Headlines
|
|
High-yield bond market goes negative:
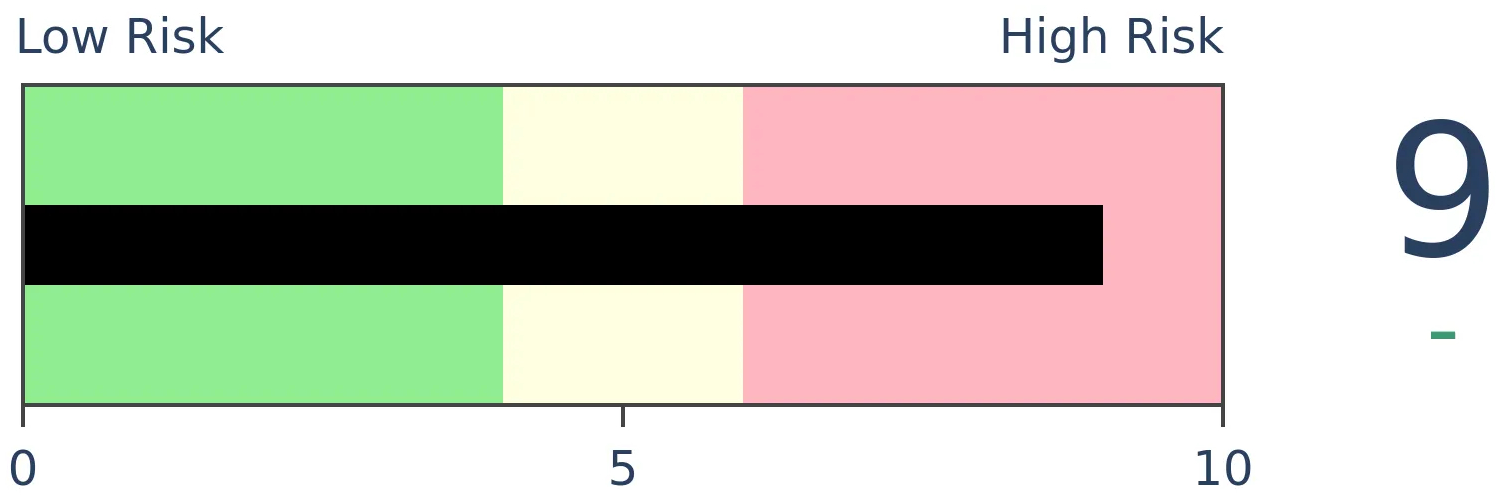
Breadth in the high-yield bond market has turned negative for the first time in months, with more bonds hitting 52-week lows than highs. That has weighed on sentiment which is registering short-term pessimism. When internal momentum turns like this, it has typically meant more short-term downside but should be a good longer-term sign.
The latest Commitments of Traders report was released, covering positions through Tuesday: The 3-Year Min/Max Screen shows that smart money commercial hedgers continued to buy stocks while selling soybeans and other agricultural contracts. They used the recent correction in equities to load up, now holding about $47 billion worth of contracts in the S&P, Dow, and Nasdaq (commercial hedgers take the opposite side of large and small speculators). This has been extreme, and bullish, since late March. It should be noted that this data was screwy prior to the last 10 years and did not work nearly as well. Since then, it's had an excellent record and remains a positive for stocks. Hedgers are still short 10-year Treasuries (but very long 30-years) and haven't budged on their net long exposure to the U.S. dollar.
Bottom Line:
- Weight of the evidence has turned mostly neutral, with offsetting extremes in some measures along with a neutral market environment
- Dumb Money Confidence has come down to neutral territory though unrivaled options speculation is still a big worry
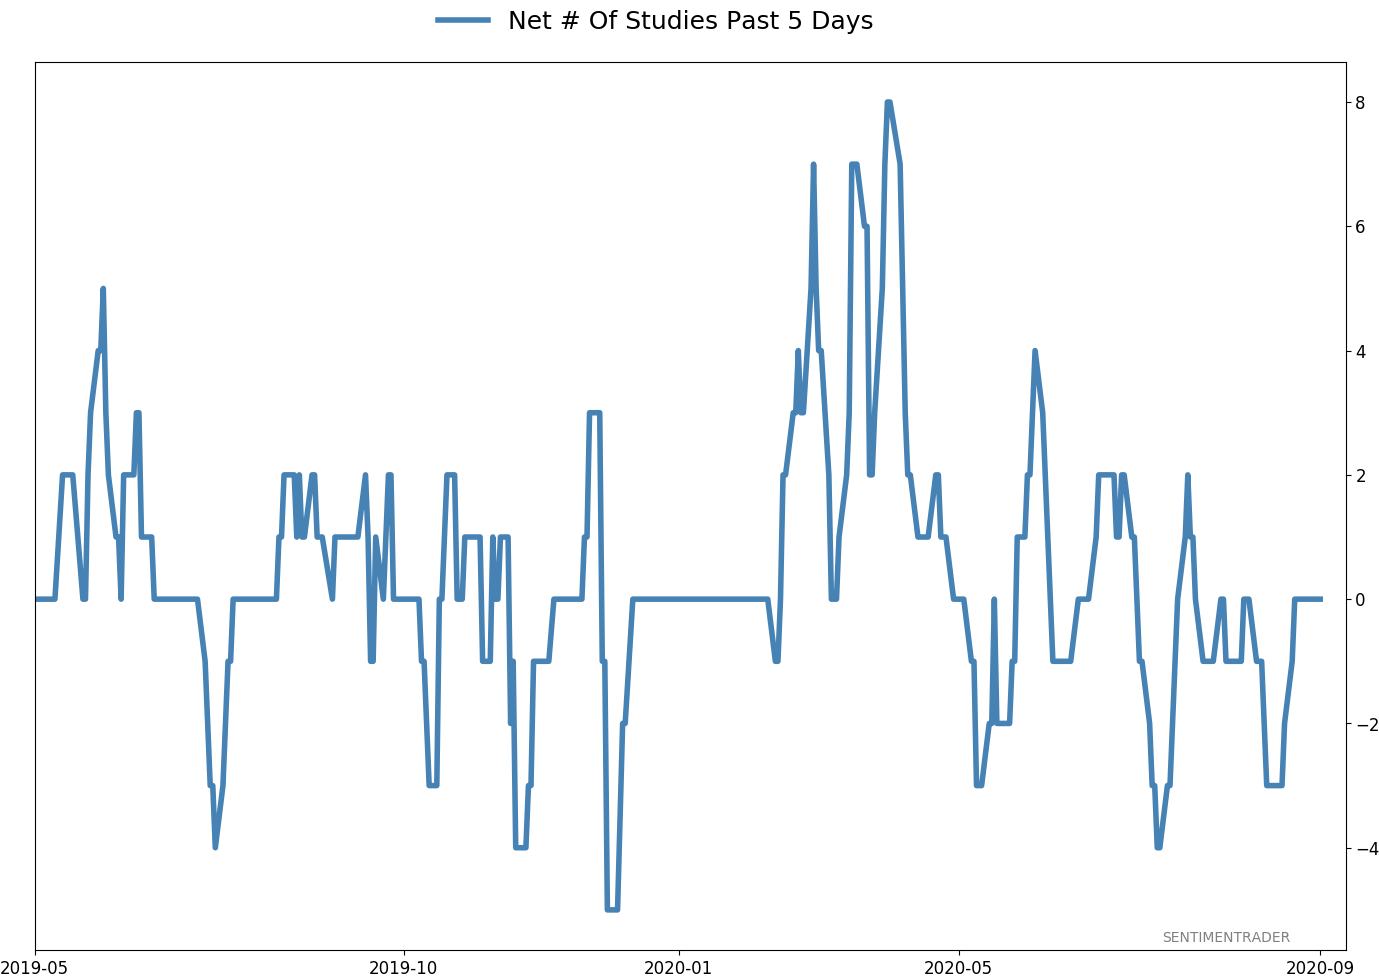
- Active Studies show a heavy positive skew over the longer-term mostly thanks to the March - May breadth thrusts, recoveries, and trend changes
- Signs of extremely skewed preference for tech stocks neared exhaustion by late June, especially relative to industrials and financials (here and here)
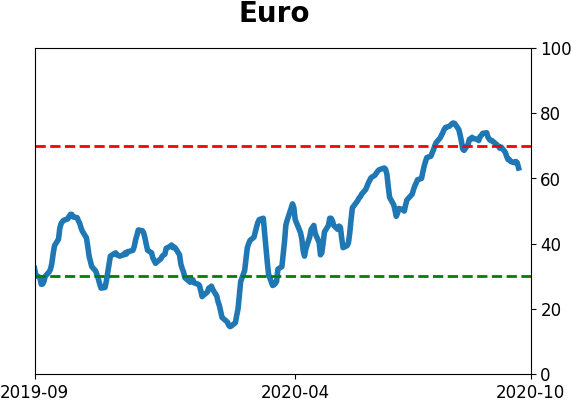
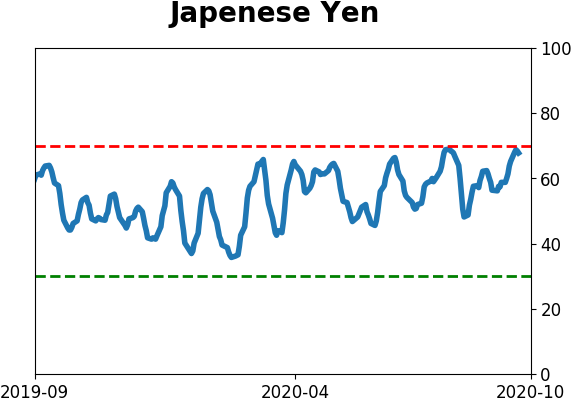
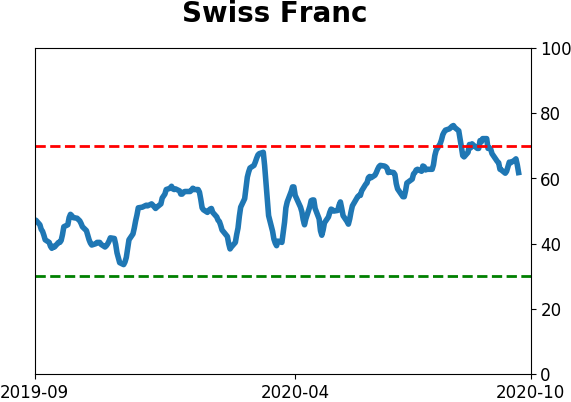
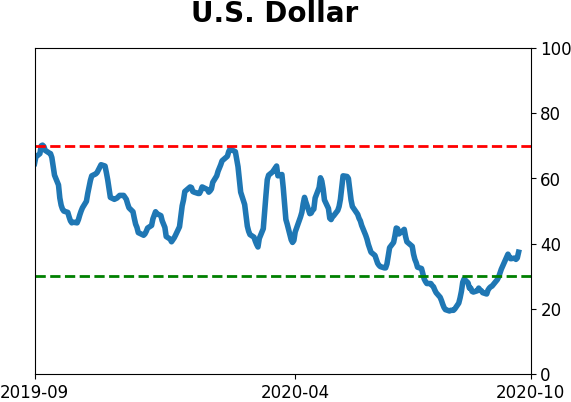
- Other markets seem driven in large part toward sentiment in the dollar, which is nearing the point that other medium-term rallies have stalled
|
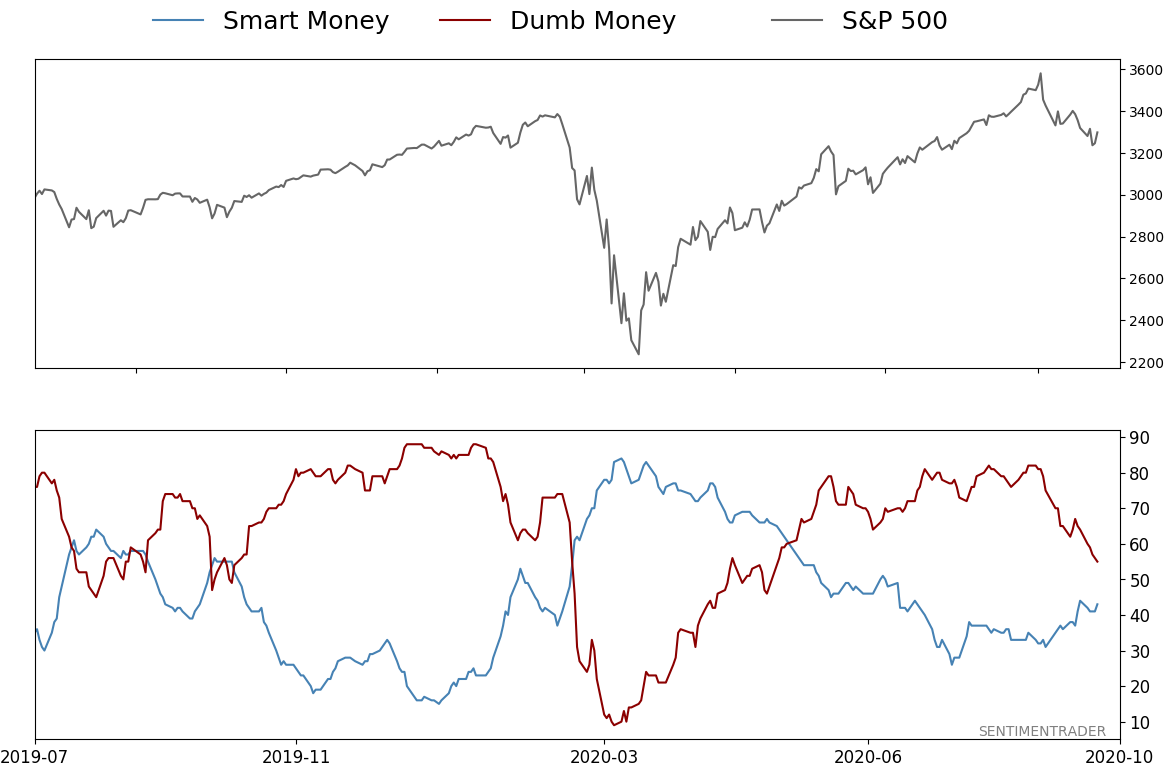
Smart / Dumb Money Confidence
|
Smart Money Confidence: 43%
Dumb Money Confidence: 55%
|
|
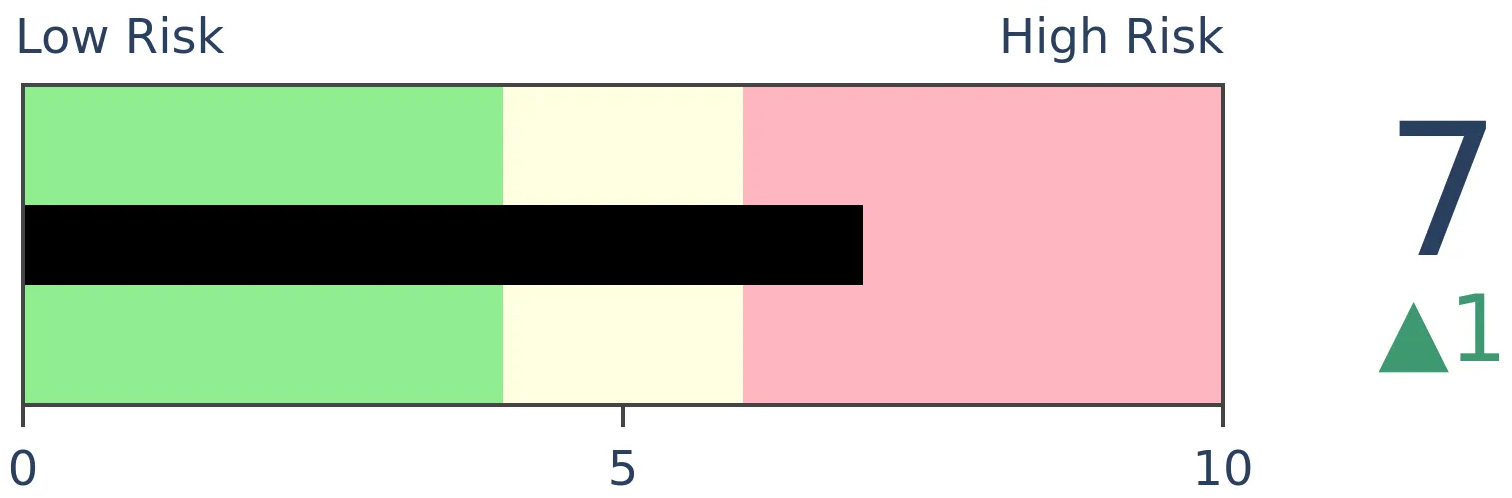
Risk Levels
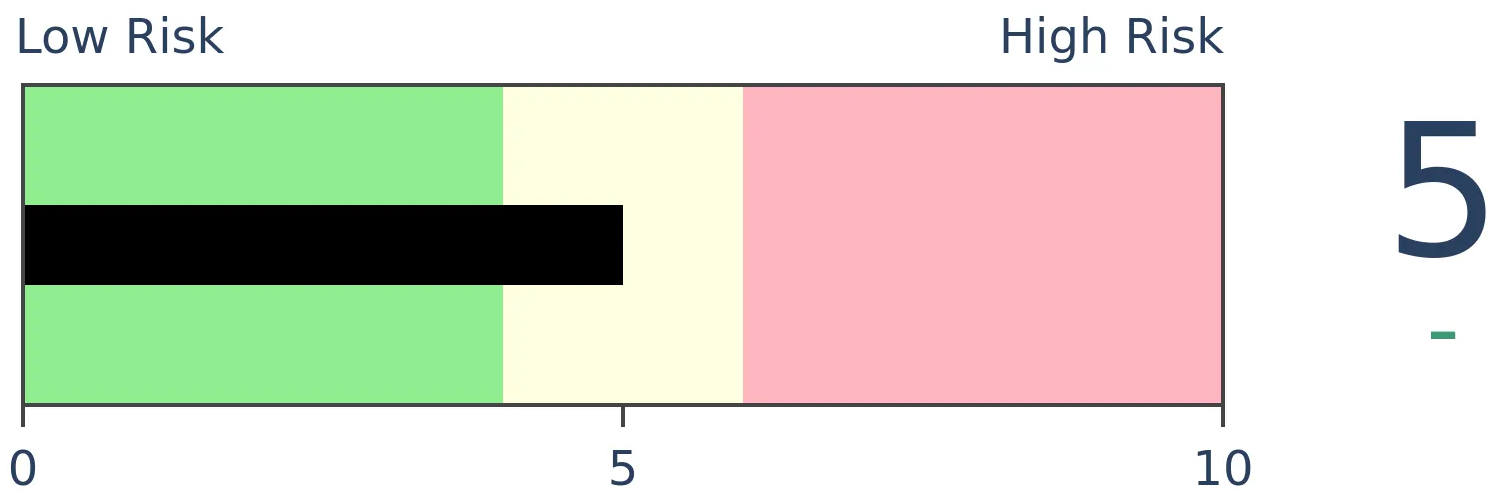
Stocks Short-Term
|
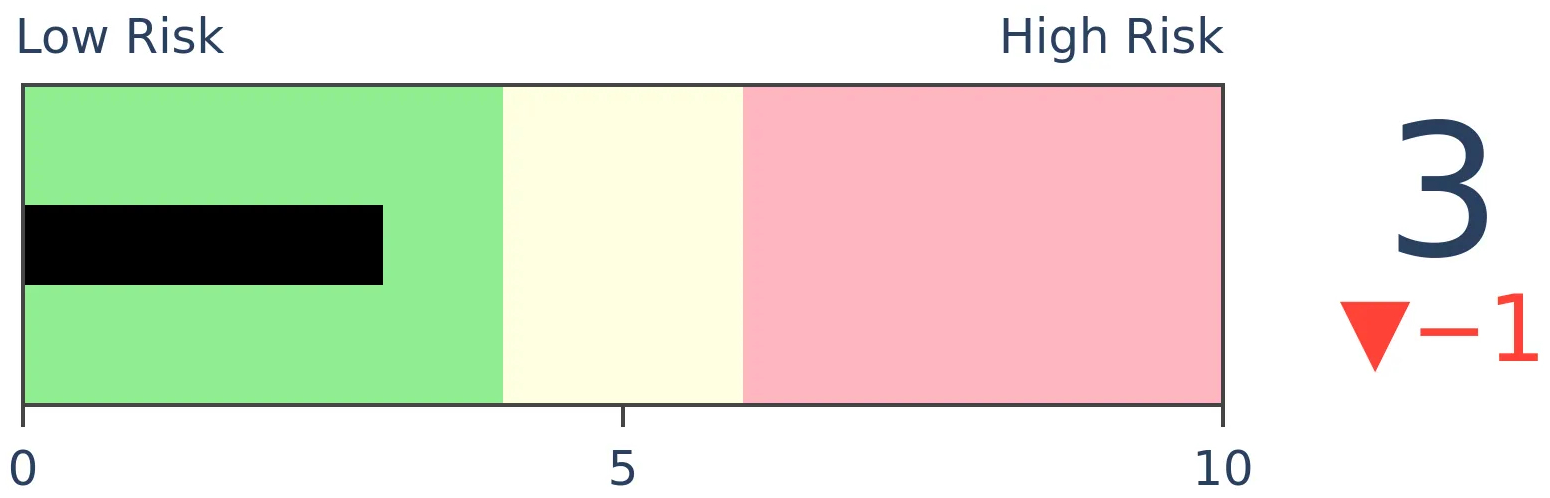
Stocks Medium-Term
|
|
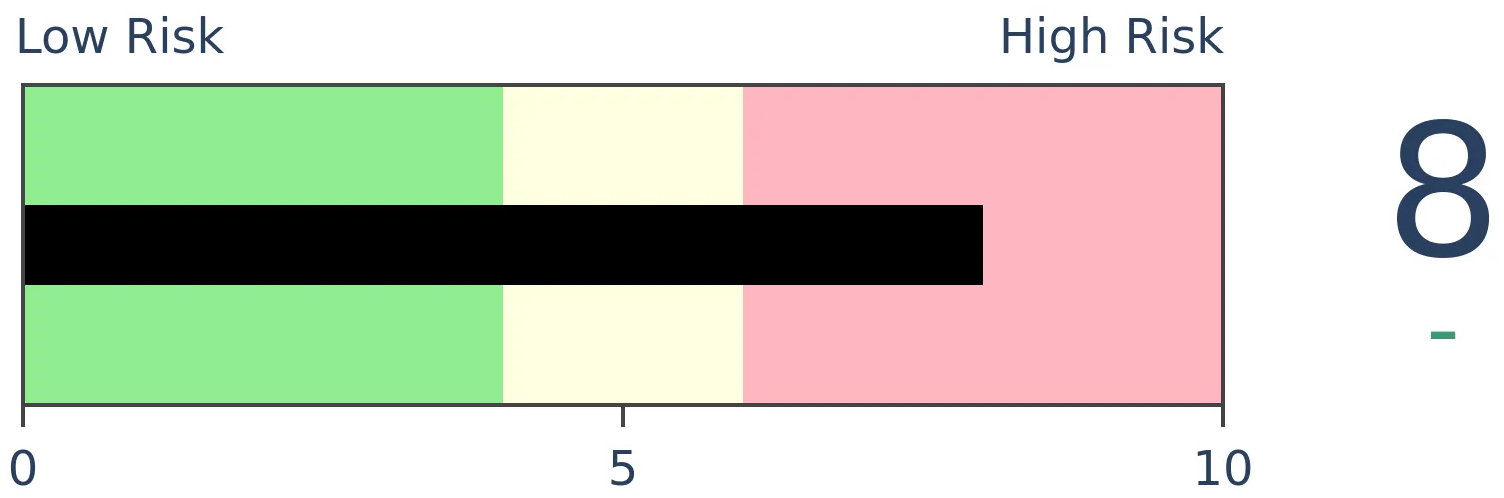
Bonds
|
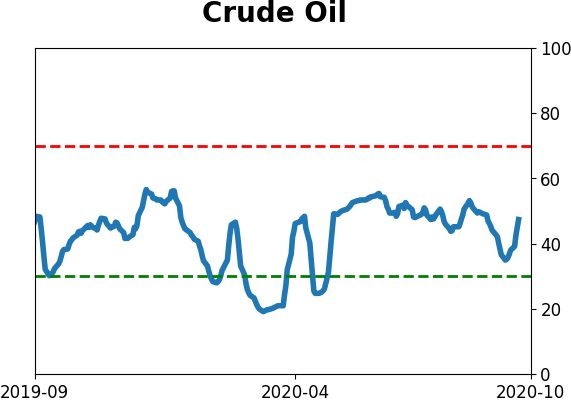
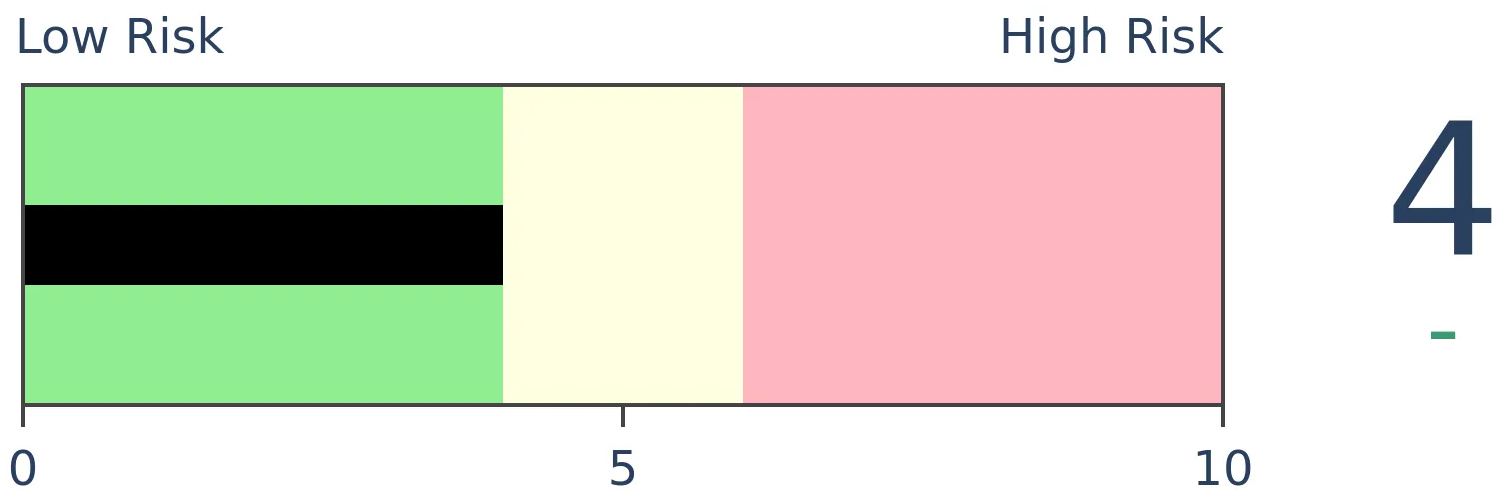
Crude Oil
|
|
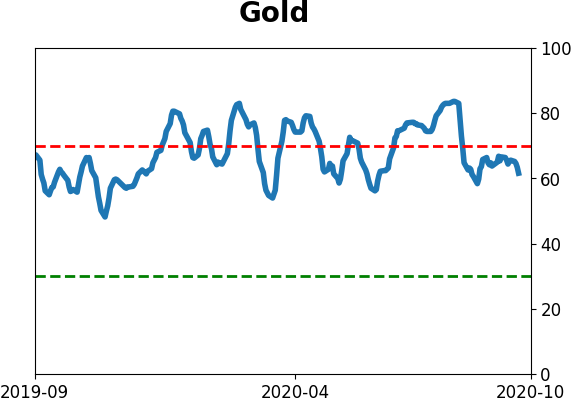
Gold
|
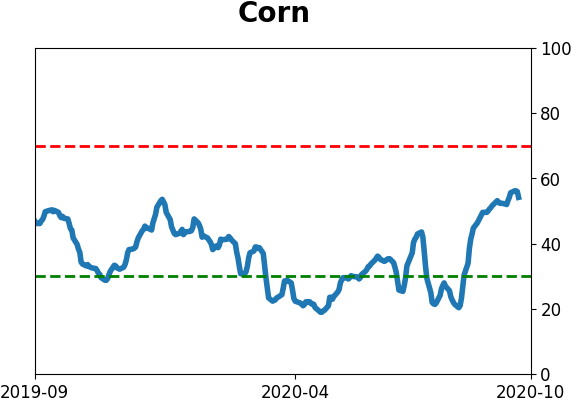
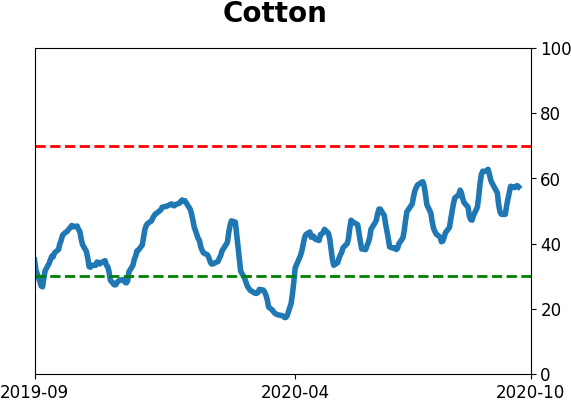
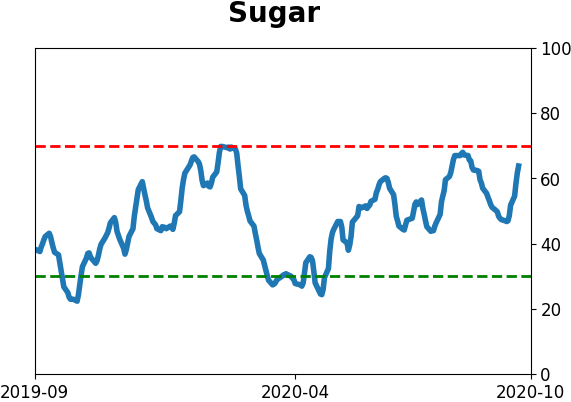
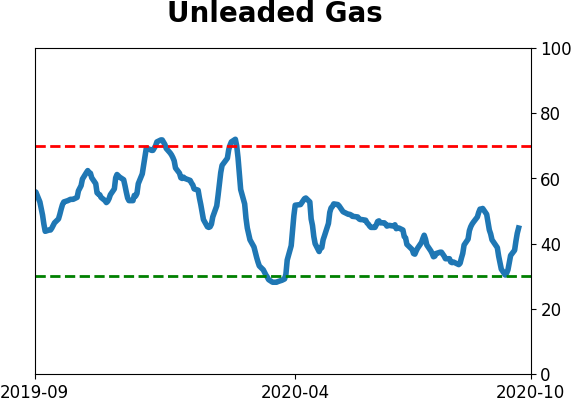
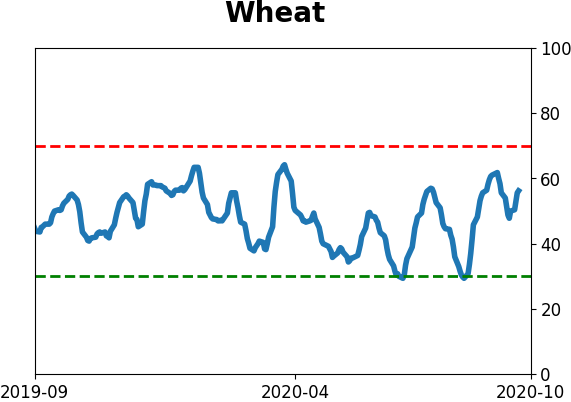
Agriculture
|
|
Research
BOTTOM LINE
Breadth in the high-yield bond market has turned negative for the first time in months, with more bonds hitting 52-week lows than highs. That has weighed on sentiment which is registering short-term pessimism. When internal momentum turns like this, it has typically meant more short-term downside but should be a good longer-term sign.
FORECAST / TIMEFRAME
None
|
High-yield bonds have started to crack, and it's worth watching.
Availability to credit has a big impact on sentiment in all markets and can be a leading indicator for stocks. Sophisticated investors tend to pay almost as much attention to machinations in bonds as in stocks, especially when debt levels are high.
Within the bond market, high-yield bonds can prove to be a good tell for stocks because the two are closely linked. When investors smell trouble, they tend to flee credit risk and sell high-yield bonds before other types.
Internal momentum is waning
In recent days, the number of these junk bonds that have dropped to a 52-week low has outnumbered those rising to a 52-week high. This is the first time this has flipped negative in months.
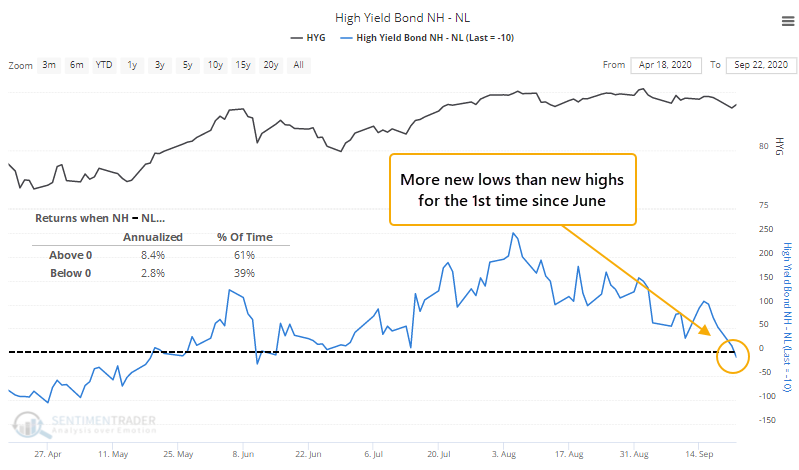
When there are more 52-week highs than lows in this market, HYG has returned an annualized +8.4%. That drops to +2.8% when there are more lows than highs, so this is a concern.
One mitigating factor could be momentum - it's been months since this figure was negative.
The table below shows every time the high-yield market had gone at least 3 months with more bonds hitting 52-week highs than lows, then that finally went negative.
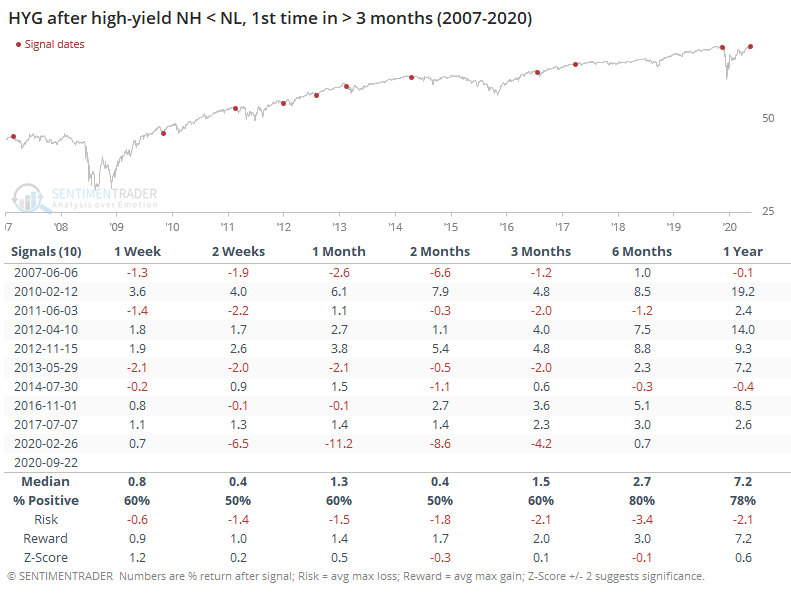
This wasn't too much of a mitigating factor. It didn't prevent large losses in 2007 or the latest one earlier this year.
For the broader stock market, this loss of internal momentum in high-yield bonds preceded a poor risk/reward ratio in the months ahead, with an inconsistent probability of positive returns.

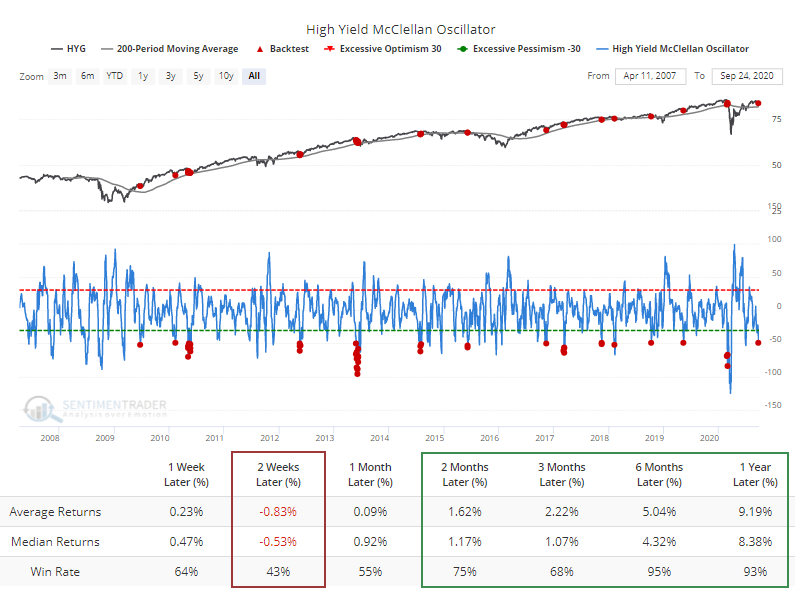
Other internal metrics for this market are already showing some shorter-term oversold signals. The McClellan Oscillator has neared -50 while HYG is still trading above its 200-day moving average. The Backtest Engine shows some short-term wobbles but good medium- to long-term returns (thanks in no small part to the study period being dominated by a long bull market).
From a longer-term point of view, the McClellan Summation Index has rolled over from a very high level.
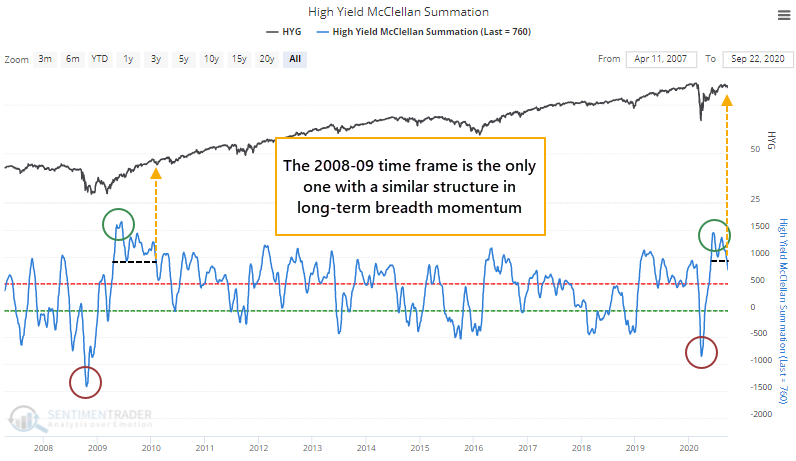
The only time frame that can compare is 2008-09 when the Summation Index hit a deeply oversold condition, then rebounded to an extremely overbought one. After that initial rebound, the Summation Index dipped, rallied again to a lower high, then fell to a lower low. That's where we are now. Below is a zoomed-in look at that window.
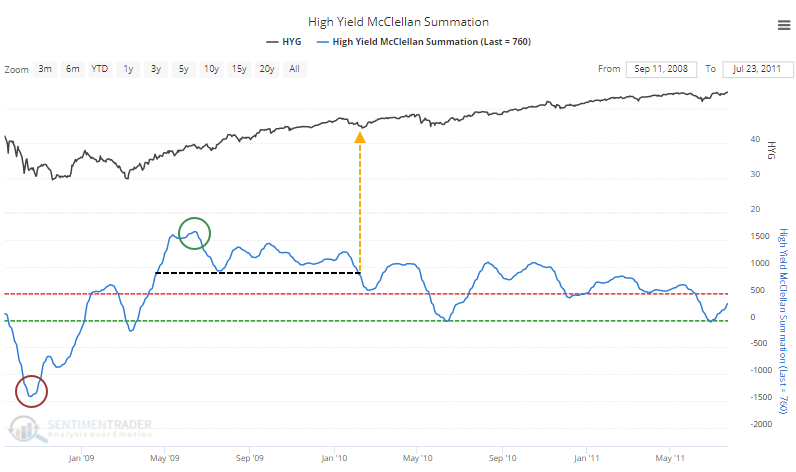
Despite the waning momentum, HYG rebounded in the months ahead though it didn't form a lasting bottom until months later after the Summation Index curled up after turning negative.
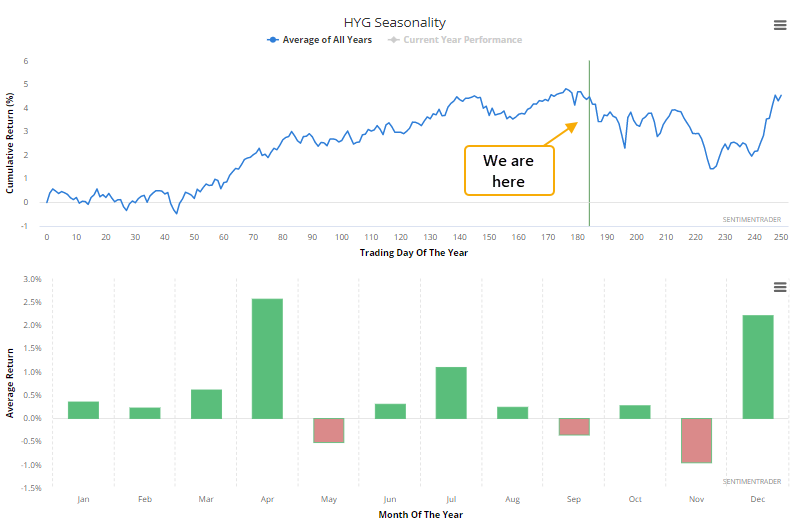
Seasonal window is mostly shut
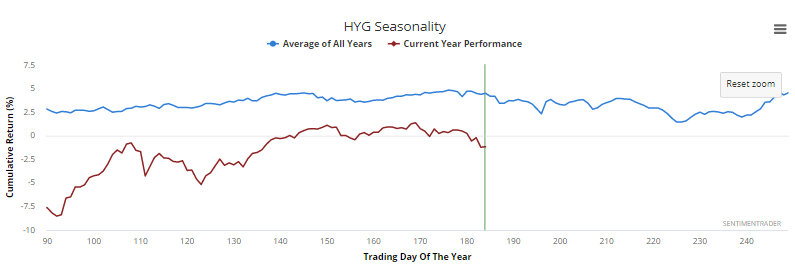
While a minor consideration at best, high-yield bonds are now entering what has been a tough seasonal window.
Once the initial plunge and recovery earlier this year passed, HYG's path in 2020 (red line) has followed its typical pattern (blue line) fairly well.
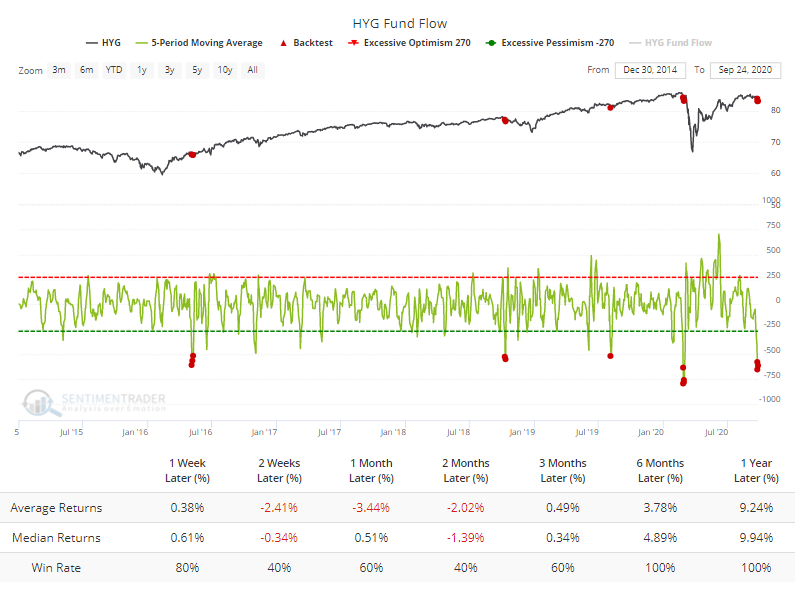
ETF traders flee and sentiment turns sour
Traders seem to be anticipating more tough times ahead, as they've pulled an average of more than $500 million per day from HYG over the past week. The Backtest Engine shows this has been an unreliable contrary indicator over the shorter-term but since all signals have triggered during a relatively benign environment, longer-term returns were excellent.
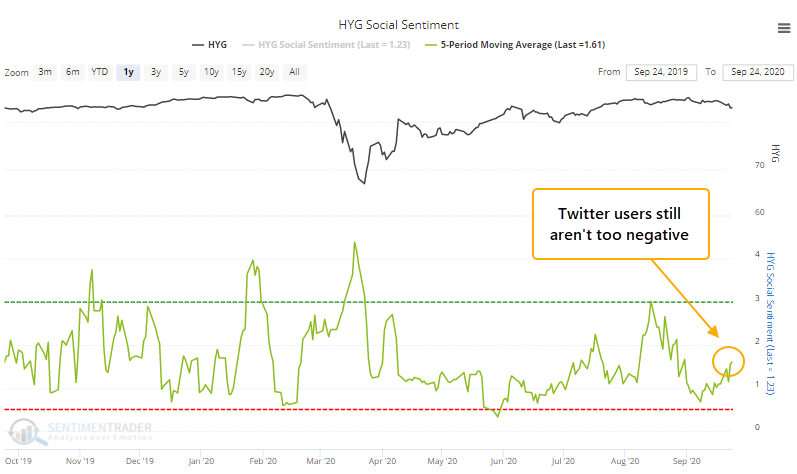
Twitter users had become quite enamored of funds like HYG earlier this month. The 5-day average of Social Sentiment dropped below 0.75 earlier this month. The indicator is derived by comparing the number of negative messages to positive ones, kind of like a put/call ratio that most of us are familiar with. You can watch Eric defend the dissertation for his Doctor of Science in Information Systems degree on these calculations on Vimeo.
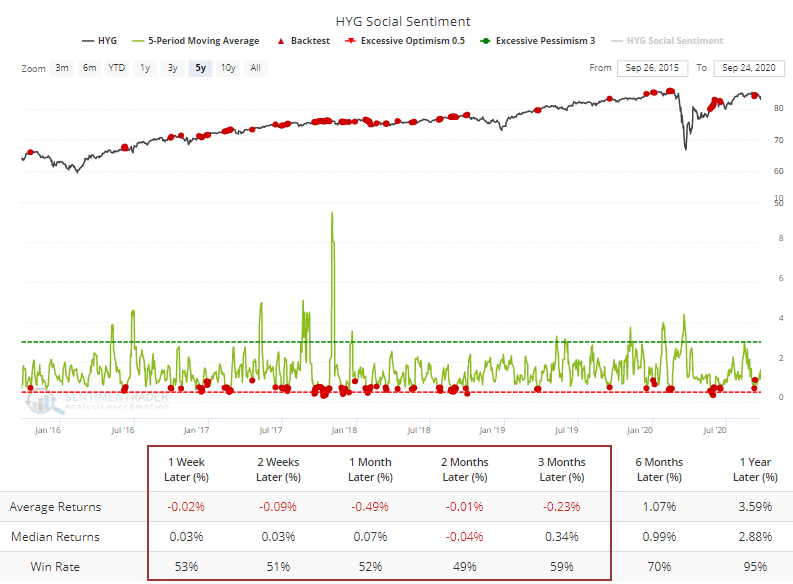
Over the past 5 years, when the 5-day average of Social Sentiment was below 0.75, results negative on average.
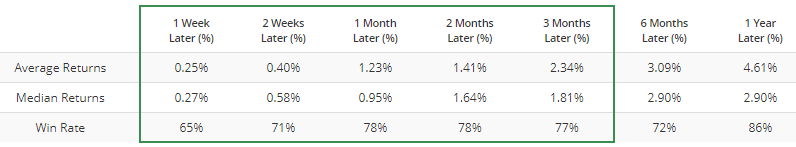
That's quite different from forward returns when Social Sentiment was above 2.5. Better bounces in HYG have come after these users were spreading more negative messages.
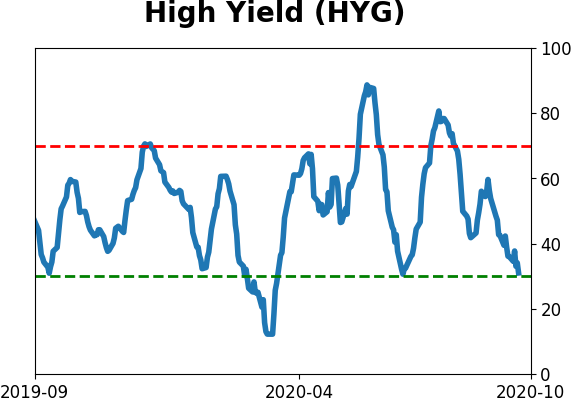
This kind of behavior has helped to push the 5-day average of HYG's Optimism Index below 25, while it's still hanging above its 200-day moving average. The Engine shows mostly very good longer-term returns, again thanks in large part to a mostly friendly environment.

When this works, it tends to really work and when it doesn't, it really doesn't. Meaning, periods of even short-term pessimism to this degree during uptrends tend to be just about "it" for the selling pressure with only minimal drawdowns. But if buying interest dried up and there was minimal upside with a continued pattern of lower lows in HYG, it led to some nasty, protracted declines and much deeper pessimism.
The overall suggestion here is that waning momentum and signs of short-term pessimism have not consistently led to good risk/reward setups on the long side just yet. It has typically taken more digestion, and even less optimism, before HYG formed a low more reliably. If it can't do so in the coming weeks and continues to see lower lows, then some very ugly precedents come to the fore.
Active Studies
| Time Frame | Bullish | Bearish | | Short-Term | 0 | 1 | | Medium-Term | 1 | 12 | | Long-Term | 47 | 2 |
|
Indicators at Extremes
Portfolio
| Position | Description | Weight % | Added / Reduced | Date | | Stocks | RSP | 15.2 | Reduced 4.2% | 2020-09-03 | | Bonds | 10% TLT, 10% BND, 10% SCHP | 30.0 | Added 30% | 2020-09-09 | | Commodities | GCC | 2.4 | Reduced 2.1%
| 2020-09-04 | | Precious Metals | GDX | 5.0 | Added 5% | 2020-09-09 | | Special Situations | XLE | 4.9 | Added 5.1% | 2020-09-03 | | Cash | | 42.5 | | |
|
Updates (Changes made today are underlined)
After stocks bottomed on March 23rd, they enjoyed a historic buying thrust and retraced a larger amount of the decline than "just a bear market rally" tends to. Through June, there were signs of breadth thrusts, recoveries, and trend changes that have an almost unblemished record at preceding higher prices over a 6-12 month time frame. On a shorter-term basis, our indicators have been showing high optimism, with Dumb Money Confidence recently above 80%, along with signs of reckless speculation during what appears to be an unhealthy market environment, historically a bad combination. While there are certainly some outlier indicators that are showing apathy or even outright pessimism, a weight-of-the-evidence approach suggests high risk over a multi-week to multi-month time frame. That has been the case since July, even arguably June and yet the major indexes hit continual new highs through late August. With the indicators and studies failing to precede any weakness, I've been hesitant to lower my already-low exposure. I am getting increasingly anxious about the oddities we're seeing, though, and lowered it again. This account is mostly about comfort with risk for me, and right now I'm not at all comfortable with any of it. In more than 25 years of experience, this is the oddest market I've ever seen. I lowered exposure again - likely the lowest I'm willing to go at this point given longer-term positives - and decided to switch to an equal-weight version of the S&P 500 index. I've become intensely uncomfortable with the concentration in the cap-weighted index. Our studies have been mixed with regard to the potential for the equal-weight version to outperform the cap version going forward, so historical support isn't overwhelming. I'm also increasingly interested again in energy stocks, starting with a small allocation. I got burned in March with the unprecedented geopolitical spat that hammered those stocks then but the longer-term setup is decent. In this account, I’ve roughly followed what has become known as the All Weather portfolio popularized by Ray Dalio. It allocates across four broad assets, designed to hold up no matter the market environment. The goal is modest positive returns while limiting large, sustained losses. I typically use popular ETFs, with low costs. At times, I will swap out for a fund I believe has better prospects, or simply lower fees if not. At other times, I will diverge quite a bit from baseline allocations, largely depending on the indicators and studies we discuss on the site. I've gotten away from this in the past, using "cash" as a substitute for "bonds" and with rates stuck at 0%, that has become less appetizing. I'm trying to get back more toward the baselines with less dramatic swings in either direction. The base allocation I use is the following: Stocks: 35%
Bonds: 45%
Precious Metals: 7.5%
Commodities: 7.5%
Cash / Special Opportunities: 5%
RETURN YTD: -1.9% 2019: 12.6%, 2018: 0.6%, 2017: 3.8%, 2016: 17.1%, 2015: 9.2%, 2014: 14.5%, 2013: 2.2%, 2012: 10.8%, 2011: 16.5%, 2010: 15.3%, 2009: 23.9%, 2008: 16.2%, 2007: 7.8%
|
|
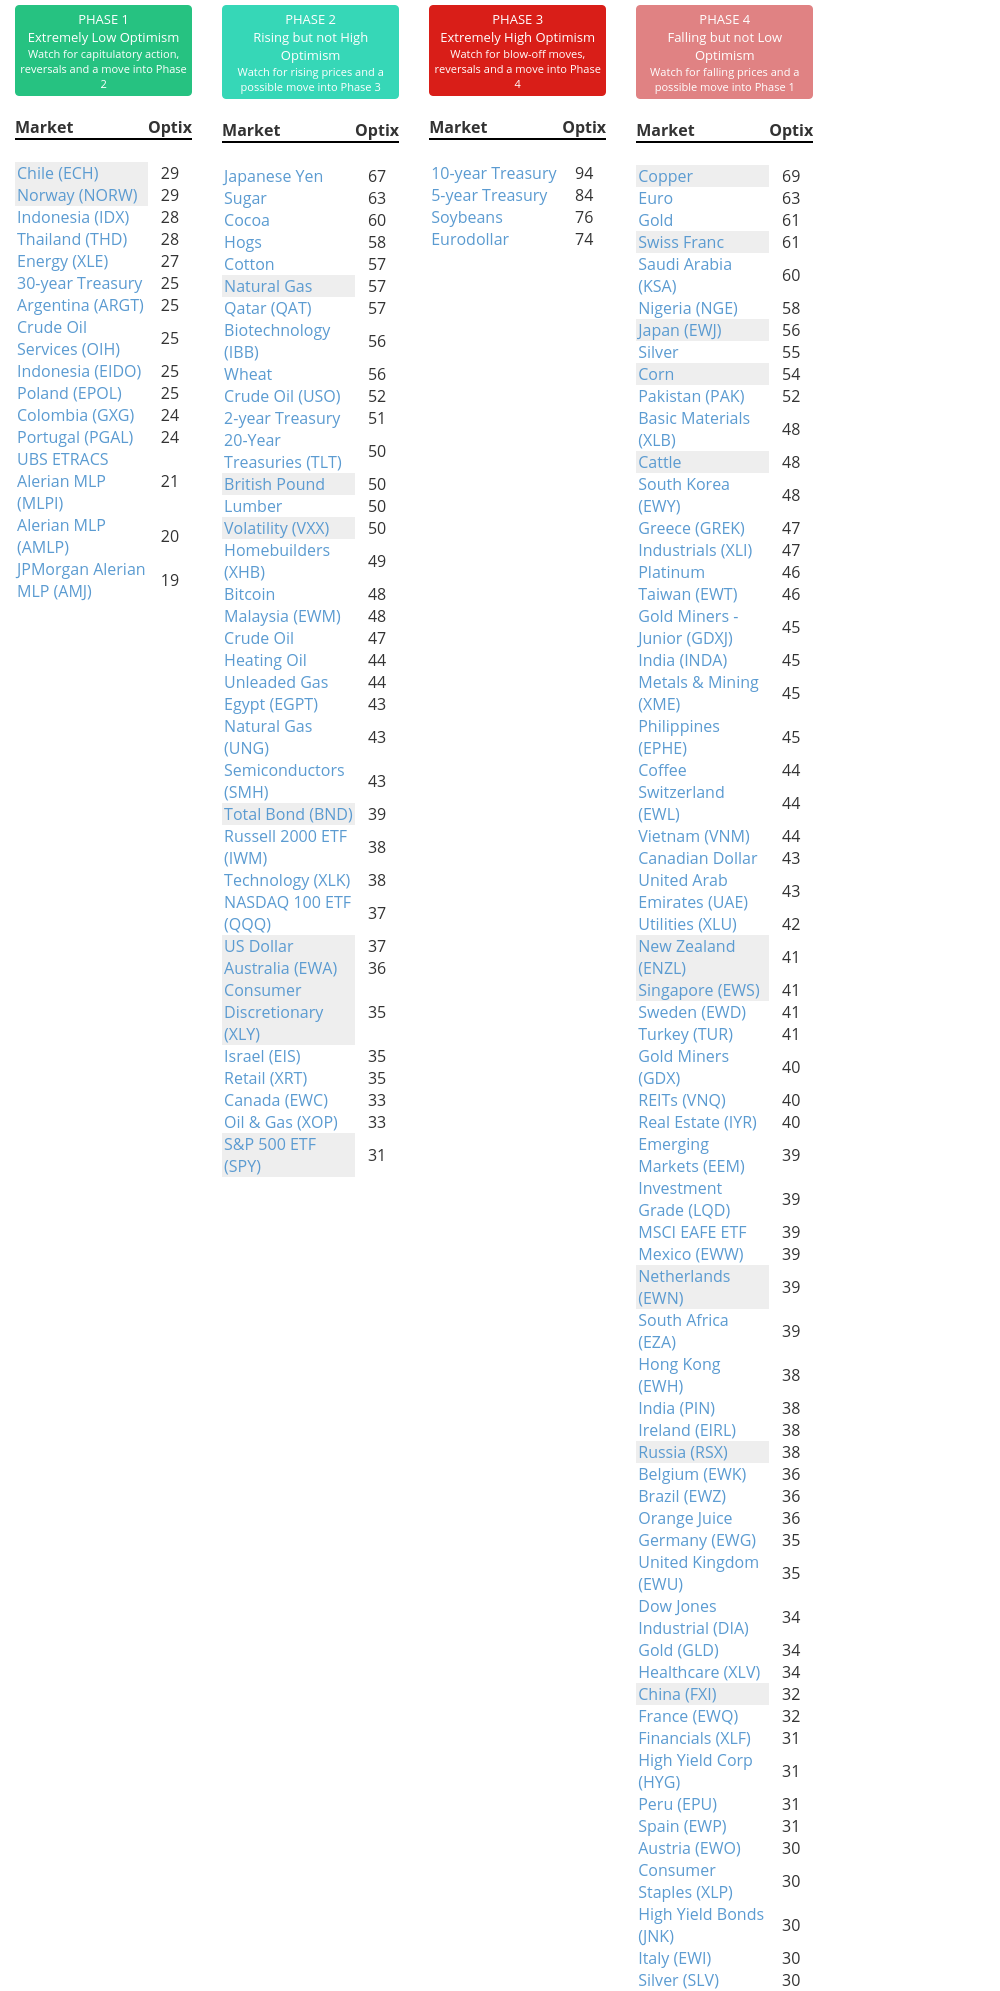
Phase Table
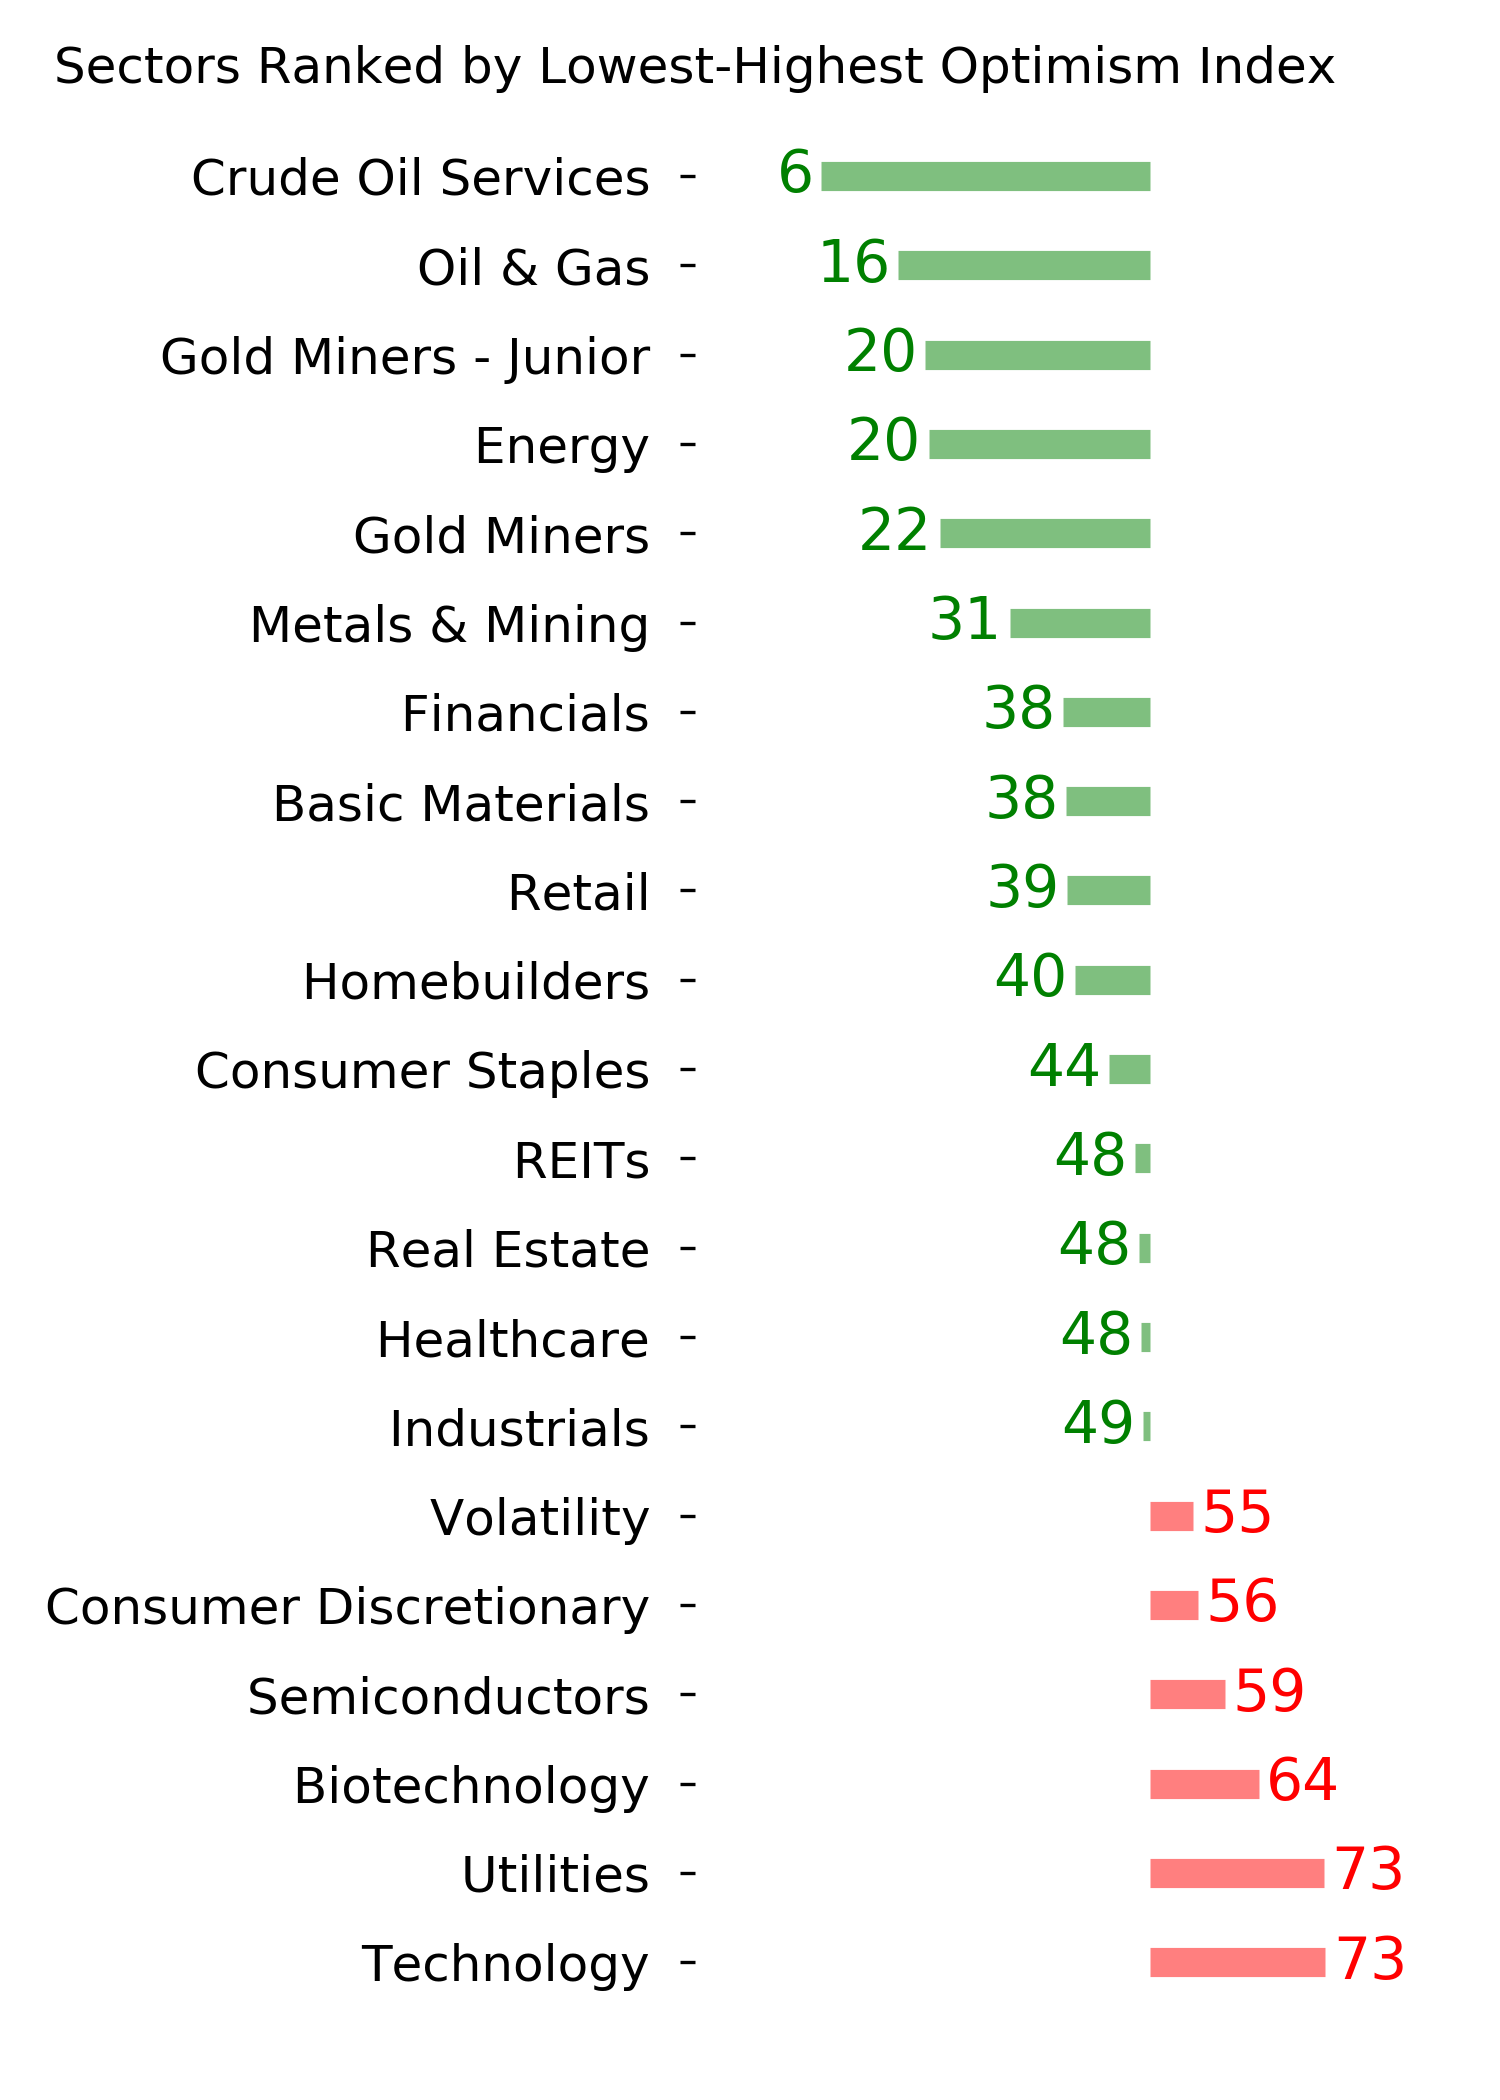
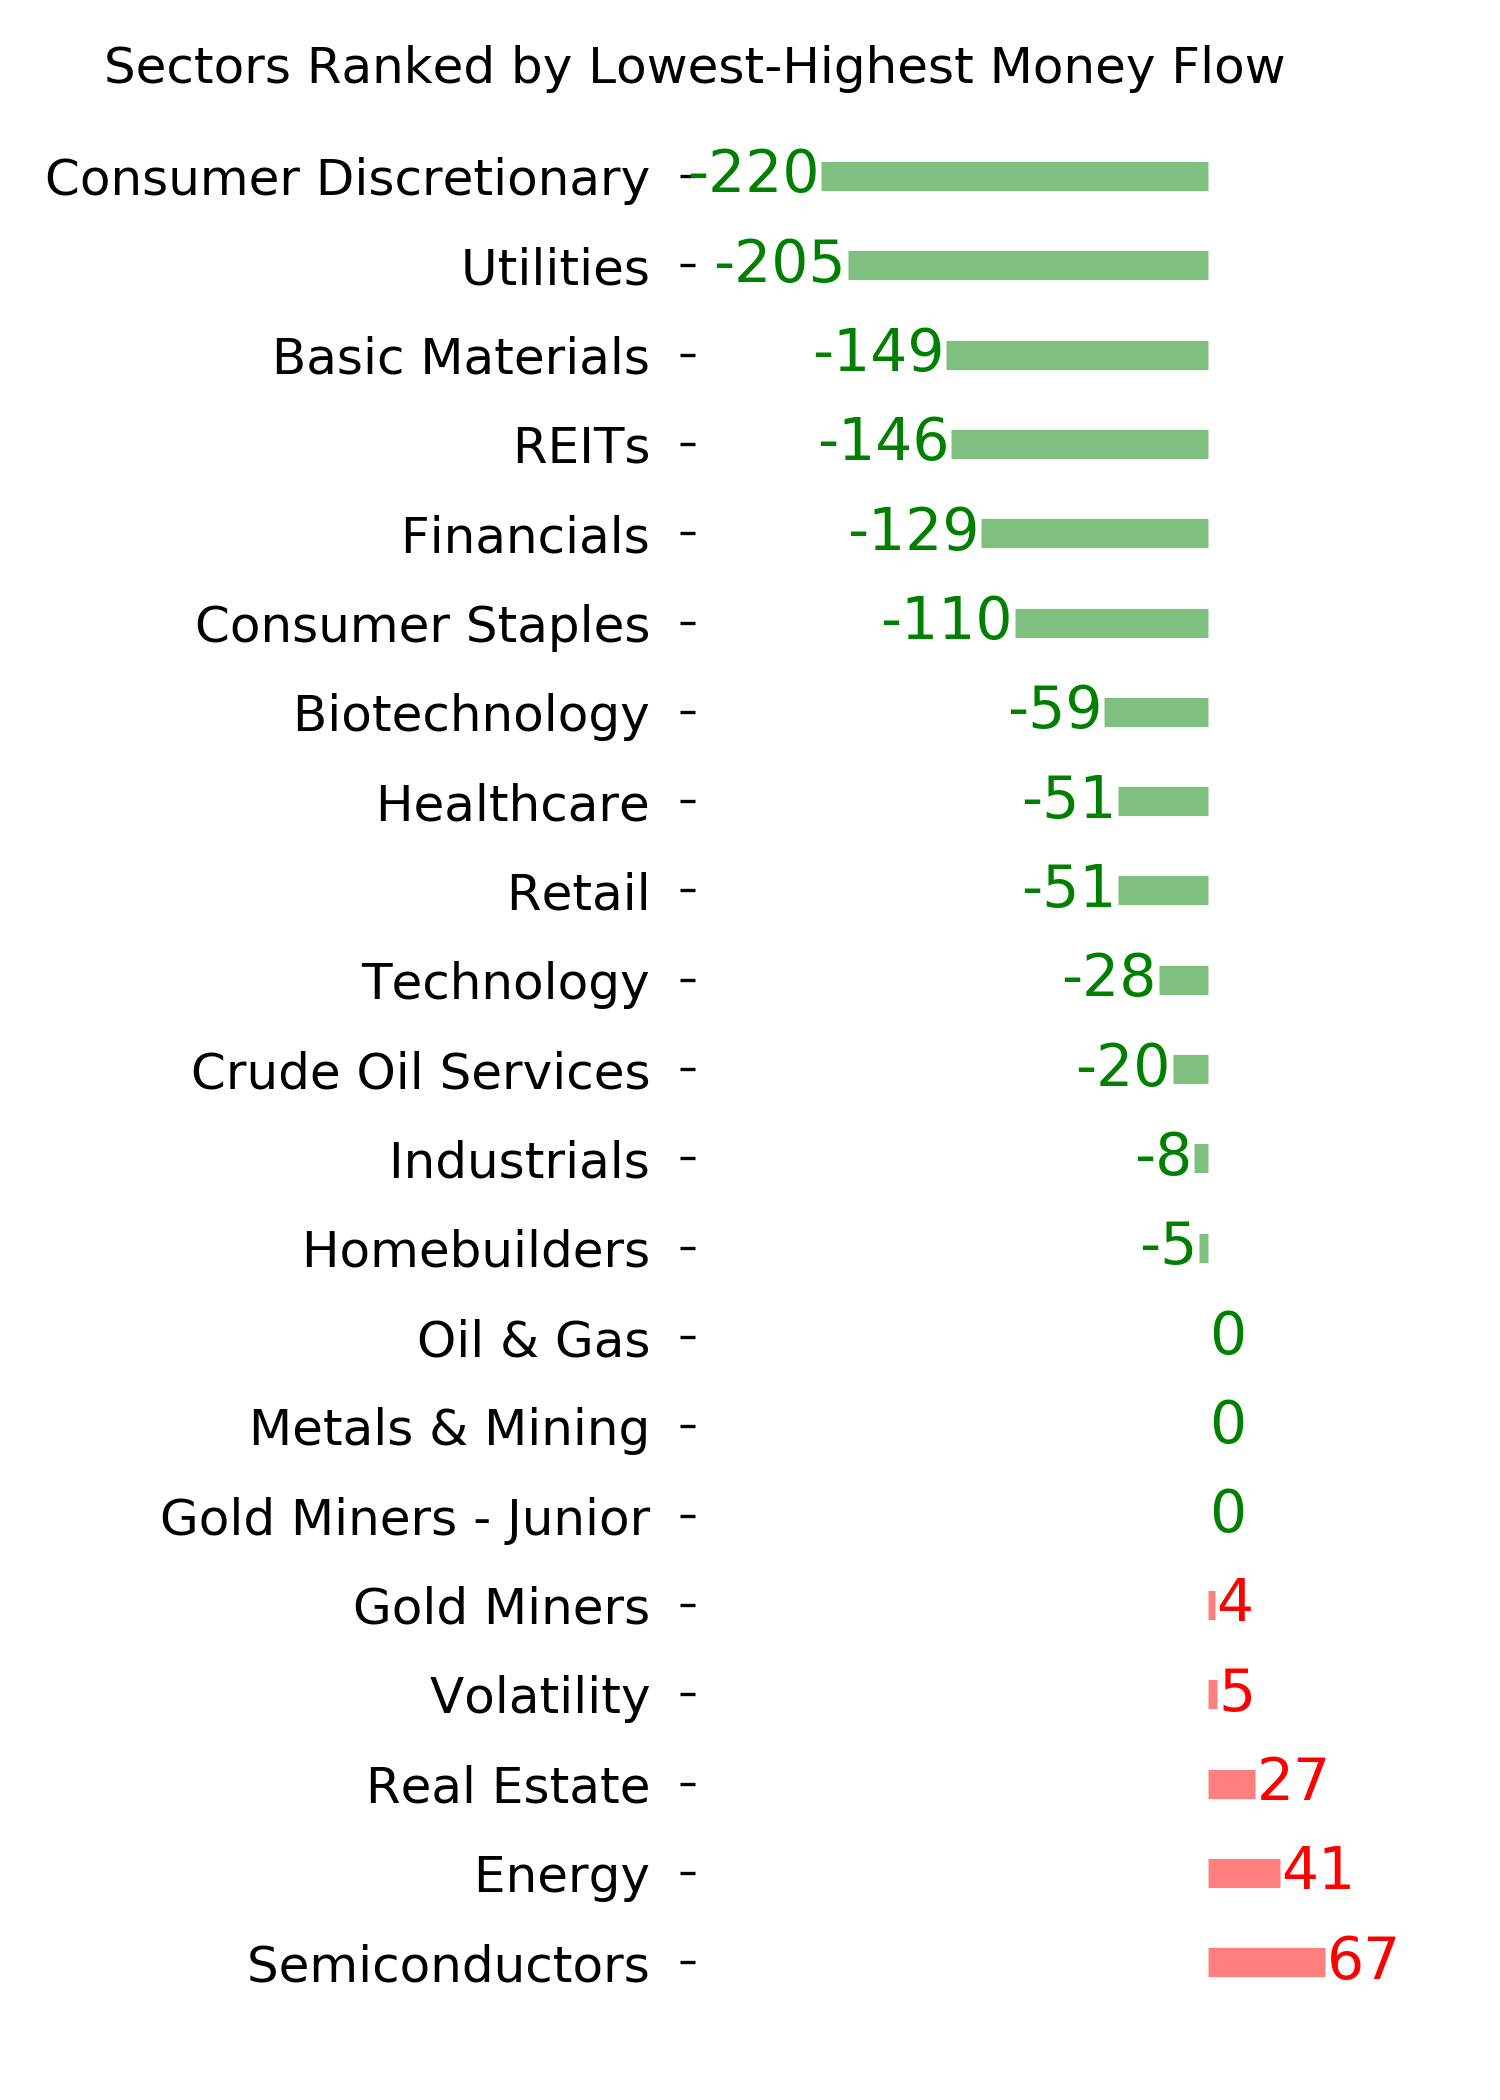
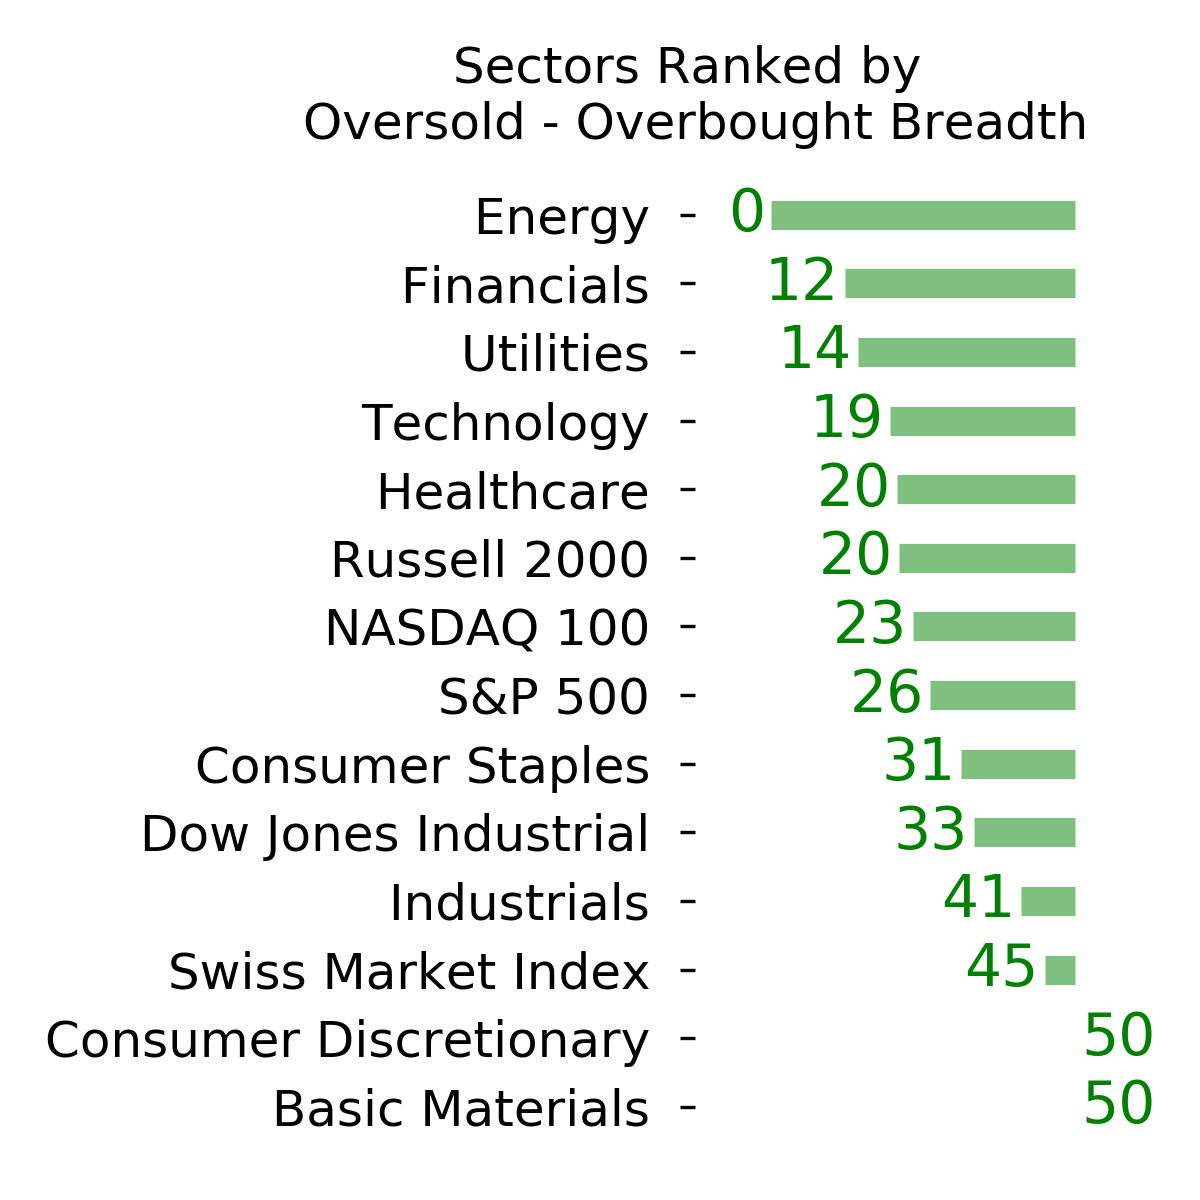
Ranks
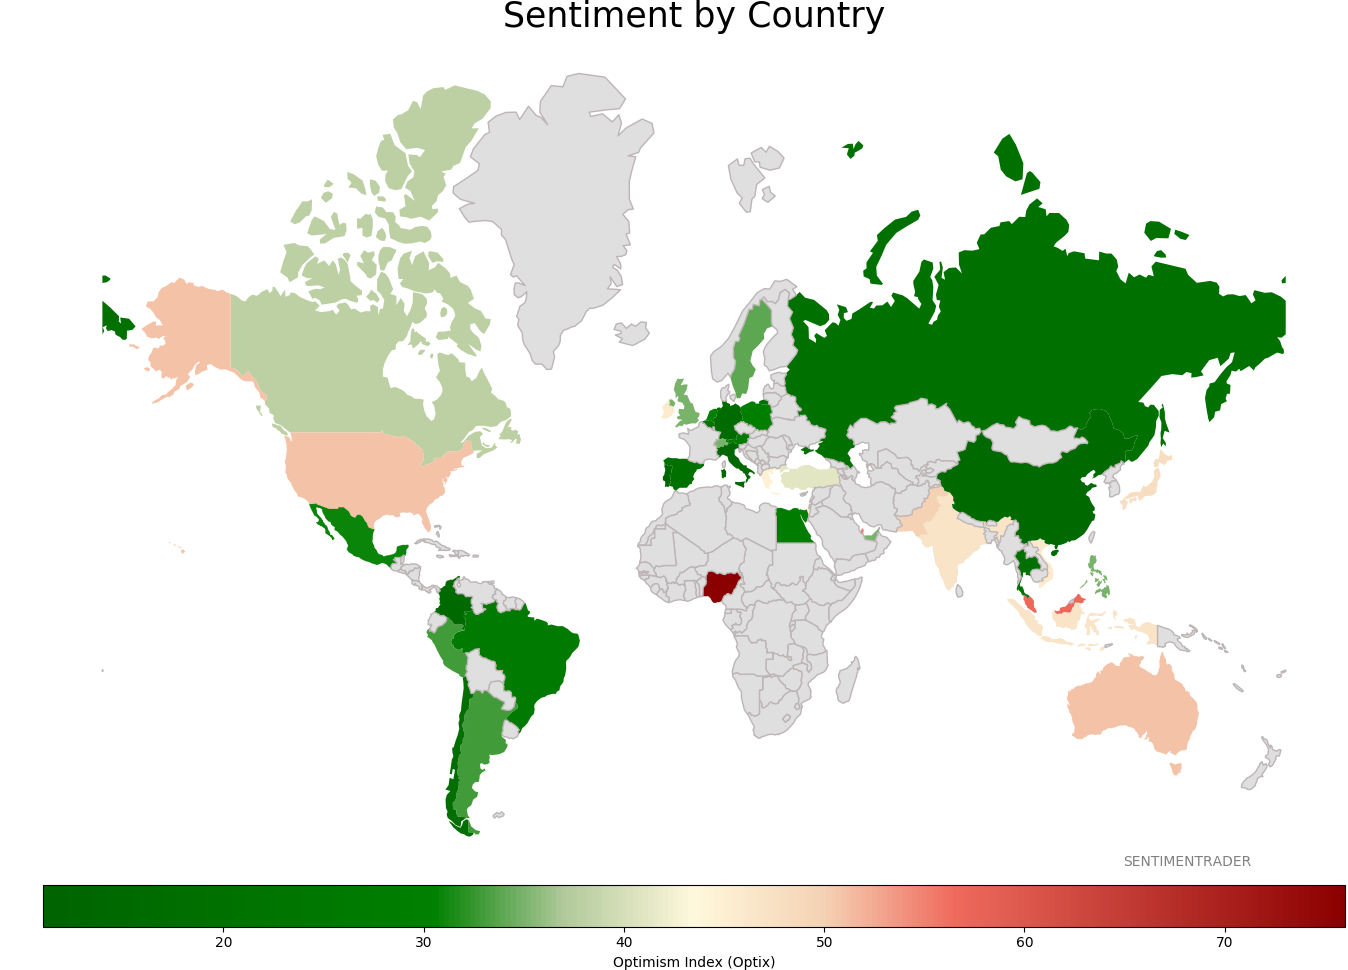
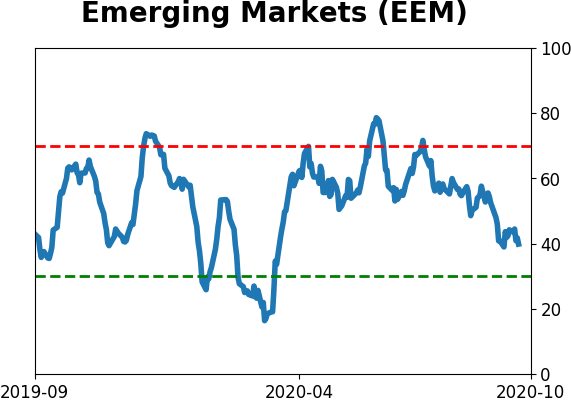
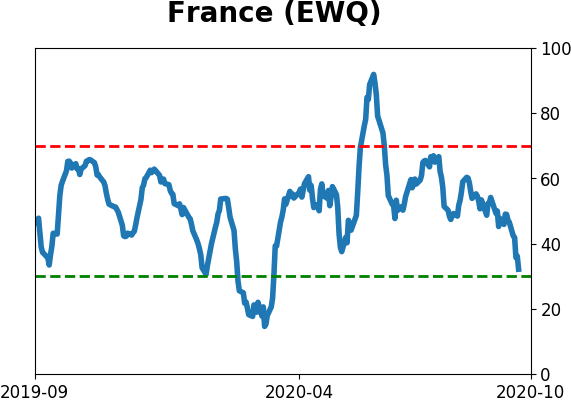
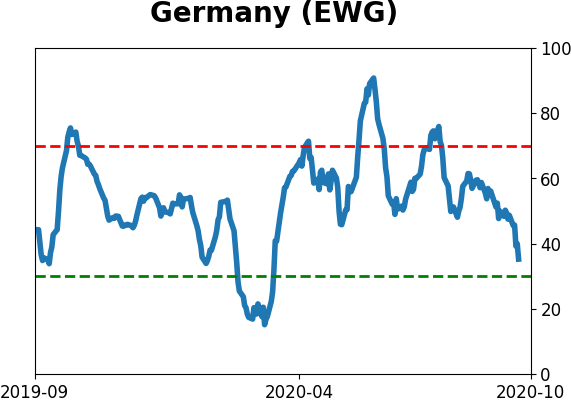
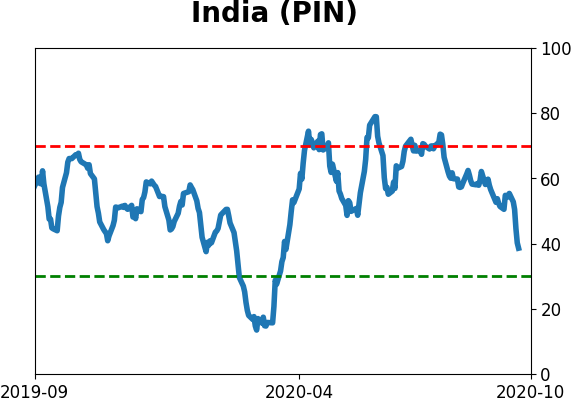
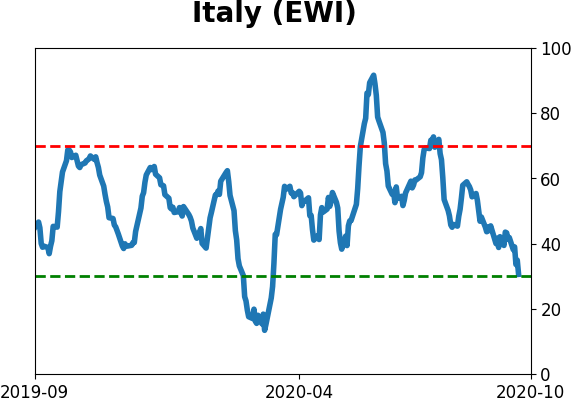
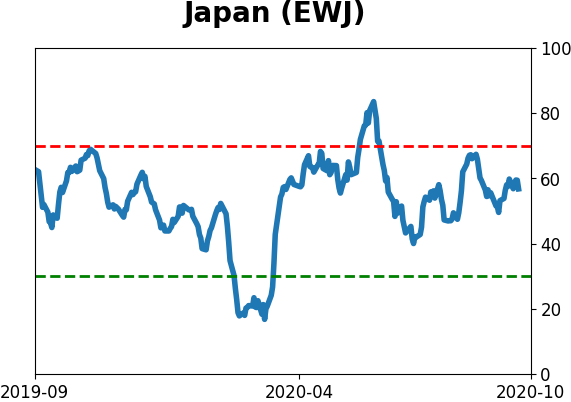
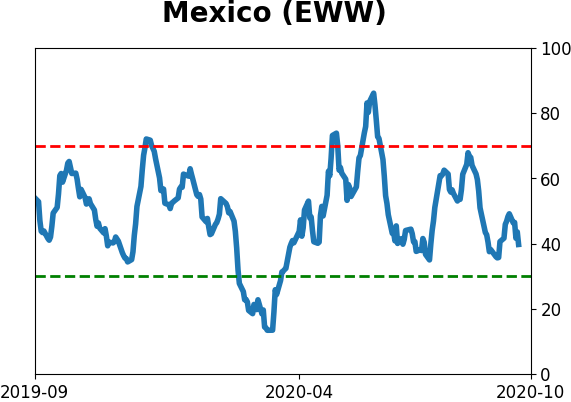
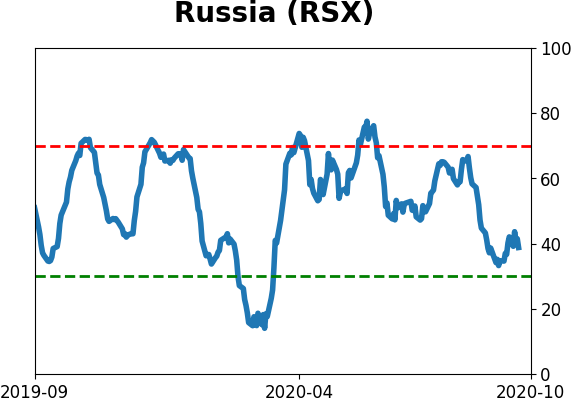
Sentiment Around The World
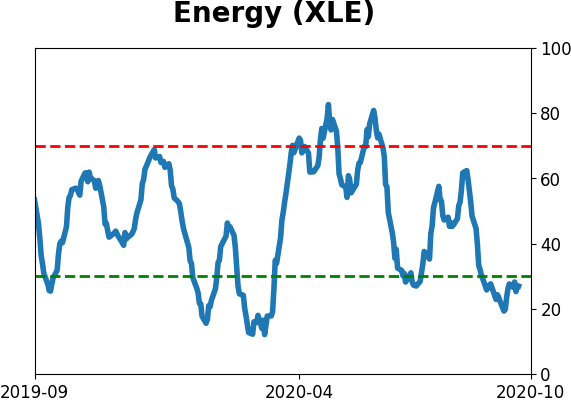
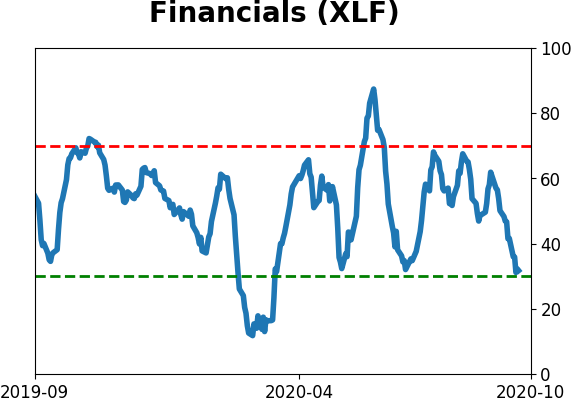
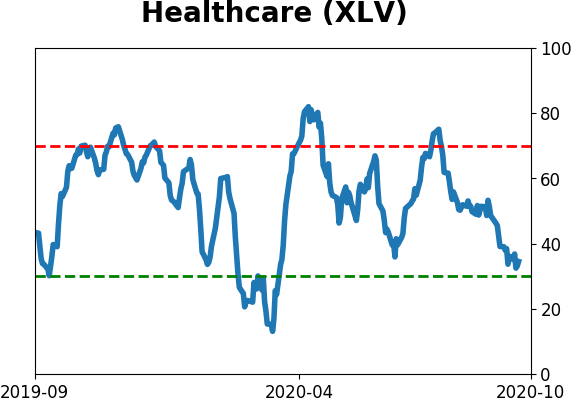
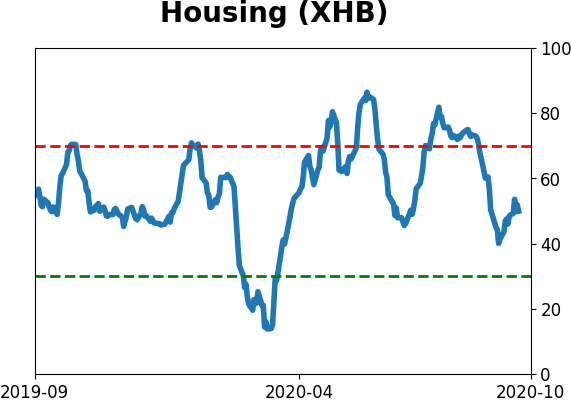
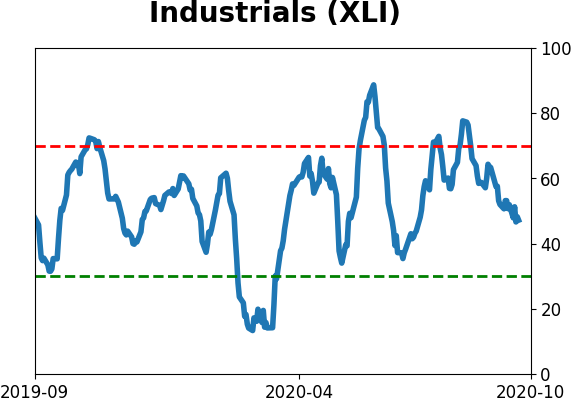
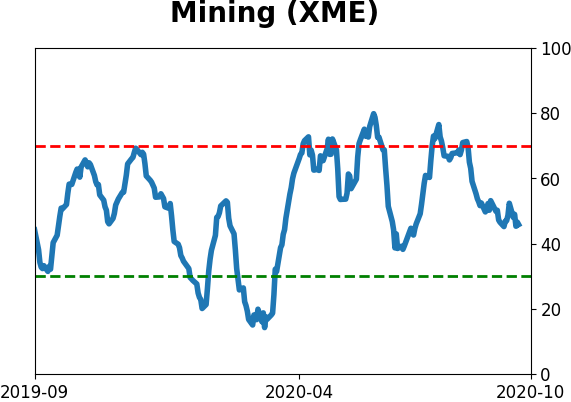
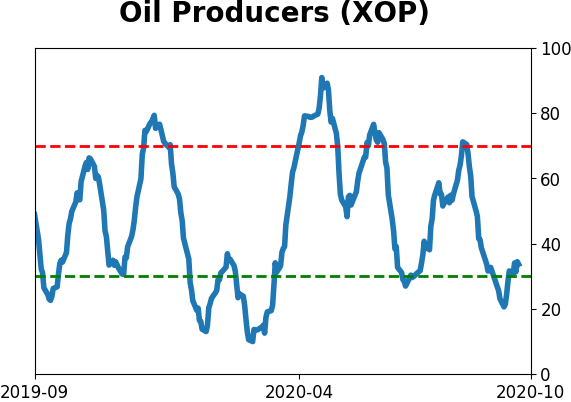
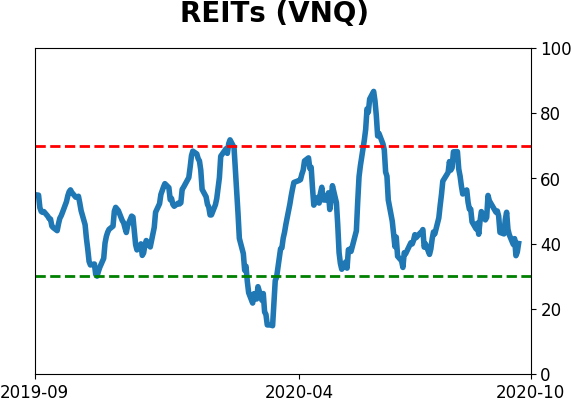
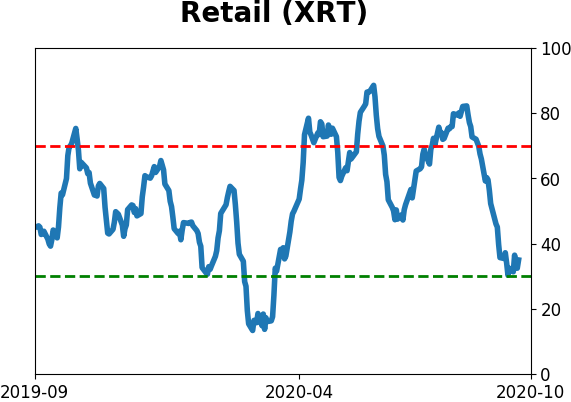
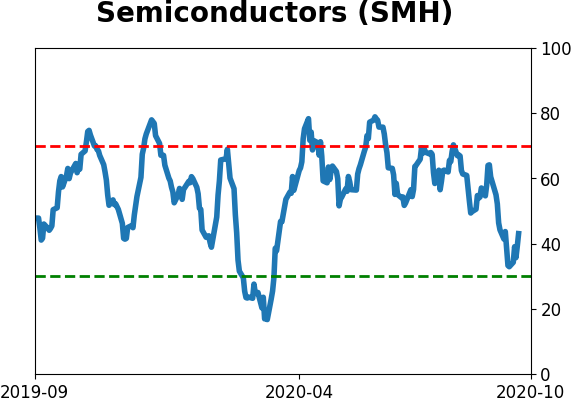
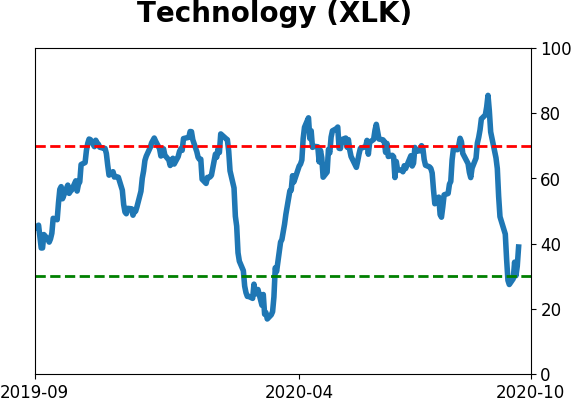
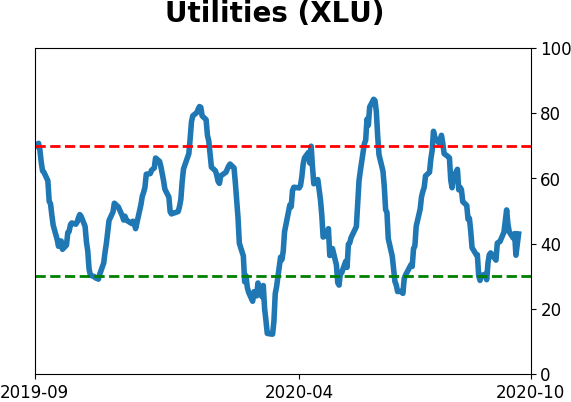
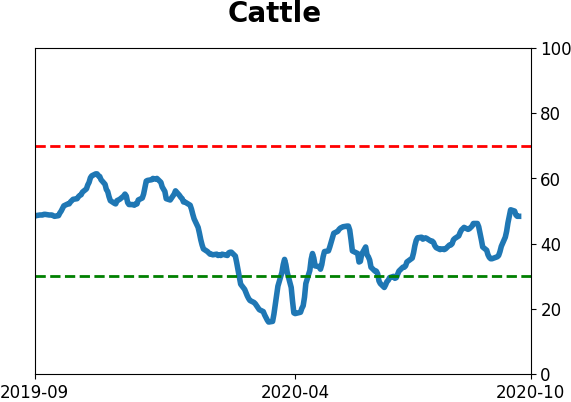
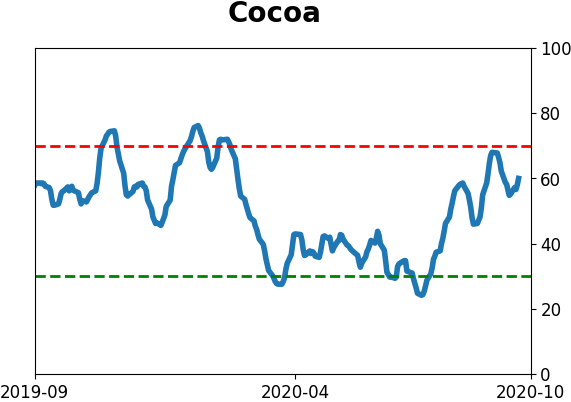
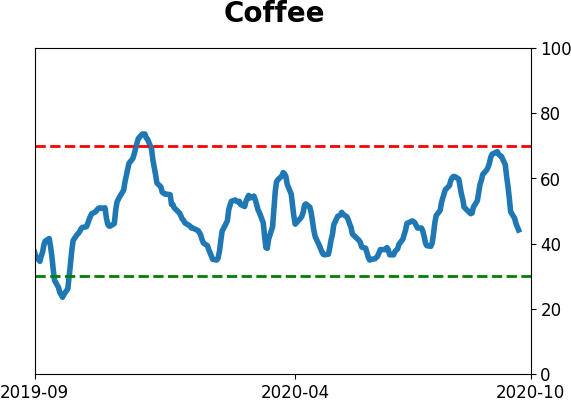
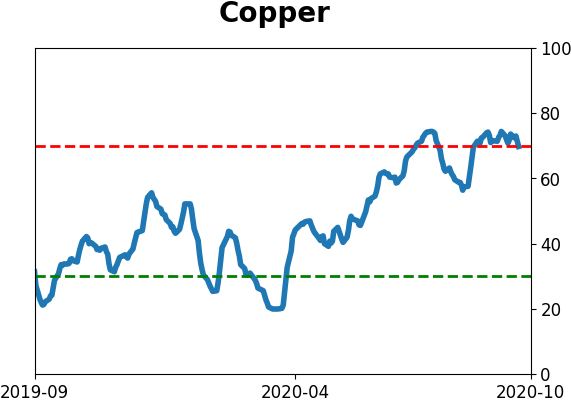
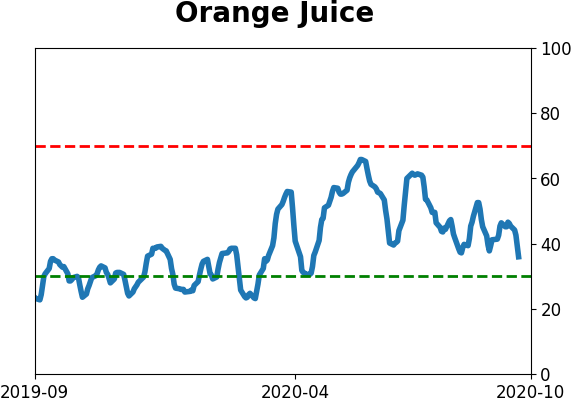
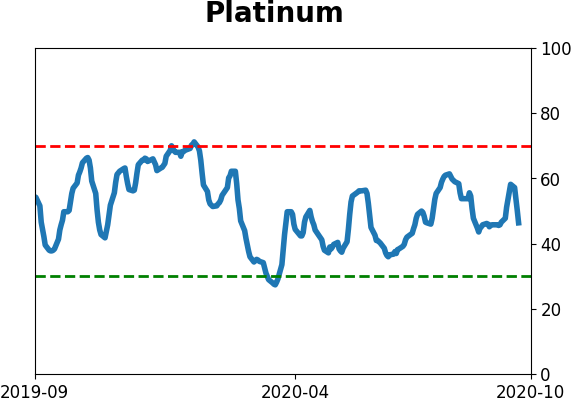
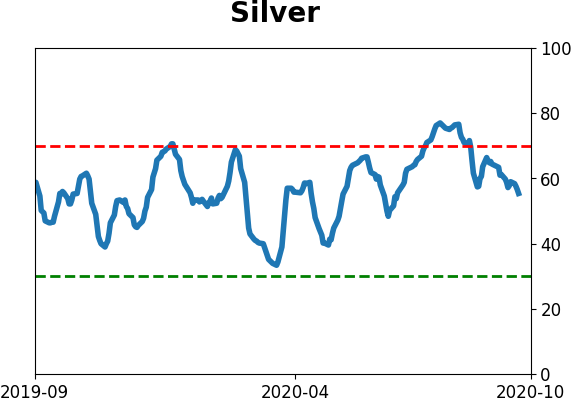
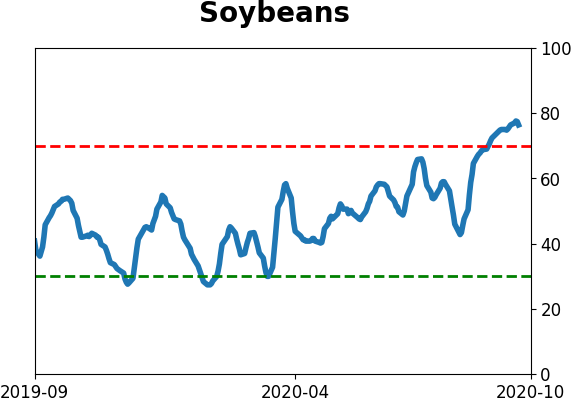
Optimism Index Thumbnails
|
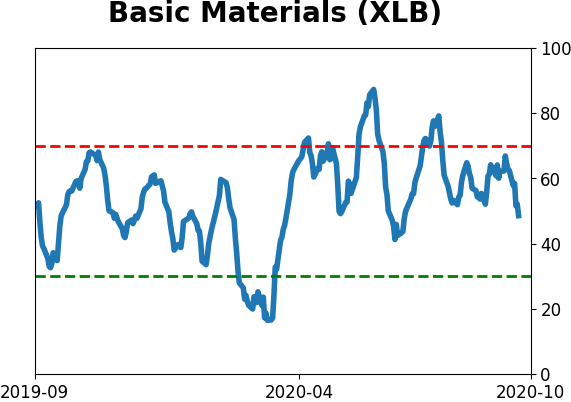
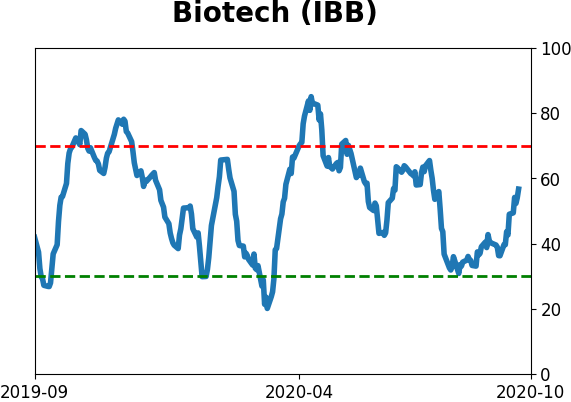
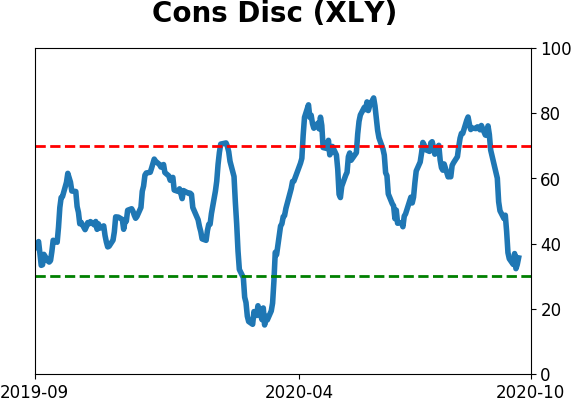
Sector ETF's - 10-Day Moving Average
|
|
|
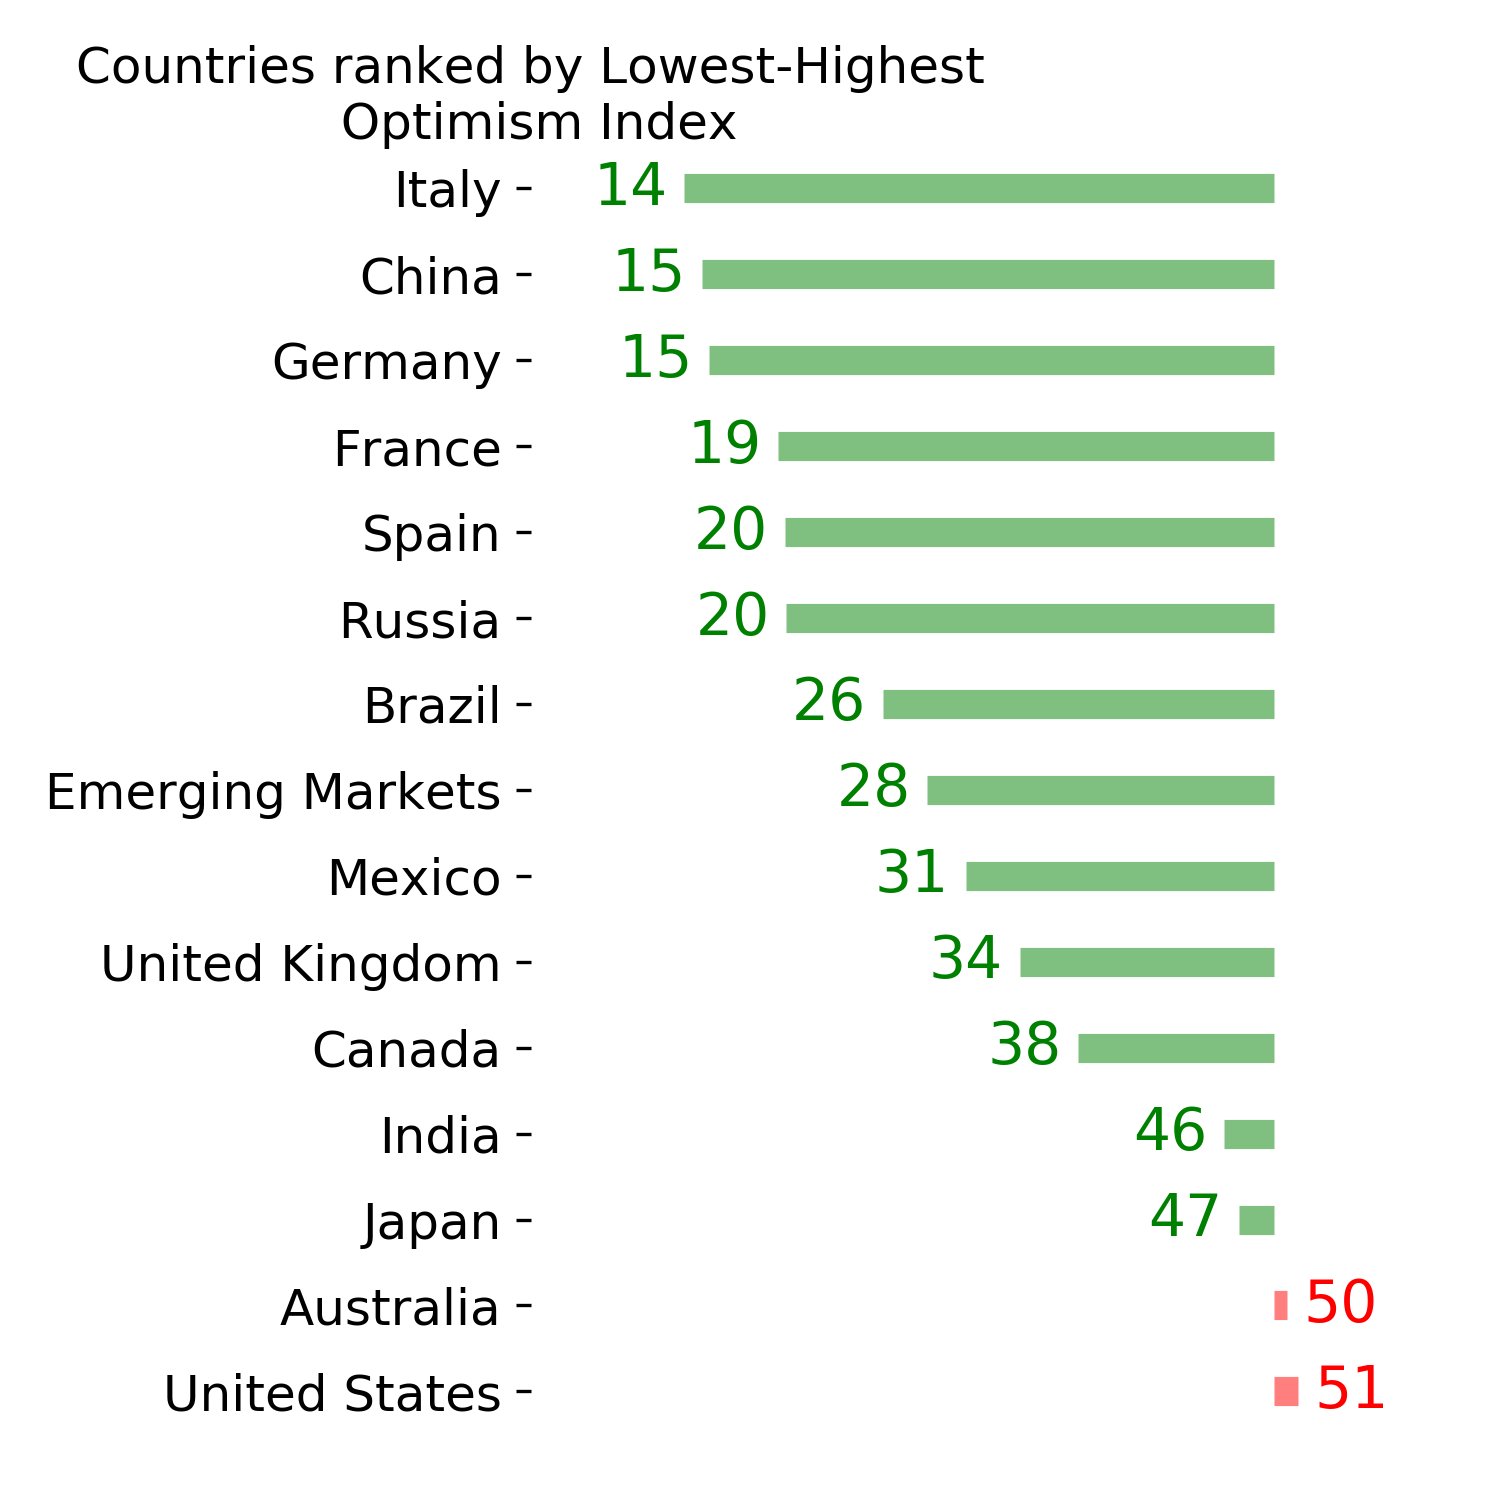
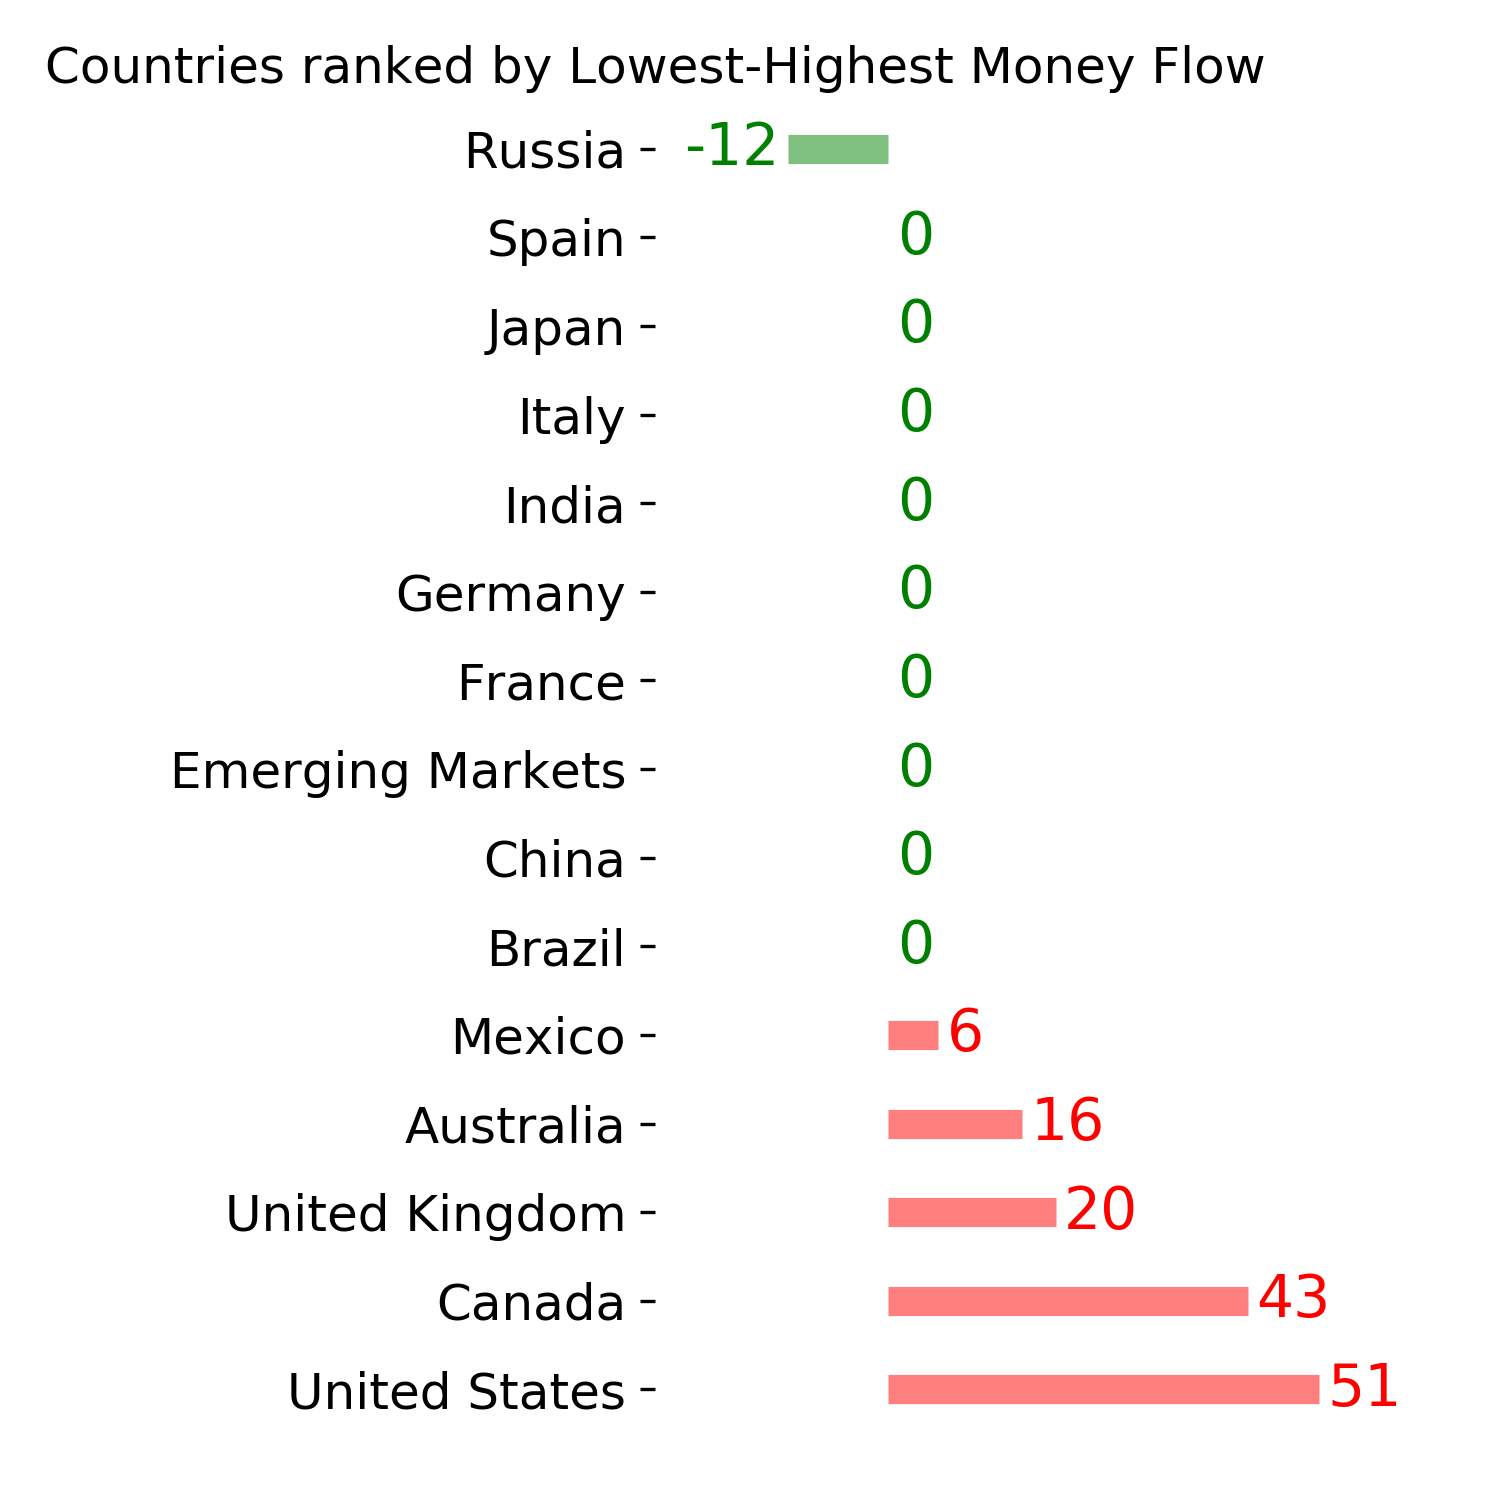
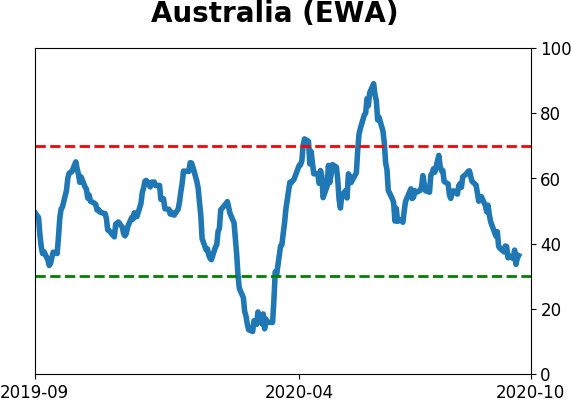
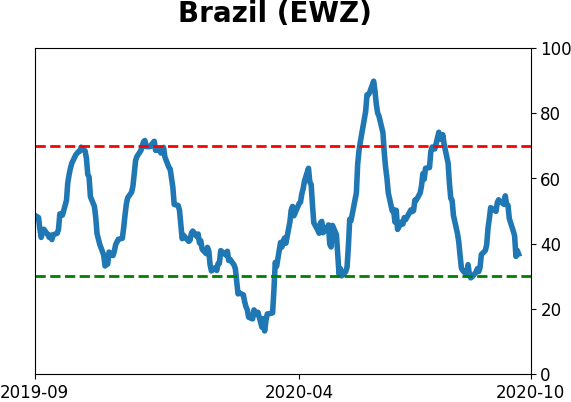
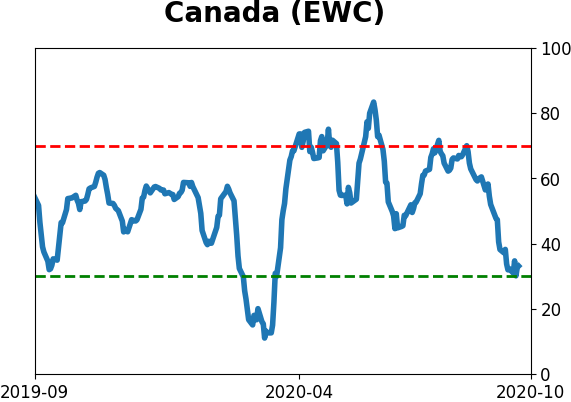
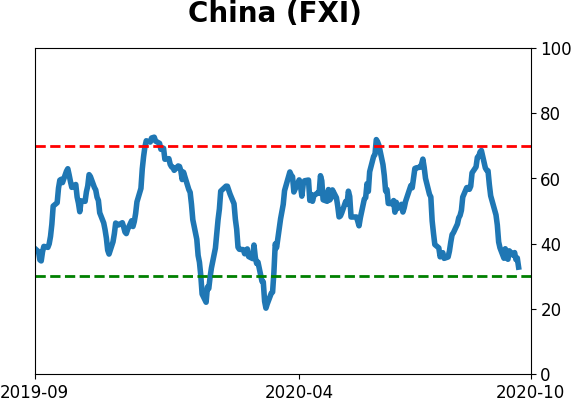
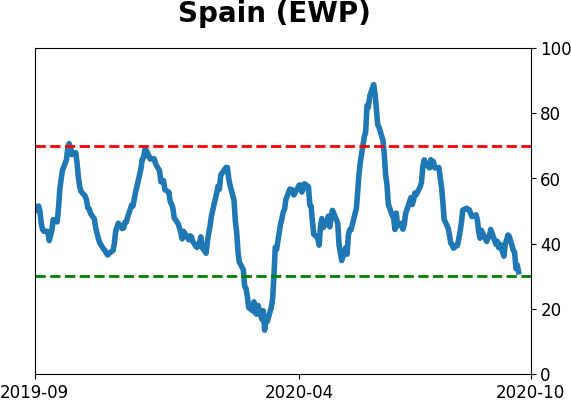
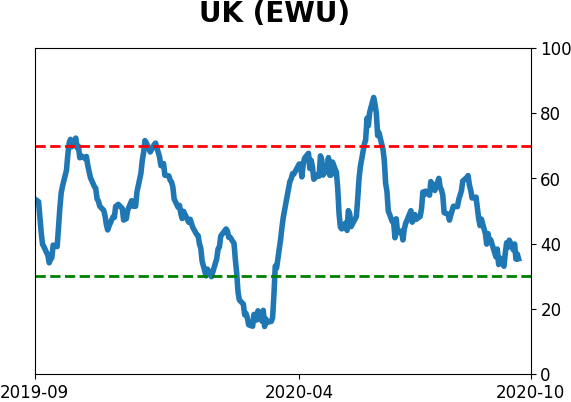
Country ETF's - 10-Day Moving Average
|
|
|
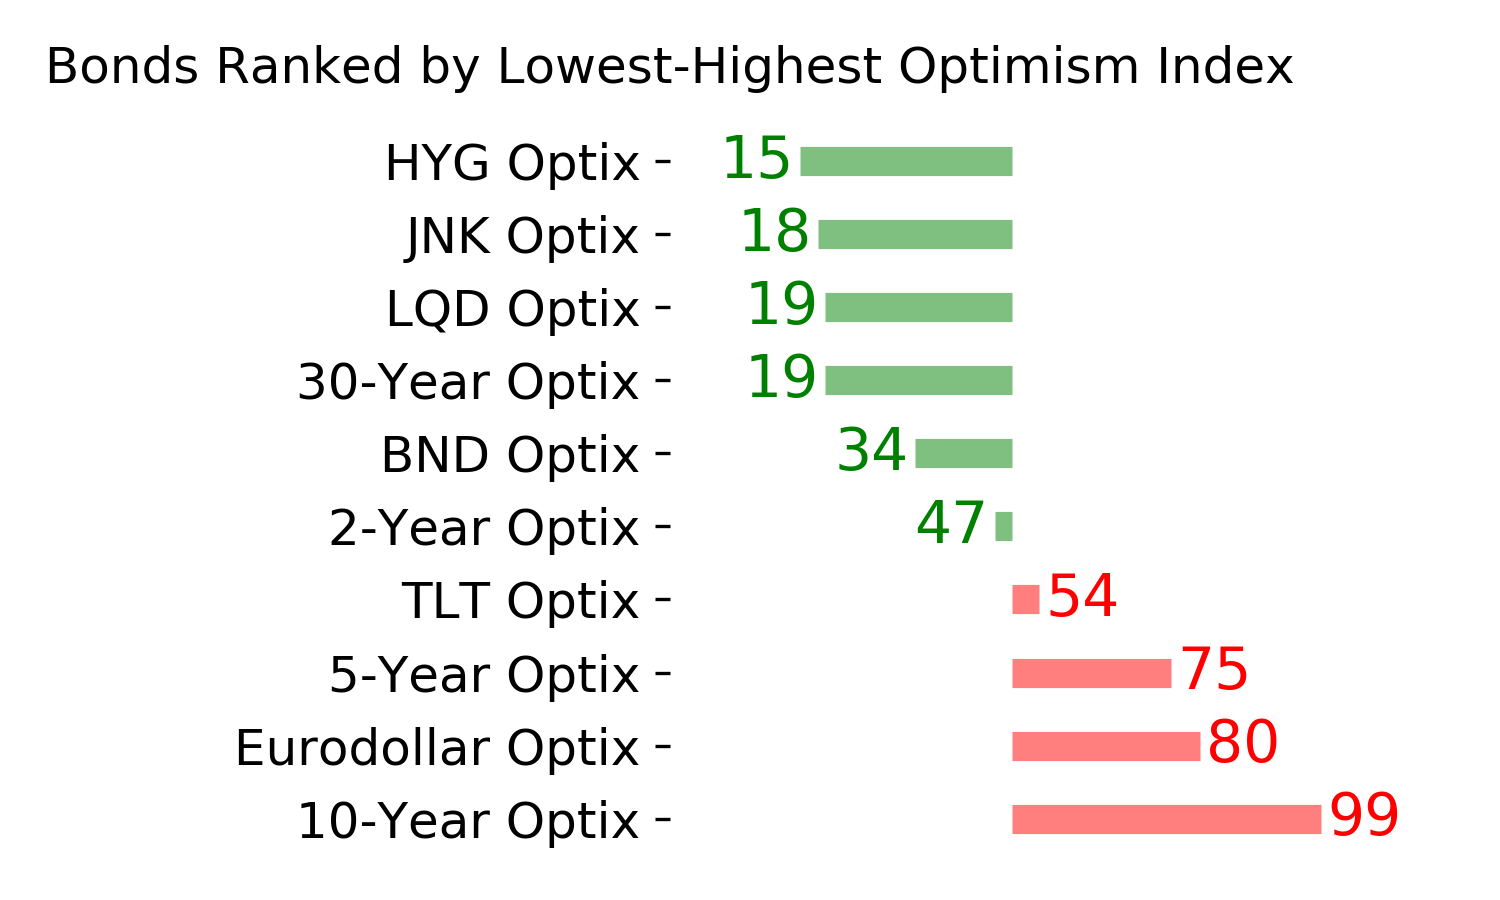
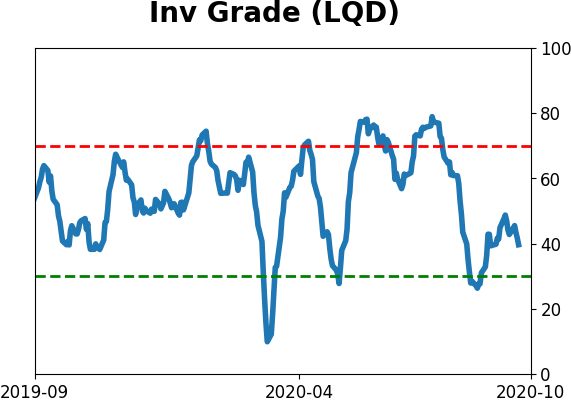
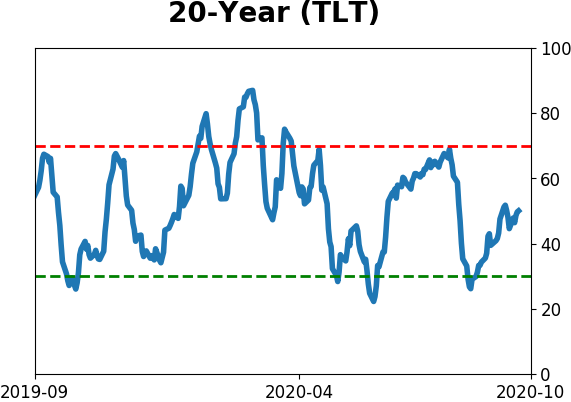
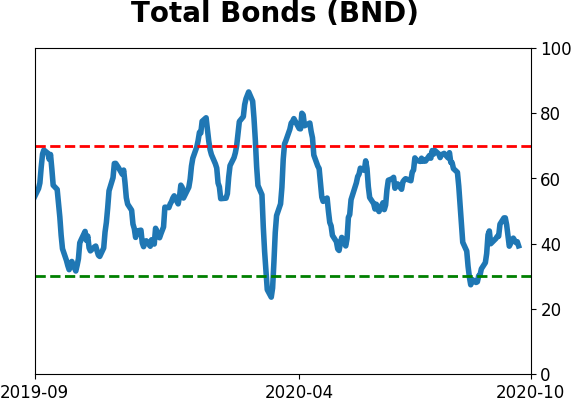
Bond ETF's - 10-Day Moving Average
|
|
|
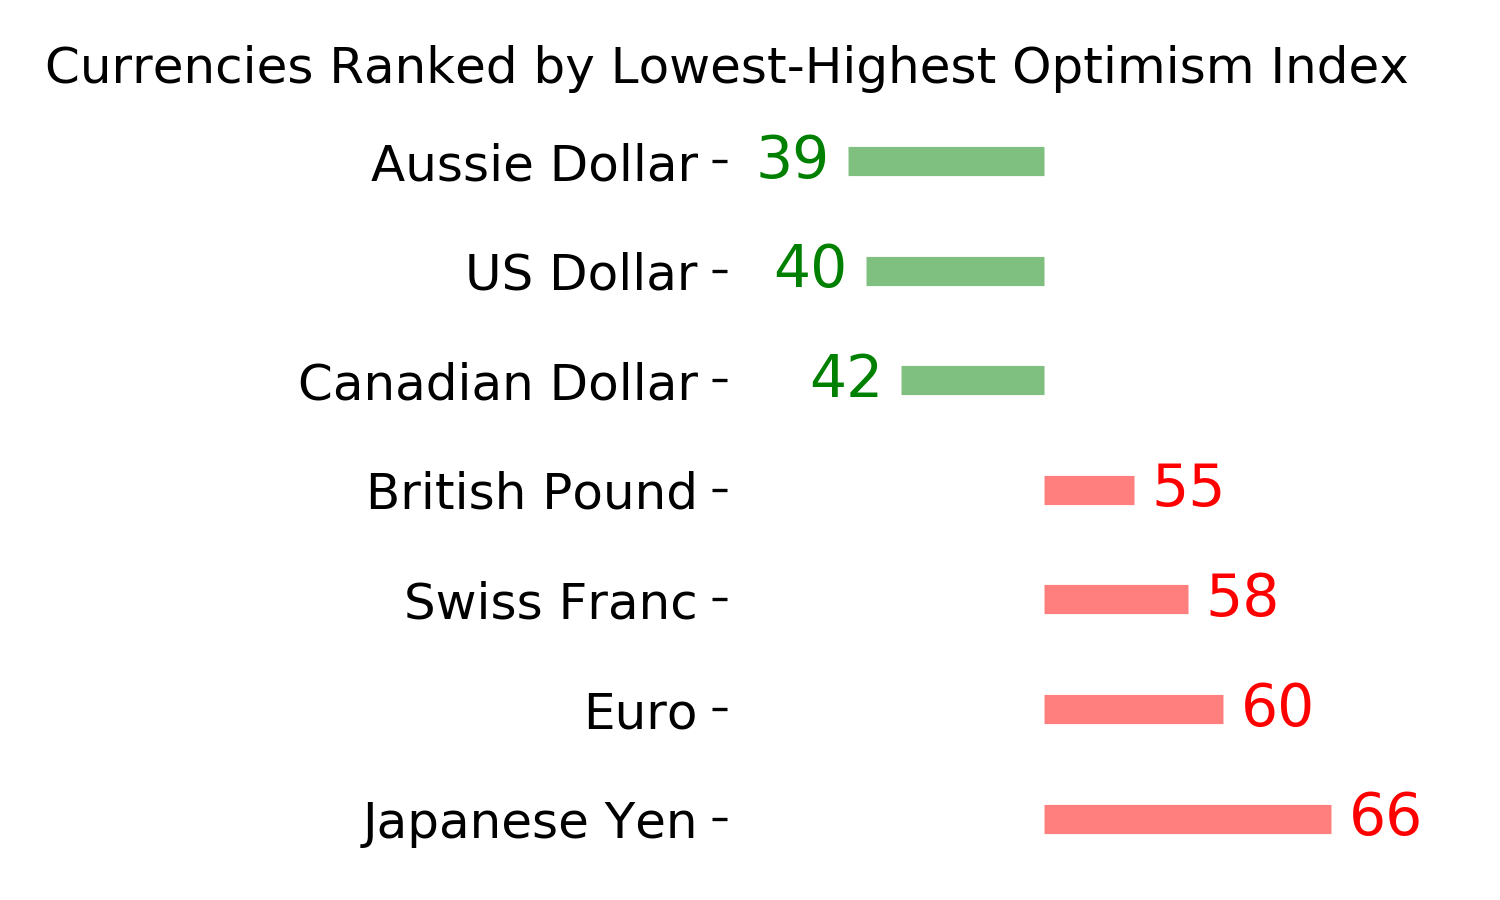
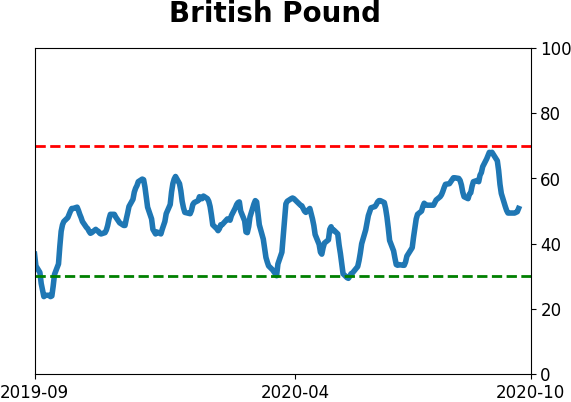
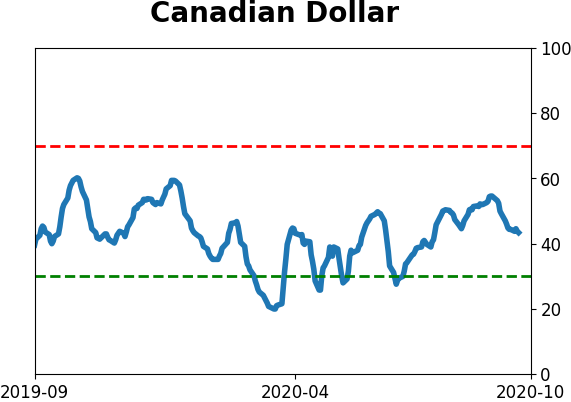
Currency ETF's - 5-Day Moving Average
|
|
|
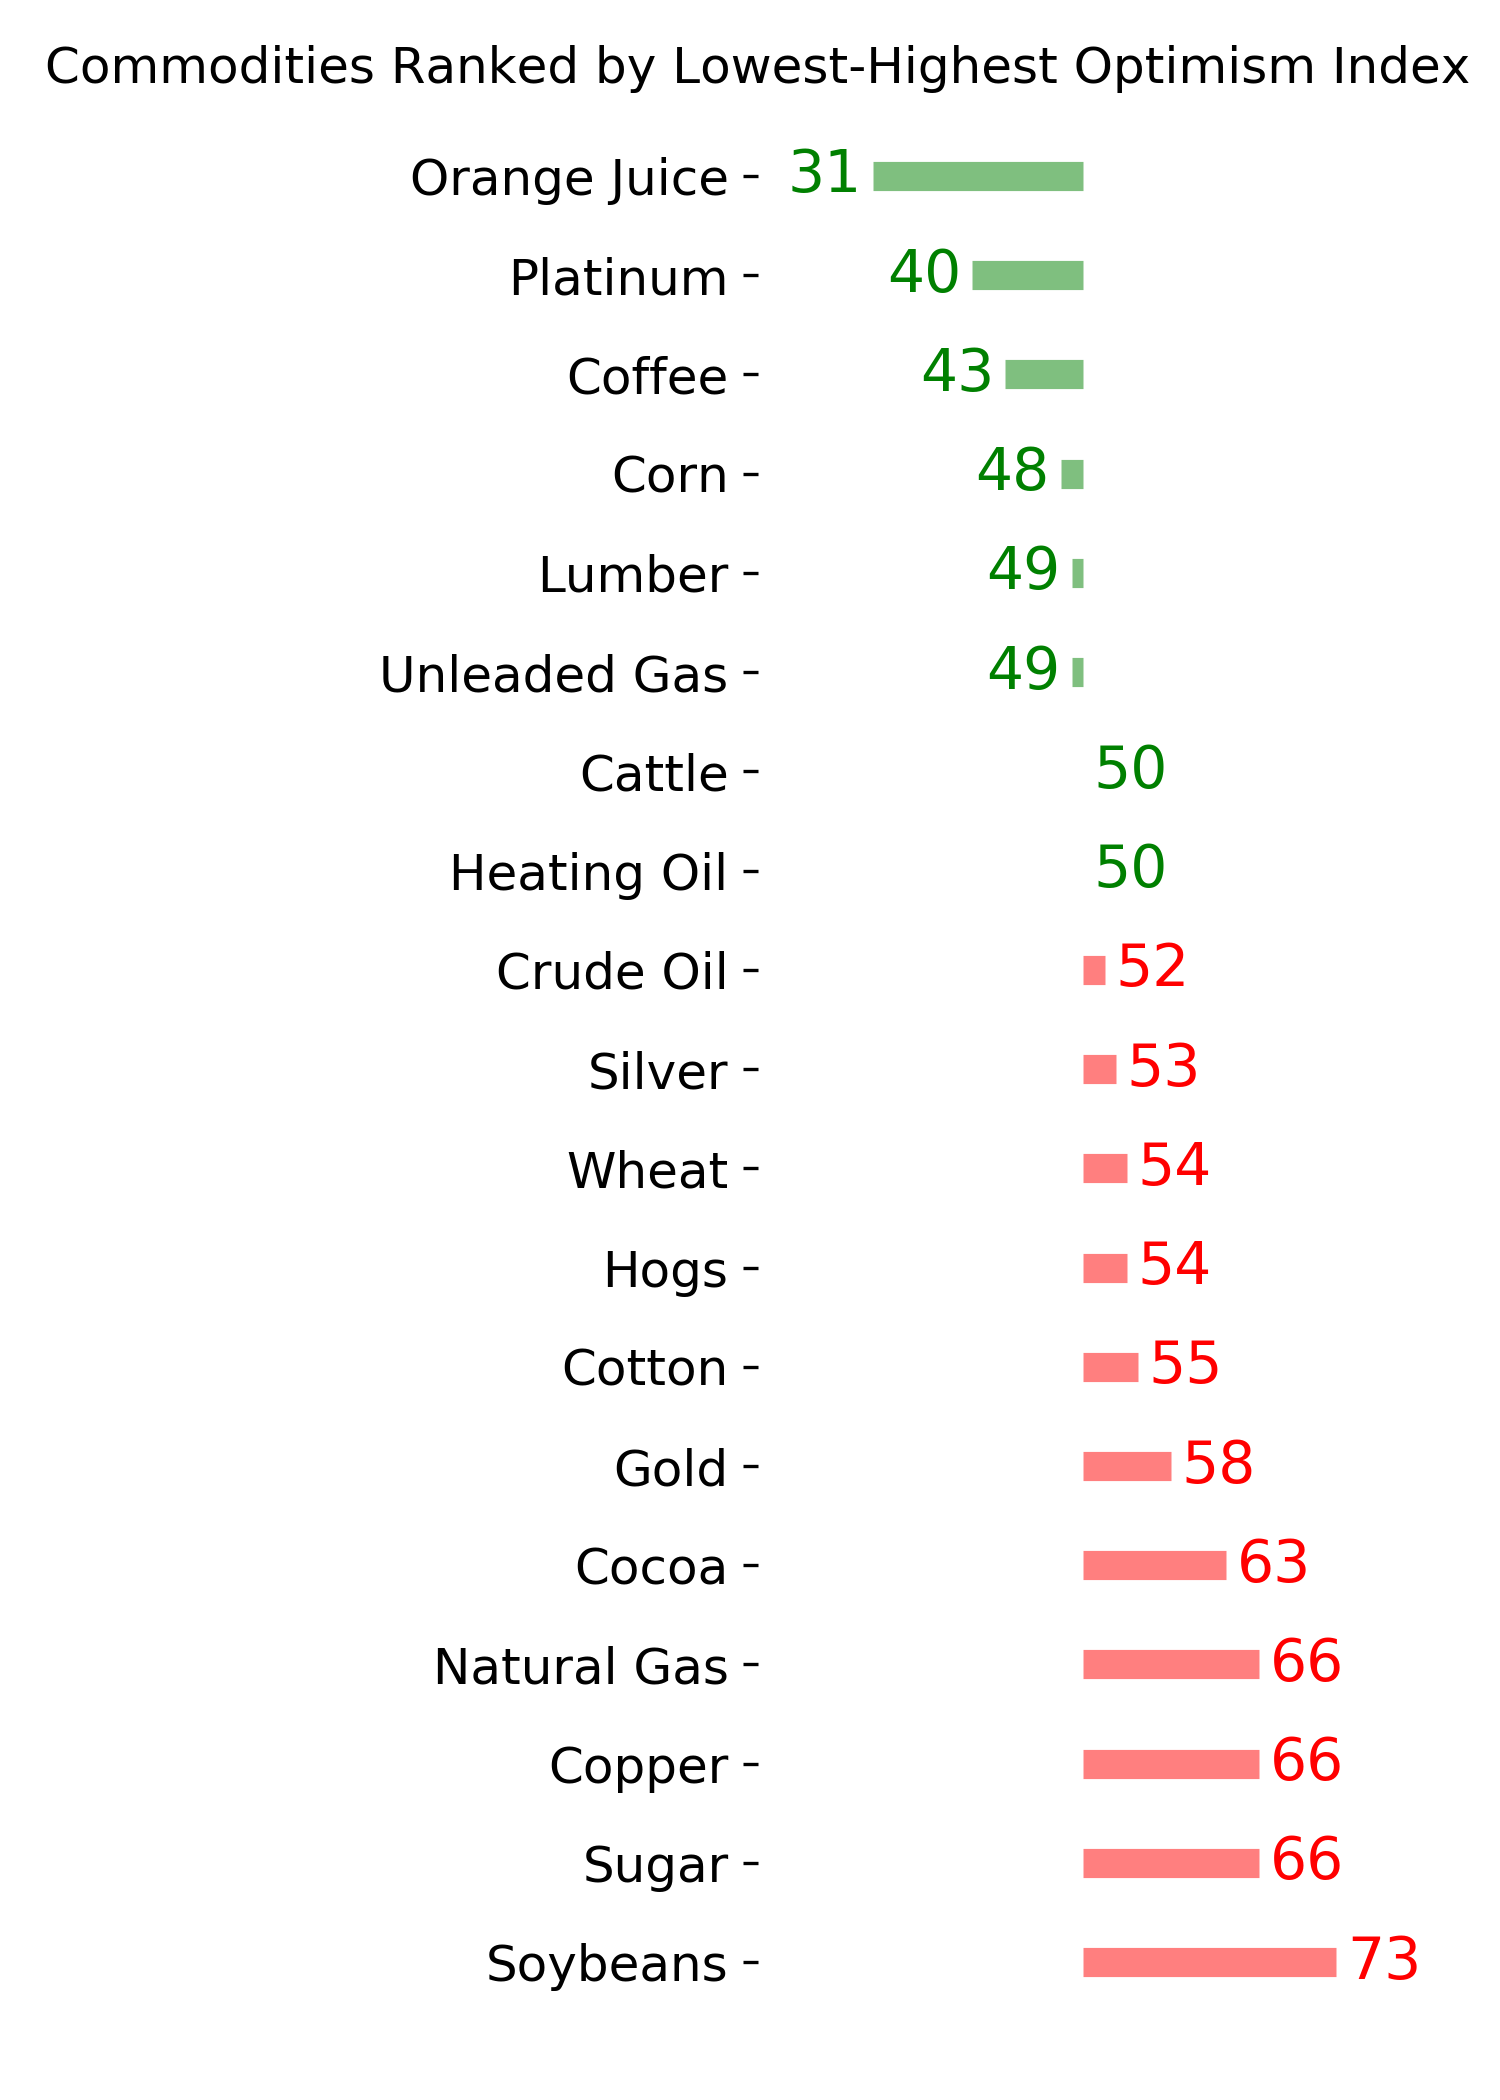
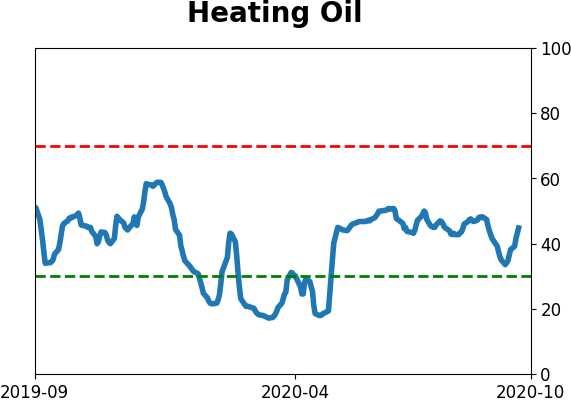
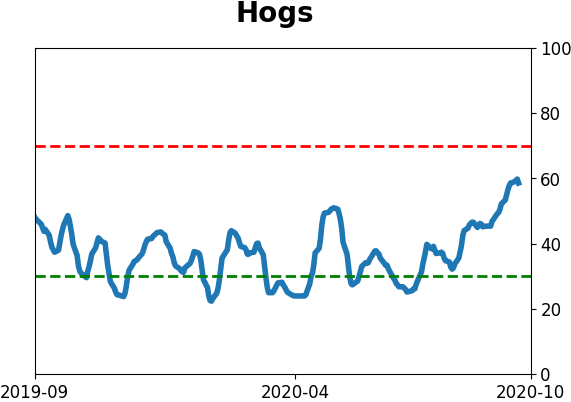
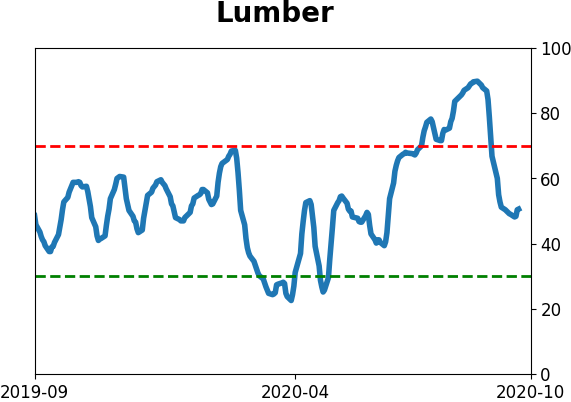
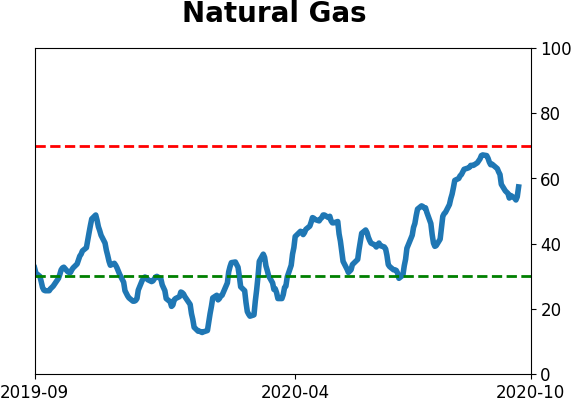
Commodity ETF's - 5-Day Moving Average
|
|