Headlines
|
|
Weekly Wrap for Sep 24 - The Ends of Momentum Streaks, Panic-Level Breadth Washouts:
This week, a number of positive momentum and breadth trends ended after months (or even years), due in large part to Monday's "shocking" decline. Among sectors, we're seeing near panic-level washouts in Tech, Industrials, and the Hang Seng.
The latest Commitments of Traders report was released, covering positions through Tuesday: The 3-Year Min/Max Screen shows that "smart money" commercial hedgers established new multi-year long exposure to the Aussie dollar and palladium. Their net long contracts account for more than 55% of the open interest, nearing a record high dating back 20 years, however sustained rallies in the currency only tend to trigger once hedgers begin reducing their exposure in earnest. The crash in palladium caused hedgers to accumulate more than 33% of open interest, the most since 2002 and 3rd-most all-time. This year is already an outlier, though, since palladium has usually rallied when hedgers had smaller positions. Hedgers continued selling major equity index futures, now holding about $50 billion worth of contracts net short, the most in nearly 3 years.
Bottom Line:
STOCKS: Hold
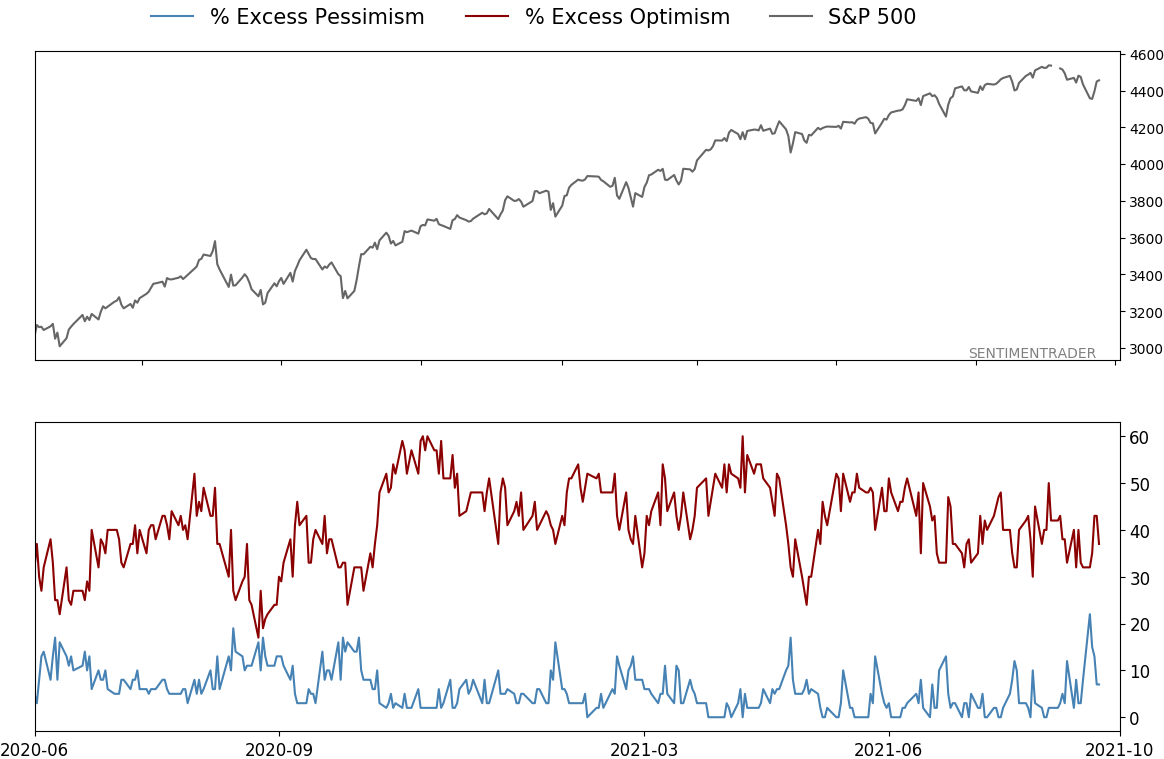
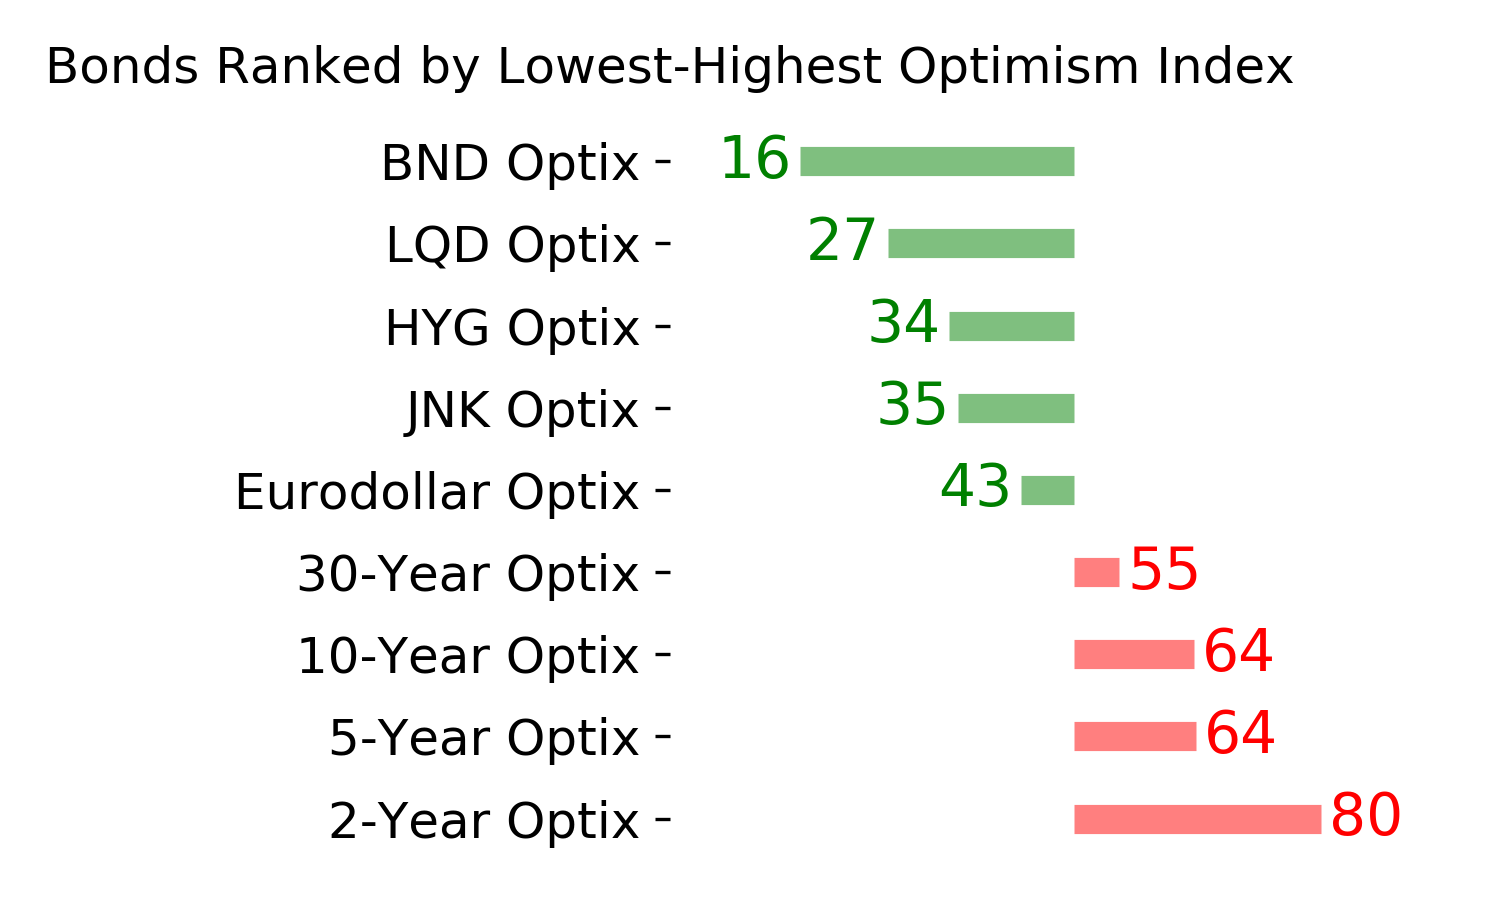
Sentiment continues to decline from the speculative February peak. With deteriorating breadth, this raises the risk of poor short- to medium-term returns until optimism and better breadth returns. See the Outlook & Allocations page for more. BONDS: Hold
Various parts of the market got hit in March, with the lowest Bond Optimism Index we usually see during healthy environments. Bond prices have modest recovered and there is no edge among the data we follow. GOLD: Hold
Gold and miners were rejected after trying to recover above their 200-day averages in May. Lately, some medium-term (not long-term) oversold extremes in breadth measures among miners have triggered.
|
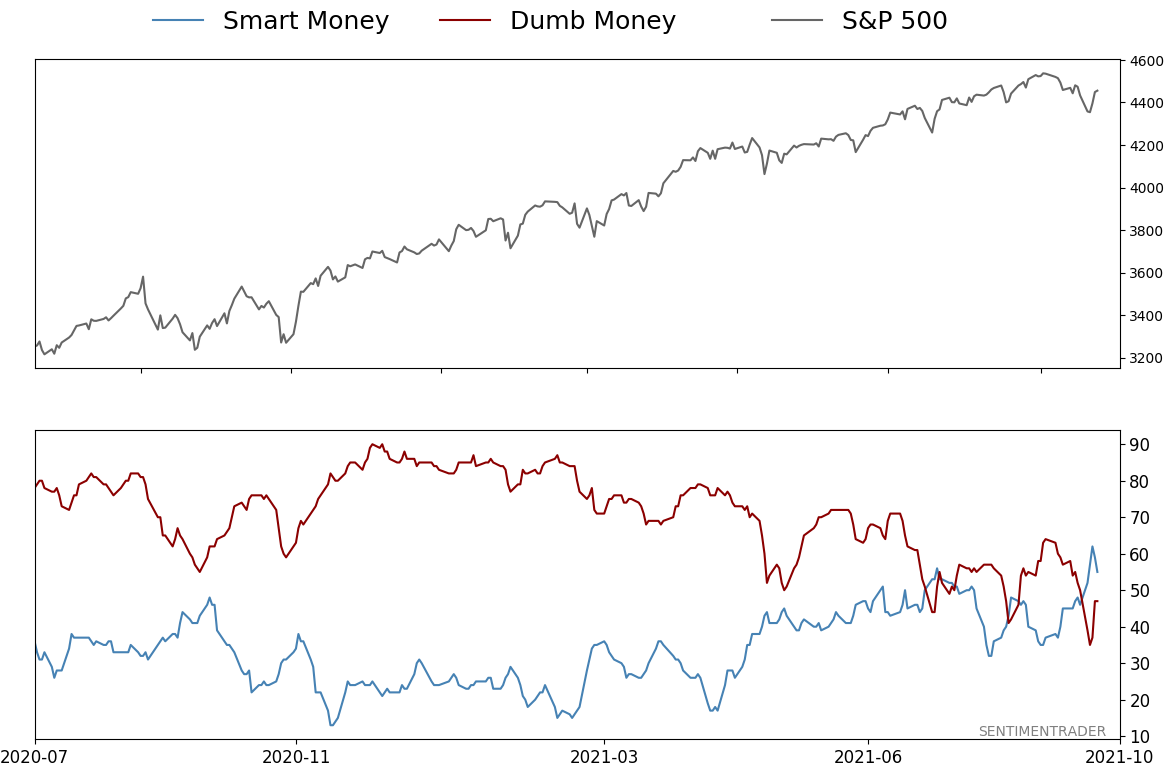
Smart / Dumb Money Confidence
|
Smart Money Confidence: 55%
Dumb Money Confidence: 47%
|
|
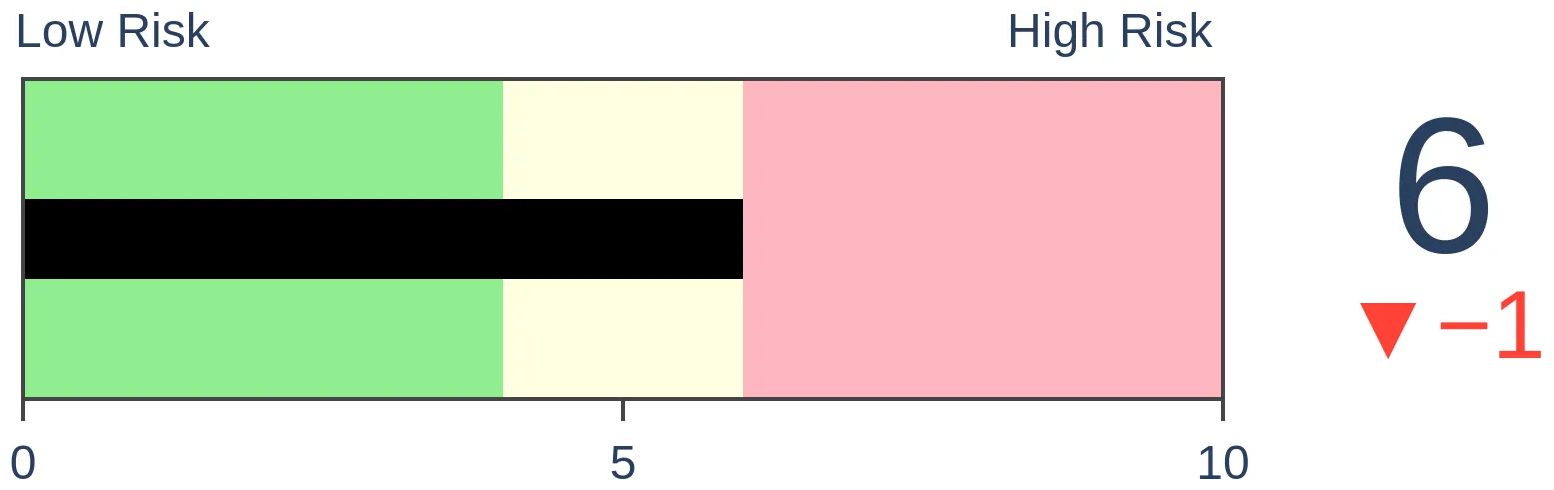
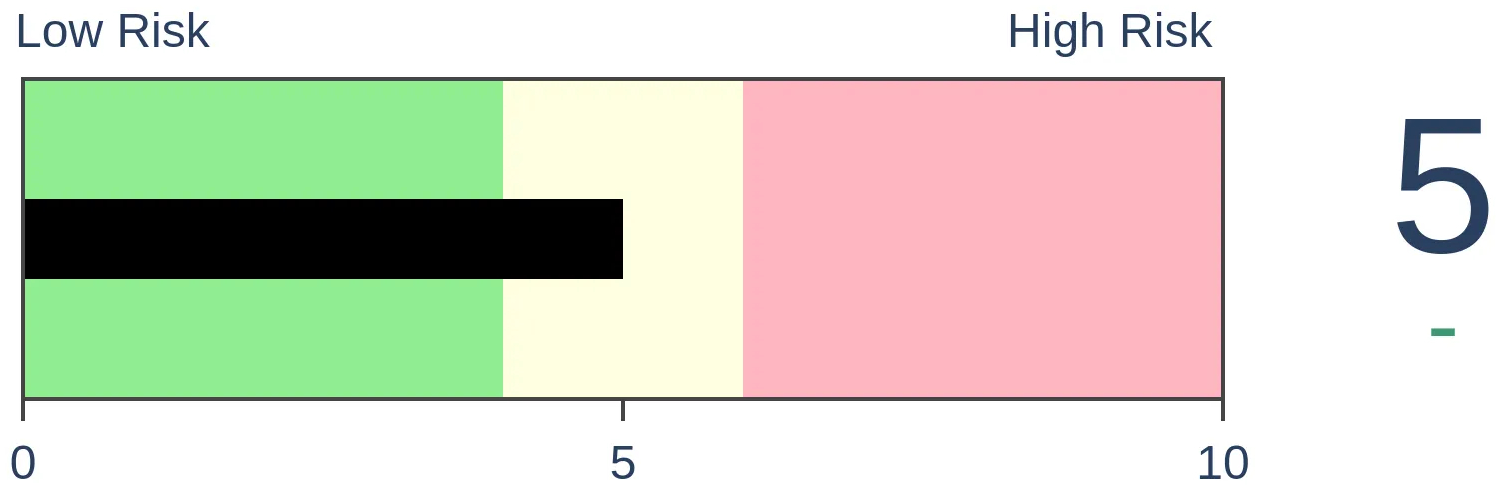
Risk Levels
Stocks Short-Term
|
Stocks Medium-Term

|
|
Bonds
|
Crude Oil
|
|
Gold

|
Agriculture

|
|
Research
By Jason Goepfert
BOTTOM LINE
This week, a number of positive momentum and breadth trends ended after months (or even years), due in large part to Monday's "shocking" decline. Among sectors, we're seeing near panic-level washouts in Tech, Industrials, and the Hang Seng.
FORECAST / TIMEFRAME
None
|
The goal of the Weekly Wrap is to summarize our recent research. Some of it includes premium content (underlined links), but we're highlighting the key focus of the research for all. Sometimes there is a lot to digest, with this summary meant to highlight the highest conviction ideas we discussed. Tags will show any symbols and time frames related to the research.
| STOCKS |
 |  |
|
We've looked at a lot of momentum and breadth studies in recent months, with the conclusion that 2021 has been a year for the record books. The few precedents often witnessed some short-term soft spots but consistently good longer-term returns.
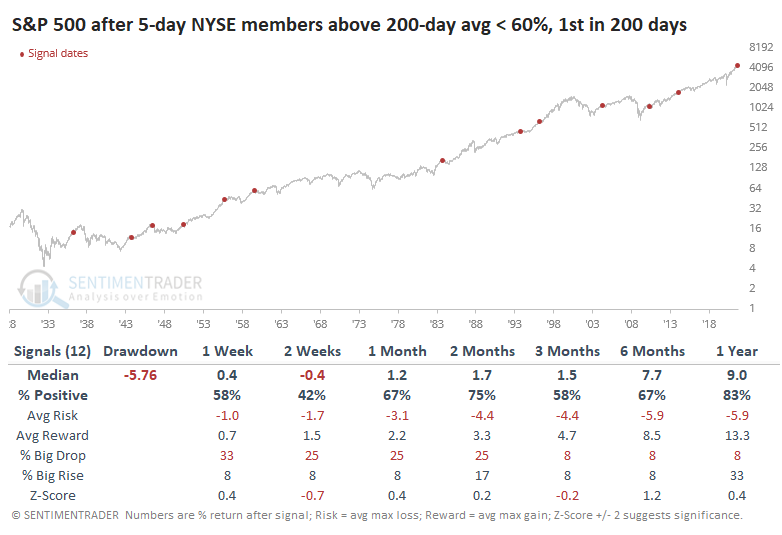
Among stocks traded on the NYSE, fewer and fewer have been holding above their 200-day moving averages. The 5-day average of this figure dropped below 60% for the first time in over 200 sessions. The only other streaks like this in the past 25 years occurred in 2004 and 2010 following the initial recoveries after bear markets and 2014 following the remarkable momentum market of 2013.
Last week ended the 13th-longest streak since 1928.
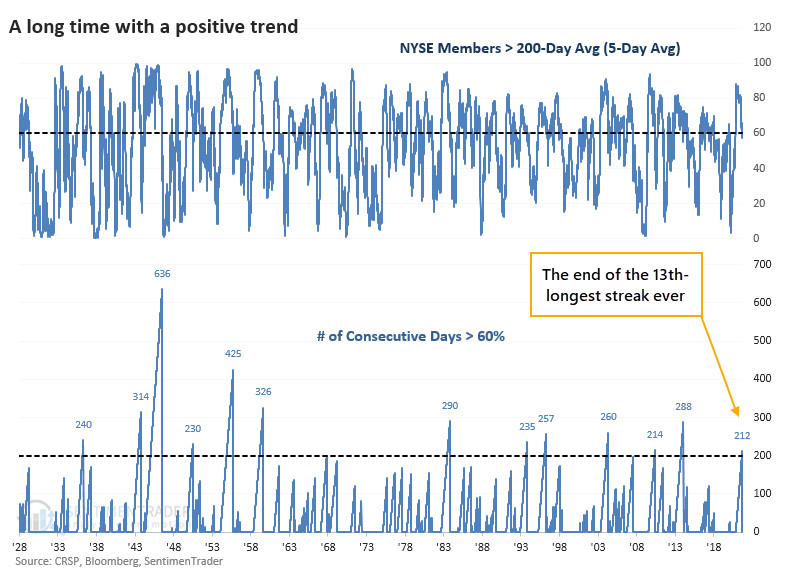
Like we've seen with most of the other studies that looked at long-term momentum and positive breadth, the ends of streaks like this typically did not morph into something more serious. Out of the 12 precedents, only one preceded a double-digit decline over any time frame.
While many securities have been pulling back, indexes like the S&P 500 have held firm. But Monday marked the S&P's first back-to-back closes below its 50-day moving average in over 200 sessions. That ends the 4th-longest streak since 1928.
Even if we relax the parameters to look at "only" six months without consecutive closes below the 50-day, the S&P showed no losses over the next 2-3 months.
THE FIRST SHOCKING DECLINE IN MONTHS
Even with a late-day recovery on Monday, the loss in the most widely-benchmarked index in the world was a rude awakening to those who believe that stocks only travel in one direction. Monday's session was more than two standard deviations from the average daily change over the past year.
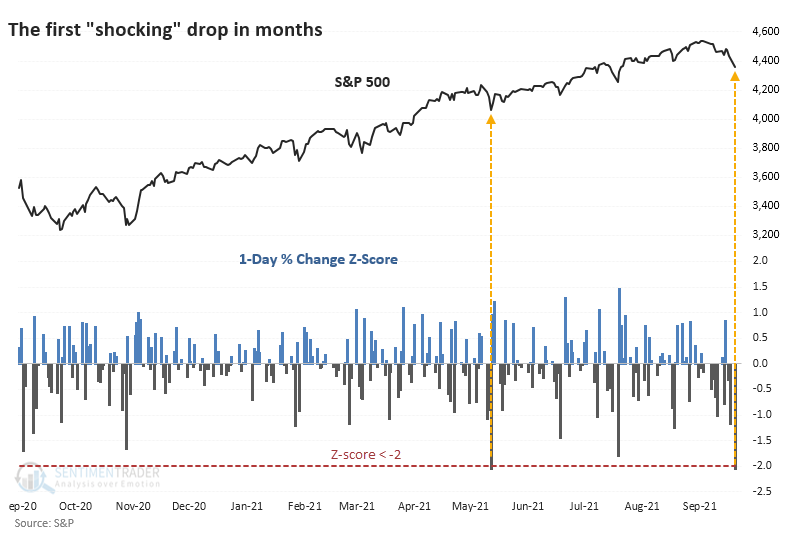
Most of us are concerned with the question of "so what?" To help give a clue, the table below shows every time since 1928 when the S&P 500 was within 5% and no more than three weeks removed from a multi-year high, then suffered its first -2 standard deviation move in at least four months. These show the times when reality paid investors an unwelcome visit.
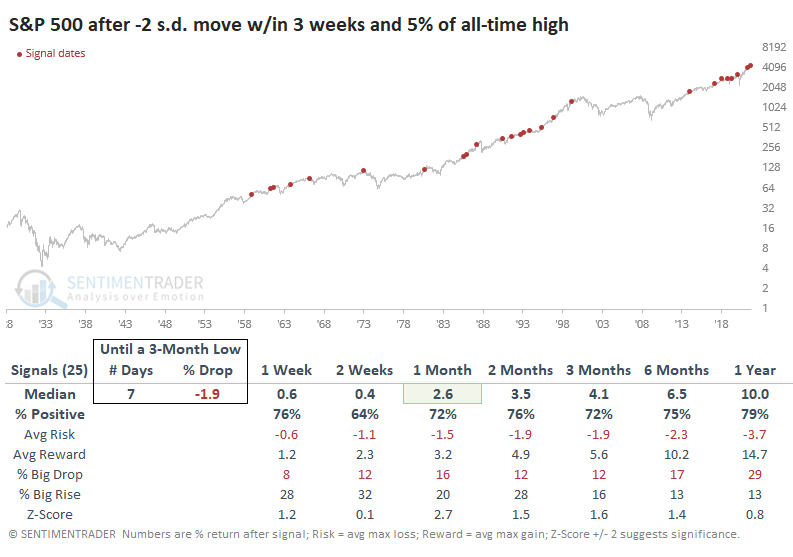
For the most part, these were buying opportunities. Investors love the idea of a bargain, and these declines often provided just that. Instead of paying up after persistent rallies, the quick drops presented them with substantially lower prices, and they usually took advantage.
The S&P's forward returns were above average on all time frames, with the most impressive performance over the next month.
Out of the 25 signals, 5 bottomed that very day, 18 took less than a month to bottom, and 20 suffered less than a 10% decline.
WASHOUT BREADTH IN TECH
Jay pointed out that in the past decade, the technology sector has been the place to be. Interestingly, one reliable breadth indicator just gave a bullish signal for those very stocks.
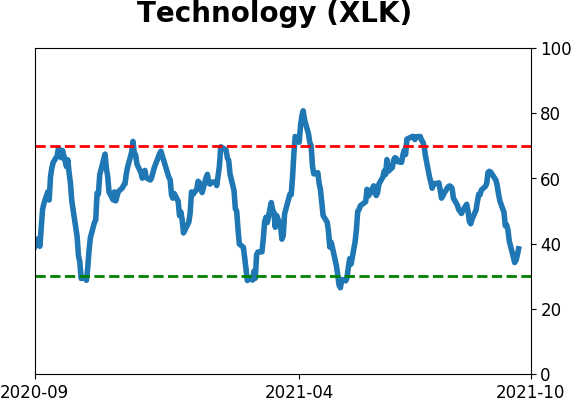
The percentage of tech sector component stocks currently above their respective 10-day moving average fell to an extremely low level during the week. The chart below displays the indicator along with the price action for ticker XLK for the last three years.
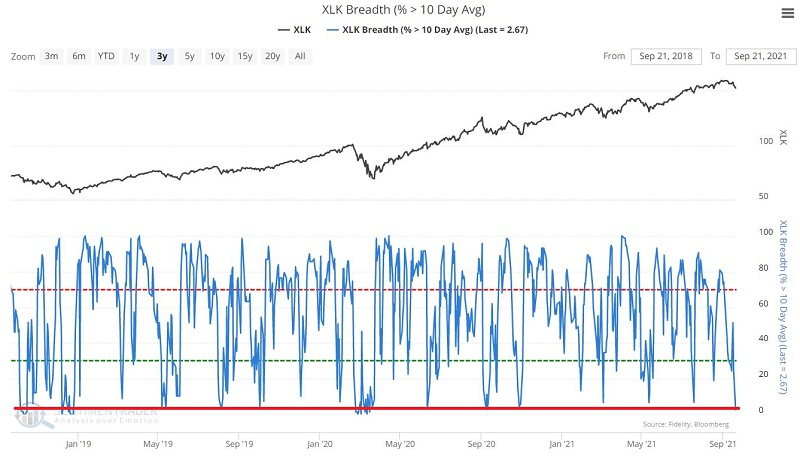
Note that only rarely does the indicator value drop below 3%.
Now let's set up a test using our Backtest Engine. We will look for those times when XLK was above its 200-day moving average and the percentage of tech stocks above their 10-day moving average drops below 3% for the first time in a week.
The returns in the table below are for the XLK ETF.
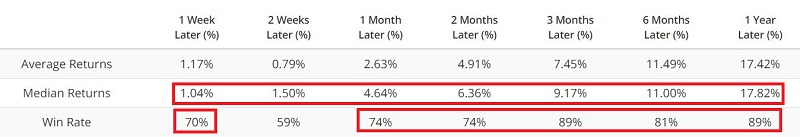
Does this new signal mean everything is "All Clear" for the technology sector and that tech stocks are about to embark on another great run to the upside? Not necessarily. Note that the signals in April 2000 and November 2007 were followed by subsequent 12-month XLK declines of -47% and -39%, respectively. But the probability definitely skewed to the upside.
STOCKS AND SECTORS - OVERSEAS INDEXES
Dean updated his absolute and relative trend following indicators for domestic and international ETFs.
Interestingly, several sectors registered an increase in their respective relative trend scores in an overall soft week for the broad market. The consumer discretionary sector led the way on the back of a better than expected retail sales report. Cyclical-oriented sectors like industrials and materials continue to soften on an absolute and relative basis.
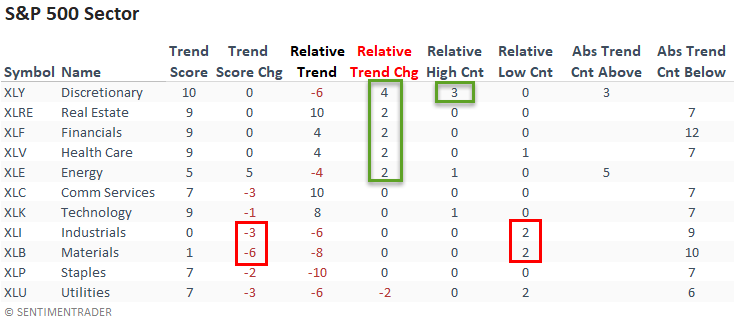
The equal-weighted sector data confirmed the cap-weighted relative trends with improvement in real estate, financials, and energy. Energy was the only group to register a new relative high last week.
The percentage of countries with a positive relative trend score versus the S&P 500 improved slightly on a week-over-week basis. The current level, while improving, continues to suggest an unfavorable environment for the MSCI ACWI World Index ex USA.
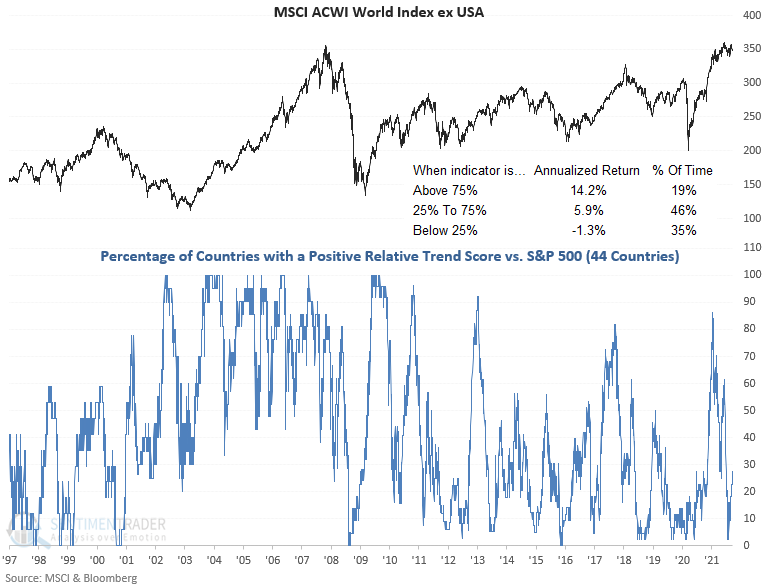
The percentage of countries with a relative trend score of -10 versus the S&P 500 increased slightly on a w/w basis. The Asia Pacific region continues to stabilize at lower levels.
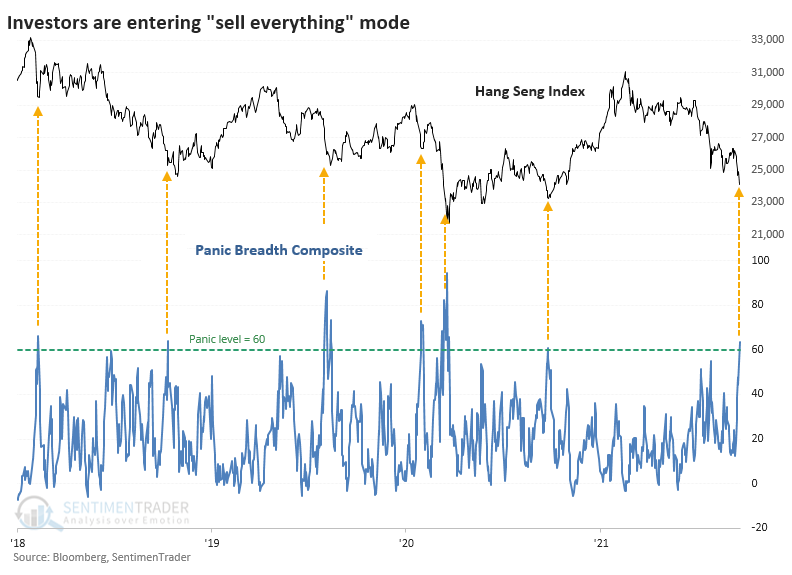
STOCKS AND SECTORS - HANG SENG
Stocks in Hong Kong have been feeling pressure, thanks in part to a plunge in property developers and related companies.
Over 5 days into Monday, an average of more than 34 stocks in the index declined versus advanced, one of the most extreme readings in nearly 20 years.
In prior years, we've looked at a breadth composite when a particular market looks like it's suffering panic-level selling pressure (like Mexico and South Korea in 2019). This composite includes nine breadth metrics that have a good record at highlighting overwhelming internal selling pressure.
It was a decent medium-term sign with returns above random across most time frames, consistent gains, and more reward than risk. It wasn't outstanding, though, as there were several large losers. The sweet spot, as we so often see, was over the next 1-3 months.
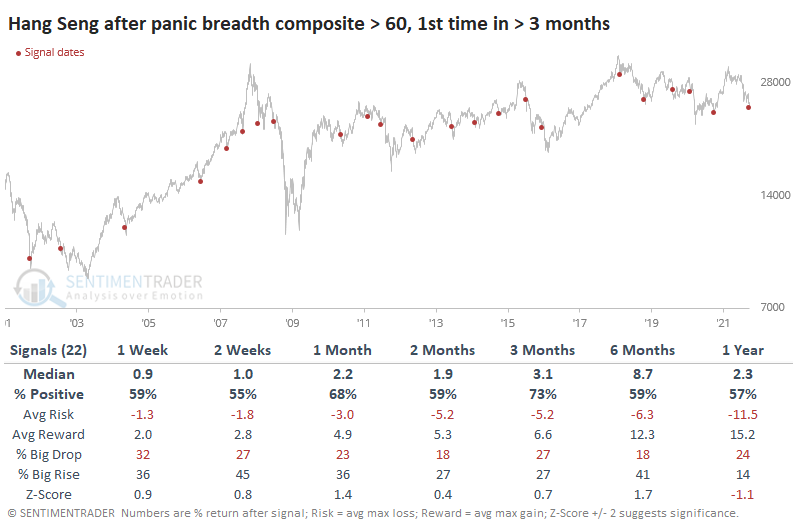
Successful signals didn't see more than an 8% drawdown during the next six months, and most of those were under 5%. The handful of failures didn't see any more significant rallies than about 5% before cratering.
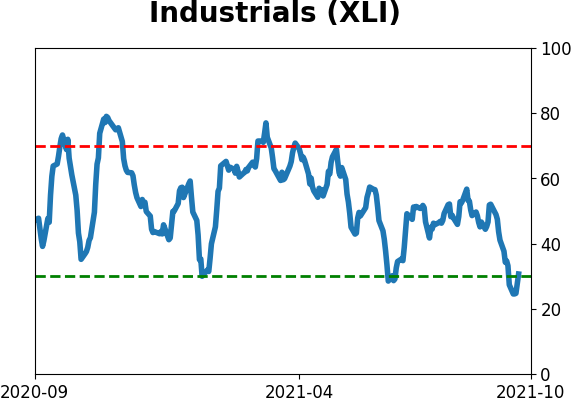
STOCKS AND SECTORS - INDUSTRIALS
This longer-term selling pressure has pushed the McClellan Summation Index for Industrials close to the zero line. Over the past five years, this has been a good buying opportunity...except when it wasn't, then it augured a multi-month period of a tough market.
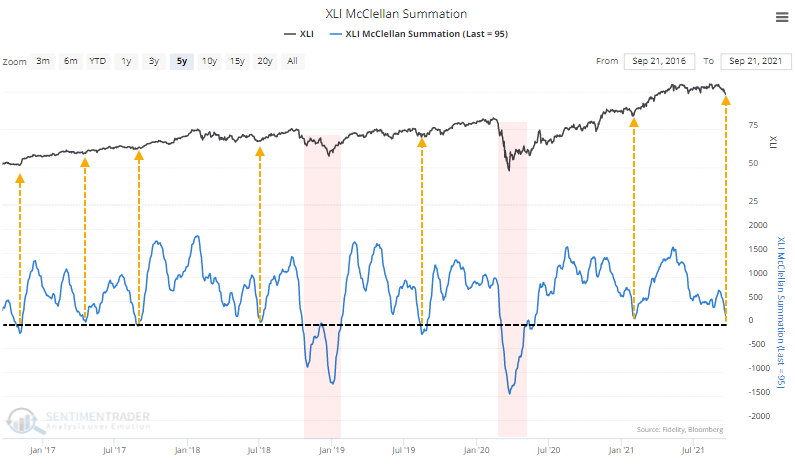
If we create a panic breadth composite as we did for the Hang Seng, it just crossed above 55%. The unusual thing about the current signal is that it triggered when the Dow Industrials were so close to a 52-week high, within 5% of it. Only a few other signals have done this.
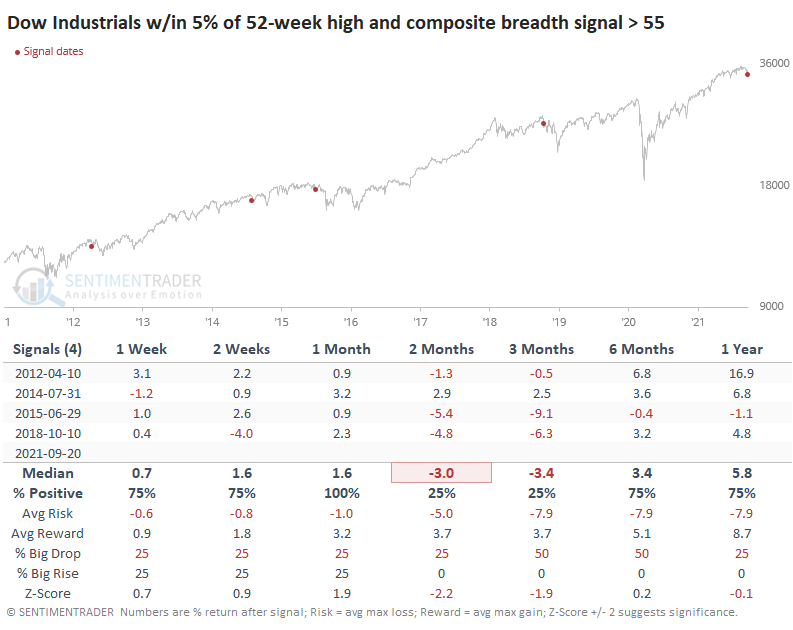
The thumbnails show how the Dow set a lower low each time at some point within the next couple of months, but each also ultimately resolved higher.
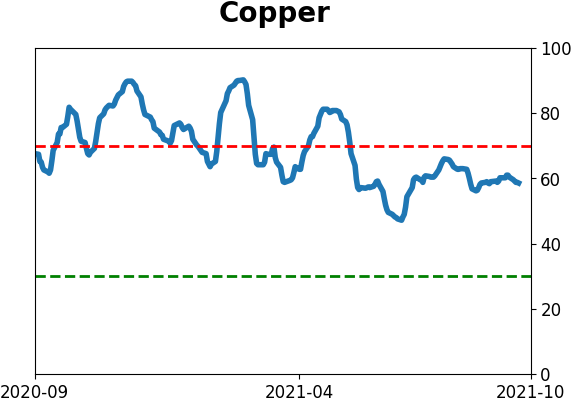
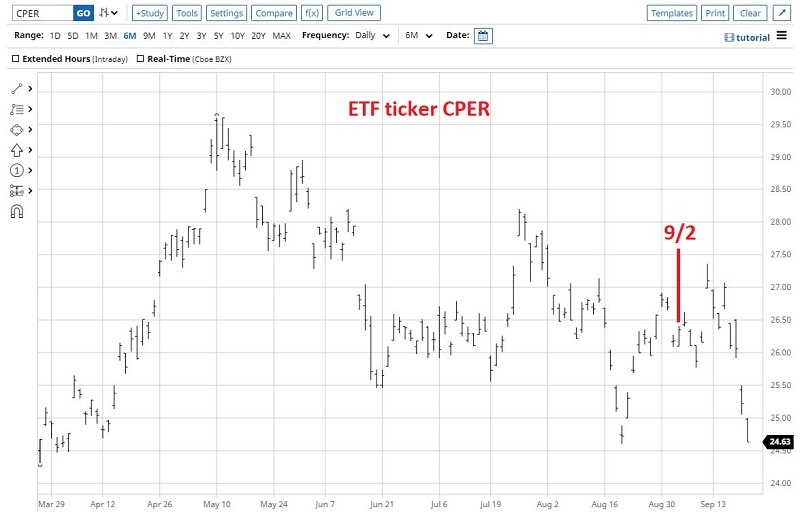
Jay updated an outlook on copper from a few weeks ago. The ETF ticker CPER (which ostensibly tracks the price of copper futures but trades like shares of stock) has declined roughly -6.5% since then.
Note that in 2021, copper has followed its seasonal trend pretty closely (in terms of trend, not necessarily in magnitude). The most recent decline started right on cue. Also, note in the chart below that things could get much worse before they get better from a solely seasonal point of view.
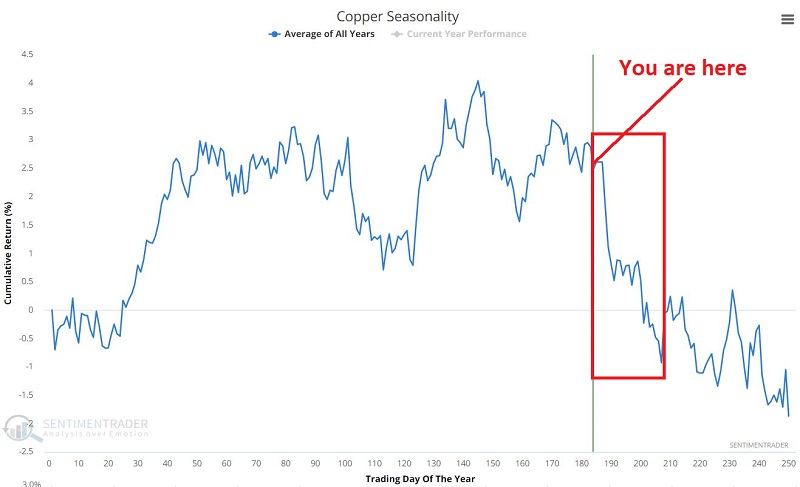
Price, seasonality, and sentiment are all presently aligned on the unfavorable side for copper. Does this mean that copper cannot rally from here? Or that copper is doomed to fall much further from here? Not at all. Still, in the long run, successful trading generally involves weighing the evidence in each given situation and trying to find an "edge."
For now, the weight of the evidence continues to be unfavorable for copper.
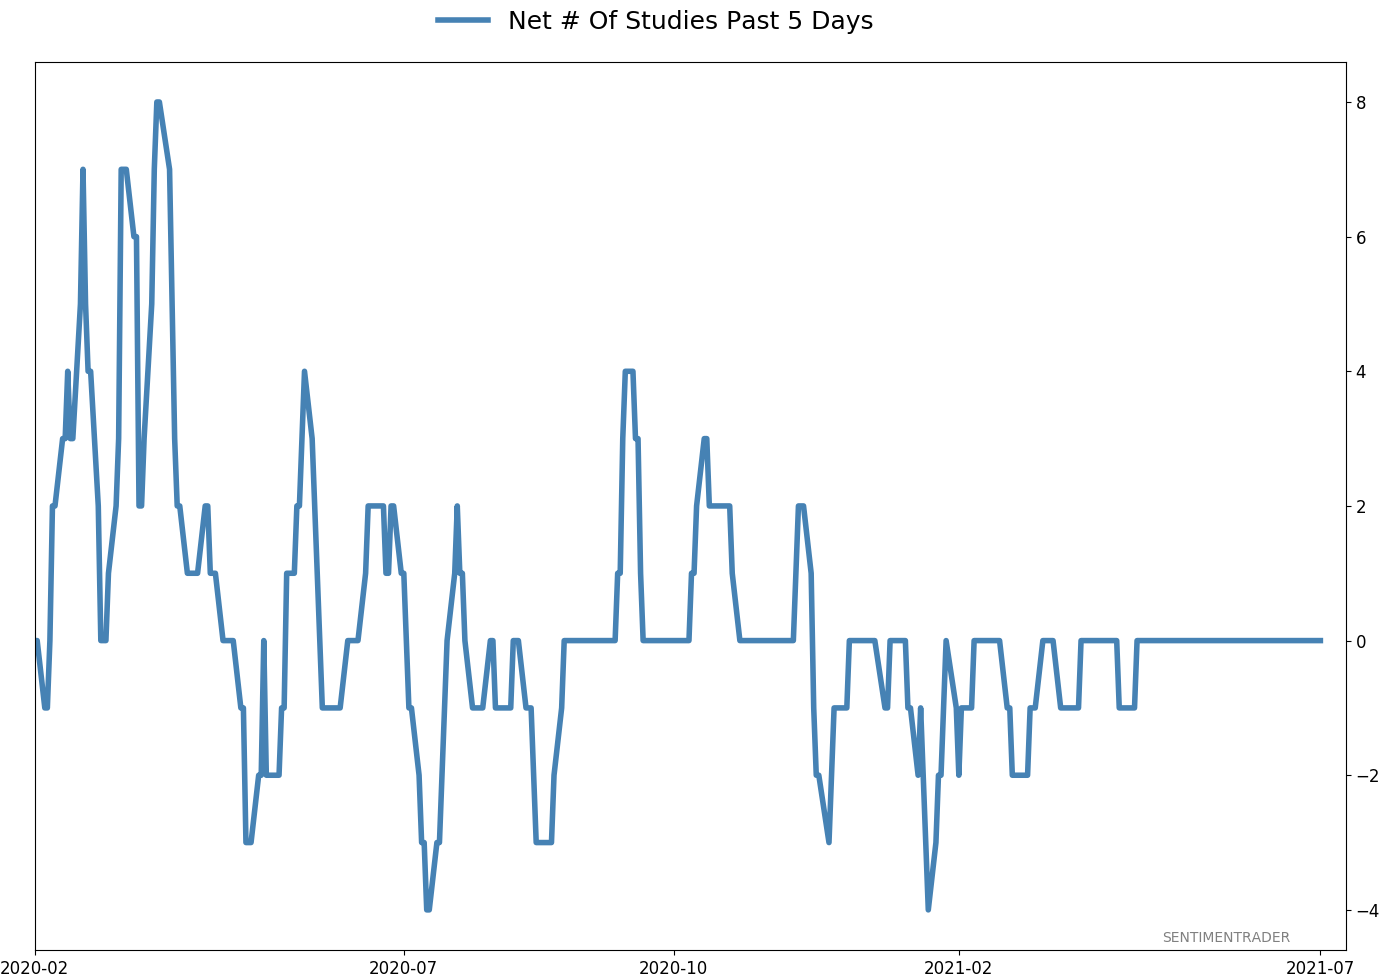
Active Studies
| Time Frame | Bullish | Bearish | | Short-Term | 0 | 6 | | Medium-Term | 7 | 3 | | Long-Term | 11 | 5 |
|
Indicators at Extremes
Portfolio
| Position | Description | Weight % | Added / Reduced | Date | | Stocks | RSP | 4.1 | Added 4.1% | 2021-05-19 | | Bonds | 23.9% BND, 6.9% SCHP | 30.7 | Reduced 7.1% | 2021-05-19 | | Commodities | GCC | 2.6 | Reduced 2.1%
| 2020-09-04 | | Precious Metals | GDX | 5.6 | Reduced 4.2% | 2021-05-19 | | Special Situations | 4.3% XLE, 2.2% PSCE | 7.6 | Reduced 5.6% | 2021-04-22 | | Cash | | 49.4 | | |
|
Updates (Changes made today are underlined)
Much of our momentum and trend work has remained positive for several months, with some scattered exceptions. Almost all sentiment-related work has shown a poor risk/reward ratio for stocks, especially as speculation drove to record highs in exuberance in February. Much of that has worn off, and most of our models are back toward neutral levels. There isn't much to be excited about here. The same goes for bonds and even gold. Gold has been performing well lately and is back above long-term trend lines. The issue is that it has a poor record of holding onto gains when attempting a long-term trend change like this, so we'll take a wait-and-see approach. RETURN YTD: 8.2% 2020: 8.1%, 2019: 12.6%, 2018: 0.6%, 2017: 3.8%, 2016: 17.1%, 2015: 9.2%, 2014: 14.5%, 2013: 2.2%, 2012: 10.8%, 2011: 16.5%, 2010: 15.3%, 2009: 23.9%, 2008: 16.2%, 2007: 7.8%
|
|
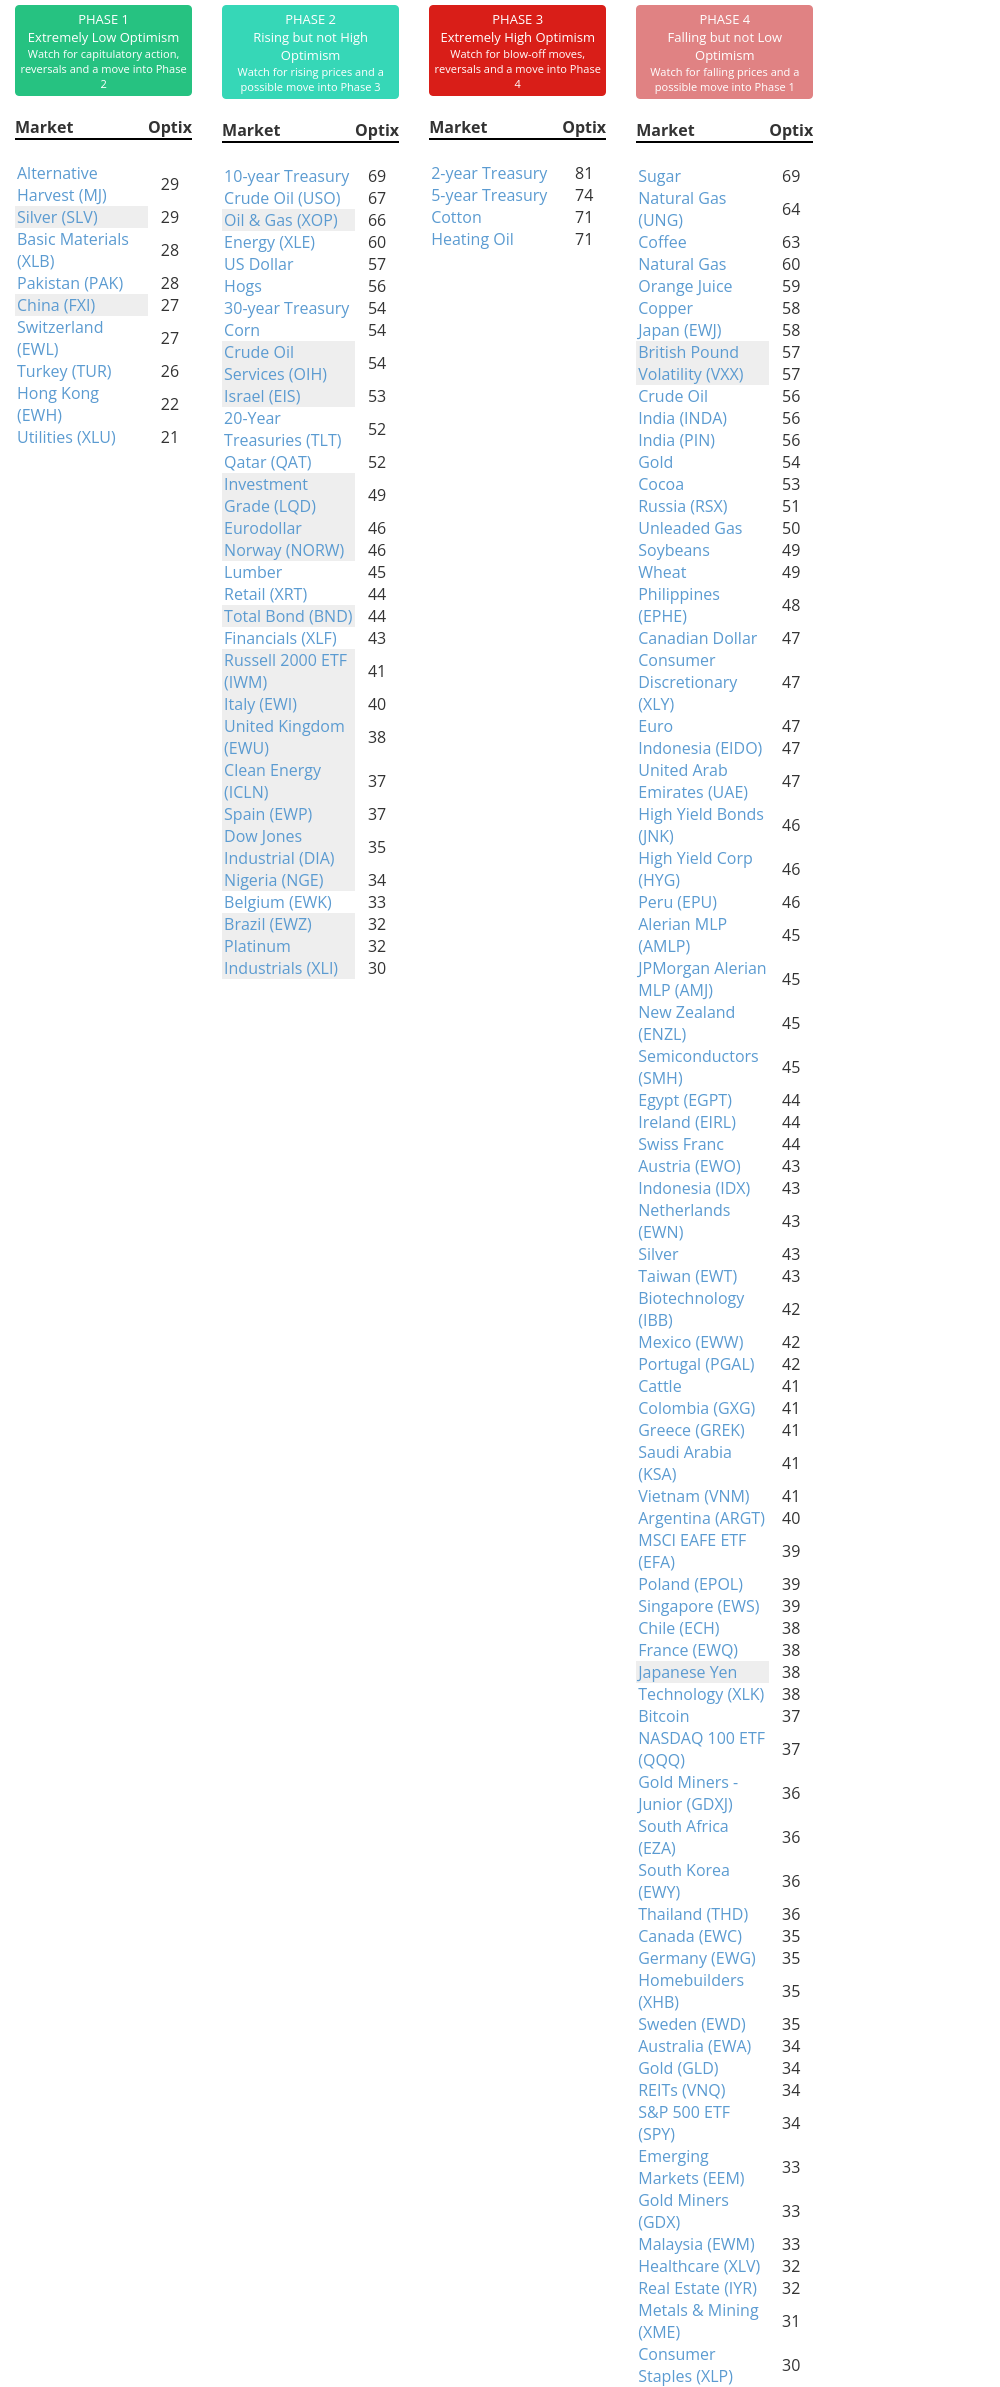
Phase Table
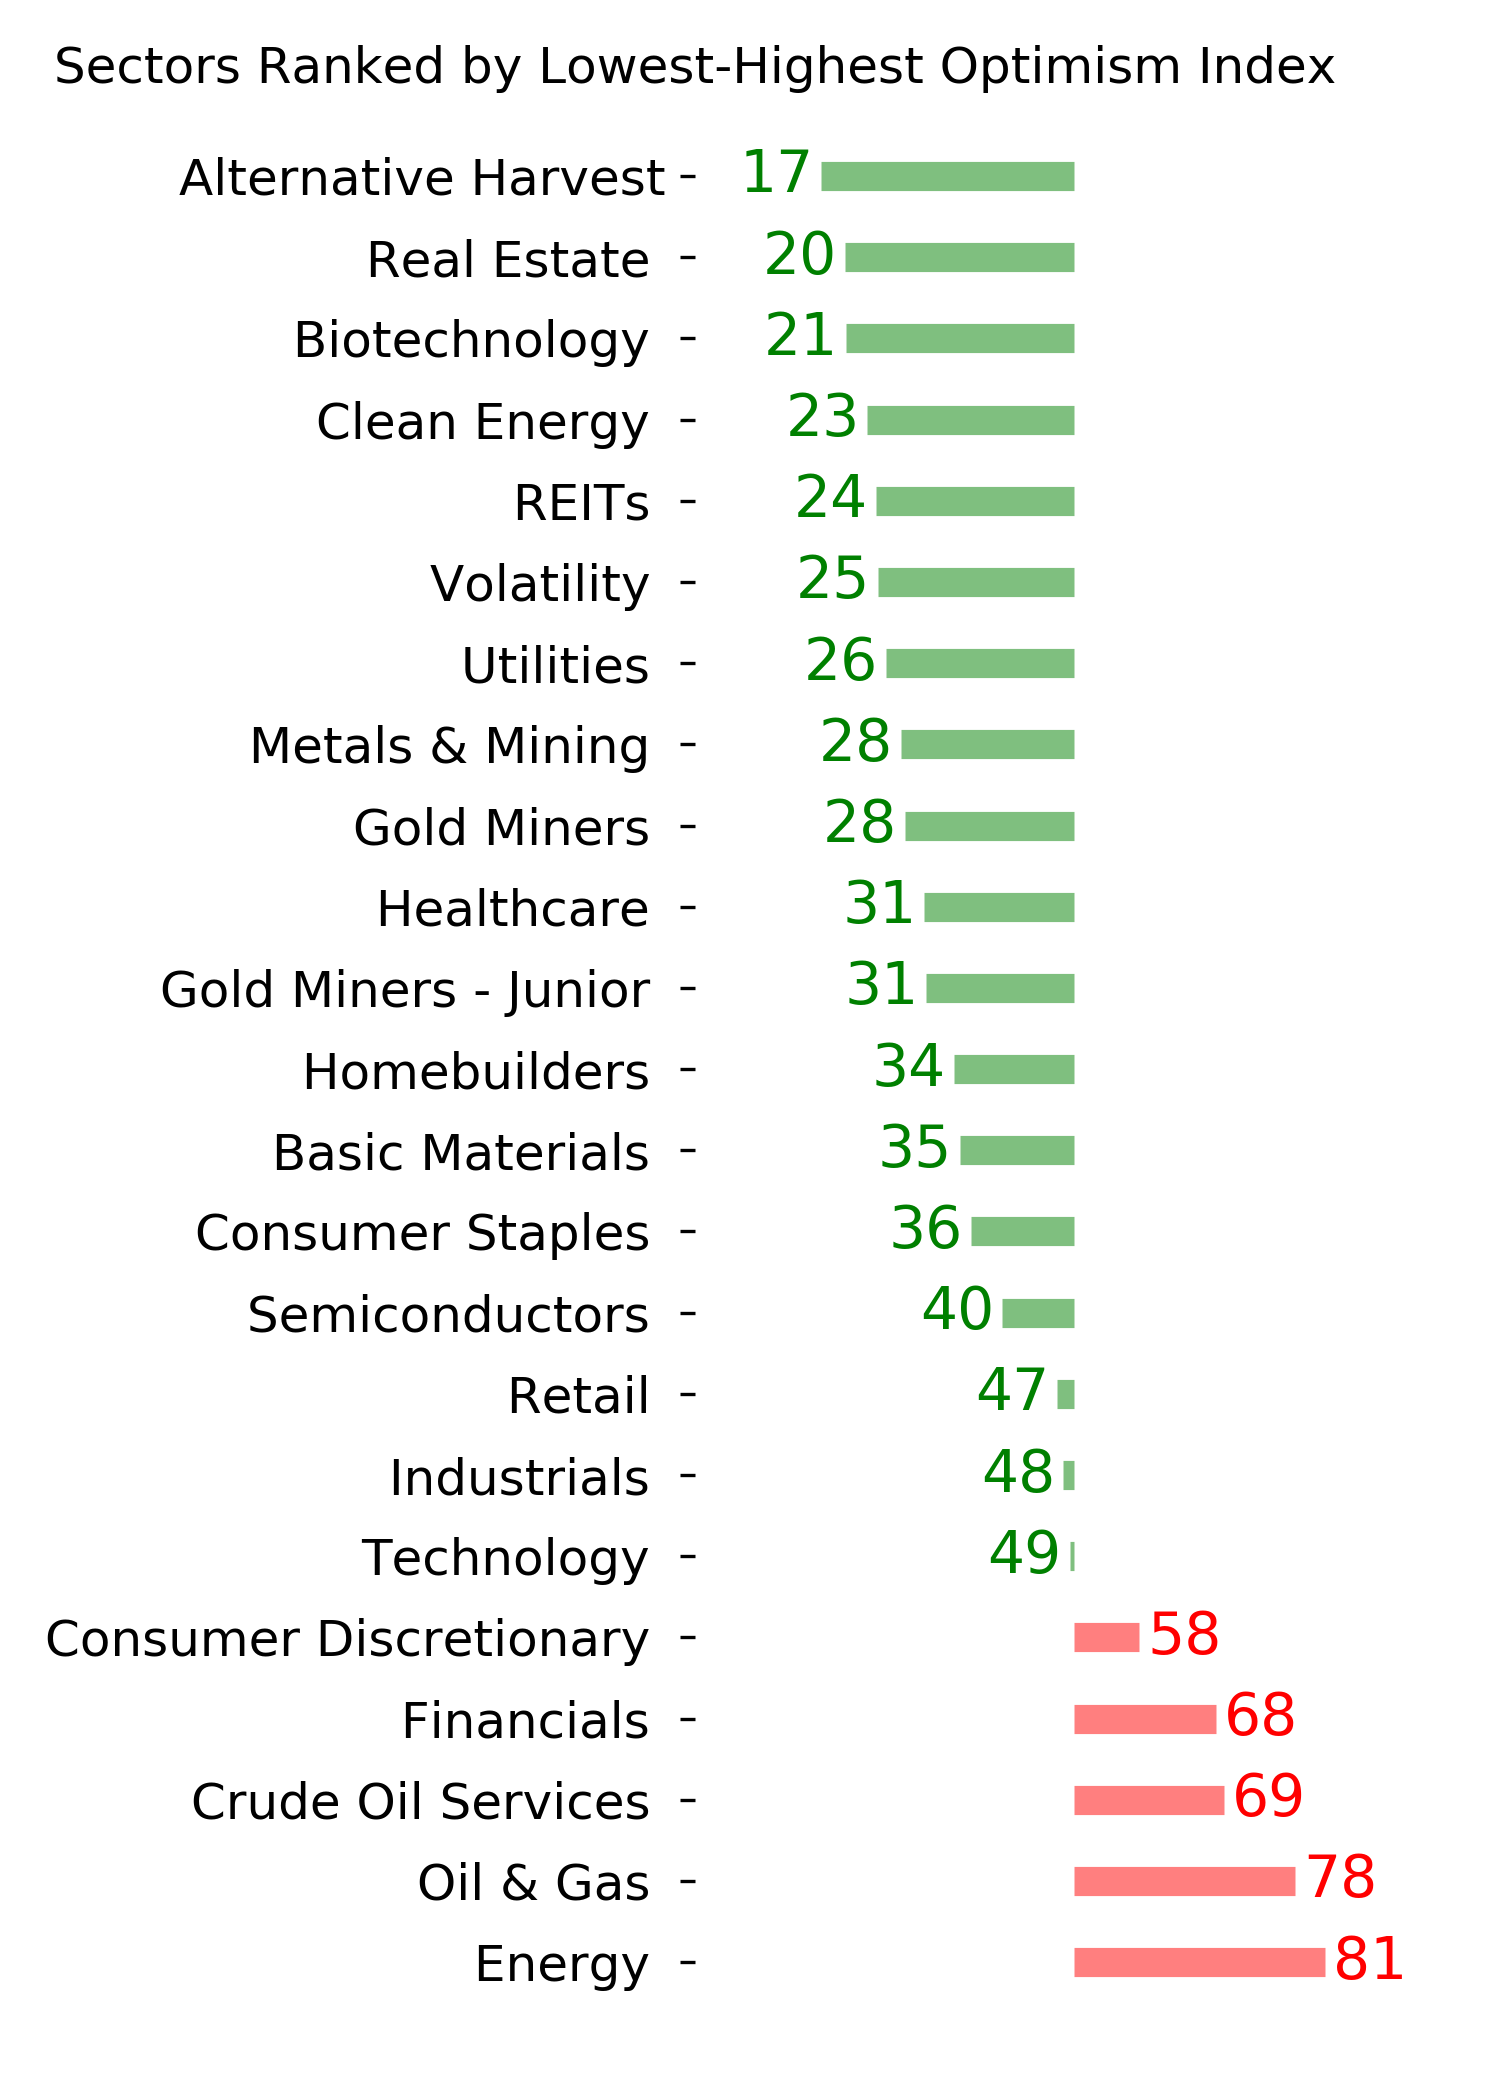
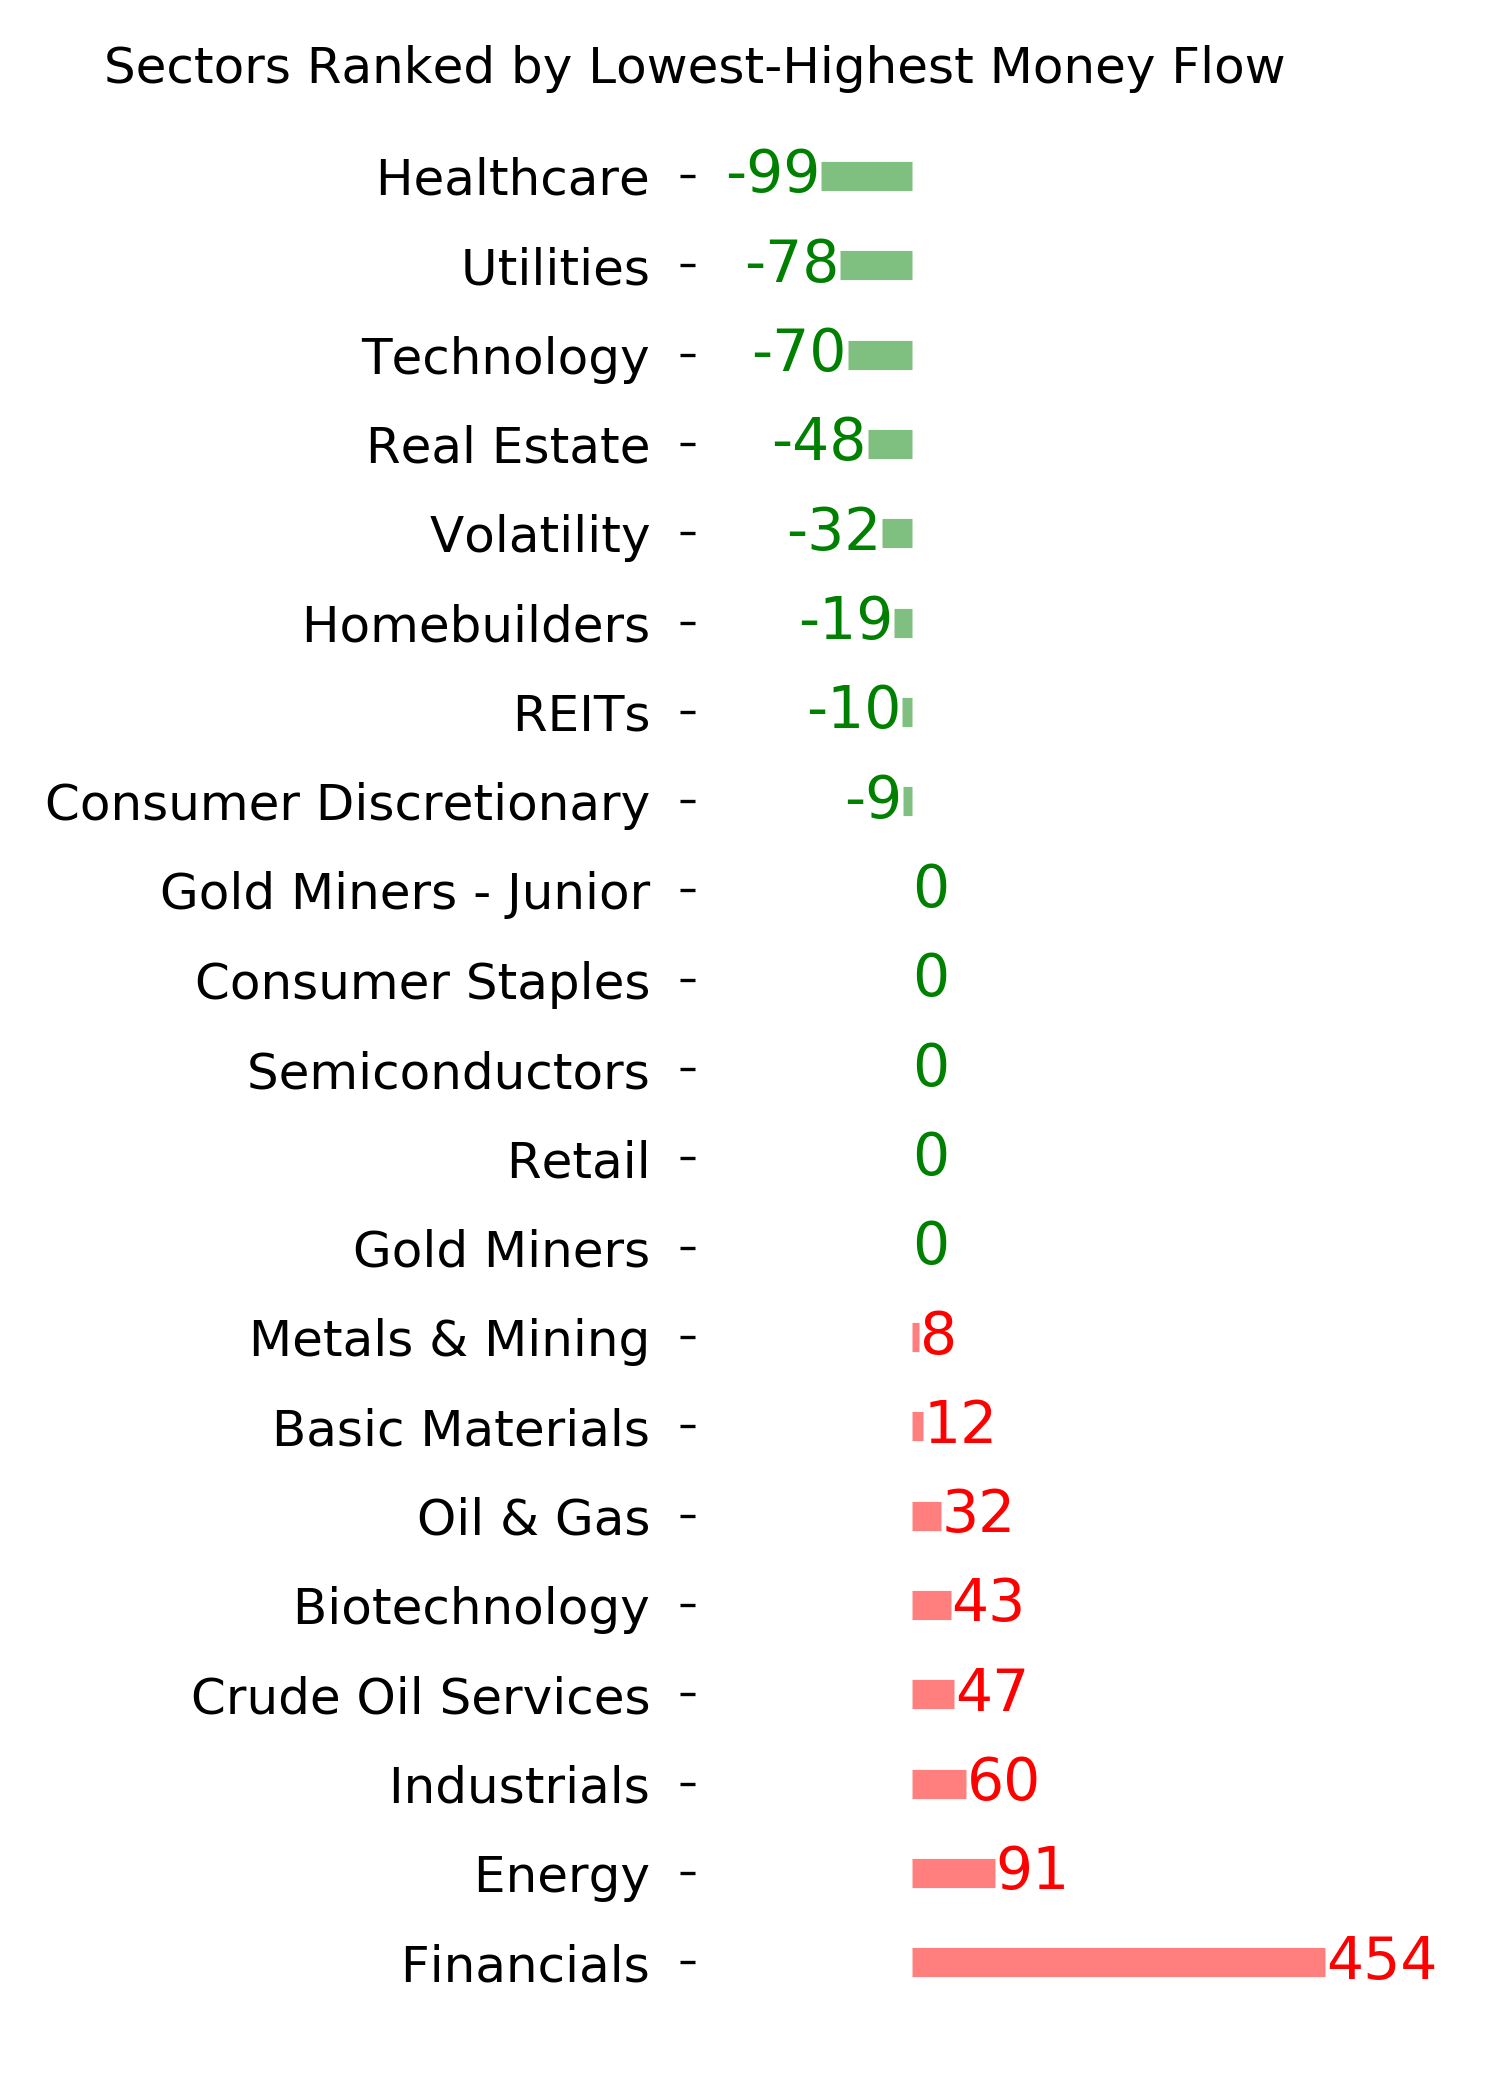
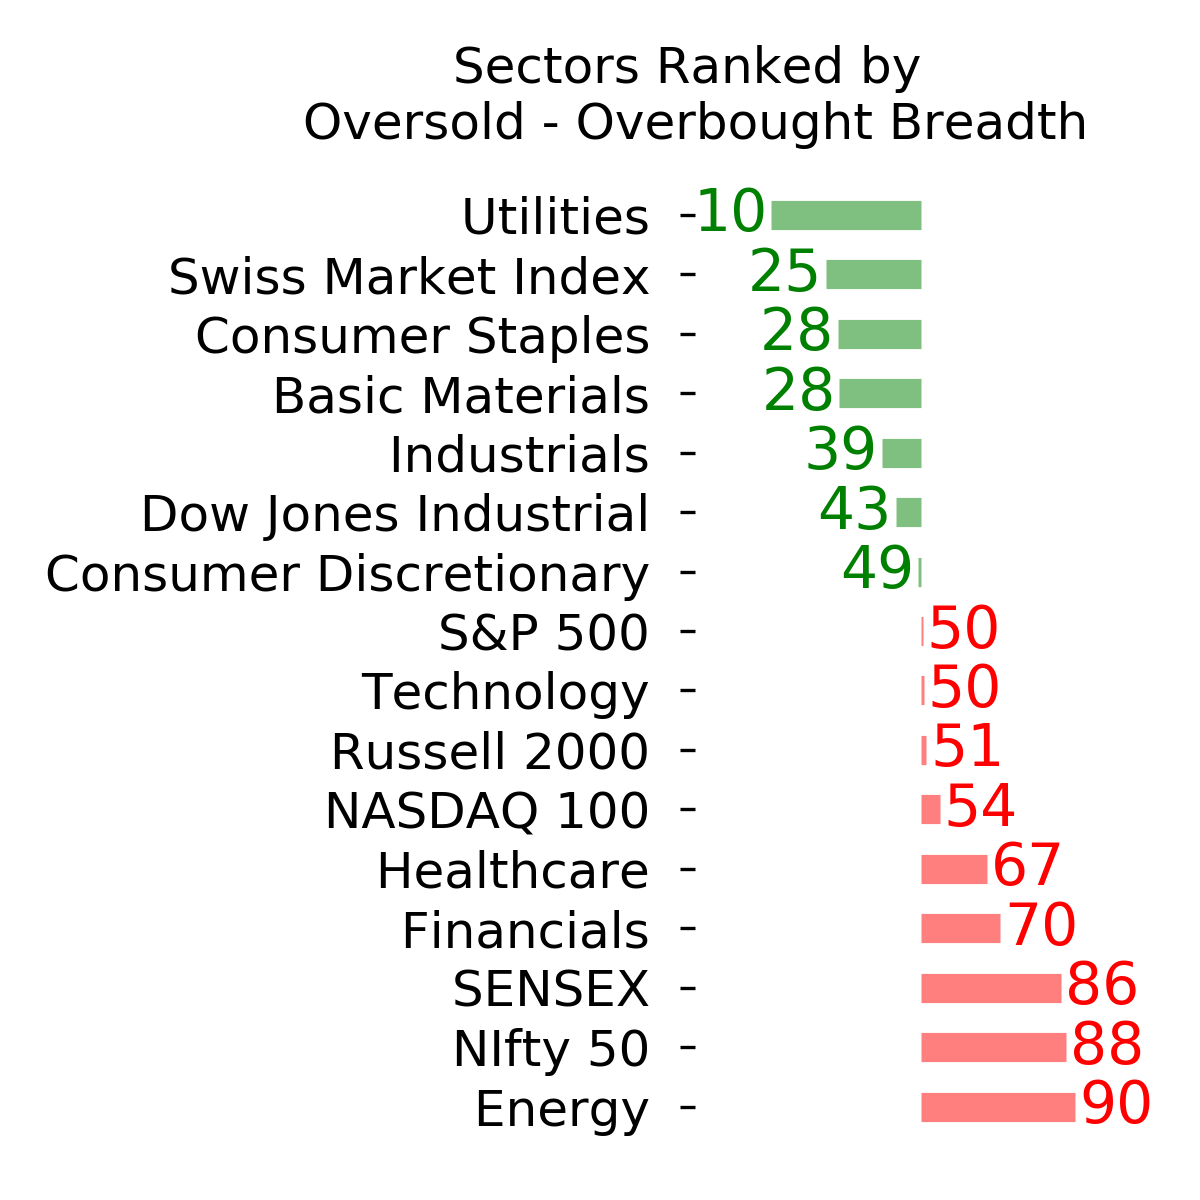
Ranks
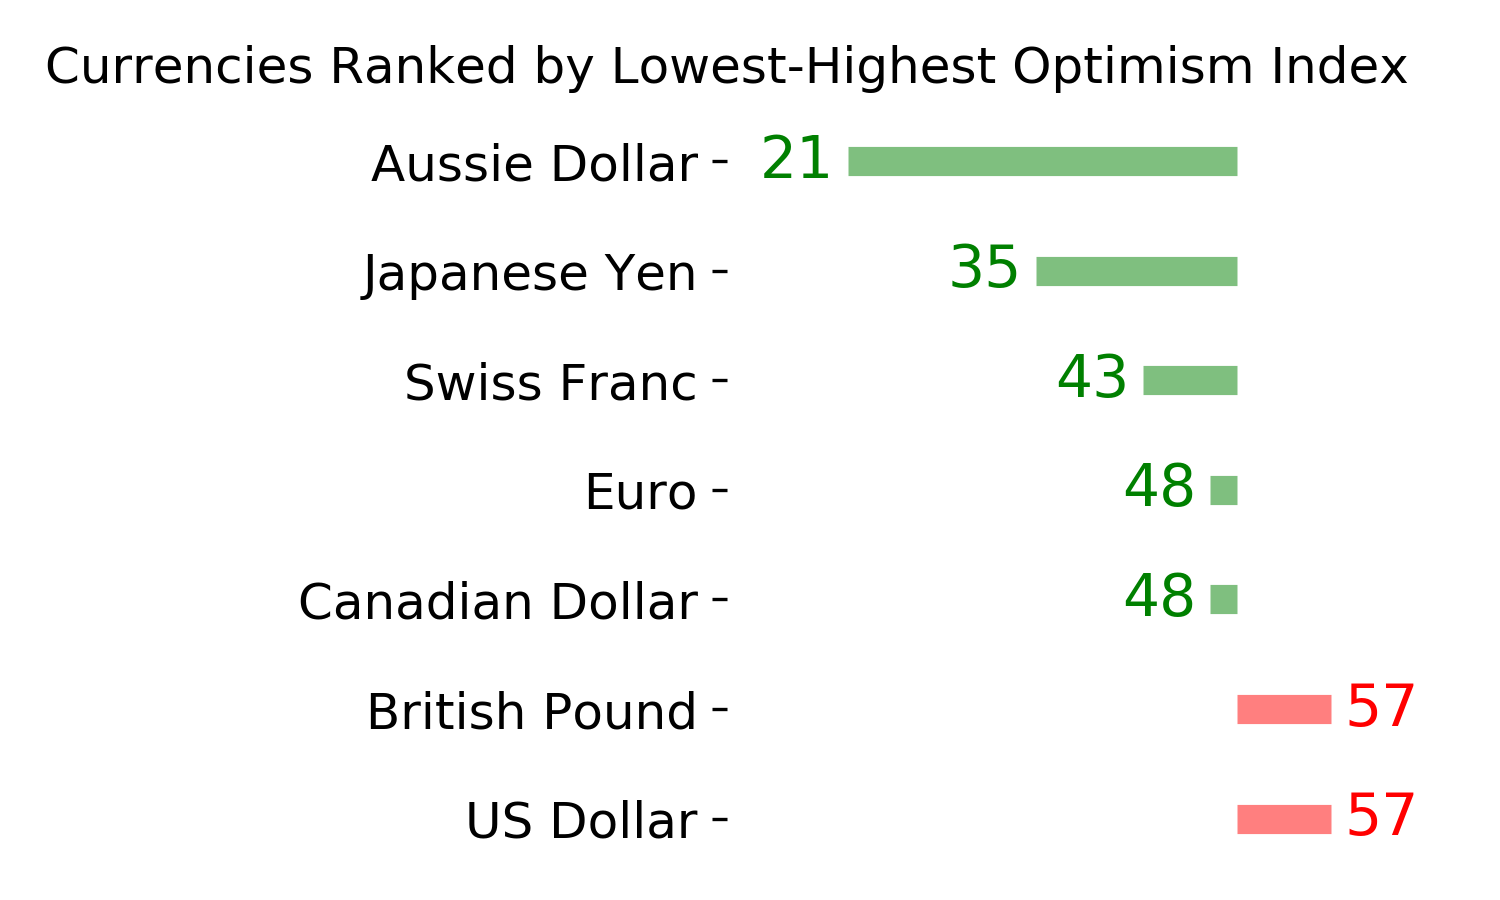
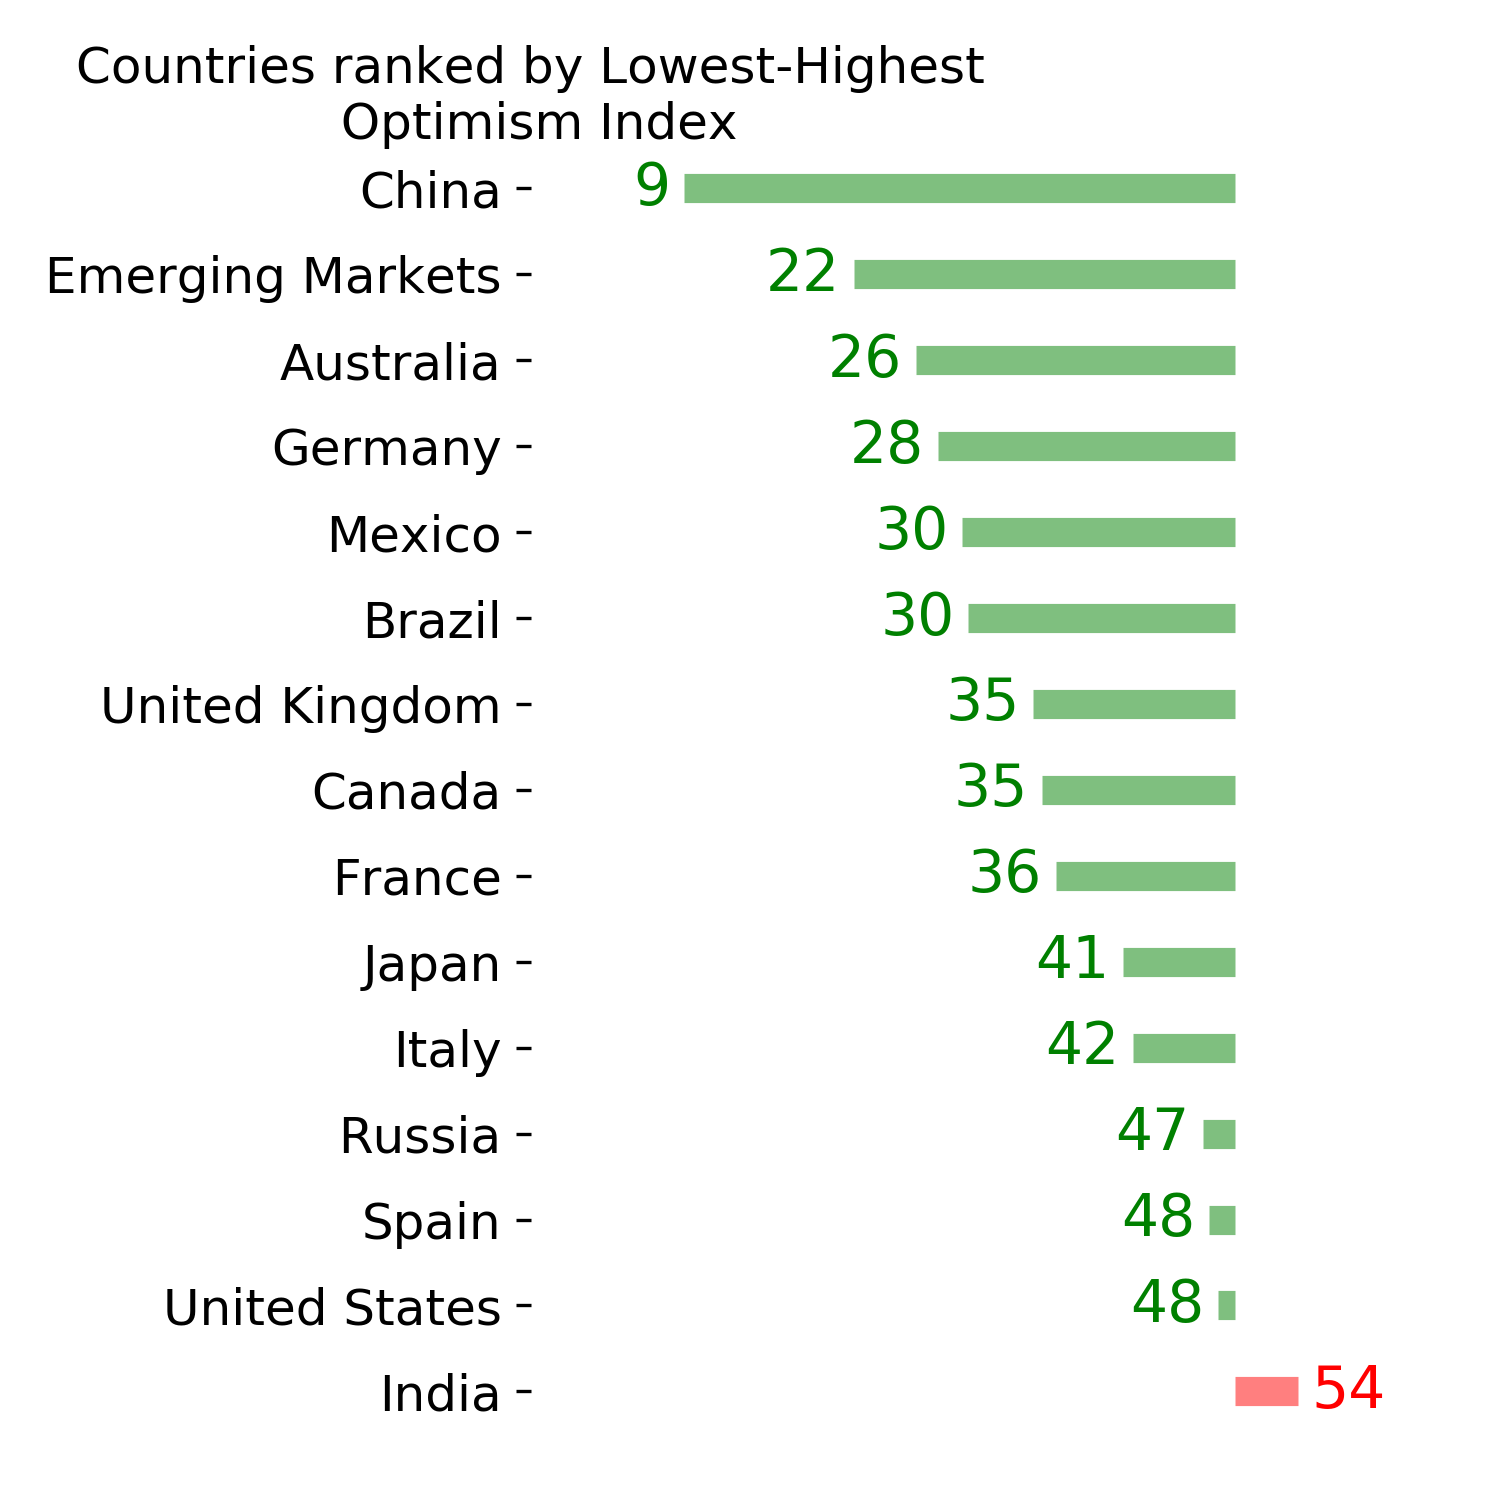
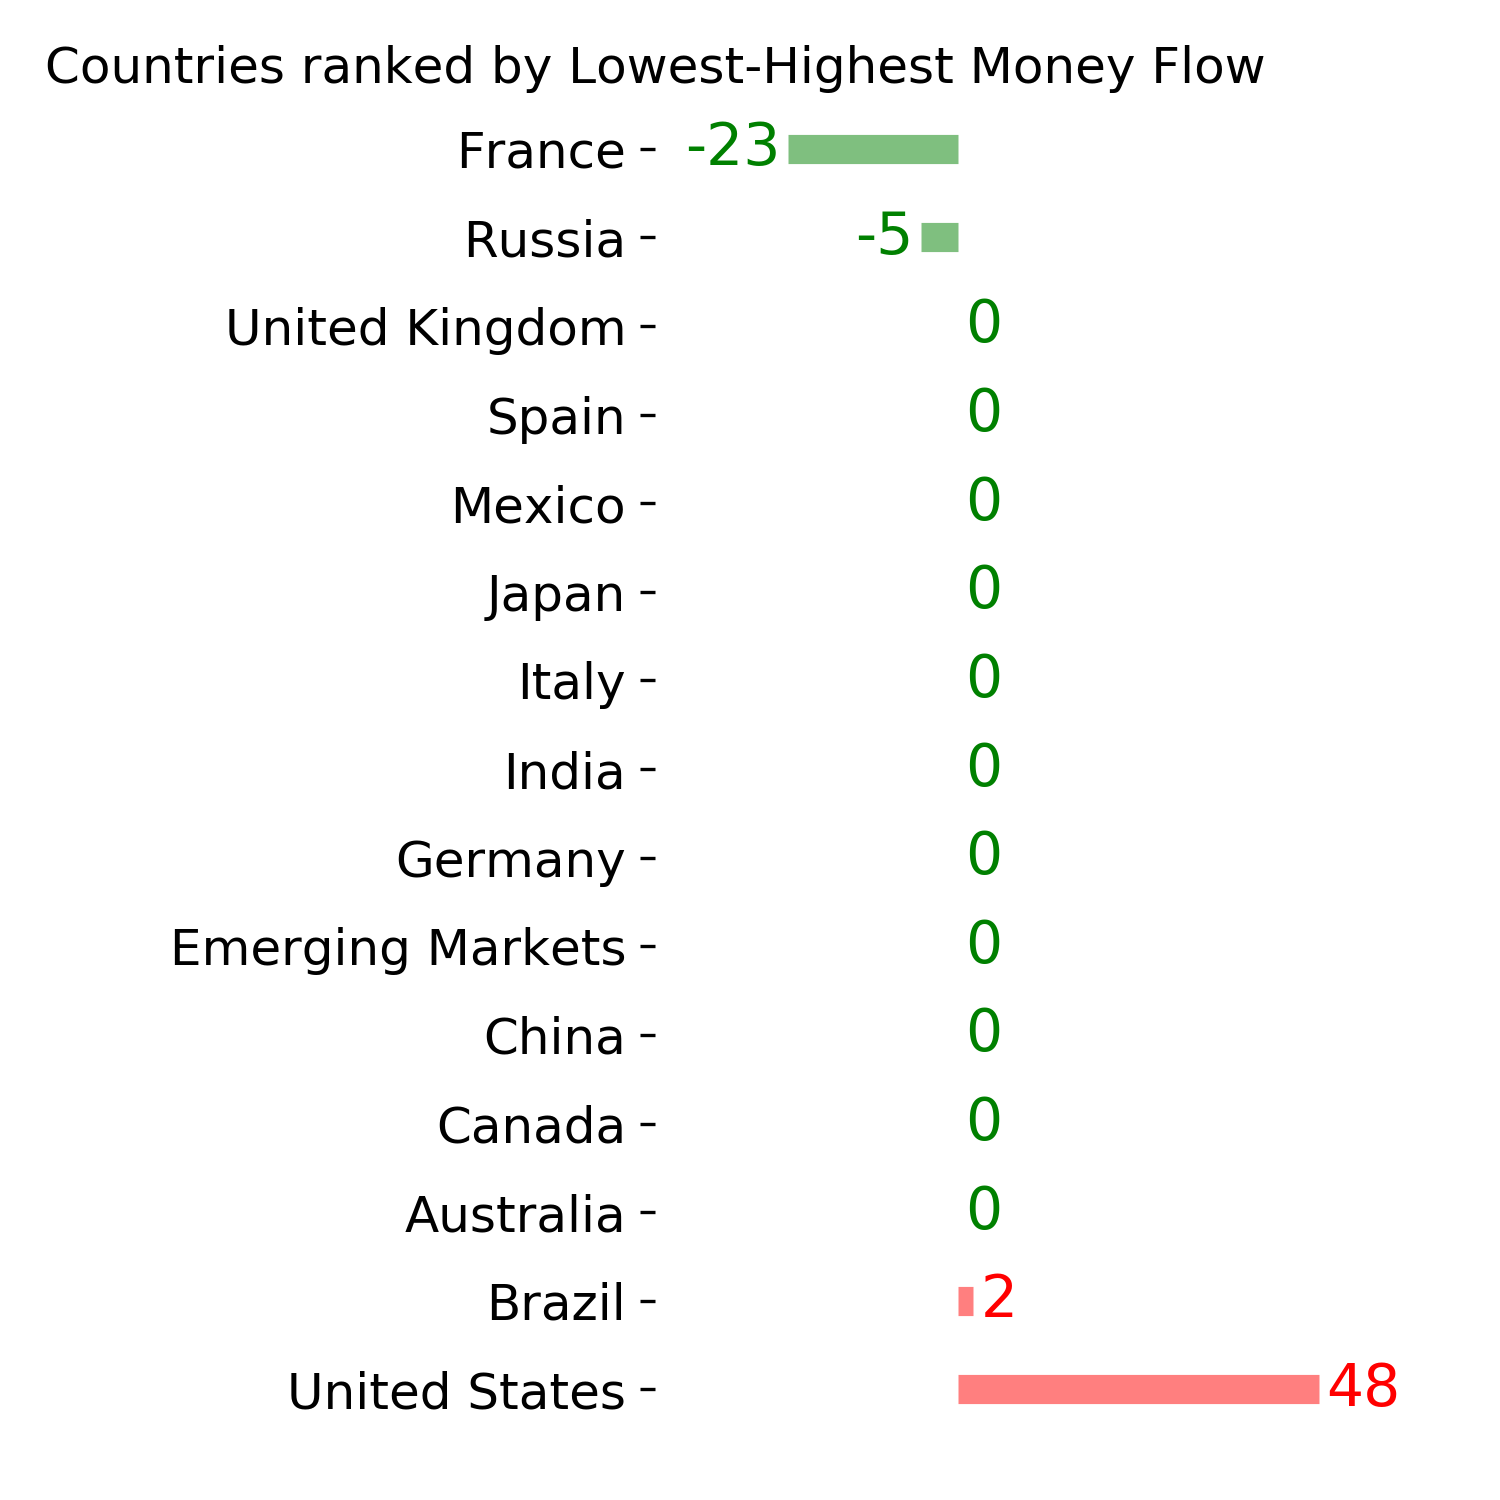
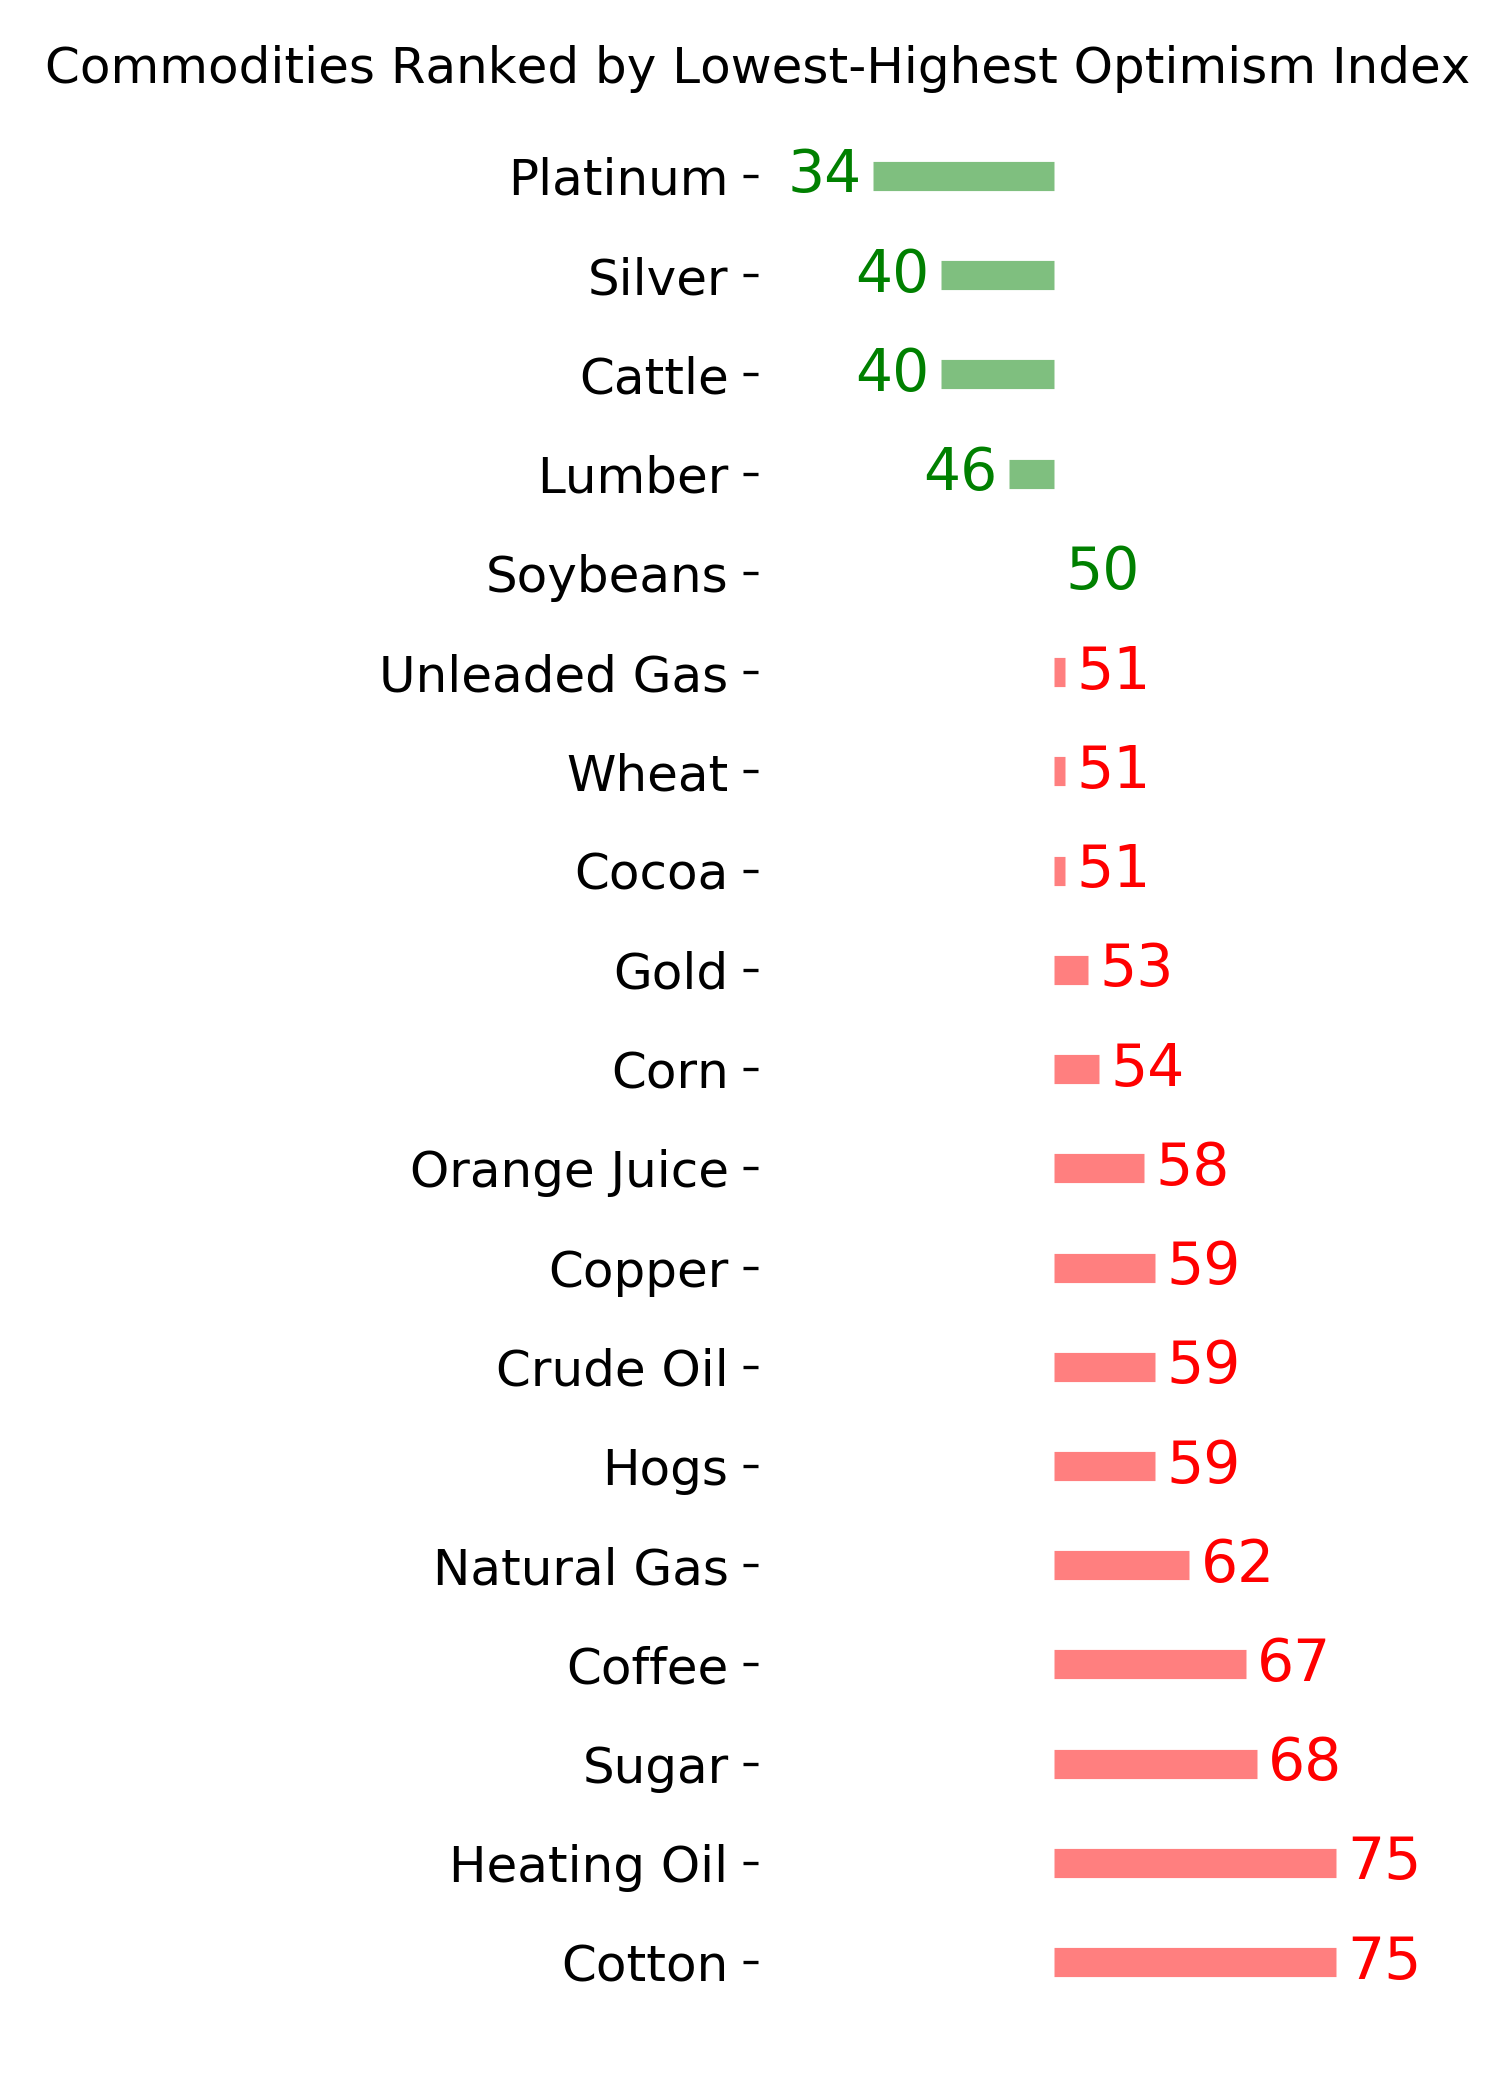
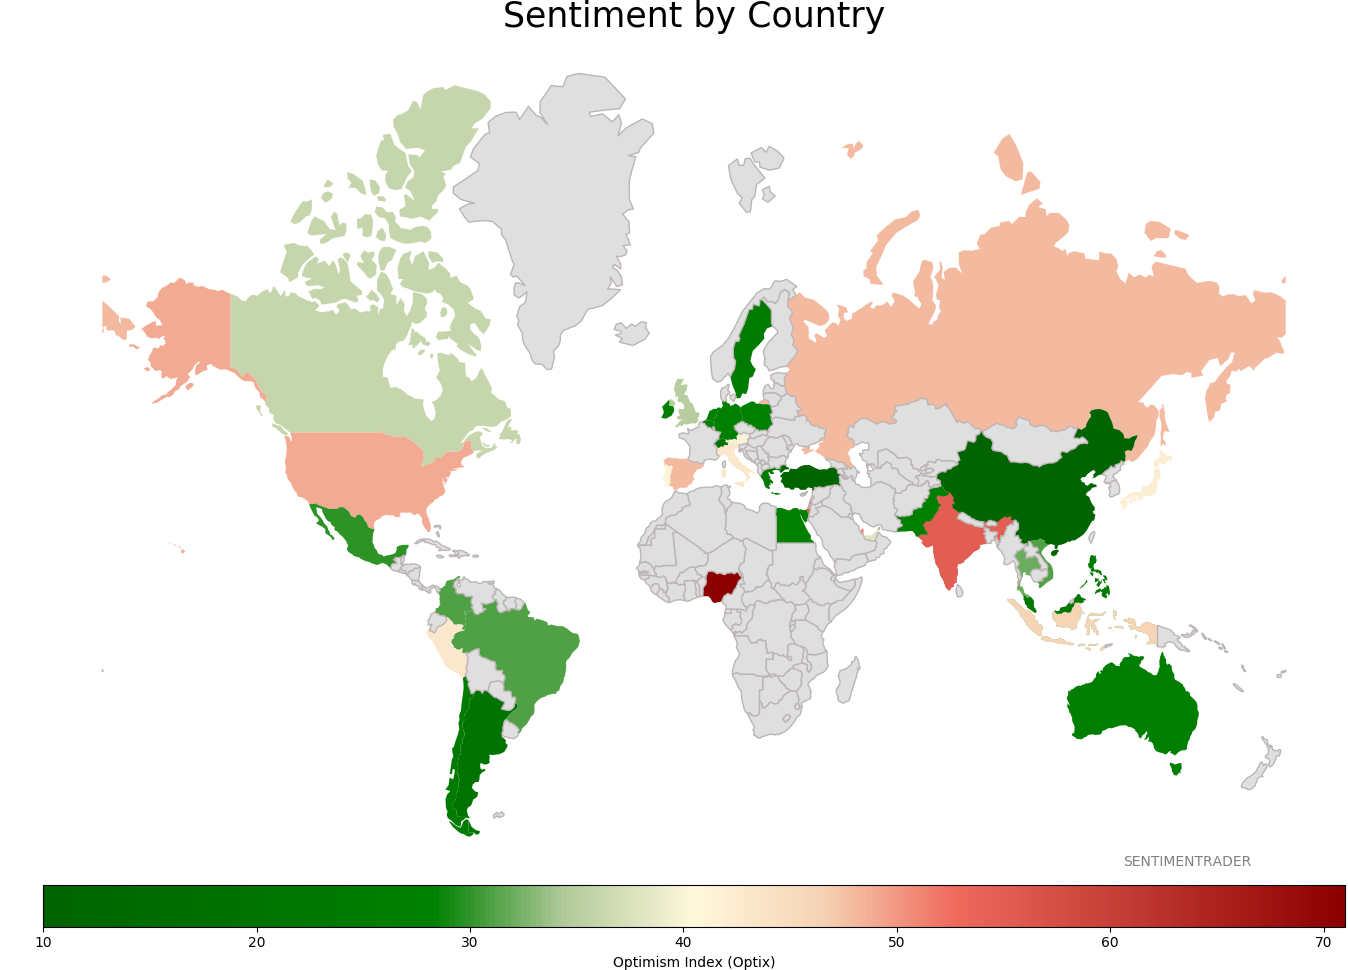
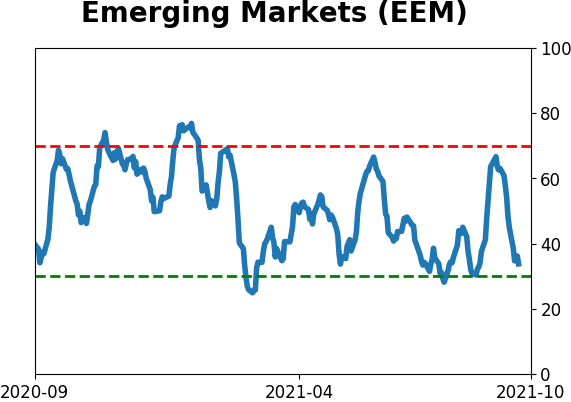
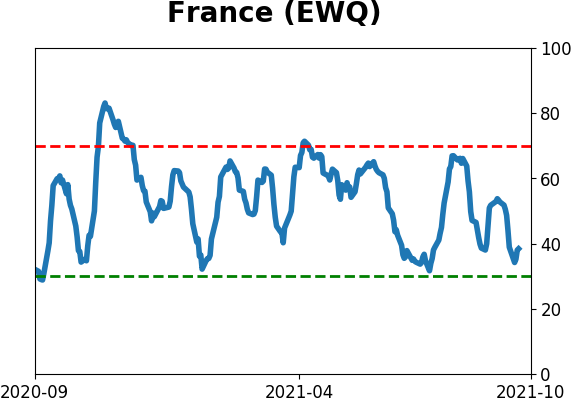
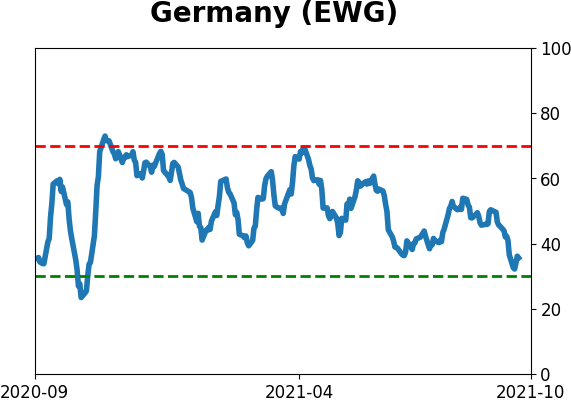
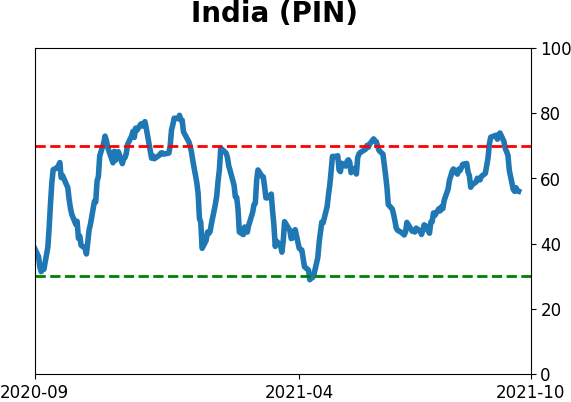
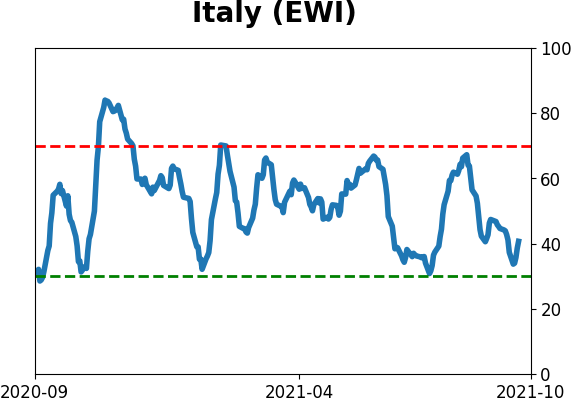
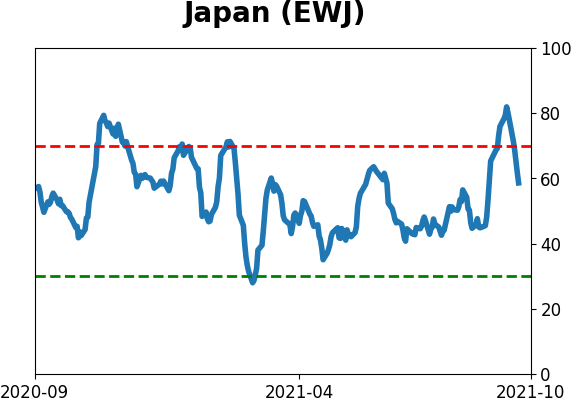
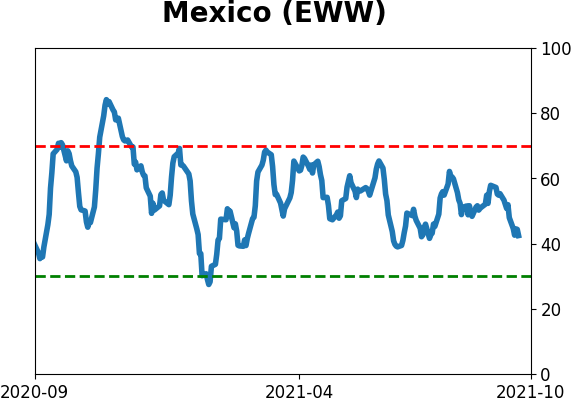
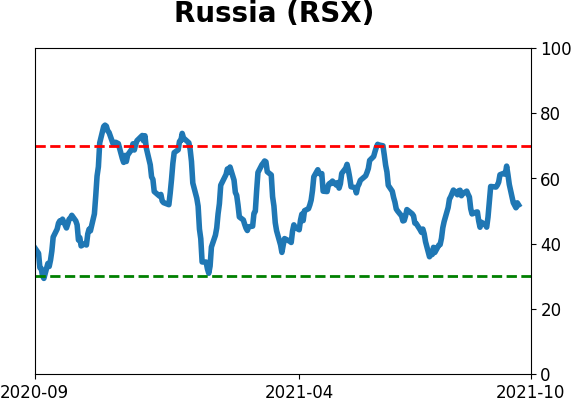
Sentiment Around The World
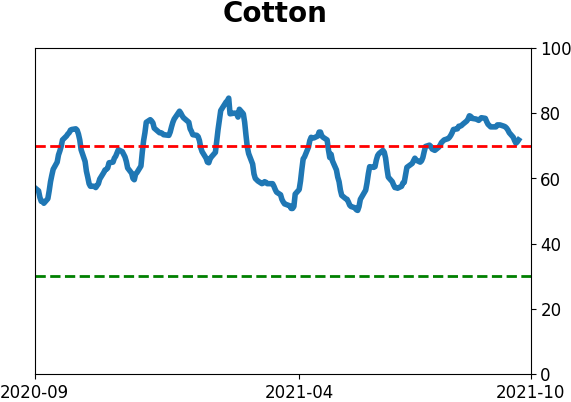
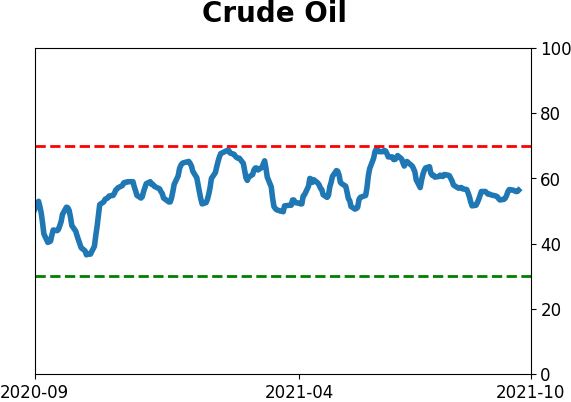
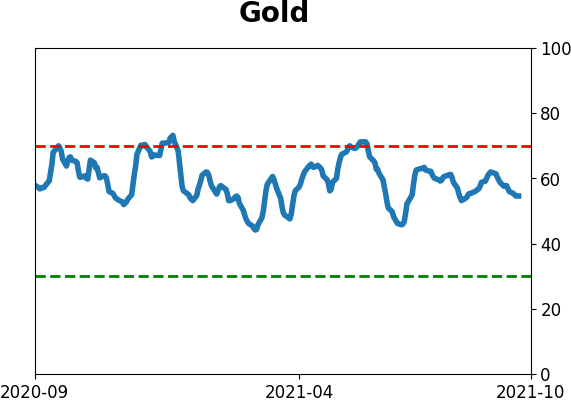
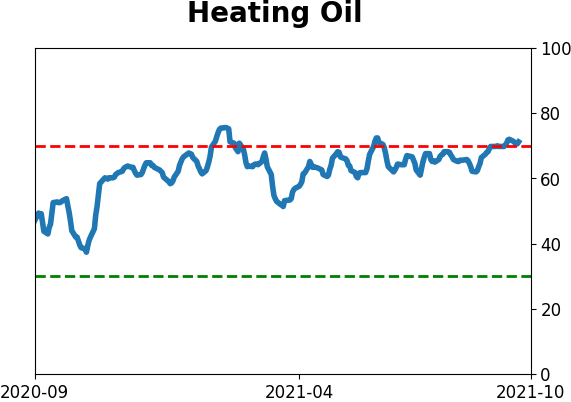
Optimism Index Thumbnails
|
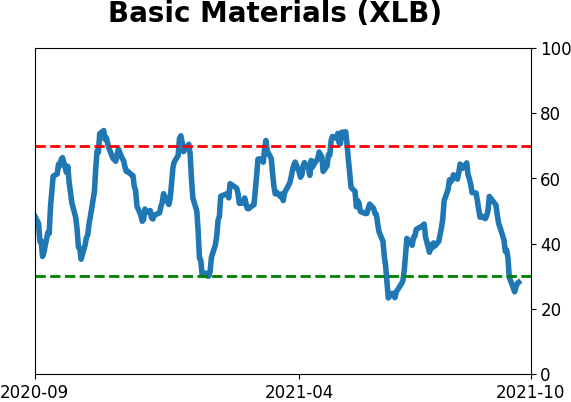
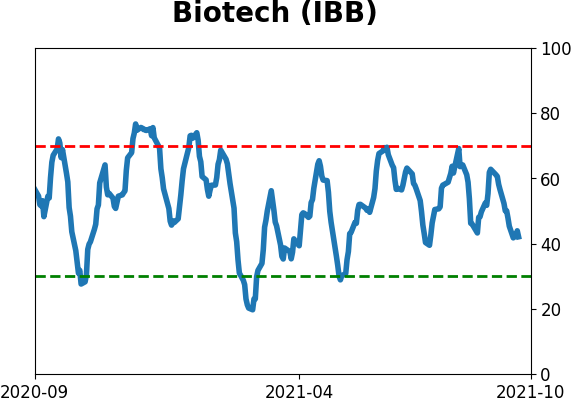
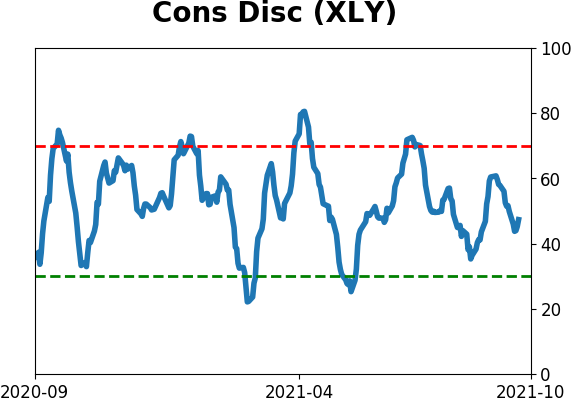
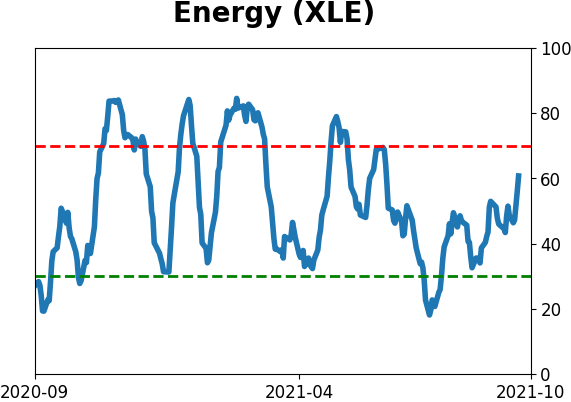
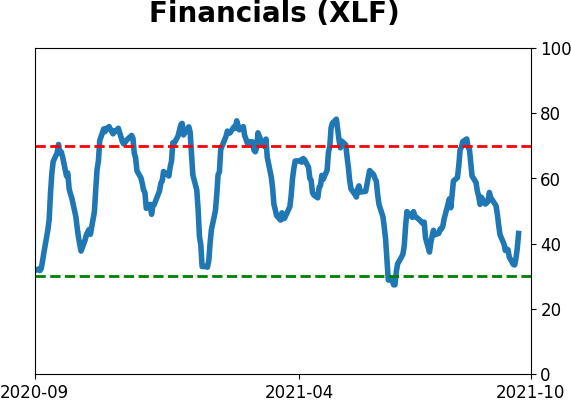
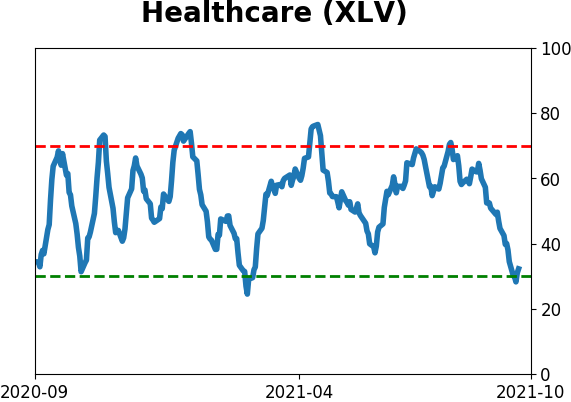
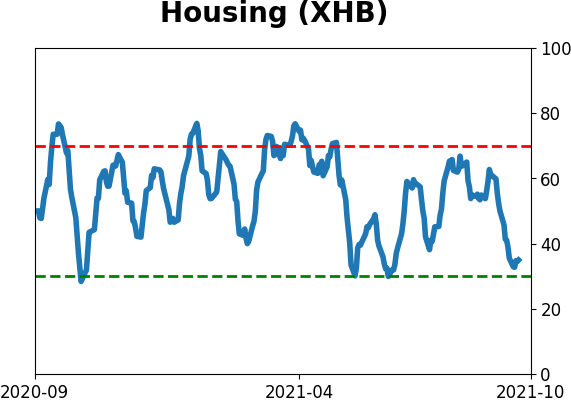
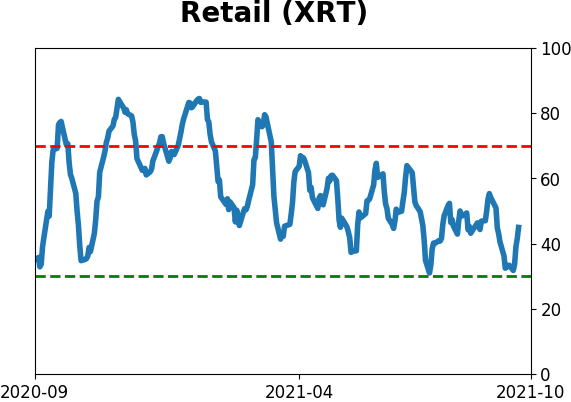
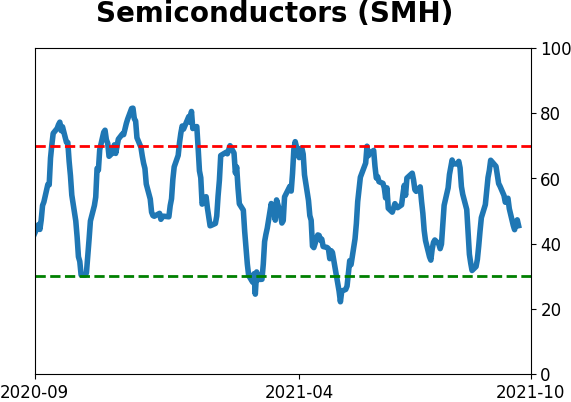
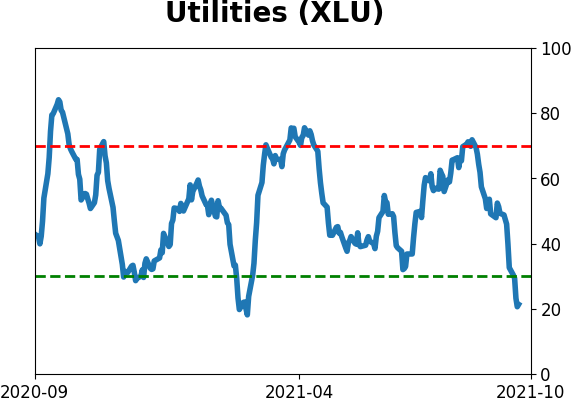
Sector ETF's - 10-Day Moving Average
|
|
|
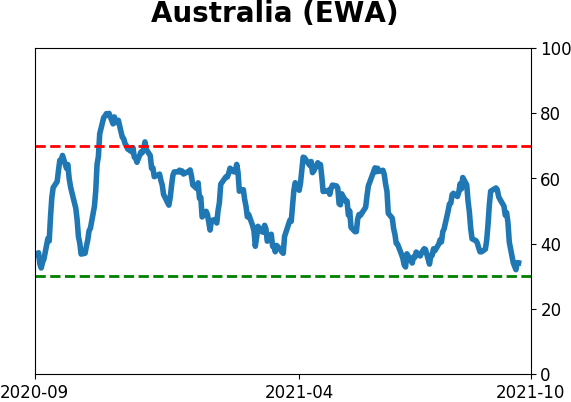
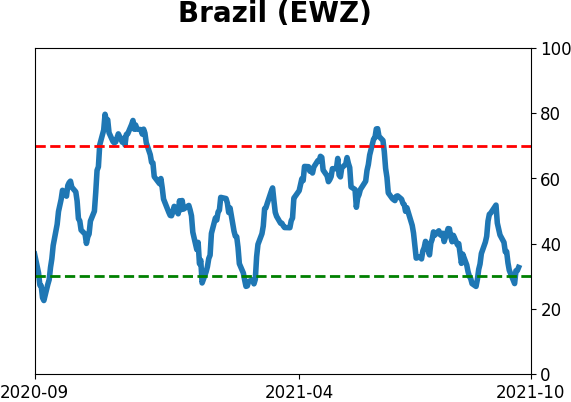
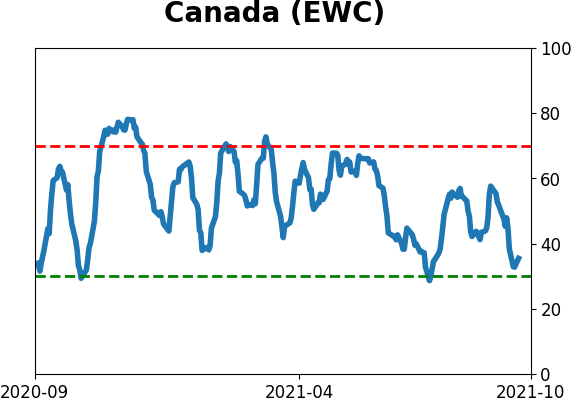
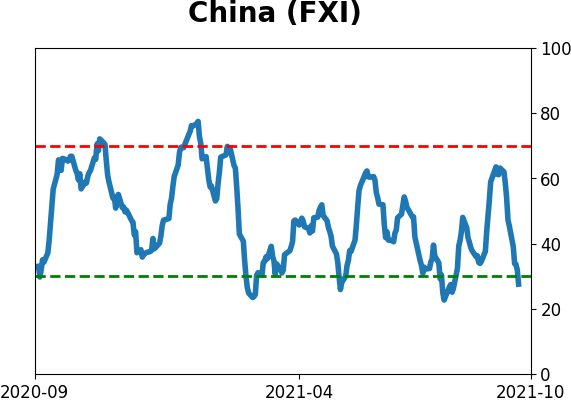
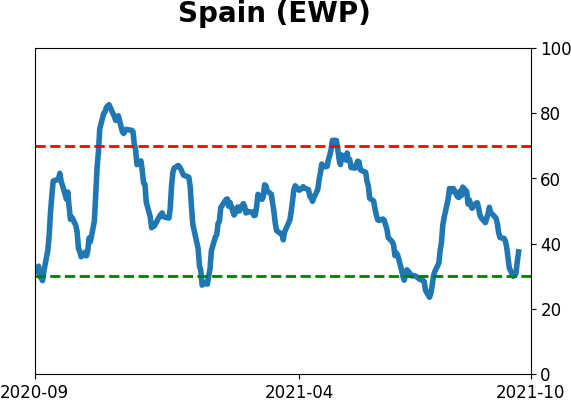
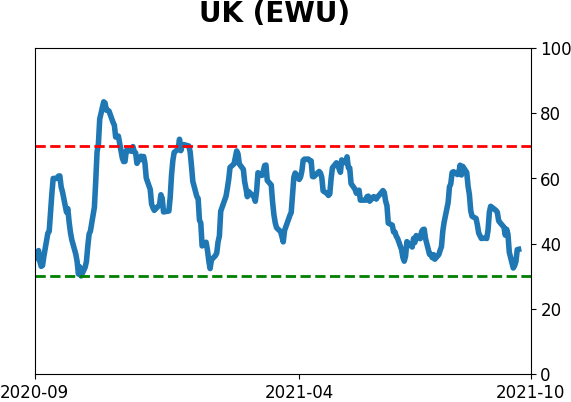
Country ETF's - 10-Day Moving Average
|
|
|
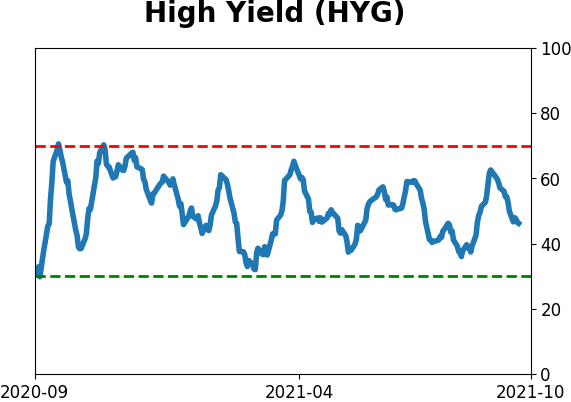
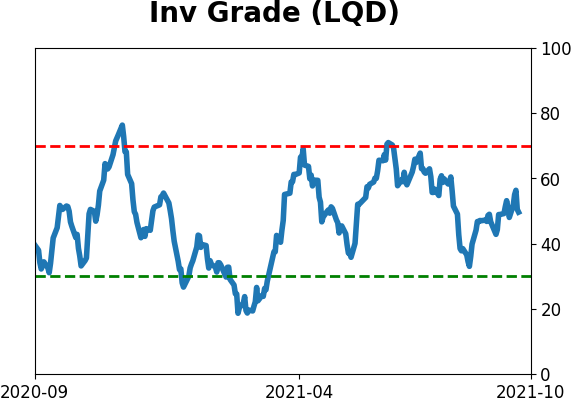
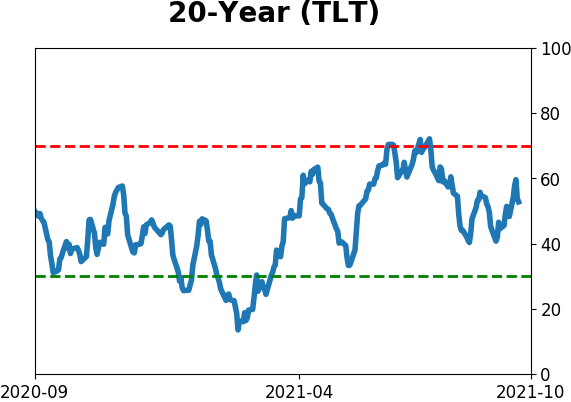
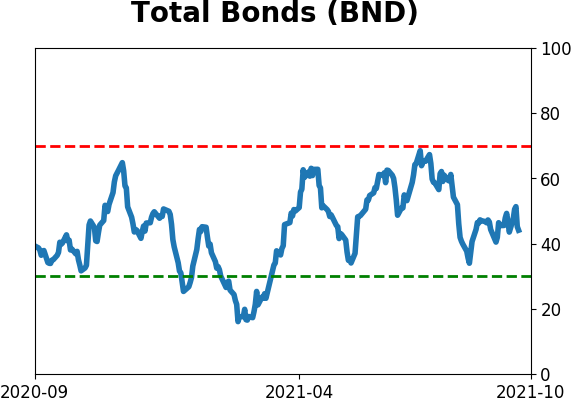
Bond ETF's - 10-Day Moving Average
|
|
|
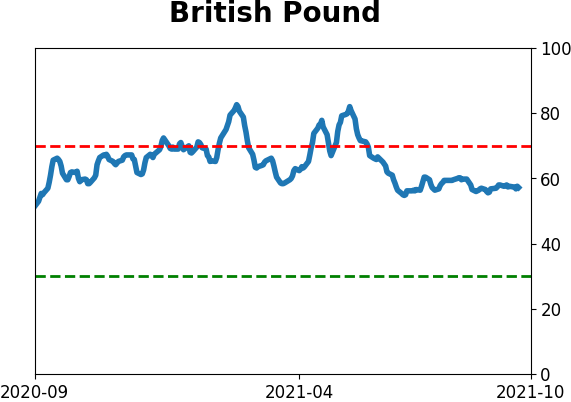
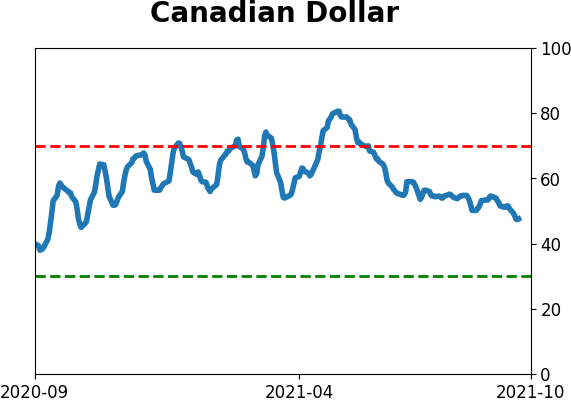
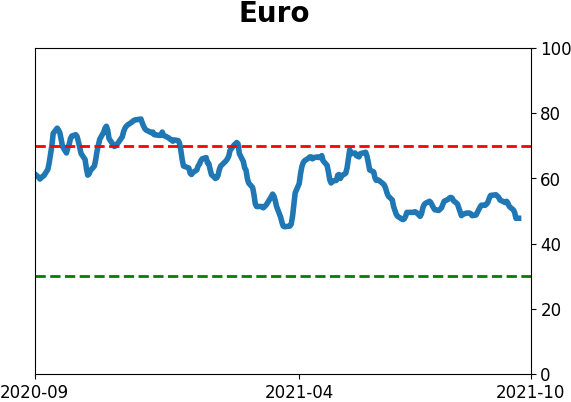
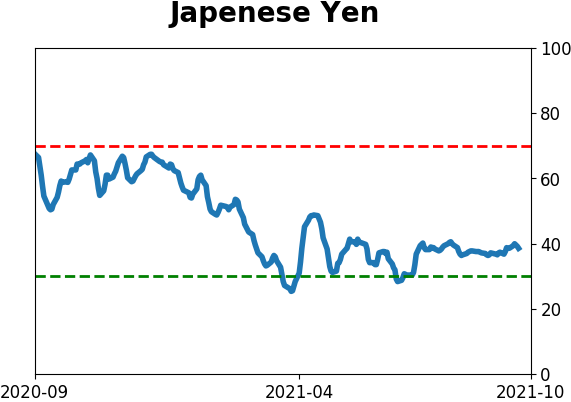
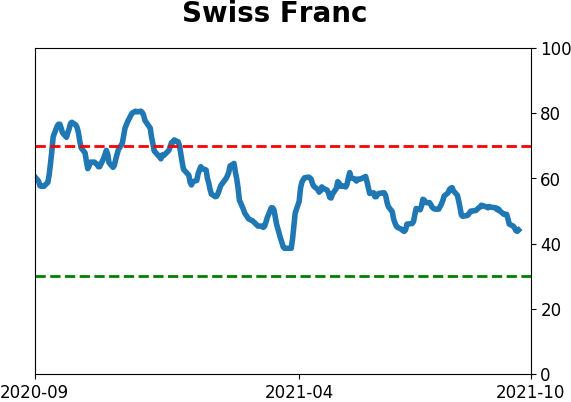
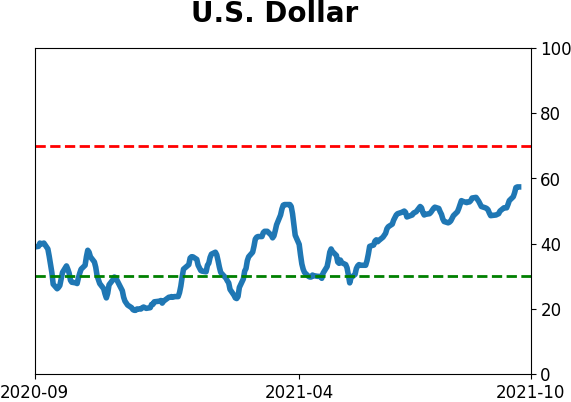
Currency ETF's - 5-Day Moving Average
|
|
|
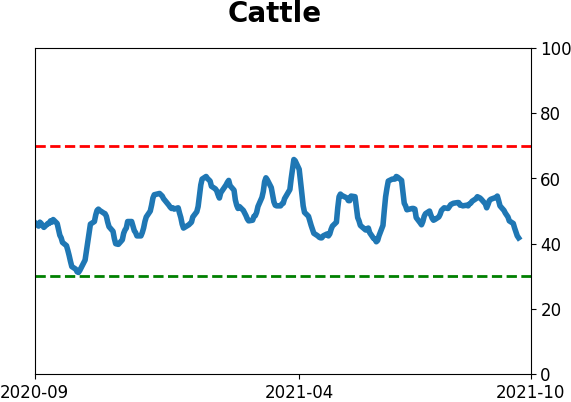
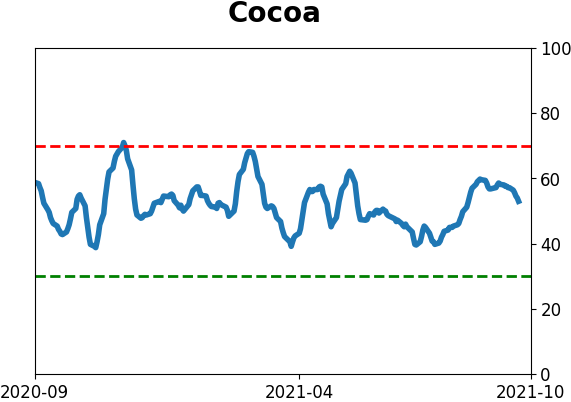
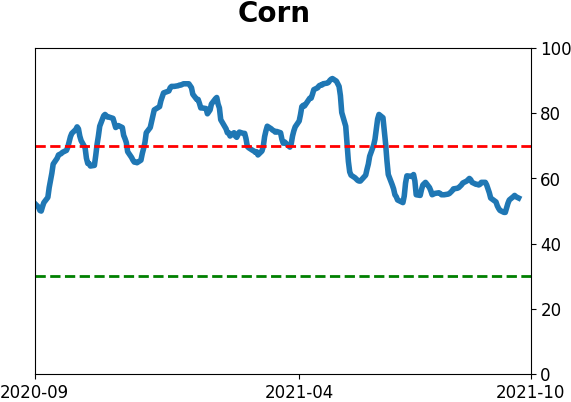
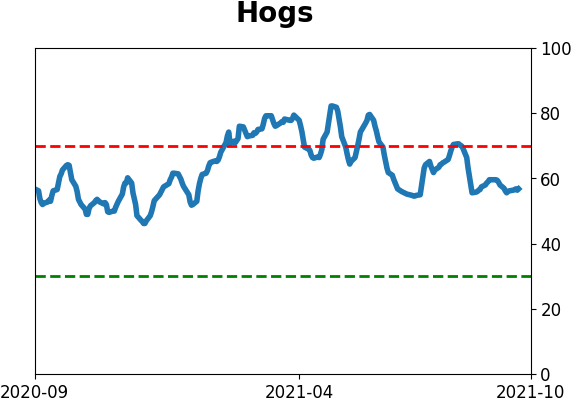
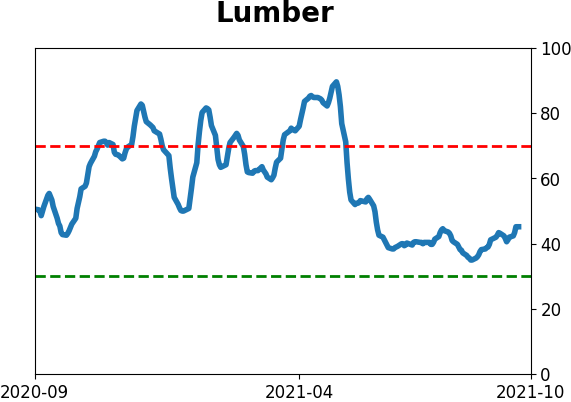
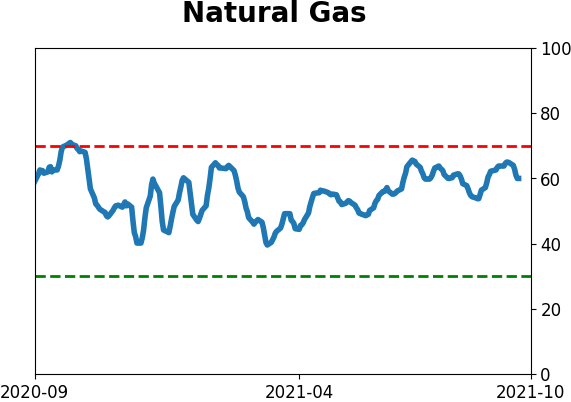
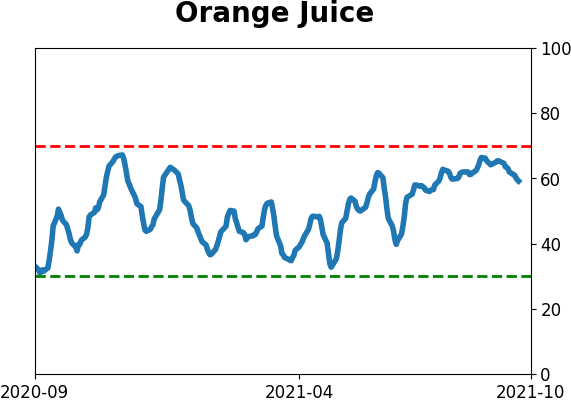
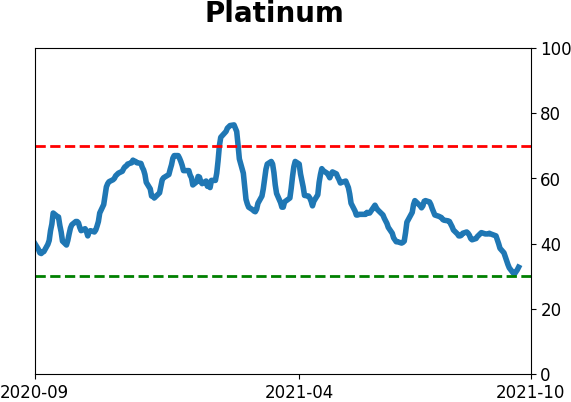
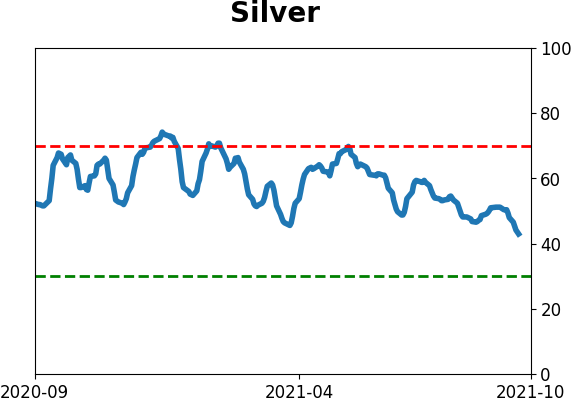
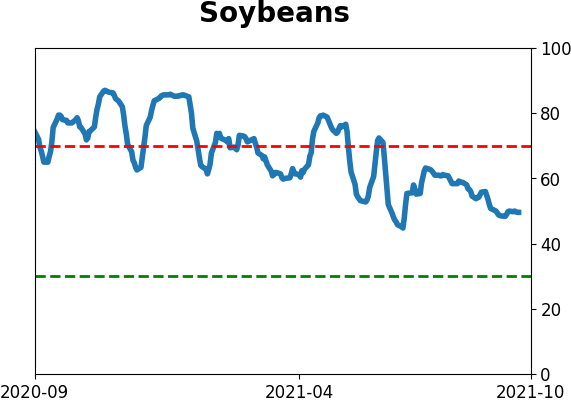
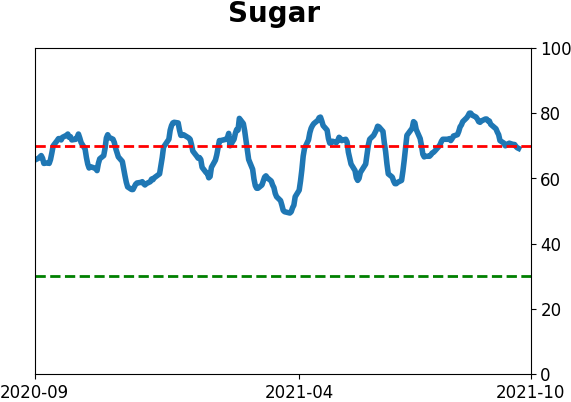
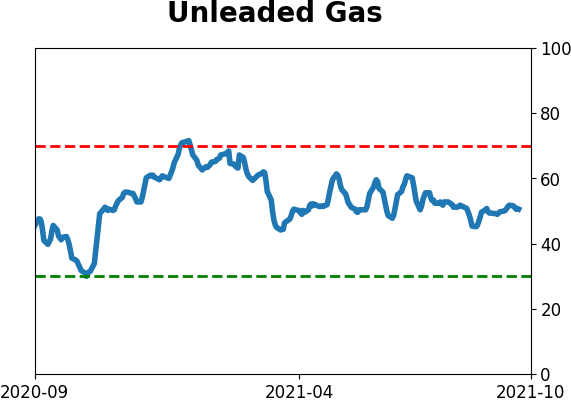
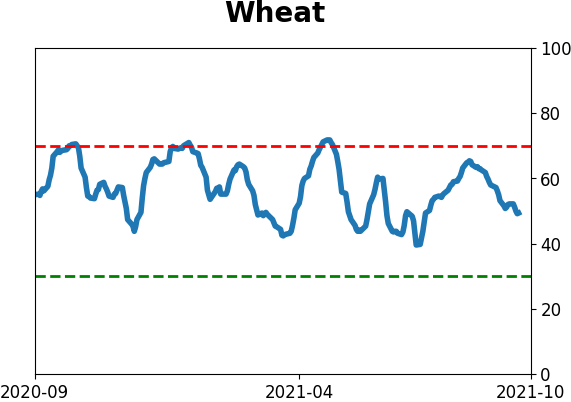
Commodity ETF's - 5-Day Moving Average
|
|