
The First Shocking Decline in Months

It's no secret that investors had become accustomed to a historic level of calm. We've been looking at this since the spring, it usually doesn't last, and yet it did for months.
Even with a late-day recovery on Monday, the loss in the most widely-benchmarked index in the world was a rude awakening to those who believe that stocks only travel in one direction. Monday's session was more than two standard deviations from the average daily change over the past year. The only other day with a -2 z-score over the past year was May 12, which marked the bottom for that pullback.
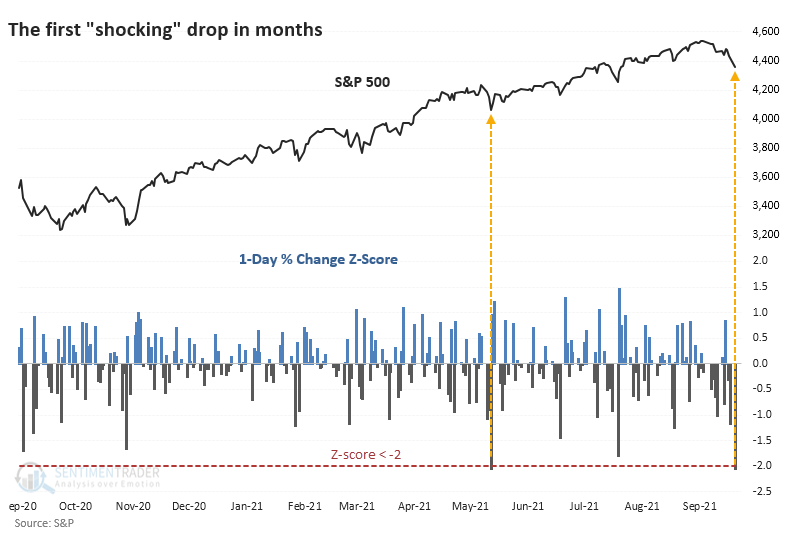
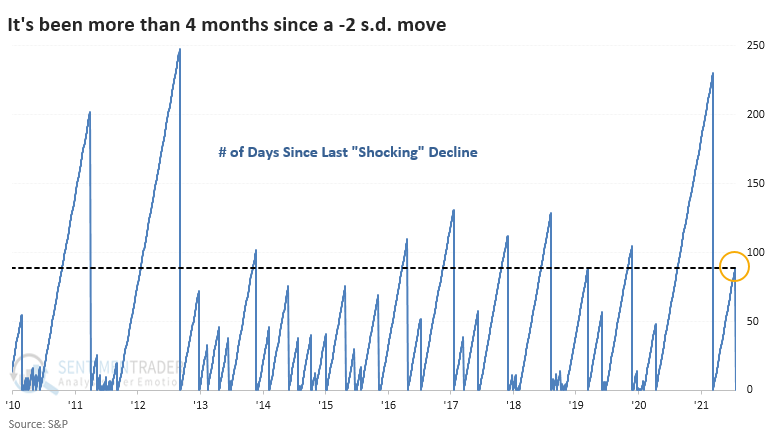
It had been nearly 90 days since that "shocking" decline in May, which is a relatively long time. Over the past decade, this ranked as the 10th-longest stretch between shocking drops.
USUALLY A QUICK BOTTOM
Most of us are concerned with the question of "so what?" To help give a clue, the table below shows every time since 1928 when the S&P 500 was within 5% and no more than three weeks removed from a multi-year high, then suffered its first -2 standard deviation move in at least four months. These show the times when reality paid investors an unwelcome visit.
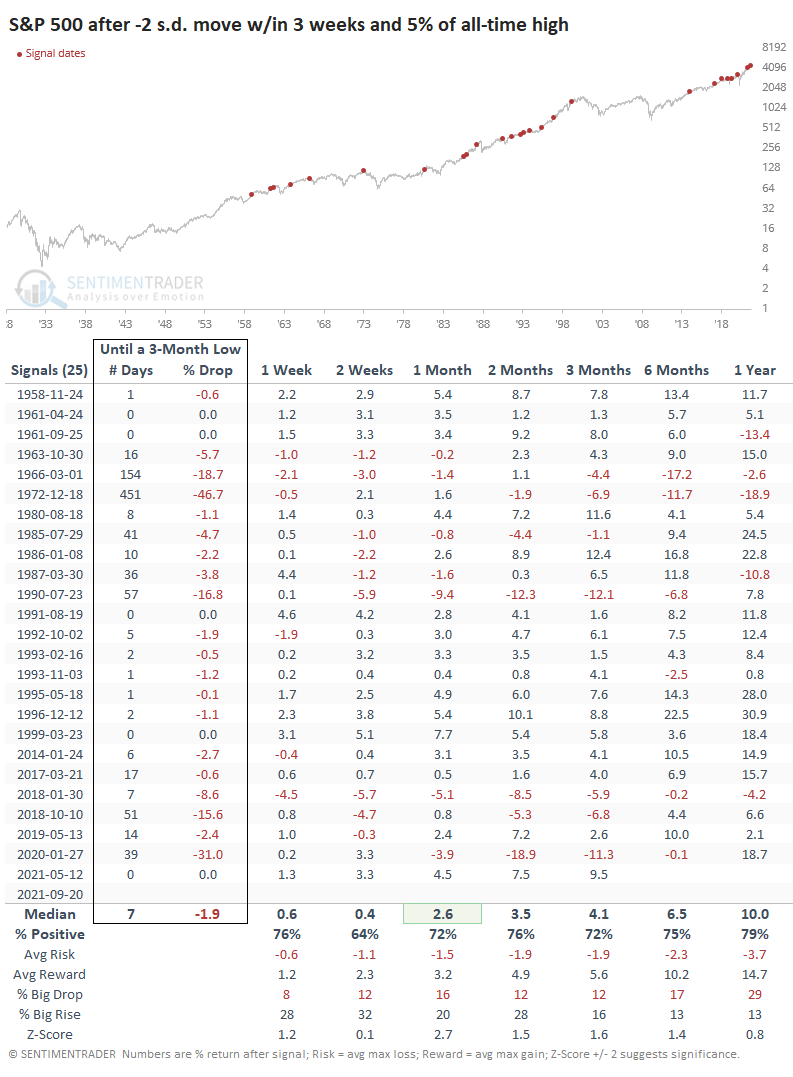
For the most part, these were buying opportunities. Investors love the idea of a bargain, and these declines often provided just that. Instead of paying up after persistent rallies, the quick drops presented them with substantially lower prices, and they usually took advantage.
The S&P's forward returns were above average on all time frames, with the most impressive performance over the next month.
MOSTLY A LOW-RISK SETUP
The risk/reward was positively skewed, with minimal risk even up to a year later. It took a median of 7 trading days until the S&P bottomed, meaning it closed at its lowest price for at least the next three months. It took an average of a further 1.9% drop to get there.
Out of the 25 signals, 5 bottomed that very day, 18 took less than a month to bottom, and 20 suffered less than a 10% decline.
The Risk/Reward Table below shows the maximum decline (risk) and maximum rally (reward) across every time frame. Out of 25 signals, 17 of them offered more reward than risk over the next three months. The dates when the S&P fell more than a further 10% at any point during the next three months have a red box around them - there were only three.
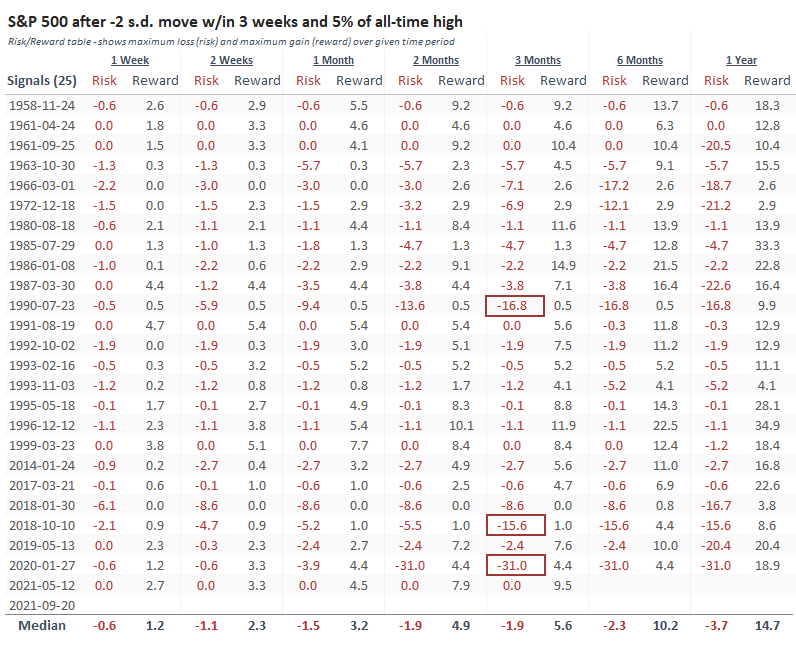
To be fair, only four of the signals preceded a gain of more than +10% during the next three months. A few of them saw further gains in the months after that, but most investors are more concerned with risk, especially over a multi-month time frame. In that sense, there was little risk of significant and sustained declines resulting immediately from these "shocking" declines.
There are now some ugly-looking charts out there, and trend-followers have their first real test of the year. We're not really seeing a bevy of oversold conditions or anything other than isolated signs of excessive pessimism. It was a quick, hard panic and that's about it. However, a quick, hard panic is about all it took for buyers to step in within similar market environments. Based on the precedents above, anything more than about a 2% decline from yesterday's close should have bulls getting anxious that this time is finally different.