Headlines
|
|
Another correction marks the 4th in only 3 years:
The S&P 500 is on the cusp of falling into a correction, or around a 10% decline from its recent peak. When this happens quickly after a new high, forward returns were sketchy over the medium-term. This is the 4th such pullback in 3 years, tied with only 2 other periods since 1928.
Once again, options traders show no fear as losses mount:
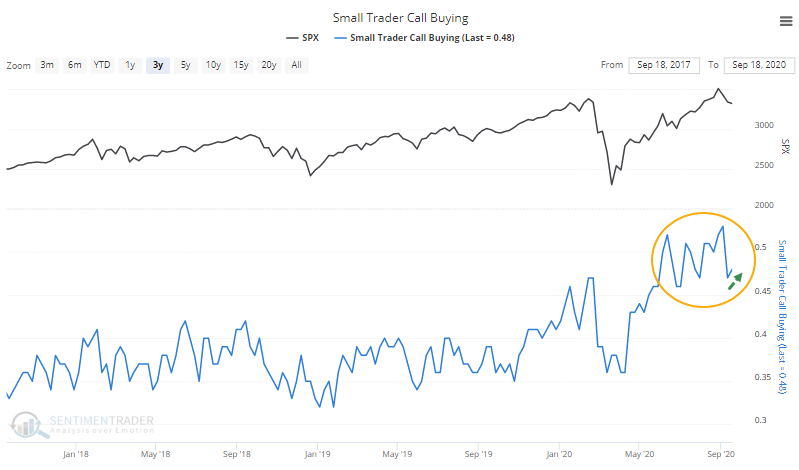
Last week, the smallest of options traders increased their bets on a market rally, undeterred by what was likely some catastrophic losses lately. Speculative activity remains above any prior peak. Estimates of gamma exposure have plunged, a potential positive, but it's not as reliable as options activity.
Tech reversal: The Nasdaq 100 fell more than 2% to a 1-month low on Monday before reversing to close at least 0.25% higher on the day, all while holding above its 200-day moving average. It's done this 7 other times in the past 30 years, leading to further upside over the next week after 6 of the 7 signals. The sole loss was -0.8%. Looking at lesser reversals expanded the sample size and led to similar results. A point in bulls' favor.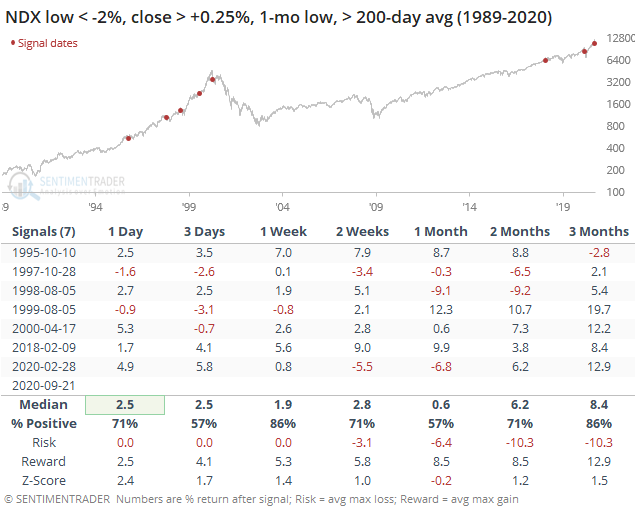
Bottom Line:
|
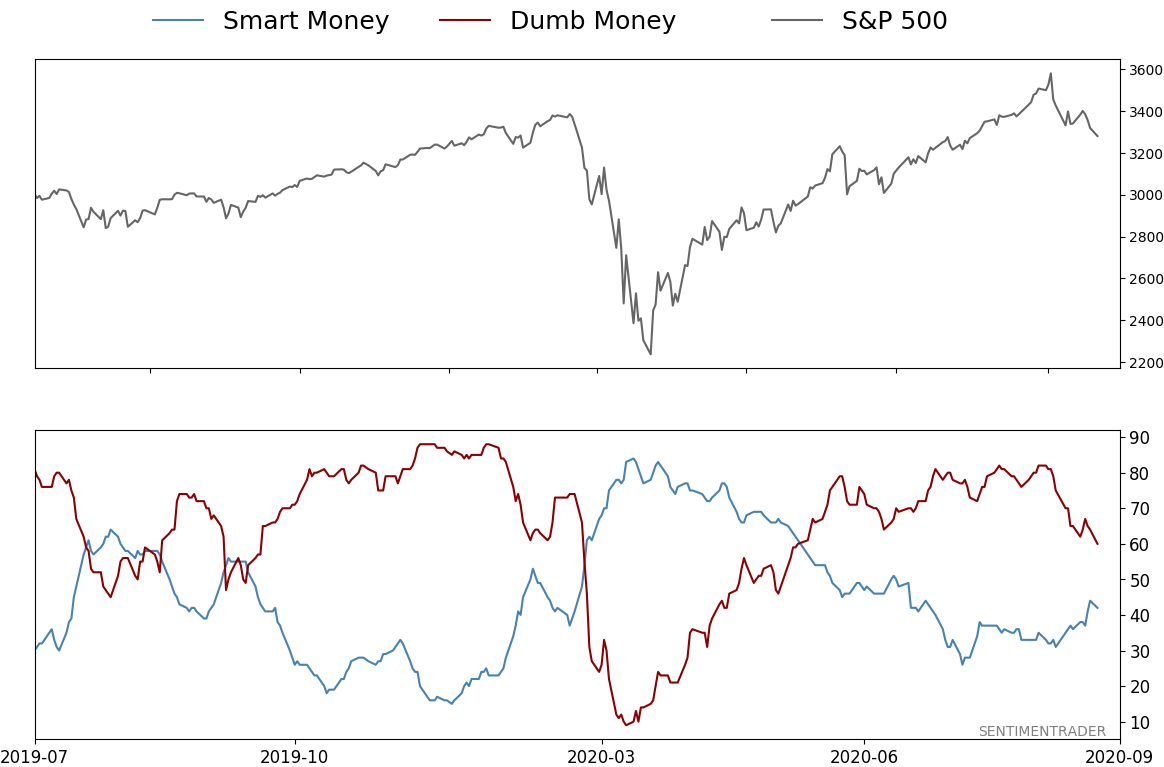
Smart / Dumb Money Confidence
|
Smart Money Confidence: 42%
Dumb Money Confidence: 60%
|
|
Risk Levels
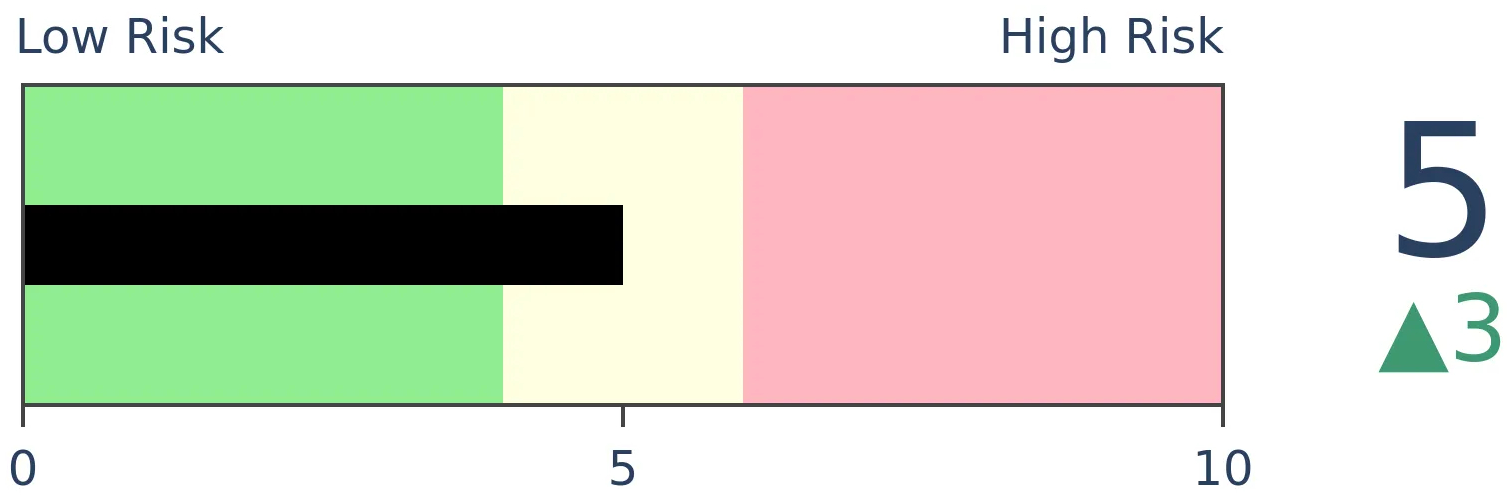
Stocks Short-Term

|
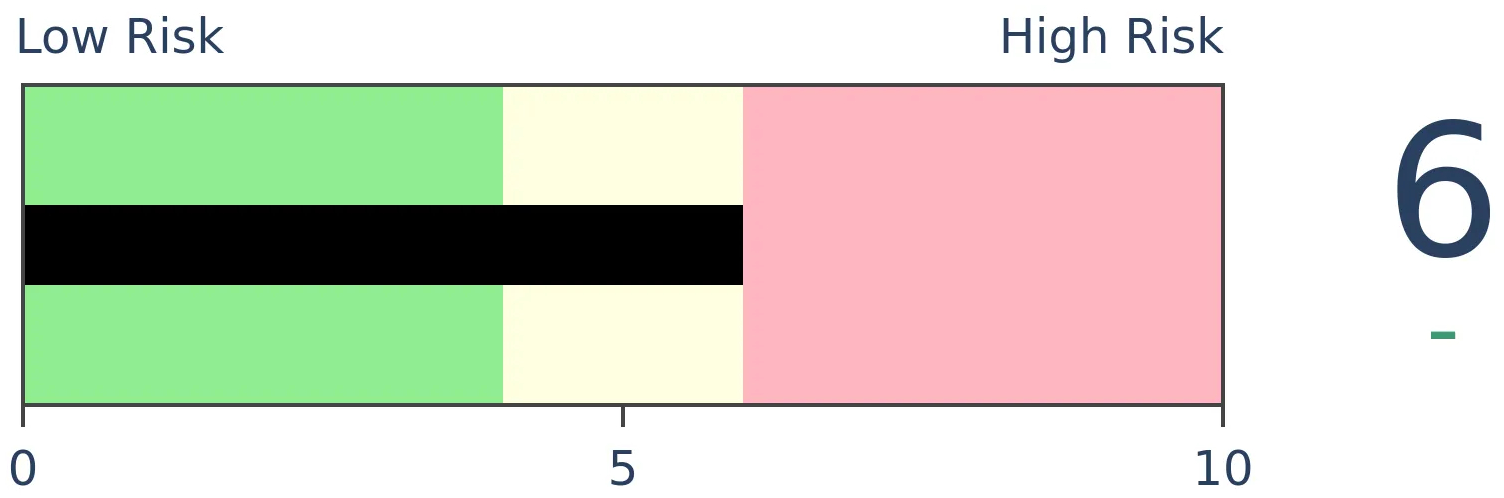
Stocks Medium-Term
|
|
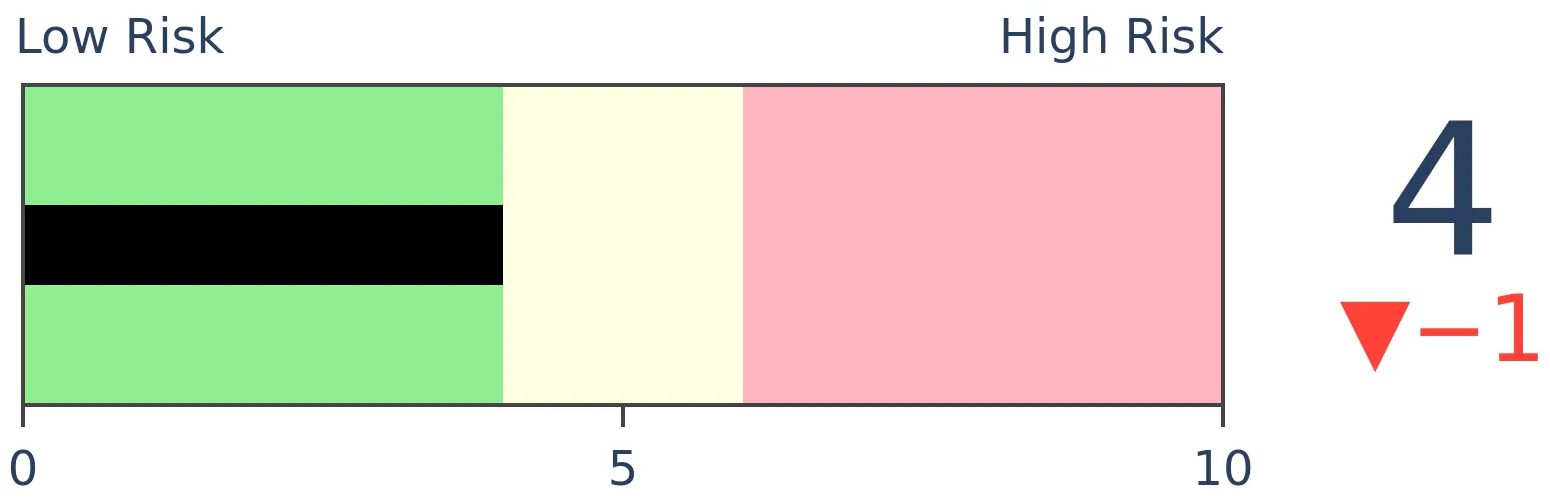
Bonds
|
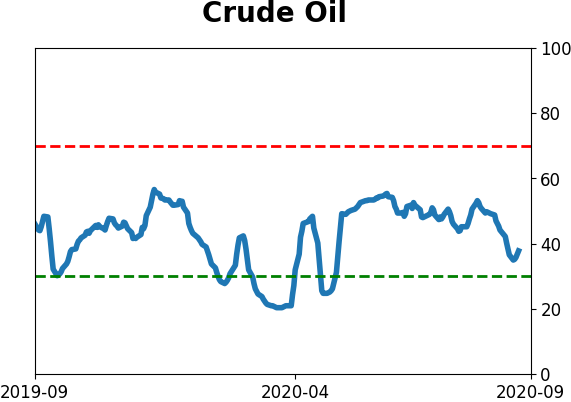
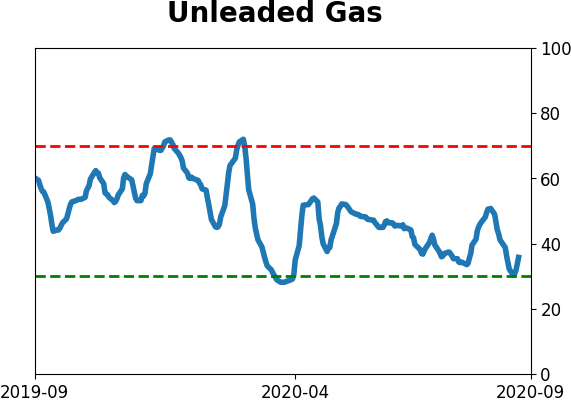
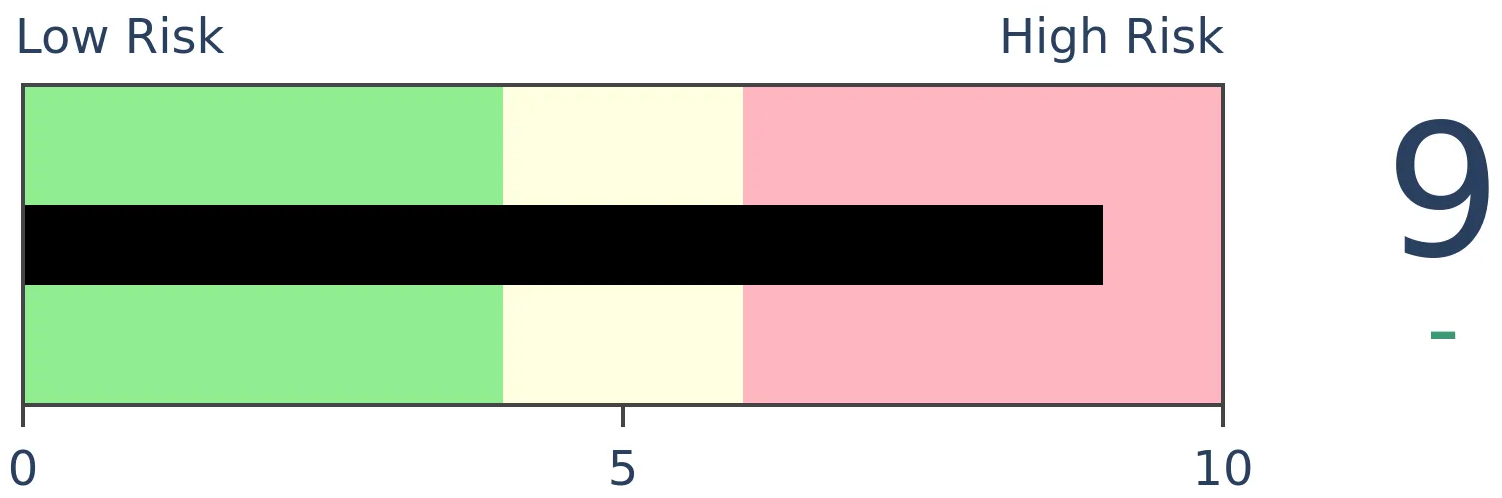
Crude Oil
|
|
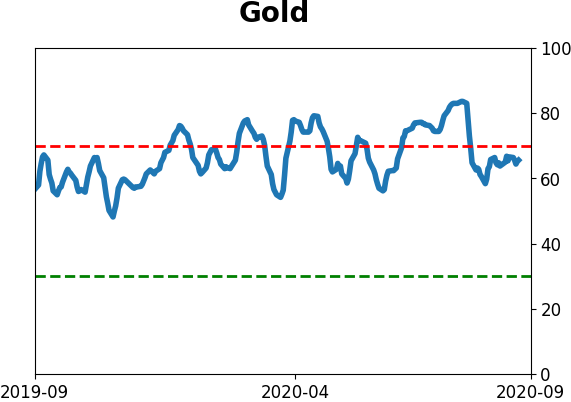
Gold
|
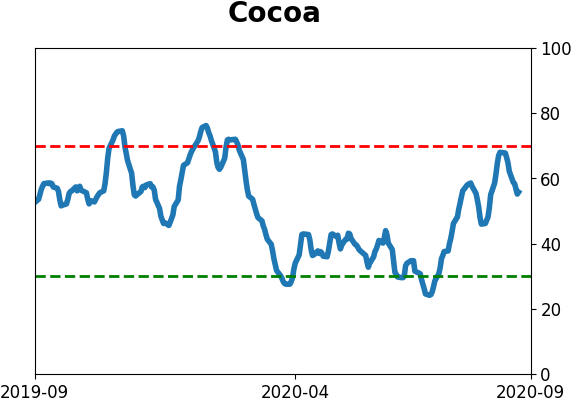
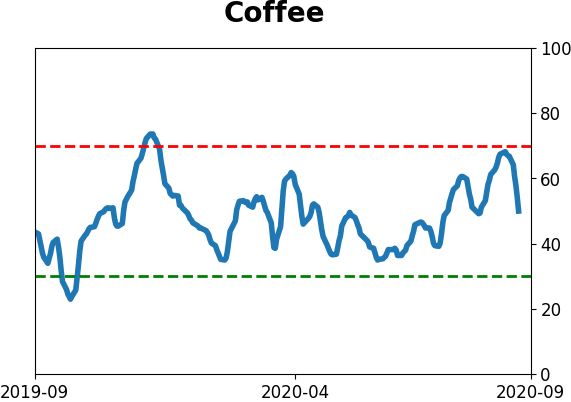
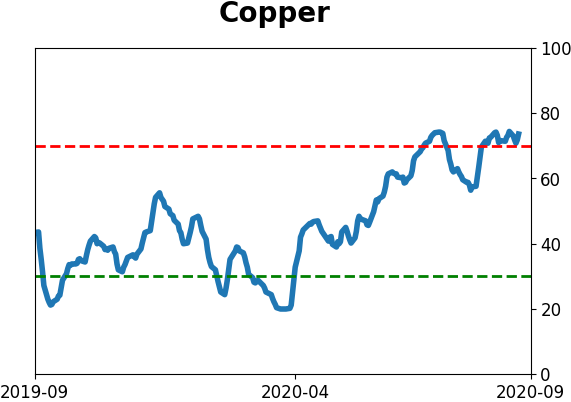
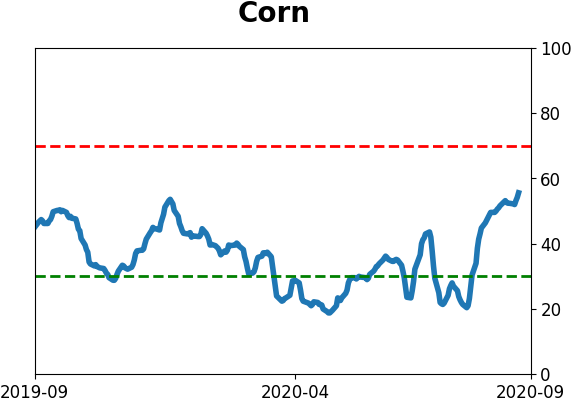
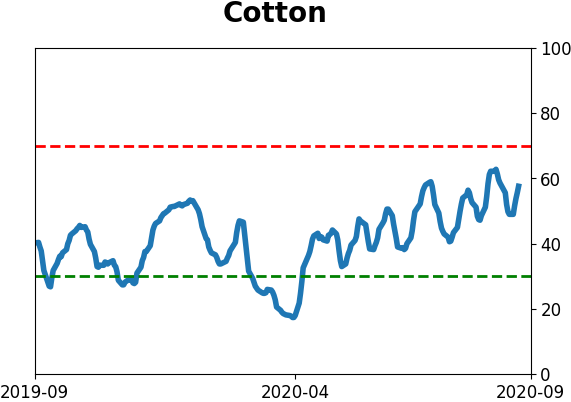
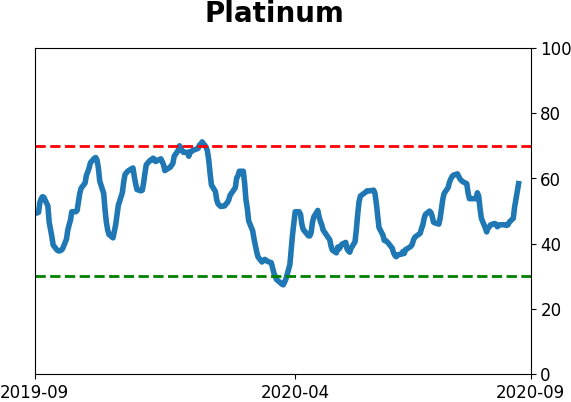
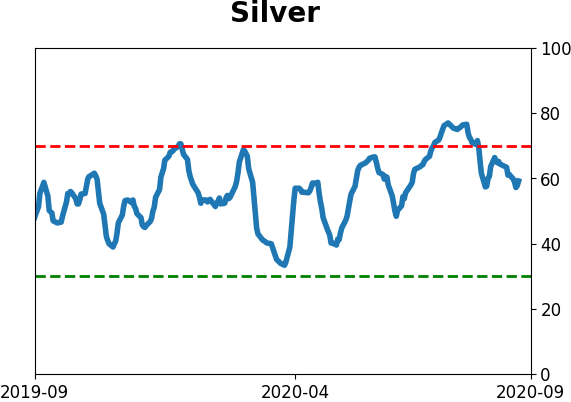
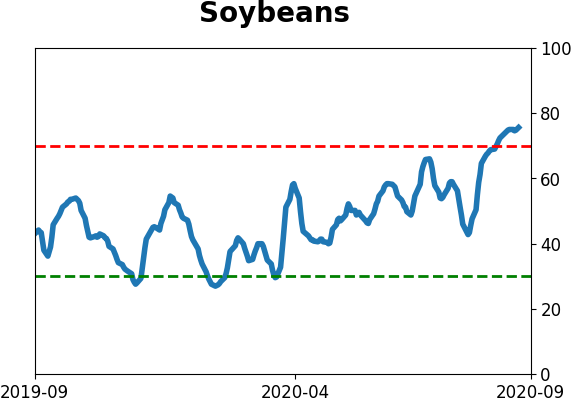
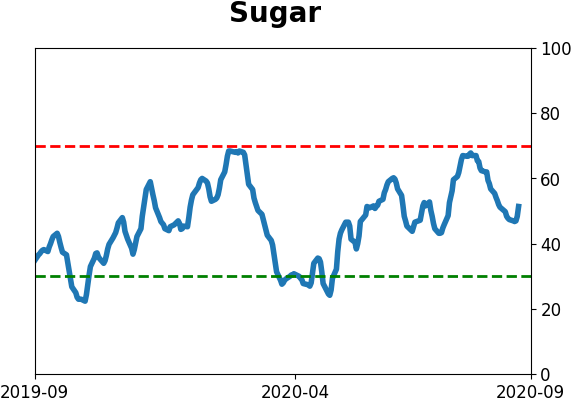
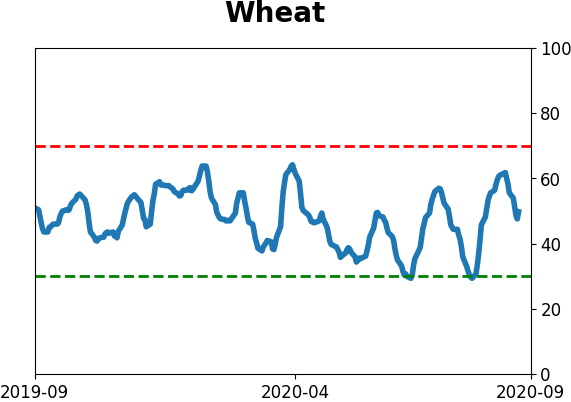
Agriculture
|
|
Research
BOTTOM LINE
The S&P 500 is on the cusp of falling into a correction, or around a 10% decline from its recent peak. When this happens quickly after a new high, forward returns were sketchy over the medium-term. This is the 4th such pullback in 3 years, tied with only 2 other periods since 1928.
FORECAST / TIMEFRAME
None
|
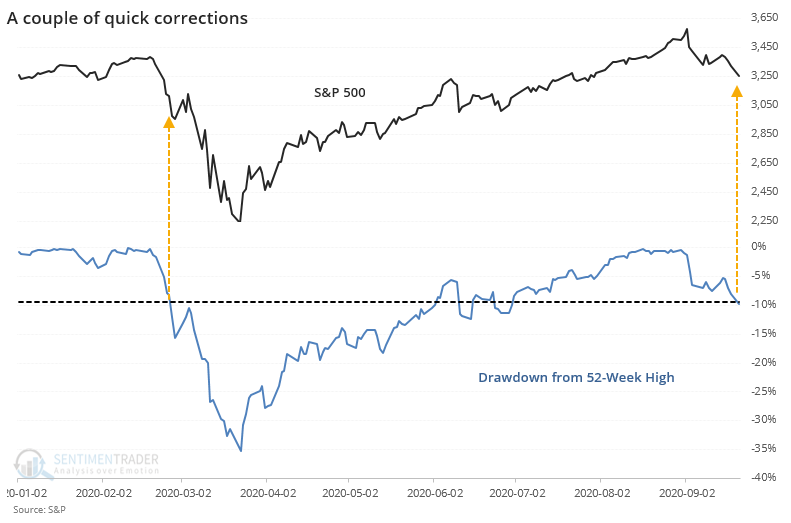
With further losses on Monday, we'll be hearing a lot about the S&P 500 falling into a correction. And then the catcalls about "actually, it's not really a correction..." It's a silly game of semantics that plays out every time in the age of clickbait social media.
We use the widely-accepted definition of a 10% decline from a 52-week as marking a correction. Of course, it's arbitrary. Everything about technical analysis is even though practitioners like to cite "rules." There are no rules when it comes to auction markets. Same goes for fundamental analysis for the most part.
It doesn't really matter. Let's not get hung up on useless word games and instead focus on the core of the matter, and that's whether fast pullbacks from an important peak are likely to continue to generate further selling pressure. For these purposes, we'll cheat a bit and consider any loss of 9.5% or greater (including on an intraday basis since 1962) to count as a correction.
If we can agree to that, then the S&P triggered it today.
The table below shows every date when the index fell this far from a 52-week high within 30 days of sitting at a 52-week high.
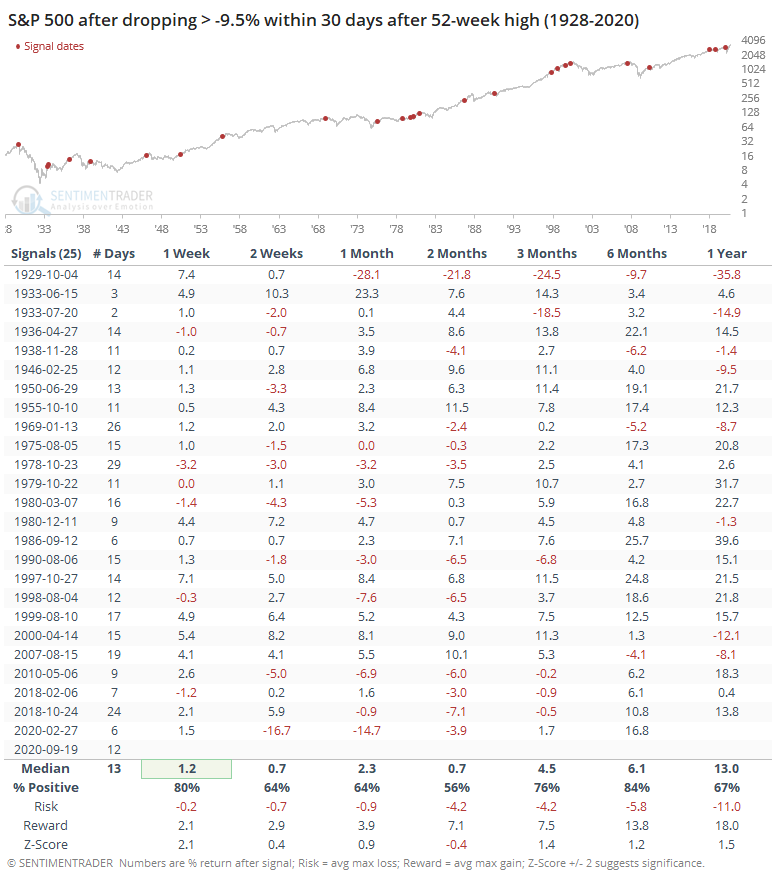
The last signal was a good warning sign that such eager selling pressure was just getting started. It also triggered in half the time, so there's that. Most of the others saw a rebound over the next week at least, but the 2-month time frame was sketchy. Risk increased substantially from shorter time frames, and the averages were unimpressive.
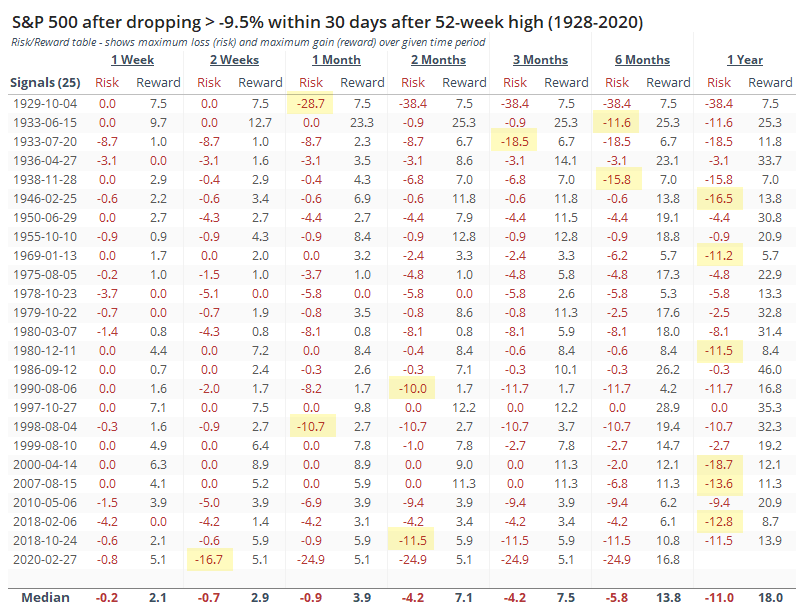
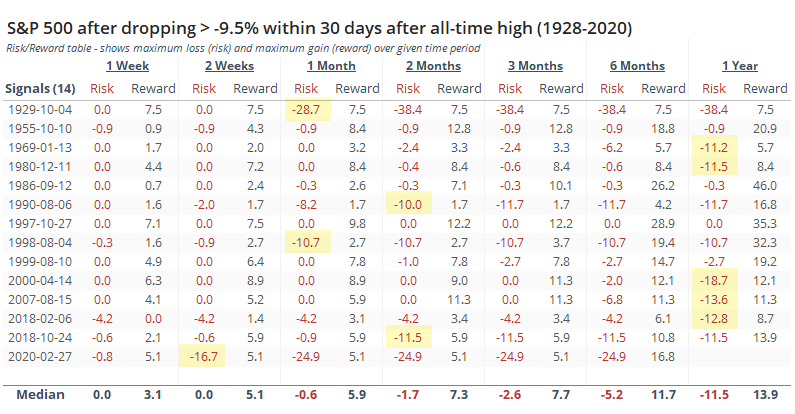
Below, we can see the Risk/Reward table. These show the S&P's maximum loss and maximum gain, respectively, from the signal date through each time frame. If the S&P fell a further 10% from the signal date, roughly pushing it into bear market territory, then it's highlighted in yellow. Out of the 25 signals, 14 of them did so within a year and 6 of them within 3 months. That would suggest about a 25% chance of falling into a bear market over the medium-term.
If we look at more important peaks, then we get the following.
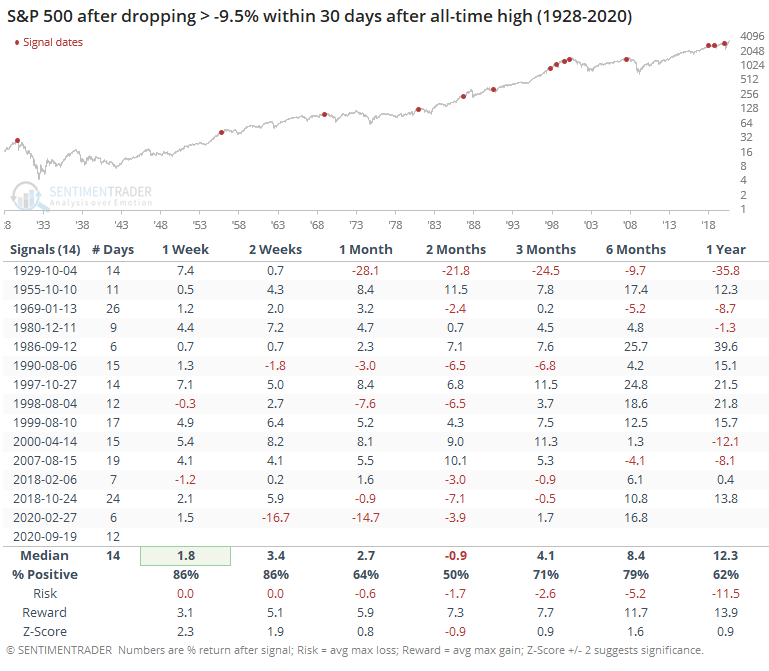
When the S&P dropped this much from an all-time high, it had even more of a tendency to see a short-term rebound, but also more of a tendency to see further selling pressure over the next couple of months. Risk was initially lower than after corrections from lesser peaks, so that's a point in bulls' favor over the medium-term.
Again, the Risk/Reward table for these signals is below. Out of 14 signals, 10 of them fell approximately into a bear market at some point within the next year, so not a great sign there. And 5 of them did so within 3 months, suggesting about a 1-in-3 chance of doing so now, based on this history.
We're now tied with 1977-1980 and 1997-2000 as having suffered 4 very quick corrections within a 3-year time span.
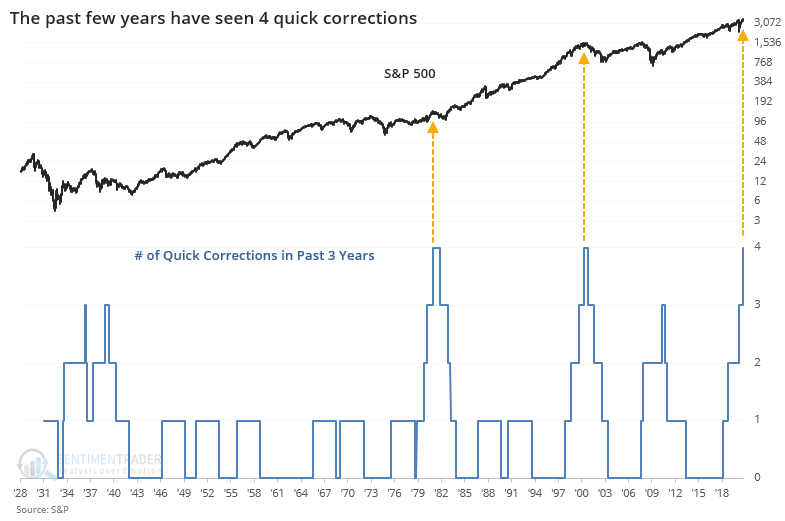
That's not very encouraging, since both saw stocks fall into a couple of years of malaise as investors tired of the volatility (there were many other factors contributing to both, to be sure).
There's something that bulls and bears might take from this behavior. Bulls could focus on the idea that there is less of a chance of falling into a bear market than falling into one, especially over the next few months. Bears may have a stronger argument, suggesting that at some point over the next year, the probability is relatively high of at least a further 10% decline. Plus, there's the idea that we've suffered so many of these in a relatively short investment horizon that it could contribute to a longer sense of risk aversion. Especially with all those recent call buyers registering all of the devastating losses they're currently suffering.
We'll have to keep an eye on the percentage of stocks within the S&P 500 that fall into a correction as well.
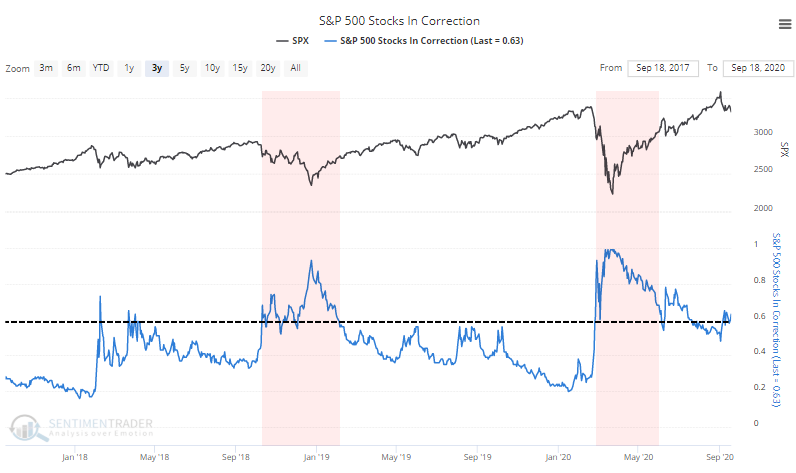
When this stays above 60%, which it's barely doing now, the market environment tends to be very volatile. Healthy markets might see brief bouts about this threshold but it rarely sticks for long.
BOTTOM LINE
Last week, the smallest of options traders increased their bets on a market rally, undeterred by what was likely some catastrophic losses lately. Speculative activity remains above any prior peak. Estimates of gamma exposure have plunged, a potential positive, but it's not as reliable as options activity.
FORECAST / TIMEFRAME
None
|
The smallest of options traders are not to be deterred.
Even after what were likely catastrophic losses over the past two weeks, since most of the options activity was concentrated in the large tech stocks that have suffered large losses, retail volume for 10 contracts or fewer increased its speculative tilt last week. They spent 48% of all their volume buying call options to open, a naked bet on rising prices.
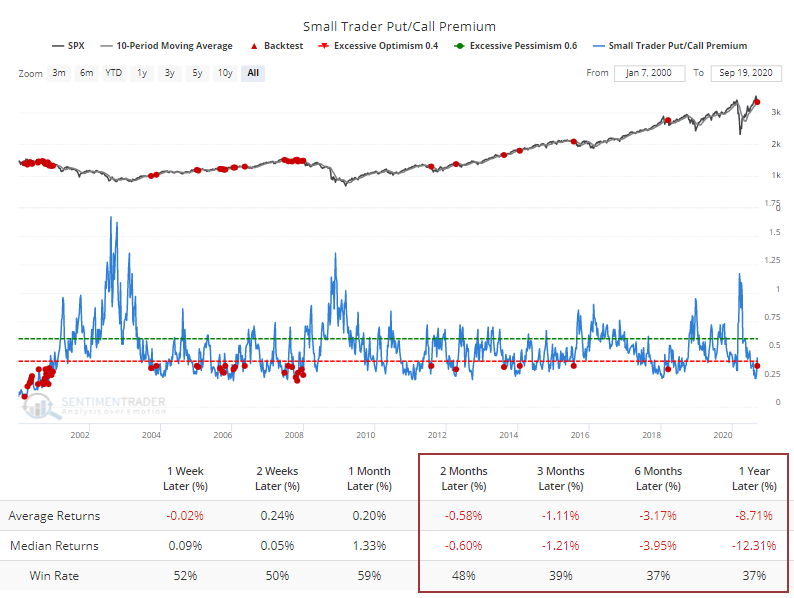
The ratio of opening call premiums to put premiums declined, ranking among the lowest in 20 years. This is even after the S&P 500 slipped below its 10-week moving average. According to the Backtest Engine, that has not been a good combination.
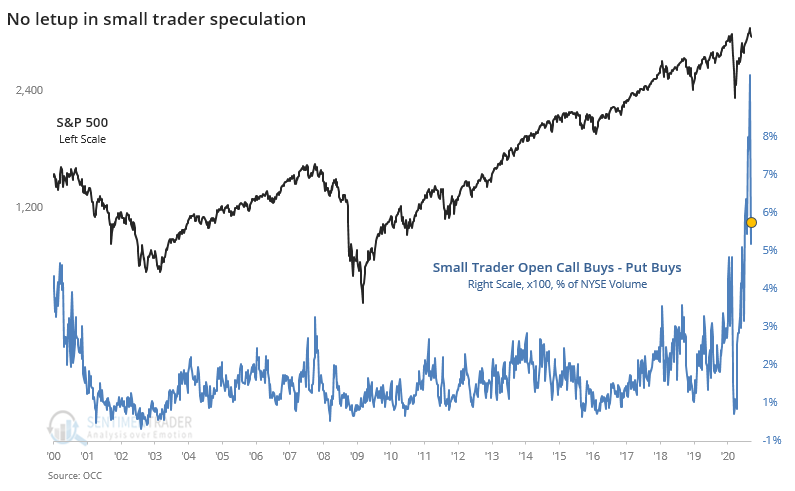
If we step back and look at the data similar to how we did last week, we can see that the number of opening call transactions minus puts, relative to NYSE volume, also ticked up.
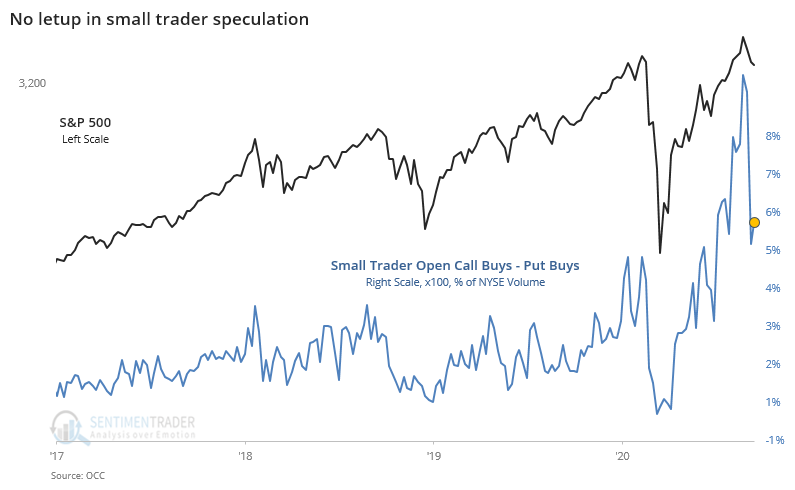
Over the past 20 years, it's the repetition of what we've harped on for weeks on end - there is still no comparison and recent losses have not deterred excessive options speculation.
The same goes when looking at speculative premiums paid relative to the S&P 500's market capitalization.
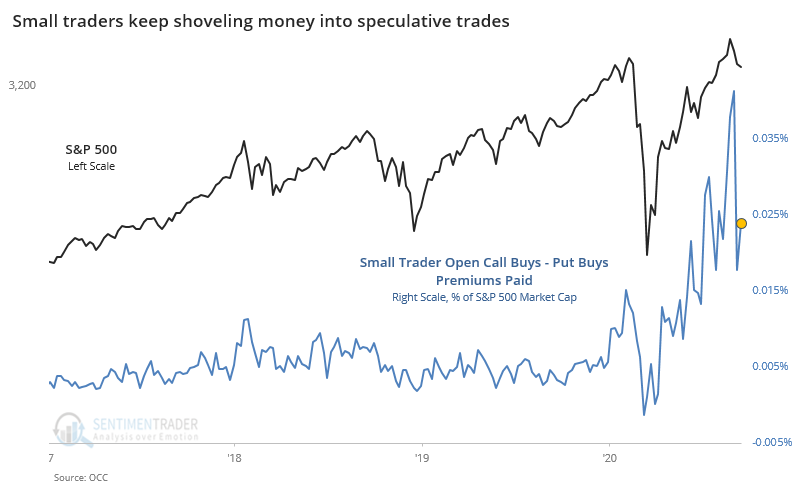
Again, historically, there is no precedent.
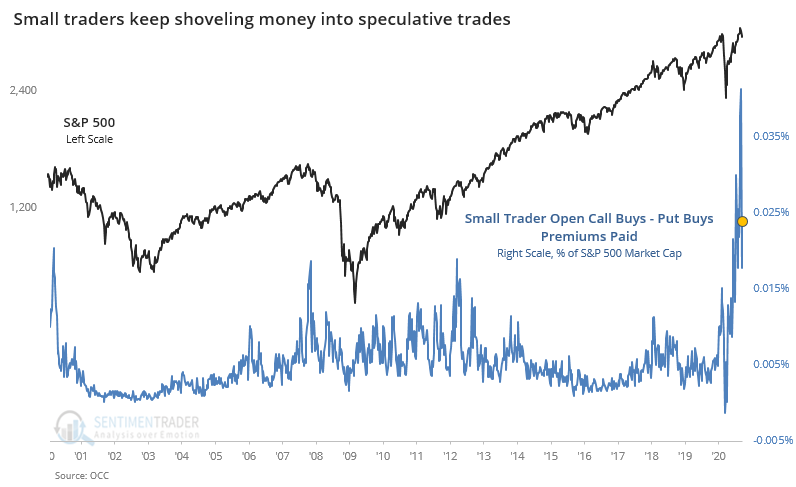
There is no way to spin this in a positive light.
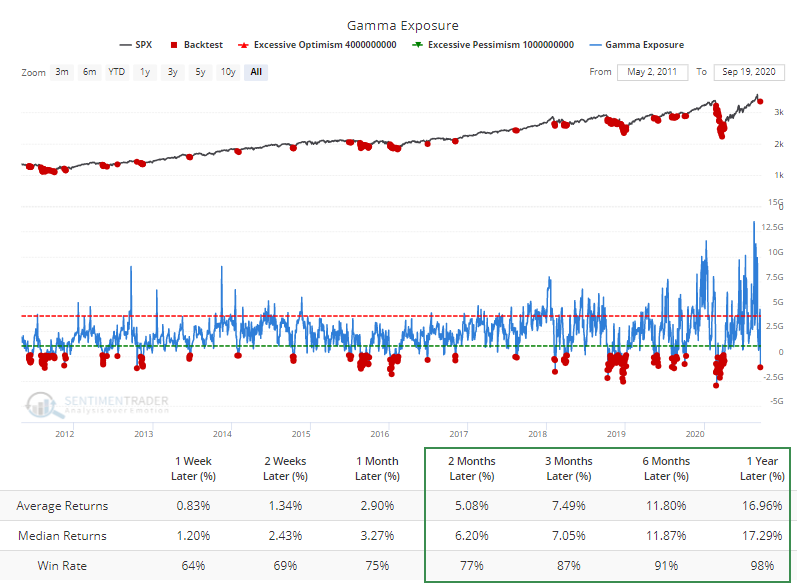
One of the big worries in late August and early September was that although stocks were rising, so was implied volatility. Traders were chasing stocks higher via options, which caused dealers to scramble to buy the underlying stock as a hedge. When this happens quickly, in short-dated options, we sometimes get the "gamma explosion" shown in the chart from the September 8 note.
While any estimate of market-wide gamma exposure is a guesstimate, according to SqueezeMetrics, Gamma Exposure had spiked in August, verifying the whole "gamma explosion" concept.
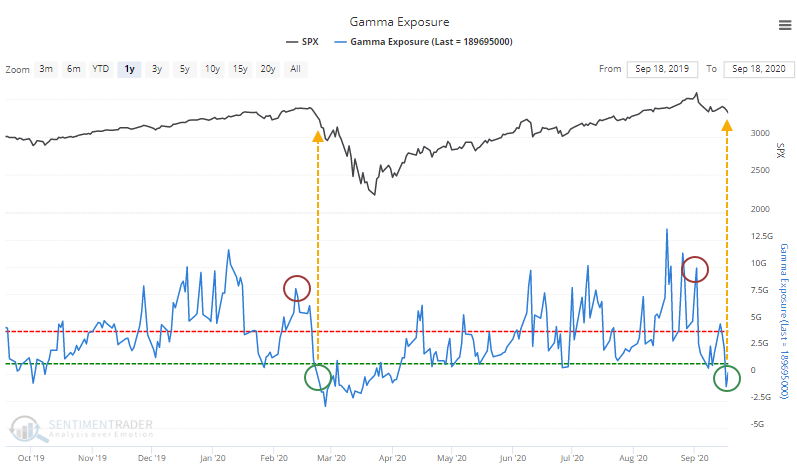
As dealers adjusted, some of the trades dropped off, and stocks fell, Gamma Exposure dropped into negative territory on Thursday before rising a bit on Friday. Whenever it has been below the lower threshold, the Backtest Engine shows that forward returns were good.
That should be a good sign, potentially dimming the negative implications from the still-excessive amount of call buying among retail traders. The biggest caveat here is that the last time Gamma Exposure cycled from above $7.5 billion to negative territory, the selloff was just getting started.
We'd continue to put the most weight on the behavior of options traders versus estimates of gamma exposure. While a drastic reduction in the latter seems to be a good sign, it still seems like there is a lot of overhead supply that needs to be worked off, many of the stocks with the heaviest options activity continue to act heavy, and there has been an increase in new bets on a rising market. Sentiment tends to swing from one extreme to the other, and this particular cycle has barely begun.
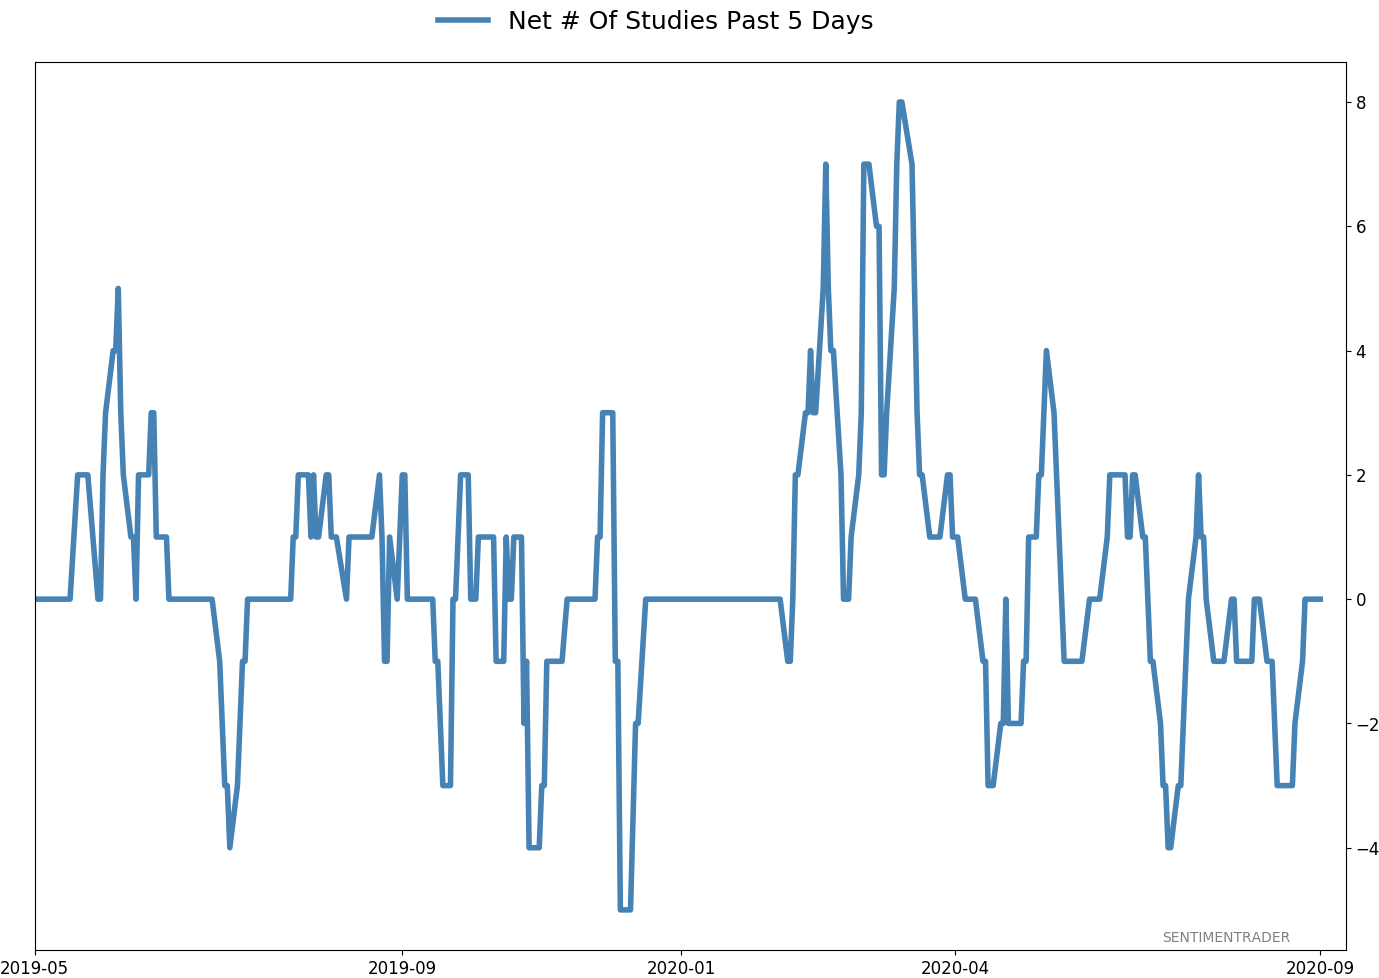
Active Studies
| Time Frame | Bullish | Bearish | | Short-Term | 0 | 1 | | Medium-Term | 1 | 12 | | Long-Term | 47 | 2 |
|
Indicators at Extremes
Portfolio
| Position | Description | Weight % | Added / Reduced | Date | | Stocks | RSP | 15.2 | Reduced 4.2% | 2020-09-03 | | Bonds | 10% TLT, 10% BND, 10% SCHP | 30.0 | Added 30% | 2020-09-09 | | Commodities | GCC | 2.4 | Reduced 2.1%
| 2020-09-04 | | Precious Metals | GDX | 5.0 | Added 5% | 2020-09-09 | | Special Situations | XLE | 4.9 | Added 5.1% | 2020-09-03 | | Cash | | 42.5 | | |
|
Updates (Changes made today are underlined)
After stocks bottomed on March 23rd, they enjoyed a historic buying thrust and retraced a larger amount of the decline than "just a bear market rally" tends to. Through June, there were signs of breadth thrusts, recoveries, and trend changes that have an almost unblemished record at preceding higher prices over a 6-12 month time frame. On a shorter-term basis, our indicators have been showing high optimism, with Dumb Money Confidence recently above 80%, along with signs of reckless speculation during what appears to be an unhealthy market environment, historically a bad combination. While there are certainly some outlier indicators that are showing apathy or even outright pessimism, a weight-of-the-evidence approach suggests high risk over a multi-week to multi-month time frame. That has been the case since July, even arguably June and yet the major indexes hit continual new highs through late August. With the indicators and studies failing to precede any weakness, I've been hesitant to lower my already-low exposure. I am getting increasingly anxious about the oddities we're seeing, though, and lowered it again. This account is mostly about comfort with risk for me, and right now I'm not at all comfortable with any of it. In more than 25 years of experience, this is the oddest market I've ever seen. I lowered exposure again - likely the lowest I'm willing to go at this point given longer-term positives - and decided to switch to an equal-weight version of the S&P 500 index. I've become intensely uncomfortable with the concentration in the cap-weighted index. Our studies have been mixed with regard to the potential for the equal-weight version to outperform the cap version going forward, so historical support isn't overwhelming. I'm also increasingly interested again in energy stocks, starting with a small allocation. I got burned in March with the unprecedented geopolitical spat that hammered those stocks then but the longer-term setup is decent. In this account, I’ve roughly followed what has become known as the All Weather portfolio popularized by Ray Dalio. It allocates across four broad assets, designed to hold up no matter the market environment. The goal is modest positive returns while limiting large, sustained losses. I typically use popular ETFs, with low costs. At times, I will swap out for a fund I believe has better prospects, or simply lower fees if not. At other times, I will diverge quite a bit from baseline allocations, largely depending on the indicators and studies we discuss on the site. I've gotten away from this in the past, using "cash" as a substitute for "bonds" and with rates stuck at 0%, that has become less appetizing. I'm trying to get back more toward the baselines with less dramatic swings in either direction. The base allocation I use is the following: Stocks: 35%
Bonds: 45%
Precious Metals: 7.5%
Commodities: 7.5%
Cash / Special Opportunities: 5%
RETURN YTD: -1.5% 2019: 12.6%, 2018: 0.6%, 2017: 3.8%, 2016: 17.1%, 2015: 9.2%, 2014: 14.5%, 2013: 2.2%, 2012: 10.8%, 2011: 16.5%, 2010: 15.3%, 2009: 23.9%, 2008: 16.2%, 2007: 7.8%
|
|
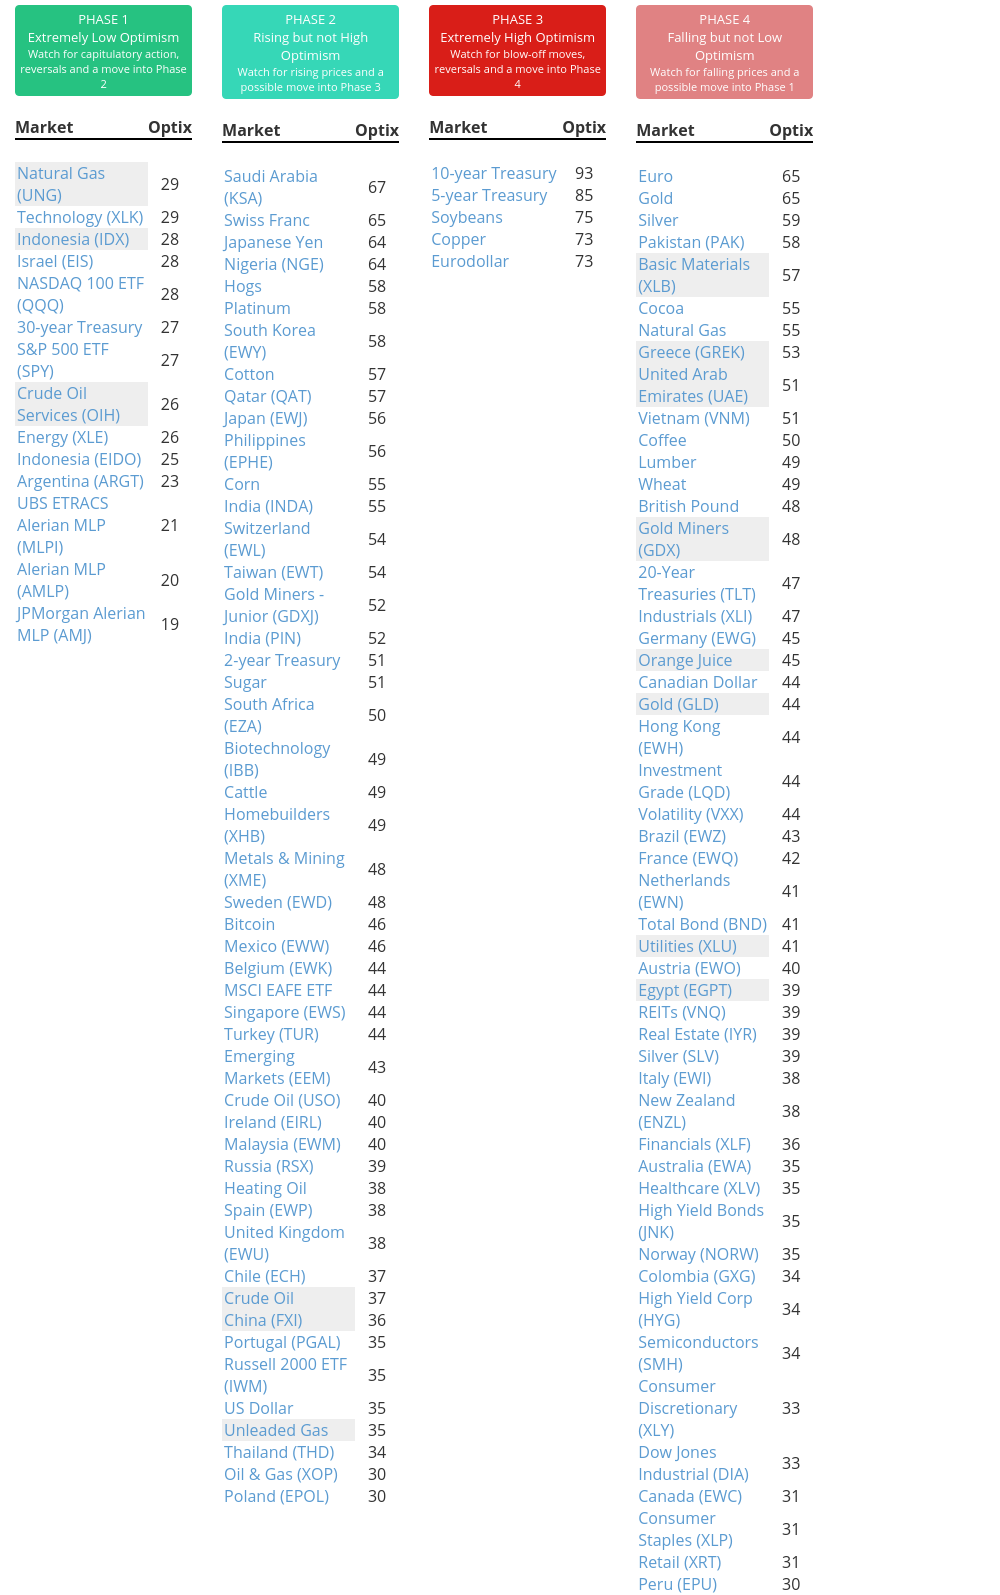
Phase Table
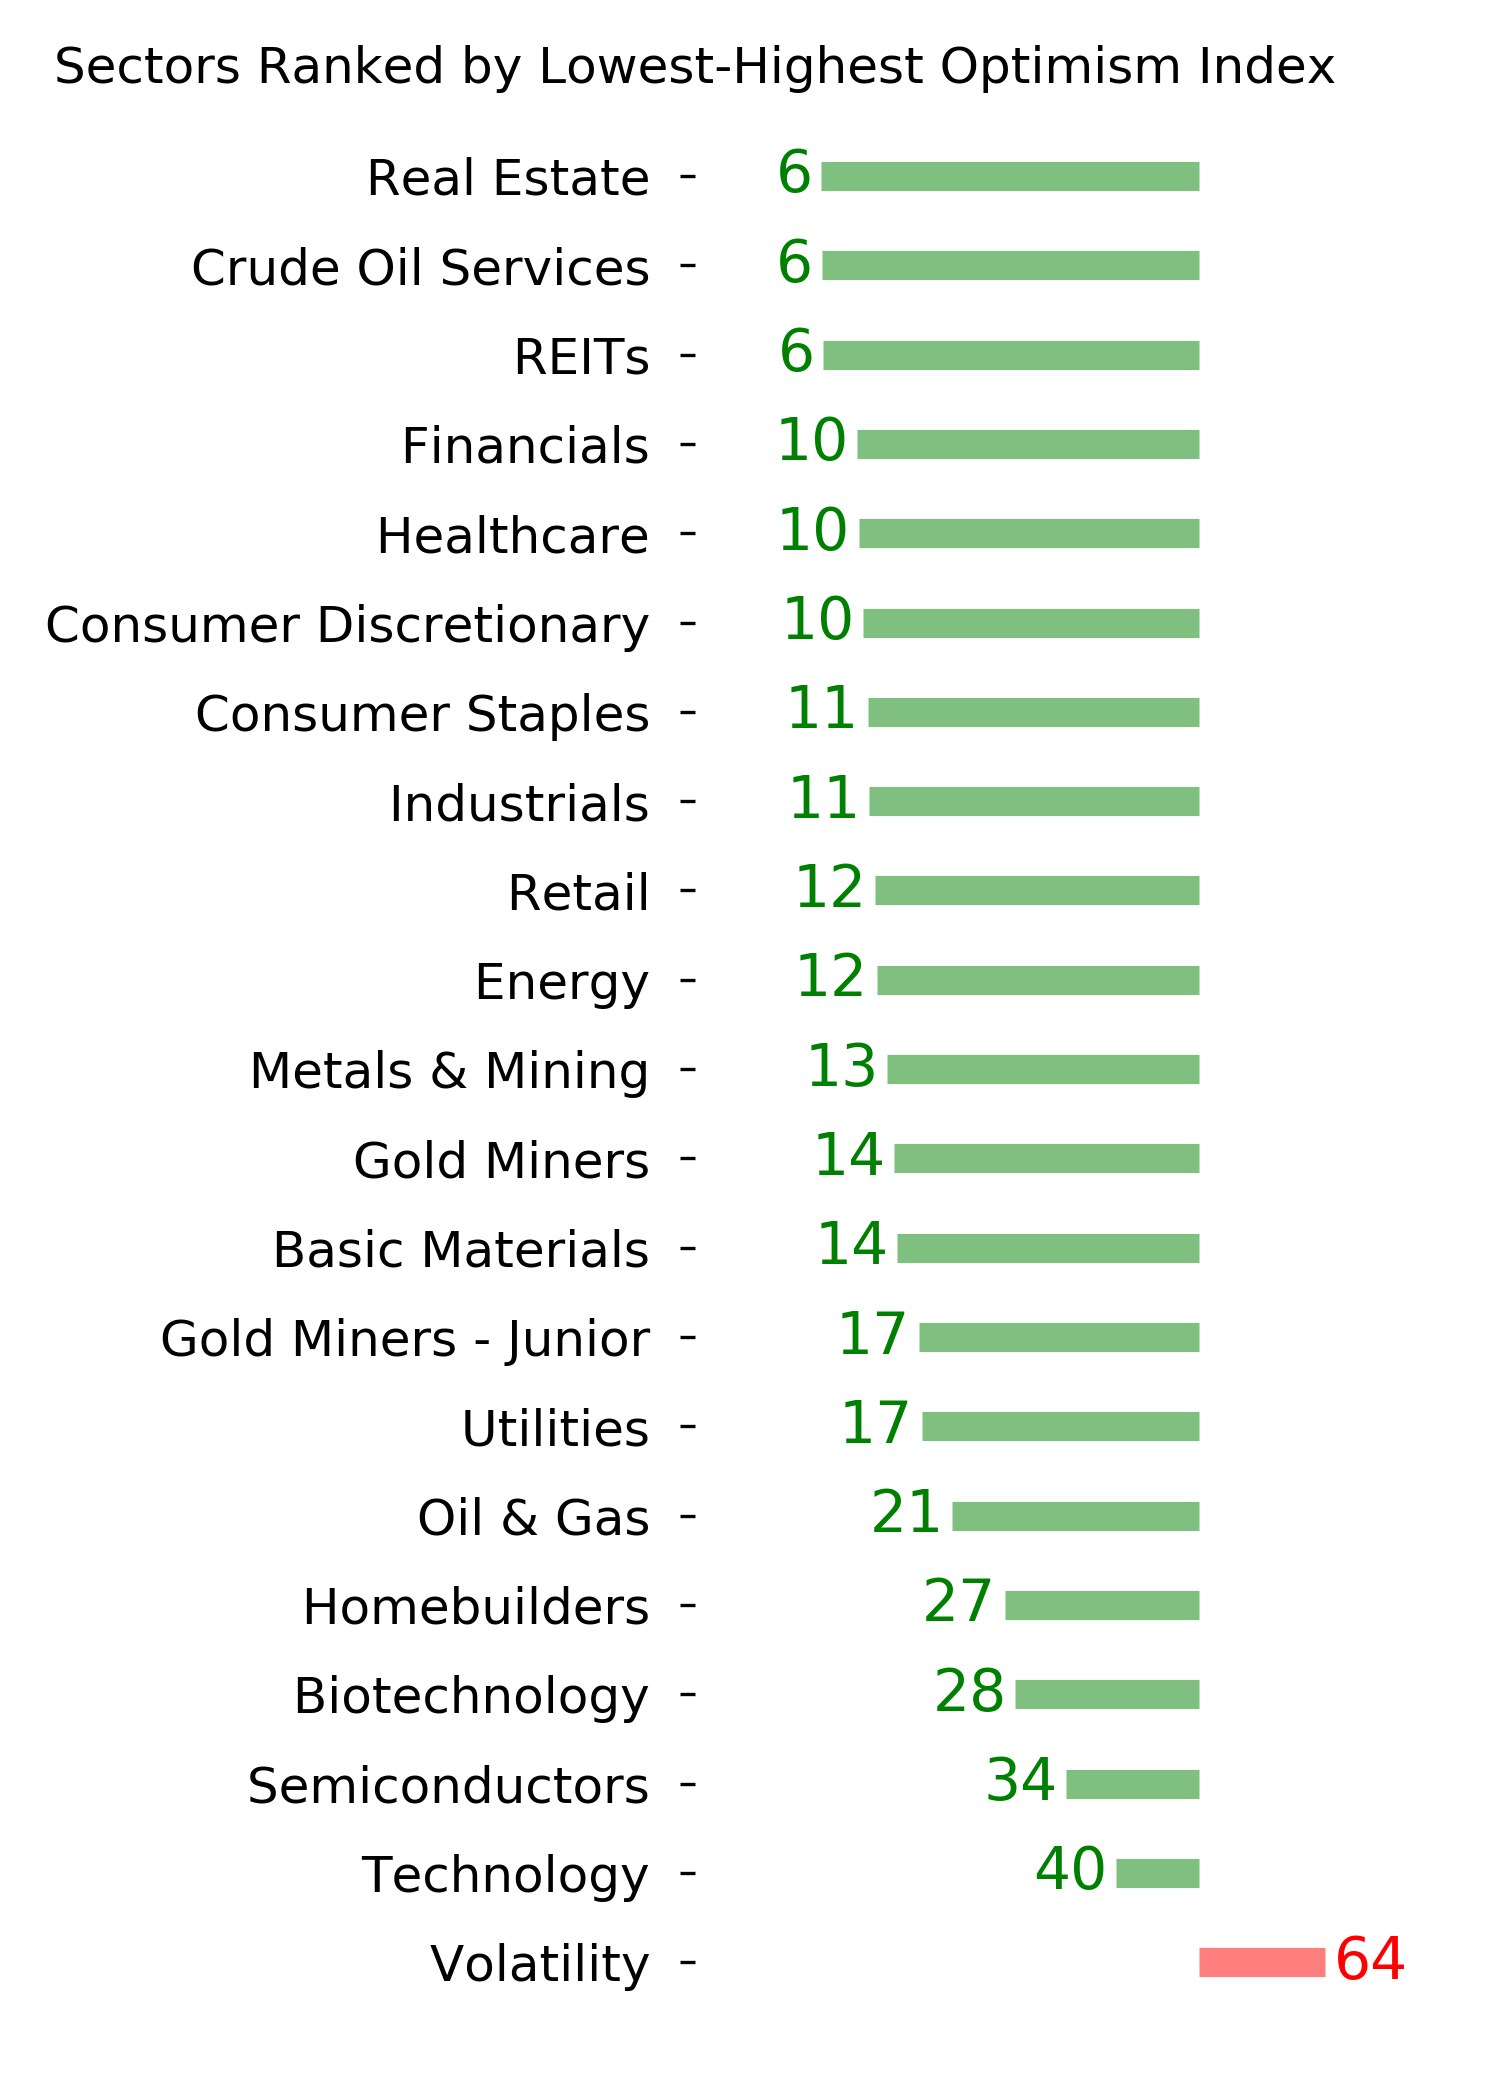
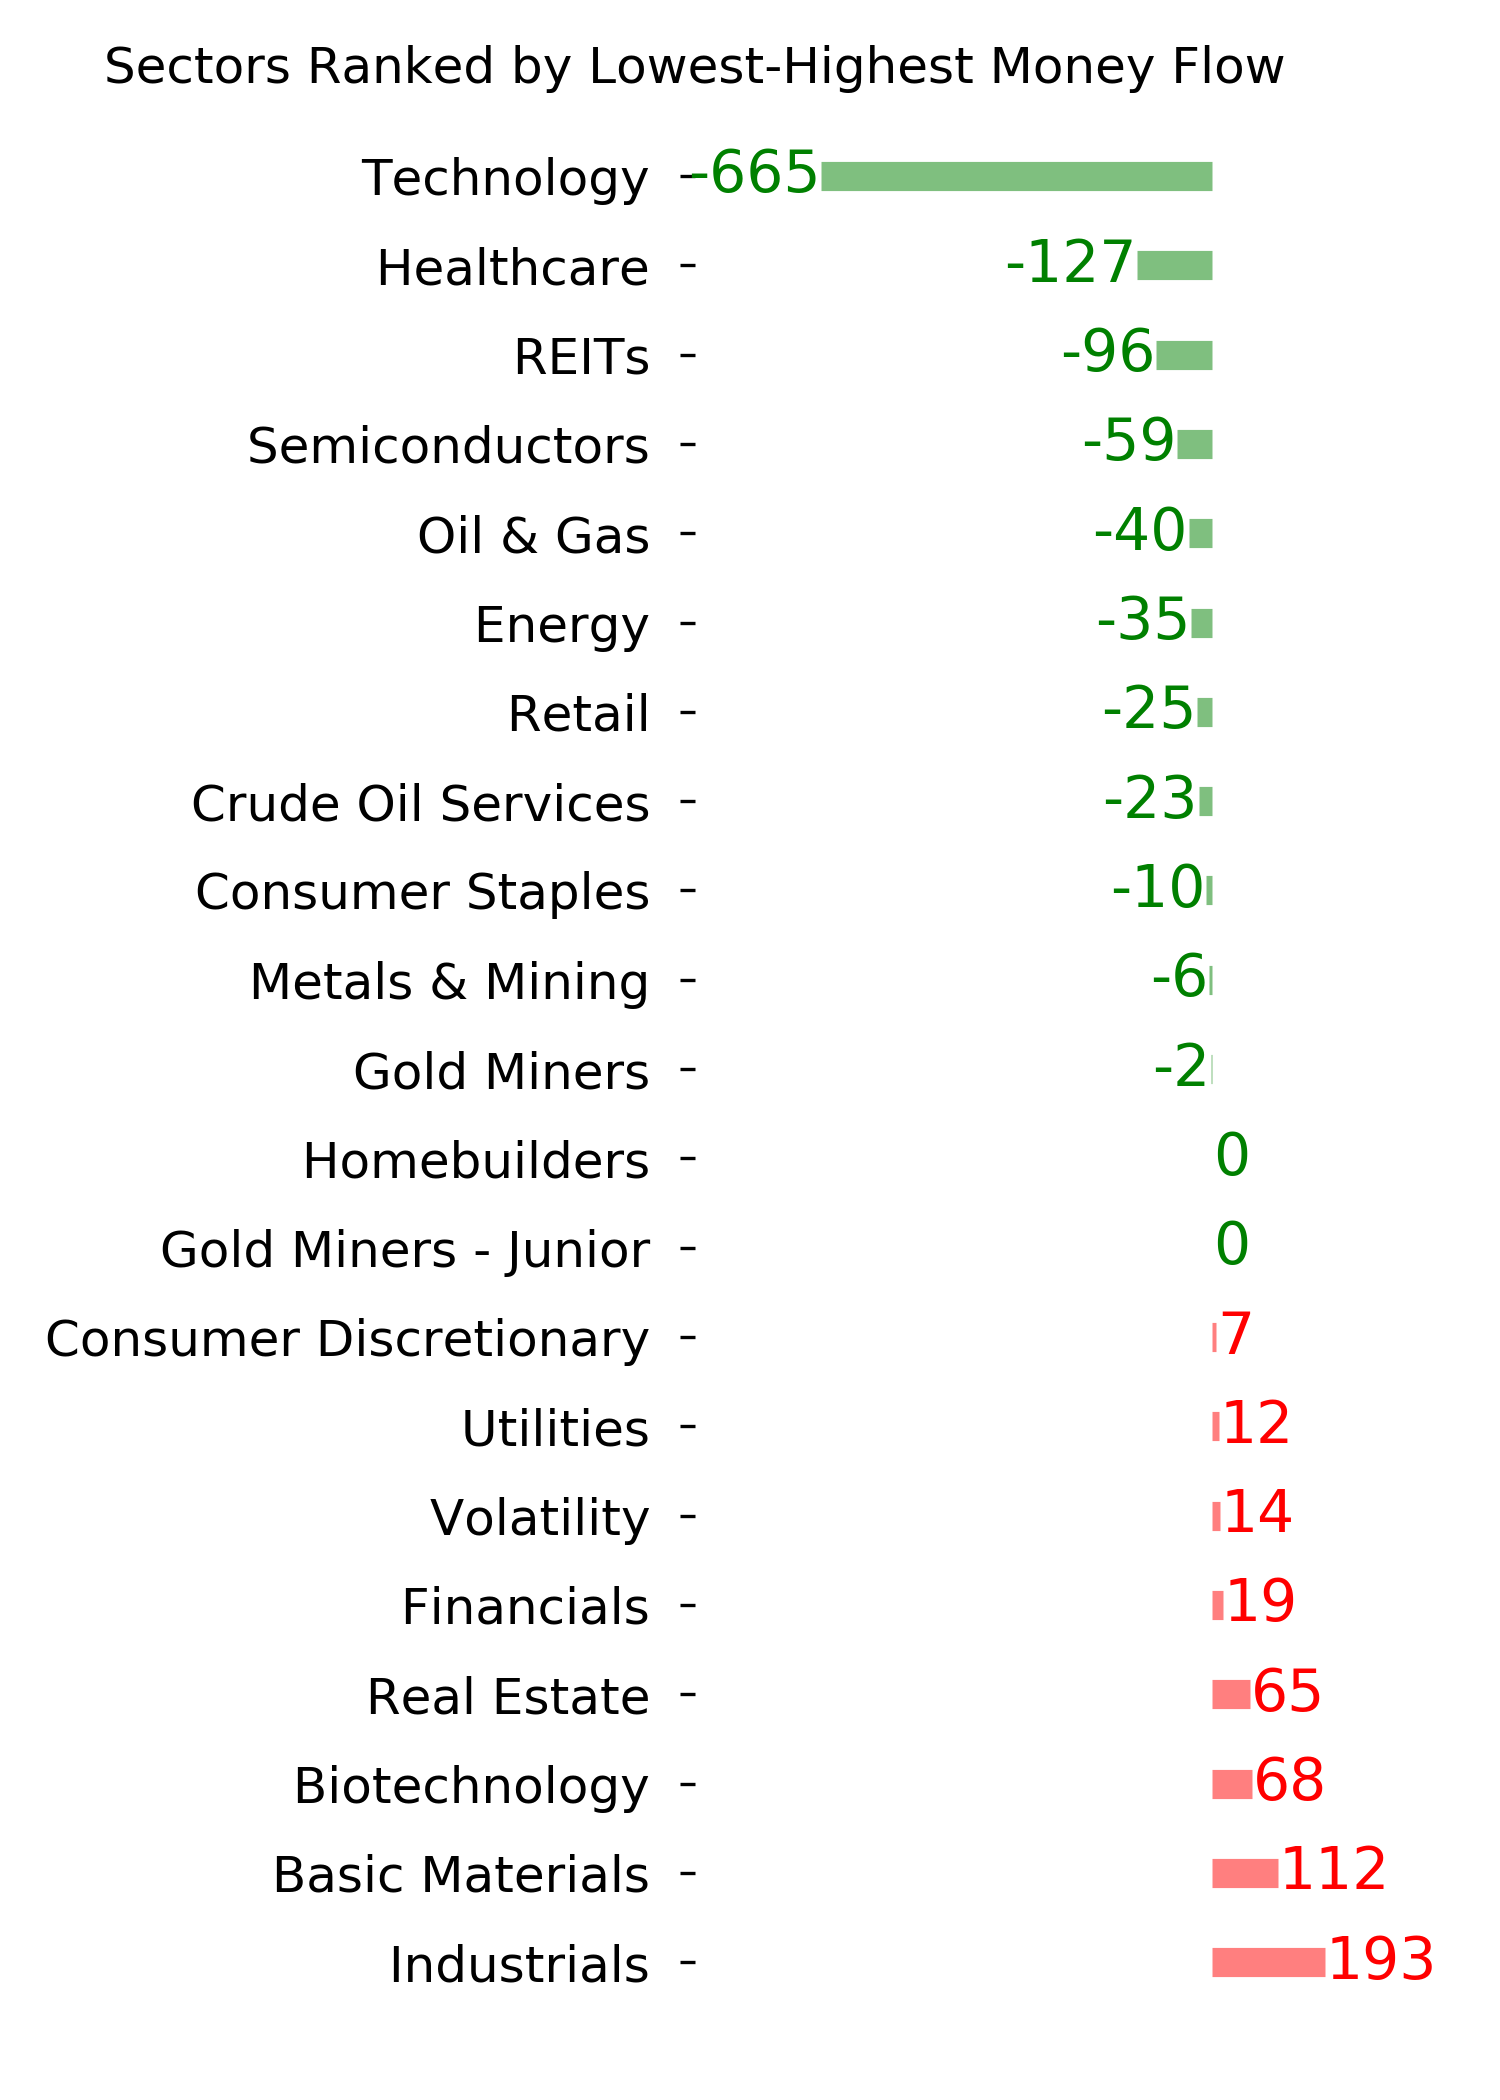
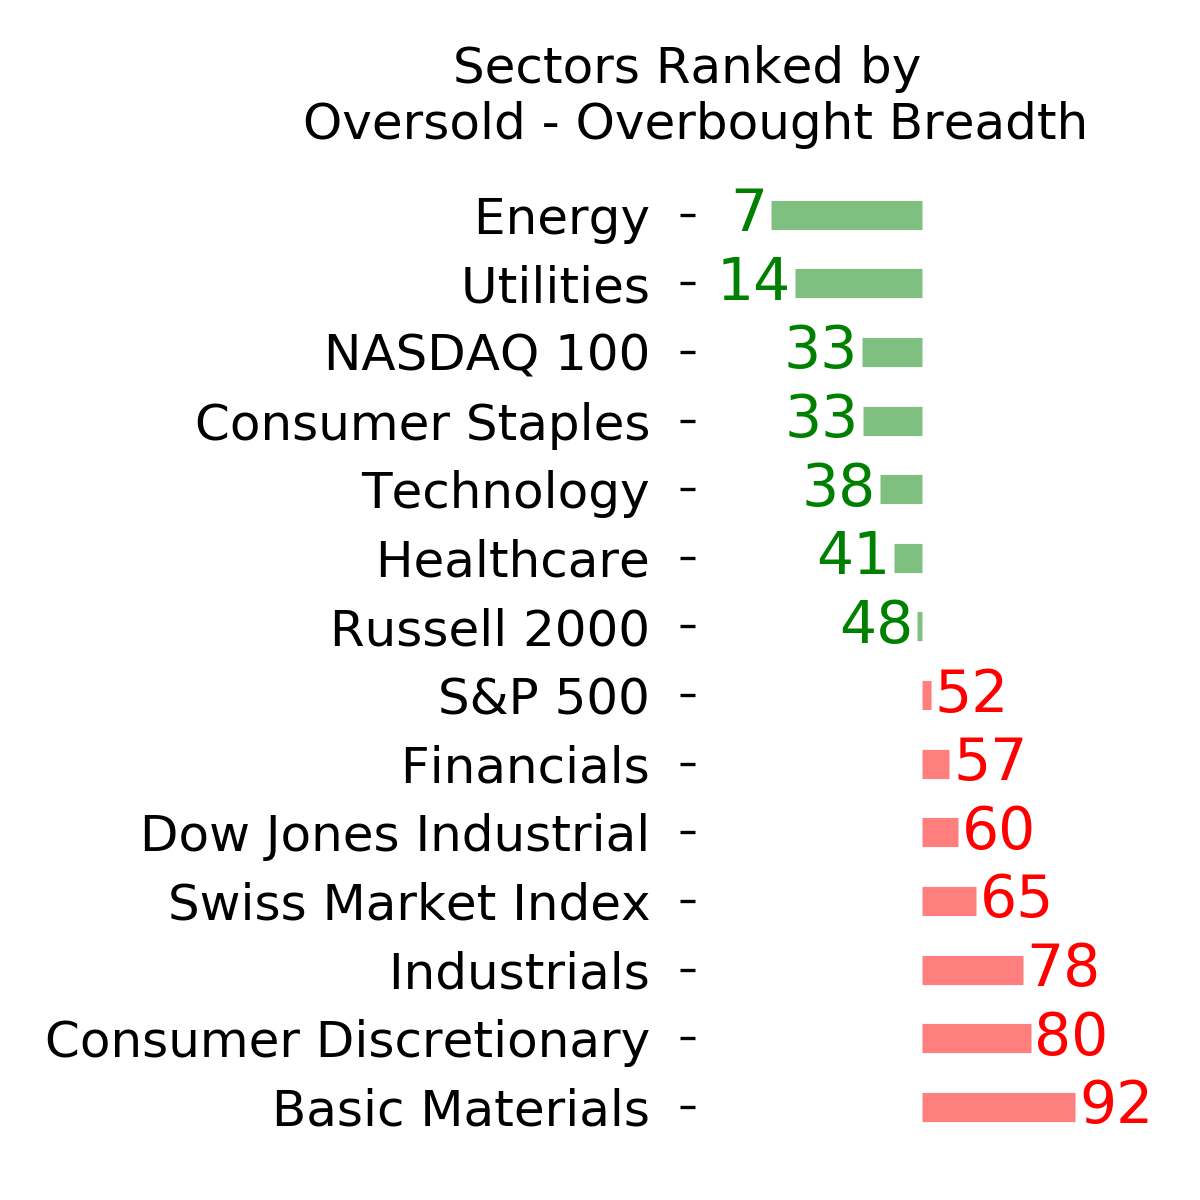
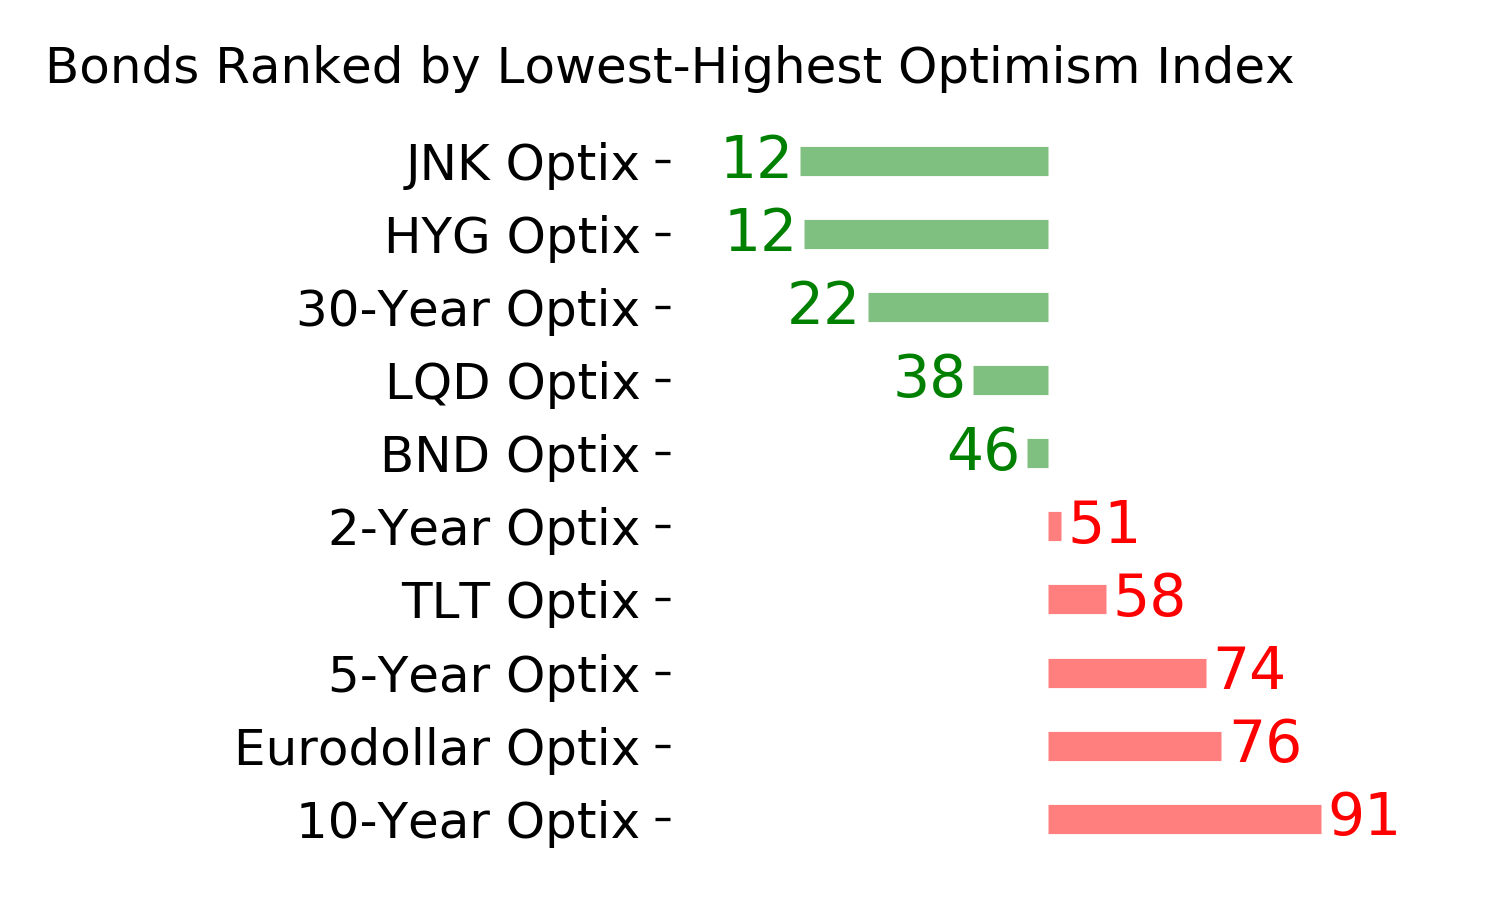
Ranks
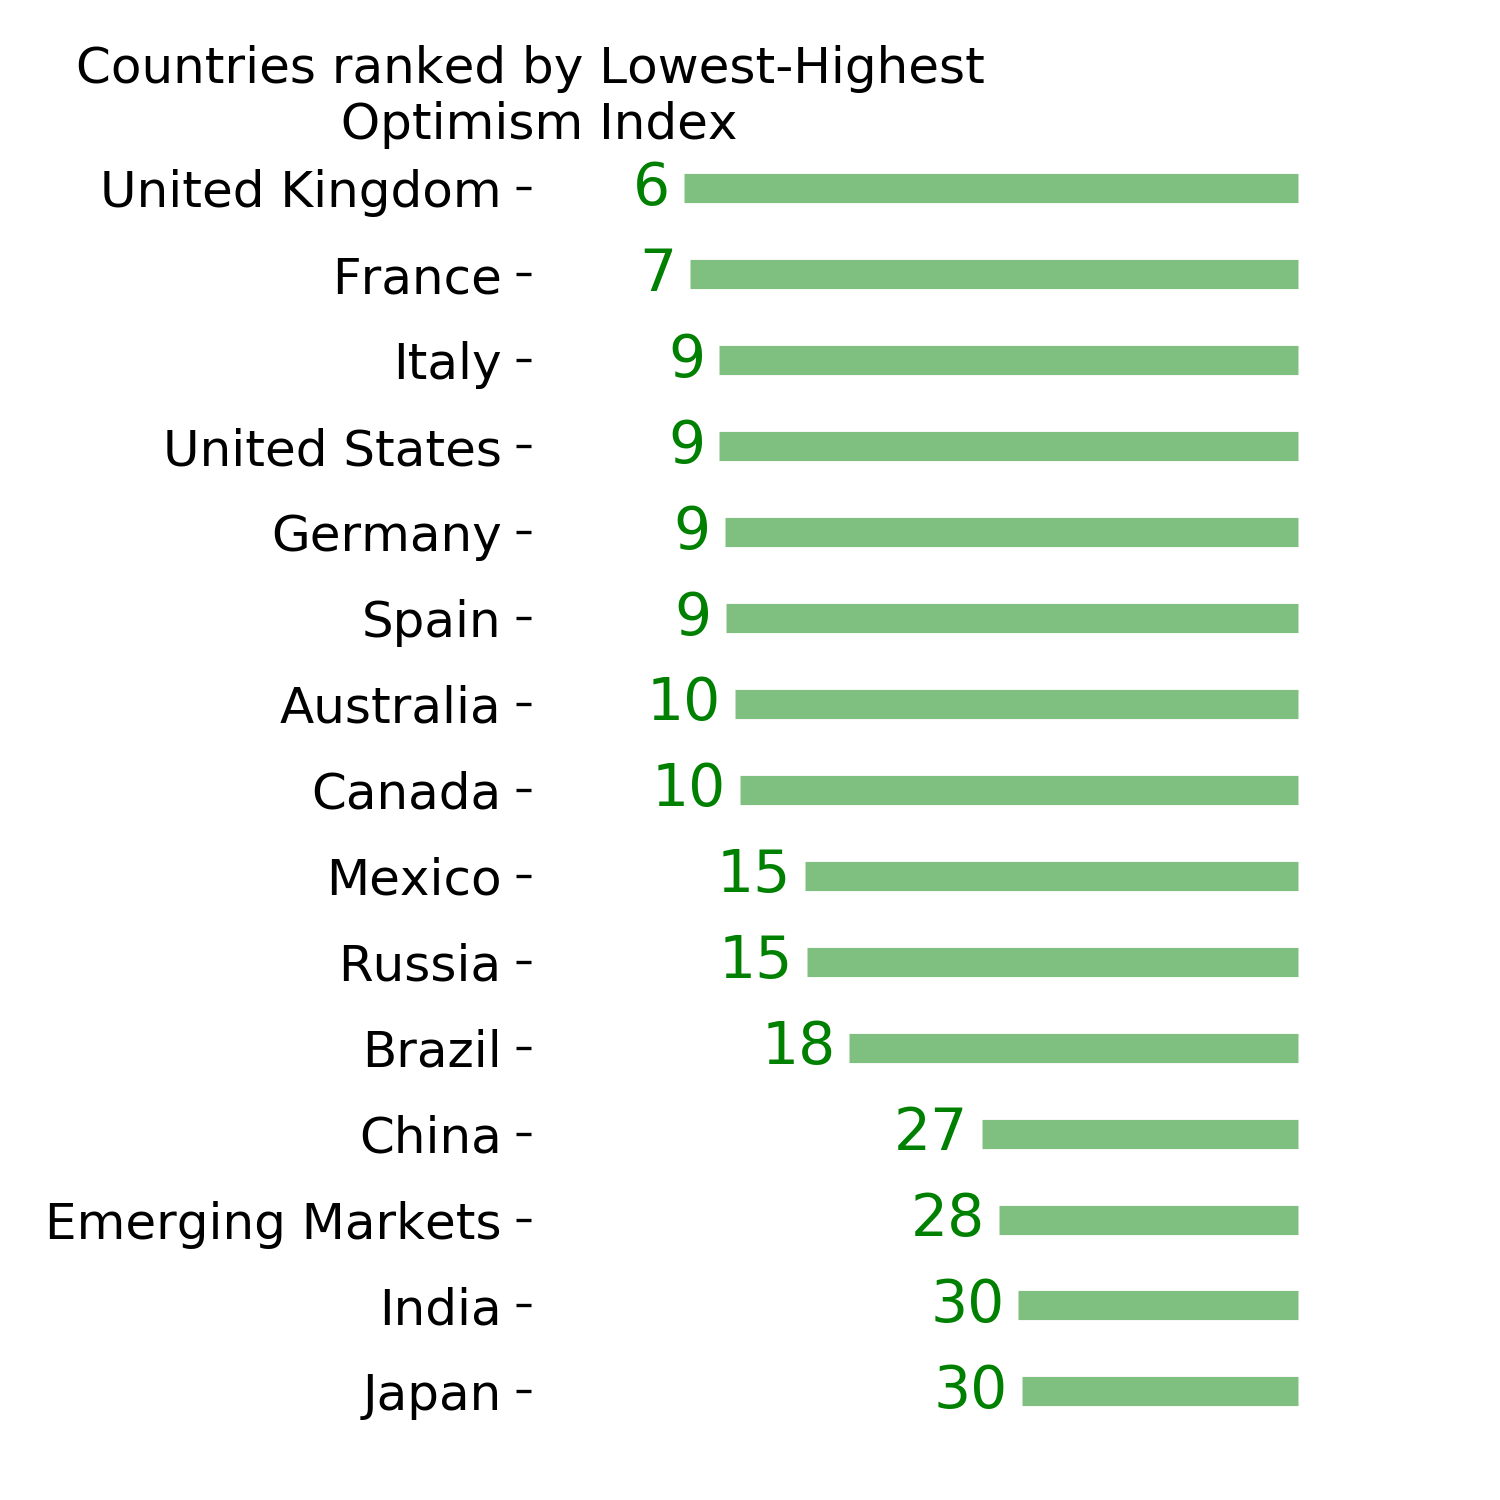
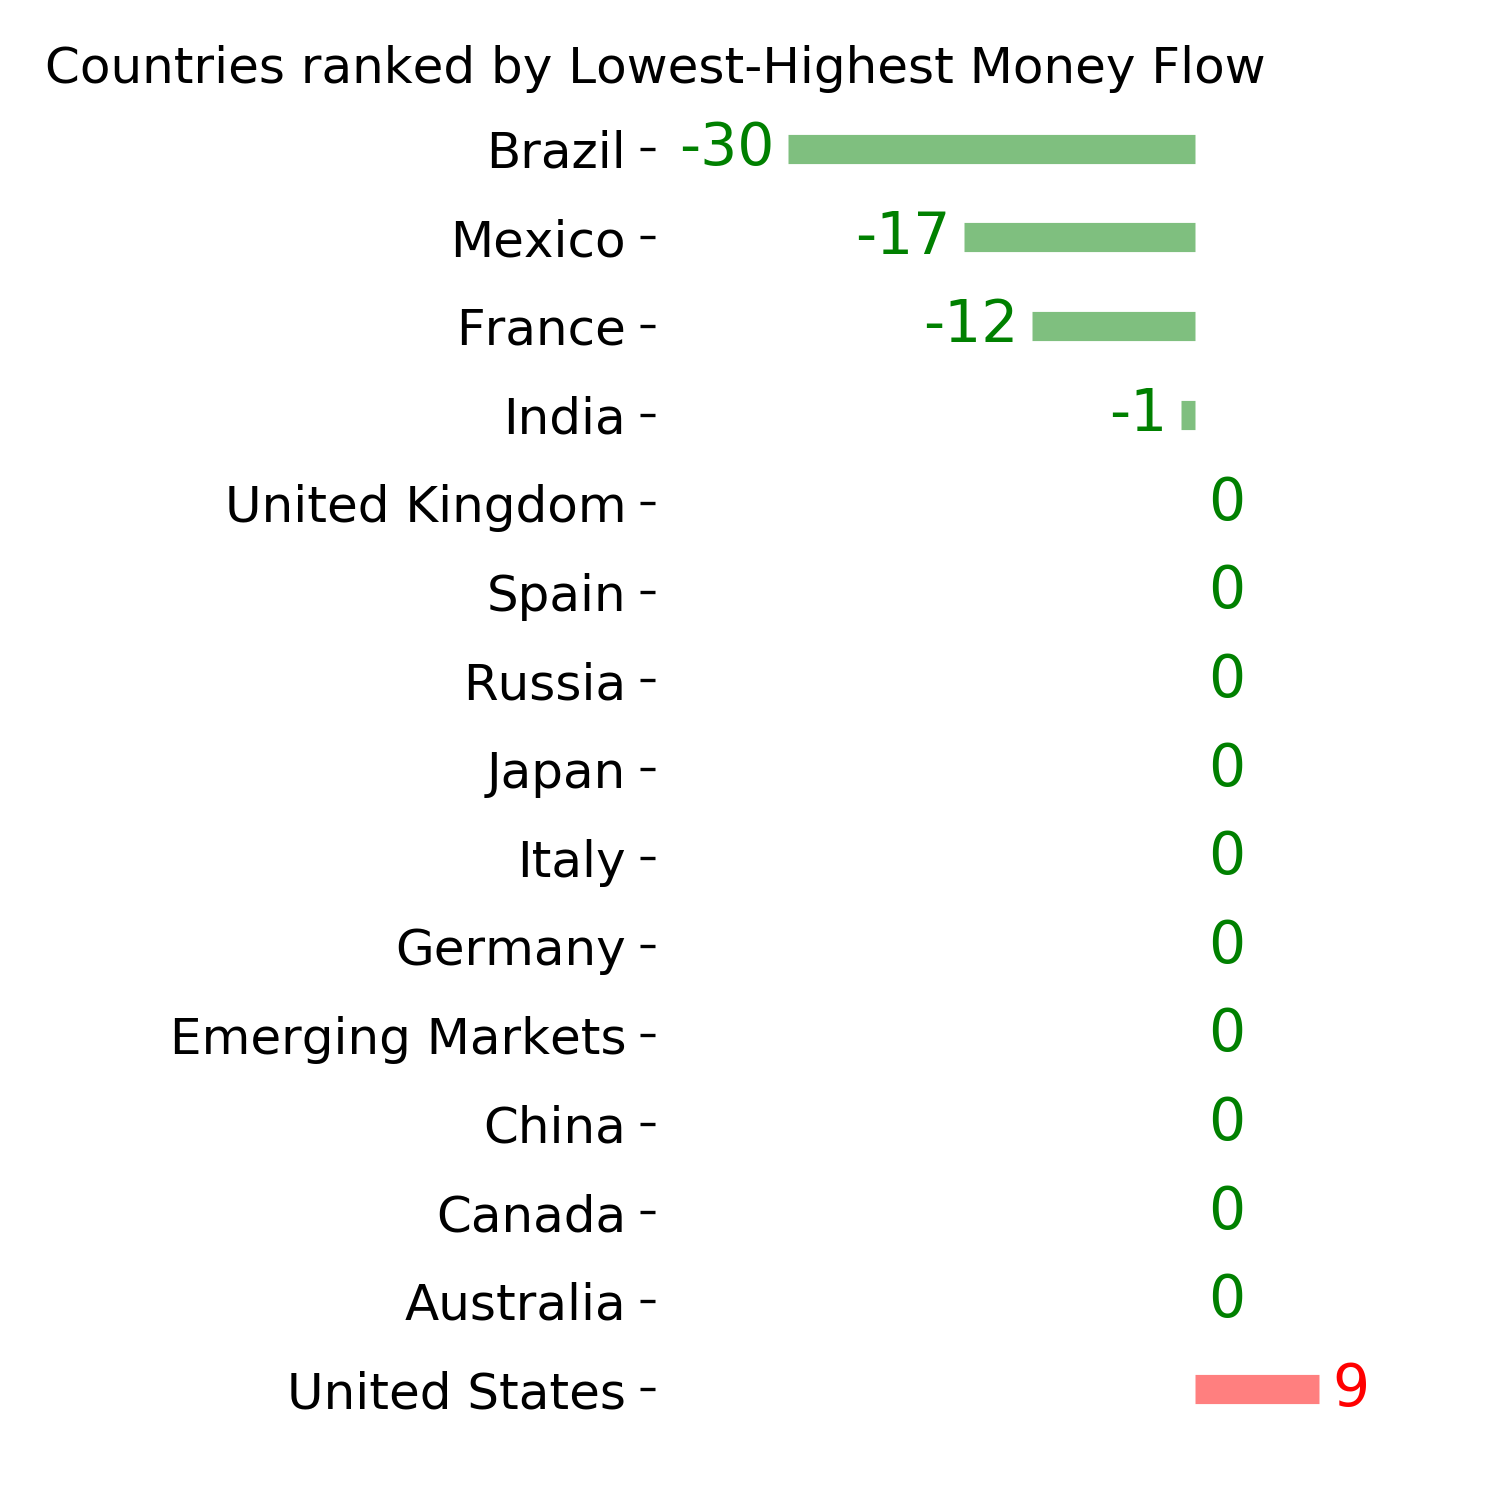
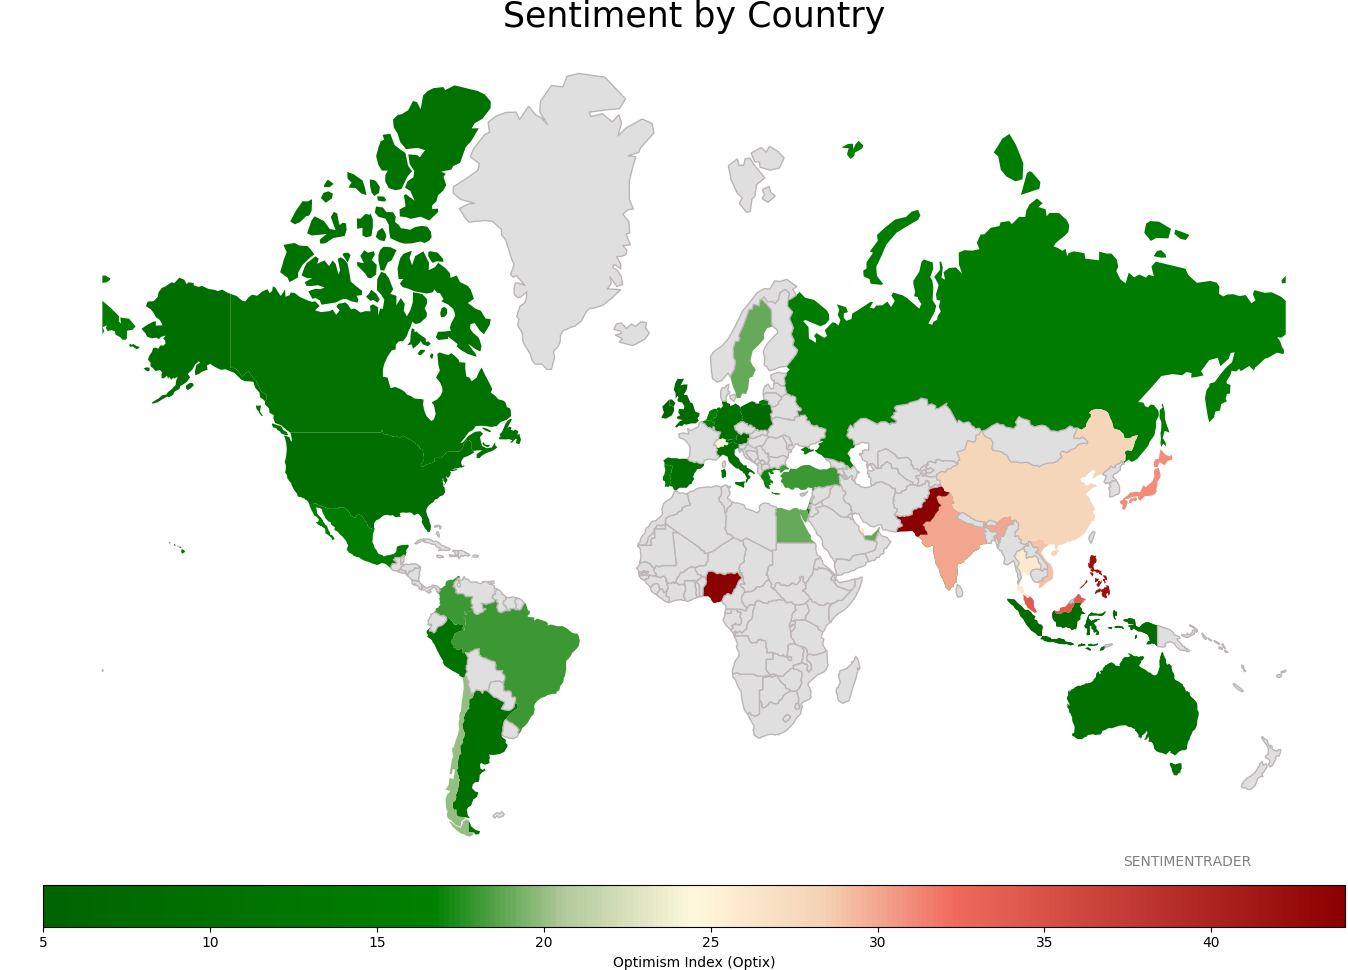
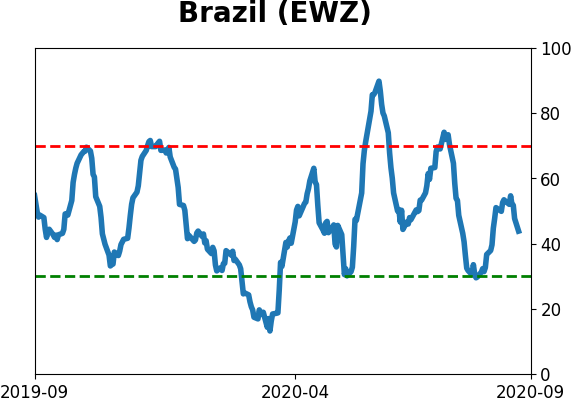
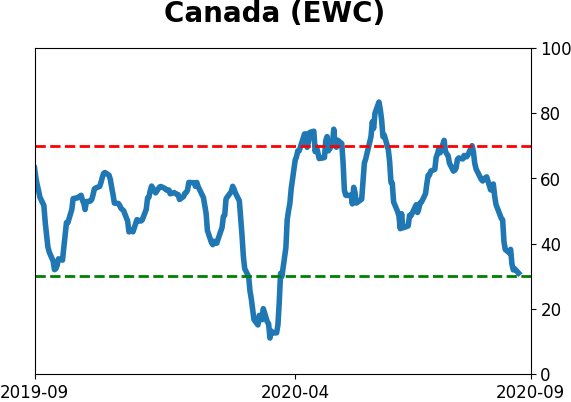
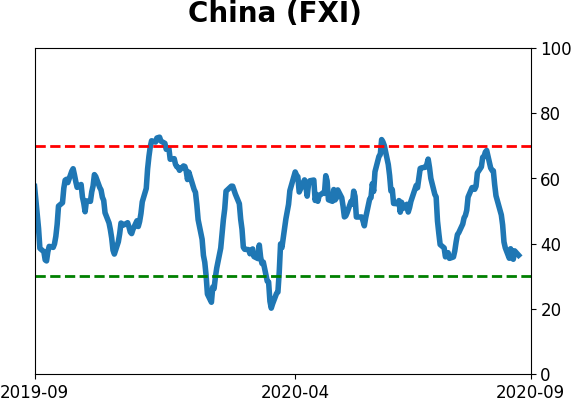
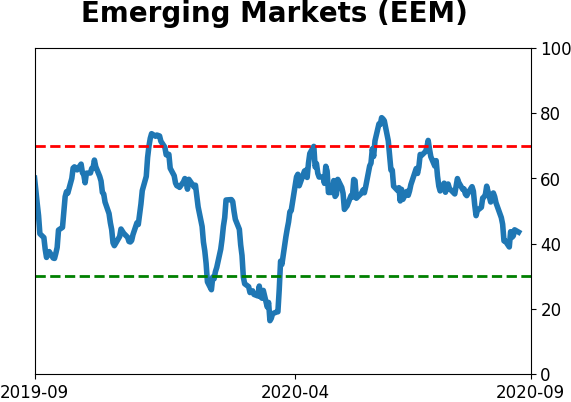
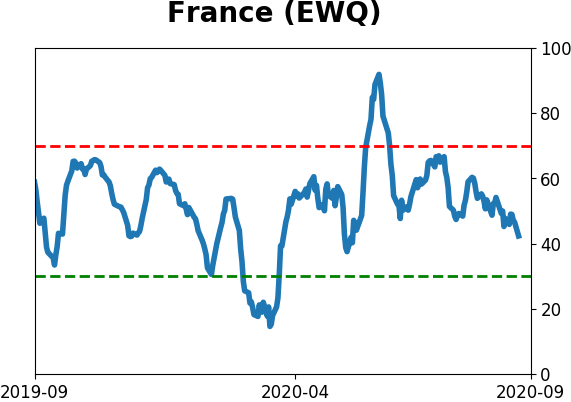
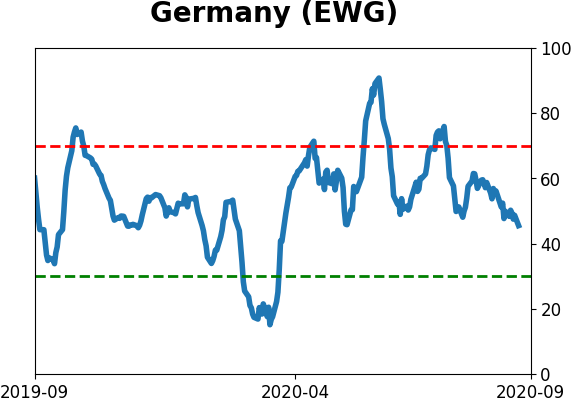
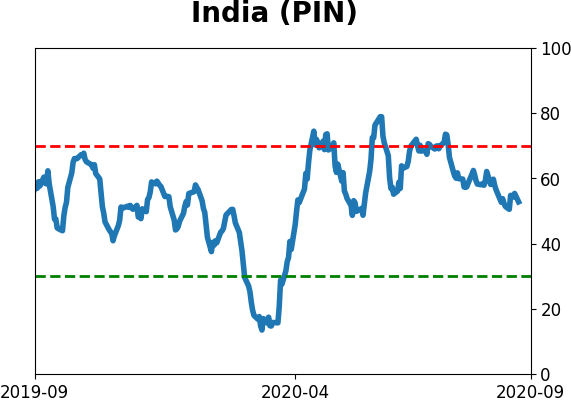
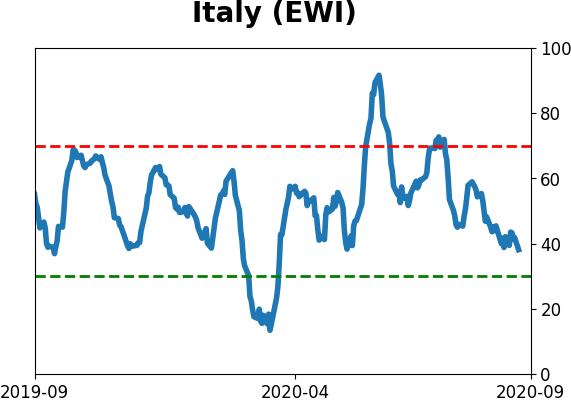
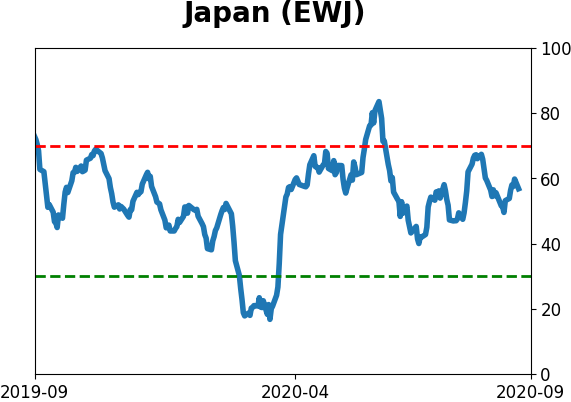
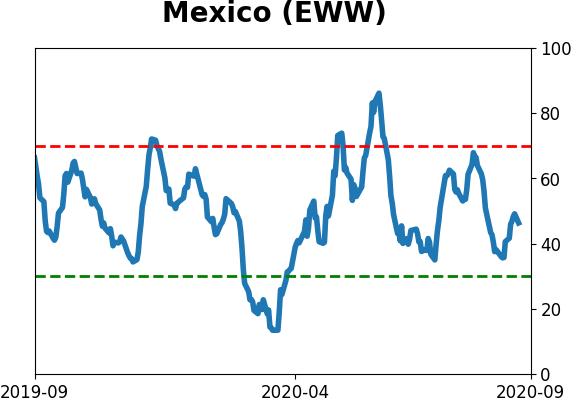
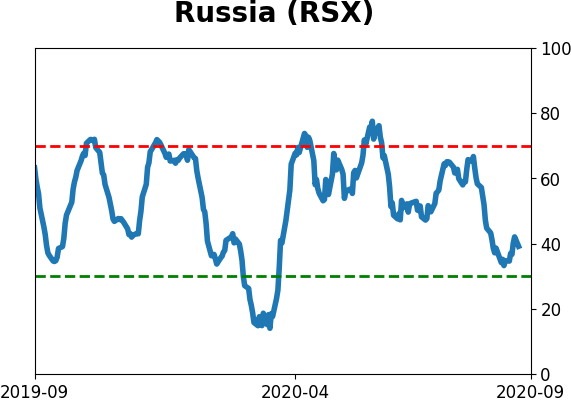
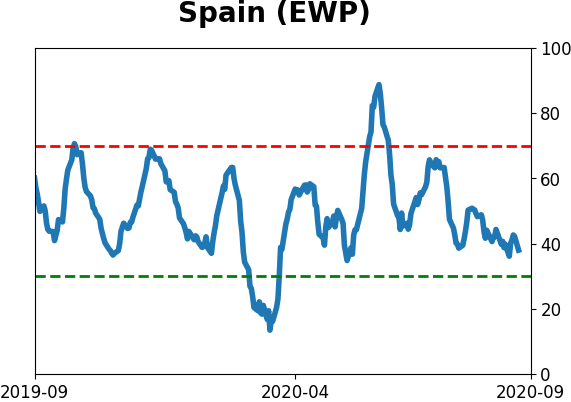
Sentiment Around The World
Optimism Index Thumbnails
|
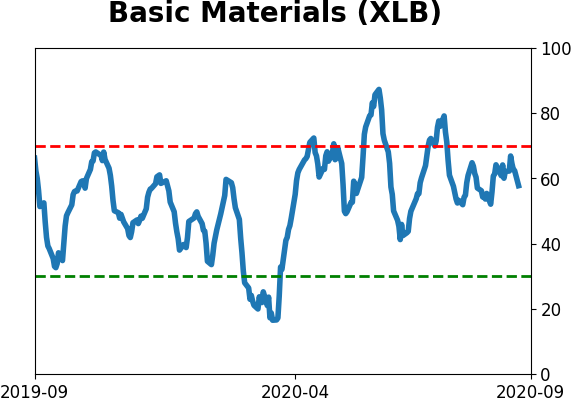
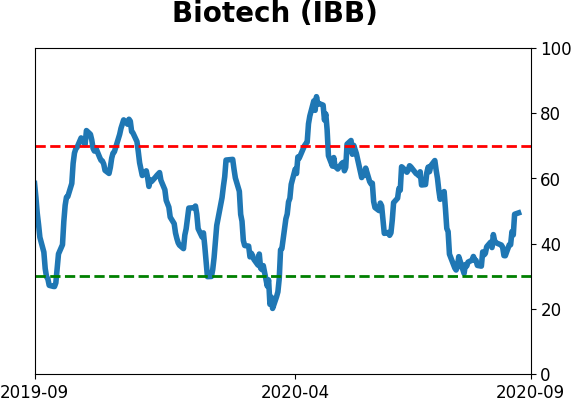
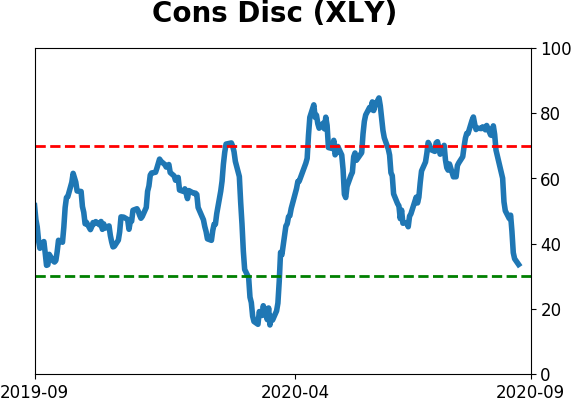
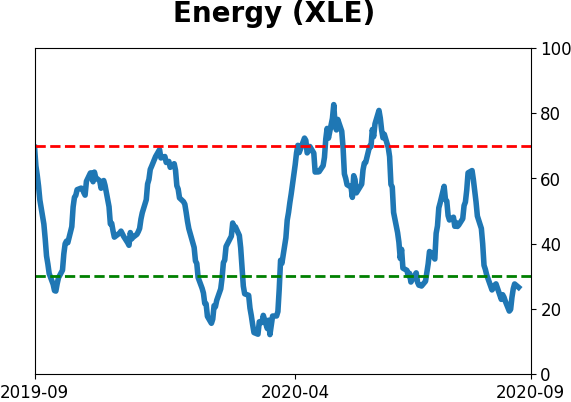
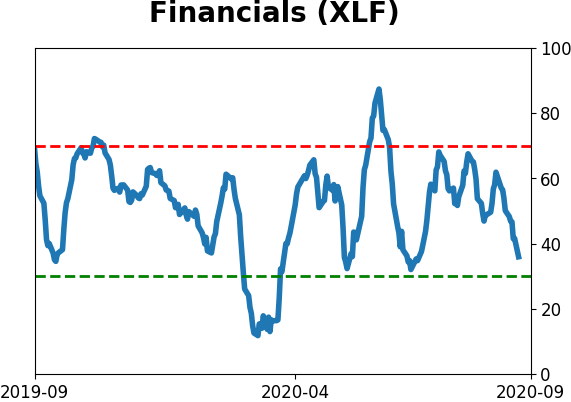
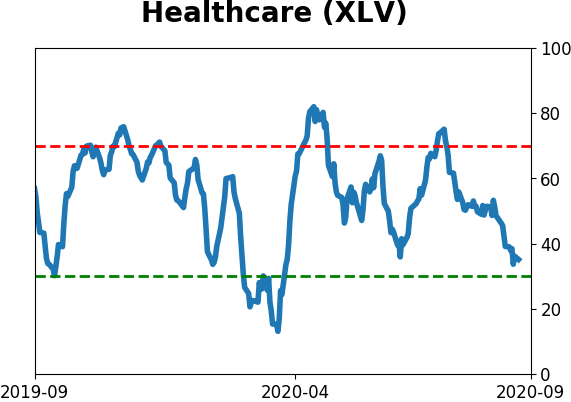
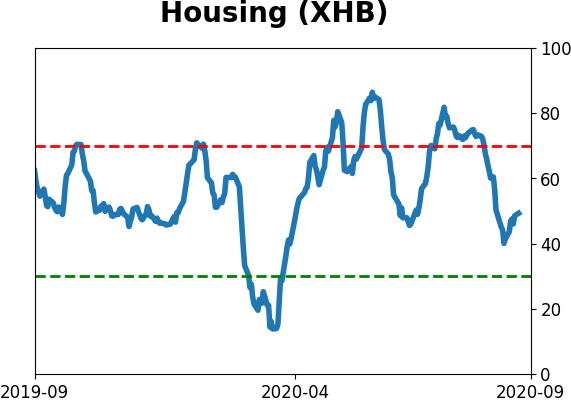
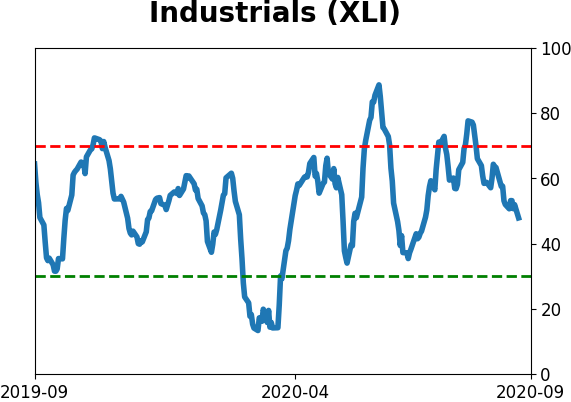
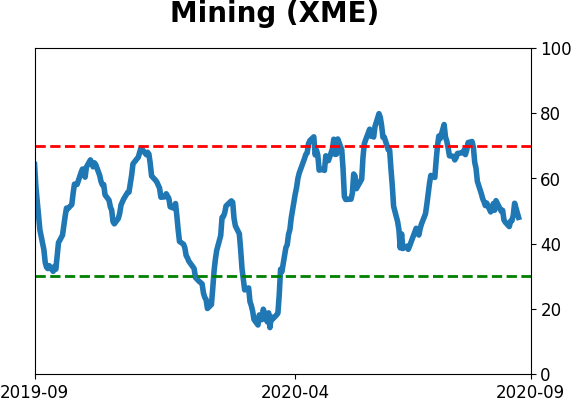
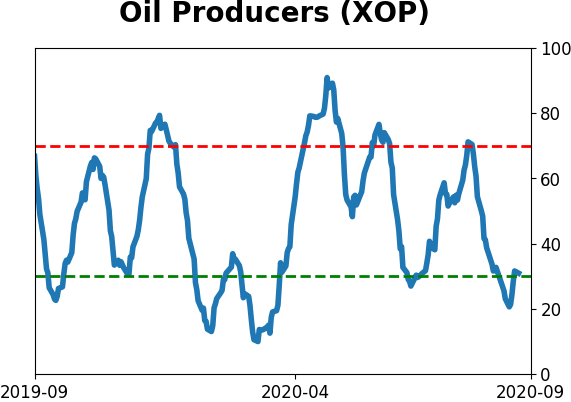
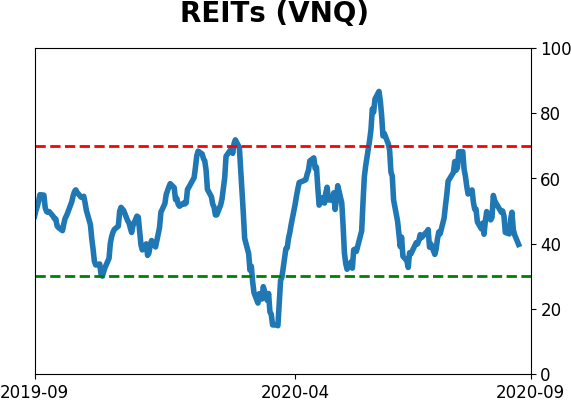
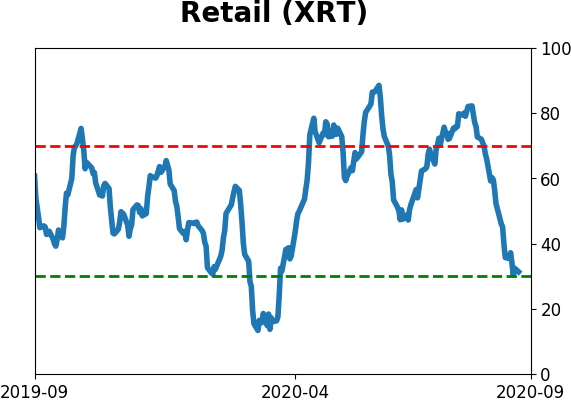
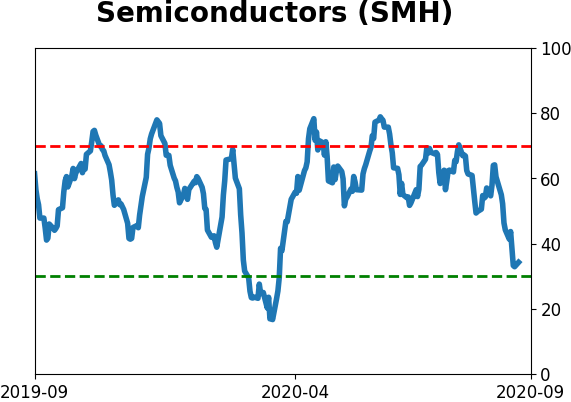
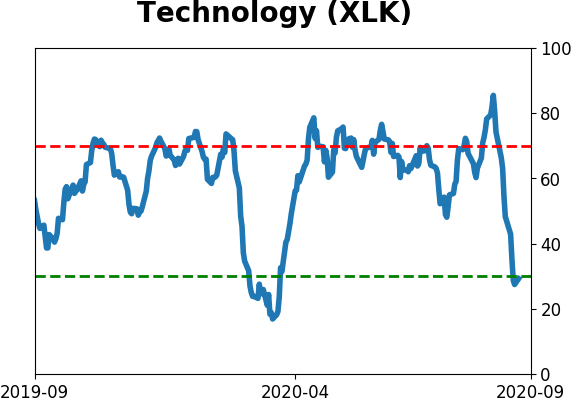
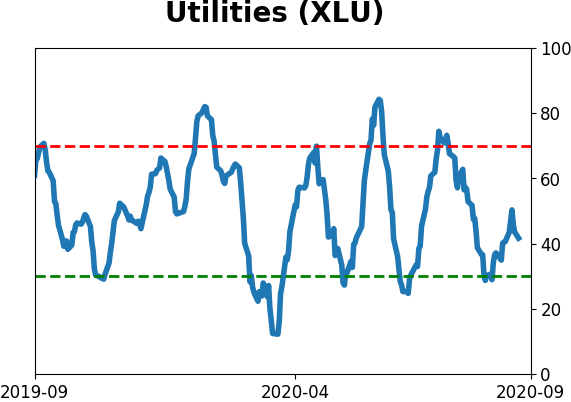
Sector ETF's - 10-Day Moving Average
|
|
|
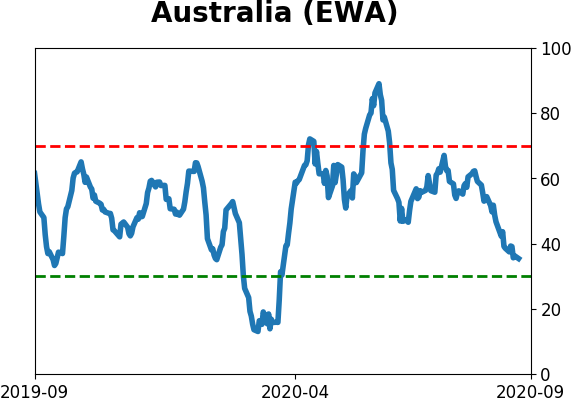
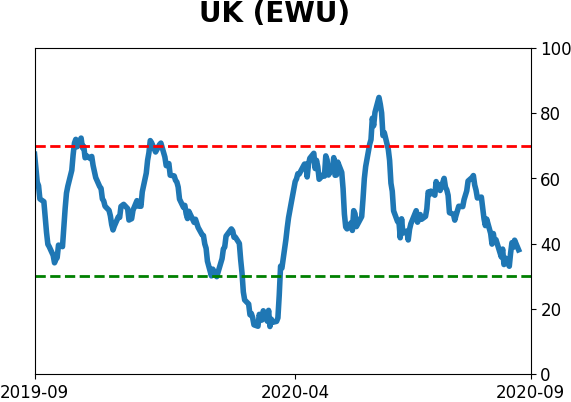
Country ETF's - 10-Day Moving Average
|
|
|
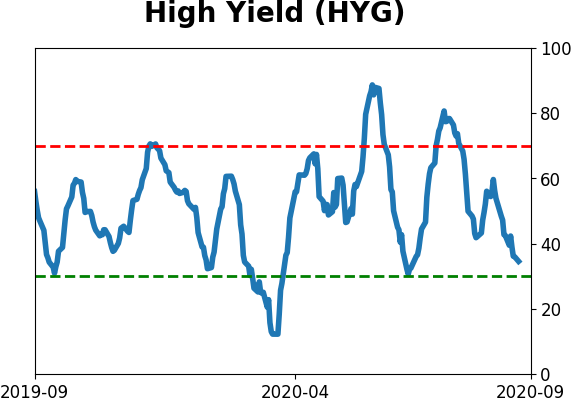
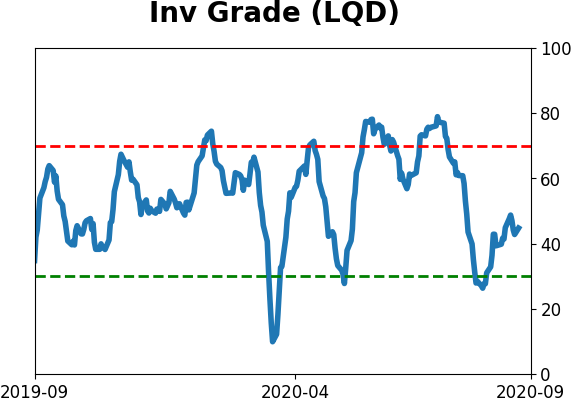
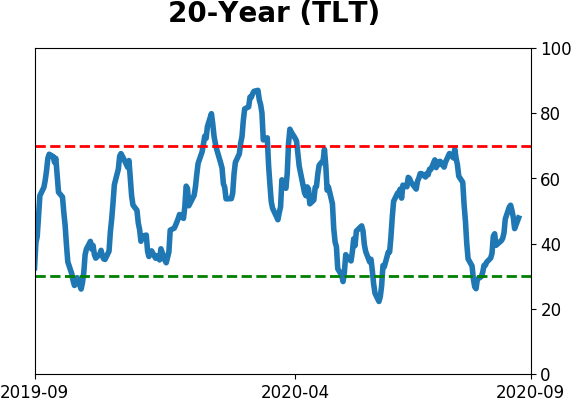
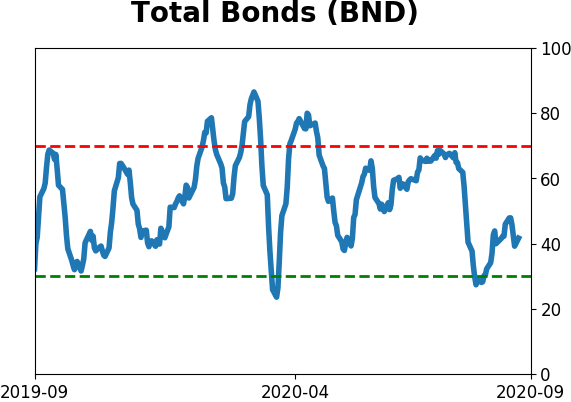
Bond ETF's - 10-Day Moving Average
|
|
|
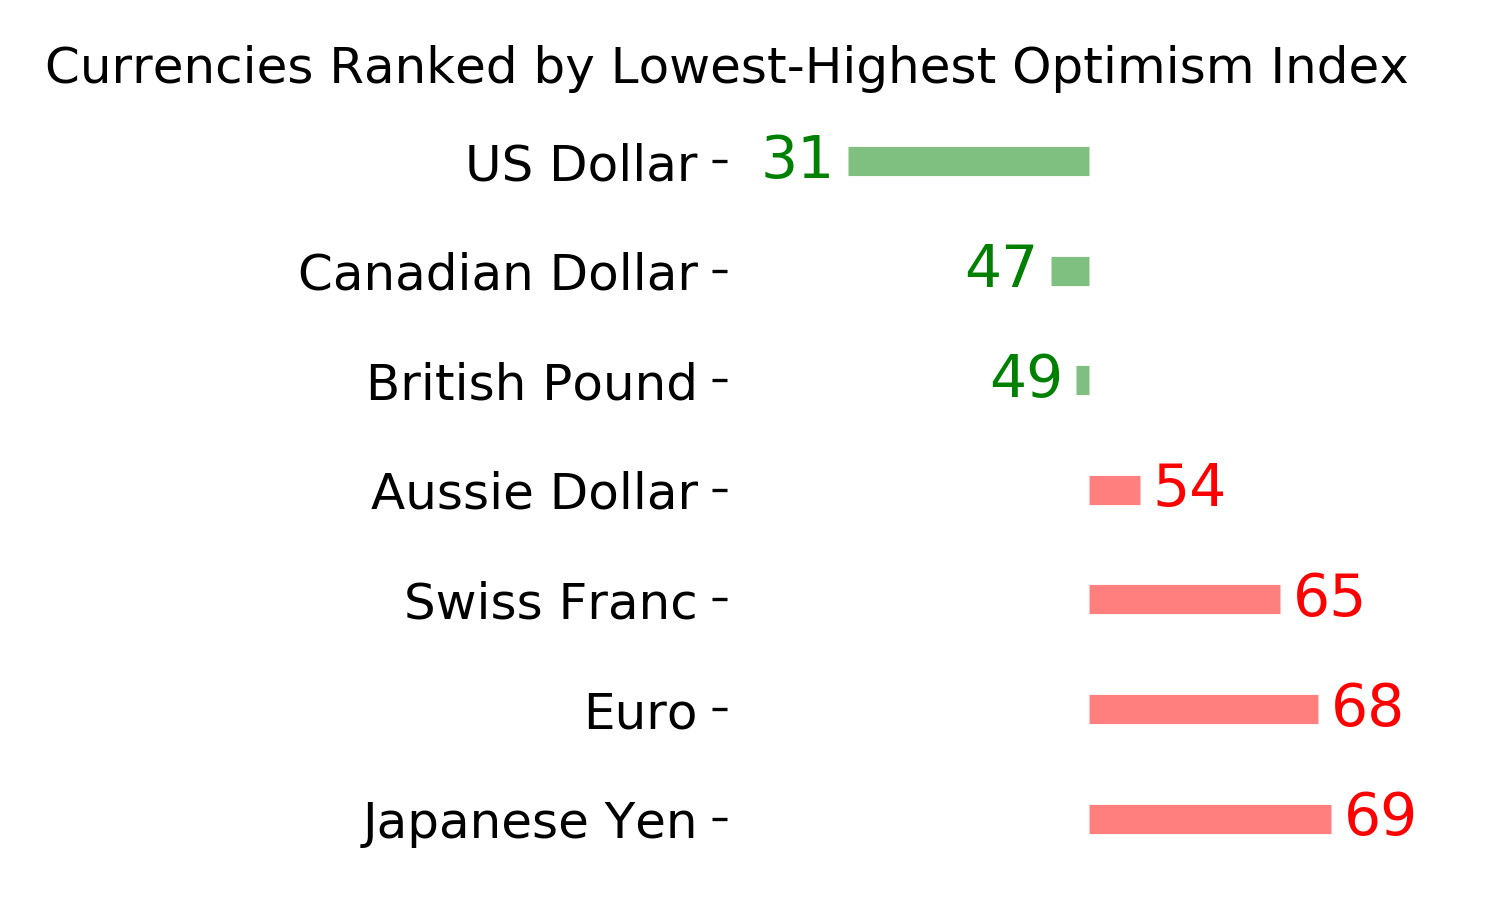
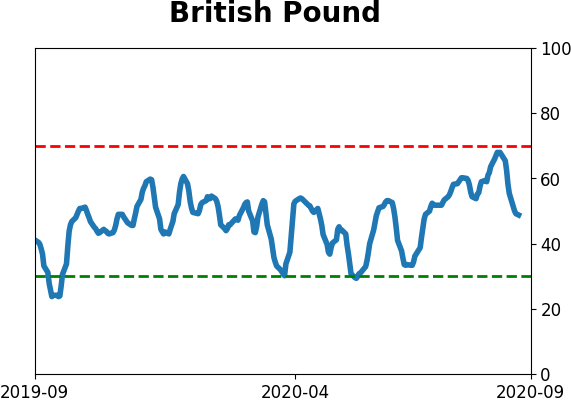
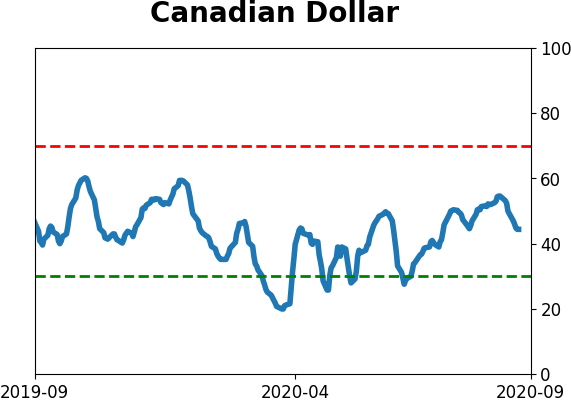
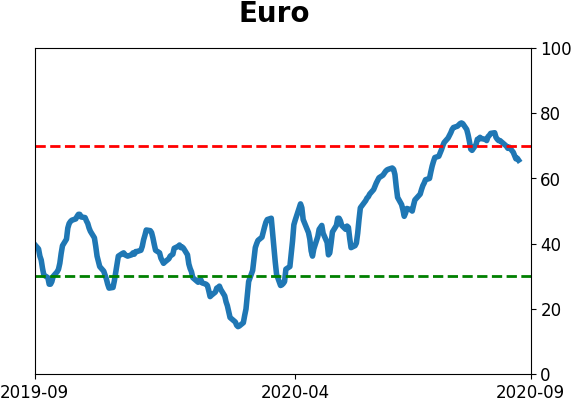
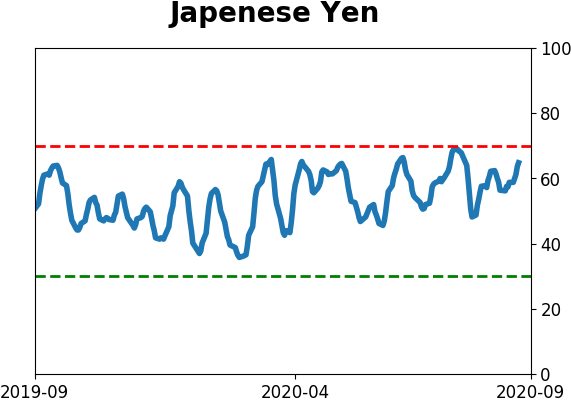
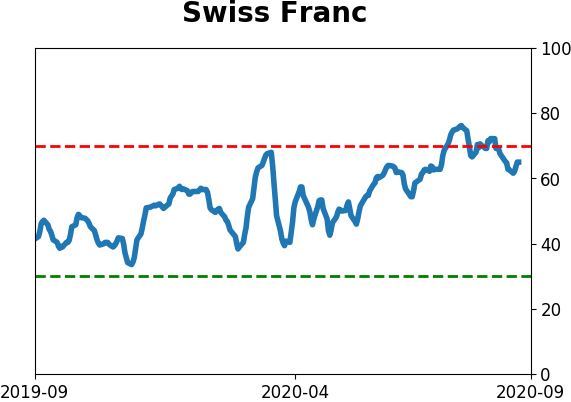
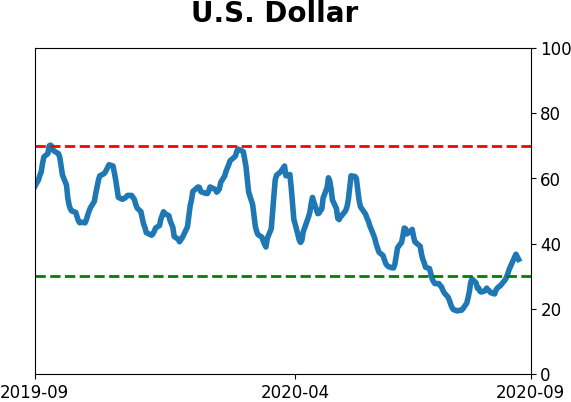
Currency ETF's - 5-Day Moving Average
|
|
|
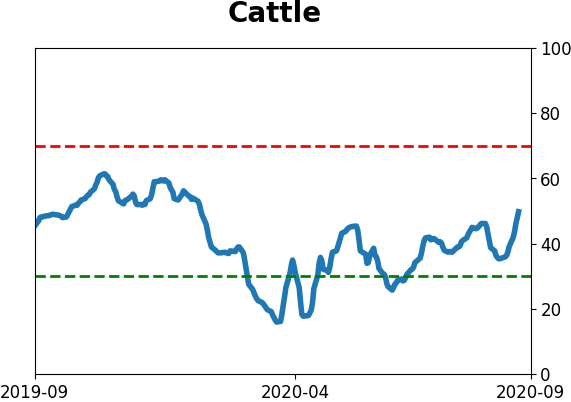
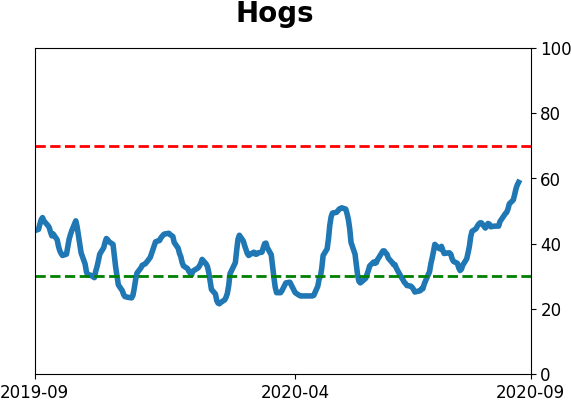
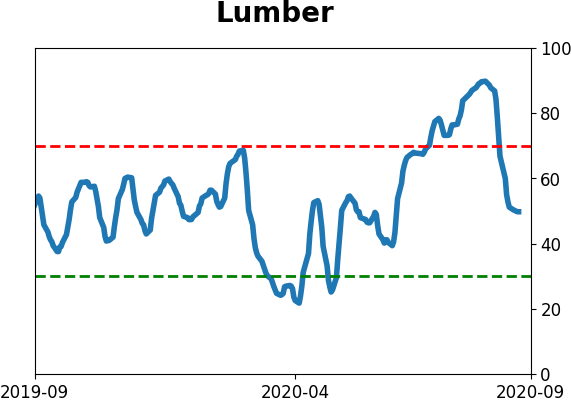
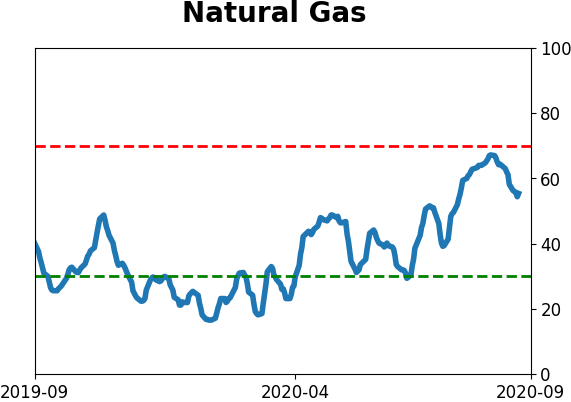
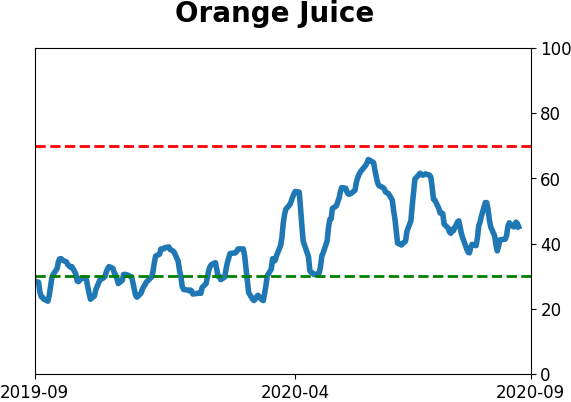
Commodity ETF's - 5-Day Moving Average
|
|