Headlines
|
|
Gold's triangle pattern will be key tell for miners:
Over the past 30 days, gold has not made a 30-day high OR a 30-day low. It's just kind of sat there, forming a consolidation 'triangle pattern' after setting new highs in August. Prior triangles typically resolved to the upside, but the next couple of weeks proved key. This is a big tell for miners, which are also consolidating after one of the most overbought readings in decades.
Thirst for IPOs remains unquenched:
Investors' receptions to IPOs have not diminished lately; they've picked up if anything. The immediate success of the Snowflake offering caused the number of IPO "run-ups" to reach a dozen, the most in 20 years. Other metrics show only 1999-2000 as a comparison, as unlikely as it would be to see a repeat of the aftermath.
The latest Commitments of Traders report was released, covering positions through Tuesday: The 3-Year Min/Max Screen shows that "smart money" hedgers, who have been heavily net long equity index futures for months, suddenly bought significantly more Nasdaq 100 contracts, in both the full and mini futures. The Backtest Engine shows that there have been 56 weeks in the past decade when hedgers held more of the long open interest than short open interest in the NDX mini contract. Three months later, QQQ was higher after 52 of those weeks, averaging 7.0%. This data has been curiously bullish for stocks since late March and it's getting even stronger. Elsewhere, hedgers were busy selling more coffee, natural gas, and soybeans. So far, the latter has been ignoring a big hedger short position, which is a change from recent history.
Bottom Line:
- Weight of the evidence had been suggesting high short- to medium-term risk so we'll see how traders react to the (slight, and short-term) pattern of a lower high and lower low in the S&P 500; still suggesting higher prices long-term
- Dumb Money Confidence was recently above 80% with evidence of skyrocketing speculation, typically a bad sign when combined with an unhealthy environment, though that's turning more neutral, and failures were approaching record length
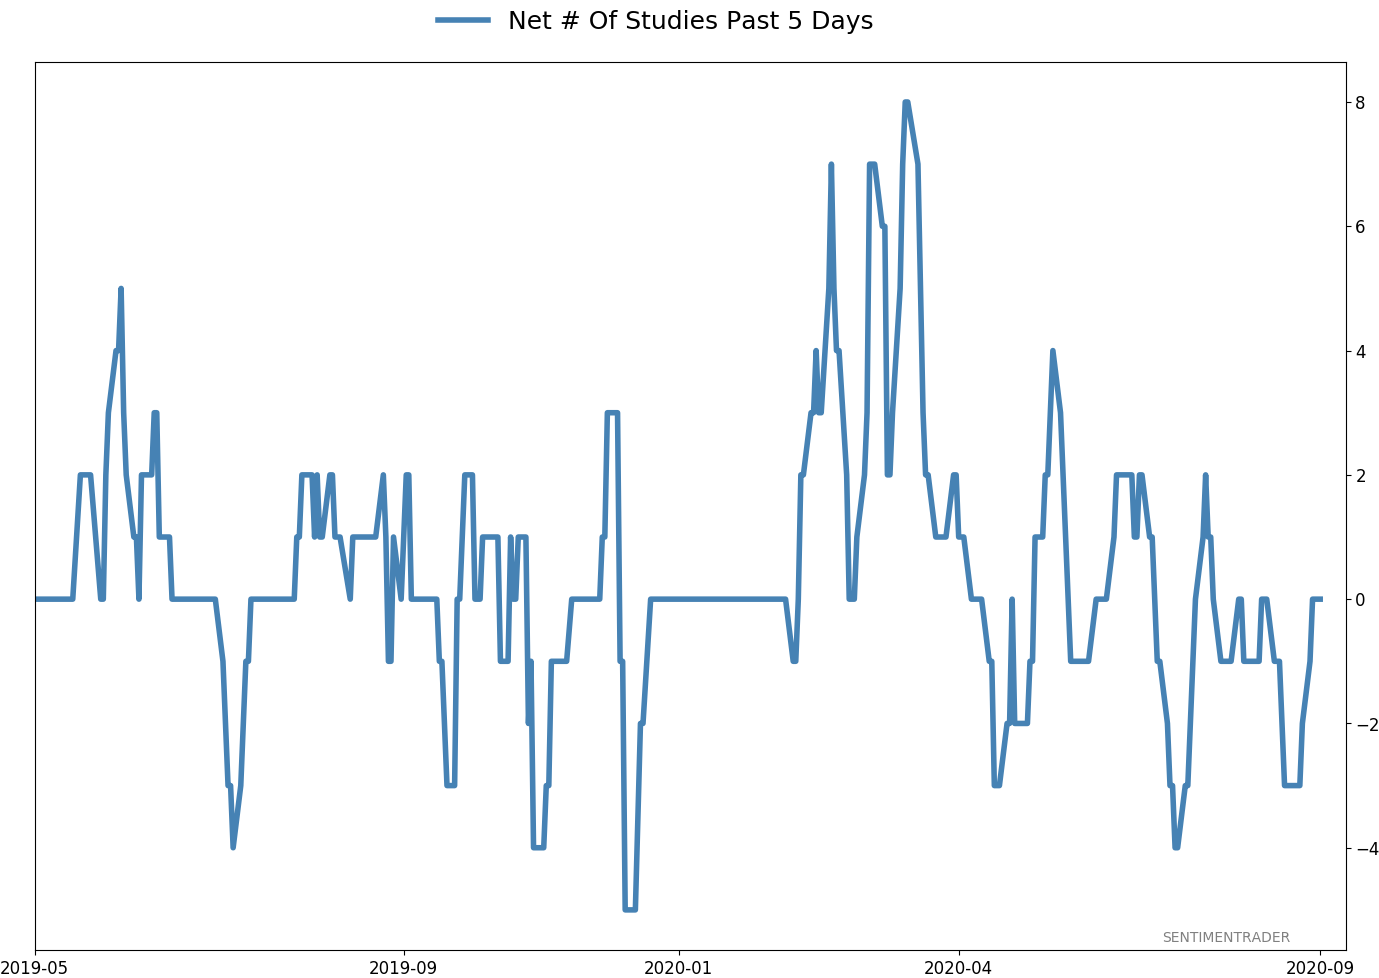
- Active Studies show a heavy positive skew over the longer-term mostly thanks to the March/April/May breadth thrusts, recoveries, and trend changes
- Signs of extremely skewed preference for tech stocks neared exhaustion by late June, especially relative to industrials and financials (here and here)
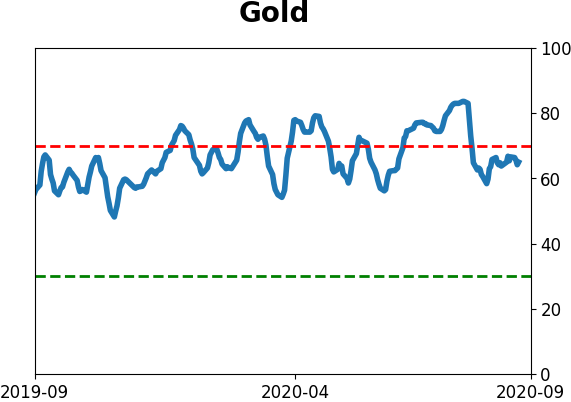
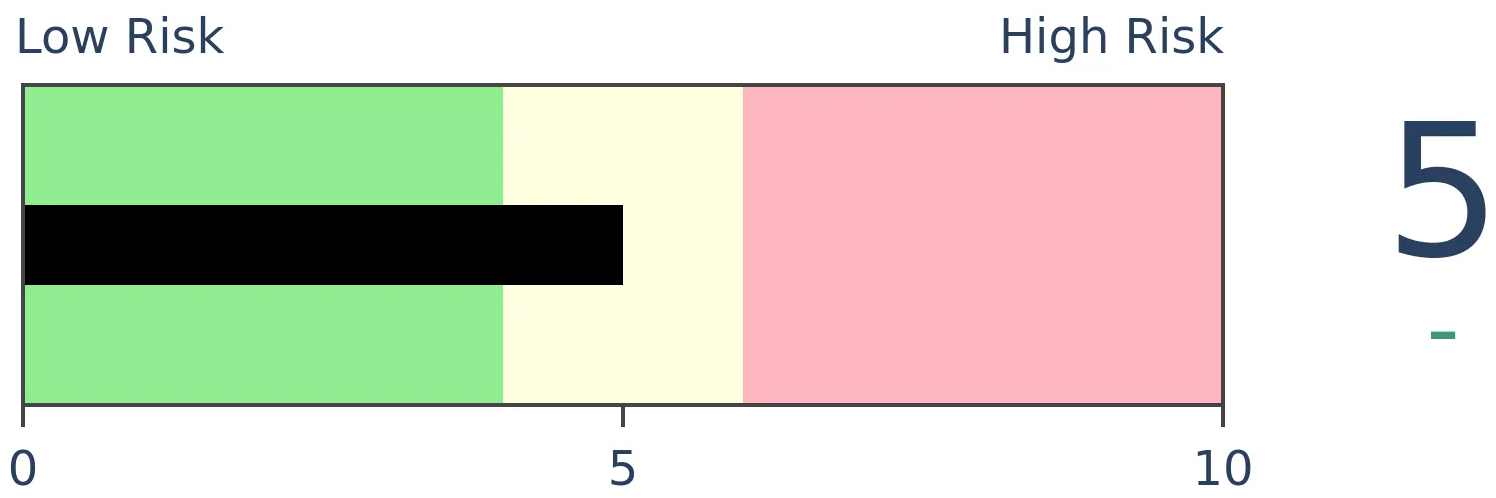
- Even though volatility has dropped to record lows, investor positioning in bonds has pushed the Risk Level to a very low level; gold has formed a triangle pattern of consolidation so a break there should be telling either way
|
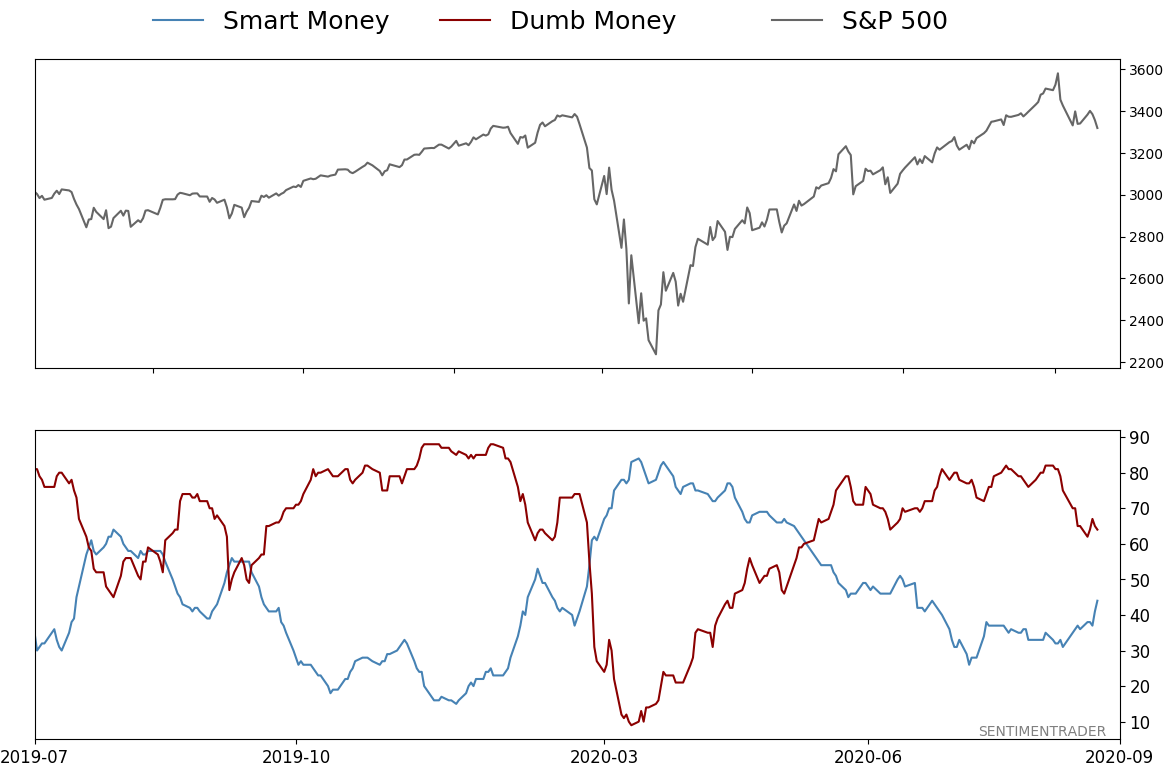
Smart / Dumb Money Confidence
|
Smart Money Confidence: 44%
Dumb Money Confidence: 64%
|
|
Risk Levels
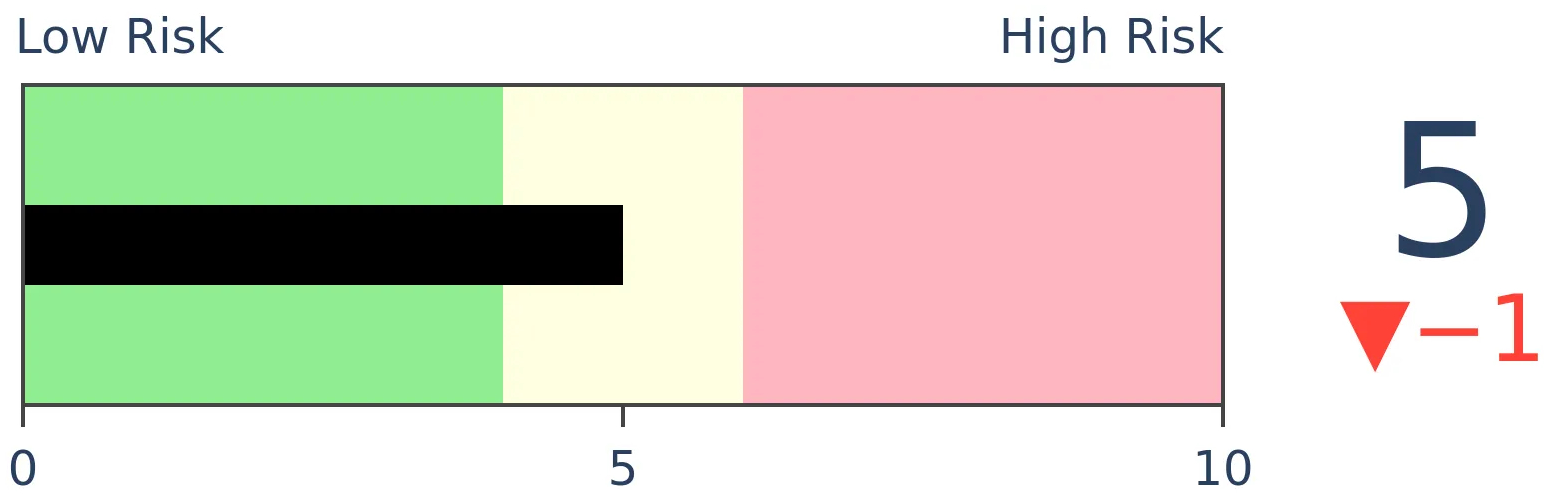
Stocks Short-Term
|
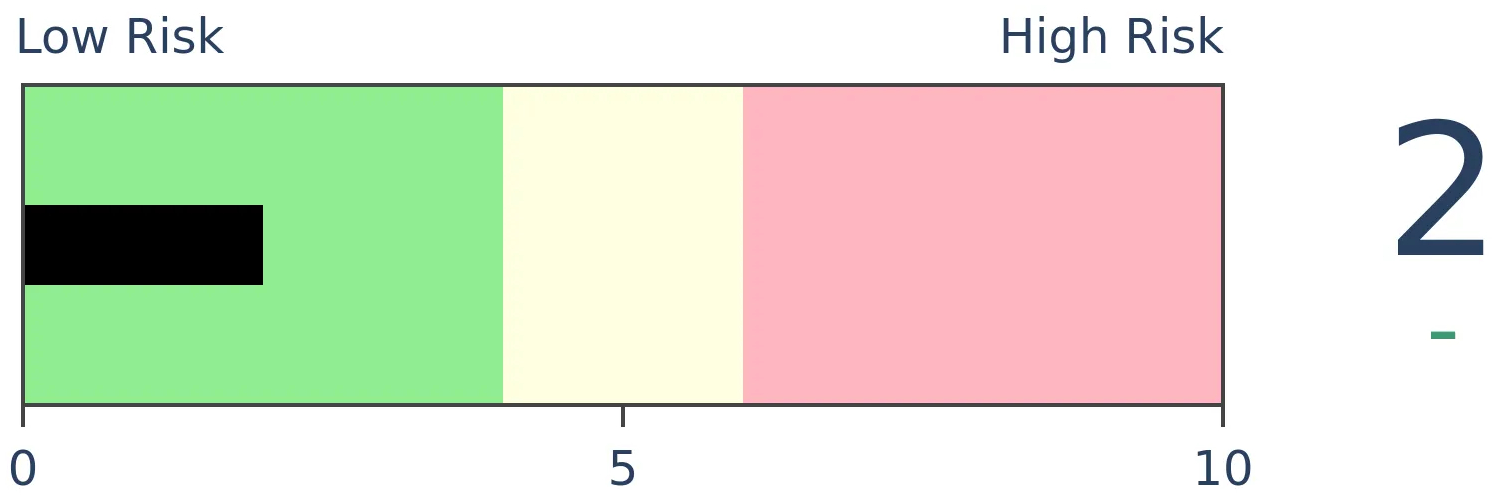
Stocks Medium-Term
|
|
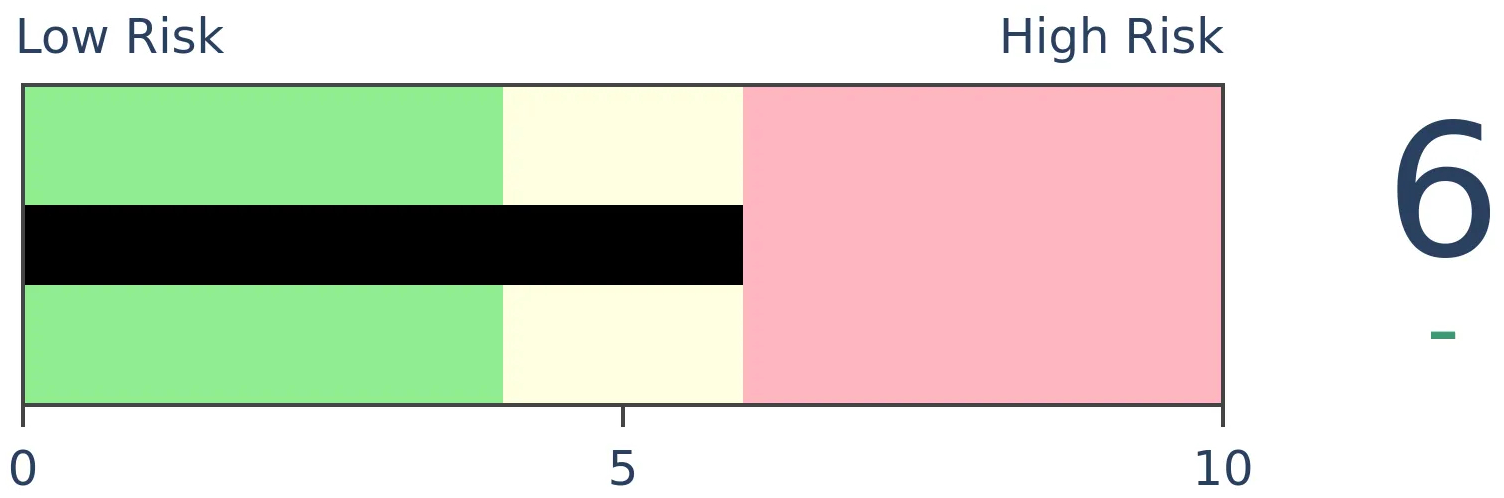
Bonds
|
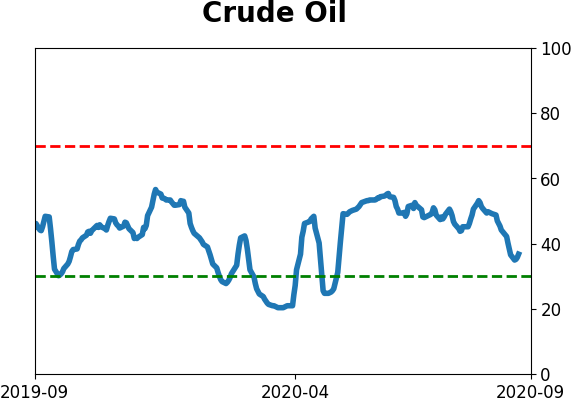
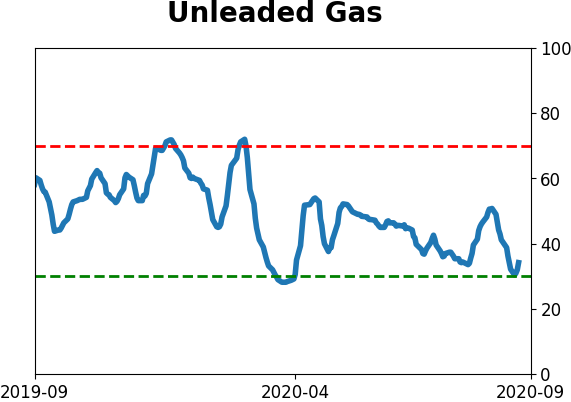
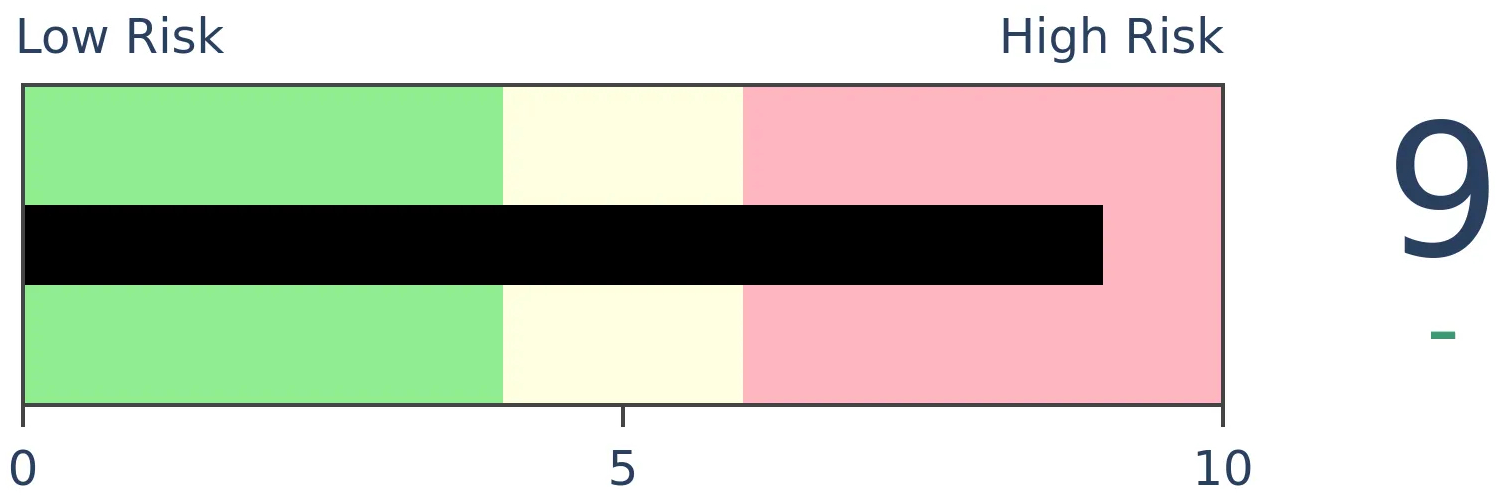
Crude Oil
|
|
Gold

|
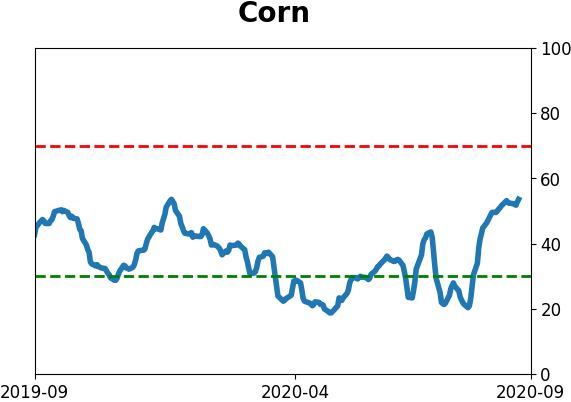
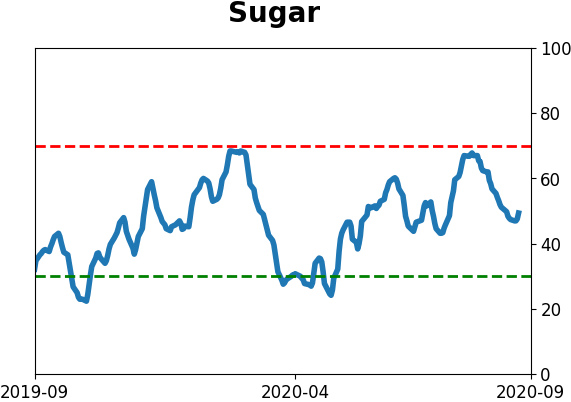
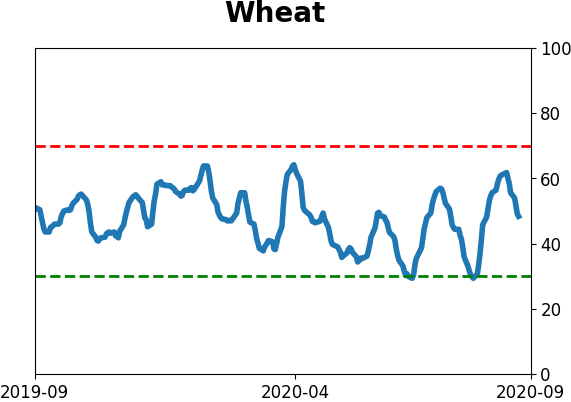
Agriculture
|
|
Research
BOTTOM LINE
Over the past 30 days, gold has not made a 30-day high OR a 30-day low. It's just kind of sat there, forming a consolidation 'triangle pattern' after setting new highs in August. Prior triangles typically resolved to the upside, but the next couple of weeks proved key. This is a big tell for miners, which are also consolidating after one of the most overbought readings in decades.
FORECAST / TIMEFRAME
None
|
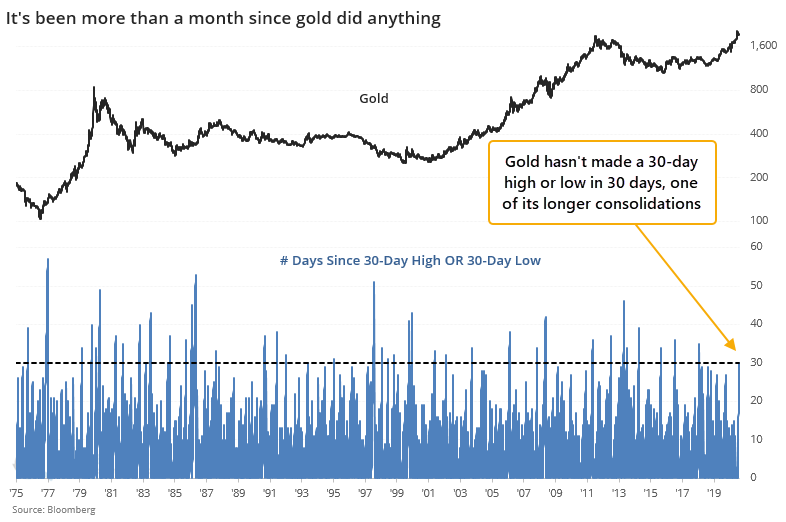
Gold hasn't done anything for more than a month. It gets derided as a "pet rock" because it has limited use for most investors, doesn't have any earnings, and doesn't pay any interest. For the past 30 days, it's lived up to its name.
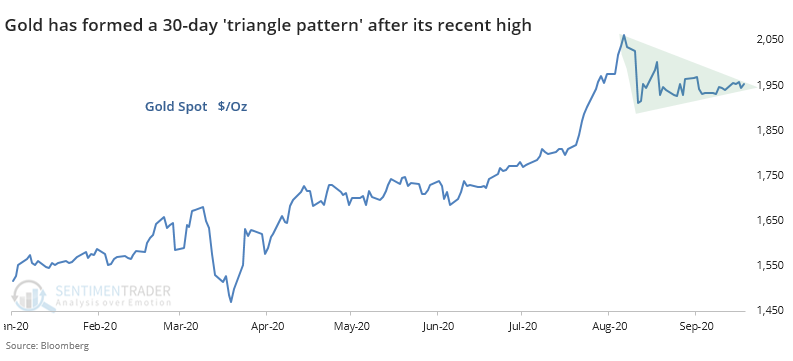
Since peaking on August 6, gold has gone into consolidation mode. It hasn't set a 30-day high OR a 30-day low in 30 sessions now.
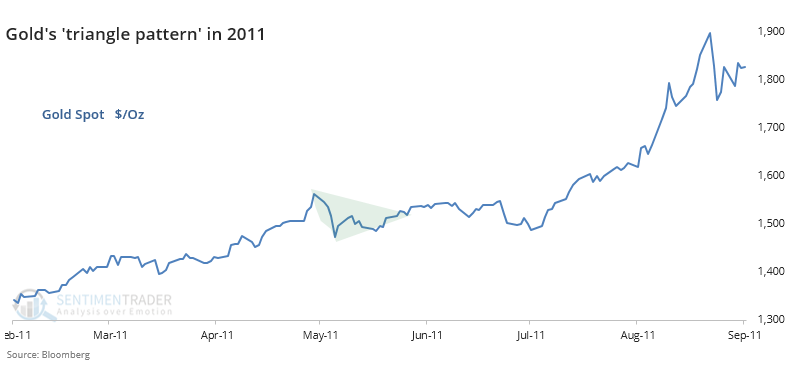
This is what's commonly referred to as a "triangle pattern" because, well, it looks like a triangle.
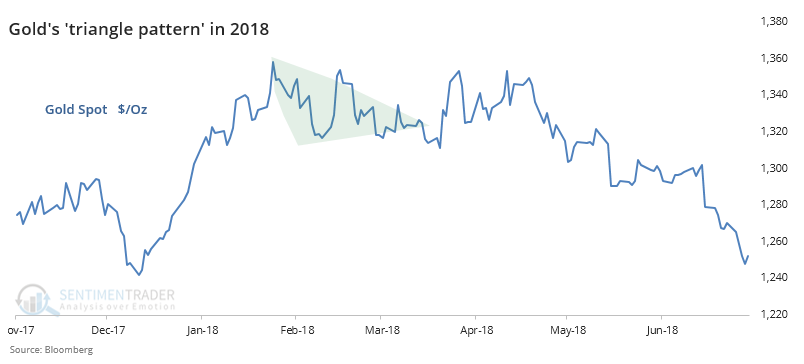
This happened in 2018 after a run-up in gold, too, and that didn't work out so well.
Neither did the one prior to that, in 2016.
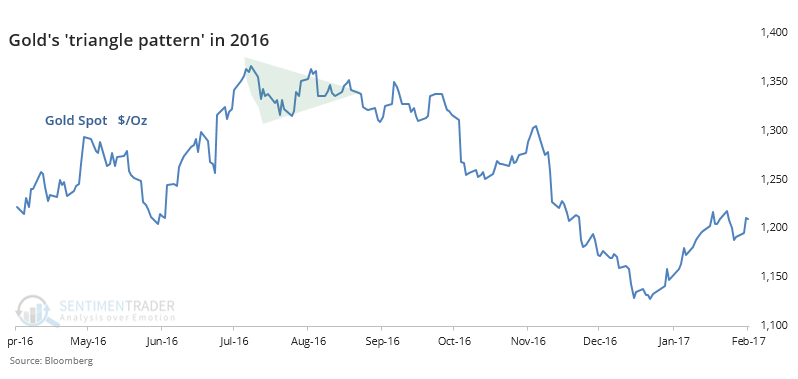
We'd have to go back to 2011 to see that last positive resolution of this pattern for the yellow metal.
Instead of subjectively eyeballing chart patterns, let's go back to 1975 and look for every time when gold hit a 52-week high, then failed to set either a 30-day high or a 30-day low for 30 days. It rallied to a new high, then just sat there.
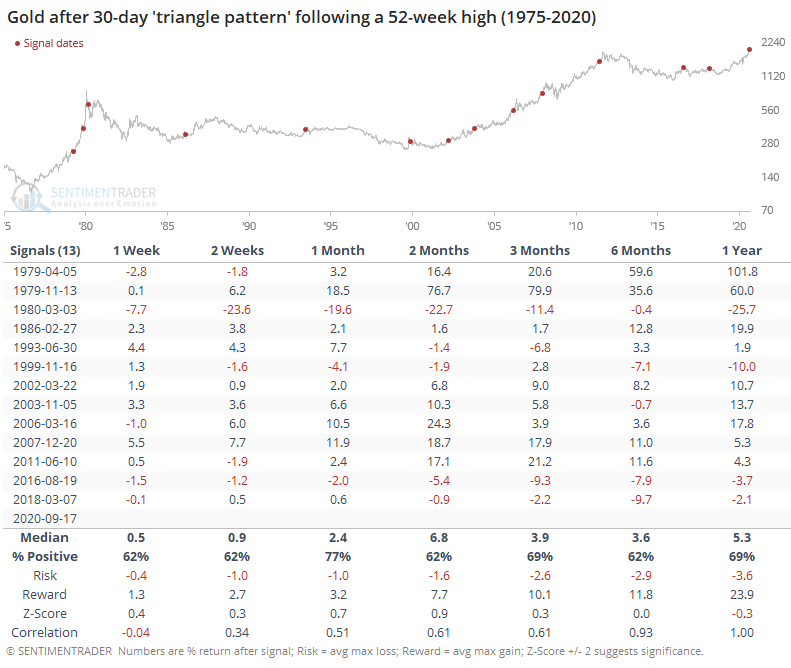
Mostly, gold resolved these patterns by breaking out to the upside. Over the next 3 months, it was higher 69% of the time, with an excellent risk/reward ratio.
The last row in the table, titled "Correlation", shows the relationship between that time frame's median return and the median return 1 year later. It shows us there was a slight tendency to see a fakeout over the next week, but gold's returns over the next 2-4 weeks gave us a decent hint at what returns over the next year would look like.
In an earlier premium note, Troy looked at this in a different way, using the expansion and contraction in gold's Bollinger Bands, a measure of volatility. Those future returns were poor, mainly because most of the signals triggered during bear markets. That's a bit of a concern, and it would be as well if gold breaks down out of this triangle pattern in the weeks ahead. History suggests it has a decent probability of heading higher, but buyers need to prove they have enough optimism to push it outside its recent consolidation zone.
Because gold had been doing well, miners were as well. Over the past 20 days, an average of more than 97% of gold mining stocks have held above their 200-day moving averages. That's among the best performances in nearly 30 years. The problem for the miners is they've never really been able to sustain this kind of momentum.
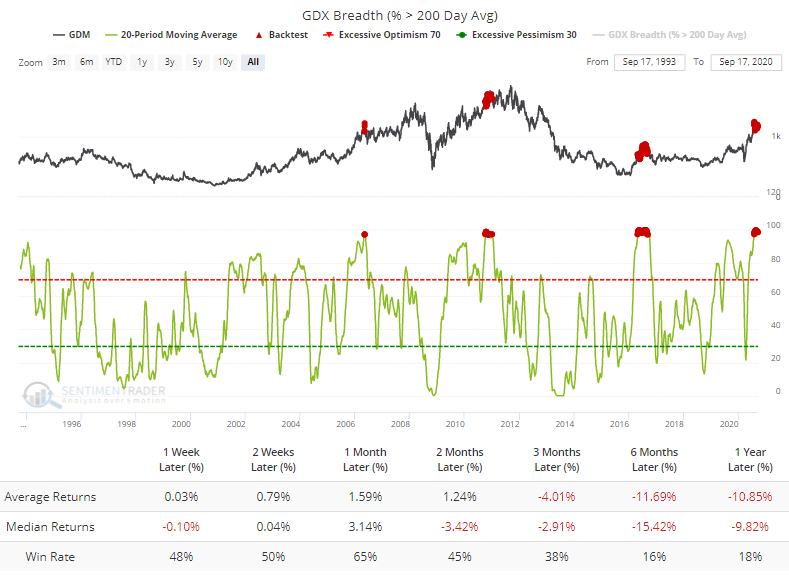
The Backtest Engine shows that miners have not been able to tack on many gains following these signals. Over the next 6 months, their returns were horrid.
The other breadth metrics we follow for the miners are mostly good and not necessarily extreme.
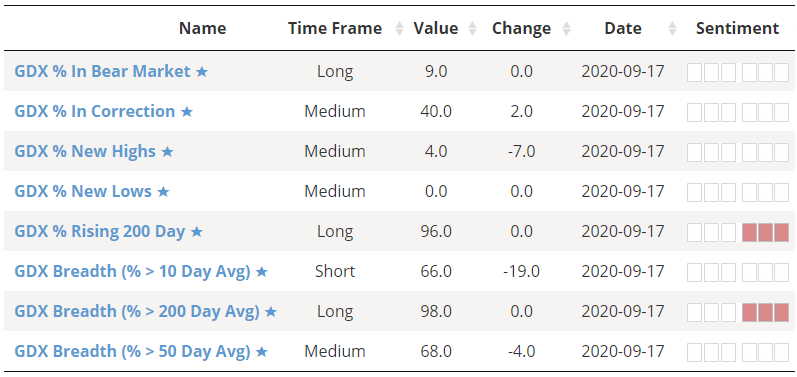
While only 4% of them just hit a 52-week high, recently that had been more than 80%, a rarely-achieved feat of coordinated buying interest in the sector. Like we saw with how many of them were above their 200-day averages, though, these companies have not had much success at maintaining this kind of upside momentum as a group.
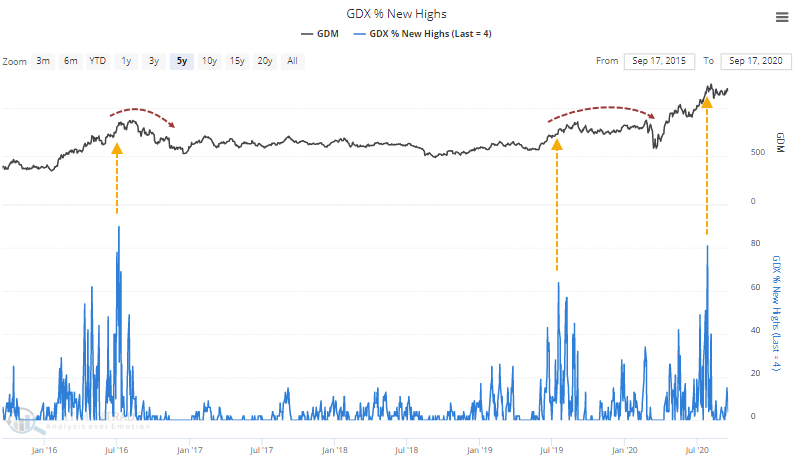
Whichever way gold breaks from its triangle pattern in the weeks ahead will almost certainly determine the fate of the miners as well. History hasn't been very kind after showing the kinds of moves they've enjoyed in recent months, so bulls have to hope that this time is different.
BOTTOM LINE
Investors' receptions to IPOs have not diminished lately; they've picked up if anything. The immediate success of the Snowflake offering caused the number of IPO "run-ups" to reach a dozen, the most in 20 years. Other metrics show only 1999-2000 as a comparison, as unlikely as it would be to see a repeat of the aftermath.
FORECAST / TIMEFRAME
None
|
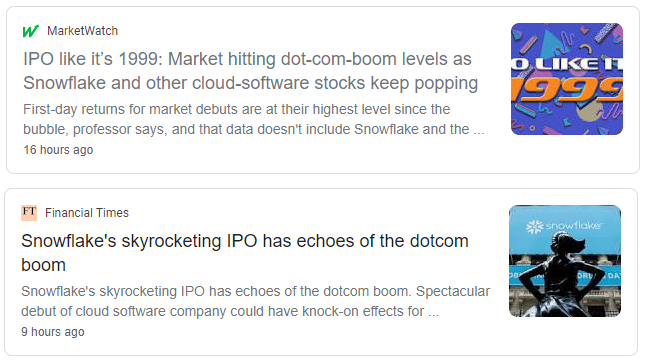
Thanks to near-hyperactive excitement over Snowflake's IPO - heck, even Warren Buffett got in on the action - the market for initial public offerings has continued its torrid pace.
The behavior surrounding some of these issues are certainly reminiscent of 20 years ago. I had a courtside seat to retail trading activity in 1999, and some of this week's headlines could just as easily have been from then. The immediate wealth and yet "money left on the table" were huge themes leading up to that peak.
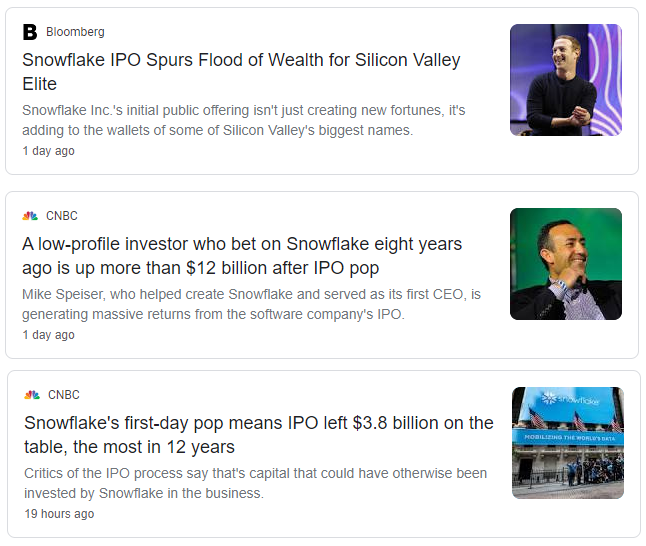
The biggest knock against a 1999 repeat, among many other differences, is simply that we already lived through it and recognize it.
Like Federal Reserve actions during the pandemic took lessons from previous crises, some bankers, founders, and investors don't wish to repeat a crash-and-burn. They're not all money-grubbing, fleece-the-public moguls - most would prefer to capitalize on a welcoming market, but only if it means lasting success.
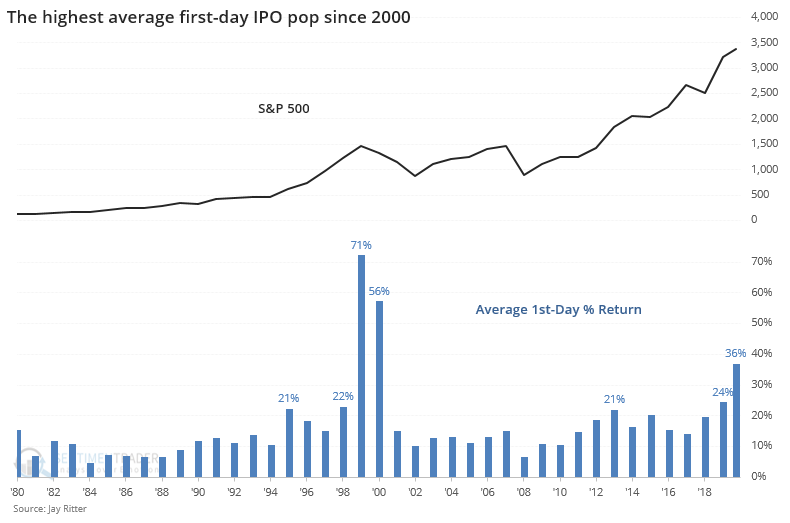
It's not necessarily the number of IPOs that's notable, anyway. It's the amount raised, and the reactions. According to Jay Ritter, Snowflake's reception was the 12th "run-up", or first-day doubling, of 2020. Through this many days of the year, 2020 ranks #3 in the past 40 years, behind (very far behind) 1999 and 2000.
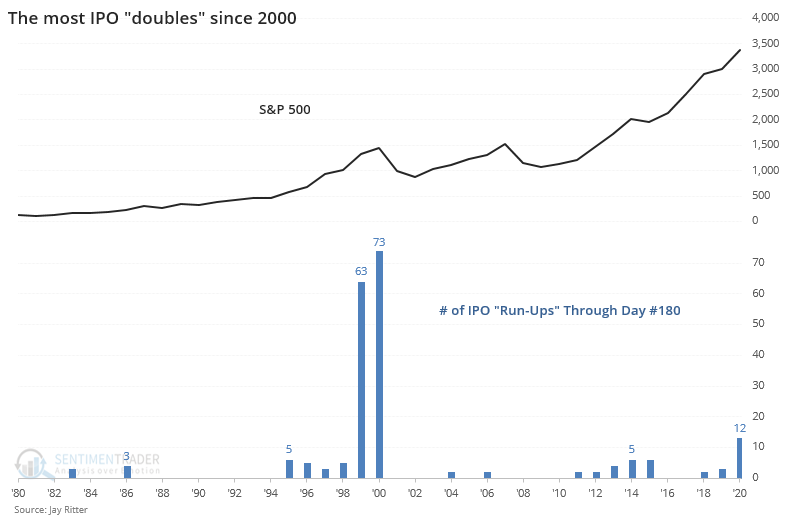
The doubles get most of the attention, but they're not alone. The average IPO has added more than a third to its stock price on the first day. This is through August. Preliminary figures through yesterday suggest this will move upwards of 40%. Again, only 1999-2000 exceeded this kind of investor reception. Of course, there are still several months left in the year so the full-year figure could change drastically depending on the market environment.
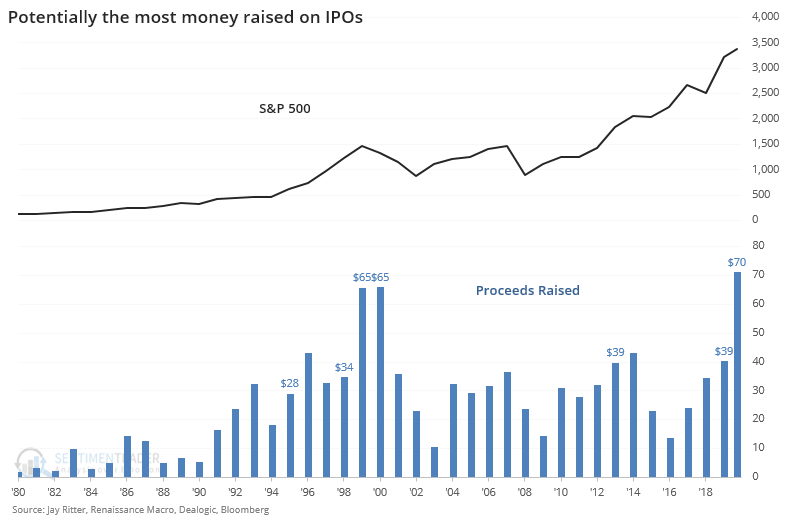
Proceeds raised in 2020 may set a record, but this comes with some caveats. IPO data is kind of like that for corporate insiders - there are a lot of wrinkles, and different firms calculate the data differently, so it may not compare to other sources.
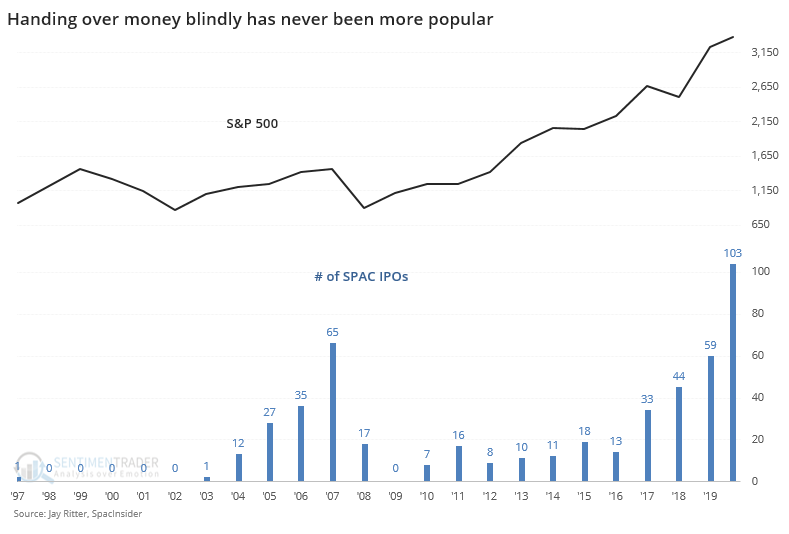
Investor appetite like this, especially considering that it includes a record number of blank-check SPAC companies that are pure speculation, is a definite concern.
It many respects, it's nothing like 1999-2000, as that was a pure all-out bubble. This is not. This is simply a very welcoming market that is starved for action with new blood. That can be a healthy thing long-term. It's more worrisome over a 6-12 month time frame, as history has proven that years with such aggressive speculative activity provide lower returns for investors going forward.
Active Studies
| Time Frame | Bullish | Bearish | | Short-Term | 0 | 1 | | Medium-Term | 1 | 12 | | Long-Term | 47 | 2 |
|
Indicators at Extremes
Portfolio
| Position | Weight % | Added / Reduced | Date | | Stocks | 15.2 | Reduced 4.2% | 2020-09-03 | | Bonds | 30.0 | Added 30% | 2020-09-09 | | Commodities | 2.4 | Reduced 2.1%
| 2020-09-04 | | Precious Metals | 5.0 | Added 5% | 2020-09-09 | | Special Situations | 4.9 | Added 5.1% | 2020-09-03 | | Cash | 42.5 | | |
|
Updates (Changes made today are underlined)
After stocks bottomed on March 23rd, they enjoyed a historic buying thrust and retraced a larger amount of the decline than "just a bear market rally" tends to. Through June, there were signs of breadth thrusts, recoveries, and trend changes that have an almost unblemished record at preceding higher prices over a 6-12 month time frame. On a shorter-term basis, our indicators have been showing high optimism, with Dumb Money Confidence recently above 80%, along with signs of reckless speculation during what appears to be an unhealthy market environment, historically a bad combination. While there are certainly some outlier indicators that are showing apathy or even outright pessimism, a weight-of-the-evidence approach suggests high risk over a multi-week to multi-month time frame. That has been the case since July, even arguably June and yet the major indexes hit continual new highs through late August. With the indicators and studies failing to precede any weakness, I've been hesitant to lower my already-low exposure. I am getting increasingly anxious about the oddities we're seeing, though, and lowered it again. This account is mostly about comfort with risk for me, and right now I'm not at all comfortable with any of it. In more than 25 years of experience, this is the oddest market I've ever seen. I lowered exposure again - likely the lowest I'm willing to go at this point given longer-term positives - and decided to switch to an equal-weight version of the S&P 500 index. I've become intensely uncomfortable with the concentration in the cap-weighted index. Our studies have been mixed with regard to the potential for the equal-weight version to outperform the cap version going forward, so historical support isn't overwhelming. I'm also increasingly interested again in energy stocks, starting with a small allocation. I got burned in March with the unprecedented geopolitical spat that hammered those stocks then but the longer-term setup is decent. In this account, I’ve roughly followed what has become known as the All Weather portfolio popularized by Ray Dalio. It allocates across four broad assets, designed to hold up no matter the market environment. The goal is modest positive returns while limiting large, sustained losses. I typically use popular ETFs, with low costs. At times, I will swap out for a fund I believe has better prospects, or simply lower fees if not. At other times, I will diverge quite a bit from baseline allocations, largely depending on the indicators and studies we discuss on the site. I've gotten away from this in the past, using "cash" as a substitute for "bonds" and with rates stuck at 0%, that has become less appetizing. I'm trying to get back more toward the baselines with less dramatic swings in either direction. The base allocation I use is the following: Stocks: 35%
Bonds: 45%
Precious Metals: 7.5%
Commodities: 7.5%
Cash / Special Opportunities: 5%
RETURN YTD: -0.6% 2019: 12.6%, 2018: 0.6%, 2017: 3.8%, 2016: 17.1%, 2015: 9.2%, 2014: 14.5%, 2013: 2.2%, 2012: 10.8%, 2011: 16.5%, 2010: 15.3%, 2009: 23.9%, 2008: 16.2%, 2007: 7.8%
|
|
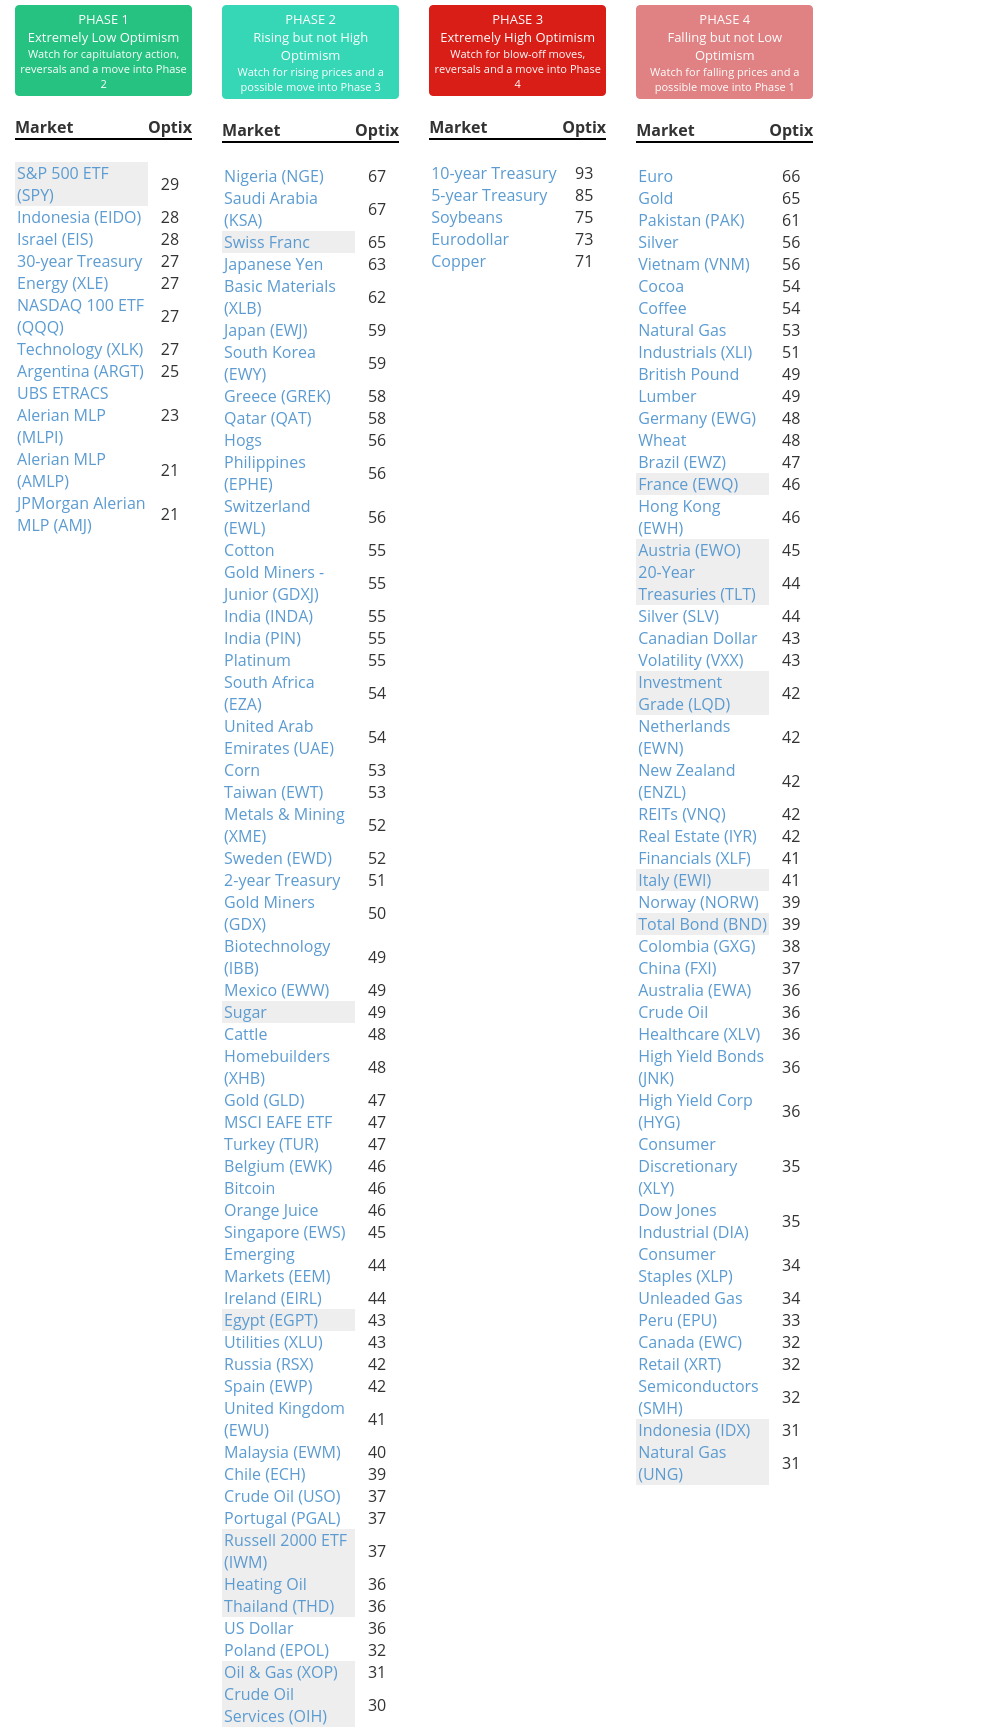
Phase Table
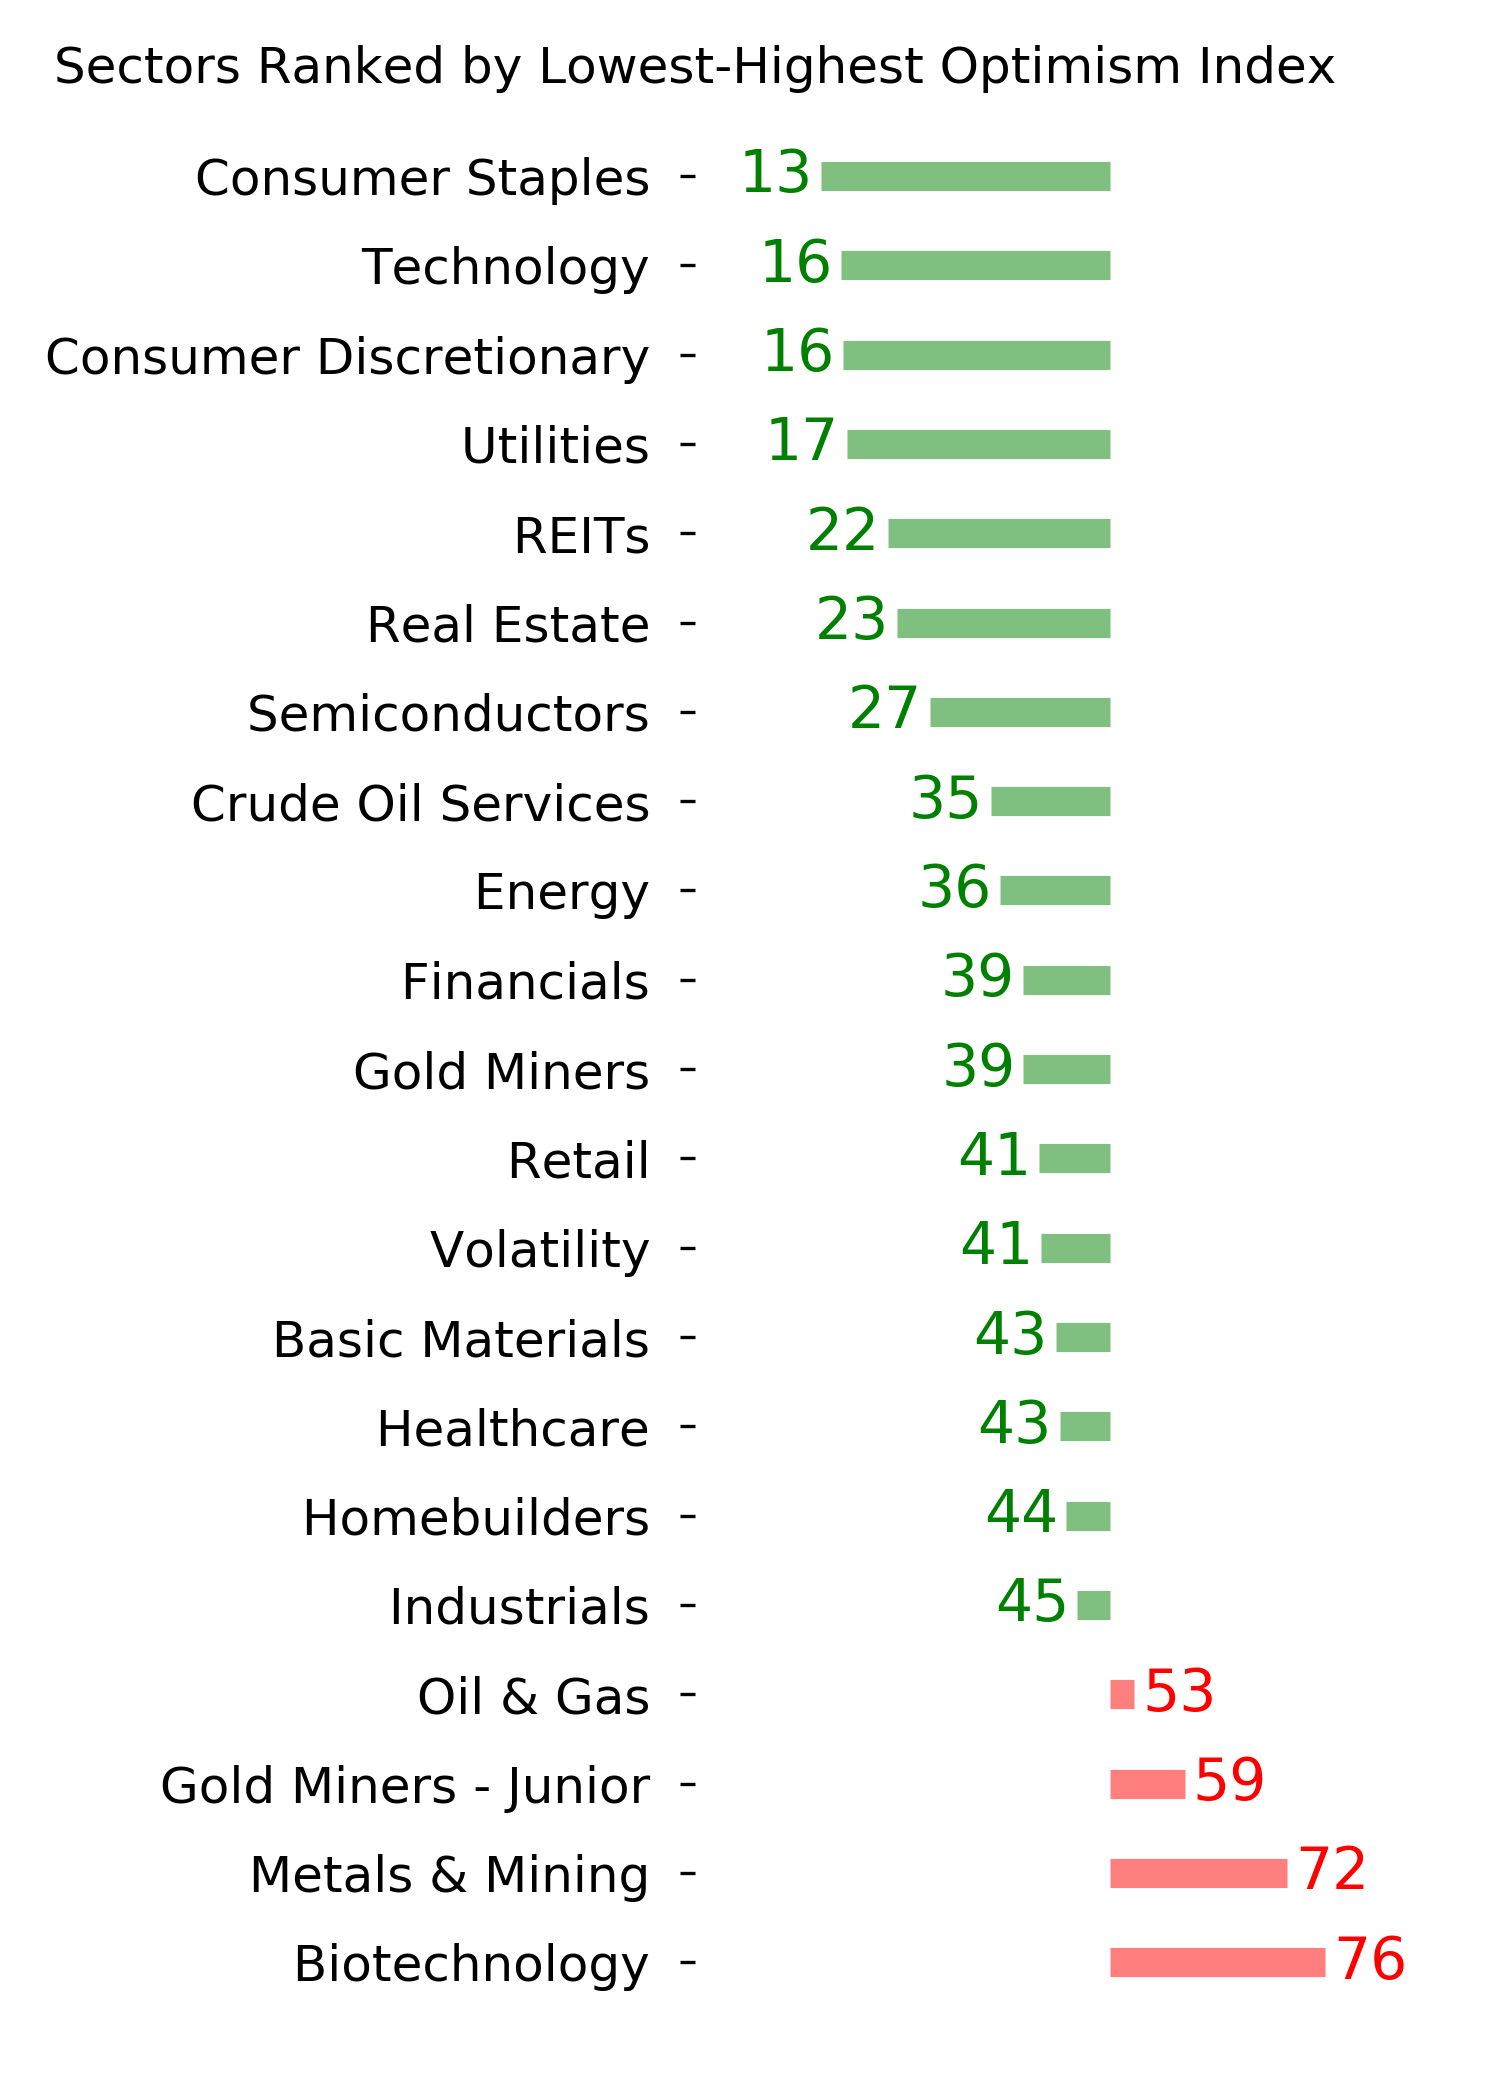
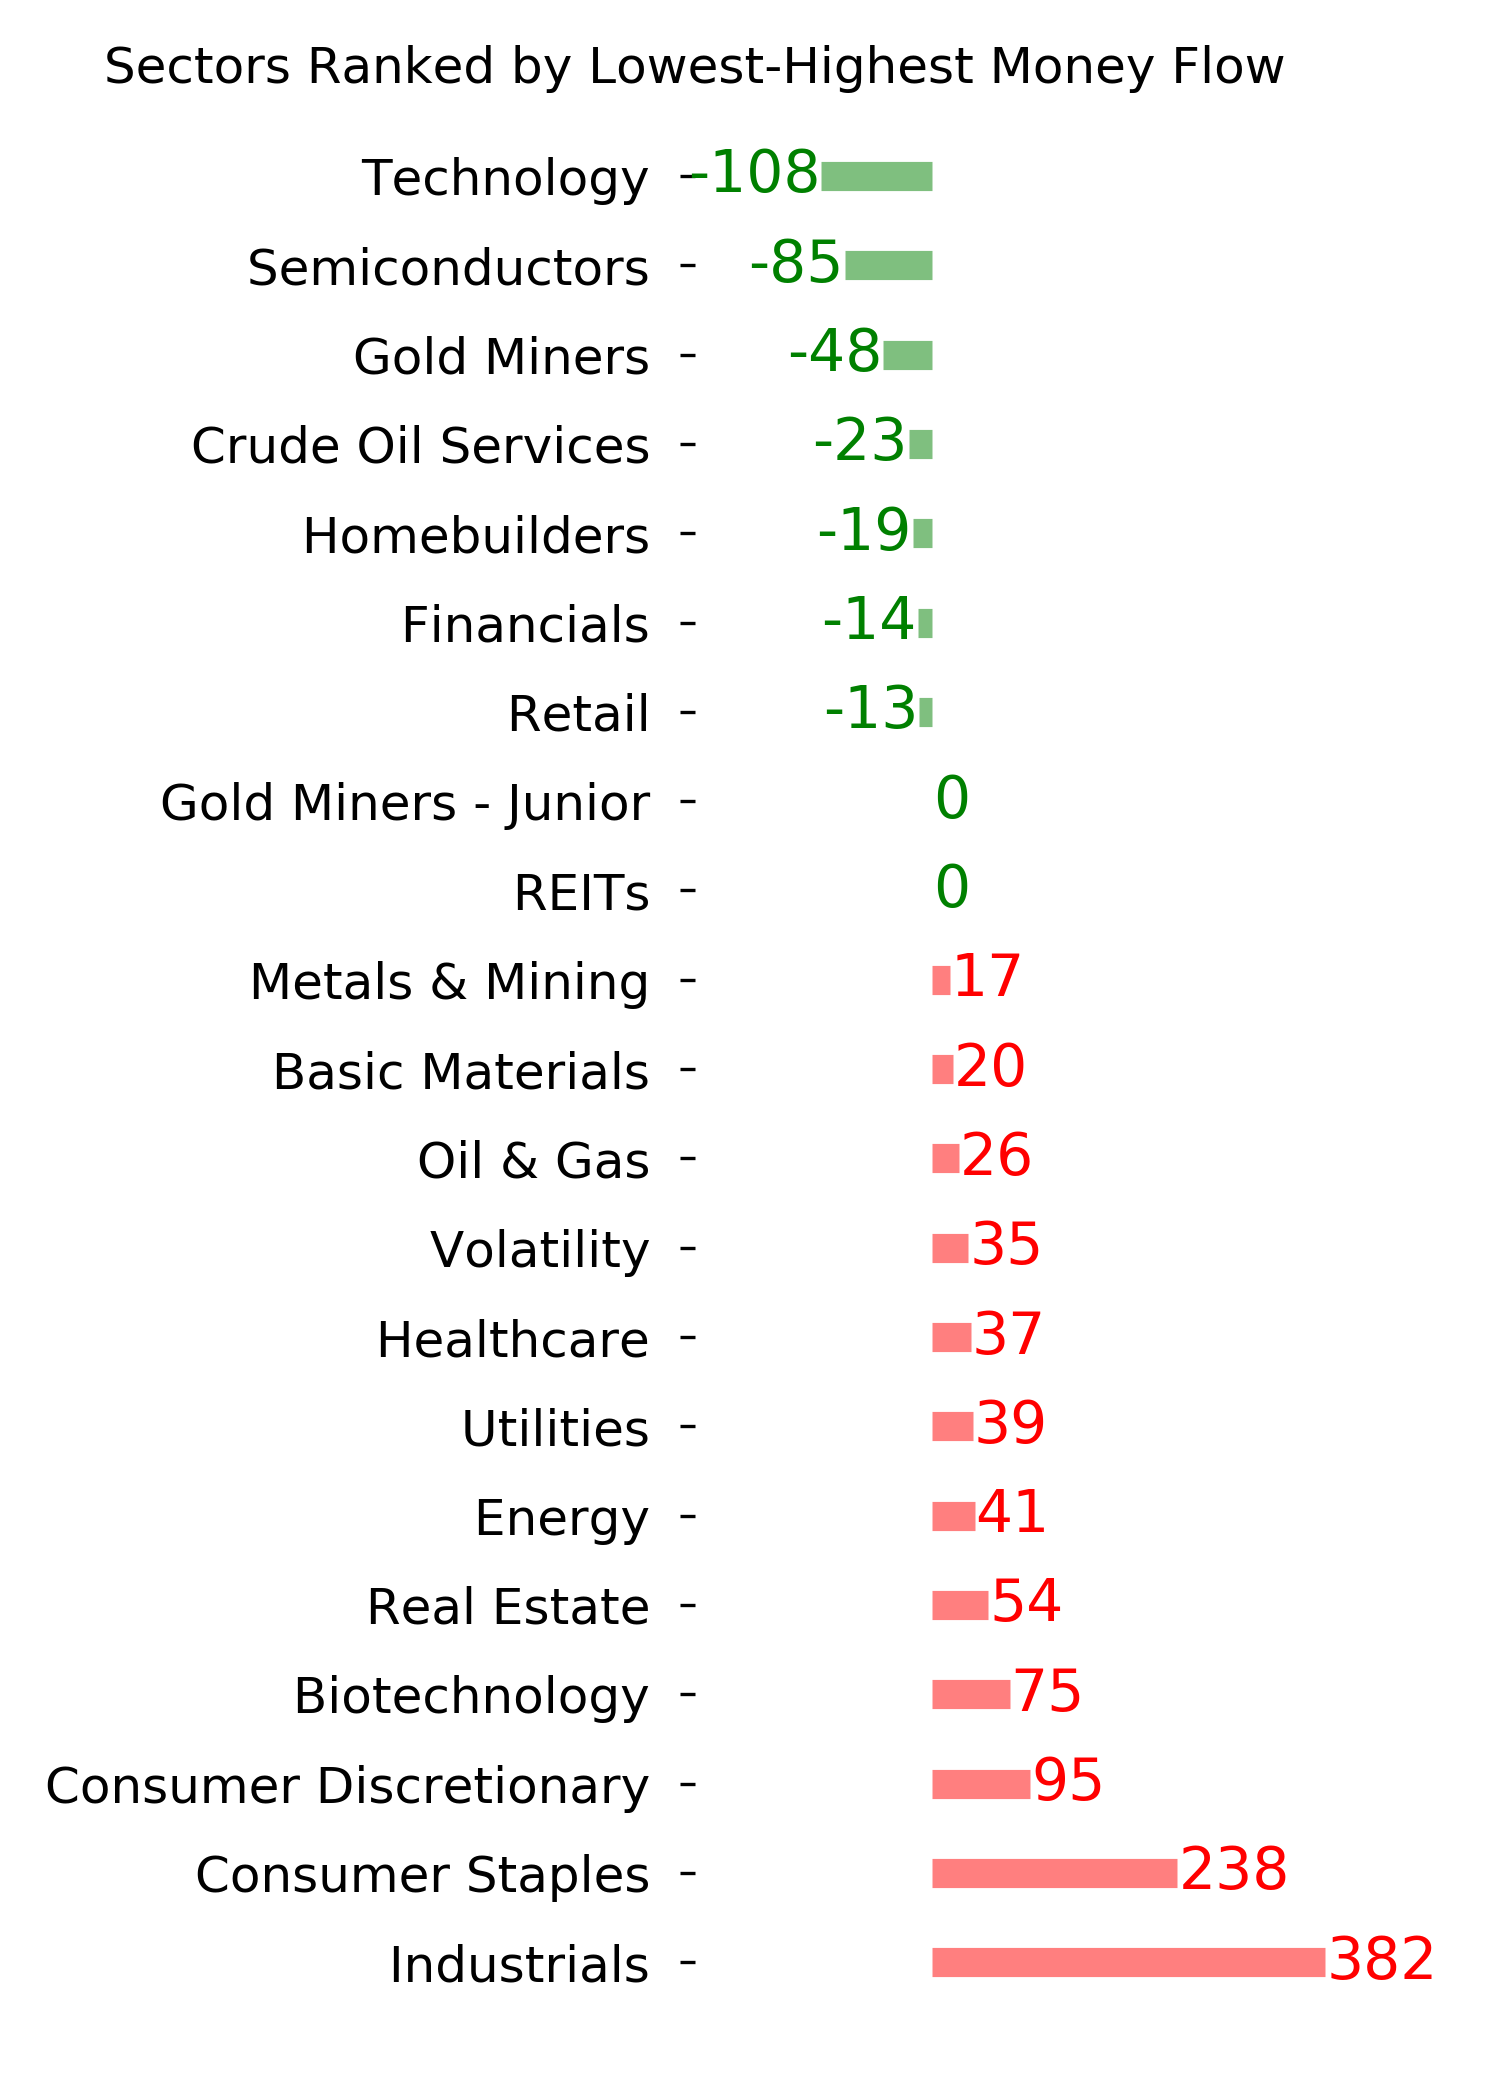
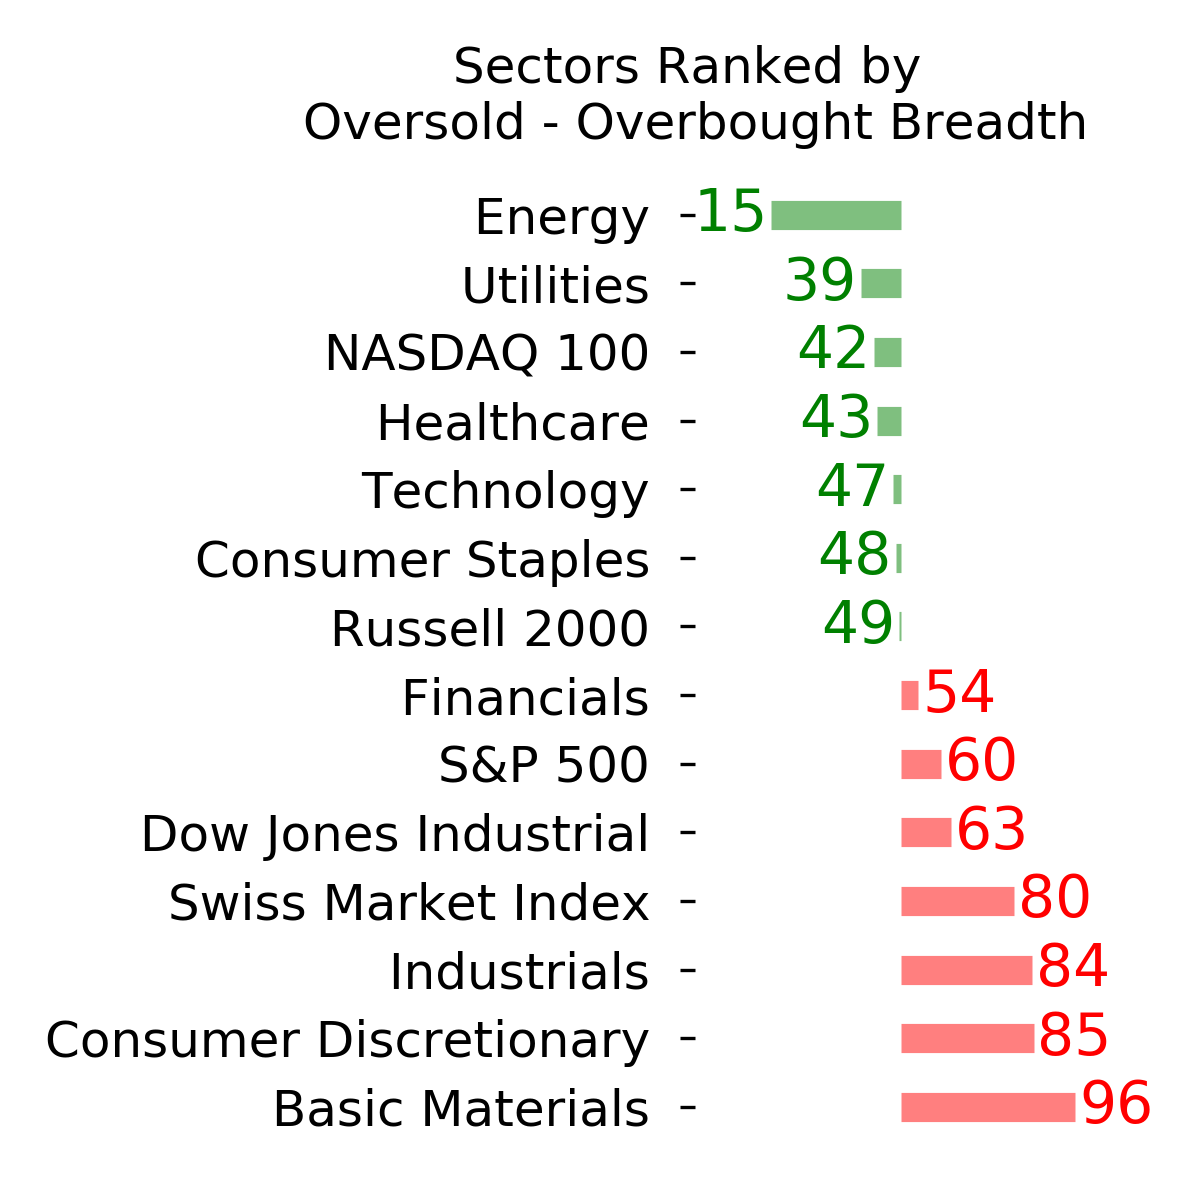
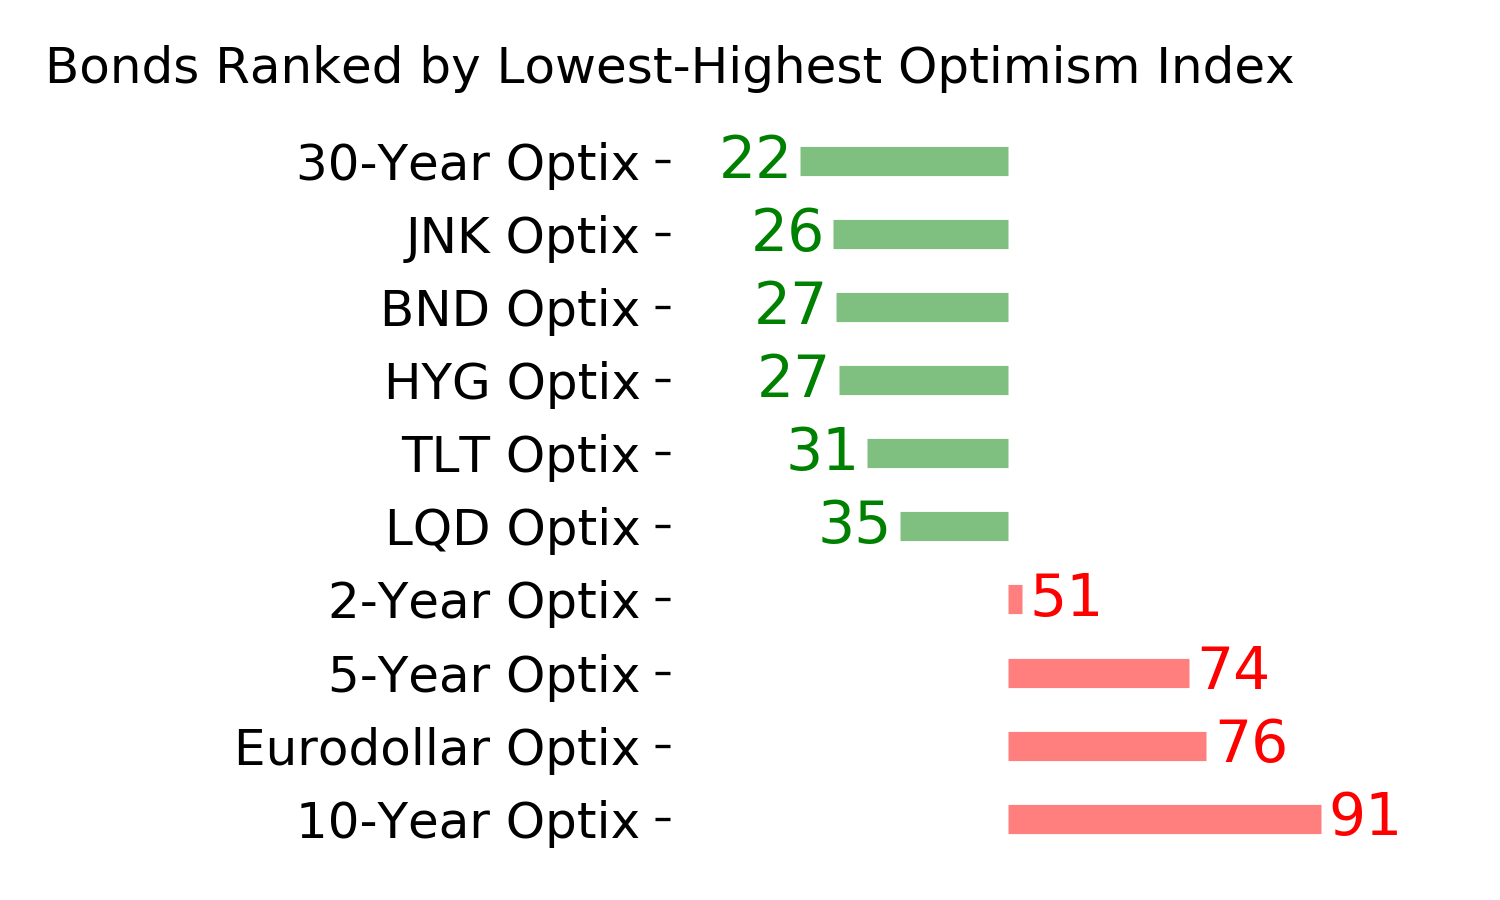
Ranks
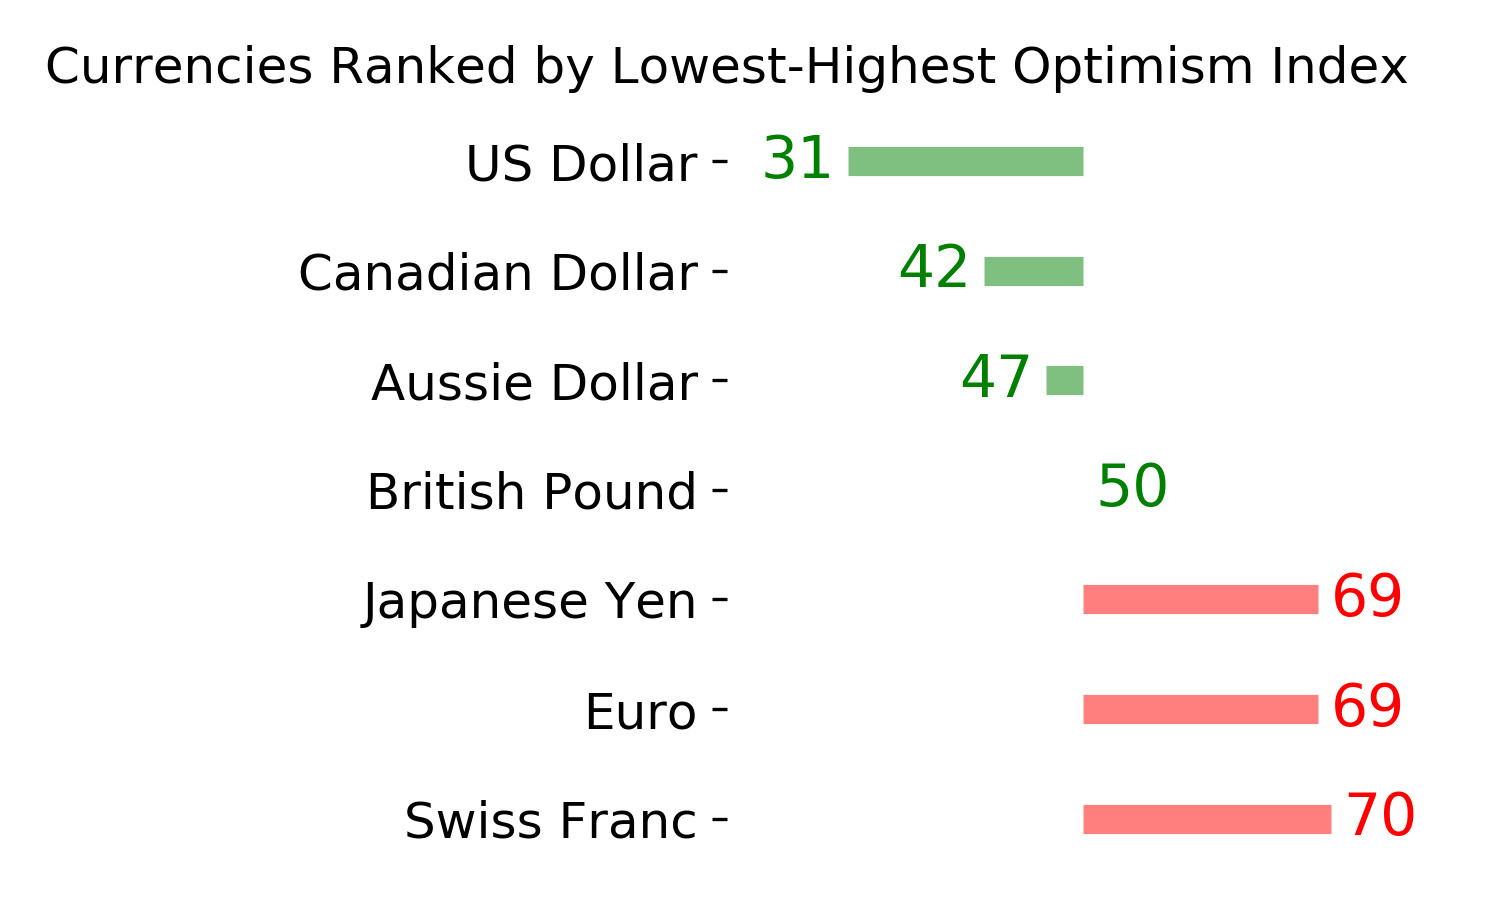
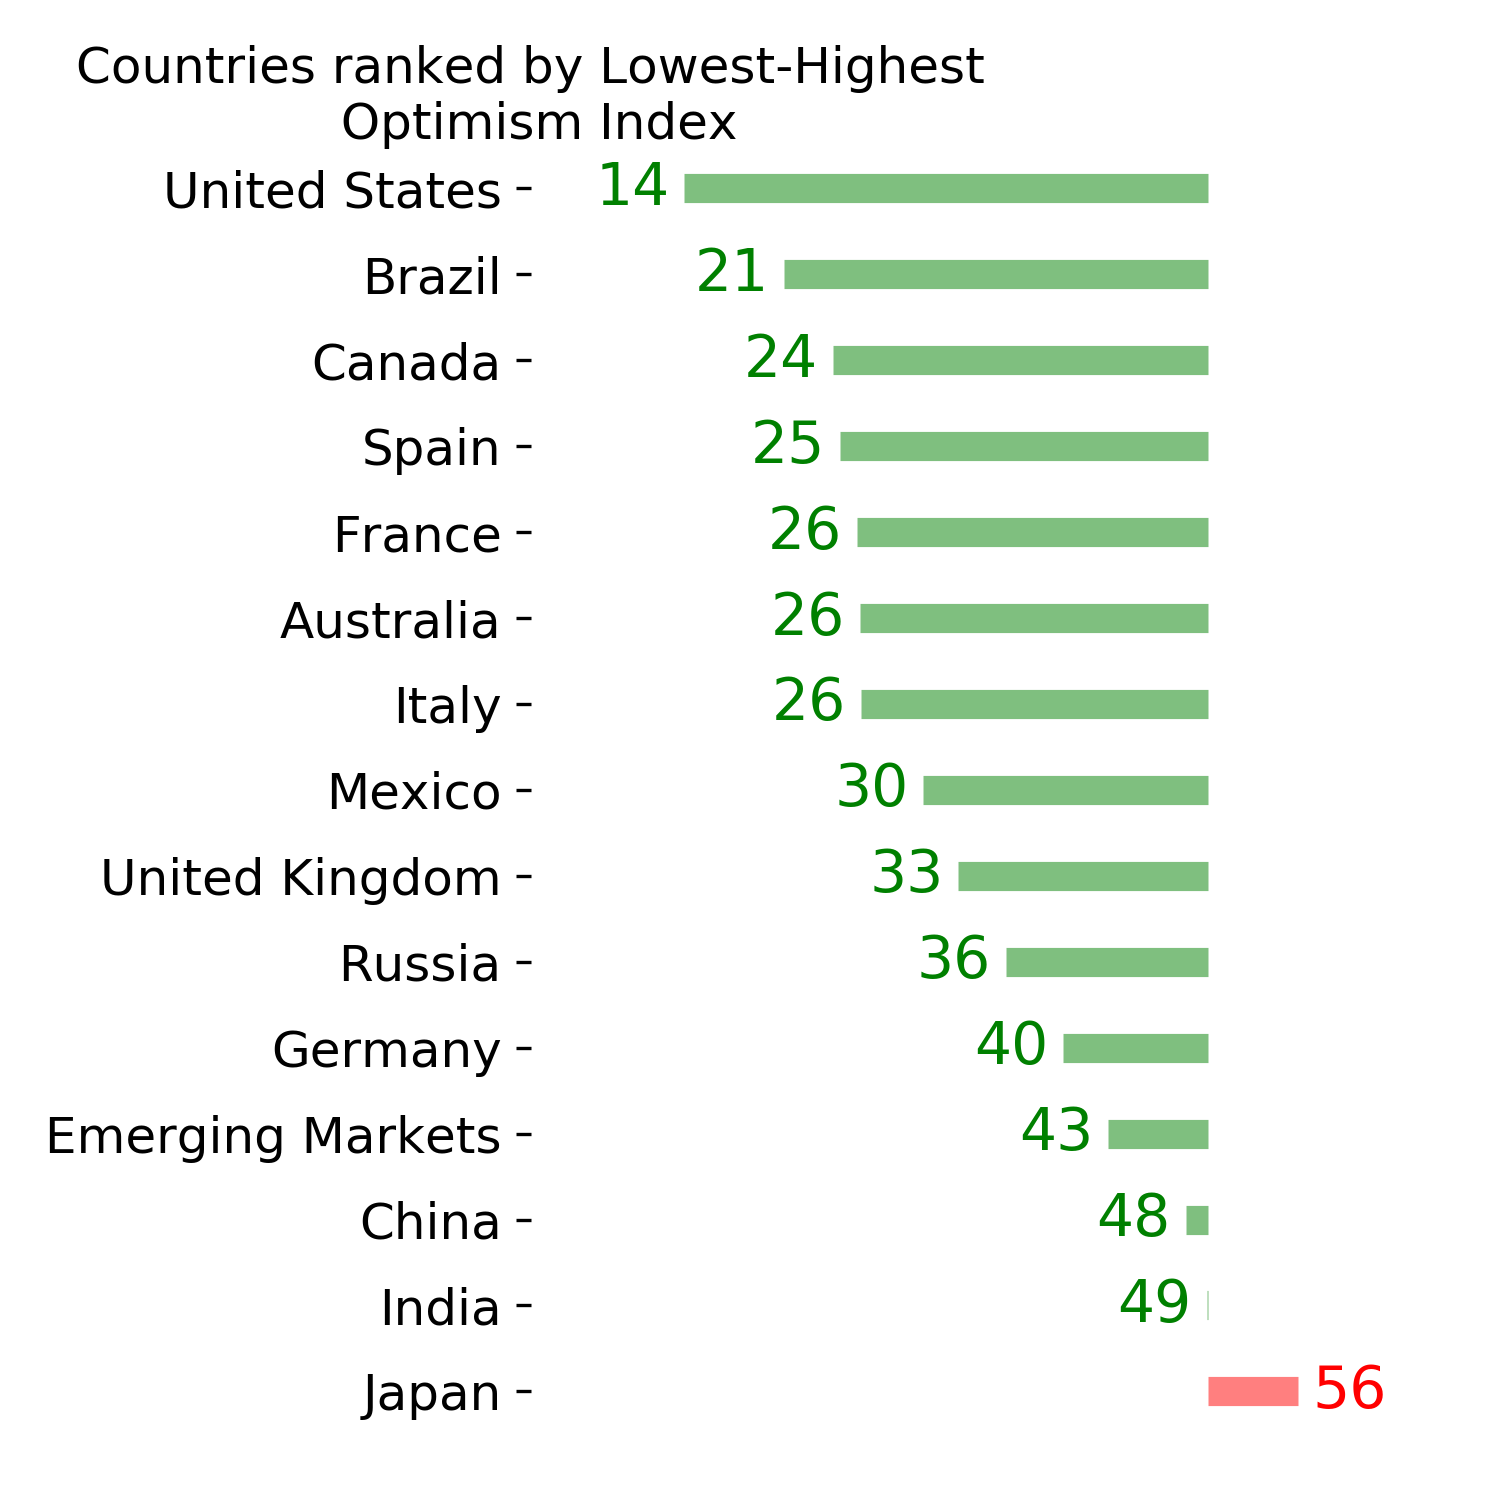
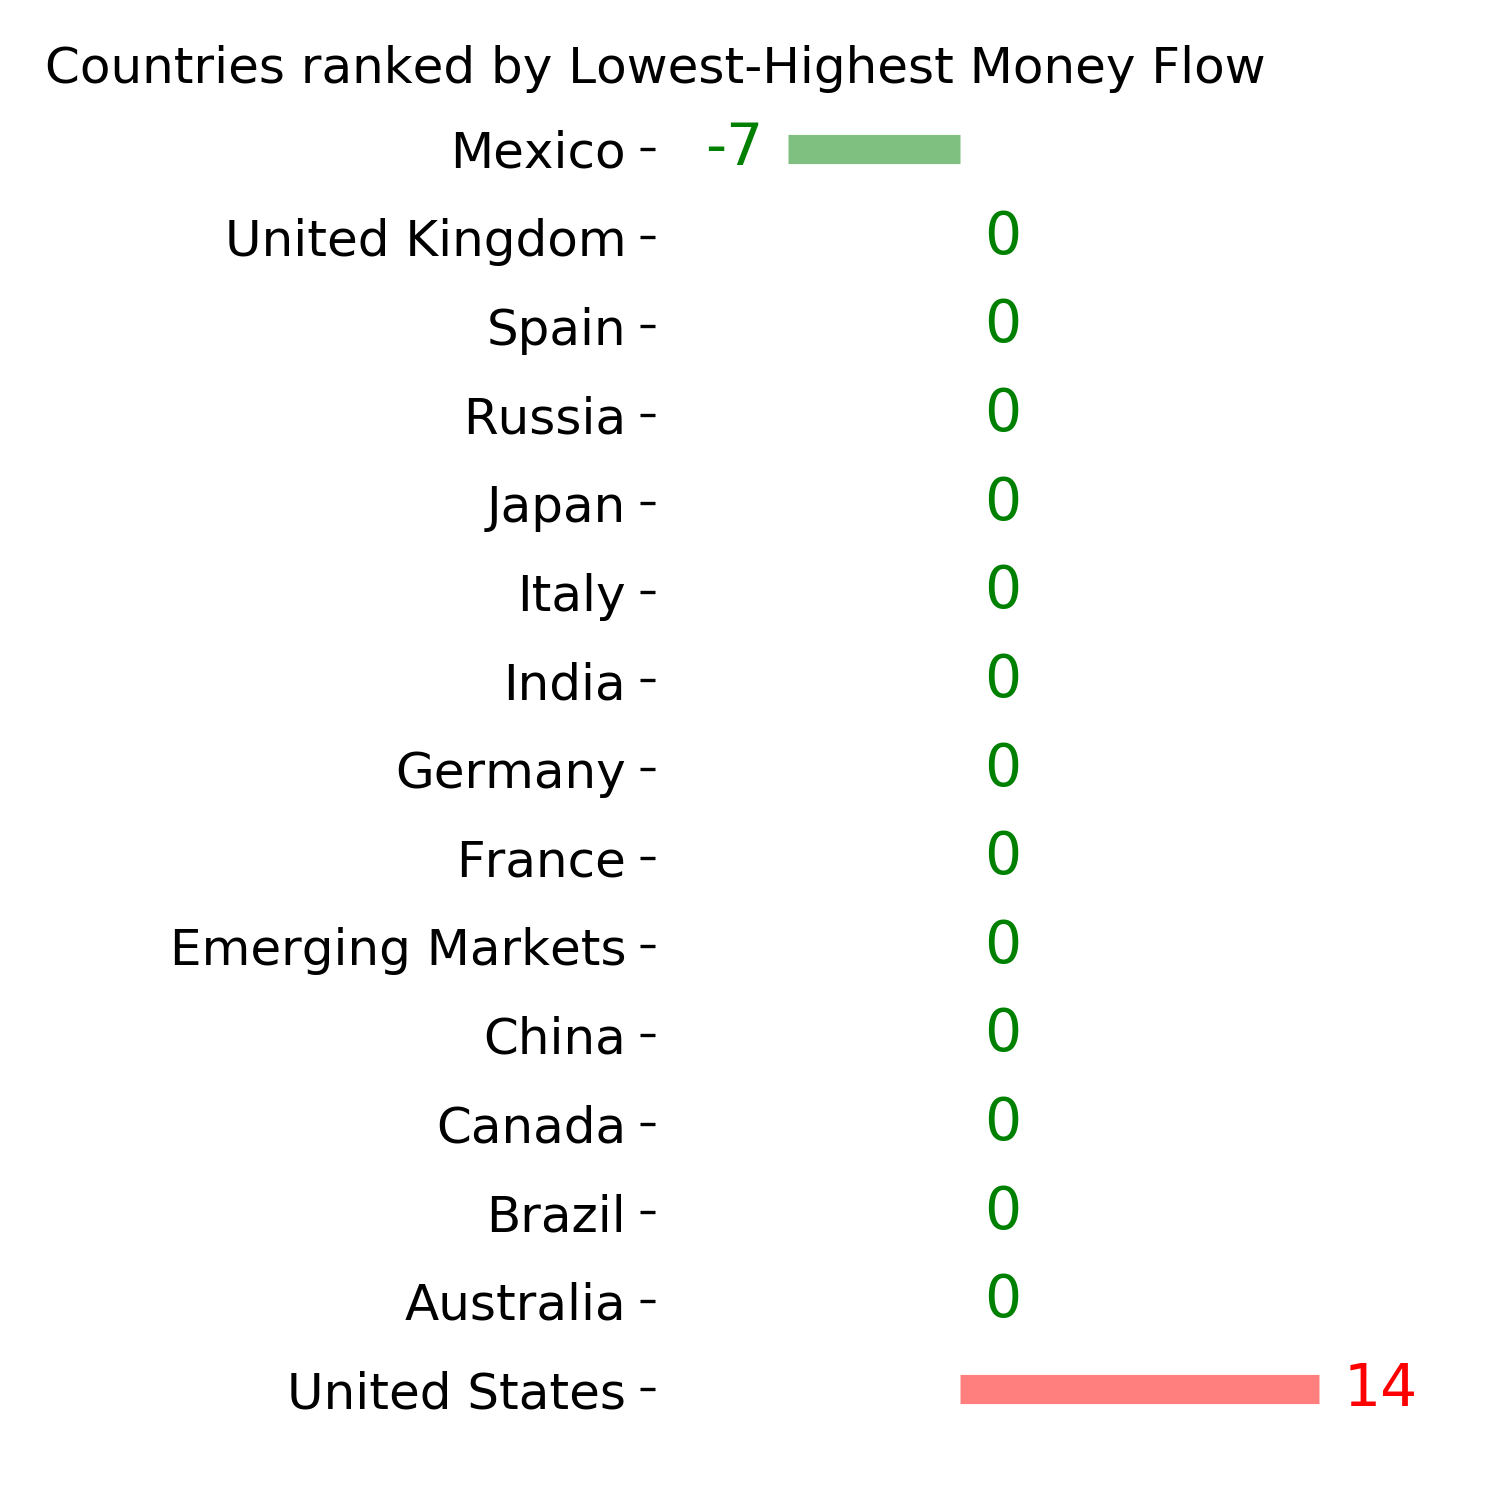
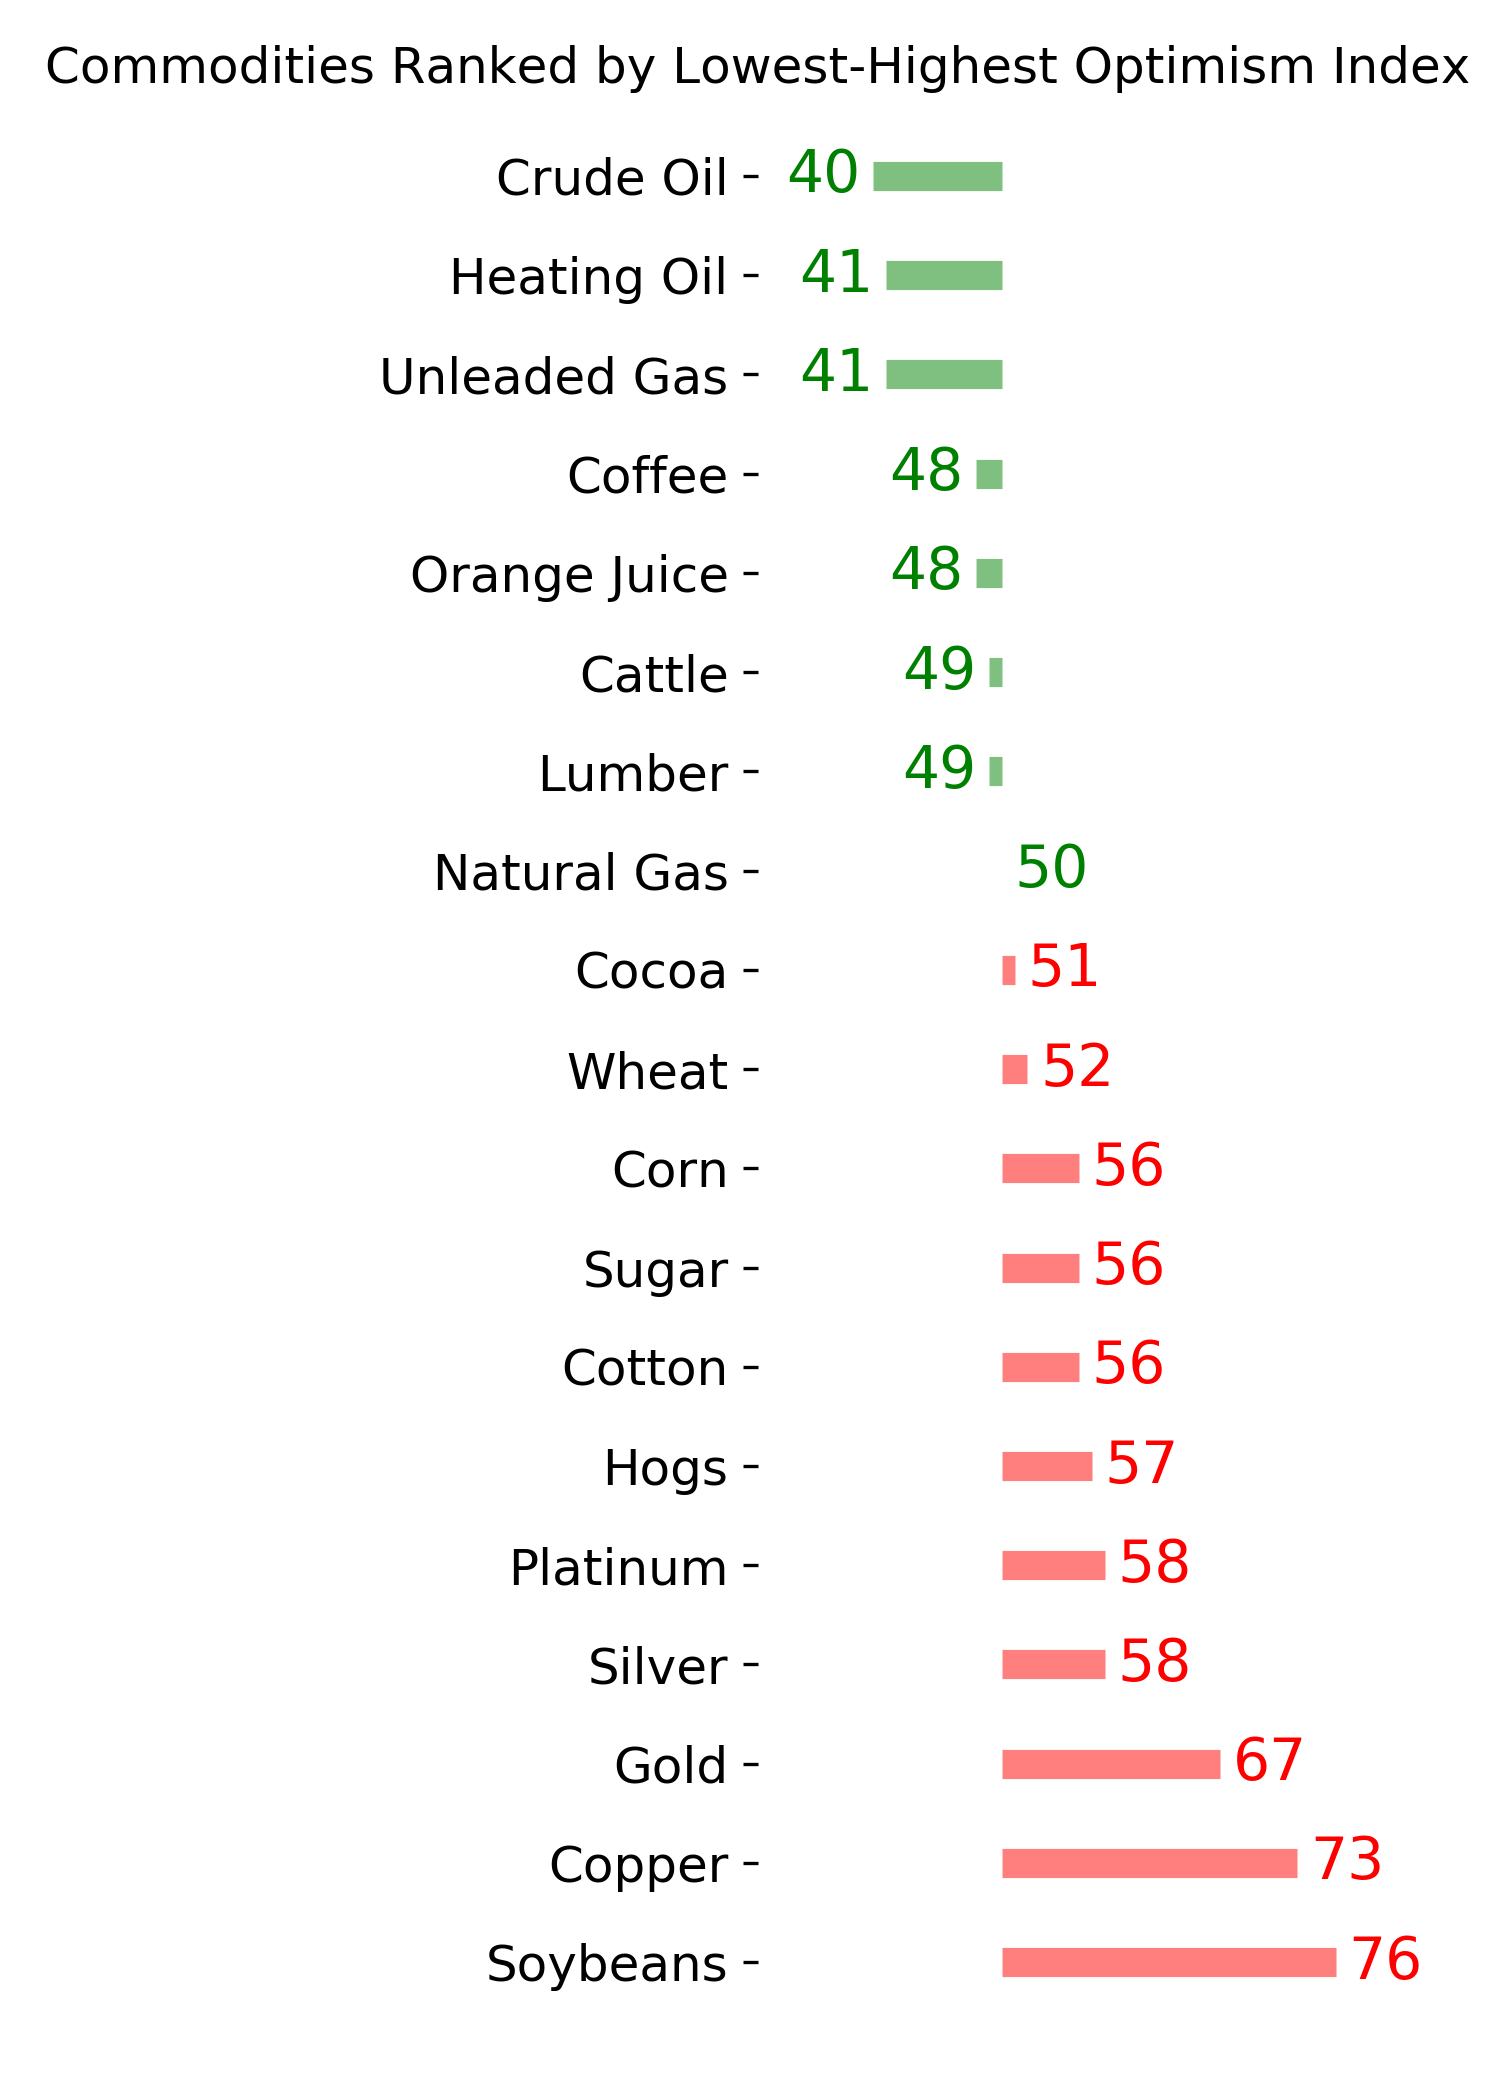
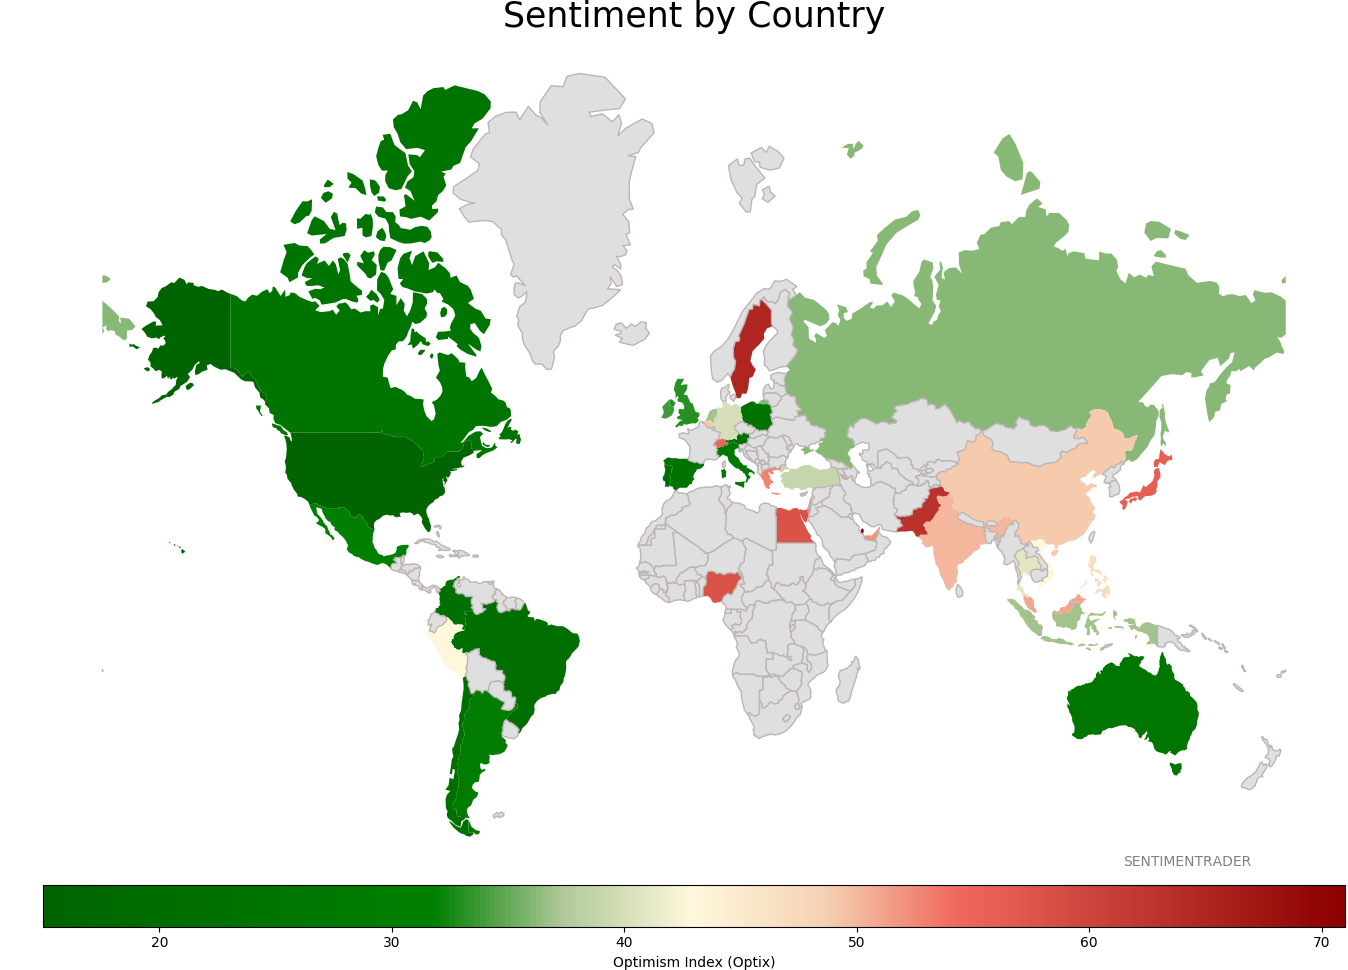
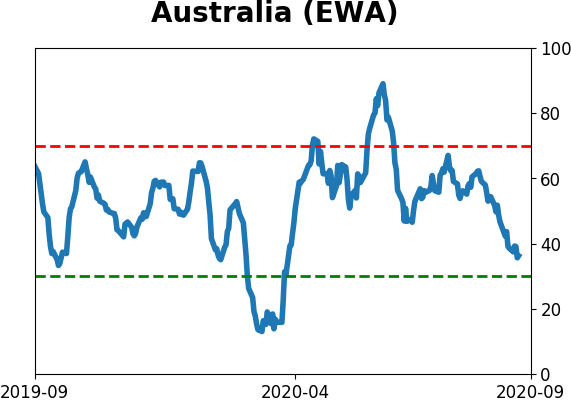
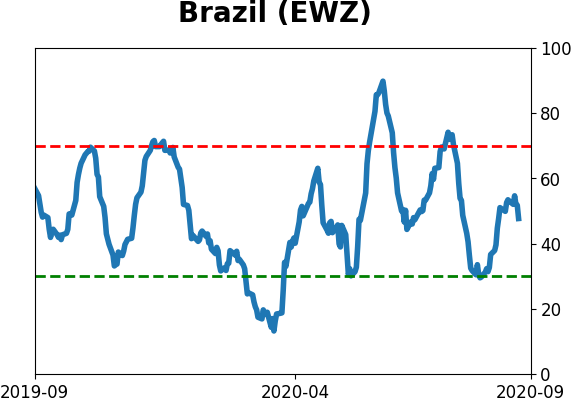
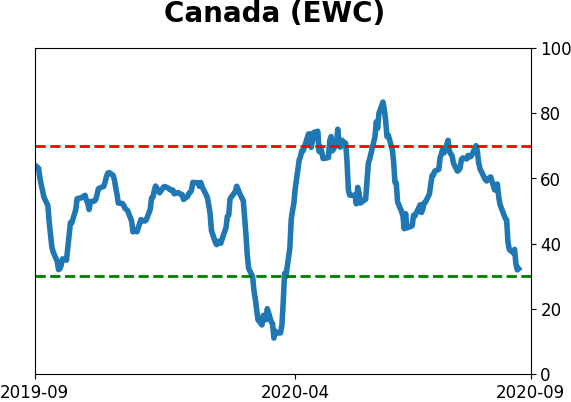
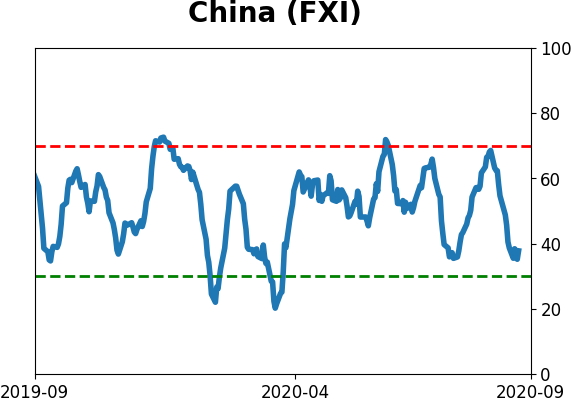
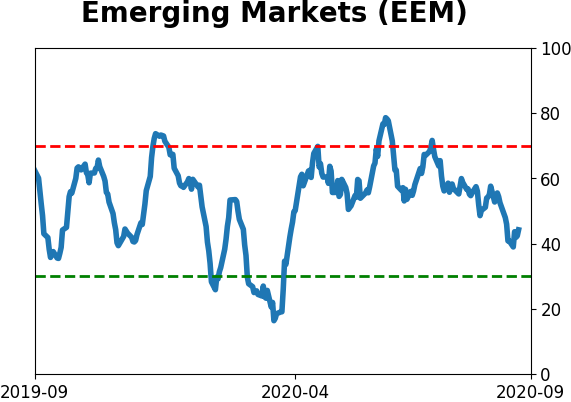
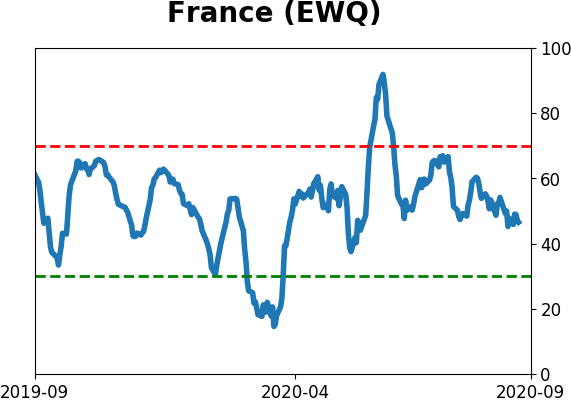
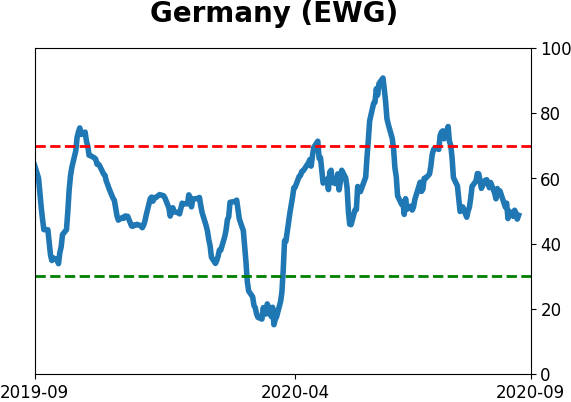
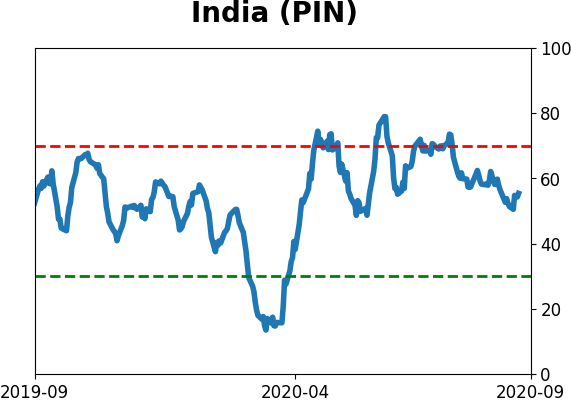
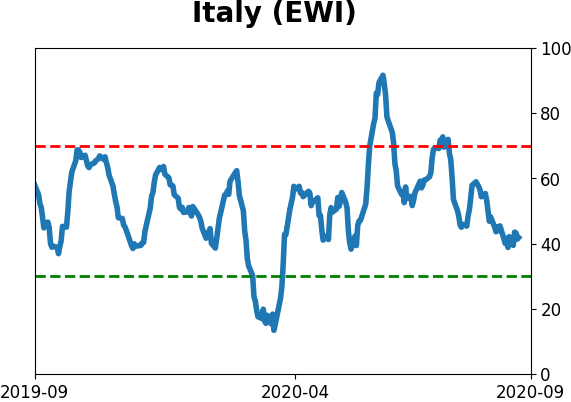
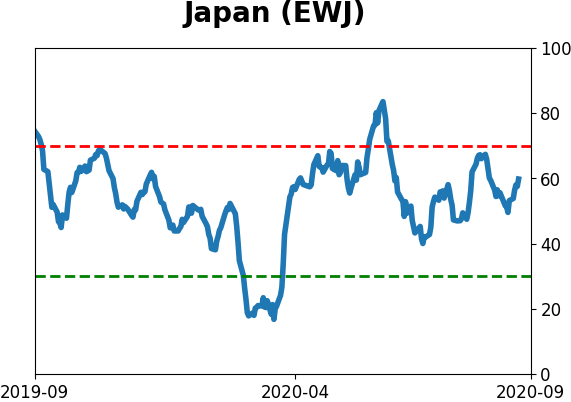
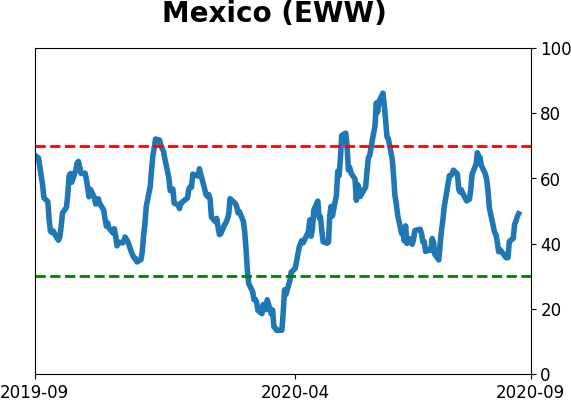
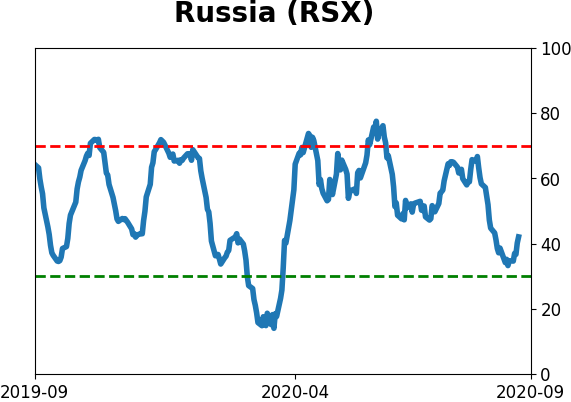
Sentiment Around The World
Optimism Index Thumbnails
|
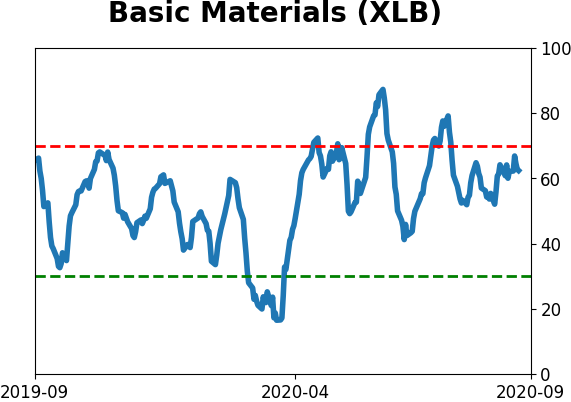
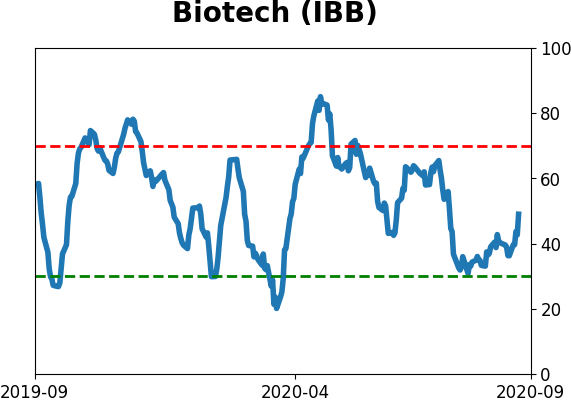
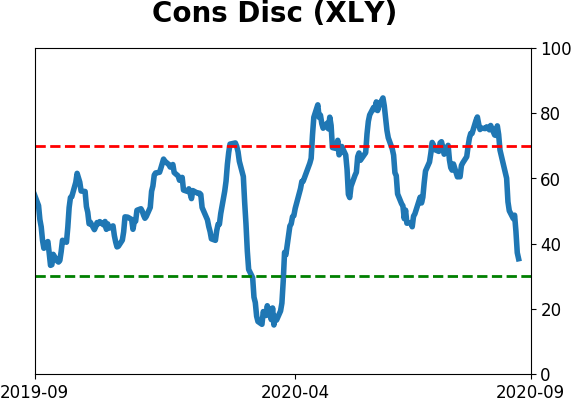
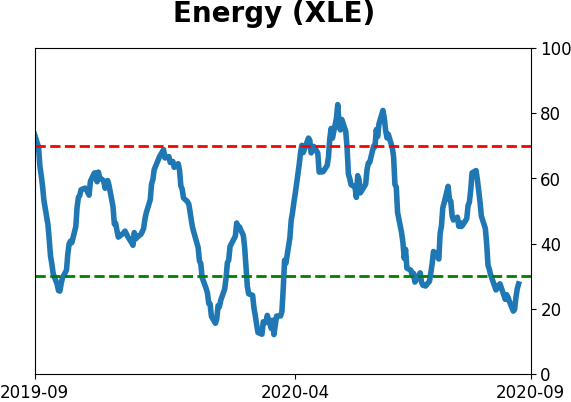
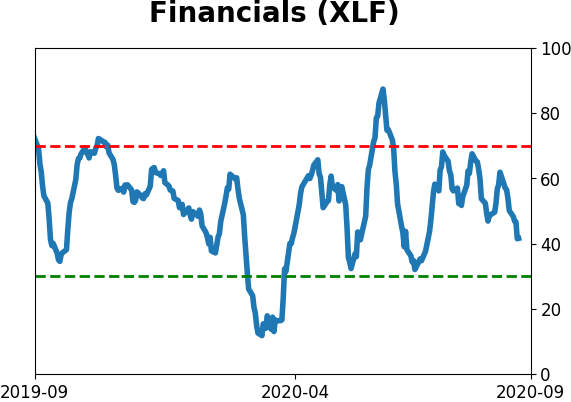
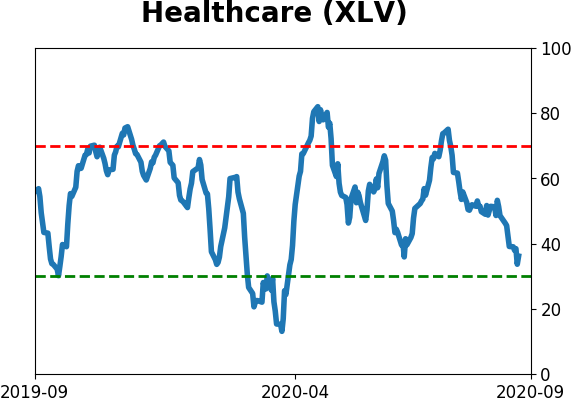
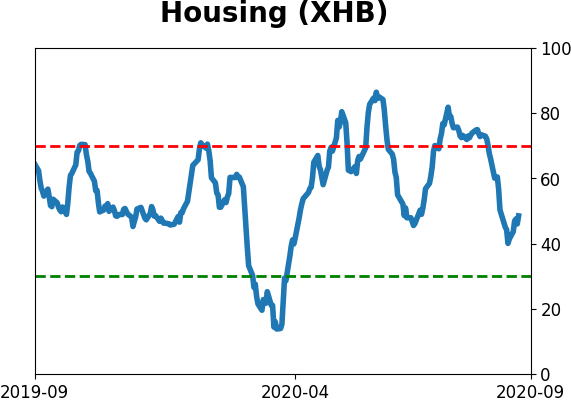
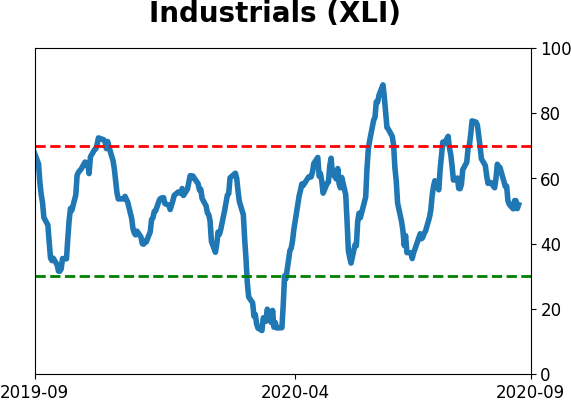
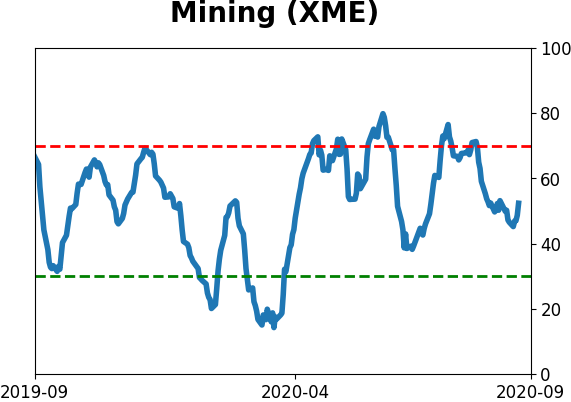
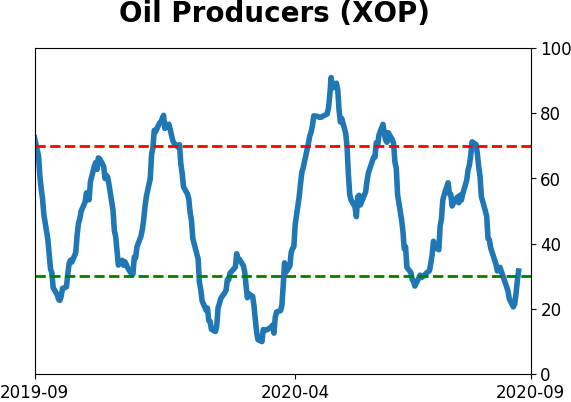
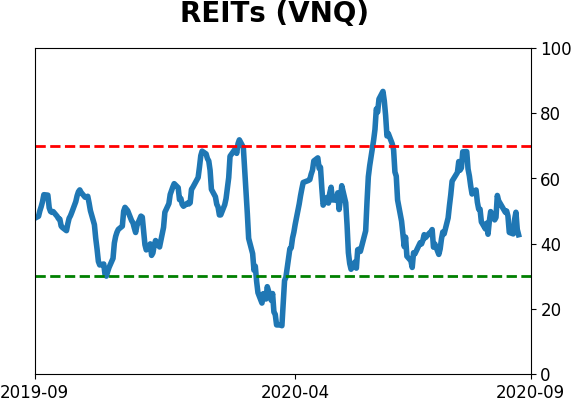
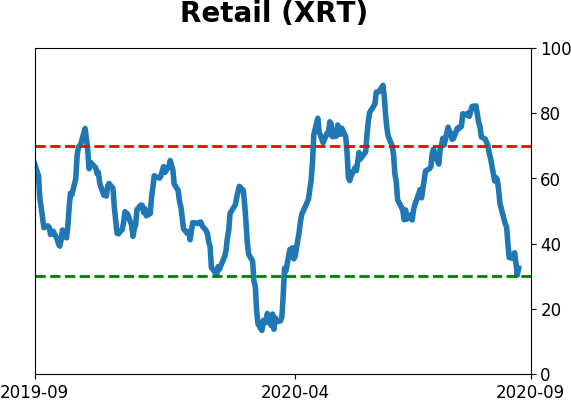
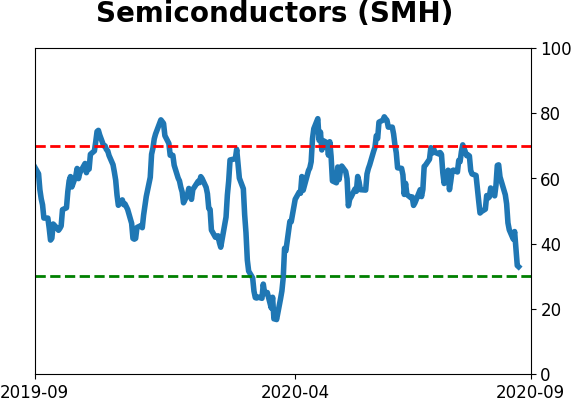
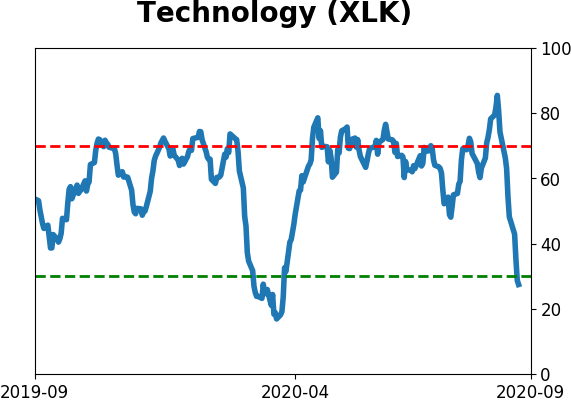
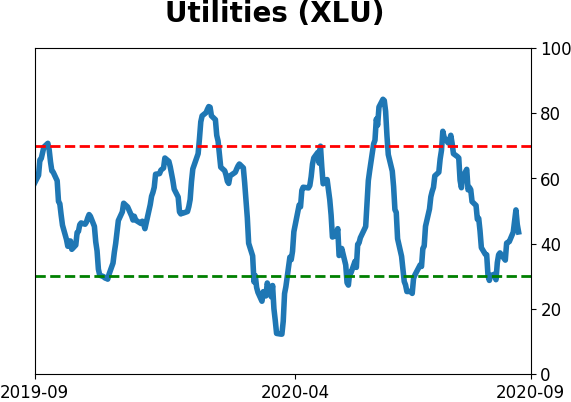
Sector ETF's - 10-Day Moving Average
|
|
|
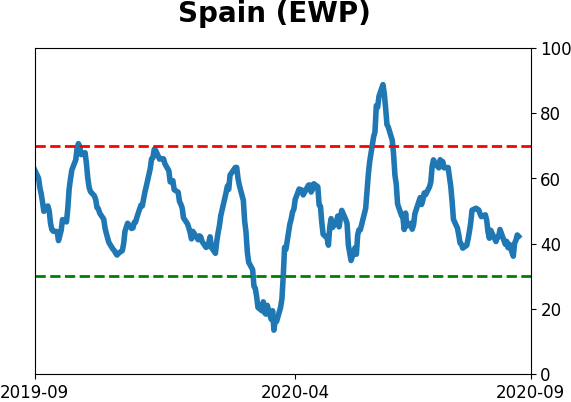
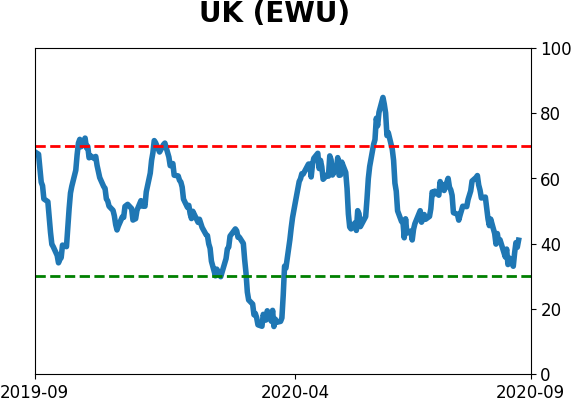
Country ETF's - 10-Day Moving Average
|
|
|
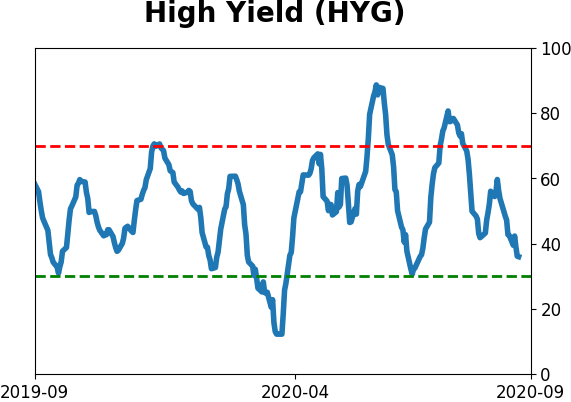
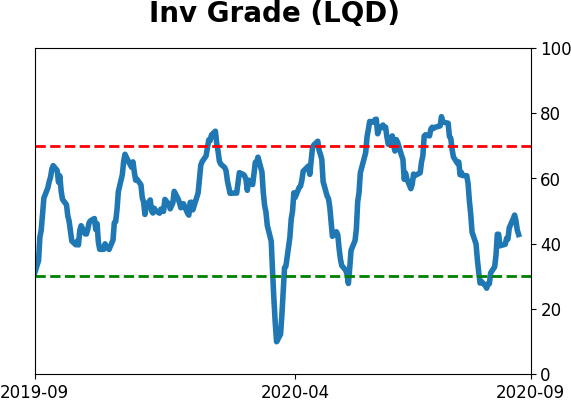
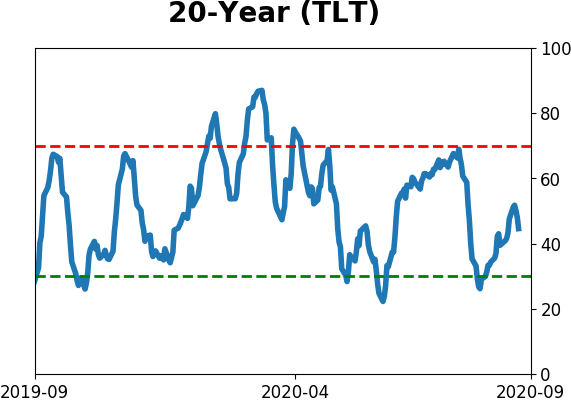
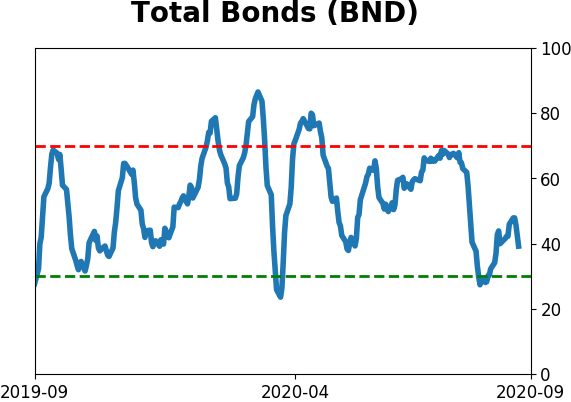
Bond ETF's - 10-Day Moving Average
|
|
|
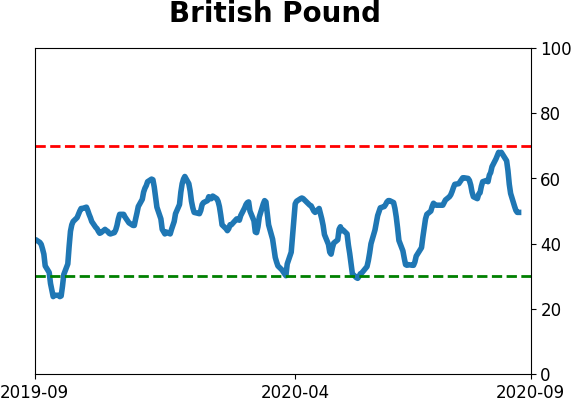
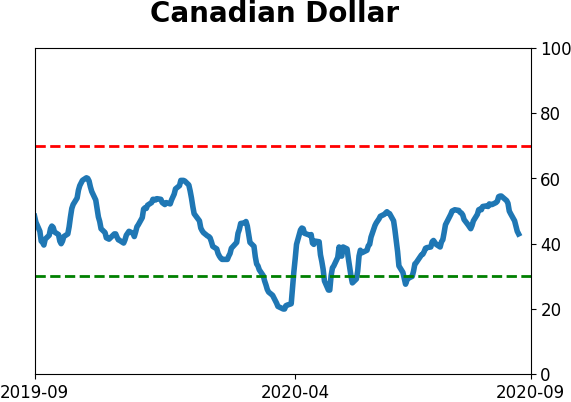
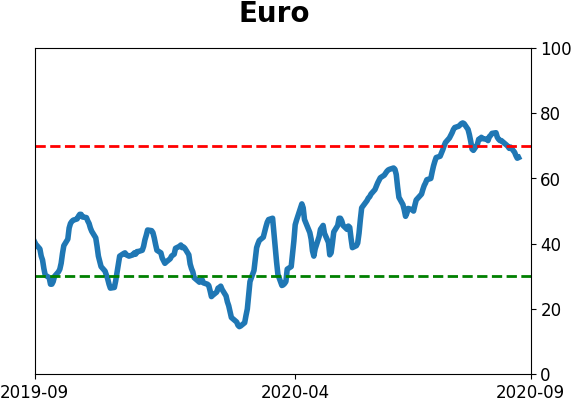
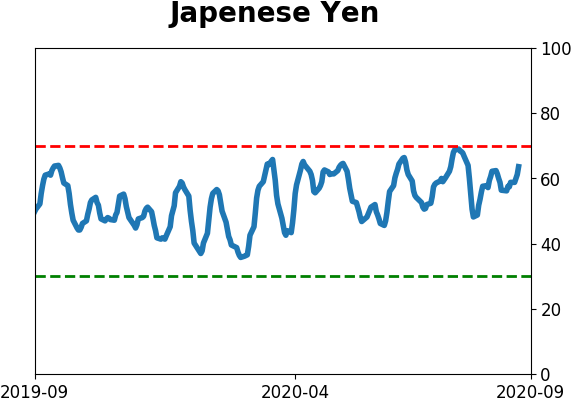
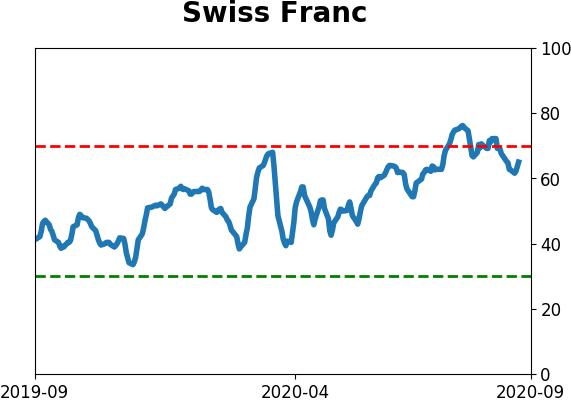
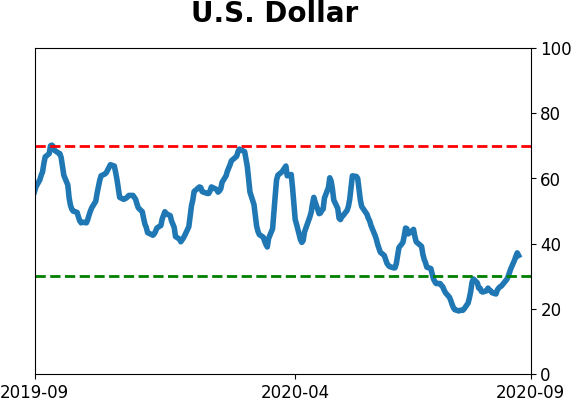
Currency ETF's - 5-Day Moving Average
|
|
|
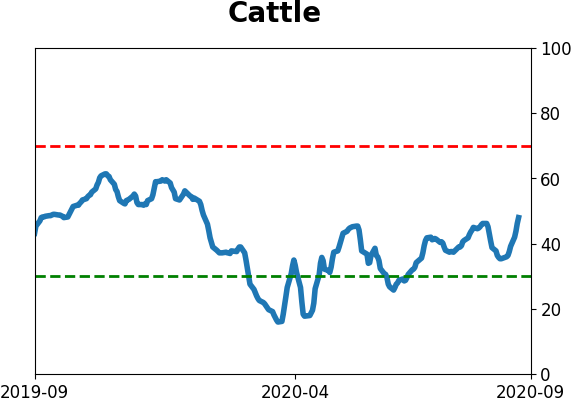
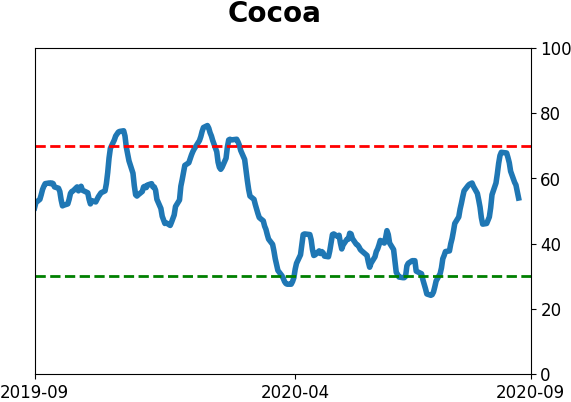
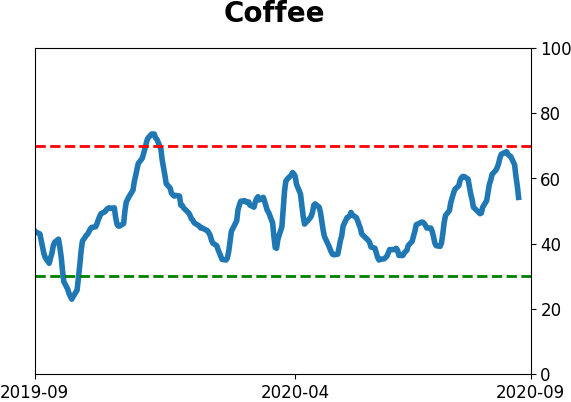
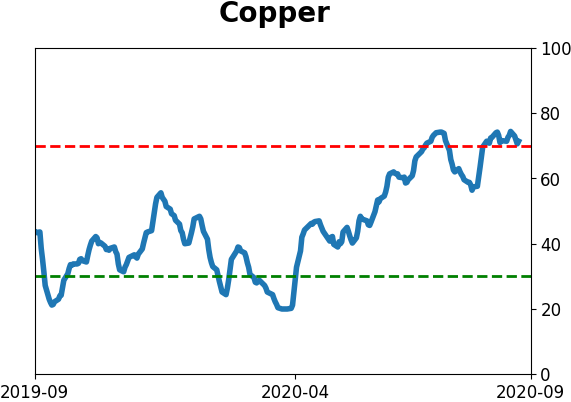
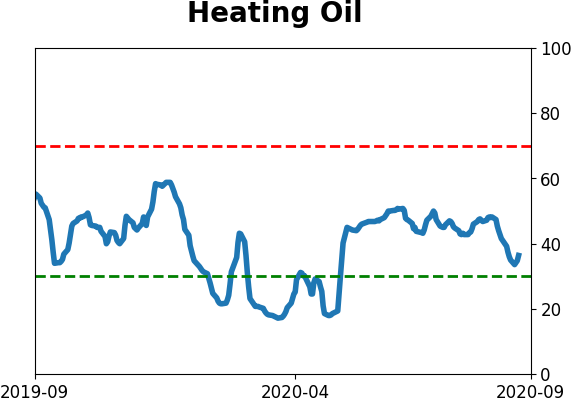
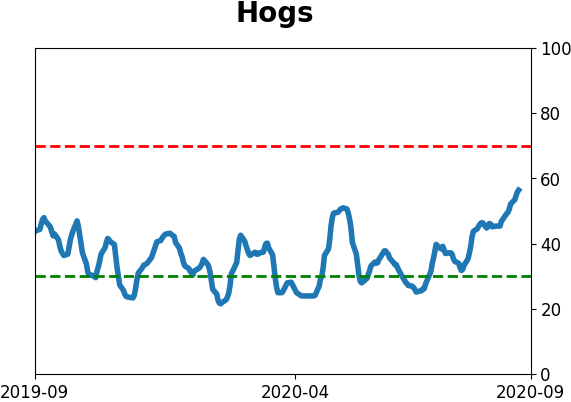
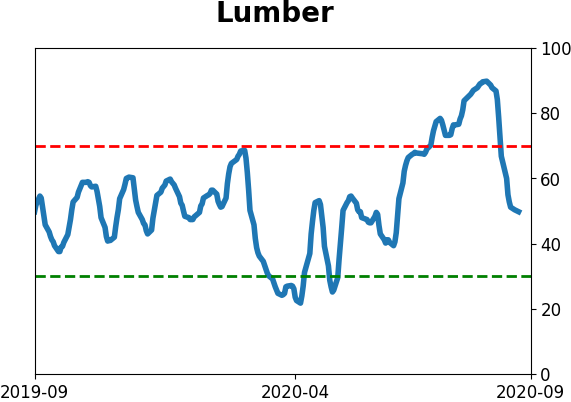
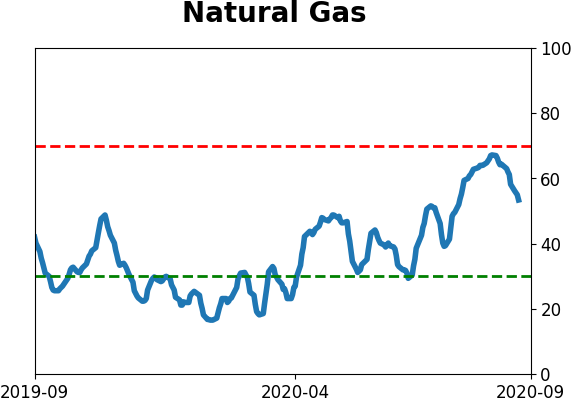
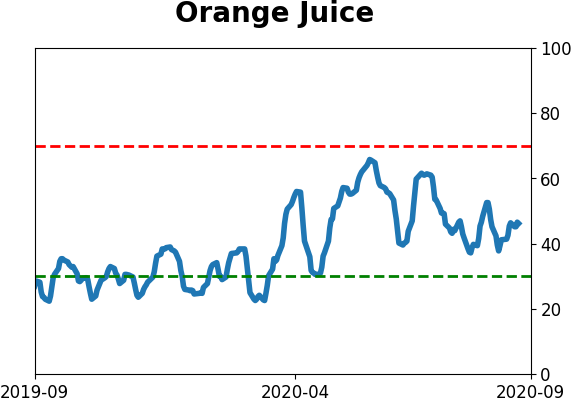
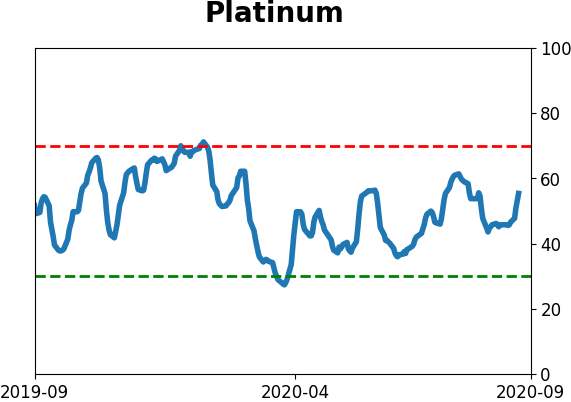
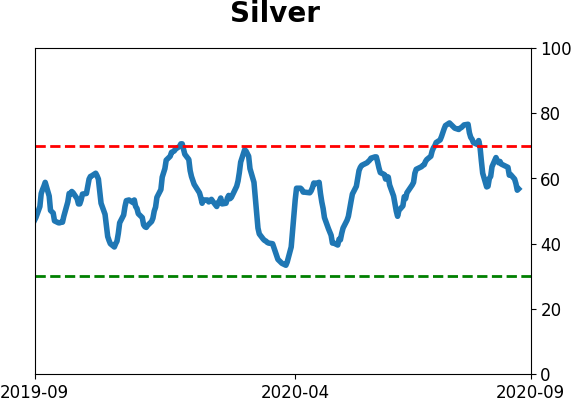
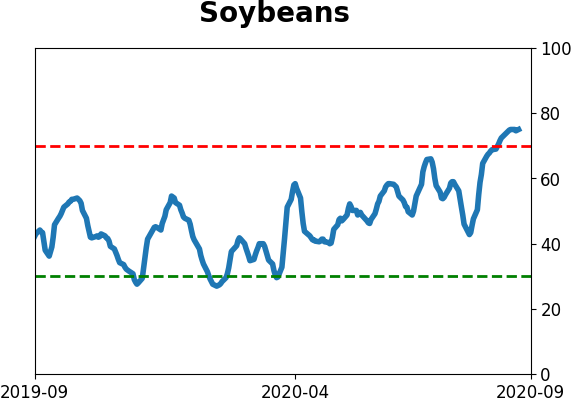
Commodity ETF's - 5-Day Moving Average
|
|