Headlines
|
|
Corporate insider buying falls off:
Buying among smart money corporate insiders spiked during the spring. It moderated since then, especially in technology stocks. Lately, buying interest has dropped off and the 4-week Velocity of the Buy/Sell Ratio has dropped well into negative territory.
Transports are the best of the bunch: On another down day, transportation stocks held firm again. The sector has shown strong relative strength over the past 1-2 weeks, and the Dow Transports just hit a new high, fully recovering from its bear market. It peaked almost exactly 2 years ago, so it's been awhile since it saw a fresh high. In a premium note, Troy shows how that index, and the S&P 500, have fared after other recoveries. Over the next 1-3 months, it has been a struggle for these normally staid stocks to hold their positive momentum.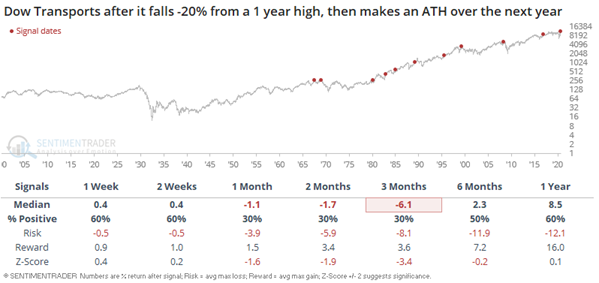
Bottom Line:
- Weight of the evidence has been suggesting flat/lower stock prices short- to medium-term, which would gather some clout if falling and holding below the lows from earlier in September; still suggesting higher prices long-term
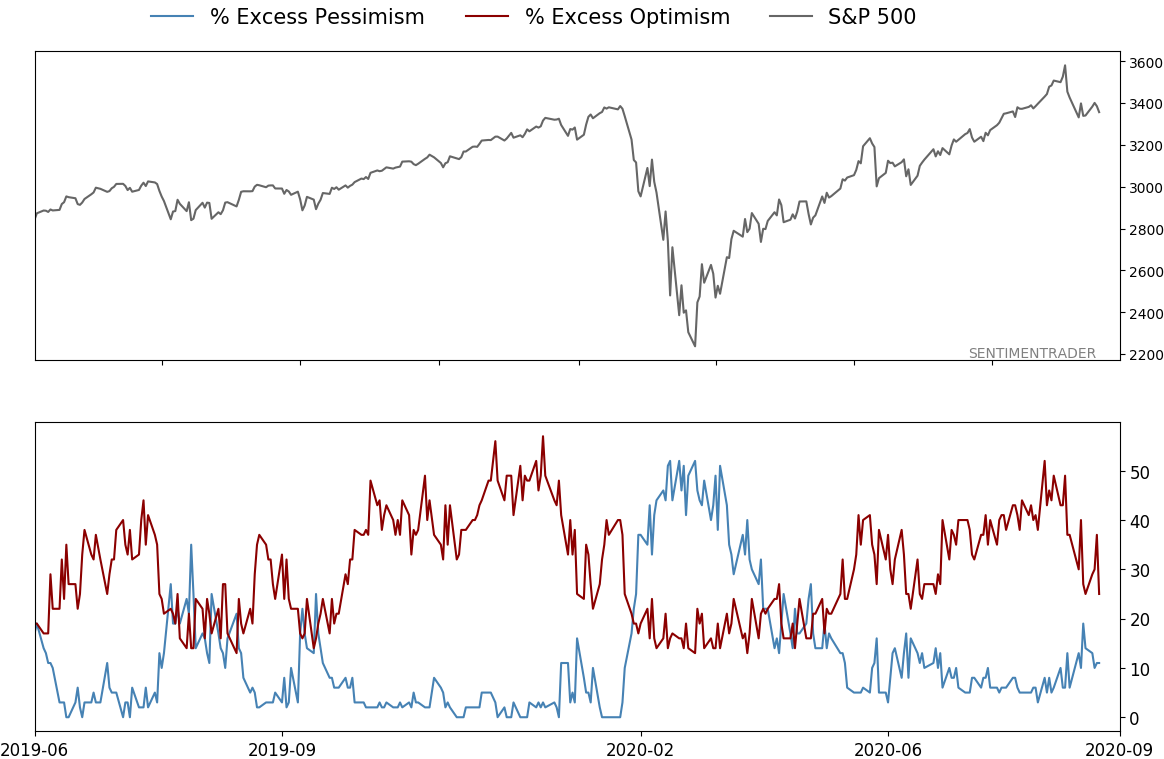
- Dumb Money Confidence was recently above 80% with evidence of skyrocketing speculation which increased during a down week, typically a bad sign when combined with an unhealthy environment, though that's turning more neutral, and failures were approaching record length
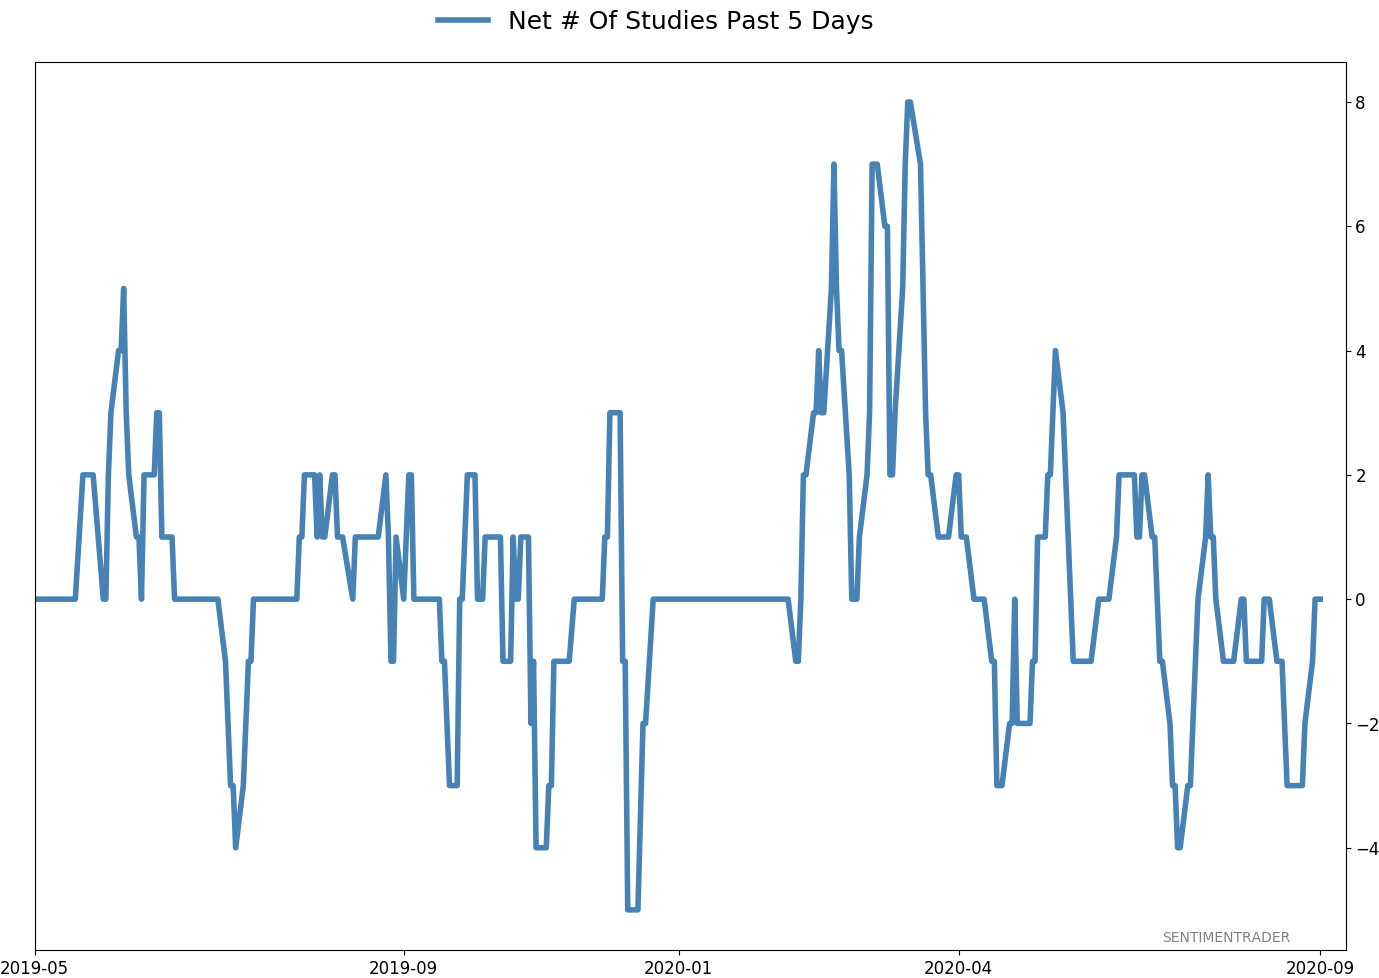
- Active Studies show a heavy positive skew over the longer-term mostly thanks to the March/April/May breadth thrusts, recoveries, and trend changes
- Signs of extremely skewed preference for tech stocks neared exhaustion by late June, especially relative to industrials and financials (here and here)
- Indicators and studies for other markets are showing less consistent forward results
|
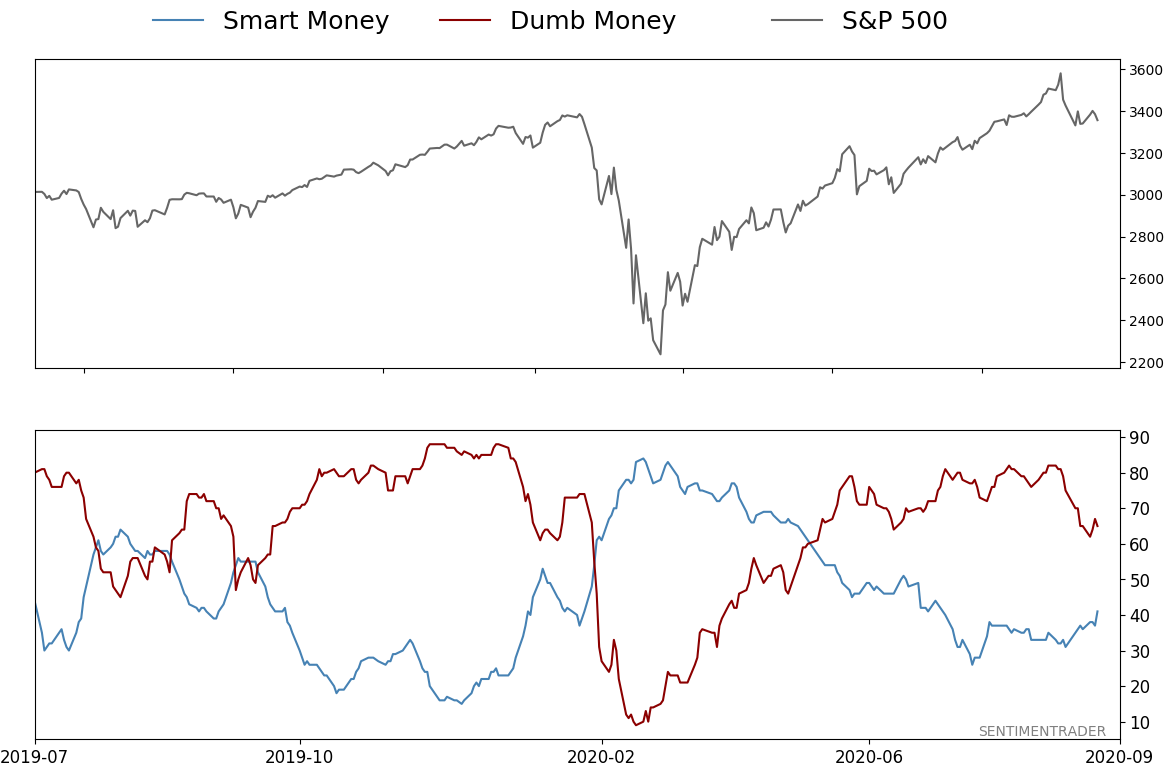
Smart / Dumb Money Confidence
|
Smart Money Confidence: 41%
Dumb Money Confidence: 65%
|
|
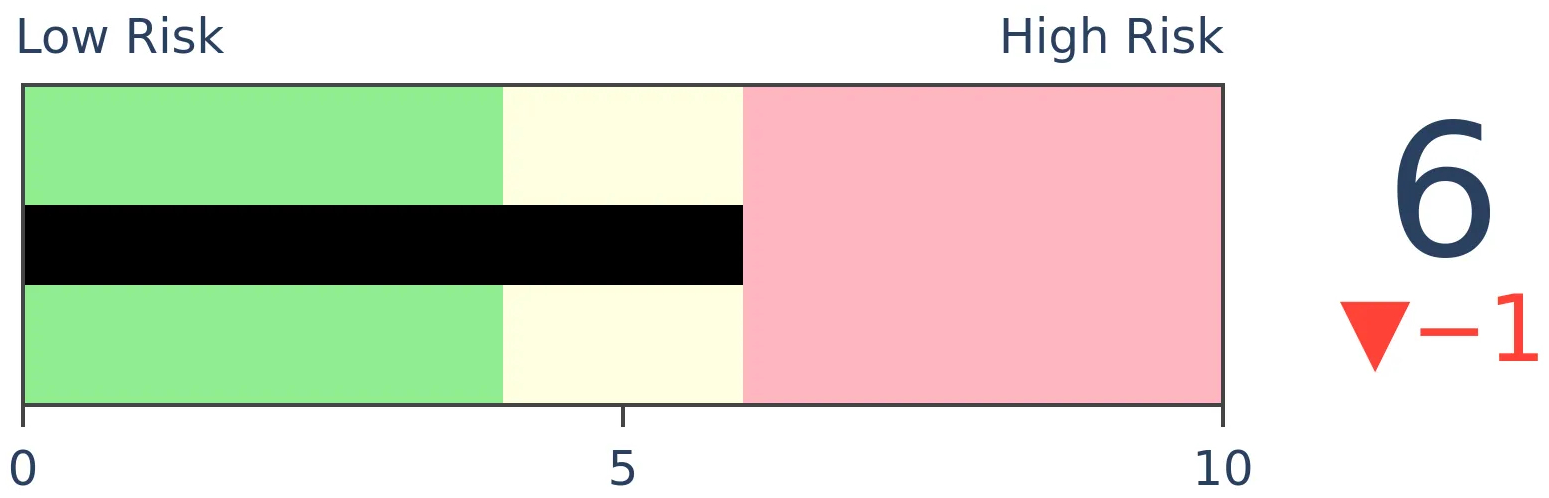
Risk Levels
Stocks Short-Term
|
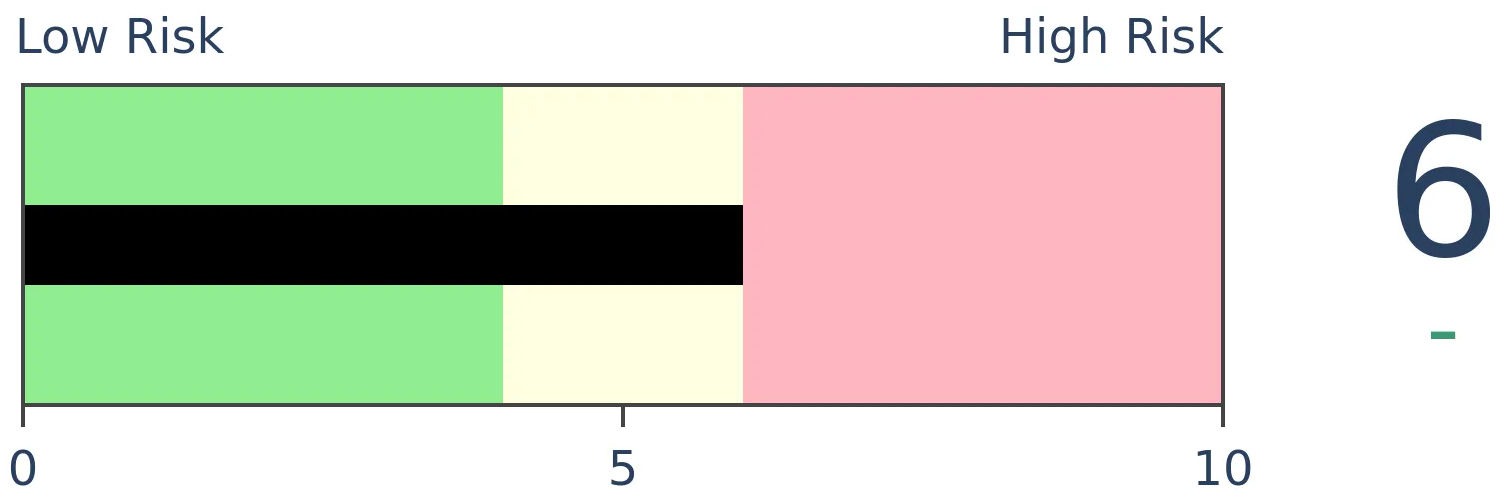
Stocks Medium-Term
|
|
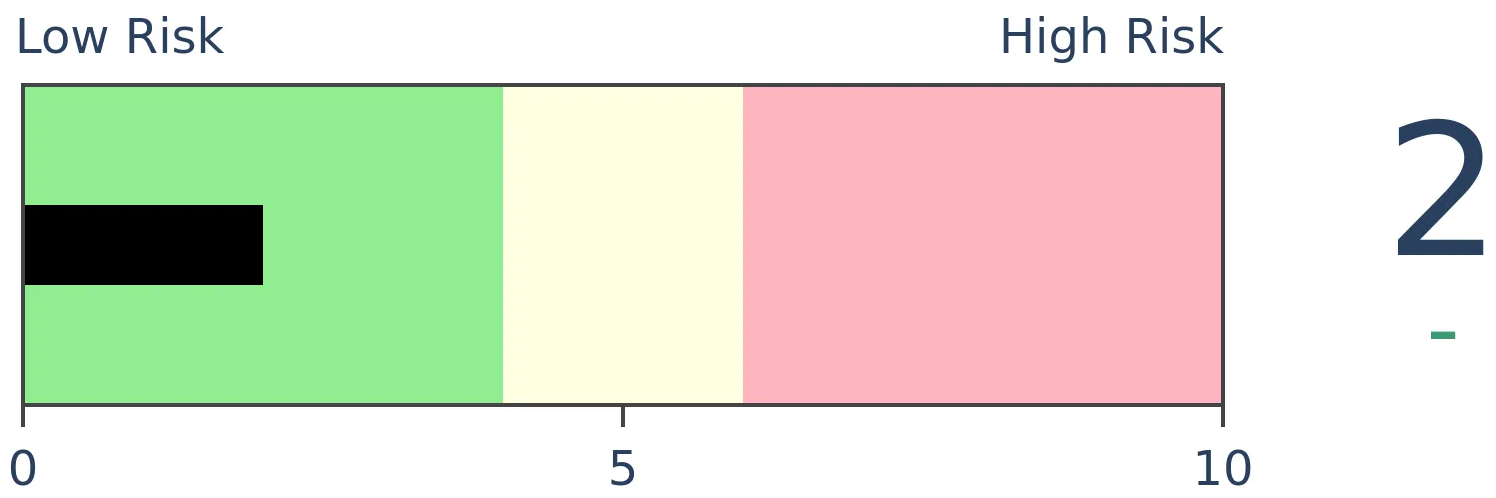
Bonds
|
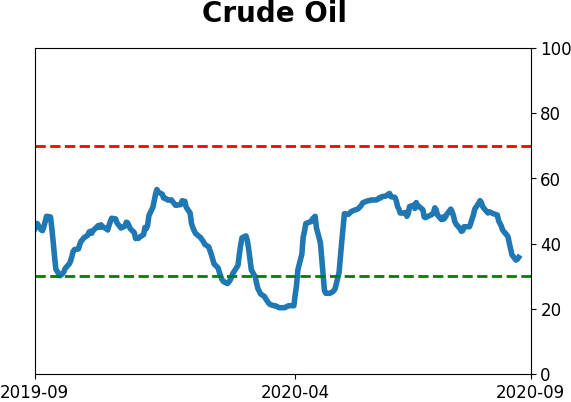
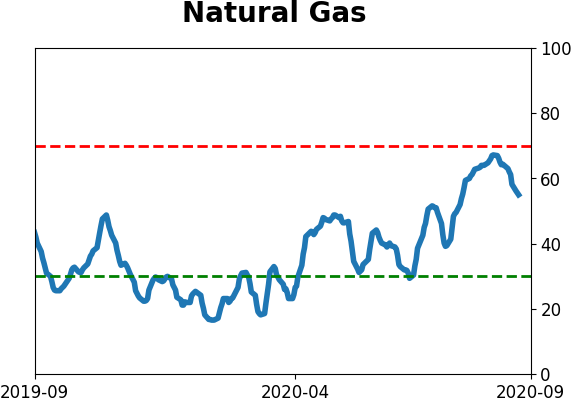
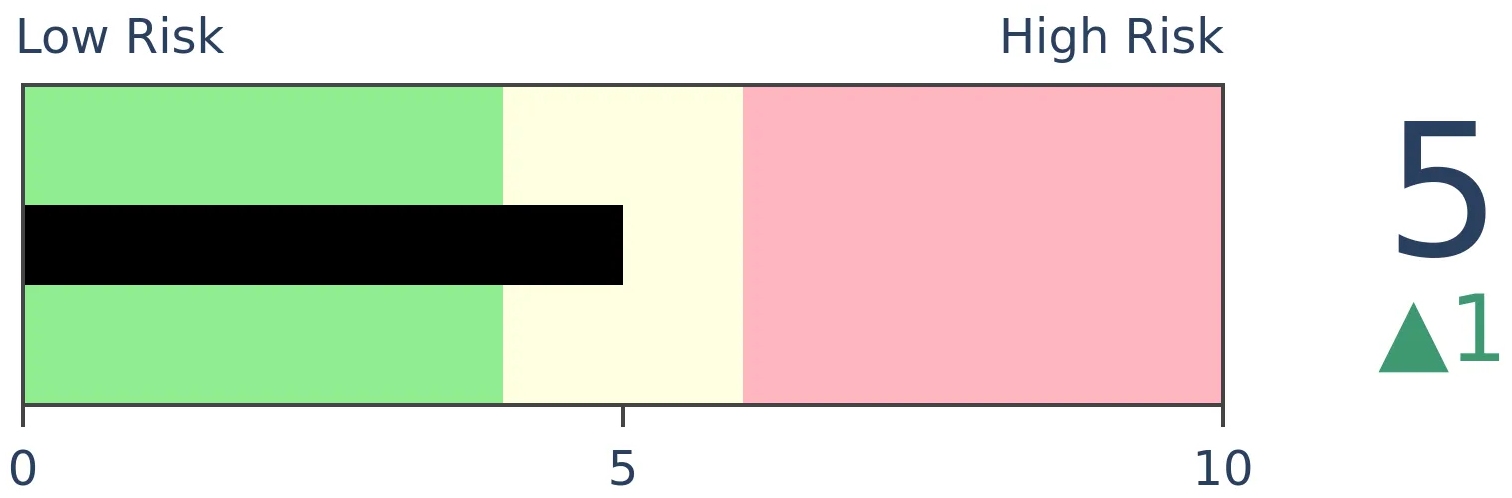
Crude Oil
|
|
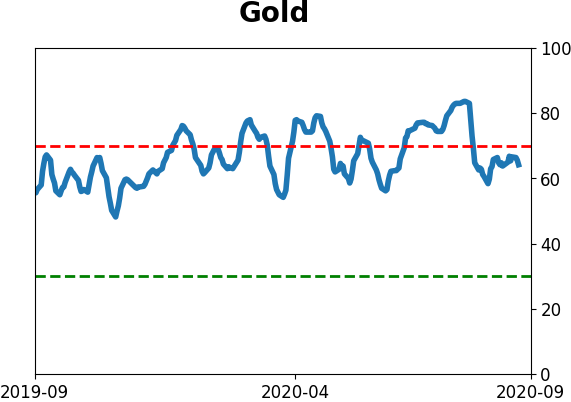
Gold
|
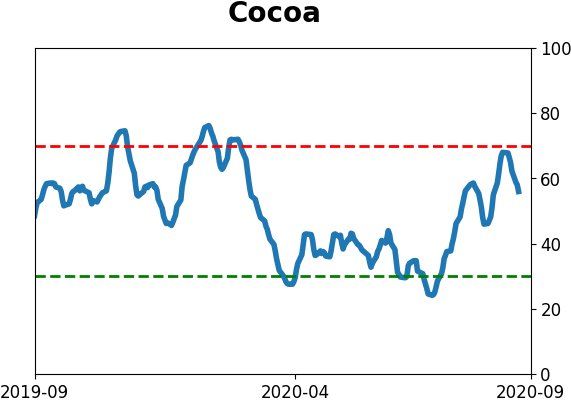
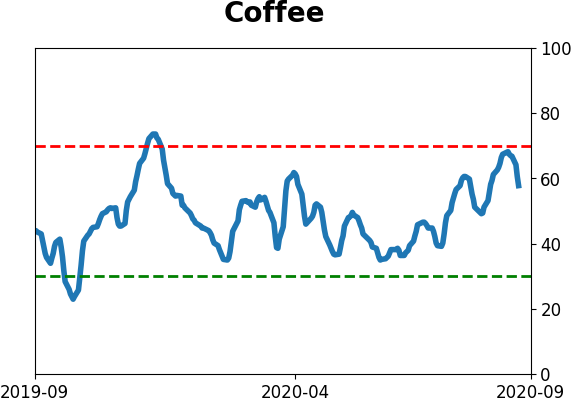
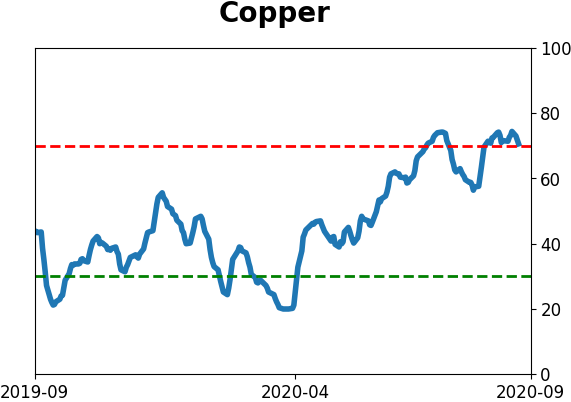
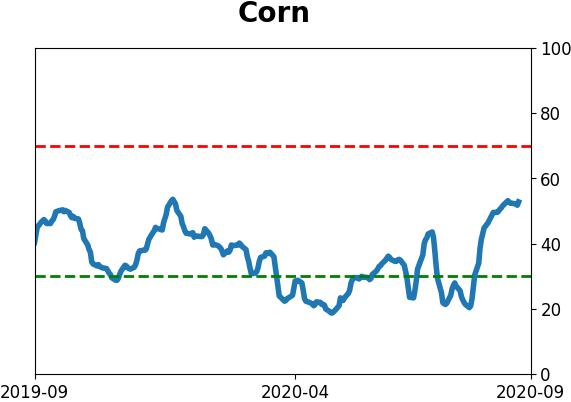
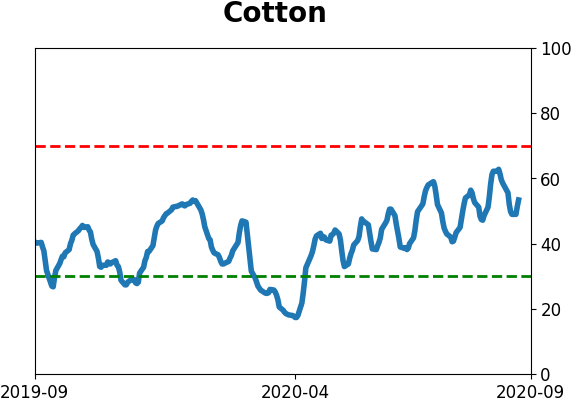
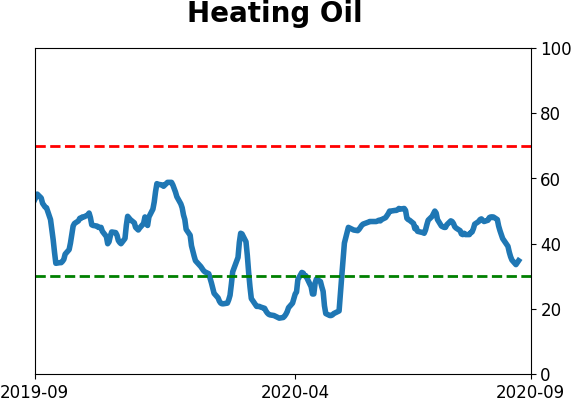
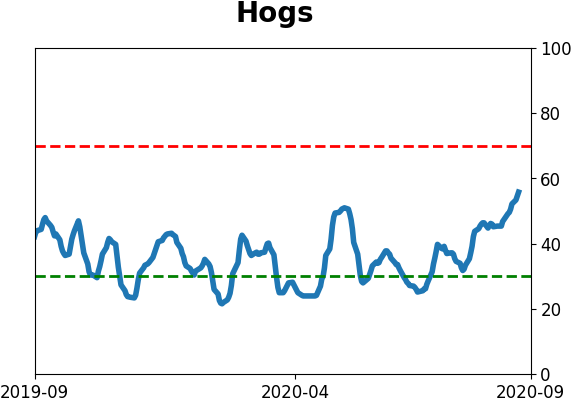
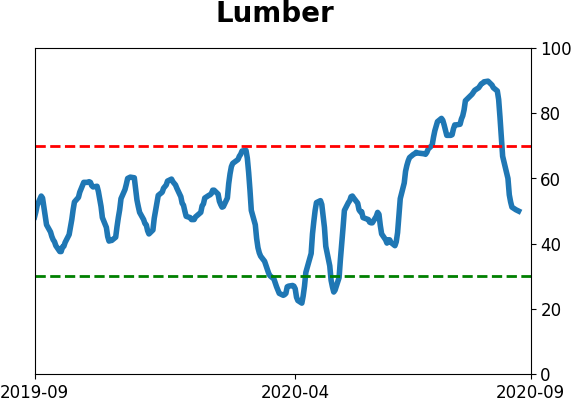
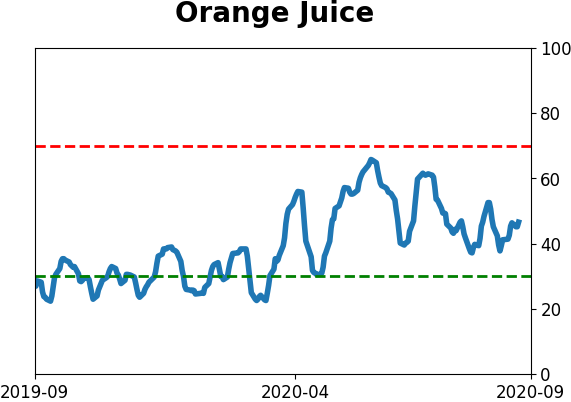
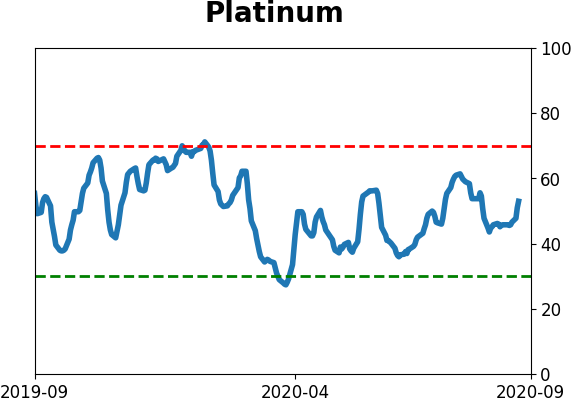
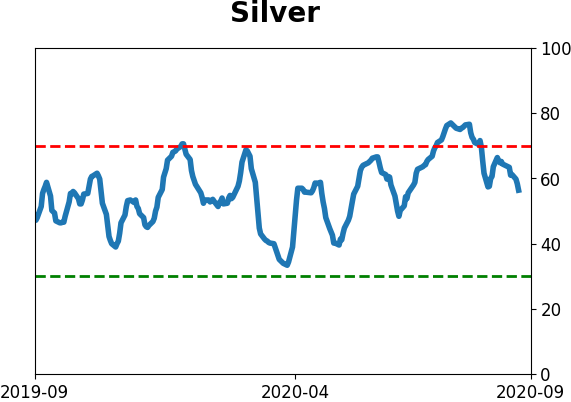
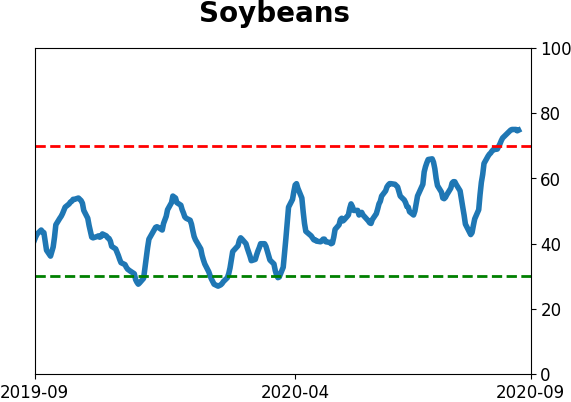
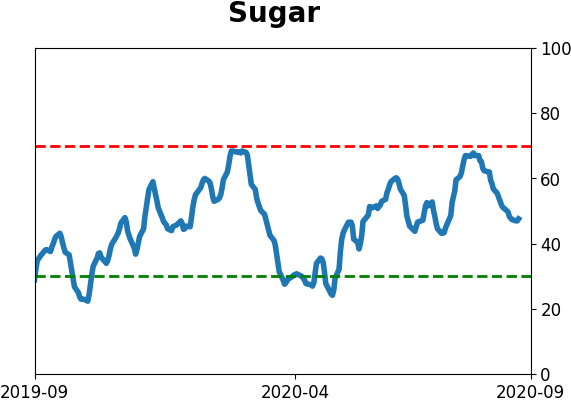
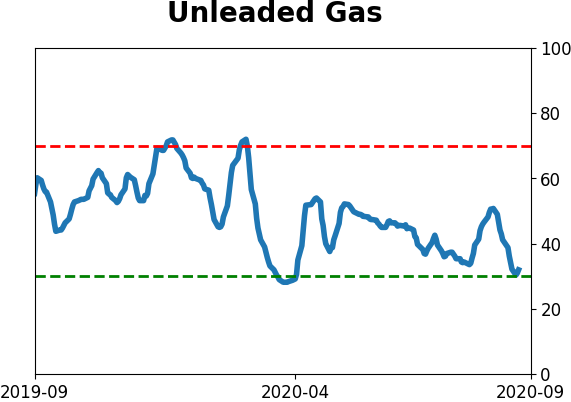
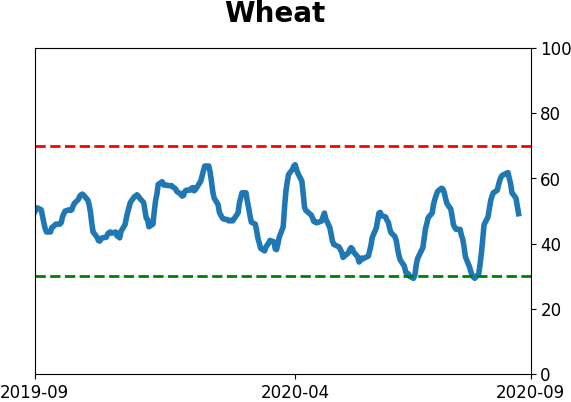
Agriculture
|
|
Research
BOTTOM LINE
Buying among smart money corporate insiders spiked during the spring. It moderated since then, especially in technology stocks. Lately, buying interest has dropped off and the 4-week Velocity of the Buy/Sell Ratio has dropped well into negative territory.
FORECAST / TIMEFRAME
None
|
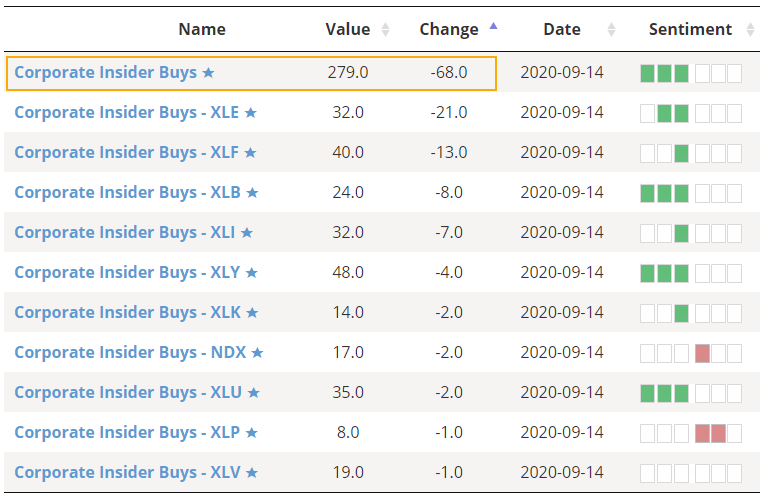
One of the supporting legs of the rally beginning in the spring and lasting through June had been buying pressure from corporate insiders and other "smart money" investors. That began to moderate in August, especially among technology shares.
Lately, buying interest has dropped off significantly among members of the S&P 500. While there are still a large number of buyers over the past 6 months thanks to heavy interest in the spring, it's dropping quickly.
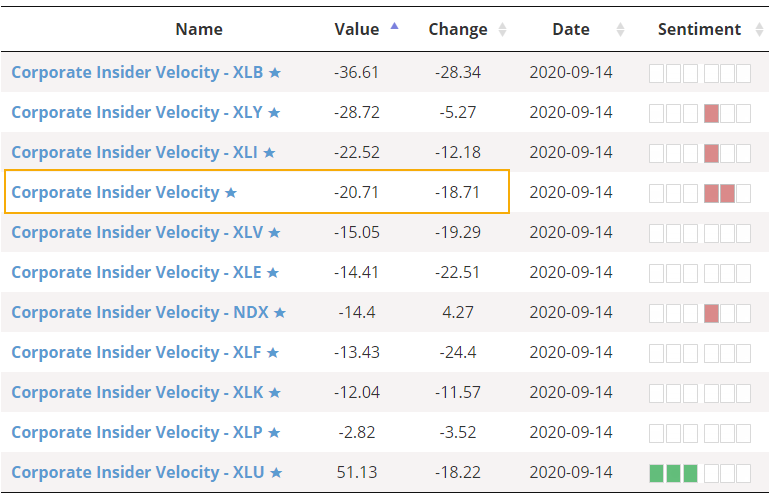
The 4-week rate of change in the Corporate Insider Buy/Sell Ratio, which we call Velocity, has dropped below -20% for stocks in the S&P 500.
According to the Backtest Engine, future returns have been poor whenever broad-market insider Velocity was below 20%.
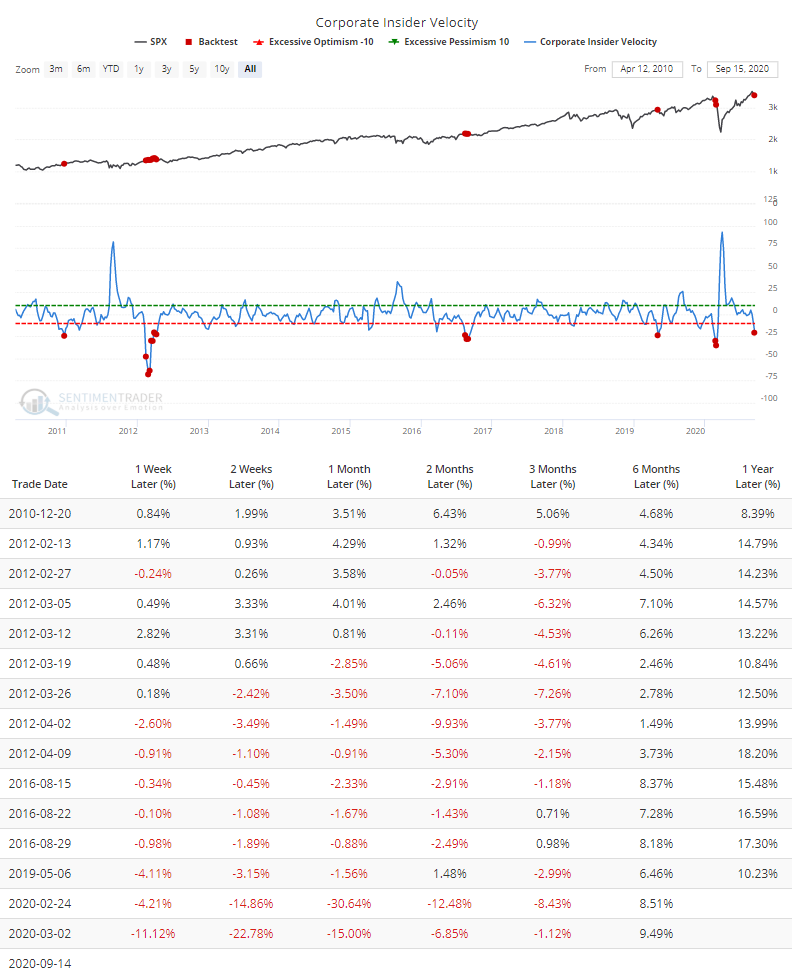
In 2010, this was very early and the S&P 500 managed to tack on more than 5% over the next few months. Those gains were eventually (though temporarily) erased during a subsequent correction but it took a long time to get there. The other signals saw more immediate weakness.
Even though the Buy/Sell Ratio is specific to S&P 500 companies, when there was quick selling pressure (or lack of buying) like this, broader indexes such as the New York Composite performed even worse.
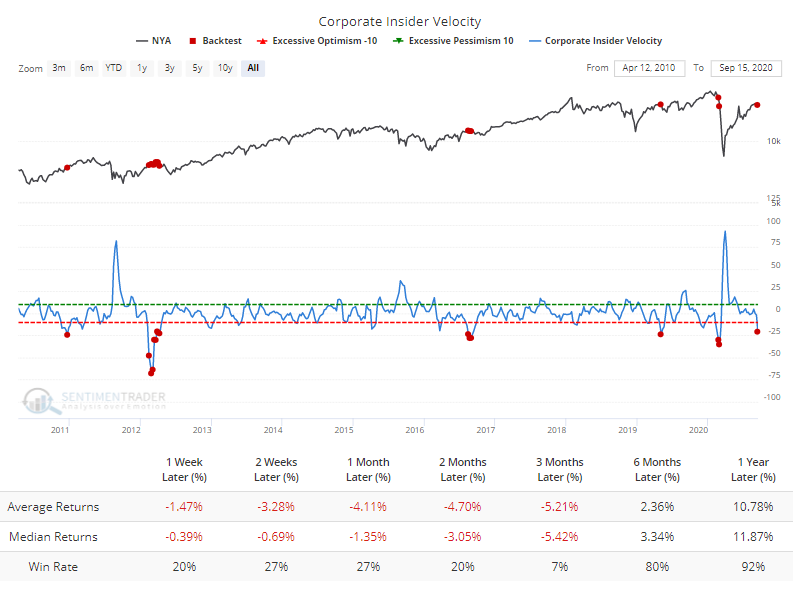
The deeply negative Velocity is a concern, but it's minor. The reason is that the overall level of the Buy/Sell Ratio is still very high and it tends to be a longer-term metric.
Another reflection of "smart money" activity is the First Hour / Last Hour indicator. This compares trading activity during the opening minutes of each day to the closing minutes. Supposedly, the "dumb money" trades during the open, emotionally reacting to overnight and pre-market news, while the "smart money" transacts near the close after they've absorbed all of that day's developments and the behavior of other traders.
This is a shaky theory, especially in recent years when so much of late-day trading volume has been triggered by flows into and out of passive ETFs. Still, divergences between this indicator and stocks have been marginally useful and it tends to shine when making a rapid move up or down, especially if it's against the current trend in averages like the S&P 500 or Dow Industrials.
This is notable now because after surging in March, it has been steadily dropping and has lost more than 2% over the past month.
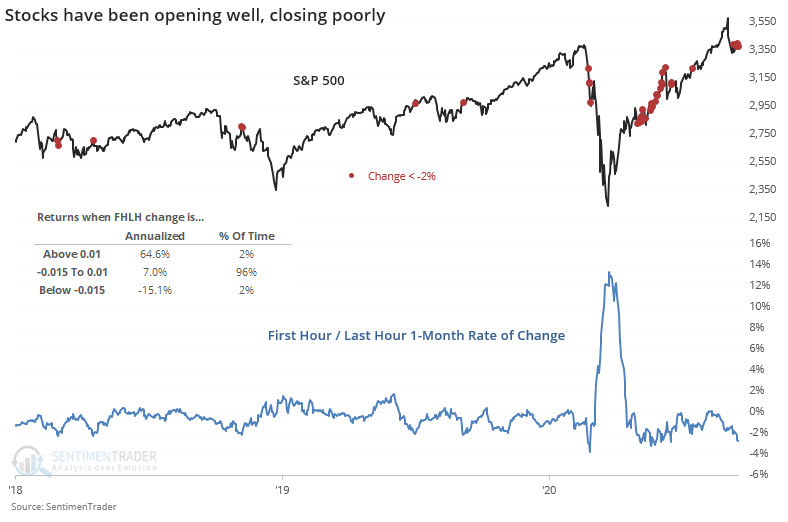
Annualized returns when this rate of change is very negative have been -15.1% as noted in the chart above. We don't put a lot of weight on this, but generally prefer to see this indicator rise as opposed to fall, along with the Smart Money Index (just another version of the same thing, and not to be confused with our Smart Money Confidence model).
Other measures of "smart money" activity, like hedgers' positions in equity index futures, are not confirming any wholesale effort to bet against stocks.
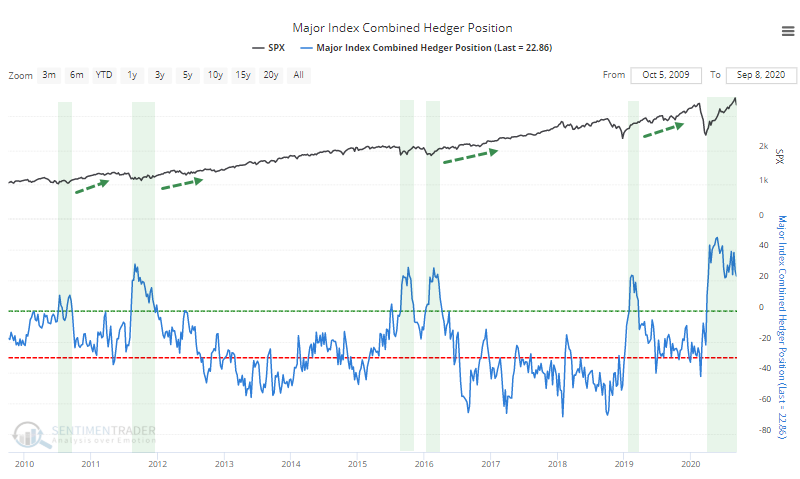
This was a nice confirming signal of a bullish bias in March and April, then it started to get weird when hedgers weren't selling as stocks rose. That should be even more positive on the surface, but the trouble is that it's different from how they've behaved at every other juncture in the past 10 years. When indicators act differently from how they have in the past, it should give pause that maybe something has changed.
Overall, "smart money" indicators are showing a very slight worry as they moderate, but generally it's coming from very positive positions and isn't a major concern here. The biggest worries for stocks remain the unbounded enthusiasm among options traders and some questionable internal momentum developments from August, though that has moderated a bit this week.
Active Studies
| Time Frame | Bullish | Bearish | | Short-Term | 0 | 1 | | Medium-Term | 1 | 12 | | Long-Term | 47 | 2 |
|
Indicators at Extremes
Portfolio
| Position | Weight % | Added / Reduced | Date | | Stocks | 15.2 | Reduced 4.2% | 2020-09-03 | | Bonds | 30.0 | Added 30% | 2020-09-09 | | Commodities | 2.4 | Reduced 2.1%
| 2020-09-04 | | Precious Metals | 5.0 | Added 5% | 2020-09-09 | | Special Situations | 4.9 | Added 5.1% | 2020-09-03 | | Cash | 42.5 | | |
|
Updates (Changes made today are underlined)
After stocks bottomed on March 23rd, they enjoyed a historic buying thrust and retraced a larger amount of the decline than "just a bear market rally" tends to. Through June, there were signs of breadth thrusts, recoveries, and trend changes that have an almost unblemished record at preceding higher prices over a 6-12 month time frame. On a shorter-term basis, our indicators have been showing high optimism, with Dumb Money Confidence recently above 80%, along with signs of reckless speculation during what appears to be an unhealthy market environment, historically a bad combination. While there are certainly some outlier indicators that are showing apathy or even outright pessimism, a weight-of-the-evidence approach suggests high risk over a multi-week to multi-month time frame. That has been the case since July, even arguably June and yet the major indexes hit continual new highs through late August. With the indicators and studies failing to precede any weakness, I've been hesitant to lower my already-low exposure. I am getting increasingly anxious about the oddities we're seeing, though, and lowered it again. This account is mostly about comfort with risk for me, and right now I'm not at all comfortable with any of it. In more than 25 years of experience, this is the oddest market I've ever seen. I lowered exposure again - likely the lowest I'm willing to go at this point given longer-term positives - and decided to switch to an equal-weight version of the S&P 500 index. I've become intensely uncomfortable with the concentration in the cap-weighted index. Our studies have been mixed with regard to the potential for the equal-weight version to outperform the cap version going forward, so historical support isn't overwhelming. I'm also increasingly interested again in energy stocks, starting with a small allocation. I got burned in March with the unprecedented geopolitical spat that hammered those stocks then but the longer-term setup is decent. In this account, I’ve roughly followed what has become known as the All Weather portfolio popularized by Ray Dalio. It allocates across four broad assets, designed to hold up no matter the market environment. The goal is modest positive returns while limiting large, sustained losses. I typically use popular ETFs, with low costs. At times, I will swap out for a fund I believe has better prospects, or simply lower fees if not. At other times, I will diverge quite a bit from baseline allocations, largely depending on the indicators and studies we discuss on the site. I've gotten away from this in the past, using "cash" as a substitute for "bonds" and with rates stuck at 0%, that has become less appetizing. I'm trying to get back more toward the baselines with less dramatic swings in either direction. The base allocation I use is the following: Stocks: 35%
Bonds: 45%
Precious Metals: 7.5%
Commodities: 7.5%
Cash / Special Opportunities: 5%
RETURN YTD: -0.3% 2019: 12.6%, 2018: 0.6%, 2017: 3.8%, 2016: 17.1%, 2015: 9.2%, 2014: 14.5%, 2013: 2.2%, 2012: 10.8%, 2011: 16.5%, 2010: 15.3%, 2009: 23.9%, 2008: 16.2%, 2007: 7.8%
|
|
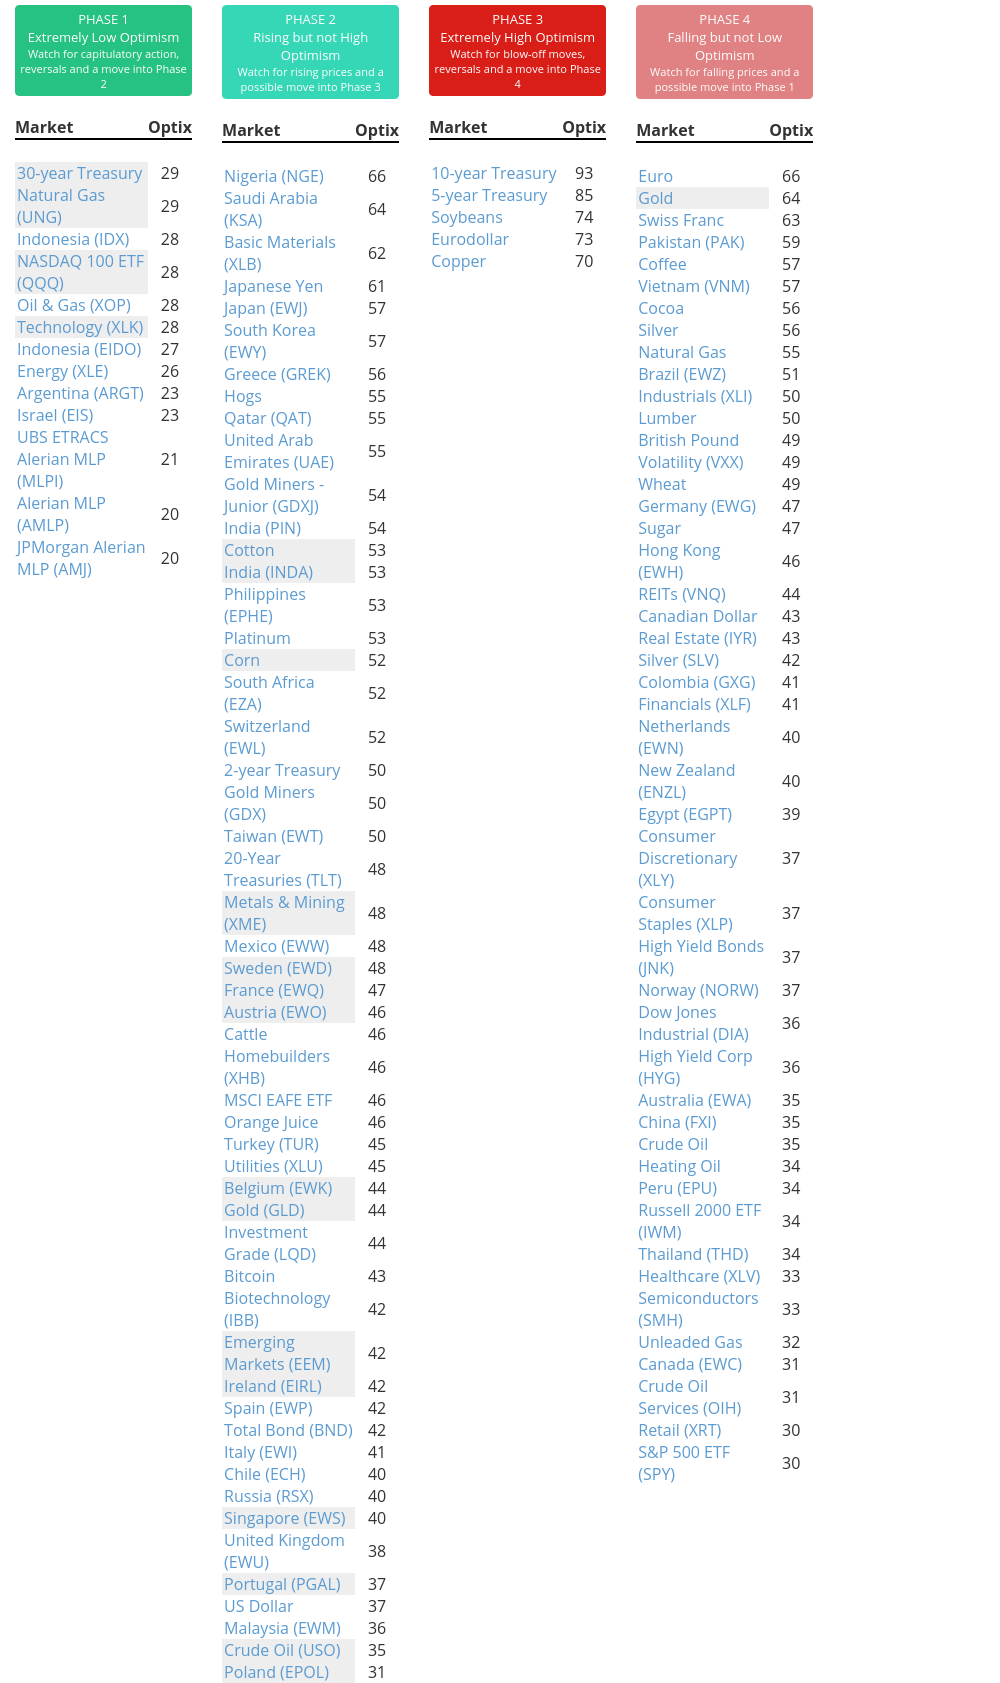
Phase Table
Ranks
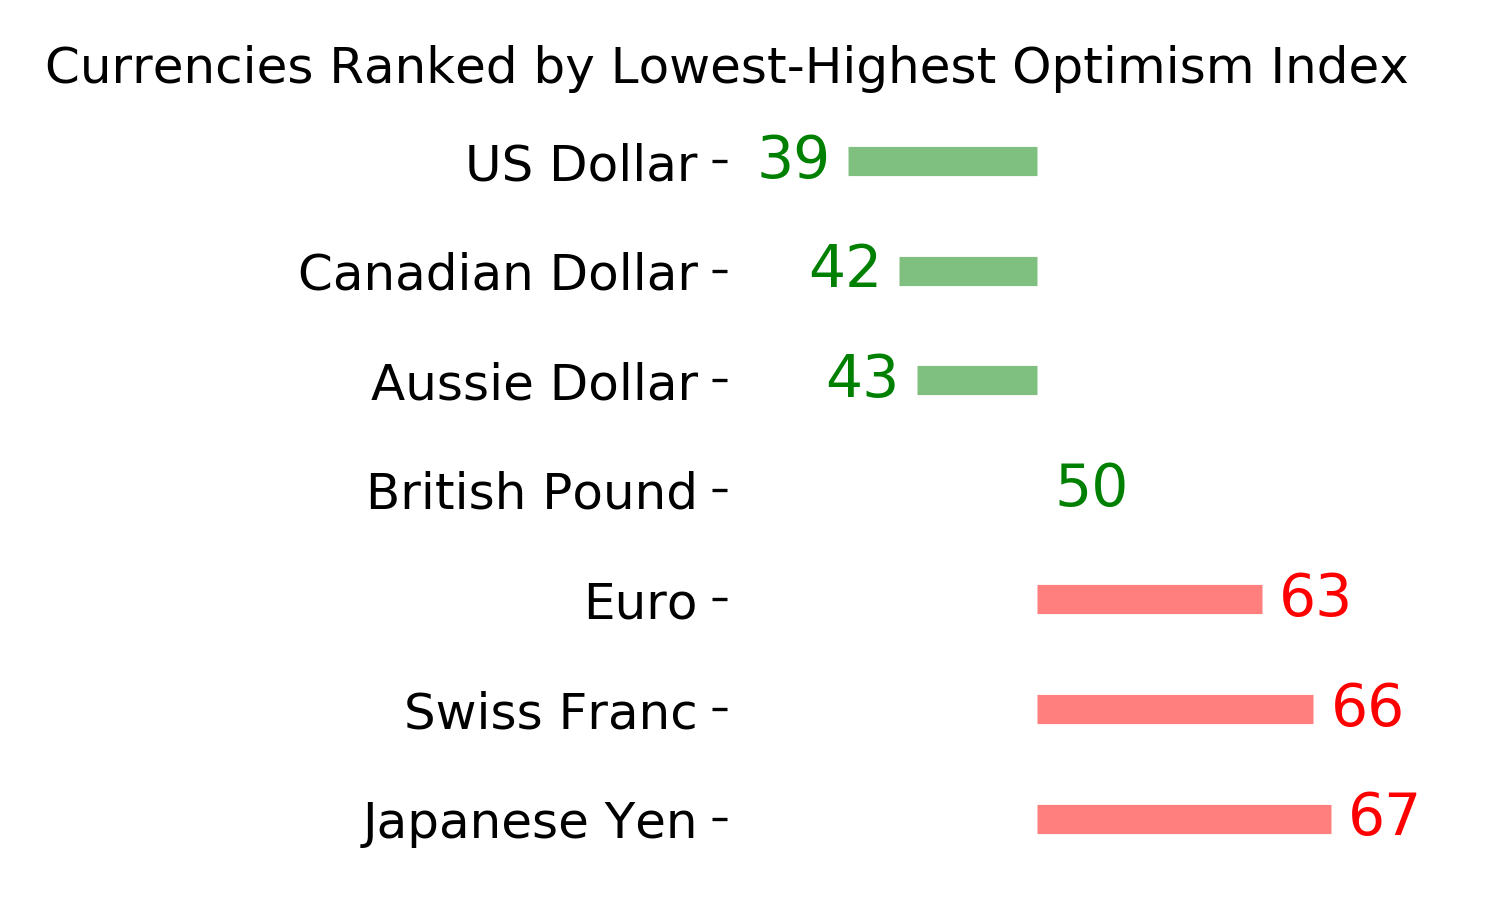
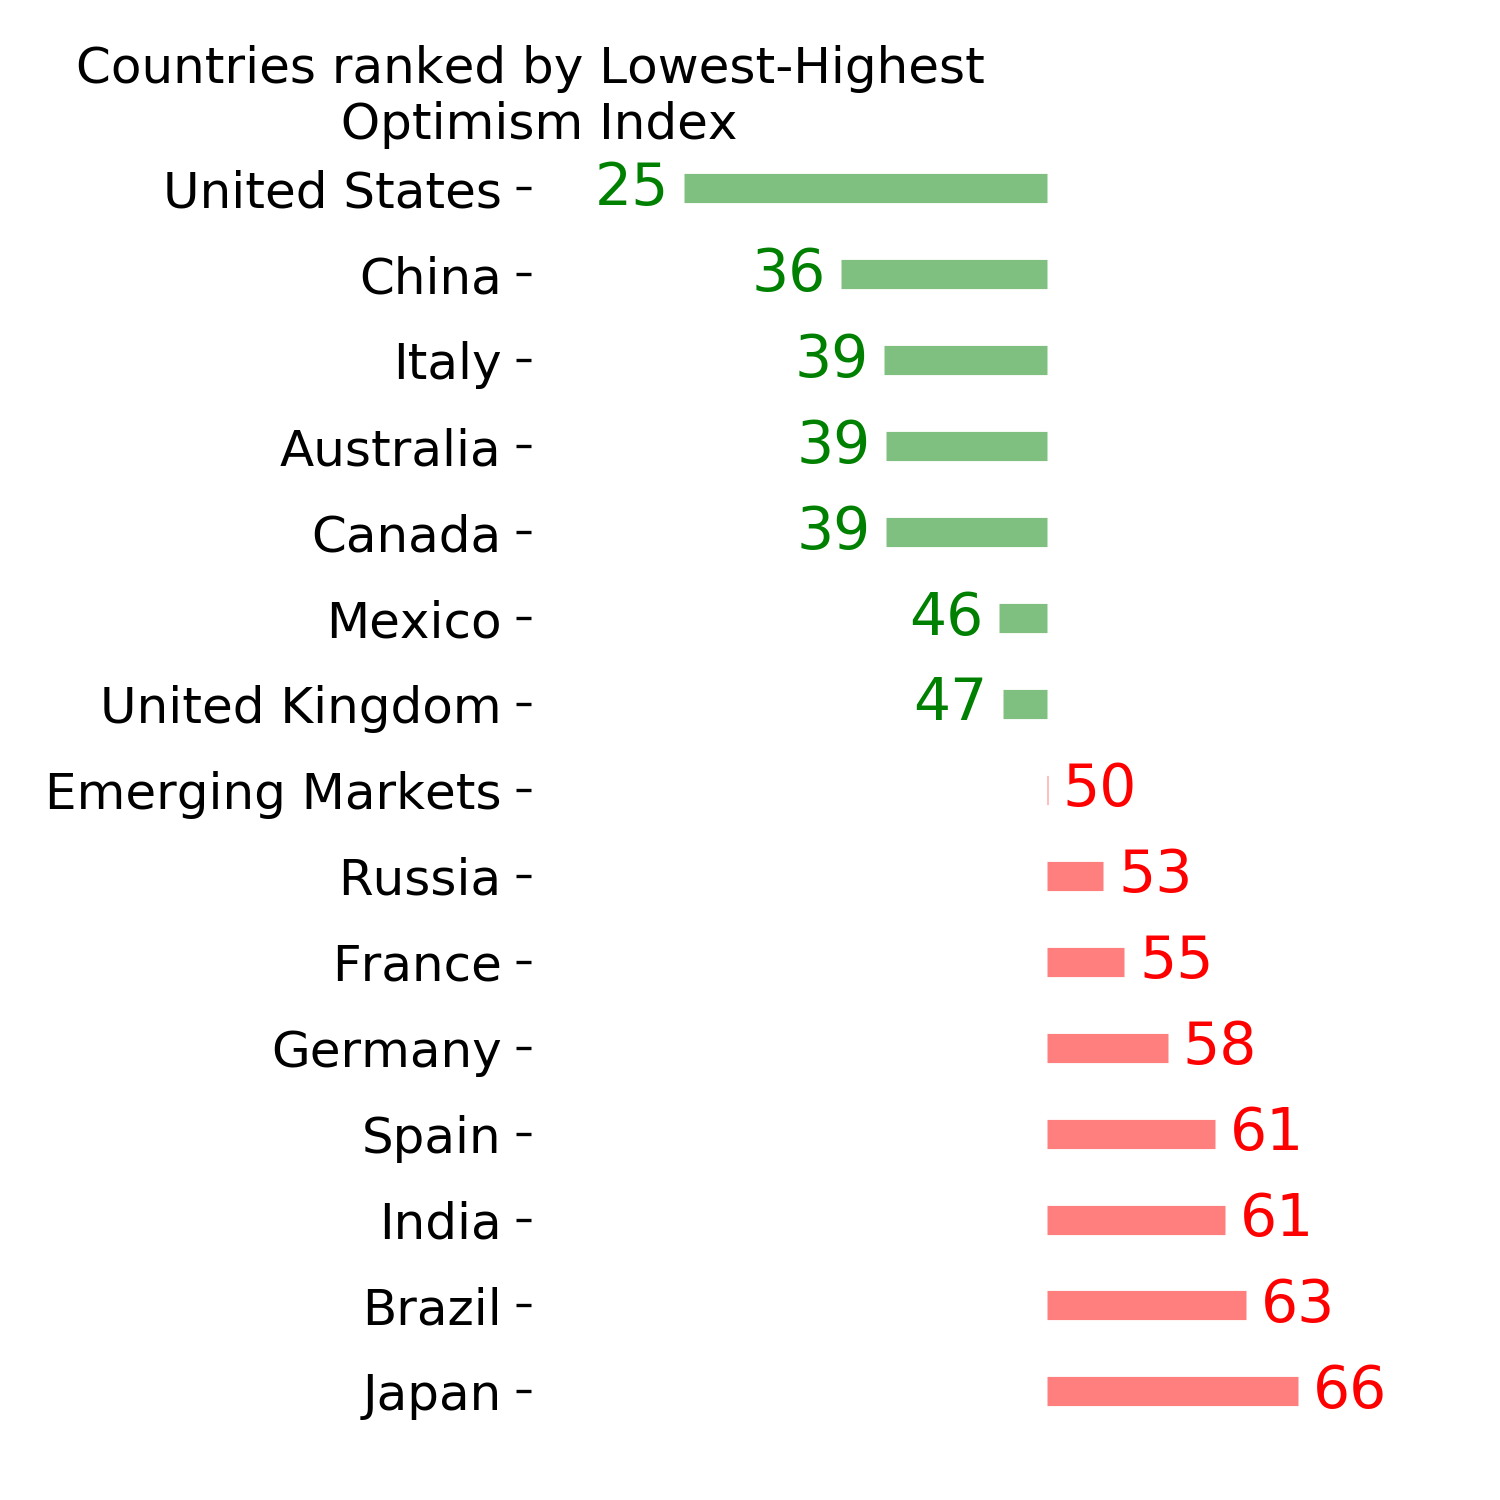
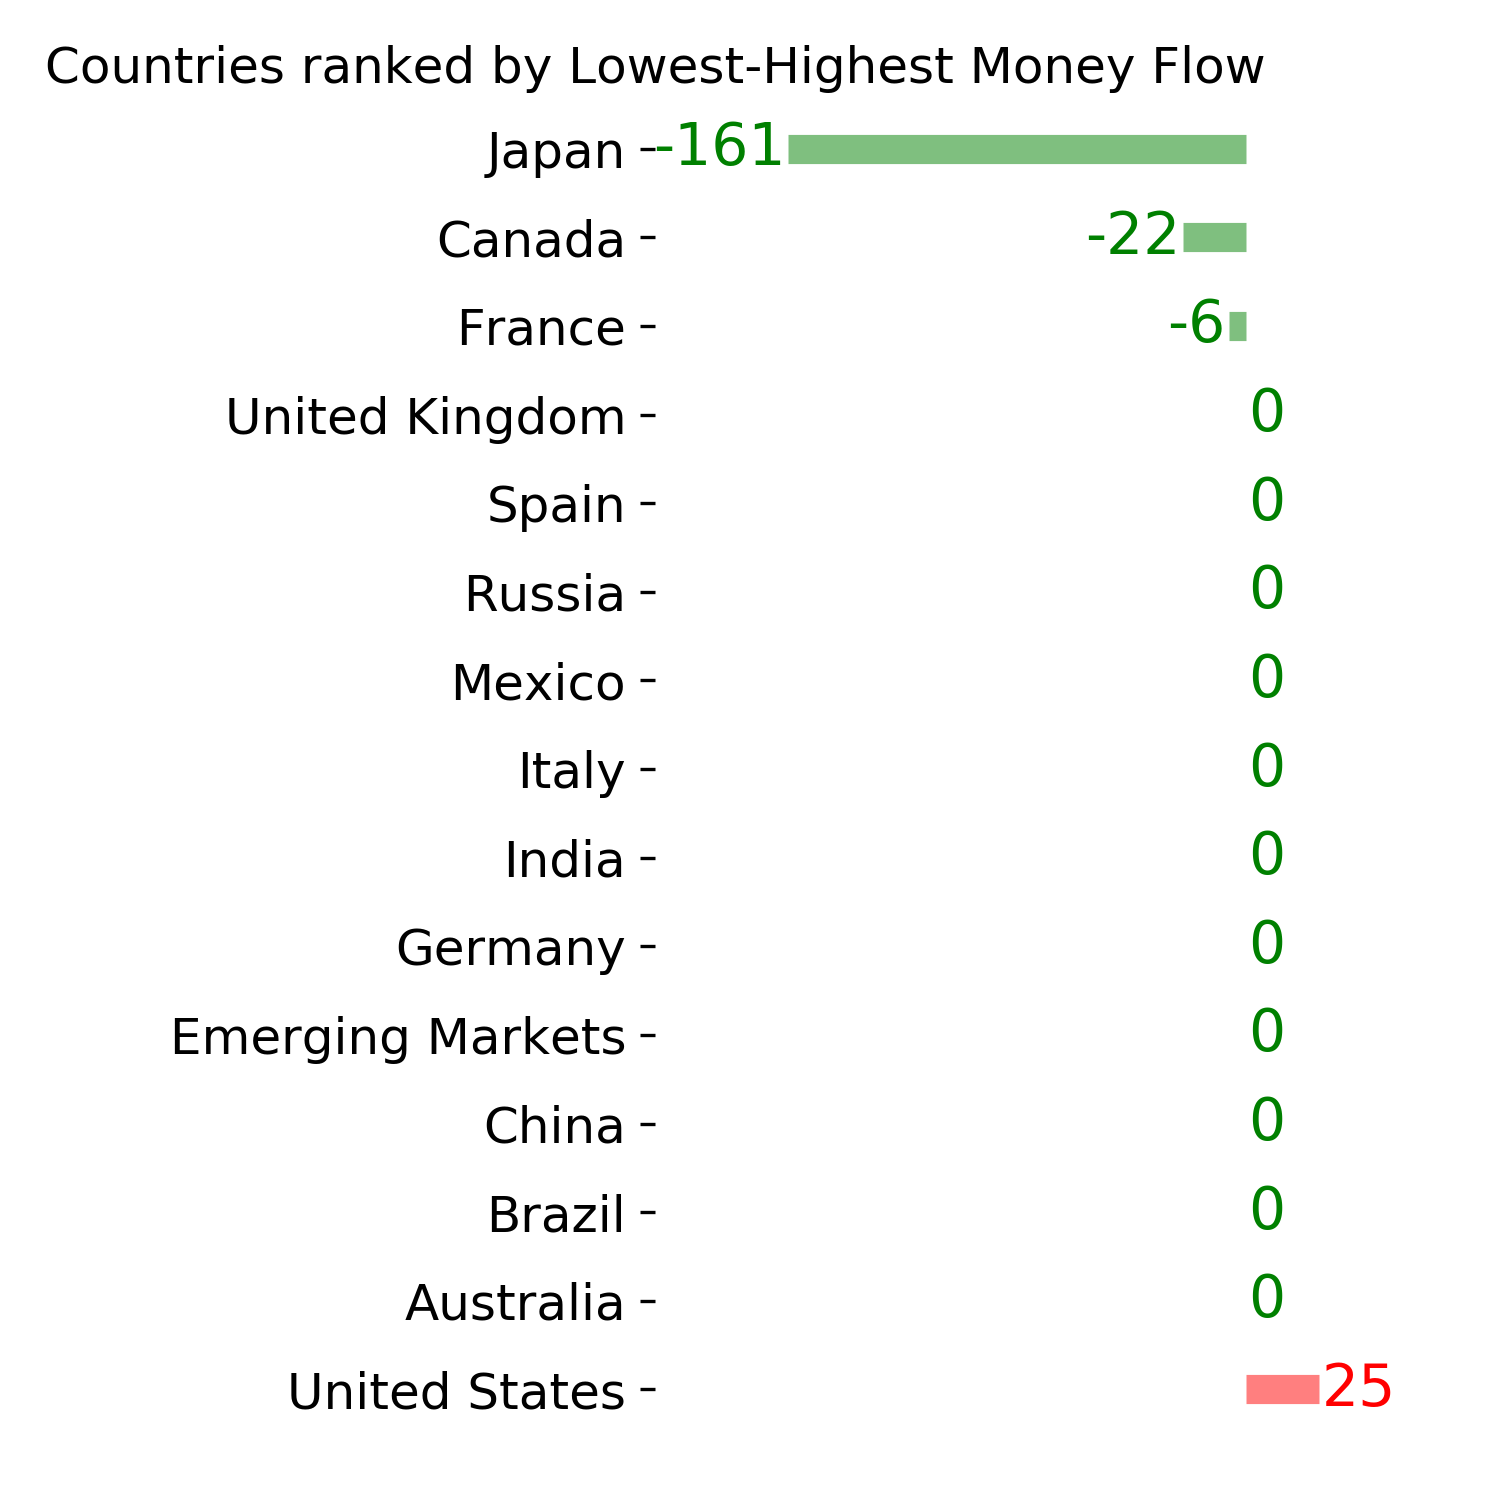
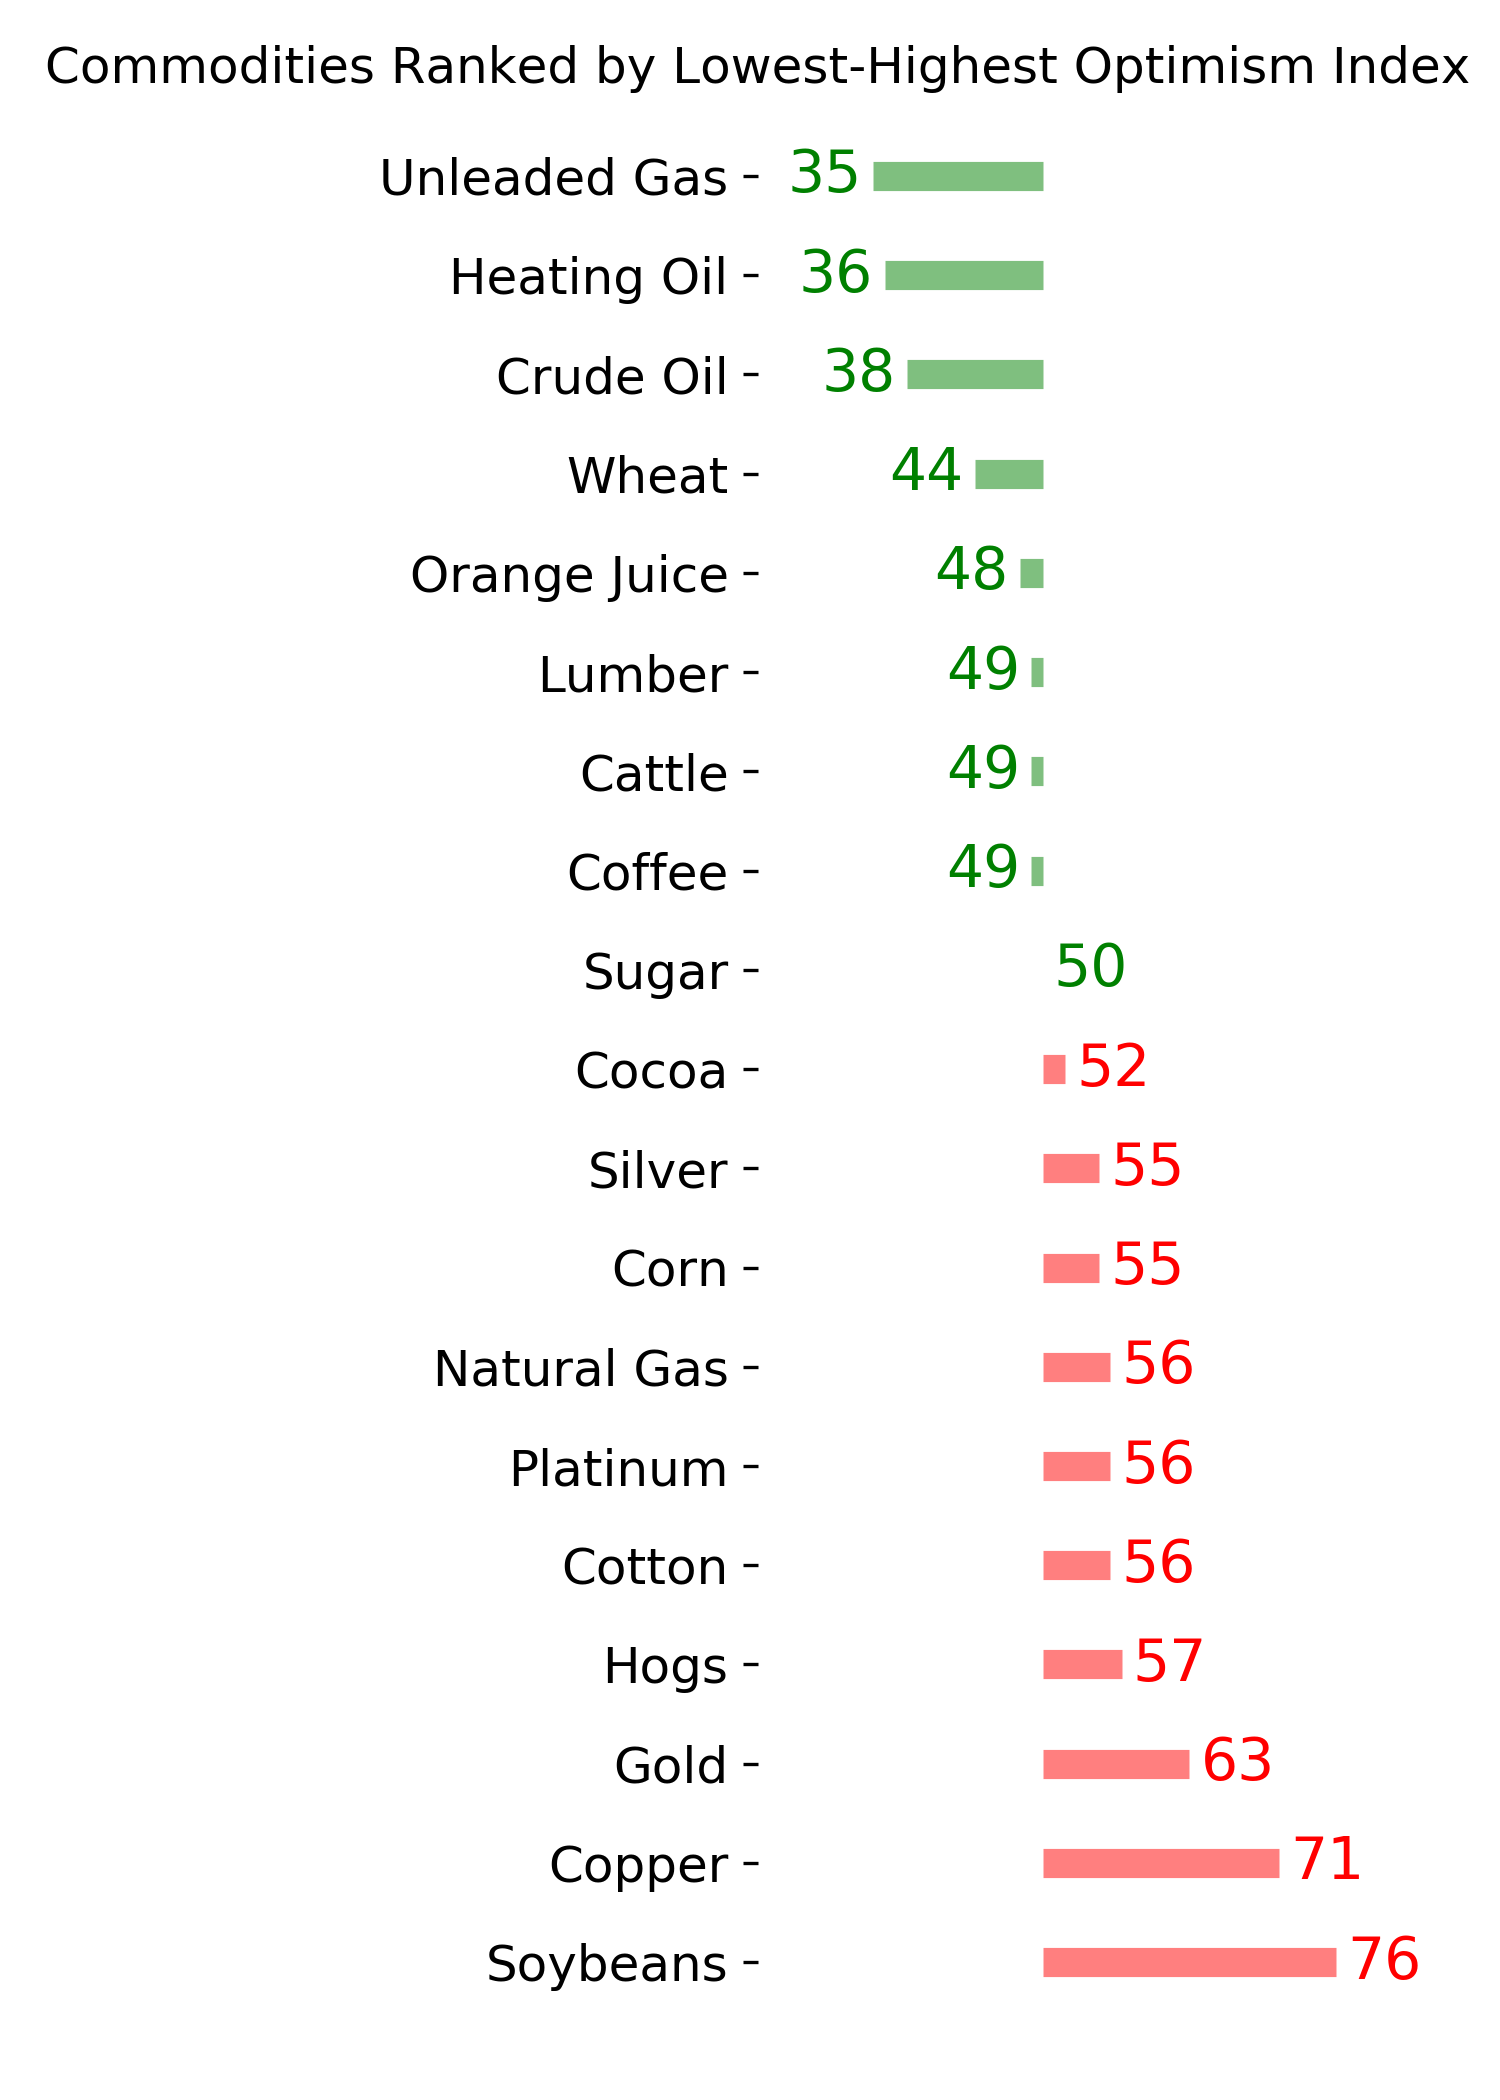
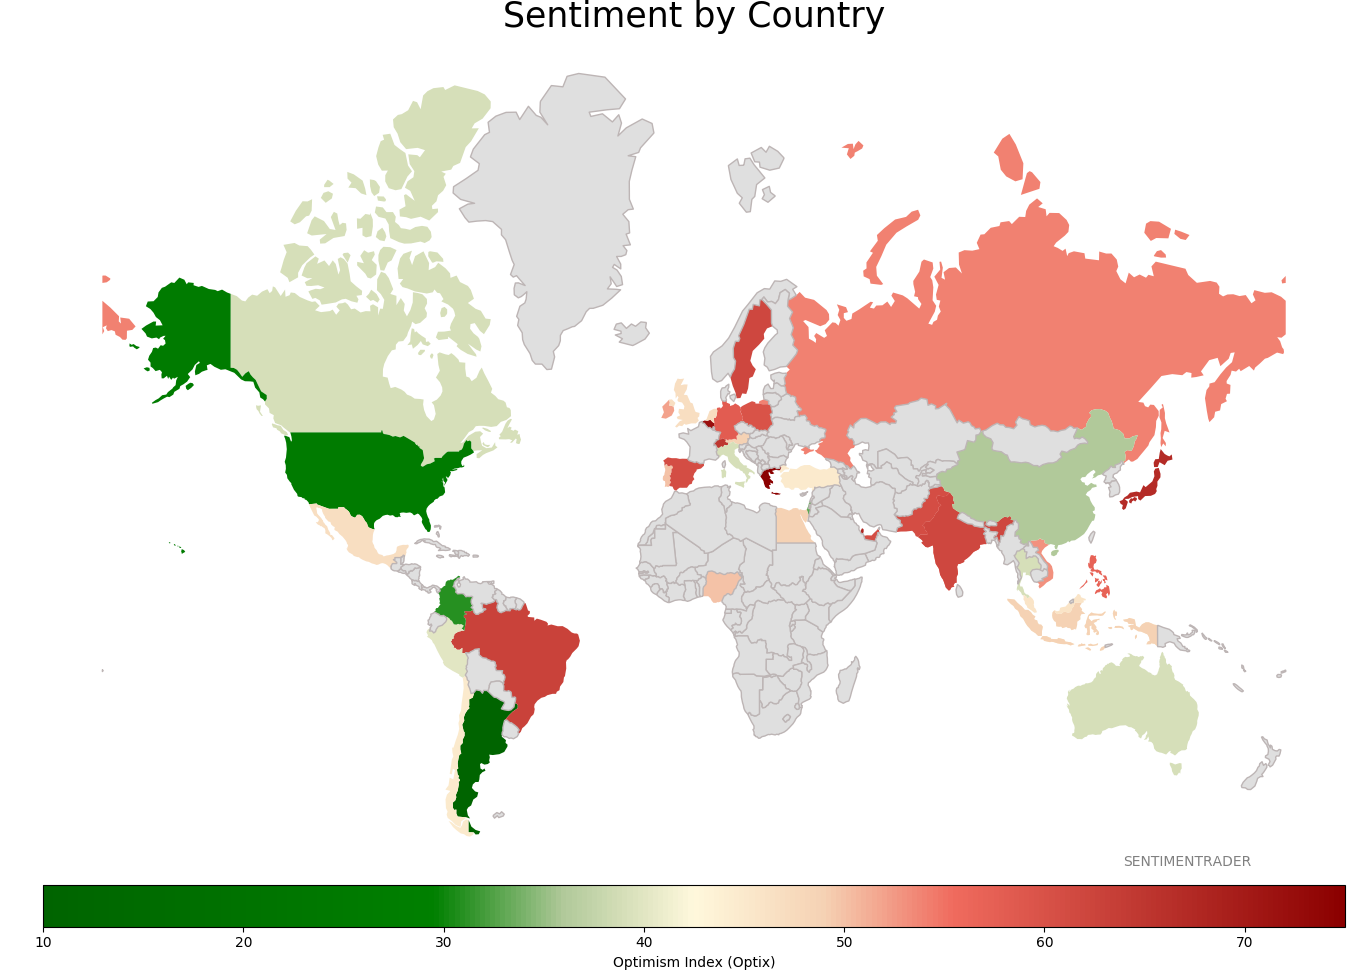
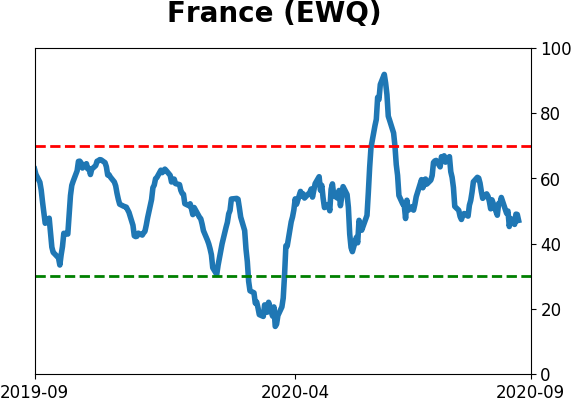
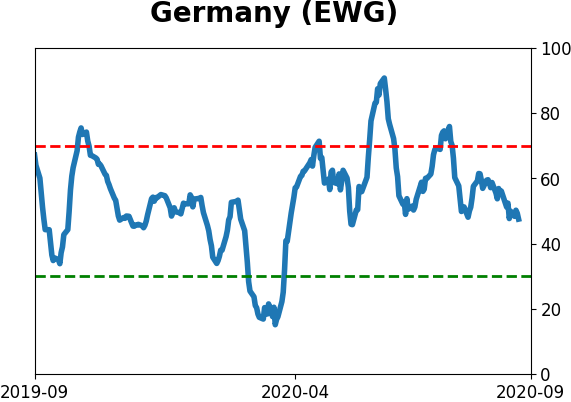
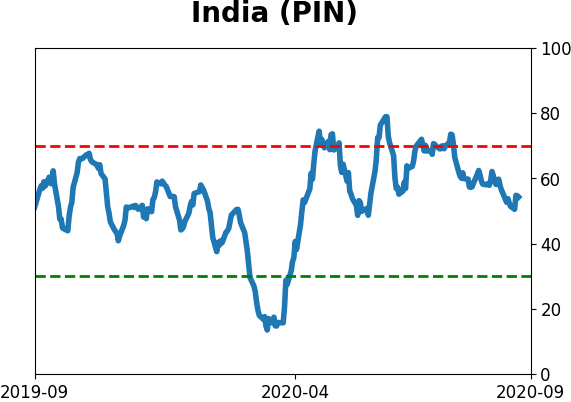
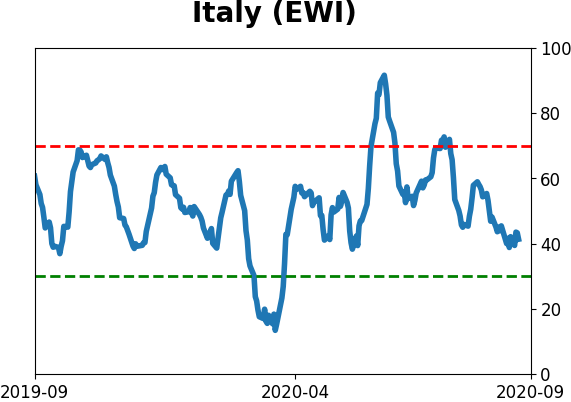
Sentiment Around The World
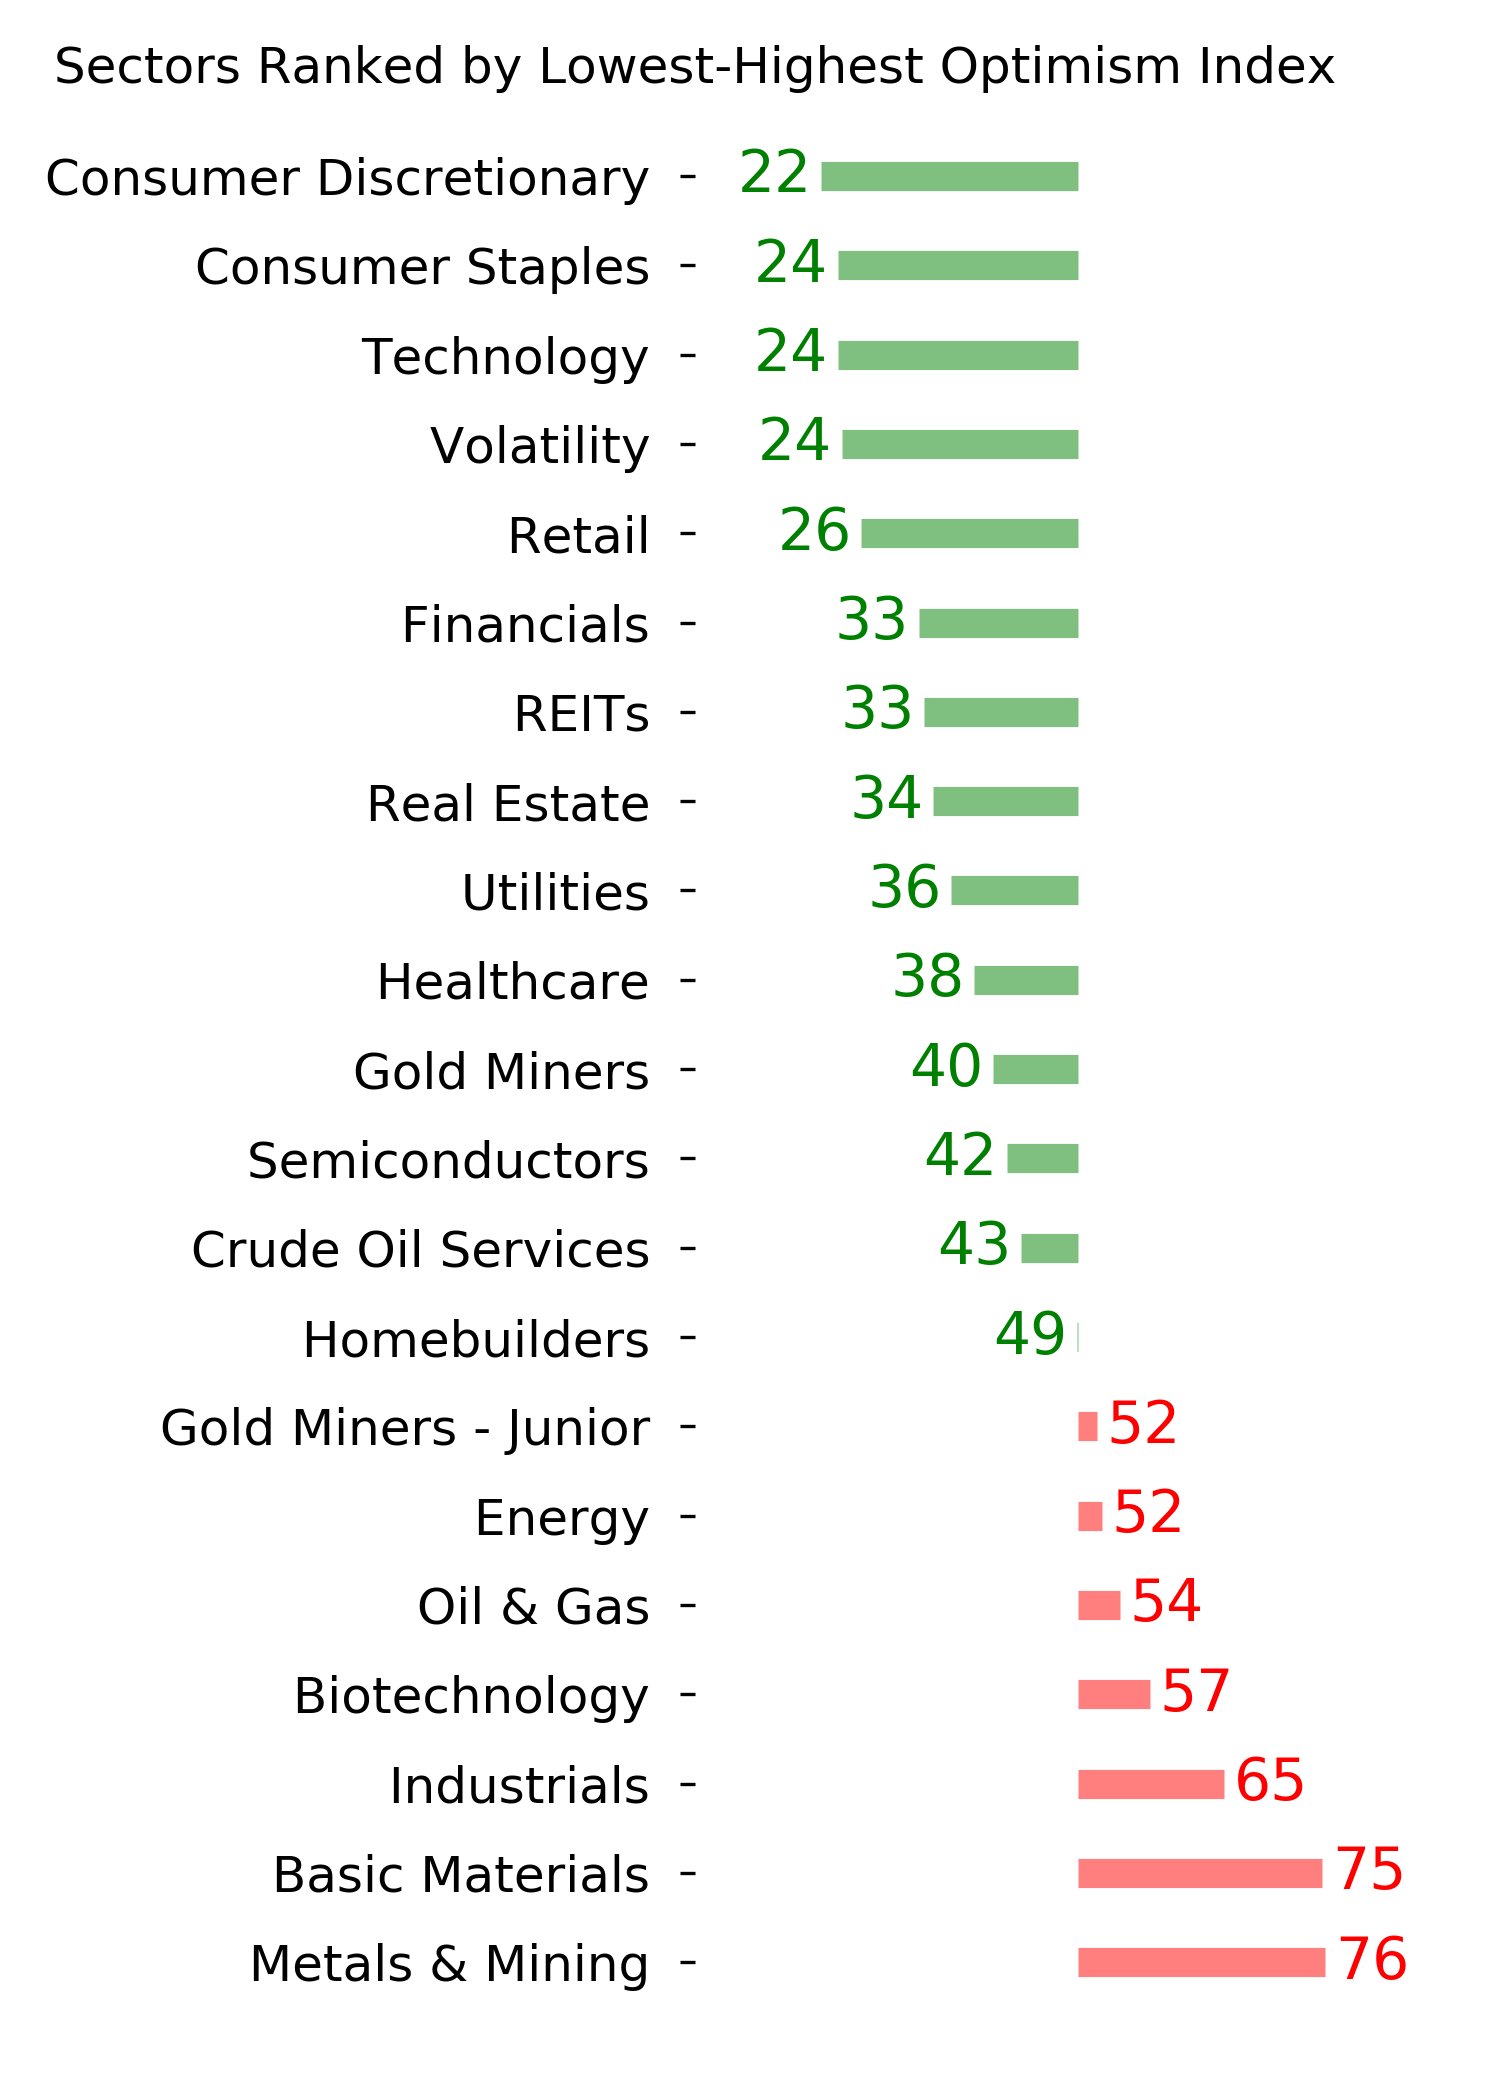
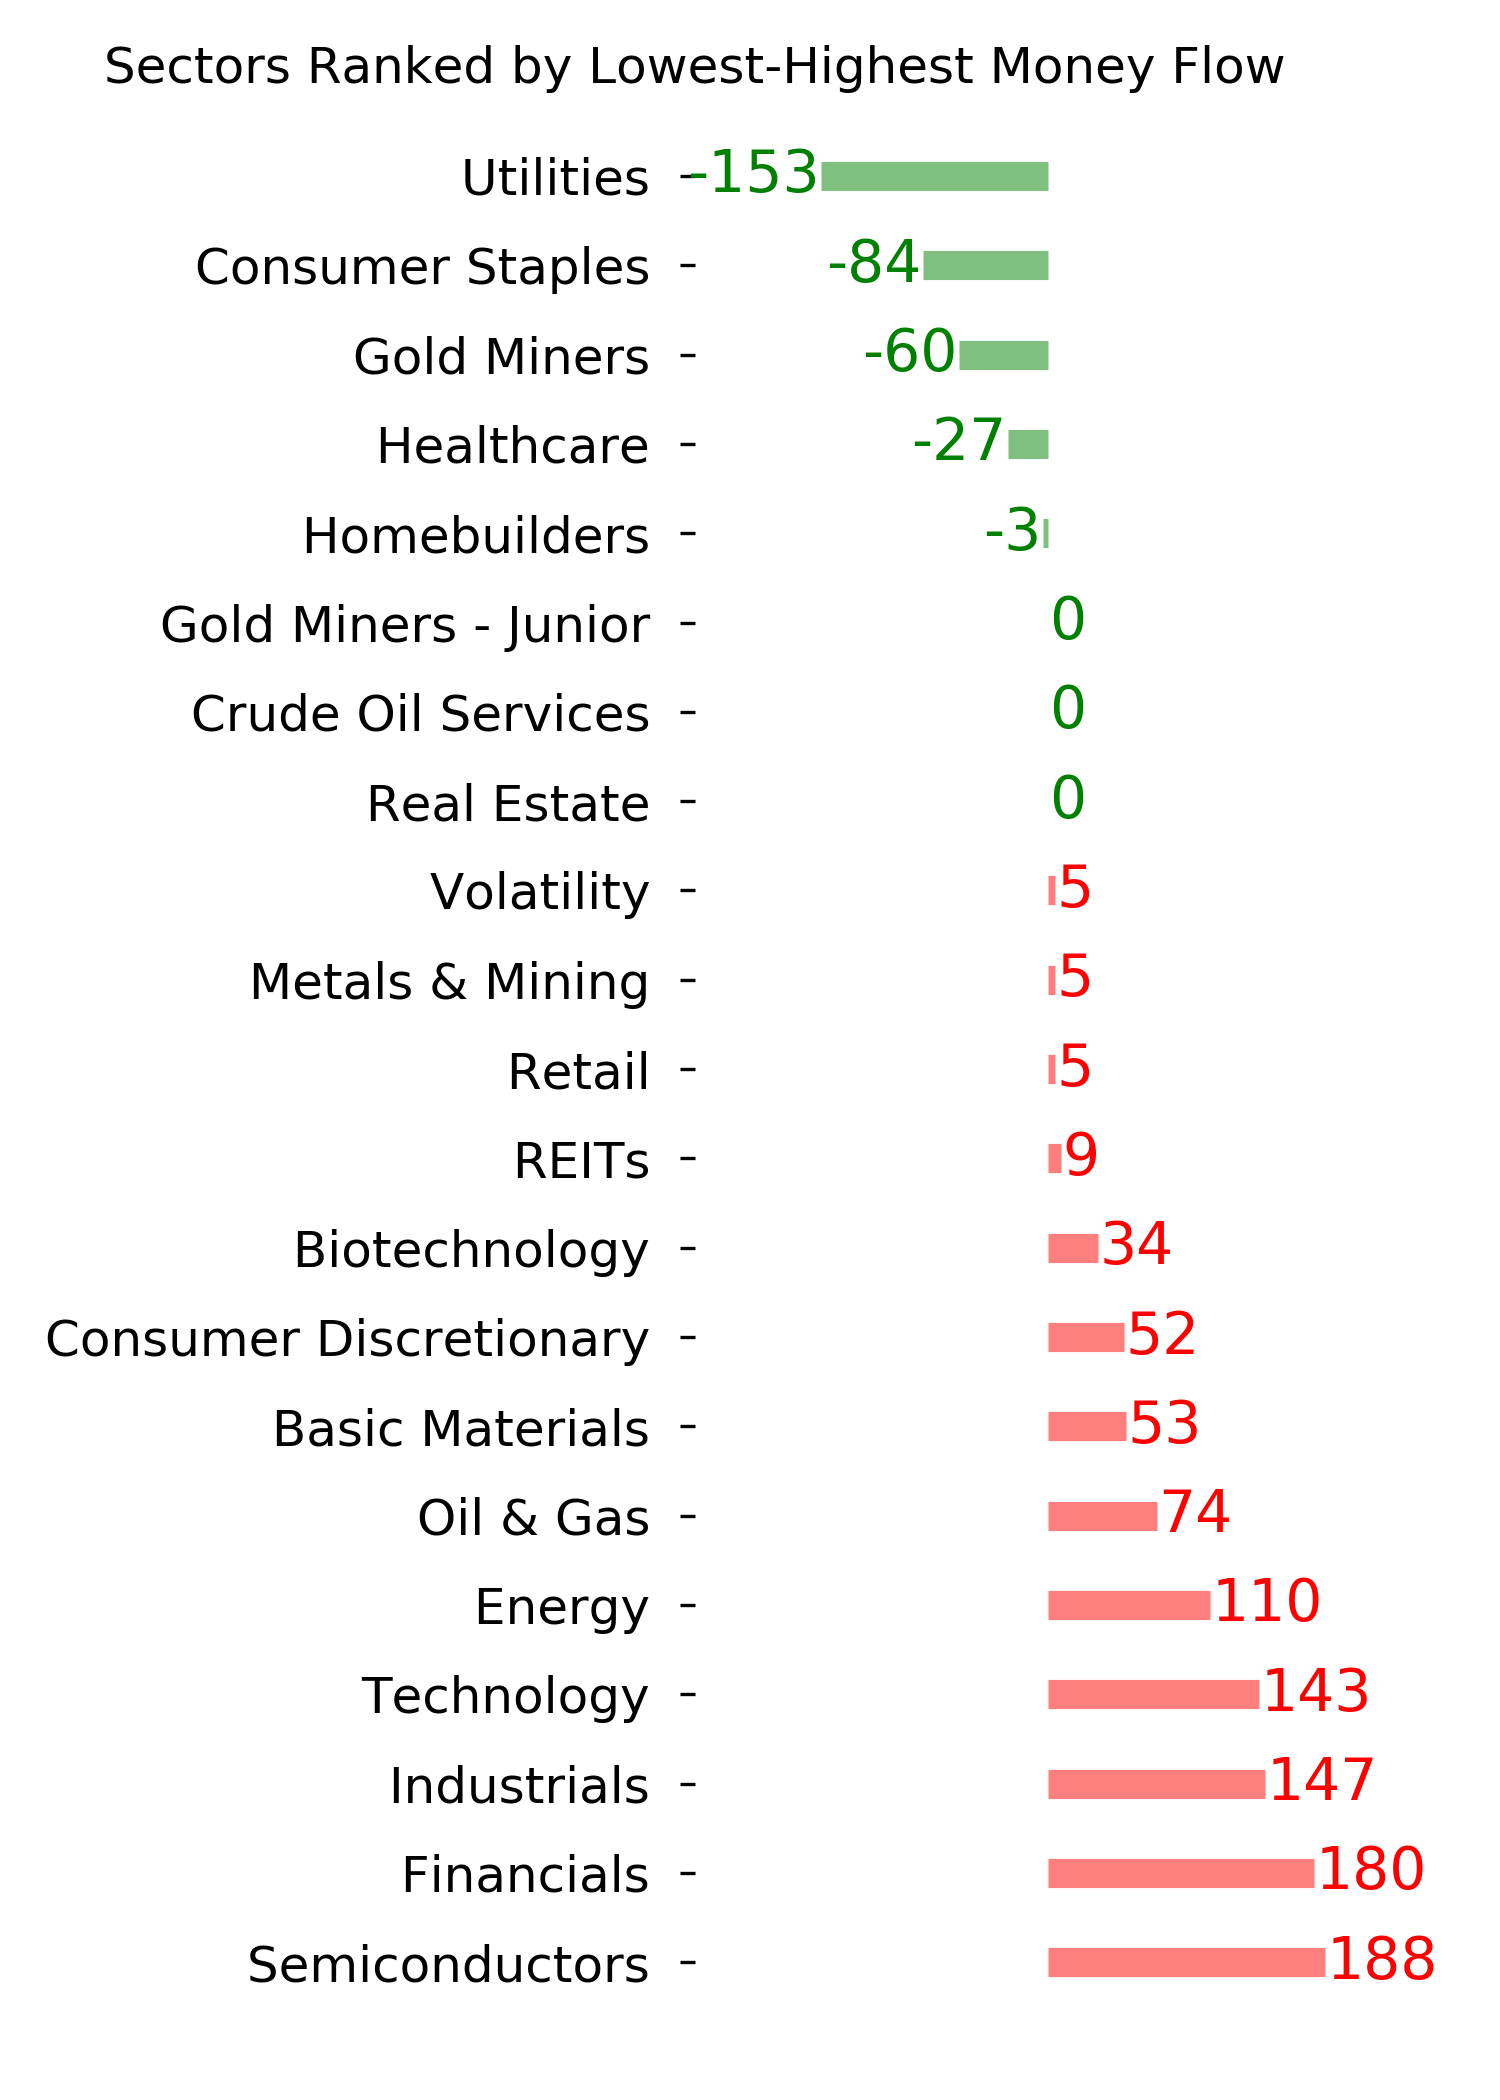
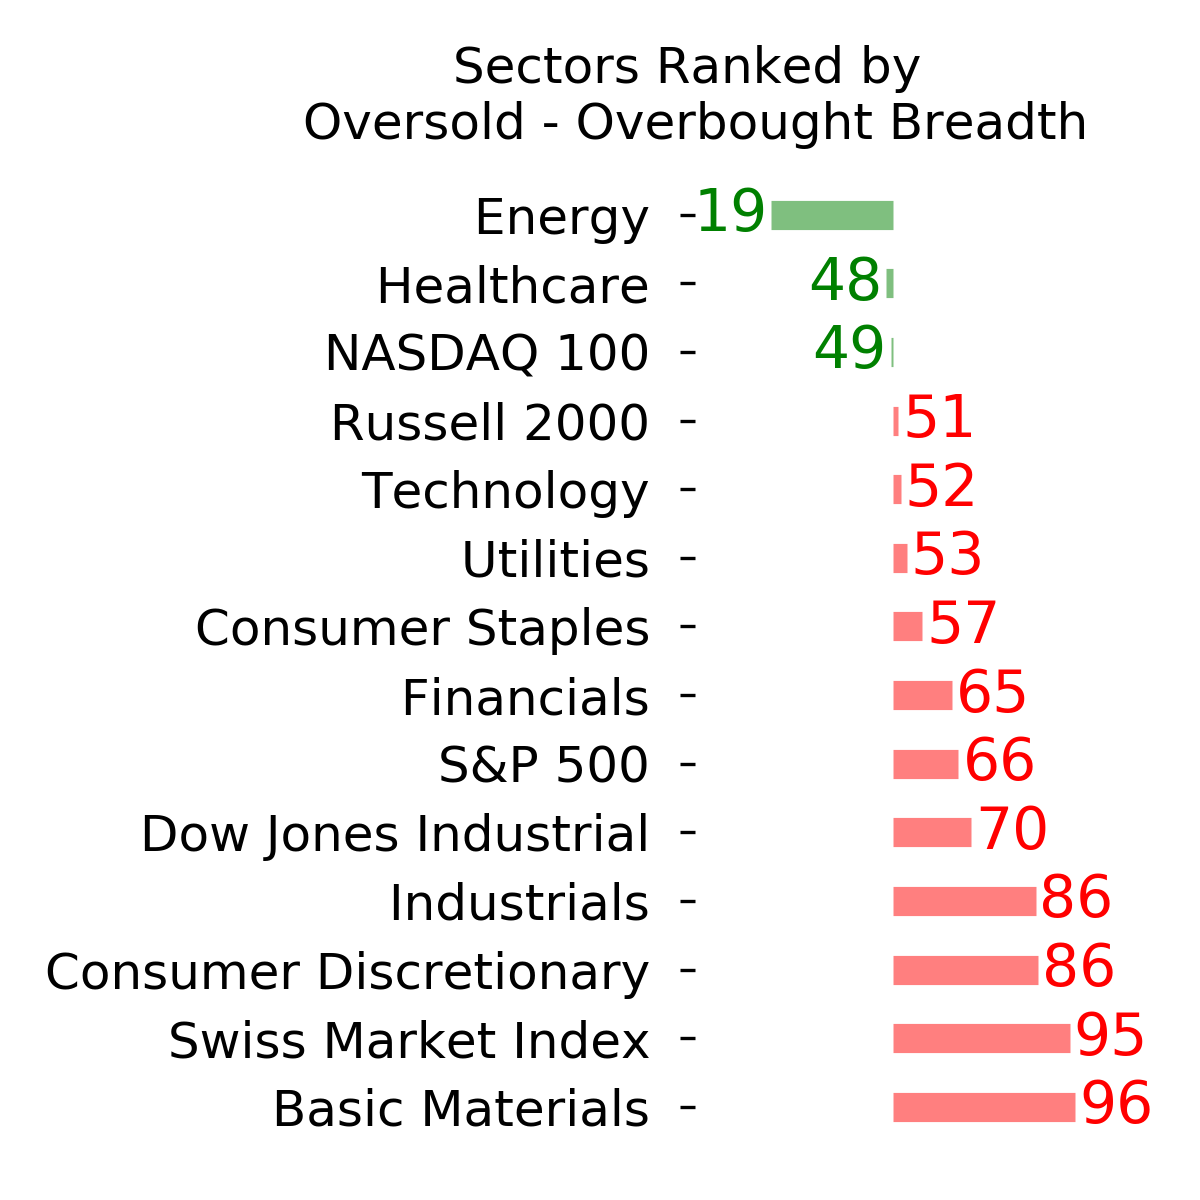
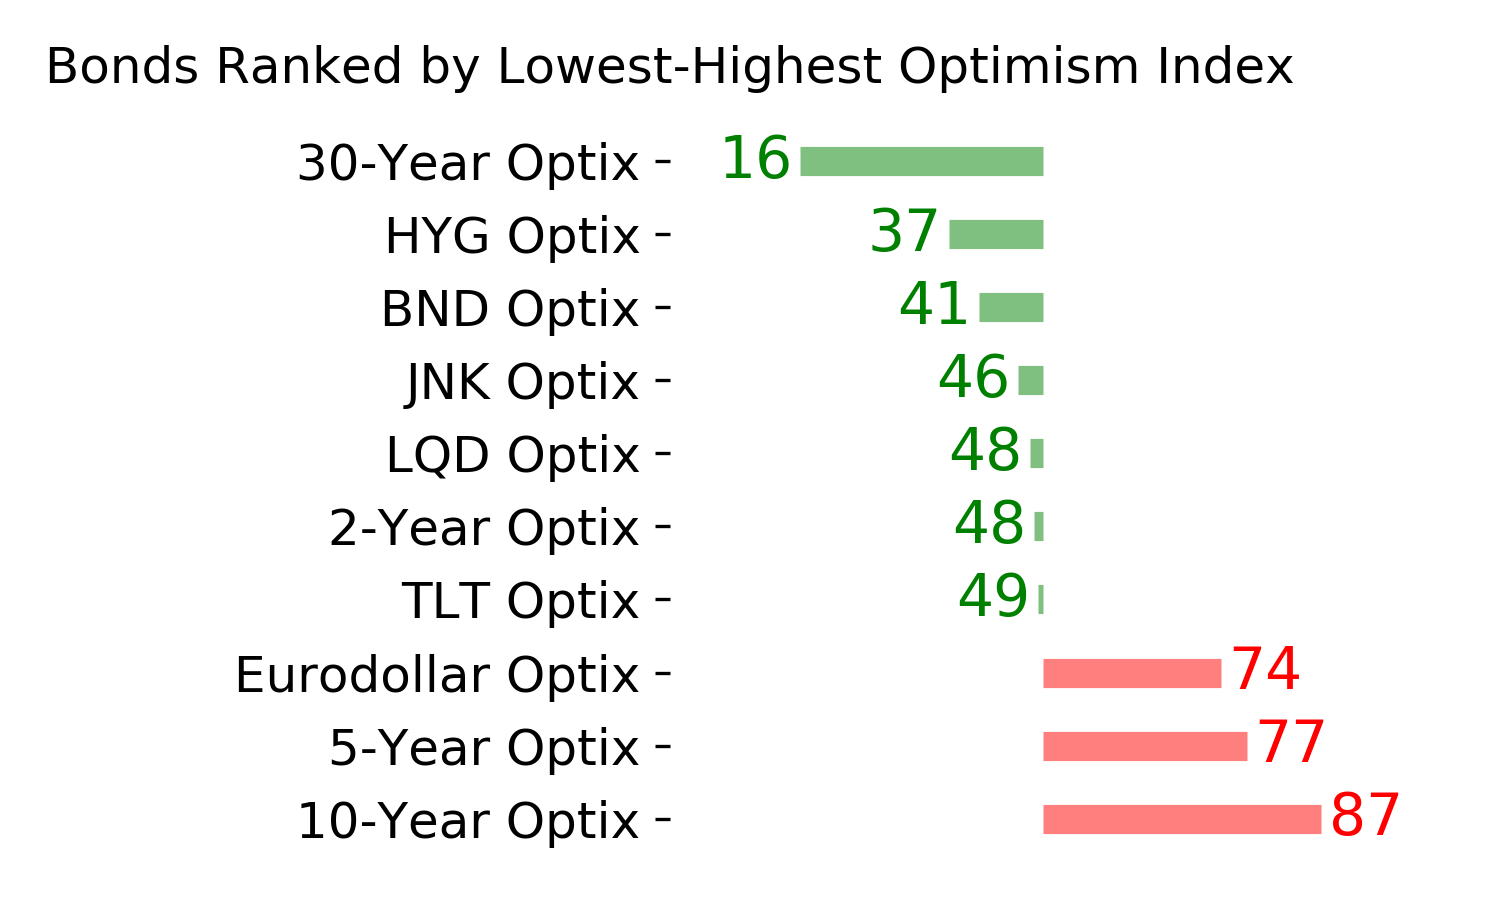
Optimism Index Thumbnails
|
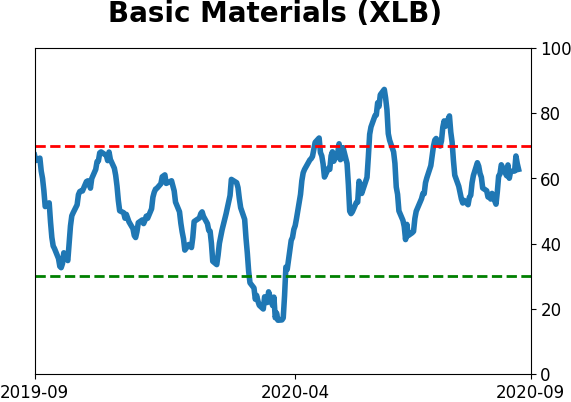
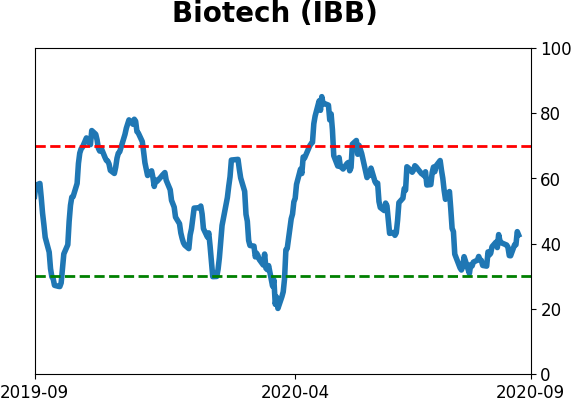
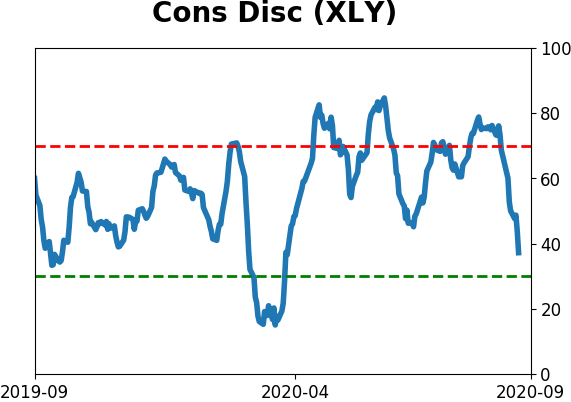
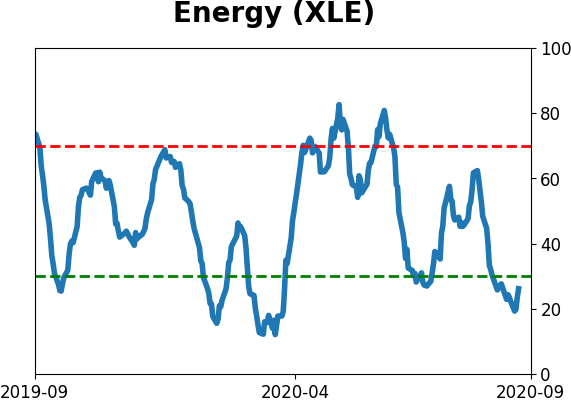
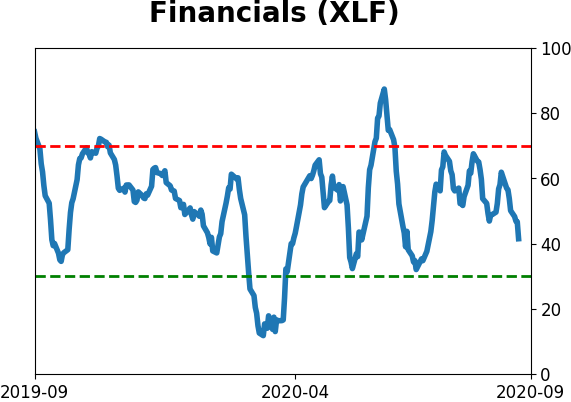
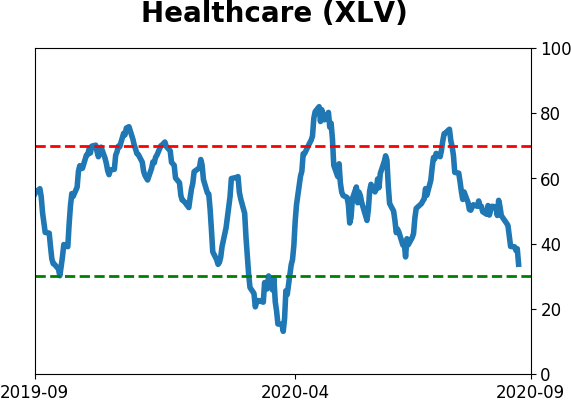
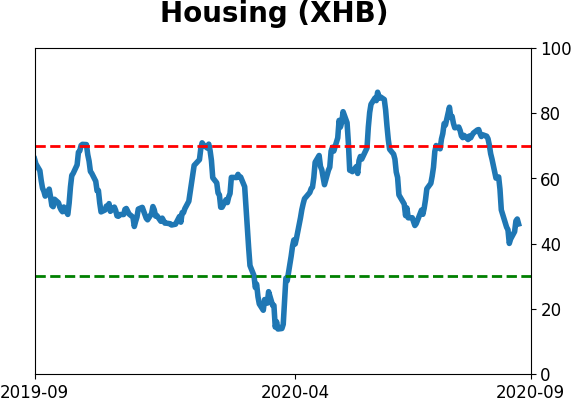
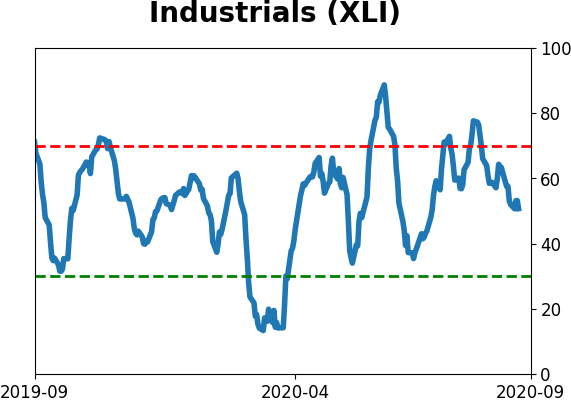
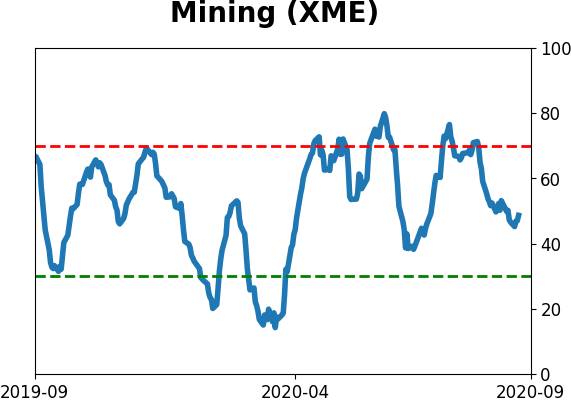
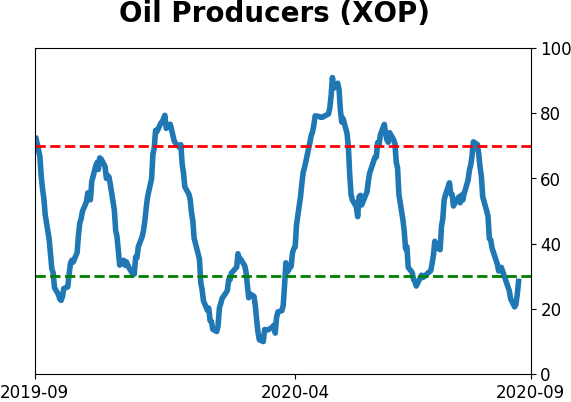
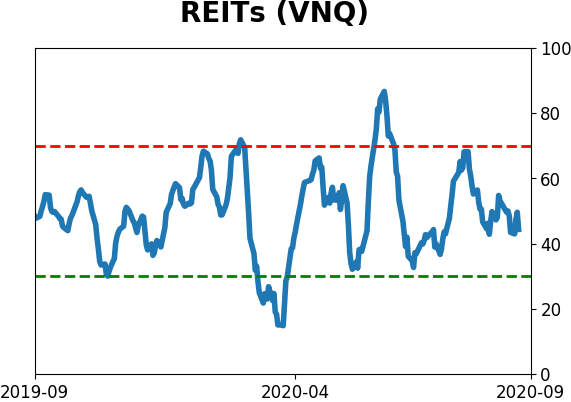
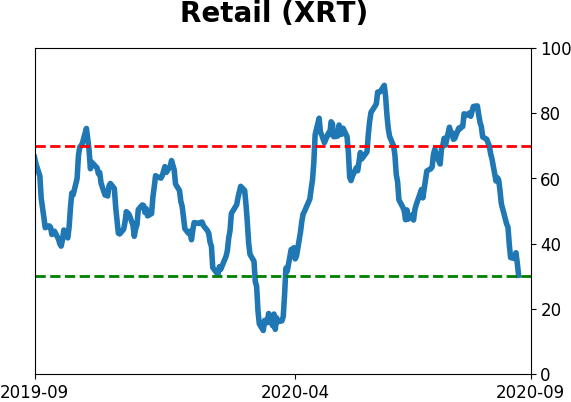
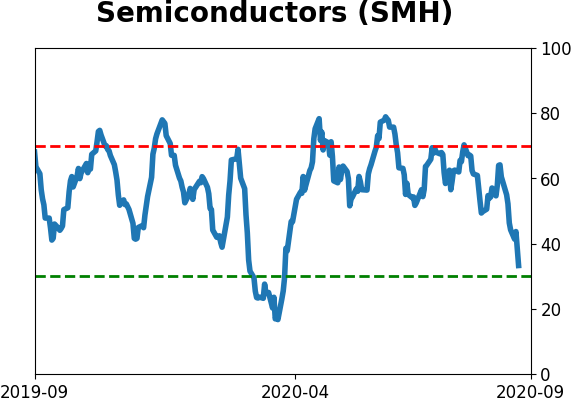
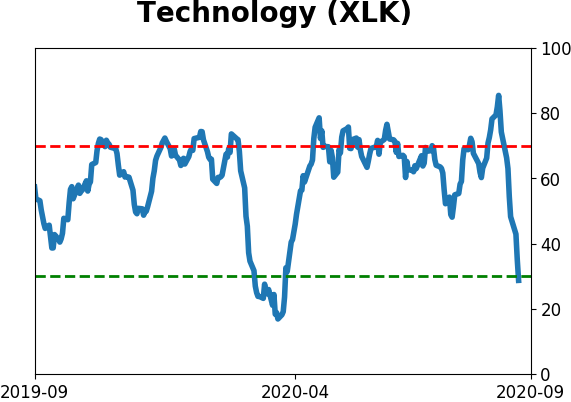
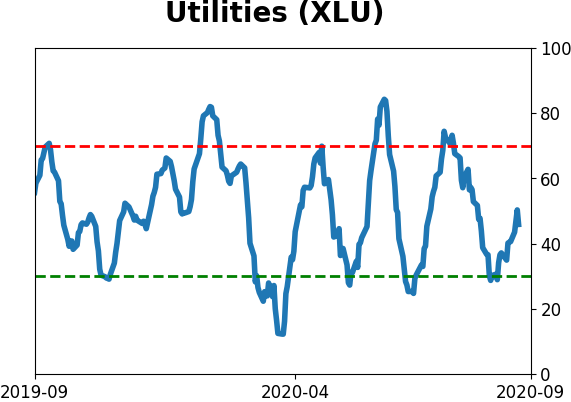
Sector ETF's - 10-Day Moving Average
|
|
|
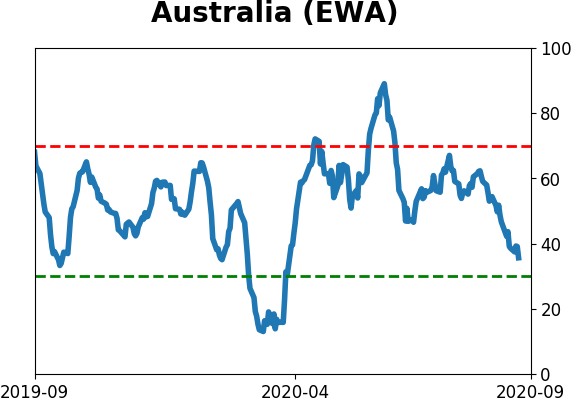
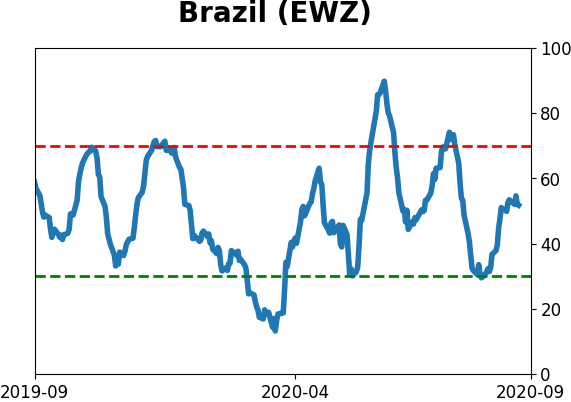
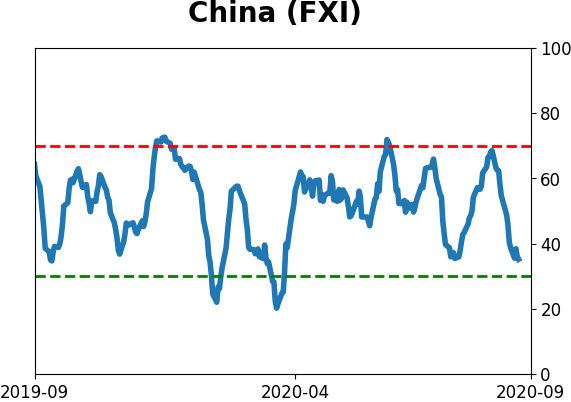
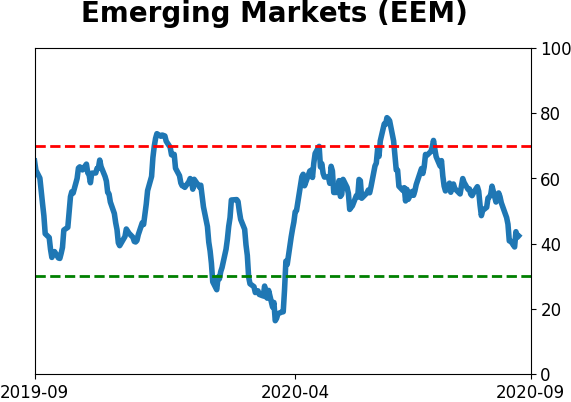
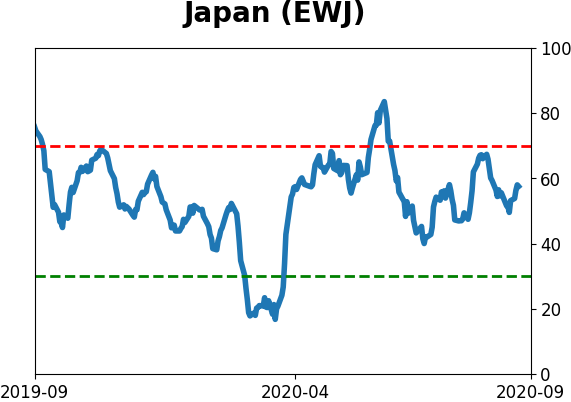
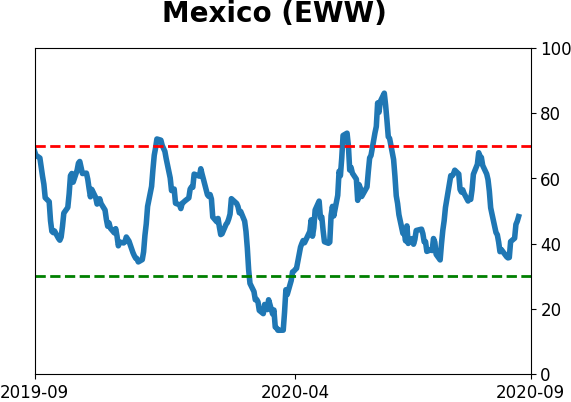
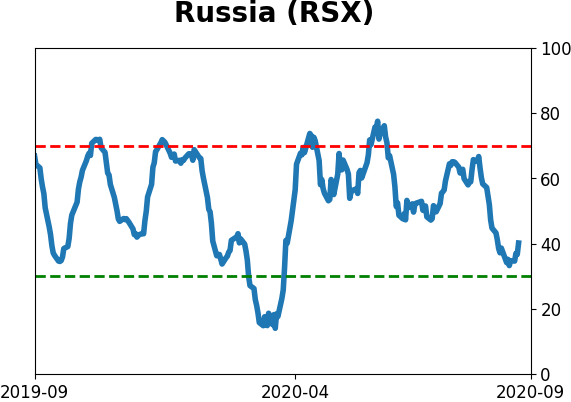
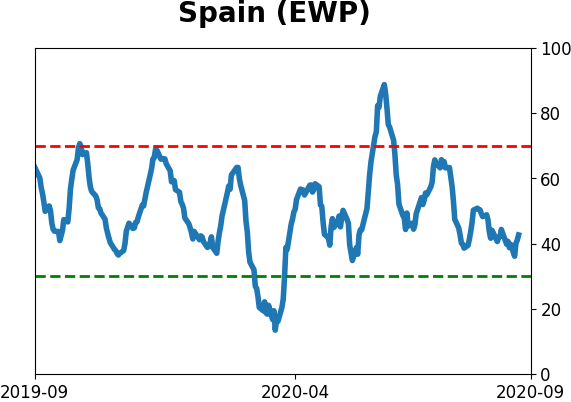
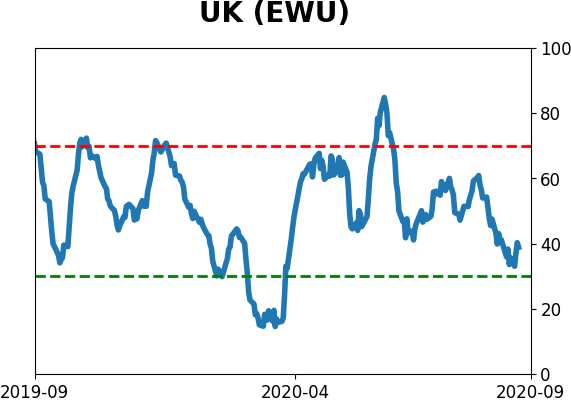
Country ETF's - 10-Day Moving Average
|
|
|
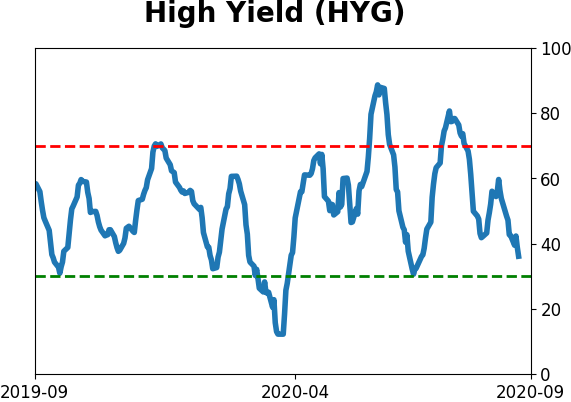
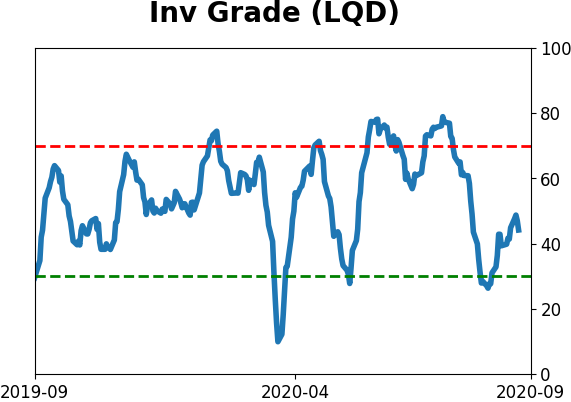
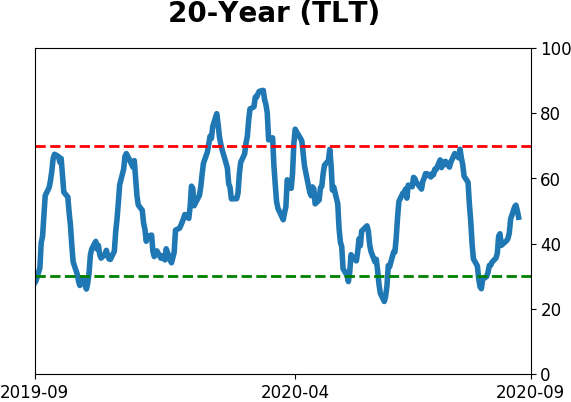
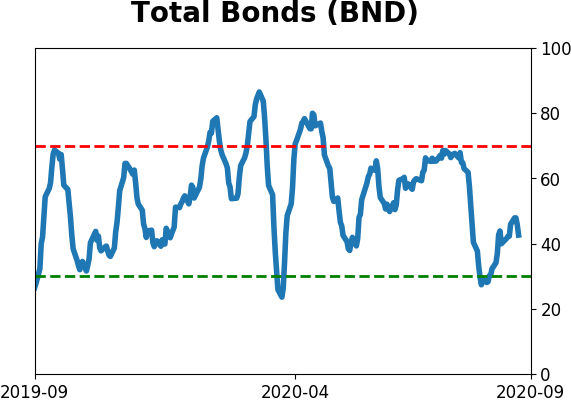
Bond ETF's - 10-Day Moving Average
|
|
|
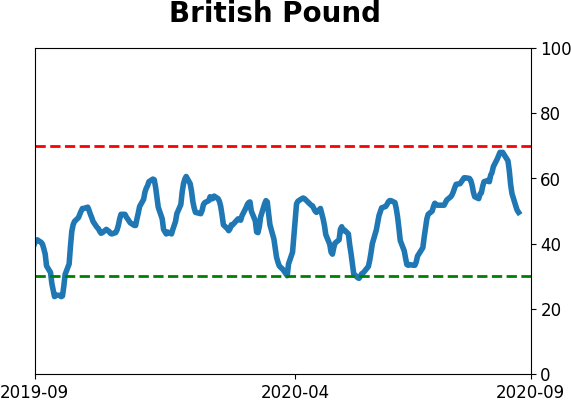
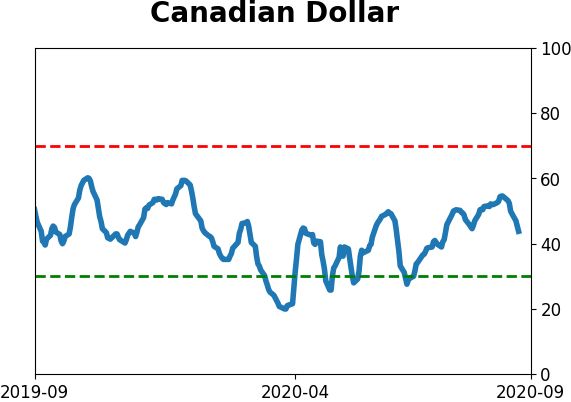
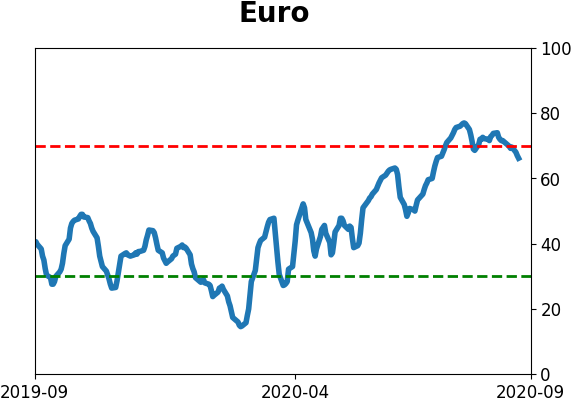
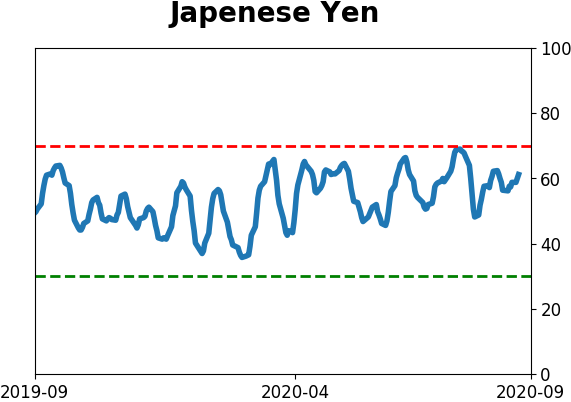
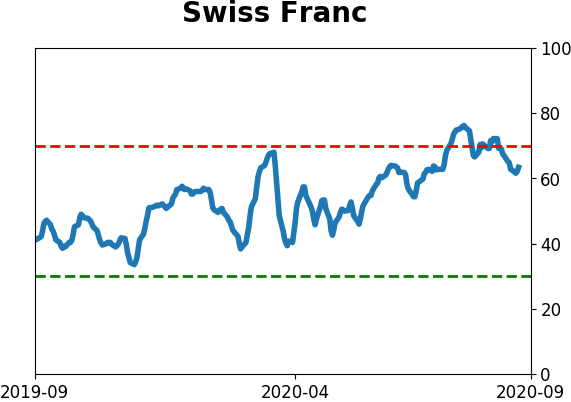
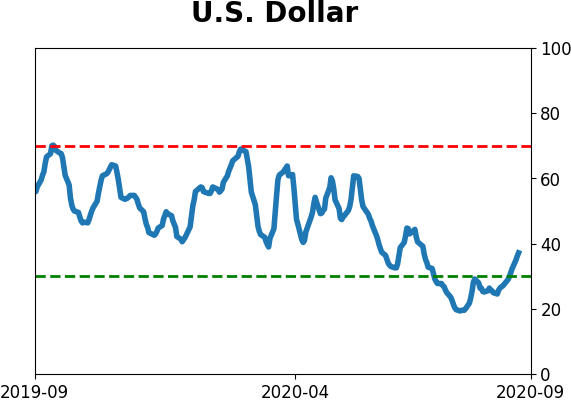
Currency ETF's - 5-Day Moving Average
|
|
|
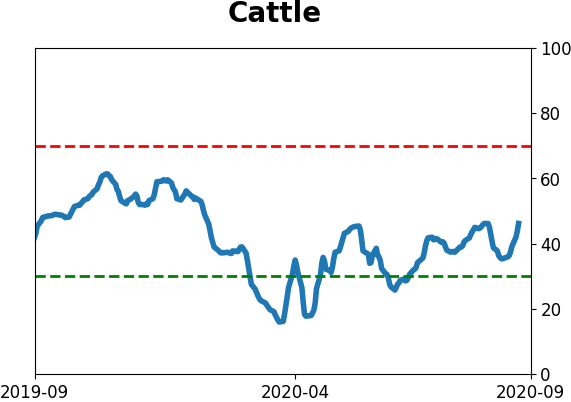
Commodity ETF's - 5-Day Moving Average
|
|