Headlines
|
|
Fund managers think tech is crowded to a record degree:
Fund managers polled by BofA suggest that tech stocks are the most crowded trade in markets right now. Not only that, they're crowded to a record degree. But a look at the history of these most-crowded trades shows that the managers had only modest success at top-ticking the assets.
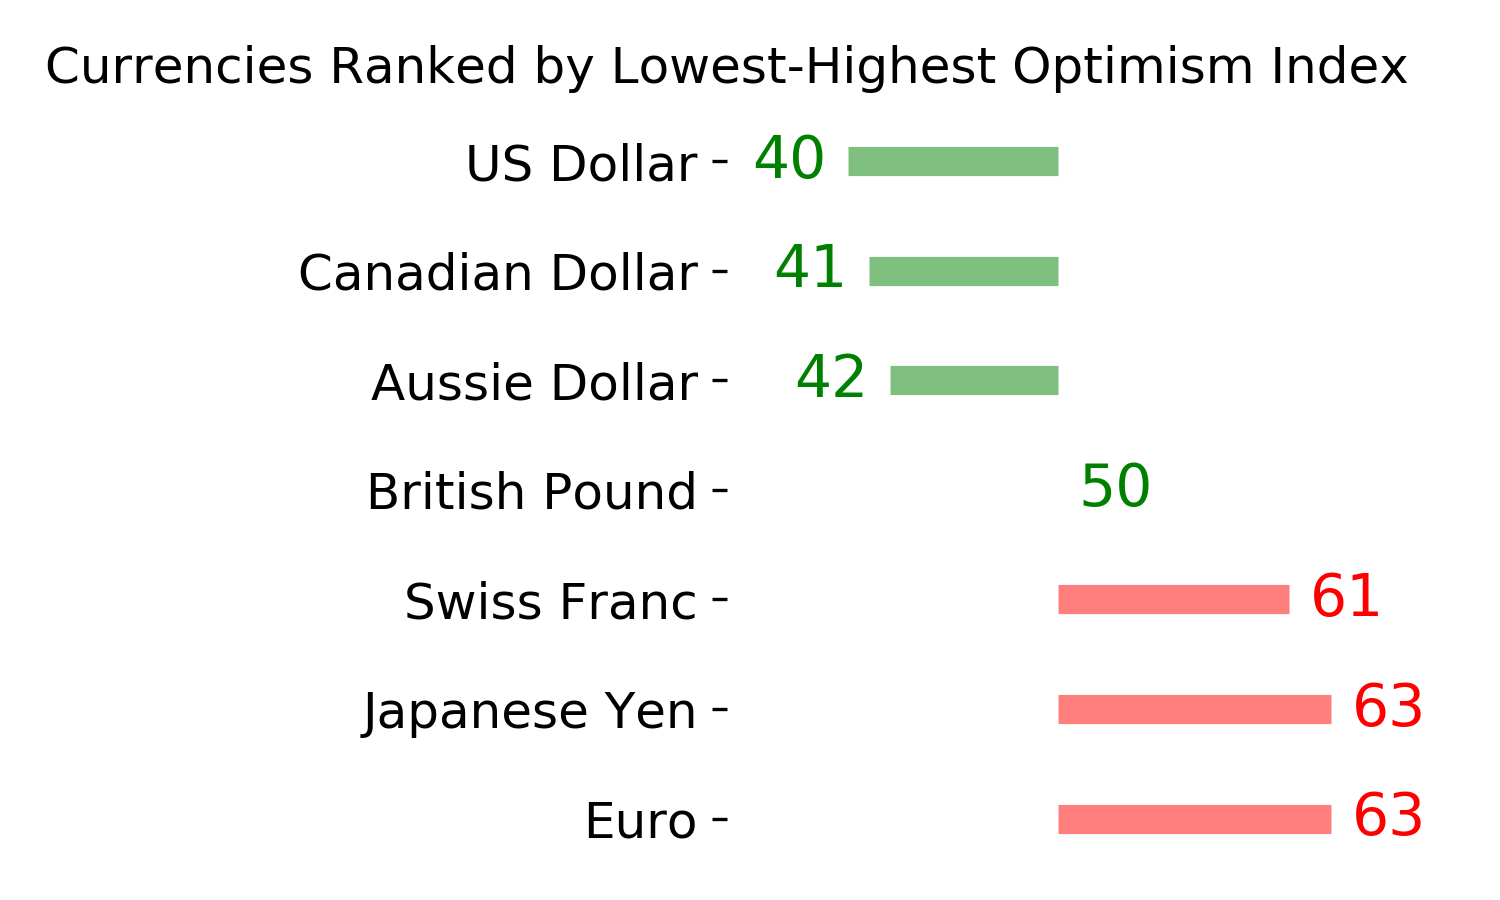
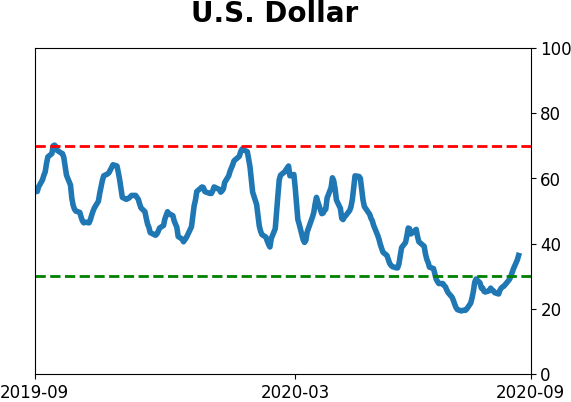
Dollar sentiment bounces back: Many markets are highly sensitive to each other at the moment, with interest rates tied closely to the dollar (and gold) which in turn have been tightly linked to stocks, especially the high-growth tech names. The Optimism Index on the dollar has bounced from extreme pessimism, as Troy mentioned in a premium note. When its Optix cycled from 20 to 40 in the past, the dollar usually fell further over the next 2 weeks, especially if we focus on the past 20 years. If it bucks this consistent trend and rallies, then it suggests the mostly negative long-term trend has changed.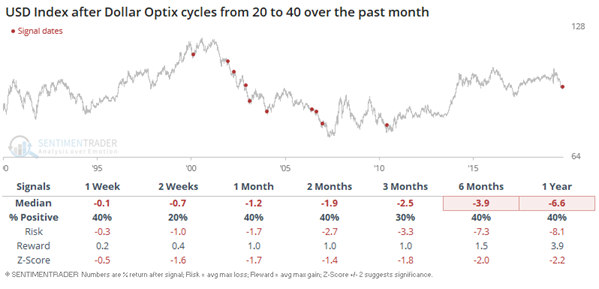
Bottom Line:
- Weight of the evidence has been suggesting flat/lower stock prices short- to medium-term, which moderated somewhat with recent weakness; still suggesting higher prices long-term
- Dumb Money Confidence was recently above 80% with evidence of skyrocketing speculation which increased during a down week, typically a bad sign when combined with an unhealthy environment, though that's turning more neutral, and failures were approaching record length
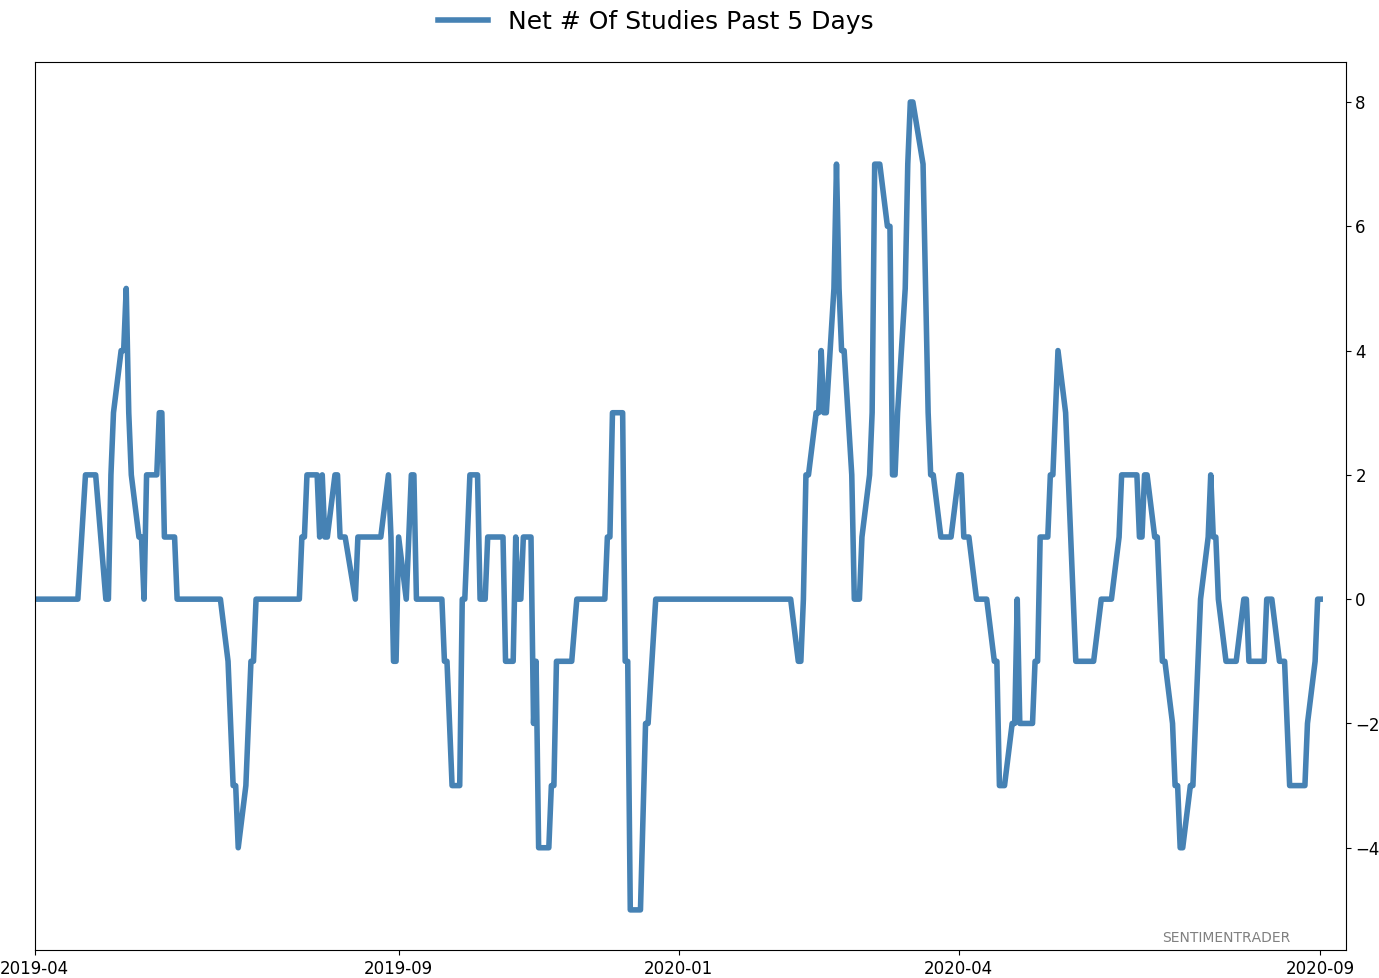
- Active Studies show a heavy positive skew over the longer-term mostly thanks to the March/April/May breadth thrusts, recoveries, and trend changes
- Signs of extremely skewed preference for tech stocks neared exhaustion by late June, especially relative to industrials and financials (here and here)
- Indicators and studies for other markets are showing less consistent forward results
|
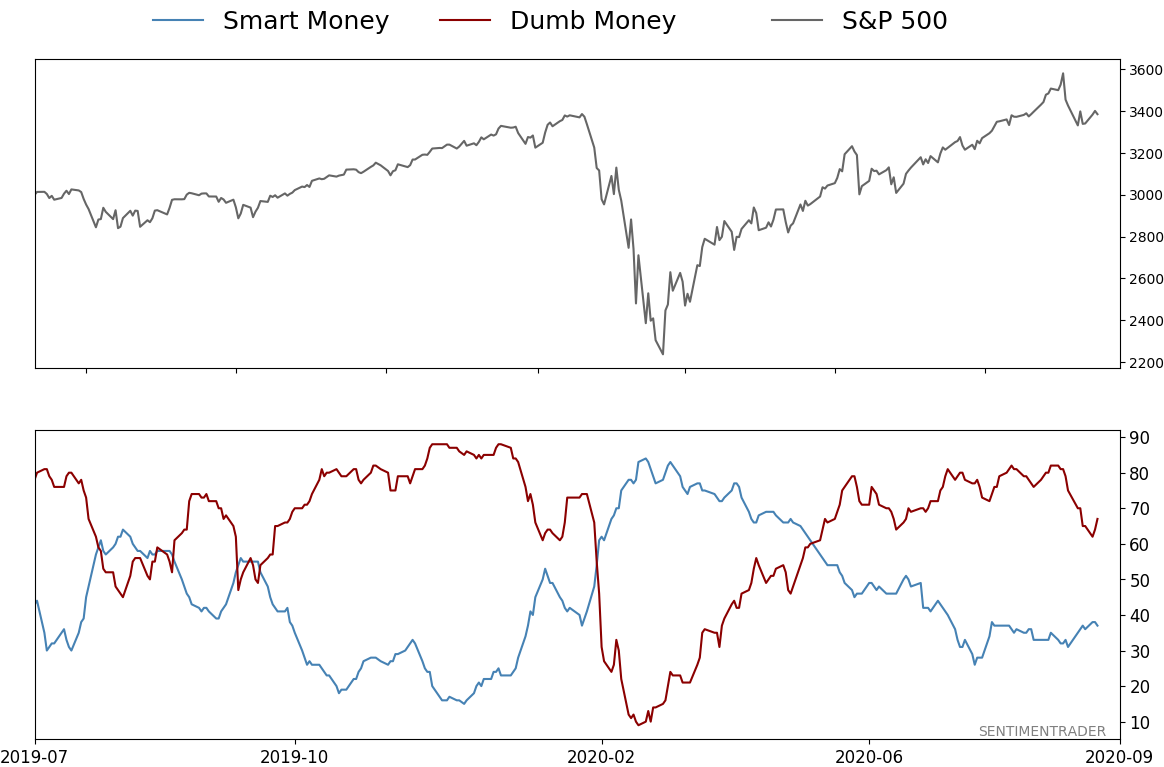
Smart / Dumb Money Confidence
|
Smart Money Confidence: 37%
Dumb Money Confidence: 67%
|
|
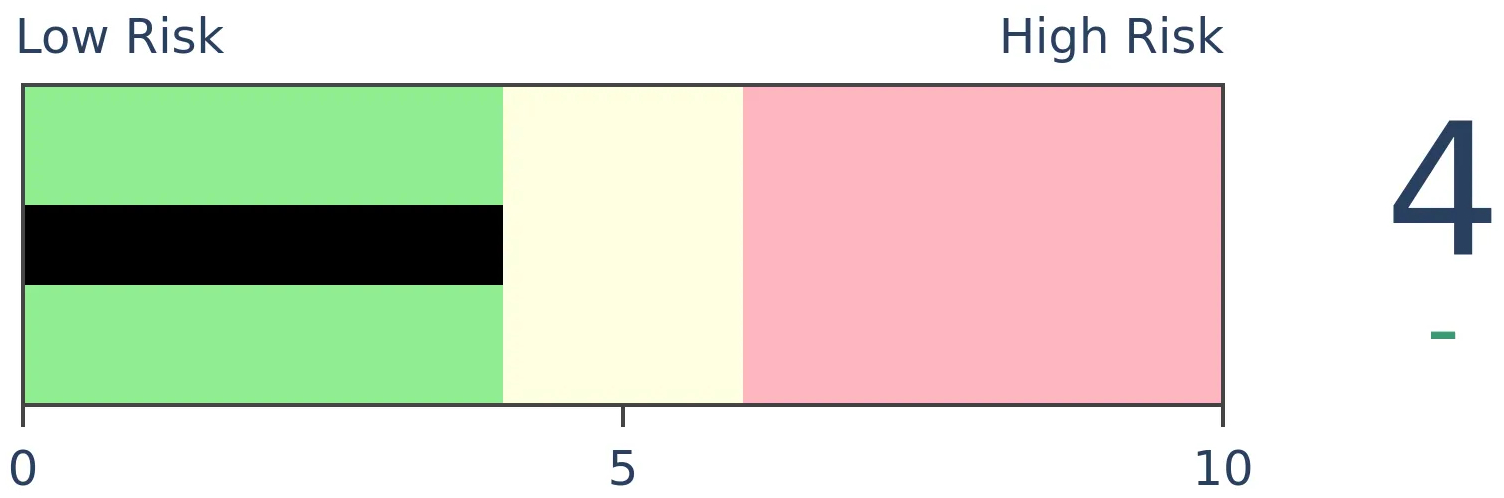
Risk Levels
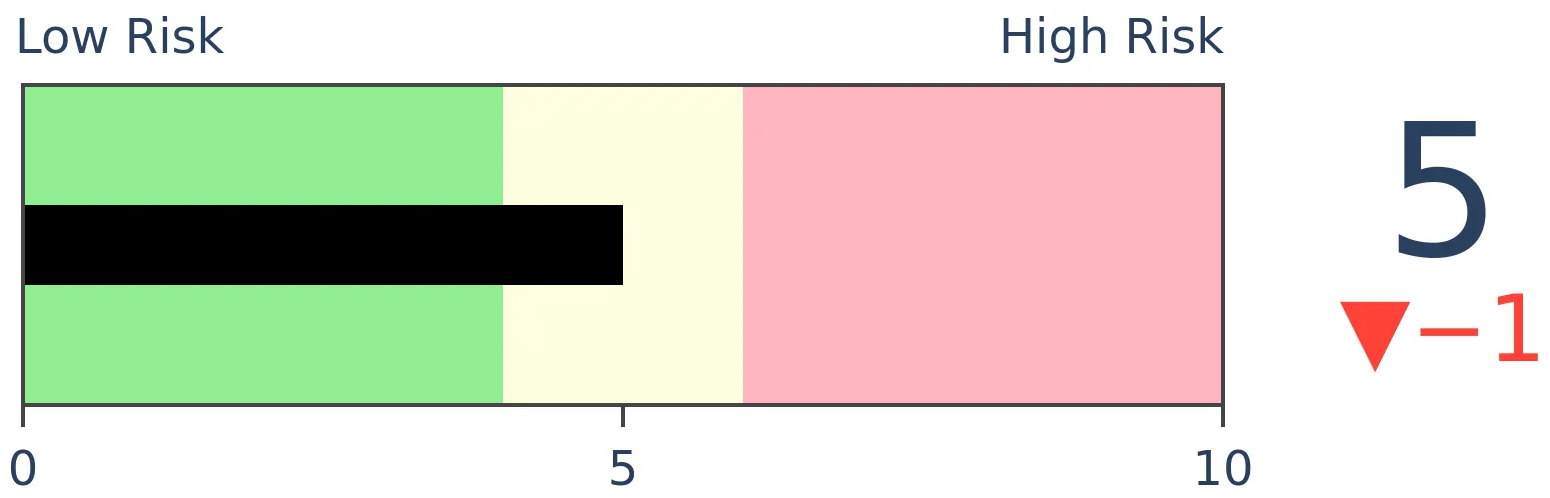
Stocks Short-Term
|
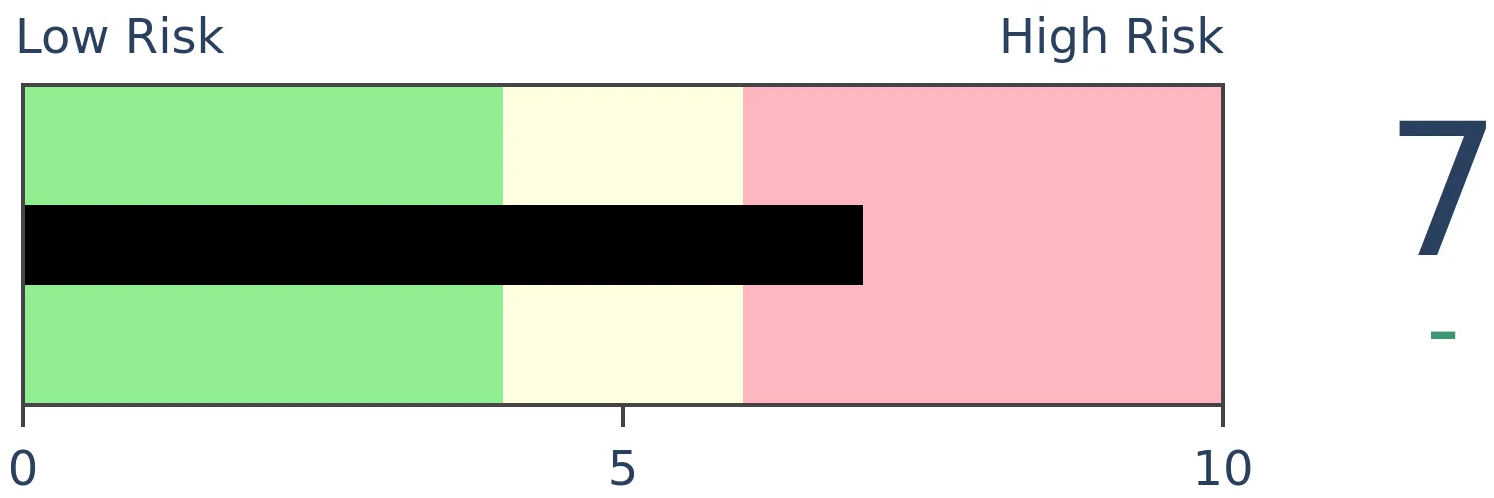
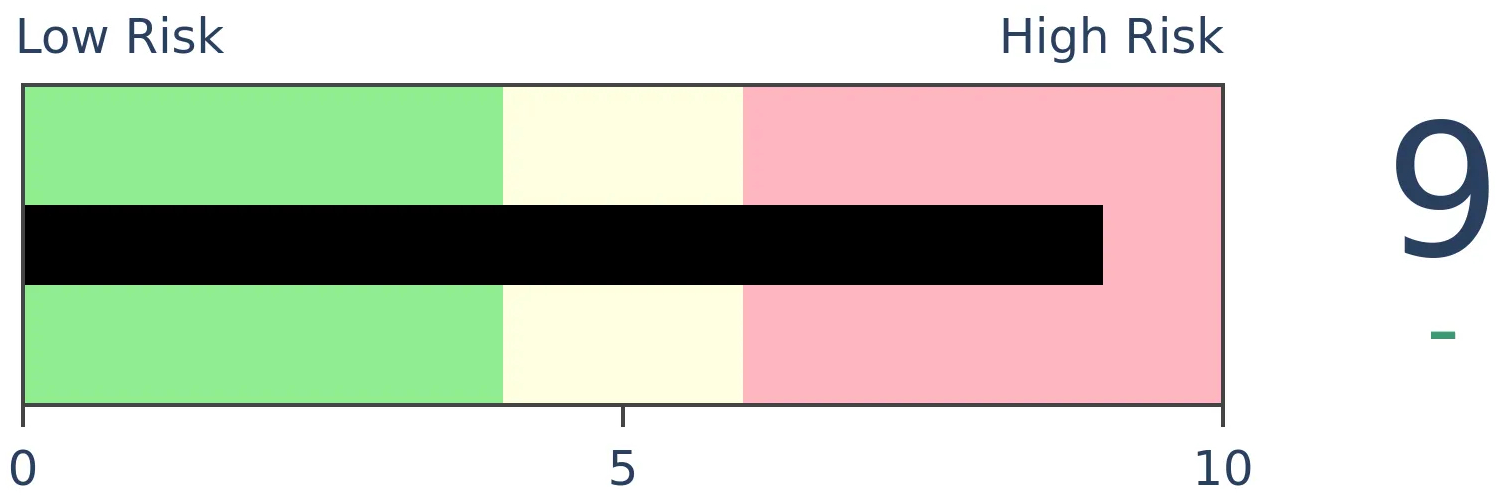
Stocks Medium-Term
|
|
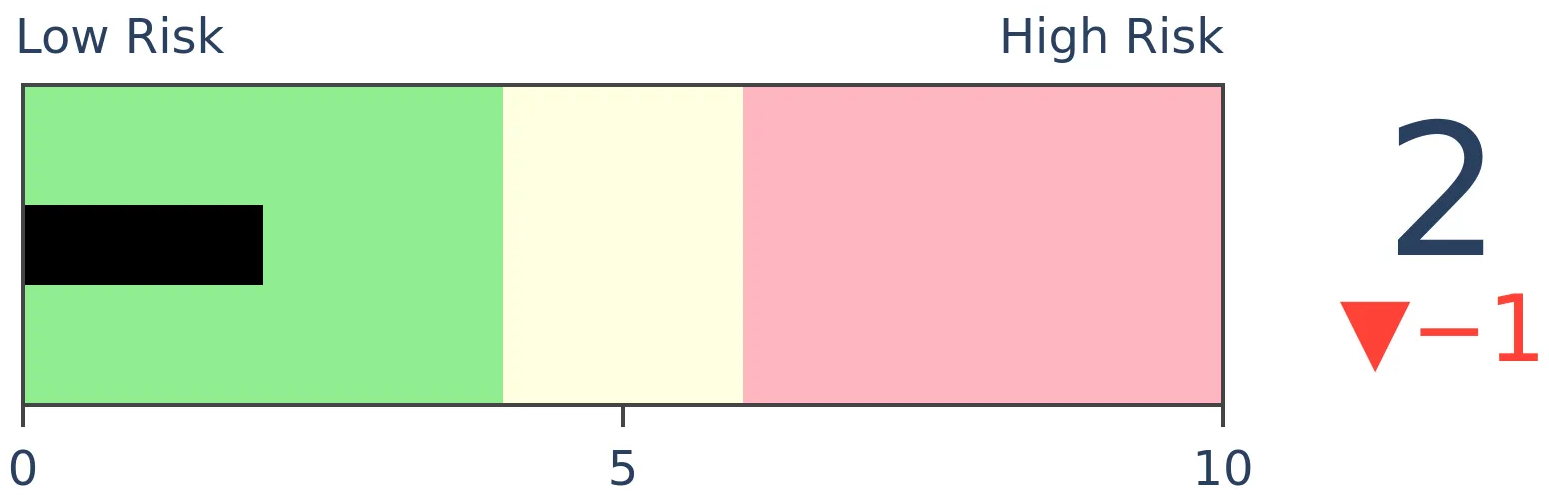
Bonds
|
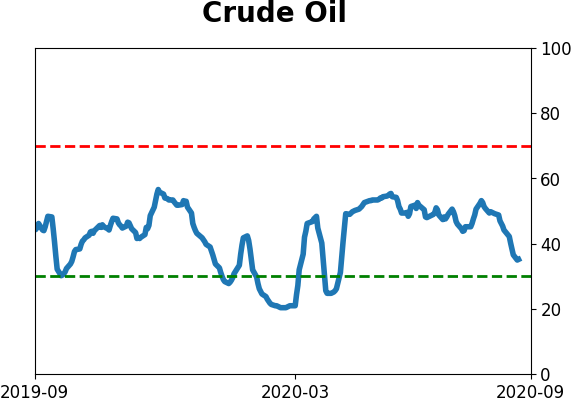
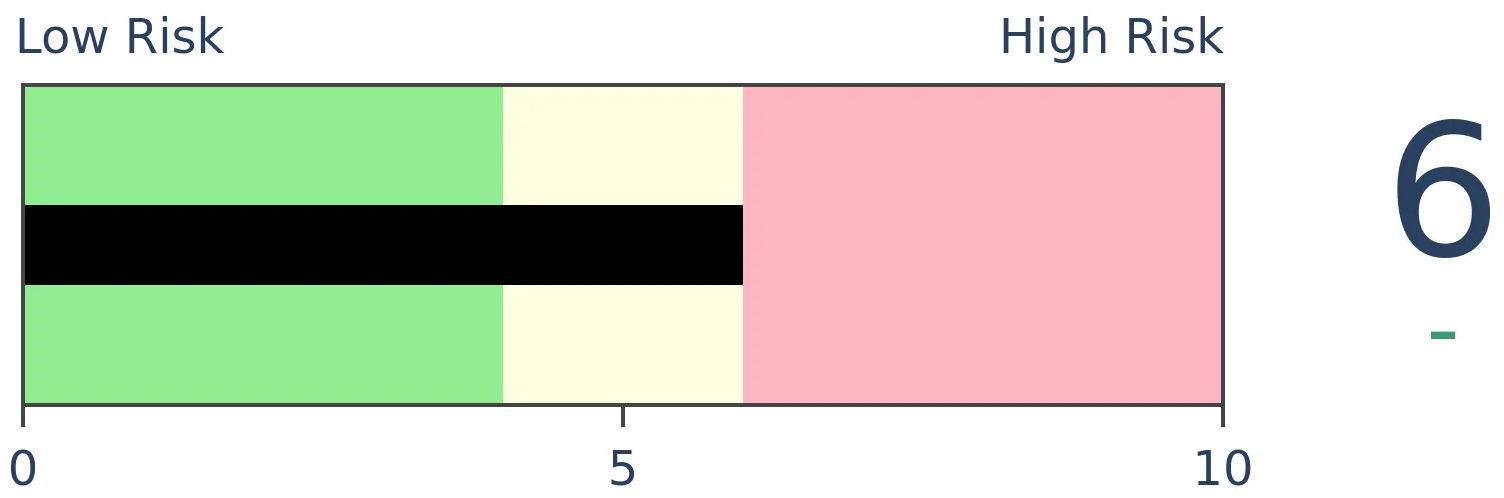
Crude Oil
|
|
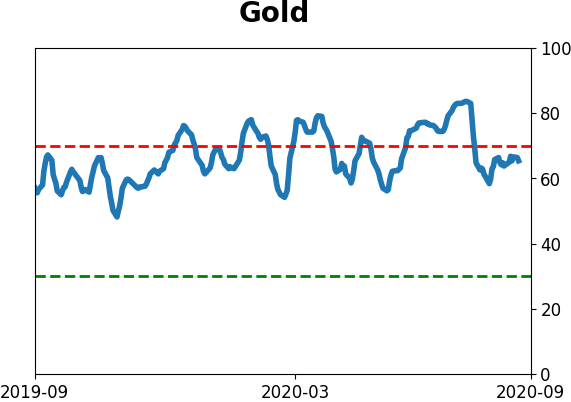
Gold
|
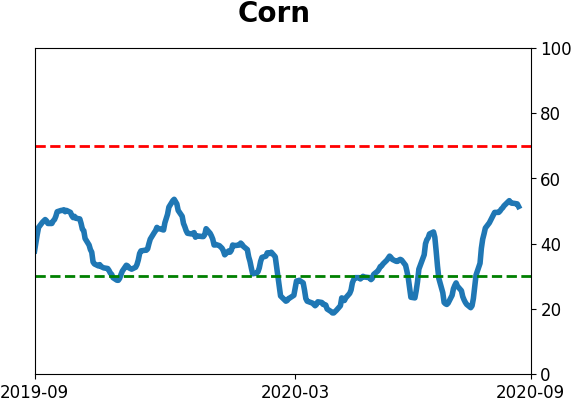
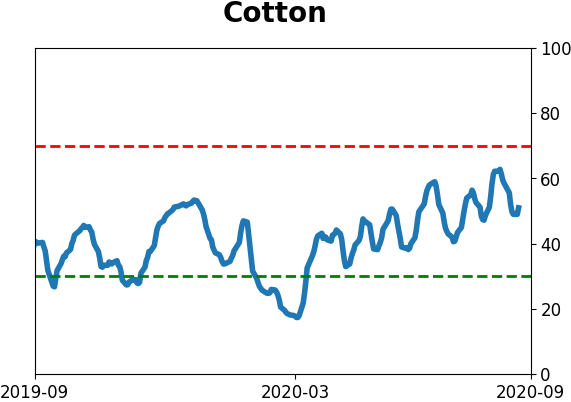
Agriculture
|
|
Research
BOTTOM LINE
Fund managers polled by BofA suggest that tech stocks are the most crowded trade in markets right now. Not only that, they're crowded to a record degree. But a look at the history of these most-crowded trades shows that the managers had only modest success at top-ticking the assets.
FORECAST / TIMEFRAME
None
|
A new bull market has begun.
At least, that's the take from the latest results of the monthly Global Fund Manager Survey conducted by Bank of America. The survey of more than 200 asset managers, with nearly $650 billion under management, reflects views through September 10.
Since a new bull market has begun and technology stocks are leading the charge, it makes sense that the managers are the most overweight that sector.
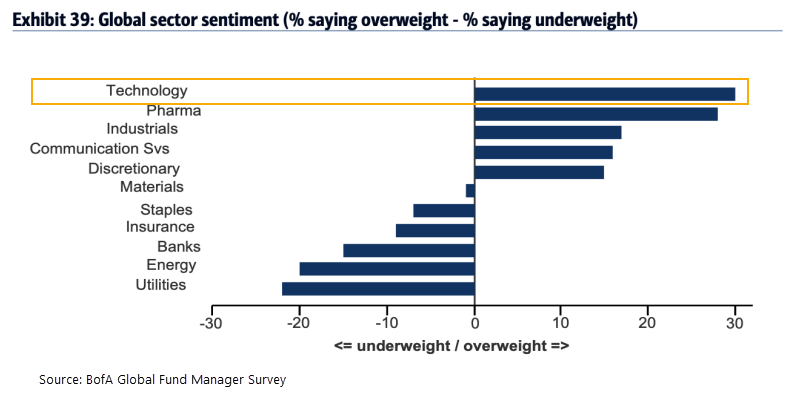
And yet despite being the most overweight in that sector, the managers also believe it's the most crowded trade. They're heavily overweight, more than any other sector or asset...and so is everyone else.
According to Michael Hartnett, Chief Investment Strategist at BofA Securities, if you're long technology stocks in the U.S. then you're a part of the most “crowded trade” of all-time. Managers believe that a tech bubble is the second-biggest tail risk this month, outweighed by a Covid-19 second wave. Volatility surrounding the U.S. presidential election was in 3rd place among concerns.
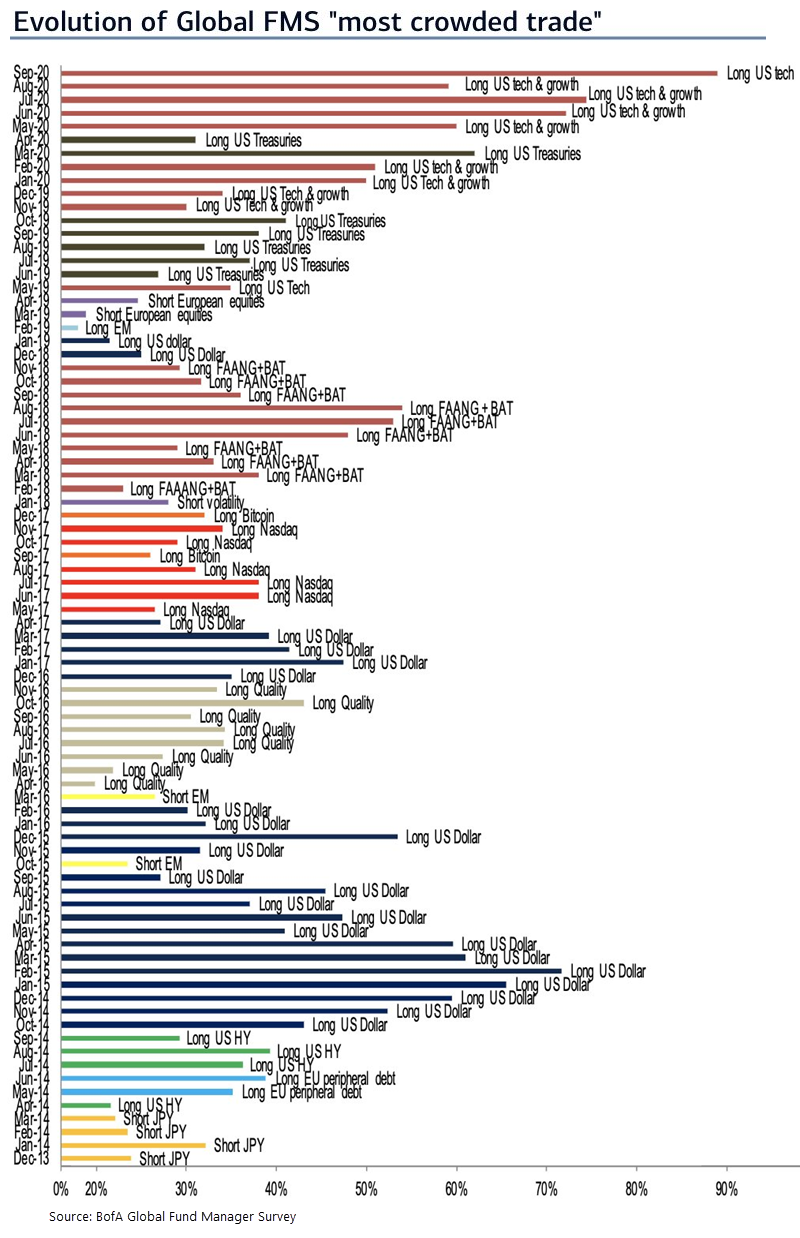
Below, we can see just how extreme this is relative to other "most crowded" trades over the past 7 years.
This is where we get to the "So what?" question that we try to answer every time one of our indicators reaches a notable extreme, there is a remarkable market development, or something gets a lot of attention in the media.
The question with this survey, especially the most crowded trade, is "Should we fade the crowd?"
We've gone back and computed the returns for each of the assets noted in the "most crowded" table above. Because we're assuming that we should trade against wherever the trade is most crowded, we'll short the asset if the crowd is long, and we'll go long if the crowd is short.
For example, if the most crowded trade is short the Japanese yen (relative to the U.S. dollar), then we'll be contrarians and go long the yen. If the crowd has rushed into FANG stocks, then we'll be reckless and sell them short. The table below shows the results of these trades based on various hold times.
If the returns are positive, then it might be a good idea to fade the herd. If not, then following the momentum would be a better strategy.
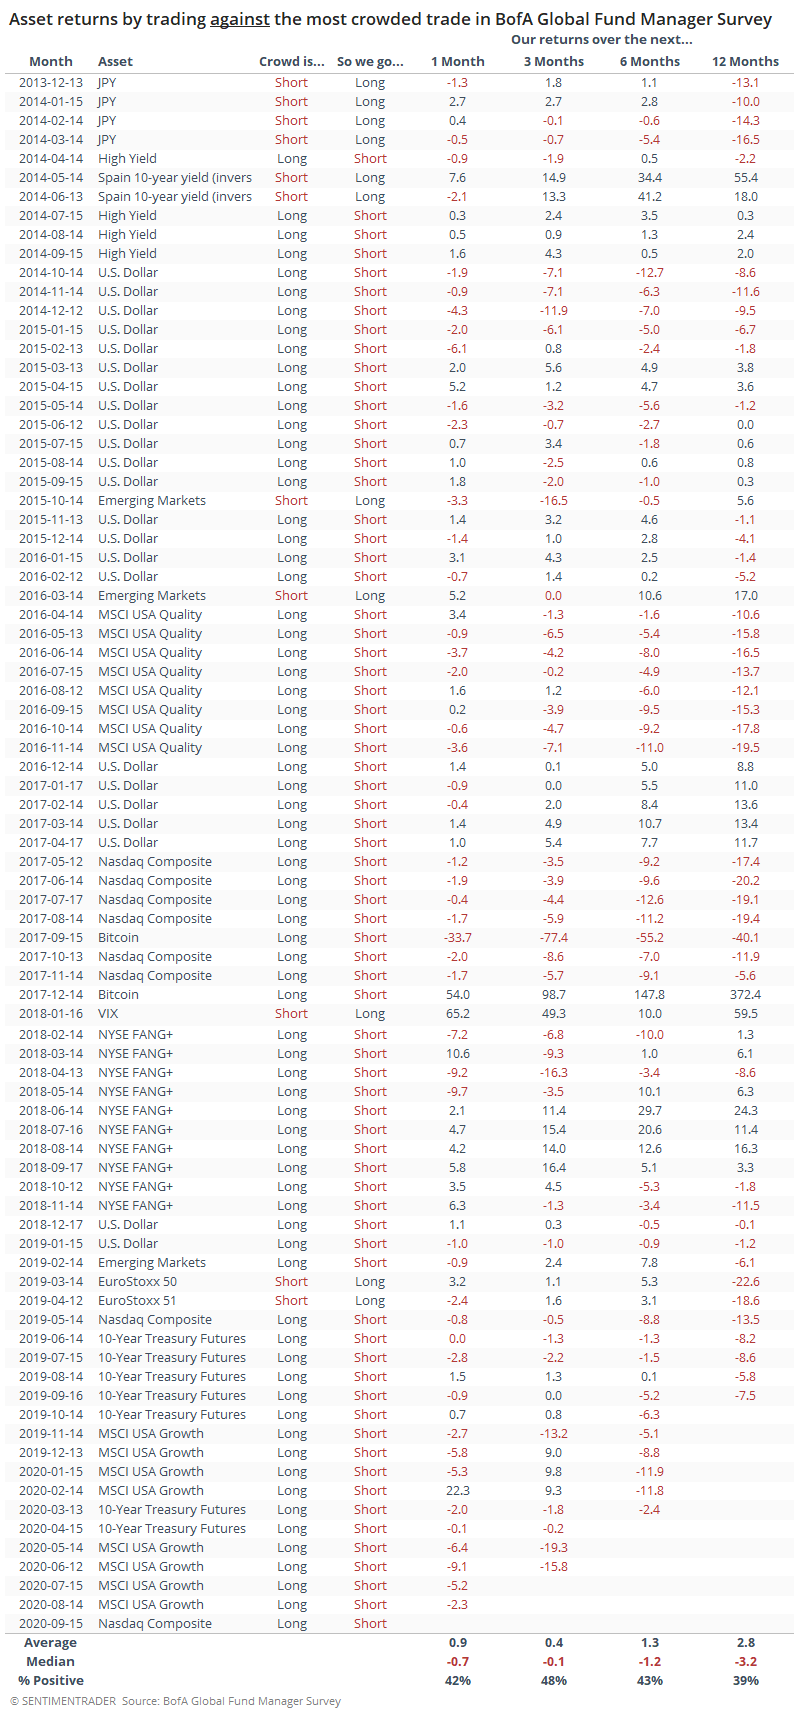 Overall, it was not a very successful contrary indicator. While these managers did tend to do a good job of determining what was driving most investors each month, that didn't necessarily mean the trends were about to end.
If you bet against the most-crowded asset or sector each month and held on until the next month, then you would have won only 42% of the time. The average trade was positive, but the median was negative, meaning that there were some big positive outliers that impacted the overall average - thanks to our short in Bitcoin near the peak and going long the VIX the next month.
These returns are theoretical only, for example, it would have been hard to get a return of more than 100% by shorting Bitcoin. The idea isn't necessarily to create a trading strategy, rather it's to get a general sense of whether we should use this widely-cited data as a reason to fade the crowd or otherwise adjust our positions.
The bottom line is that these managers are likely correct in that the most-crowded trade right now is tech stocks. There is a modest chance that it's so crowded, tech is likely to fall. But based solely on this survey's success at identifying too-crowded trades, we wouldn't use it in isolation to sell these stocks.
Active Studies
| Time Frame | Bullish | Bearish | | Short-Term | 0 | 1 | | Medium-Term | 1 | 12 | | Long-Term | 47 | 2 |
|
Indicators at Extremes
Portfolio
| Position | Weight % | Added / Reduced | Date | | Stocks | 15.2 | Reduced 4.2% | 2020-09-03 | | Bonds | 30.0 | Added 30% | 2020-09-09 | | Commodities | 2.4 | Reduced 2.1%
| 2020-09-04 | | Precious Metals | 5.0 | Added 5% | 2020-09-09 | | Special Situations | 4.9 | Added 5.1% | 2020-09-03 | | Cash | 42.5 | | |
|
Updates (Changes made today are underlined)
After stocks bottomed on March 23rd, they enjoyed a historic buying thrust and retraced a larger amount of the decline than "just a bear market rally" tends to. Through June, there were signs of breadth thrusts, recoveries, and trend changes that have an almost unblemished record at preceding higher prices over a 6-12 month time frame. On a shorter-term basis, our indicators have been showing high optimism, with Dumb Money Confidence recently above 80%, along with signs of reckless speculation during what appears to be an unhealthy market environment, historically a bad combination. While there are certainly some outlier indicators that are showing apathy or even outright pessimism, a weight-of-the-evidence approach suggests high risk over a multi-week to multi-month time frame. That has been the case since July, even arguably June and yet the major indexes hit continual new highs through late August. With the indicators and studies failing to precede any weakness, I've been hesitant to lower my already-low exposure. I am getting increasingly anxious about the oddities we're seeing, though, and lowered it again. This account is mostly about comfort with risk for me, and right now I'm not at all comfortable with any of it. In more than 25 years of experience, this is the oddest market I've ever seen. I lowered exposure again - likely the lowest I'm willing to go at this point given longer-term positives - and decided to switch to an equal-weight version of the S&P 500 index. I've become intensely uncomfortable with the concentration in the cap-weighted index. Our studies have been mixed with regard to the potential for the equal-weight version to outperform the cap version going forward, so historical support isn't overwhelming. I'm also increasingly interested again in energy stocks, starting with a small allocation. I got burned in March with the unprecedented geopolitical spat that hammered those stocks then but the longer-term setup is decent. In this account, I’ve roughly followed what has become known as the All Weather portfolio popularized by Ray Dalio. It allocates across four broad assets, designed to hold up no matter the market environment. The goal is modest positive returns while limiting large, sustained losses. I typically use popular ETFs, with low costs. At times, I will swap out for a fund I believe has better prospects, or simply lower fees if not. At other times, I will diverge quite a bit from baseline allocations, largely depending on the indicators and studies we discuss on the site. I've gotten away from this in the past, using "cash" as a substitute for "bonds" and with rates stuck at 0%, that has become less appetizing. I'm trying to get back more toward the baselines with less dramatic swings in either direction. The base allocation I use is the following: Stocks: 35%
Bonds: 45%
Precious Metals: 7.5%
Commodities: 7.5%
Cash / Special Opportunities: 5%
RETURN YTD: -0.2% 2019: 12.6%, 2018: 0.6%, 2017: 3.8%, 2016: 17.1%, 2015: 9.2%, 2014: 14.5%, 2013: 2.2%, 2012: 10.8%, 2011: 16.5%, 2010: 15.3%, 2009: 23.9%, 2008: 16.2%, 2007: 7.8%
|
|
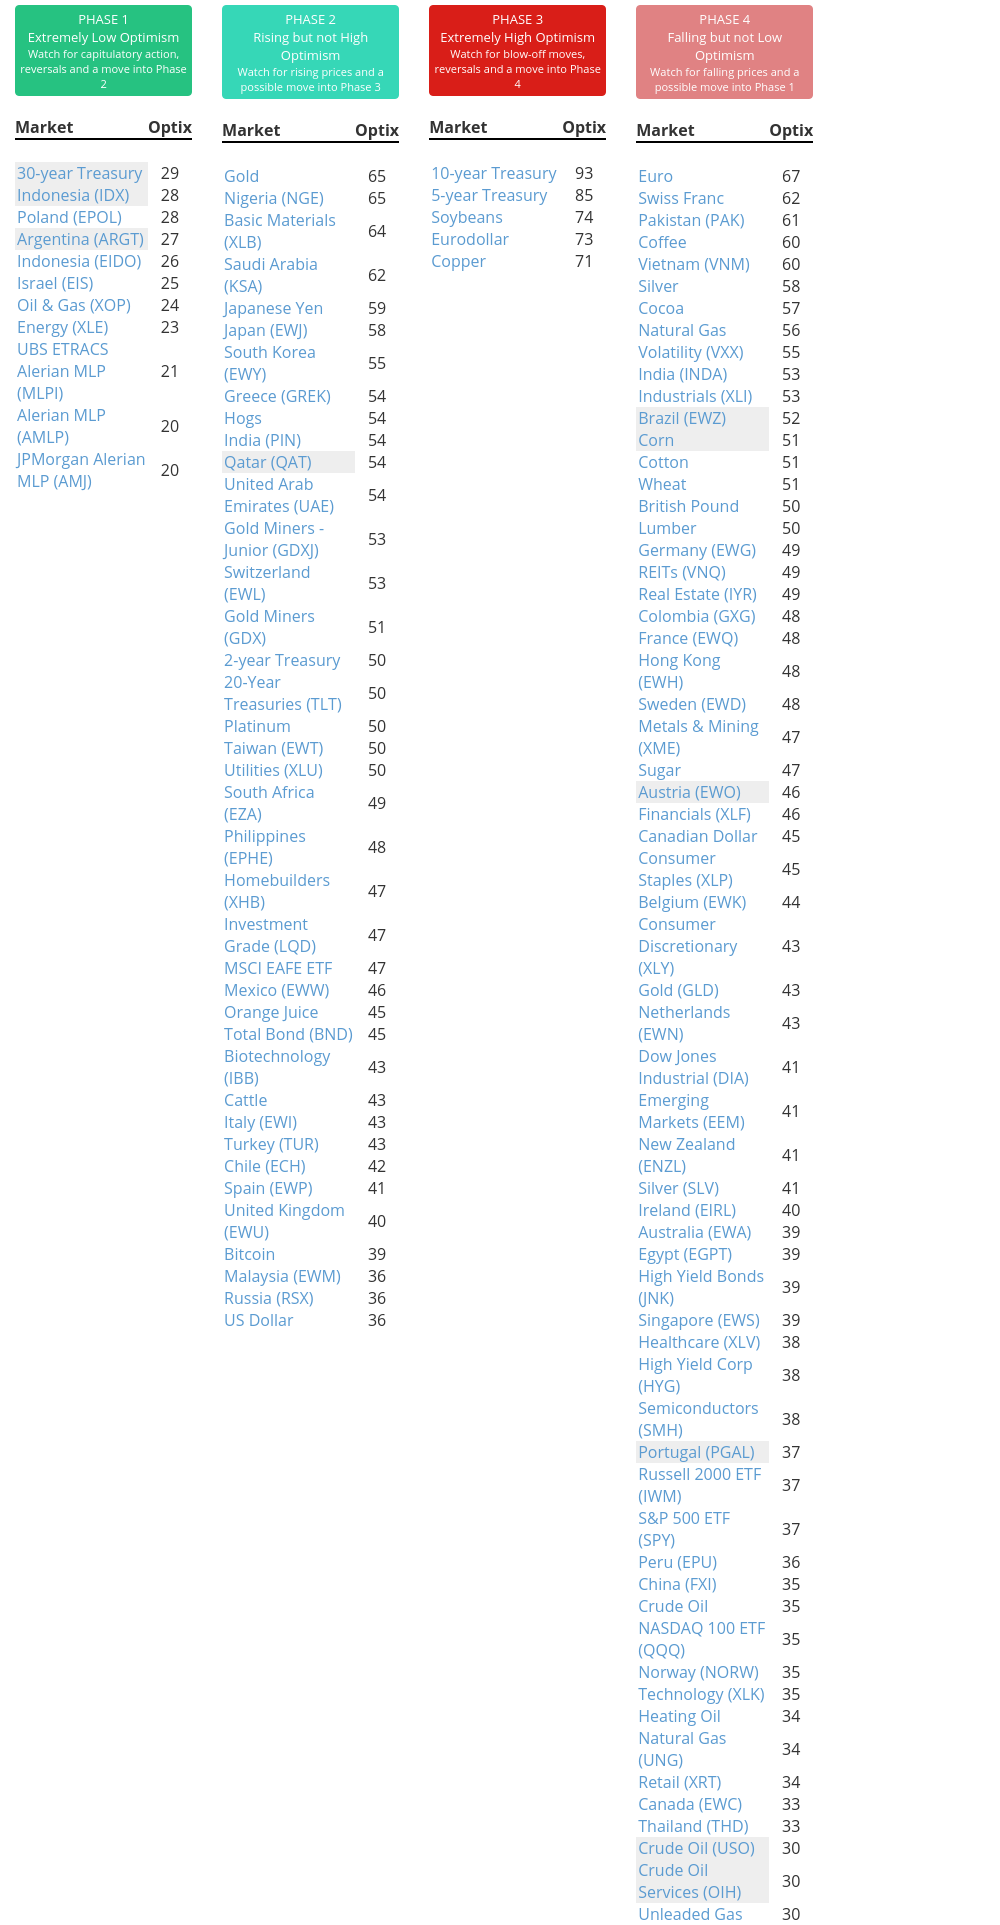
Phase Table
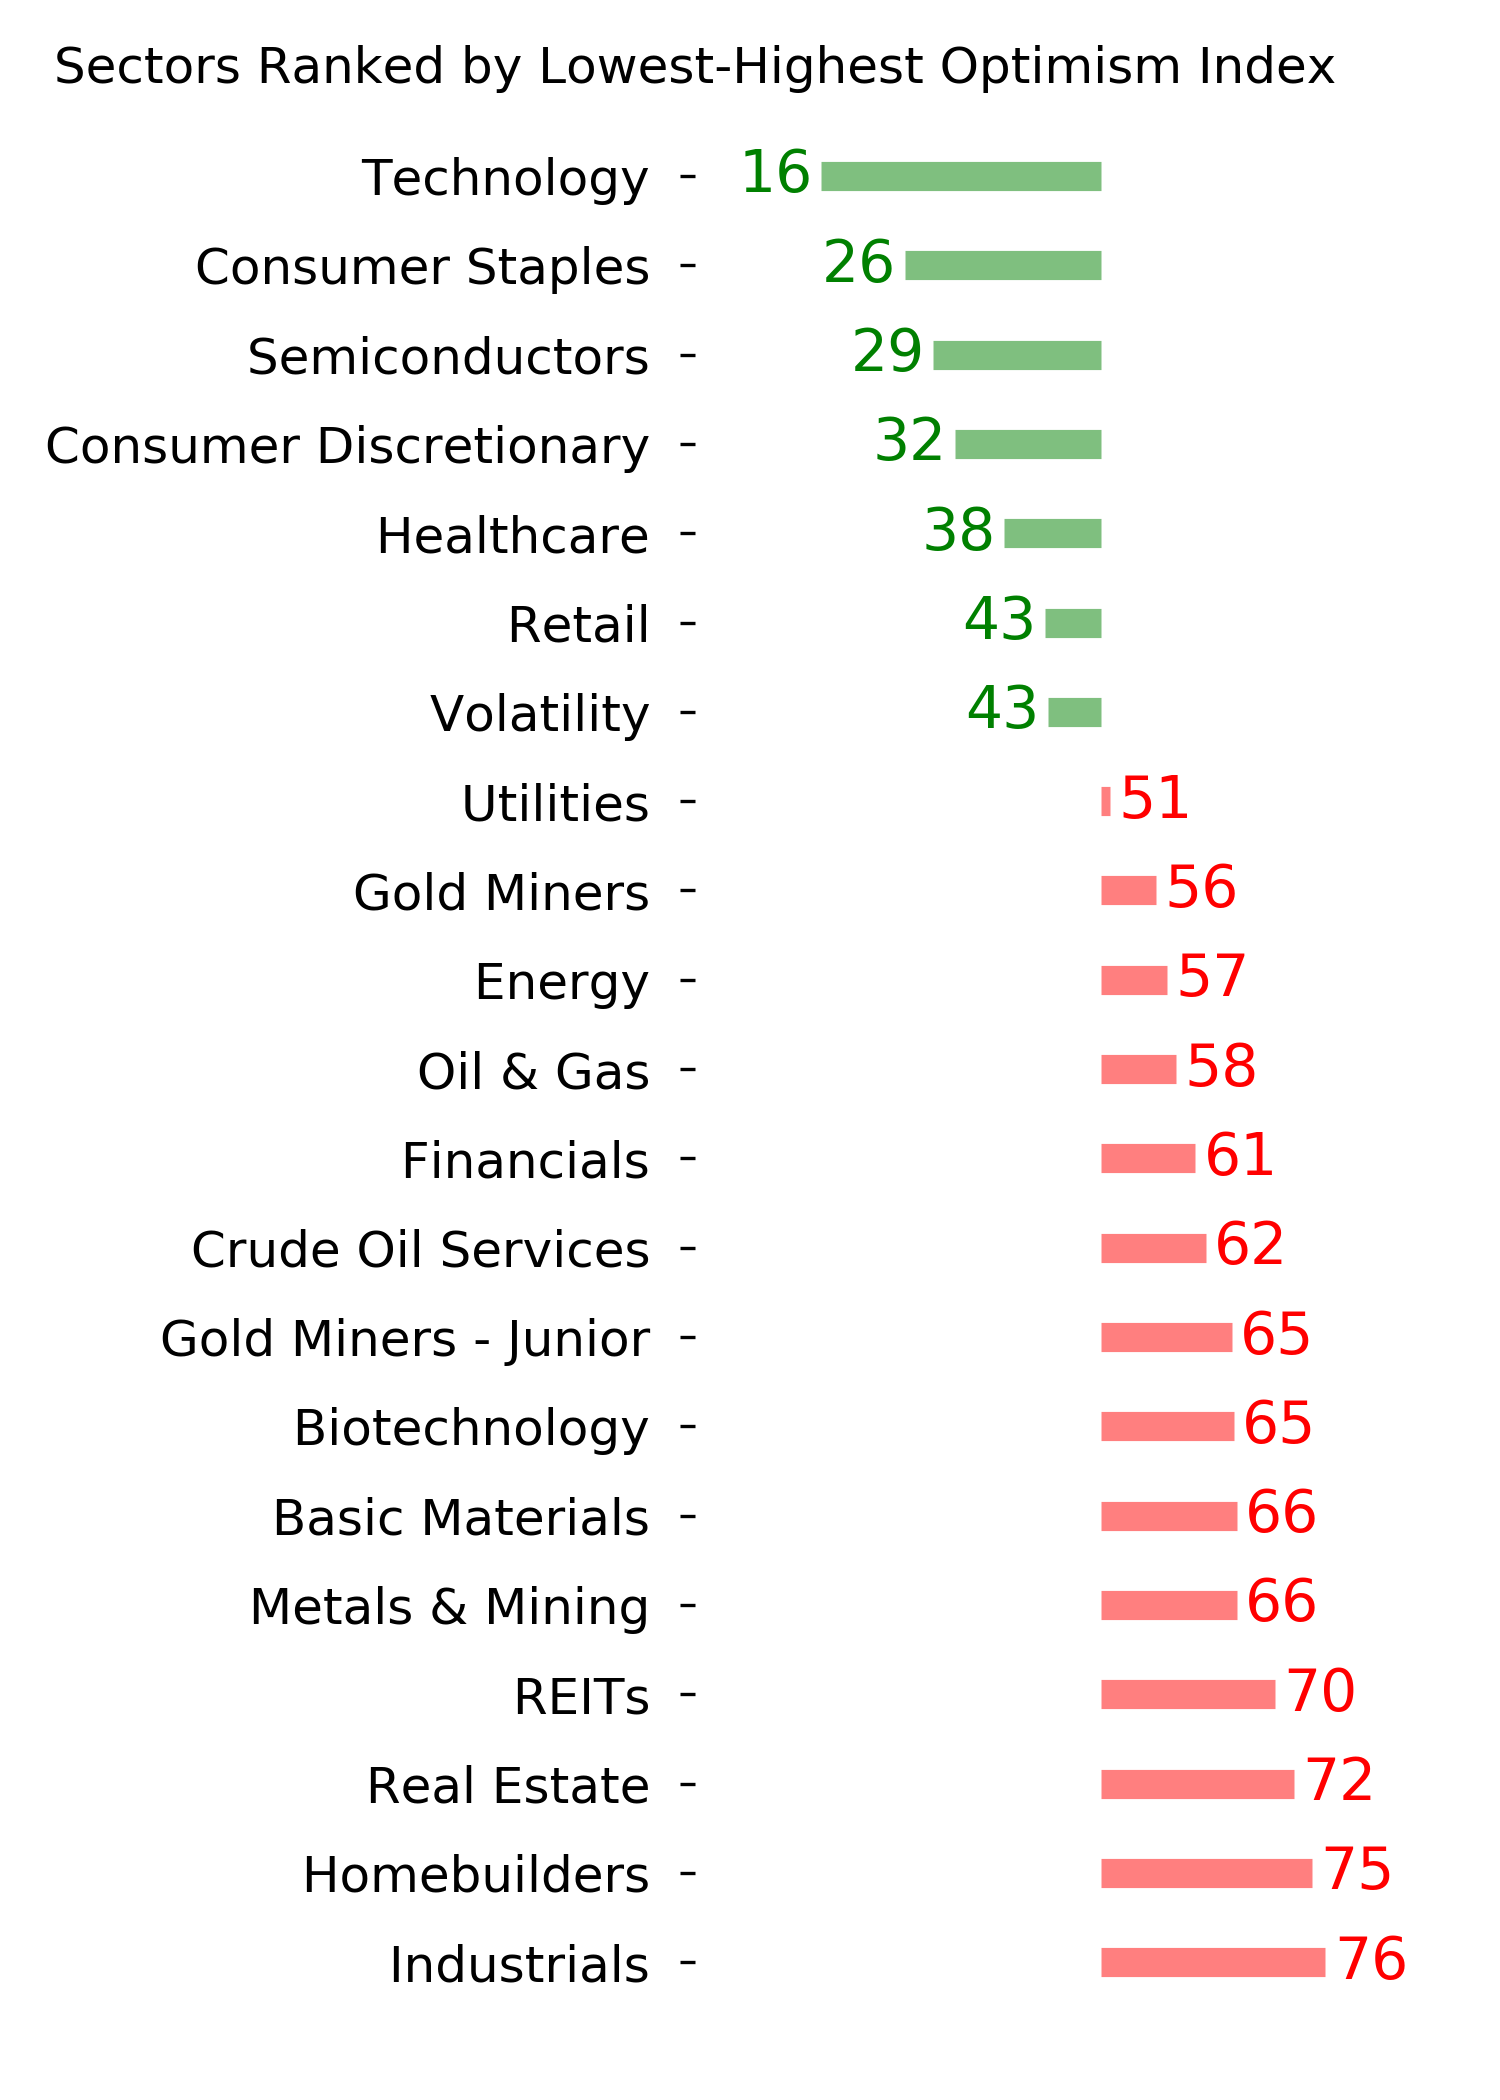
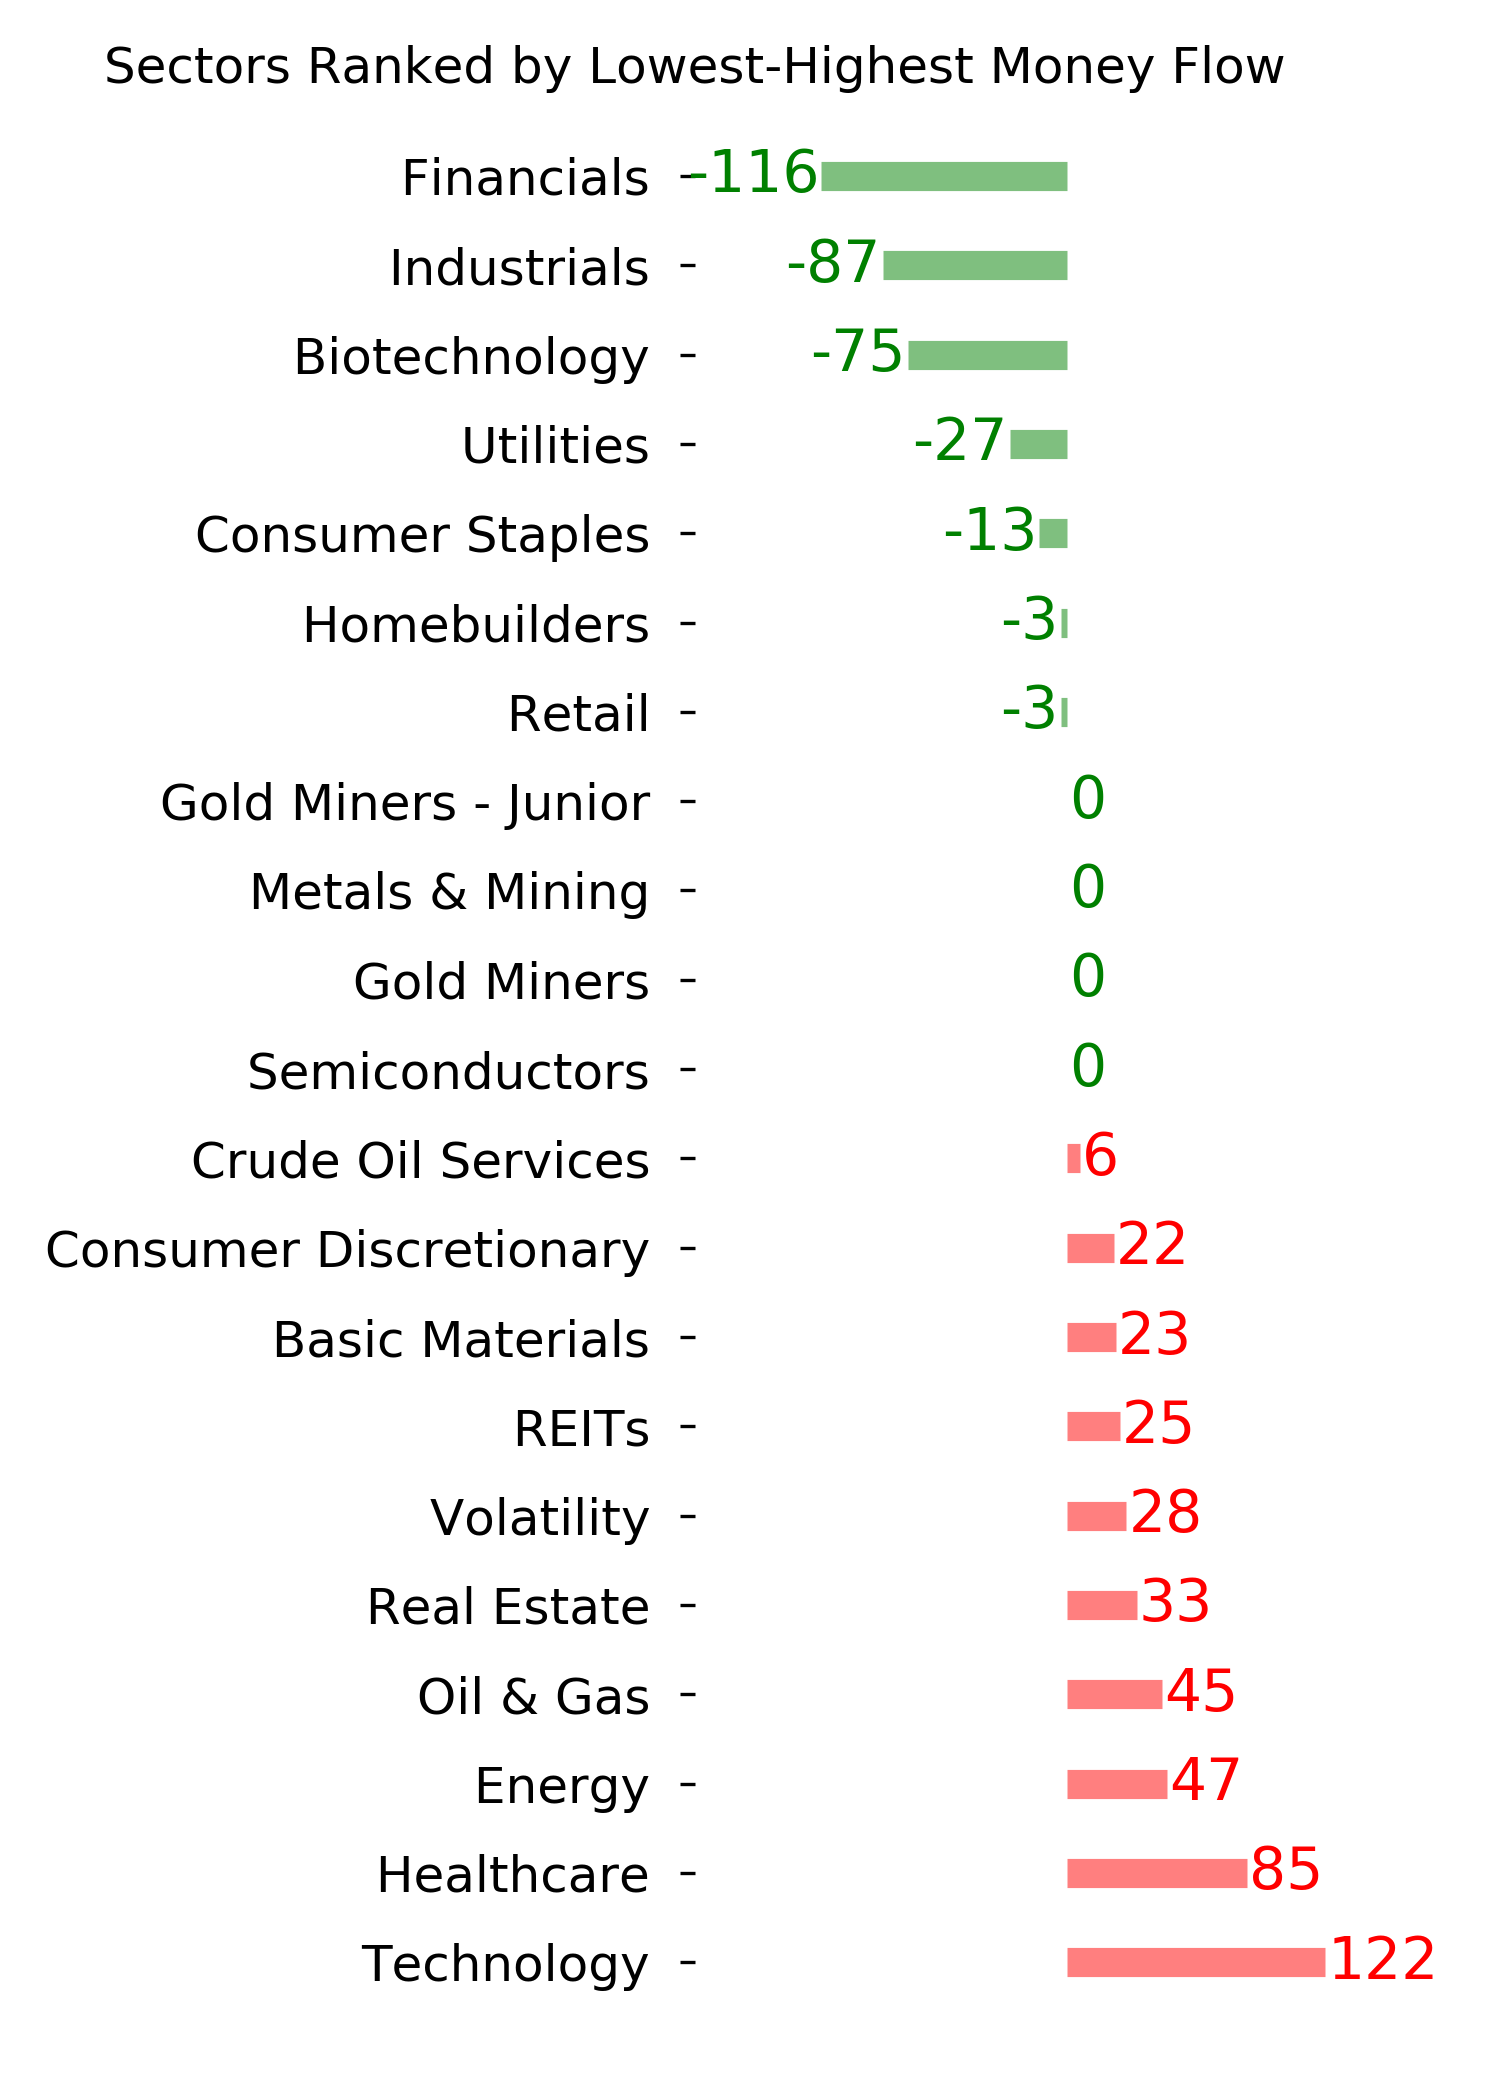
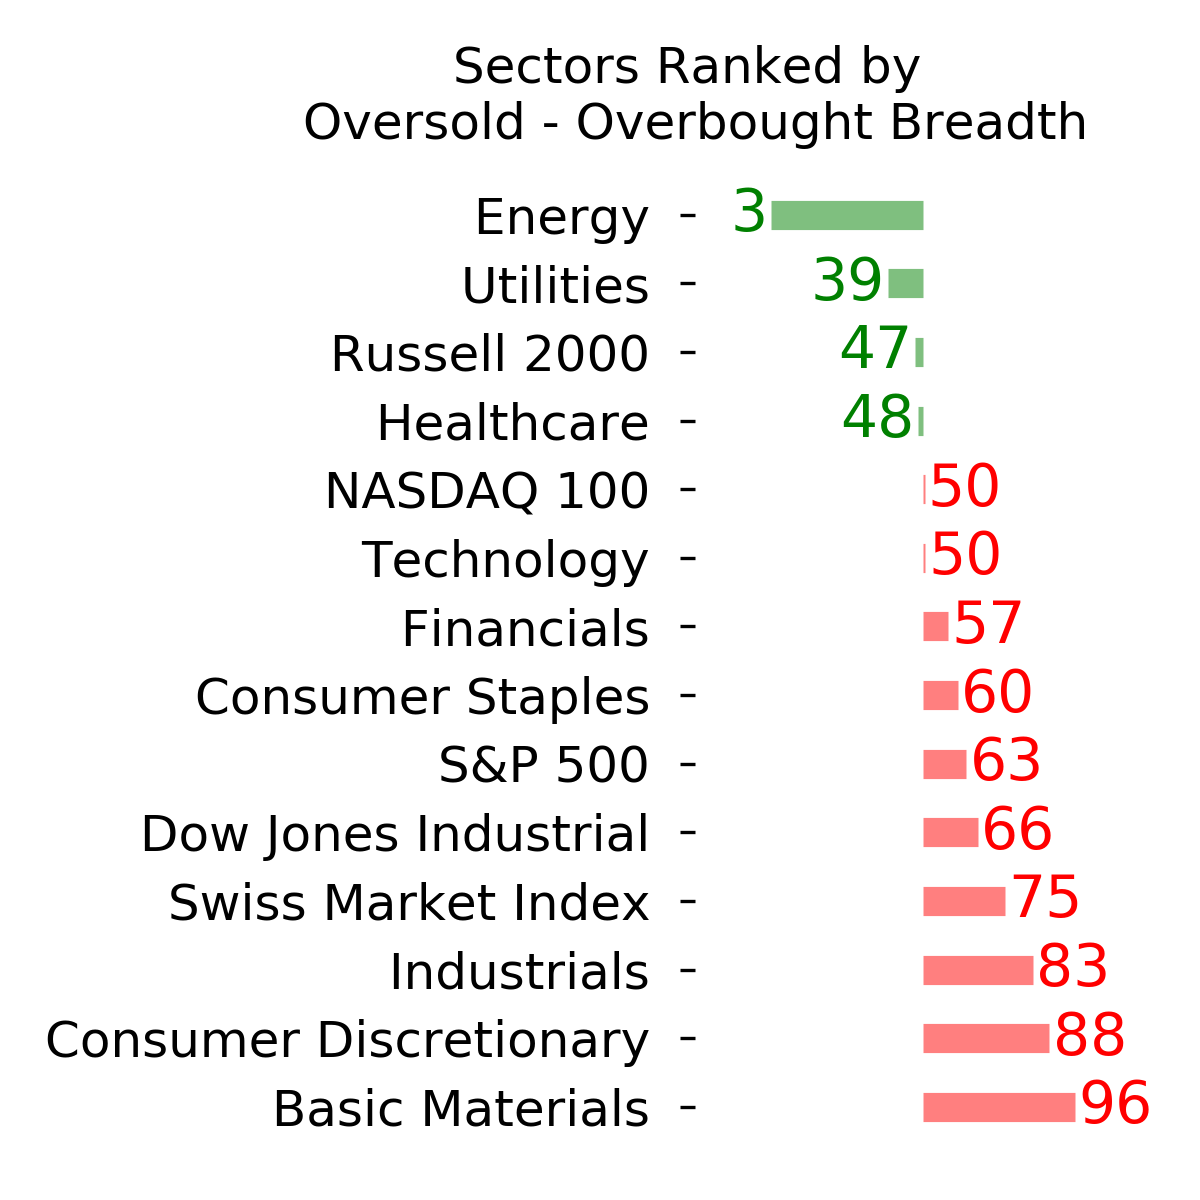
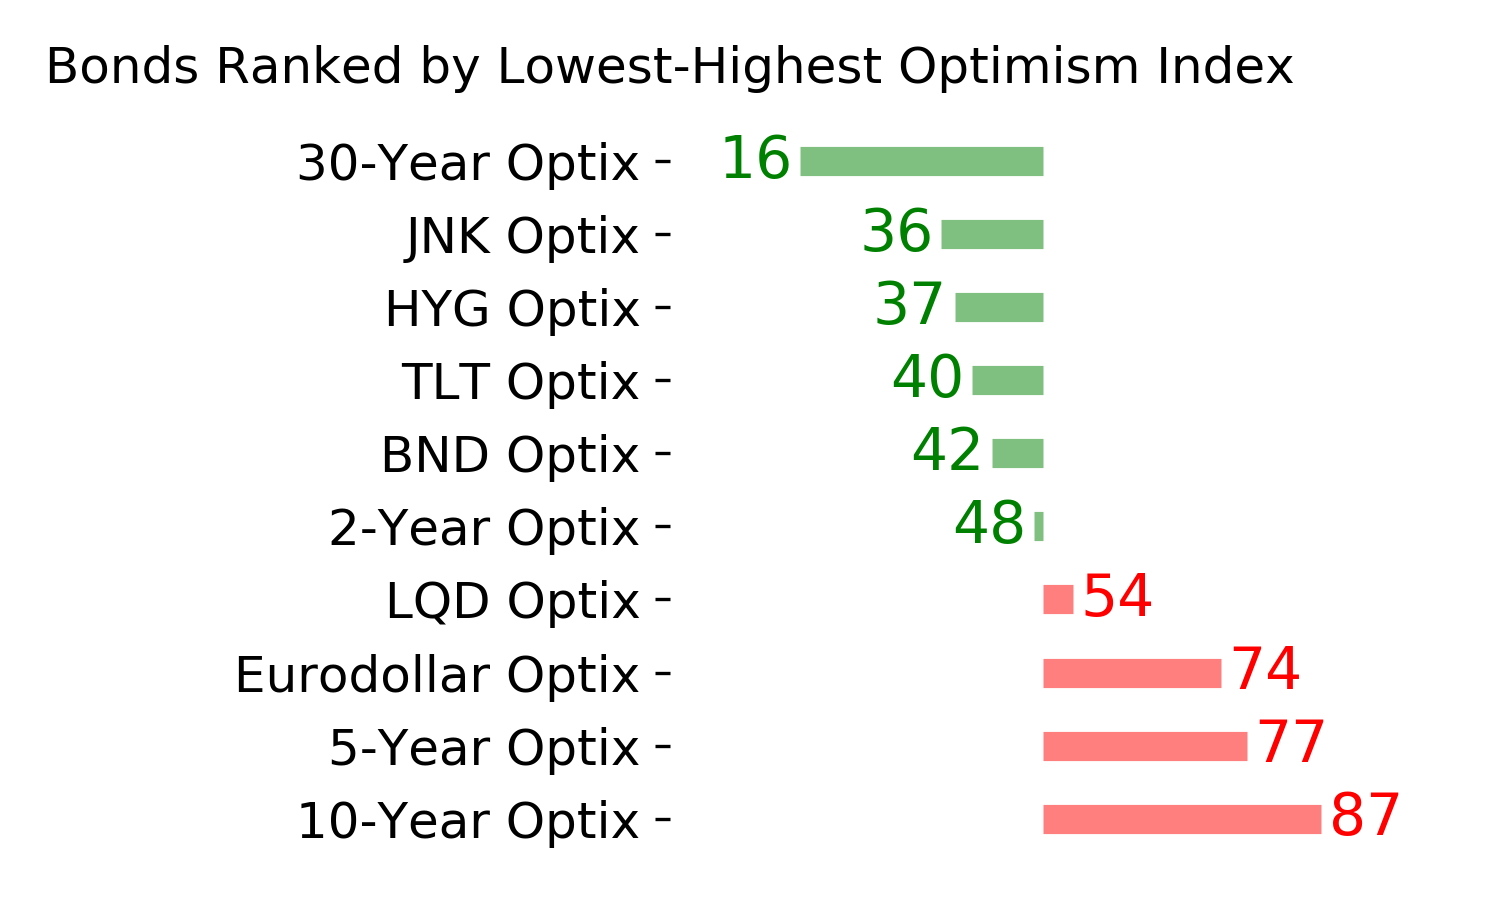
Ranks
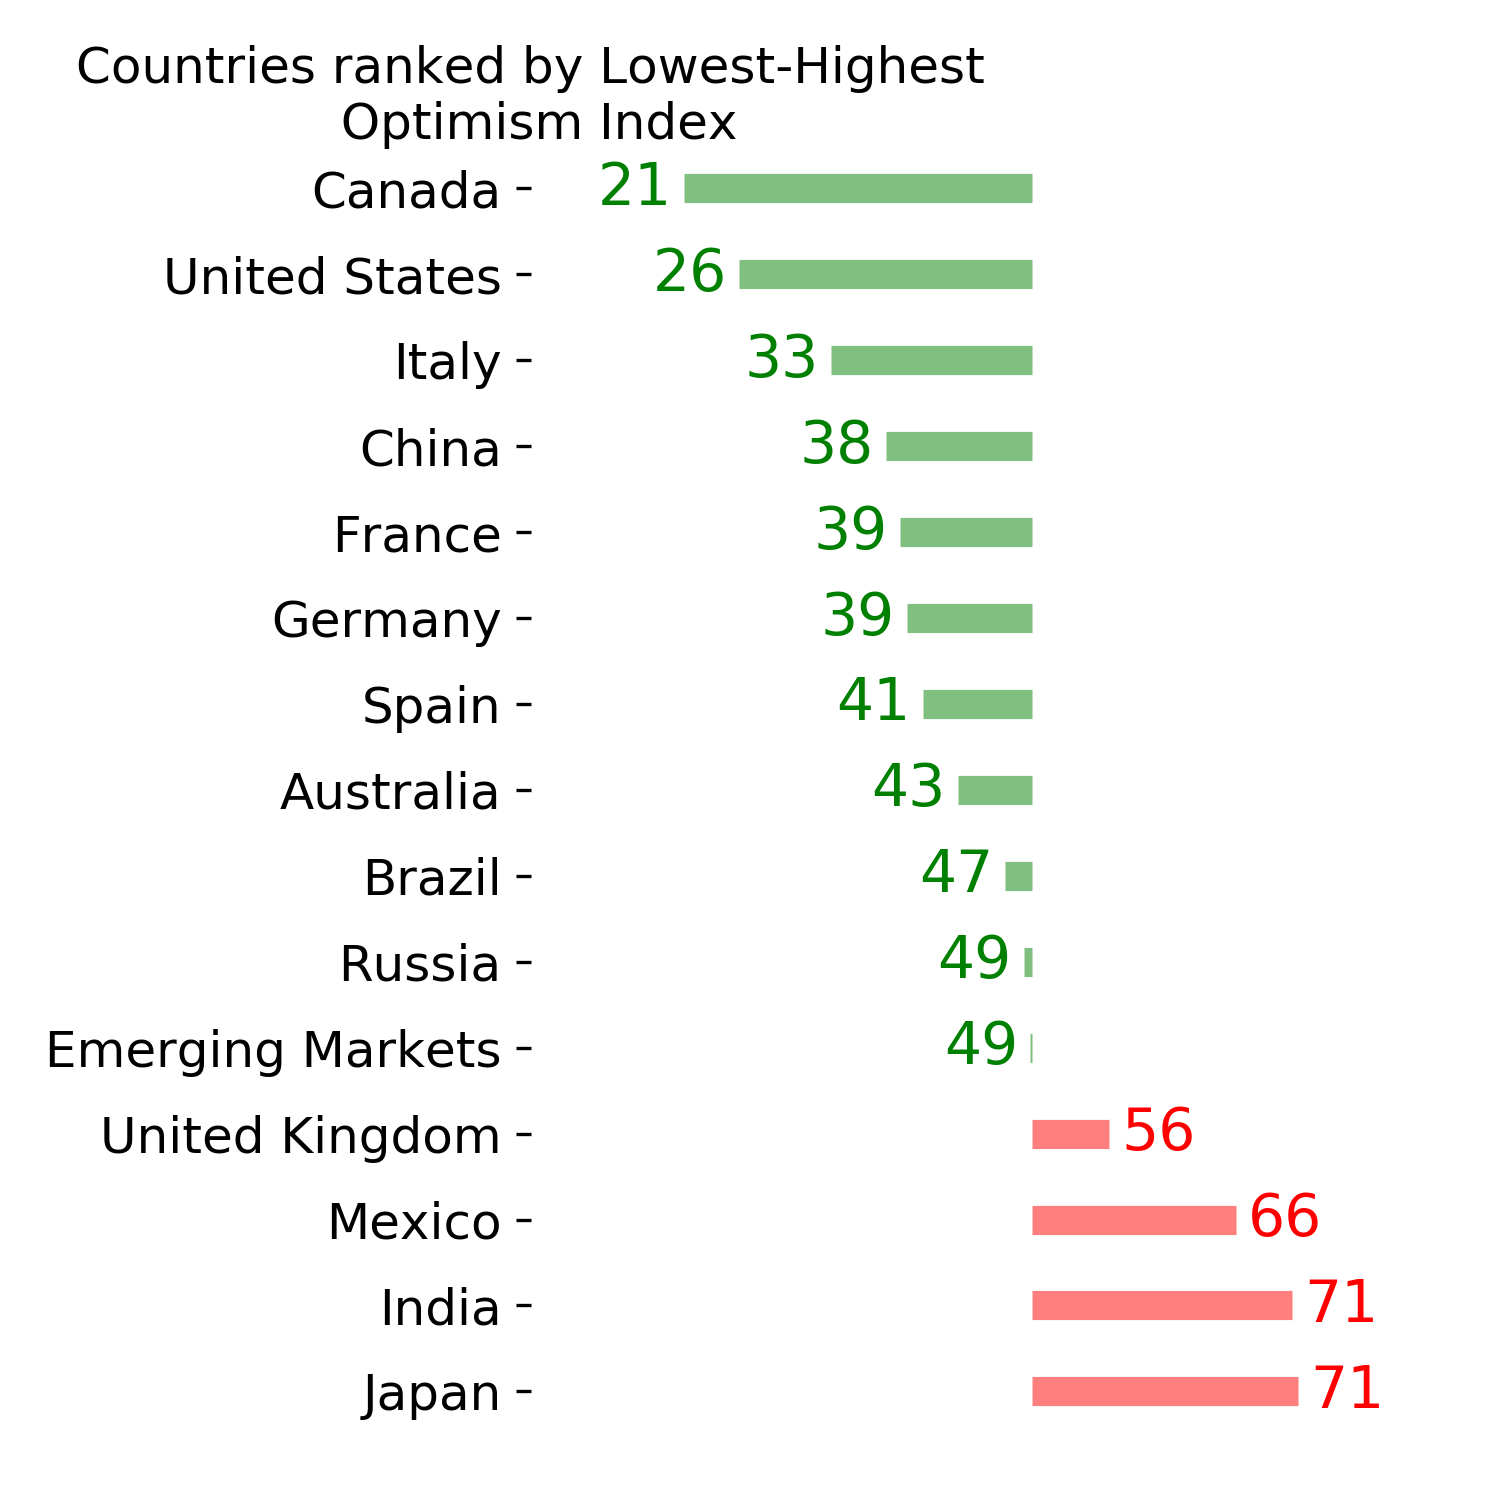
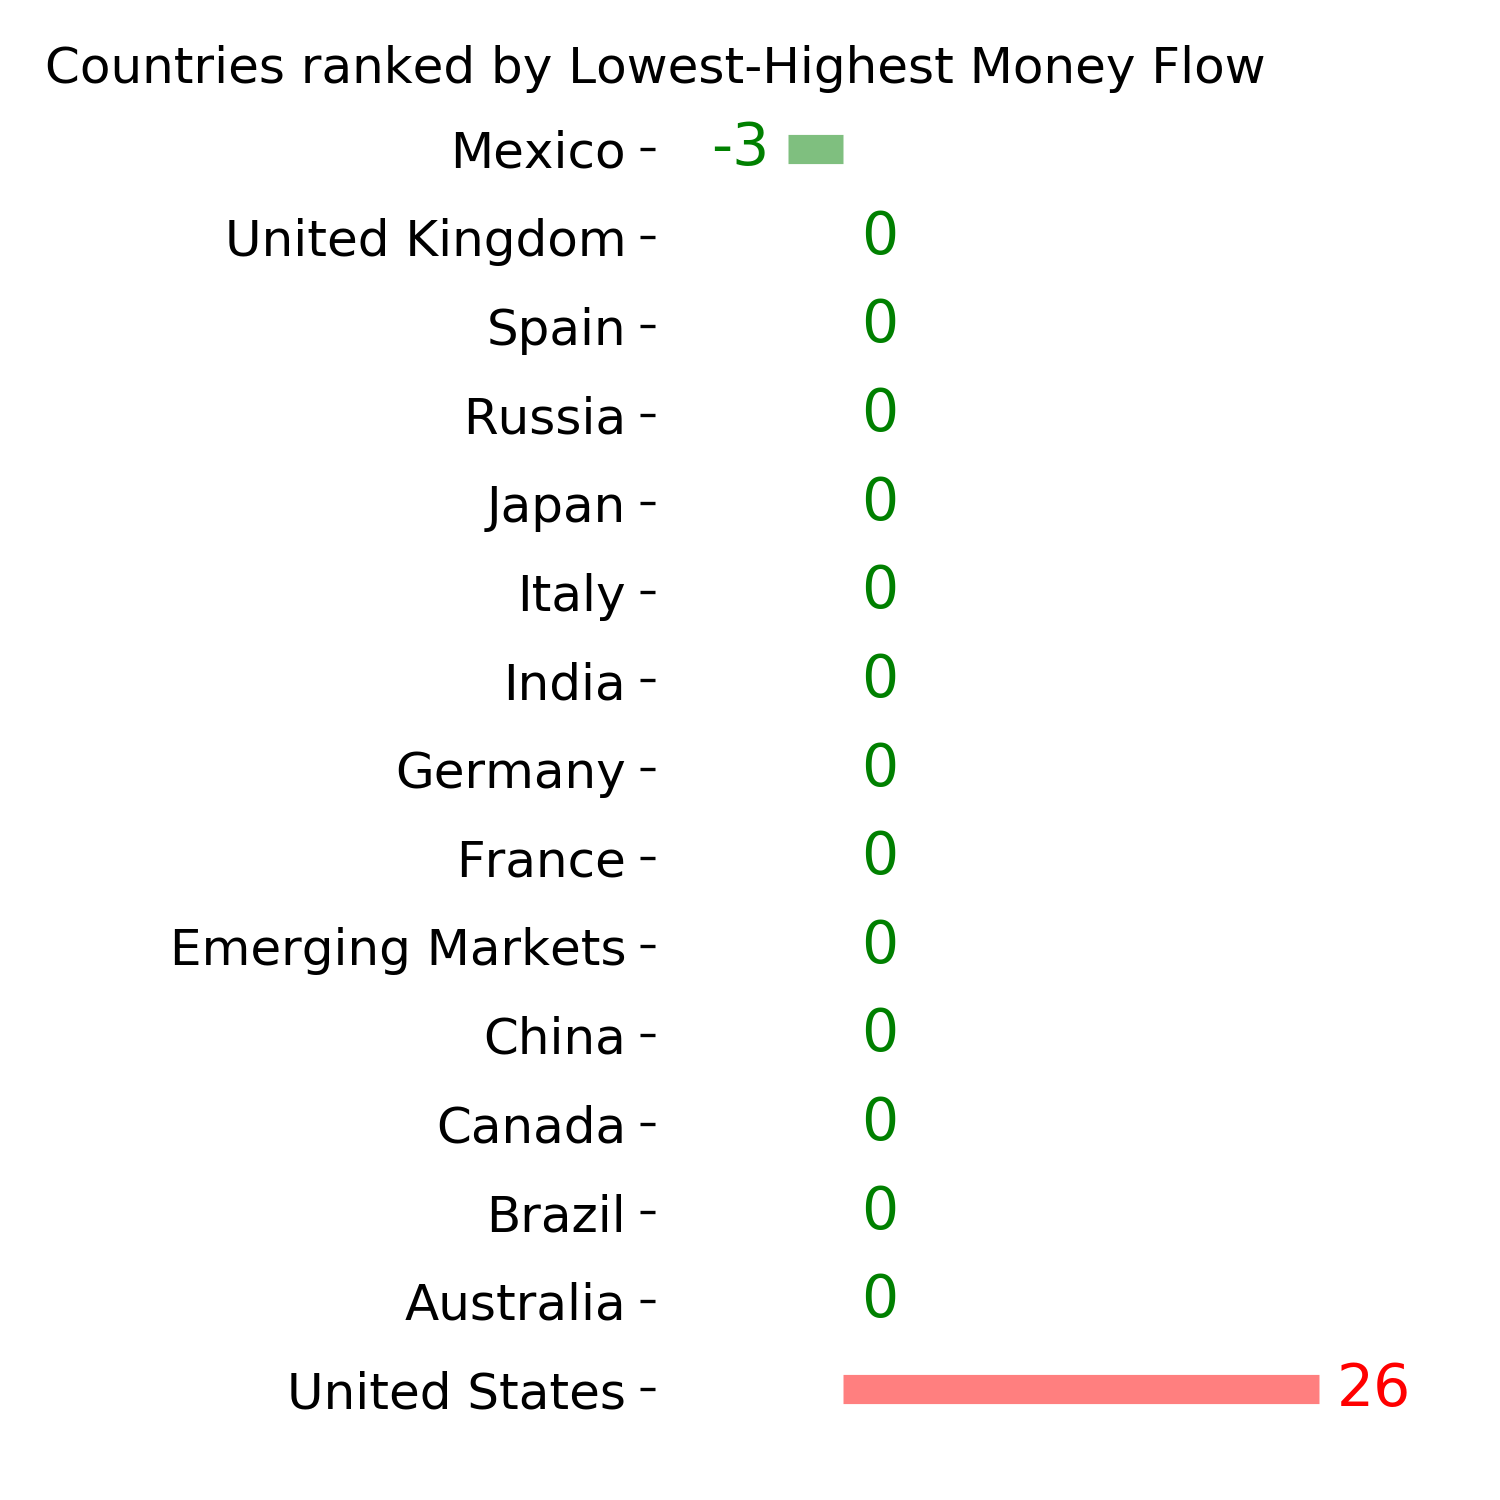
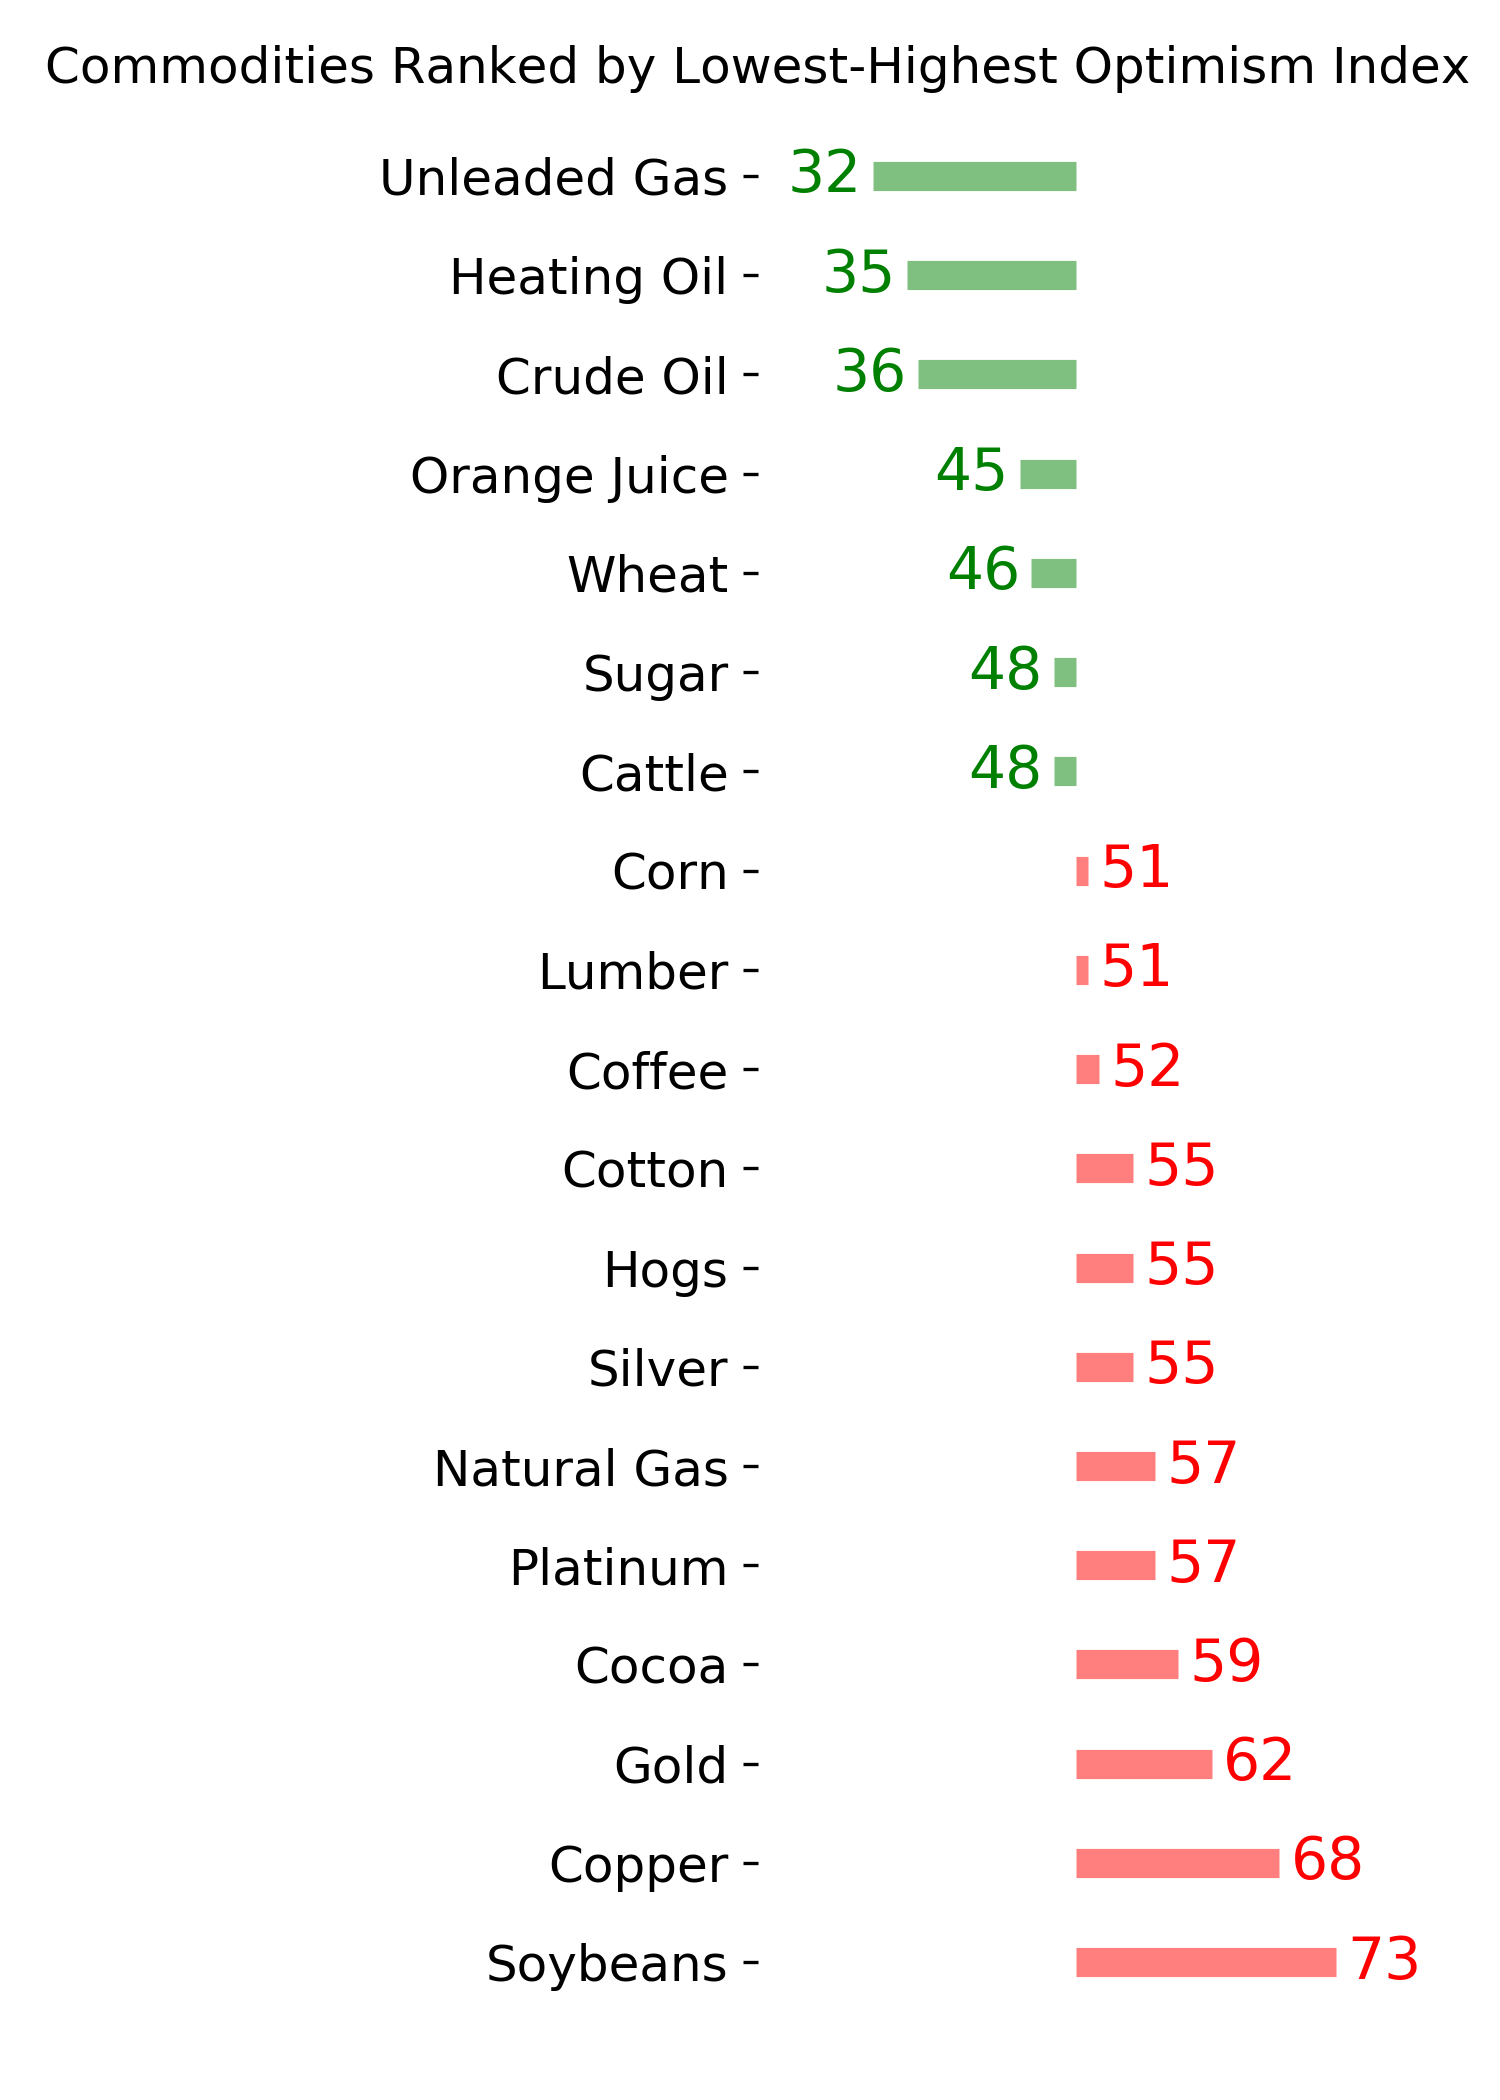
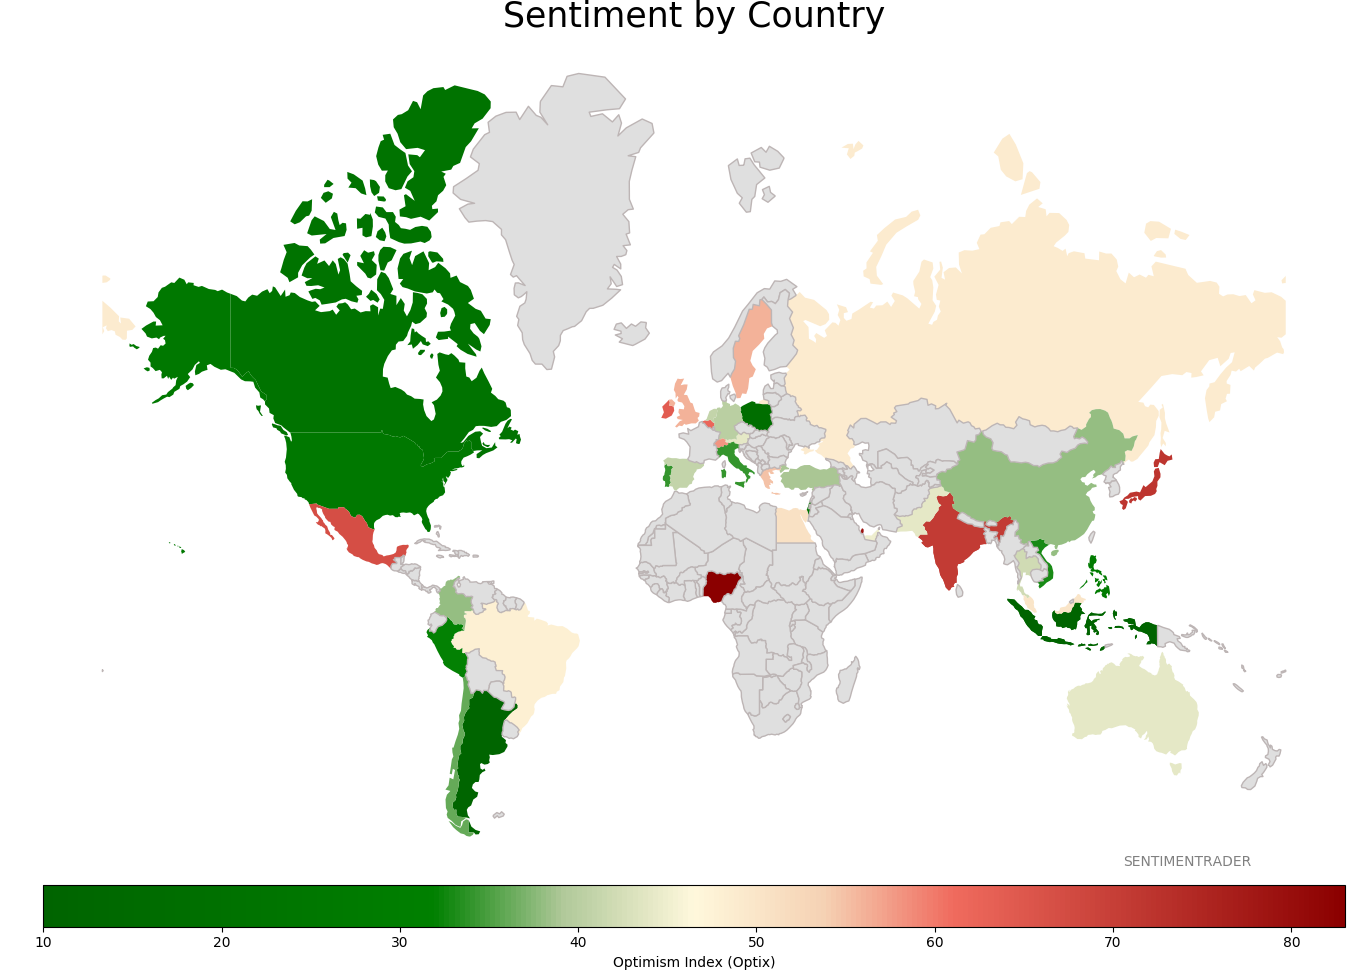
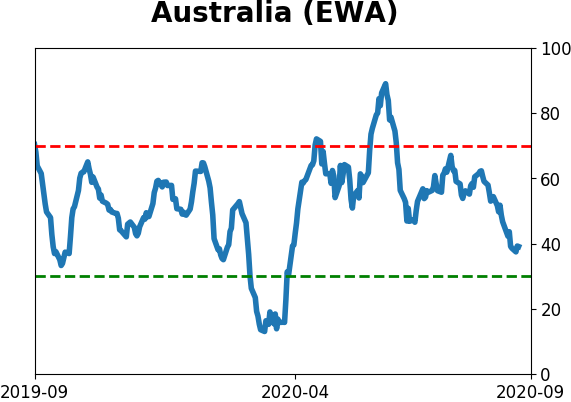
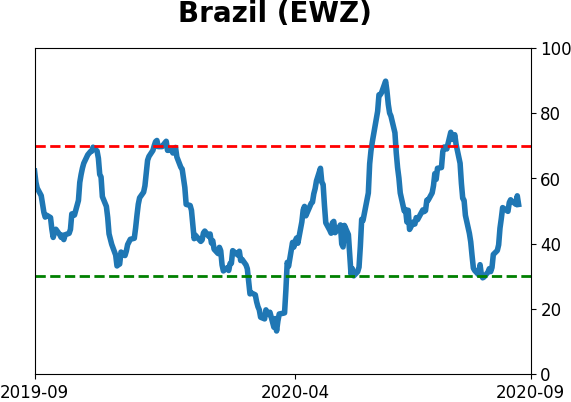
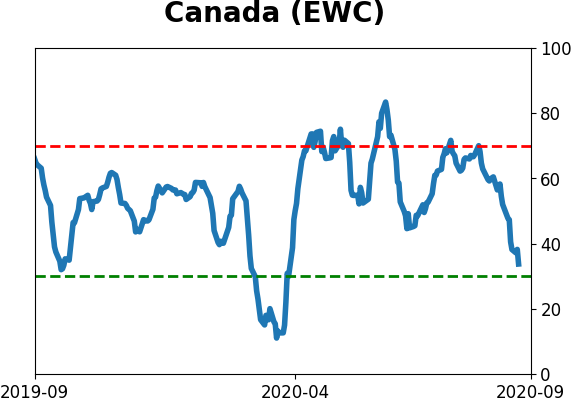
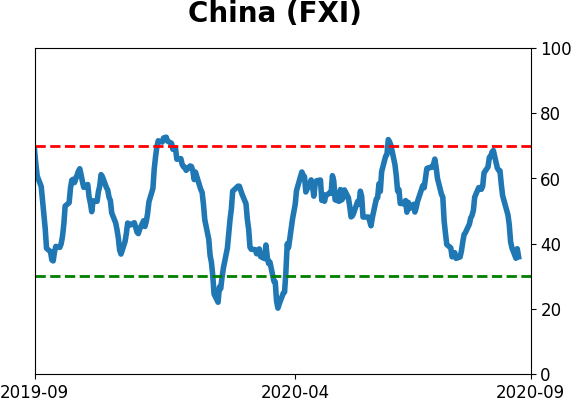
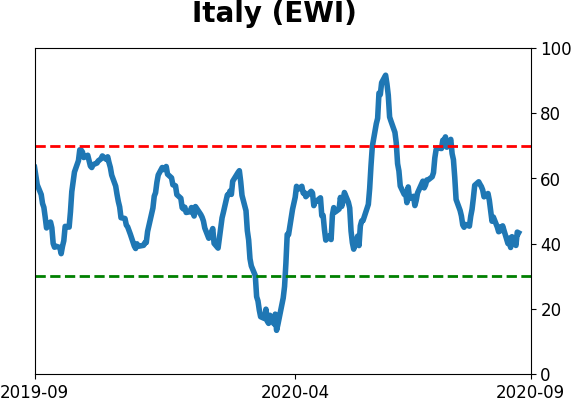
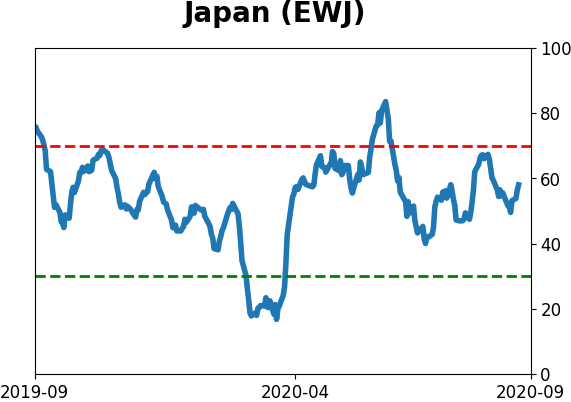
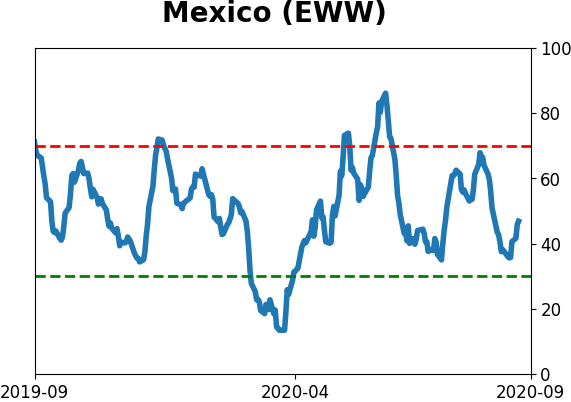
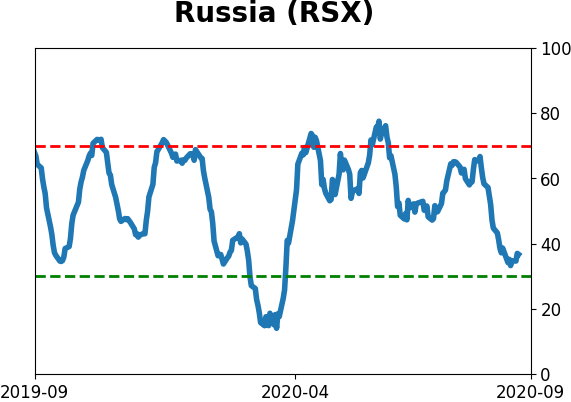
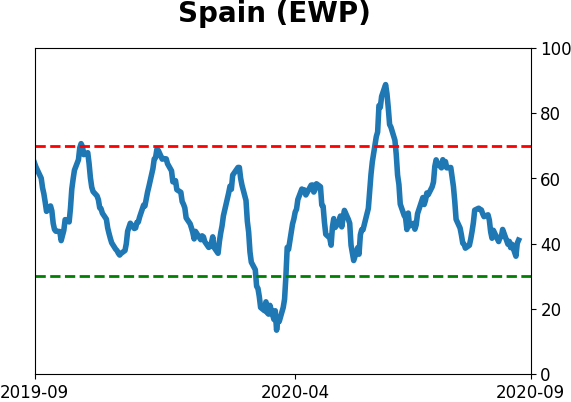
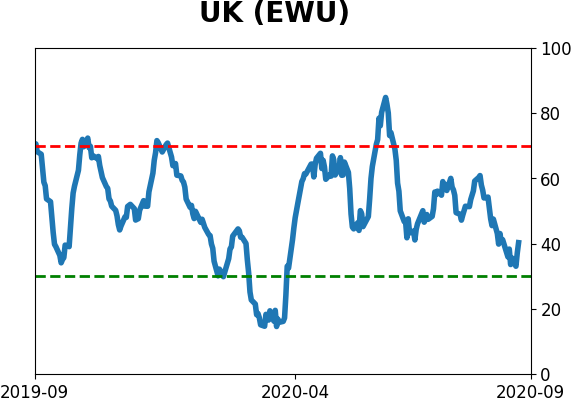
Sentiment Around The World
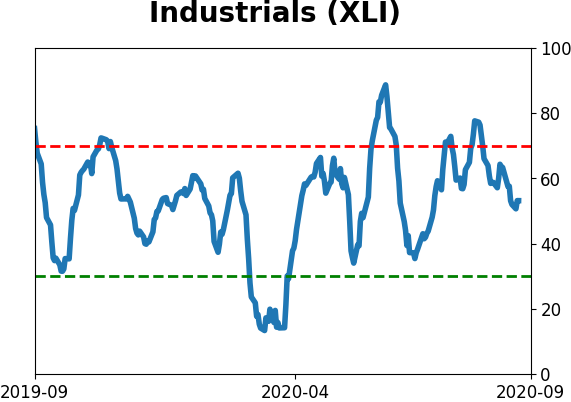
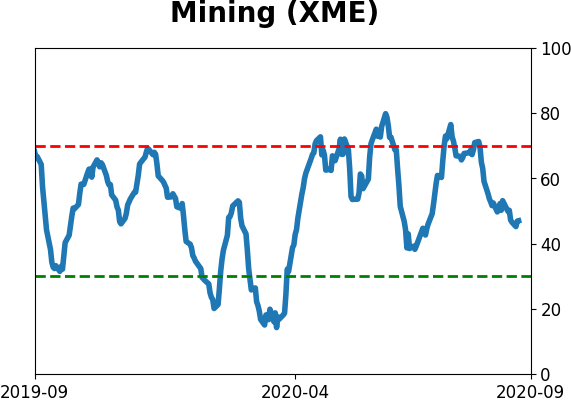
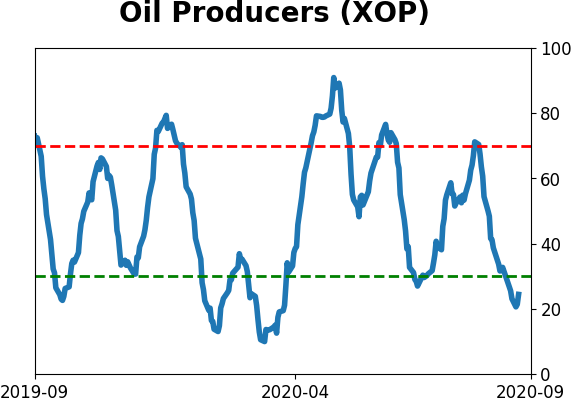
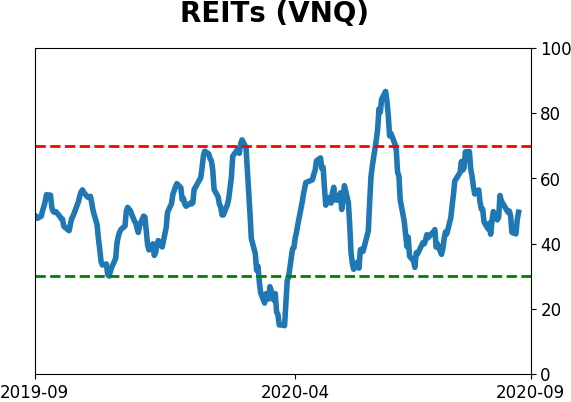
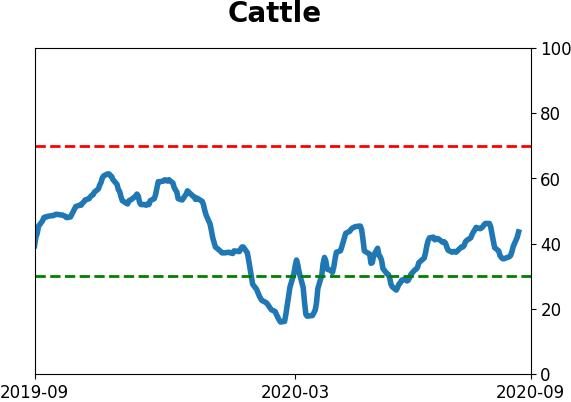
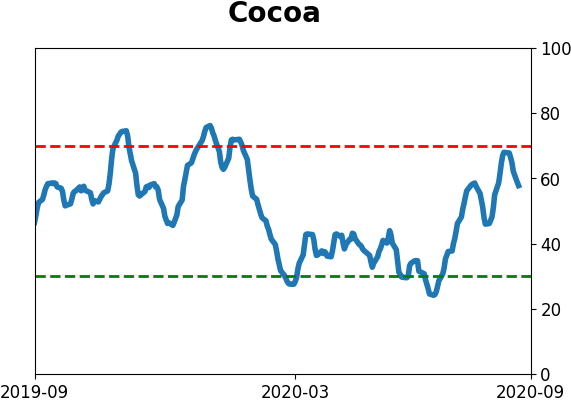
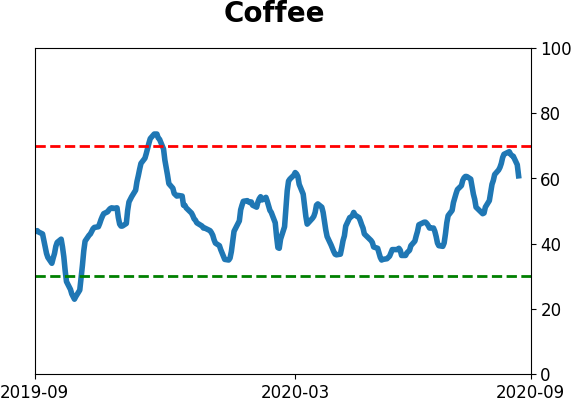
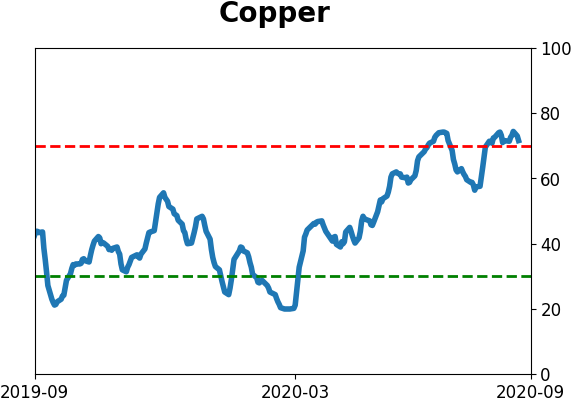
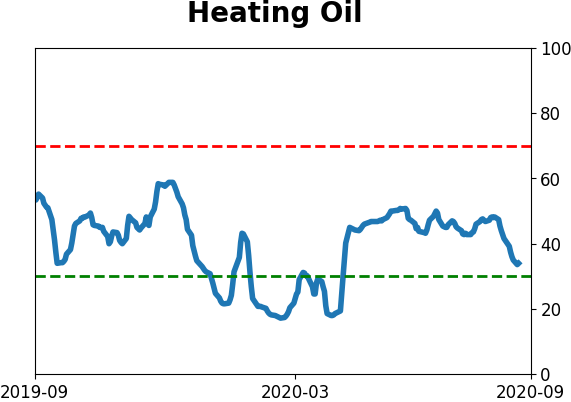
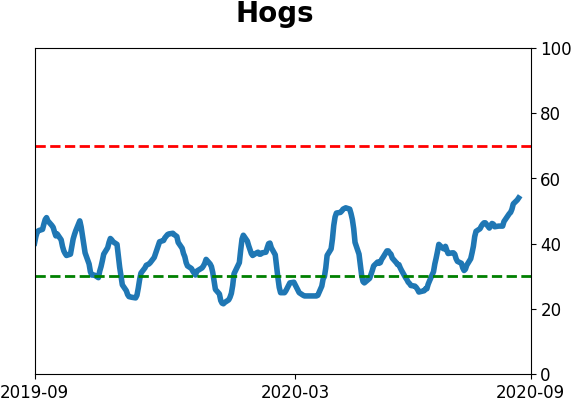
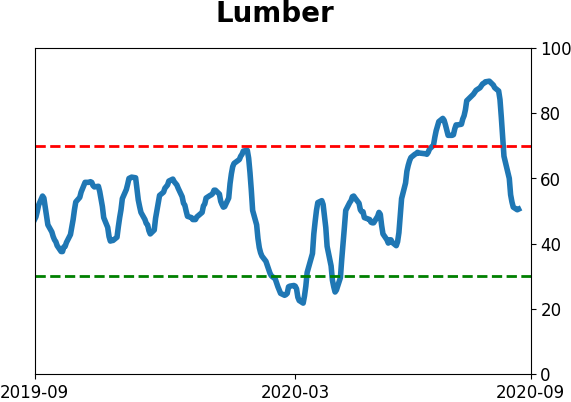
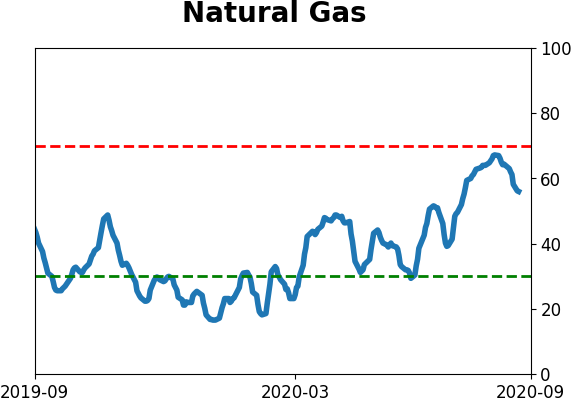
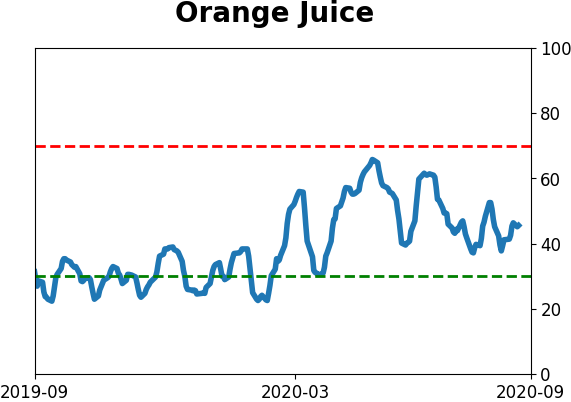
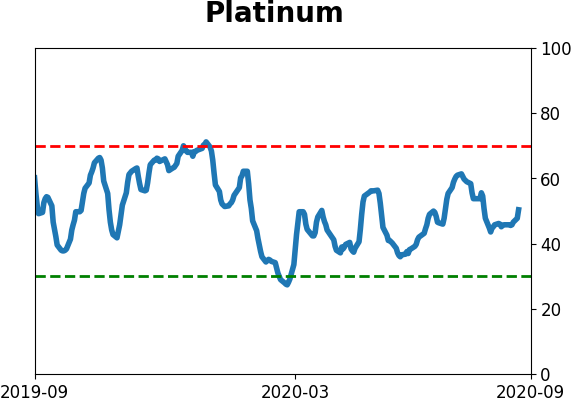
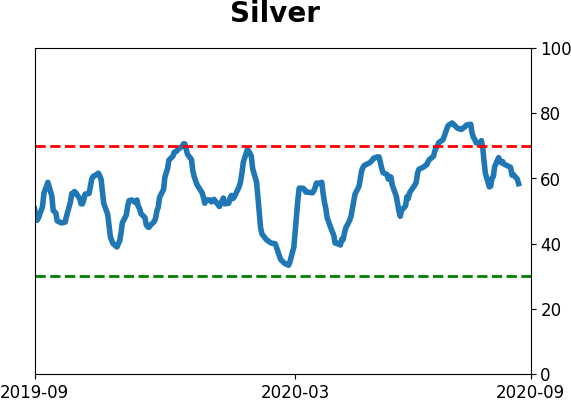
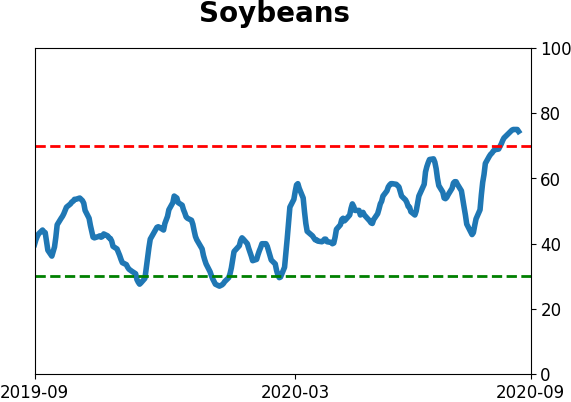
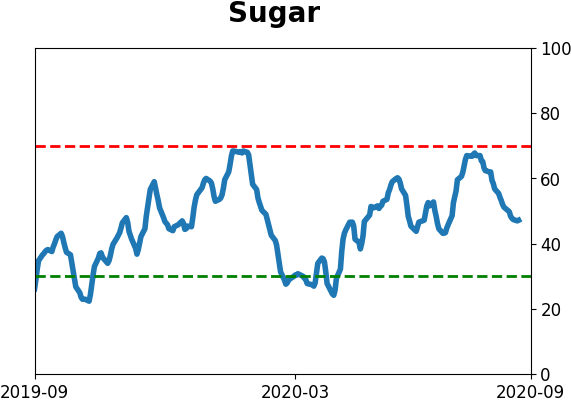
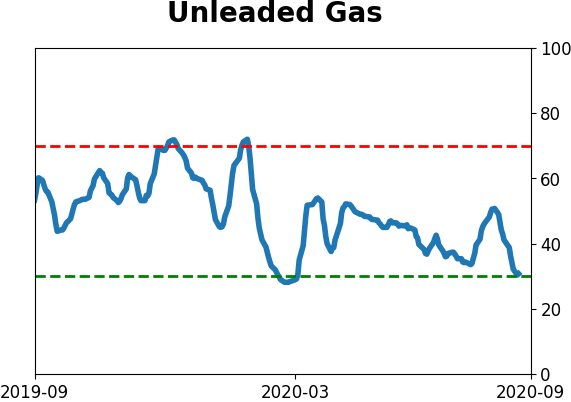
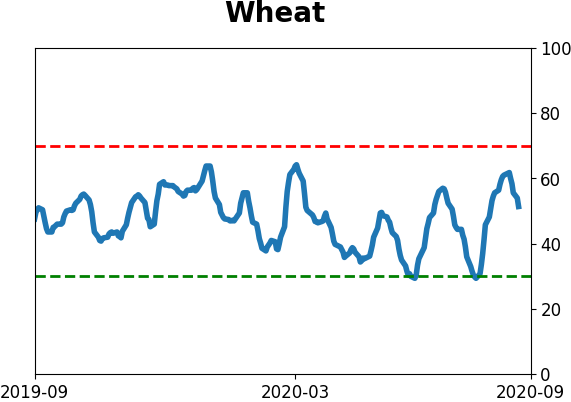
Optimism Index Thumbnails
|
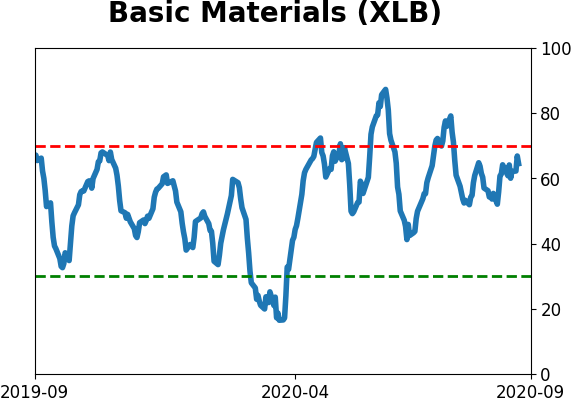
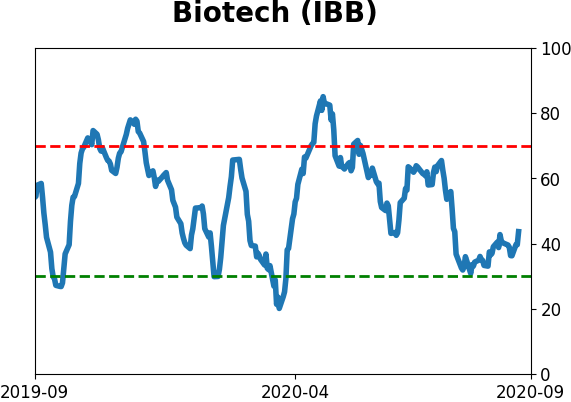
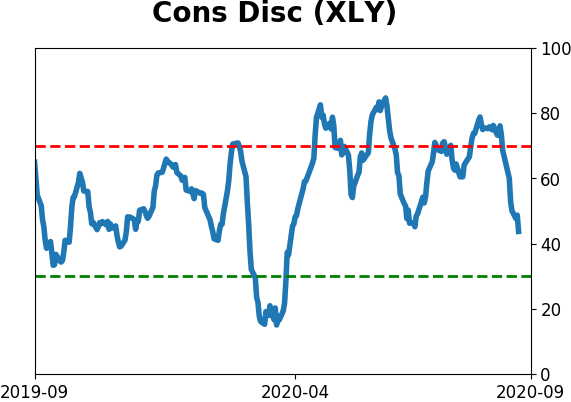
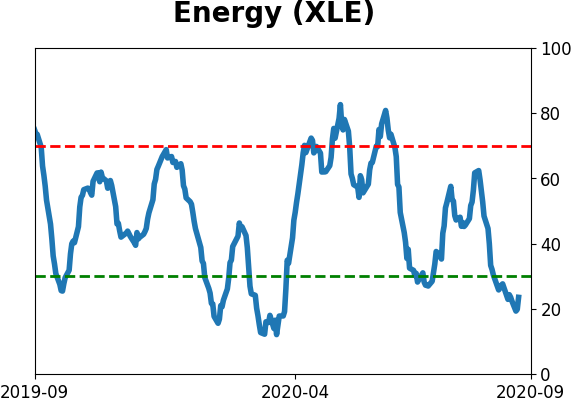
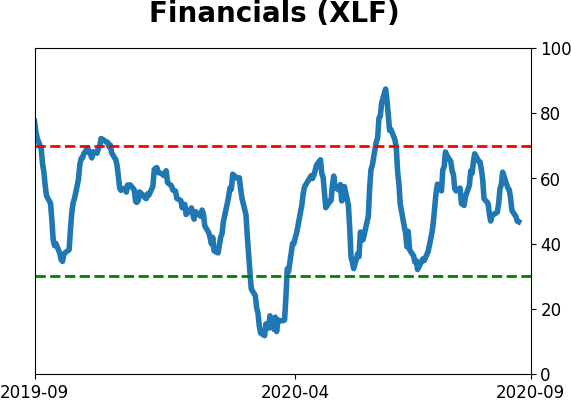
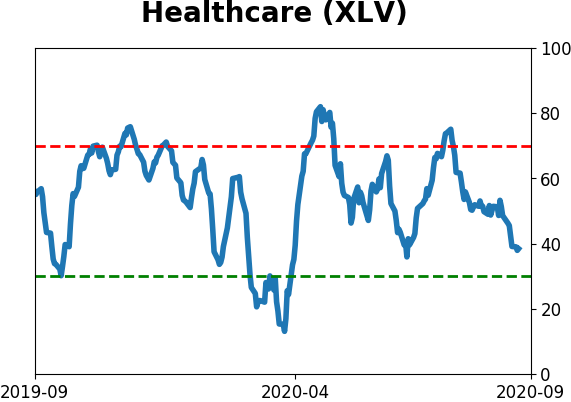
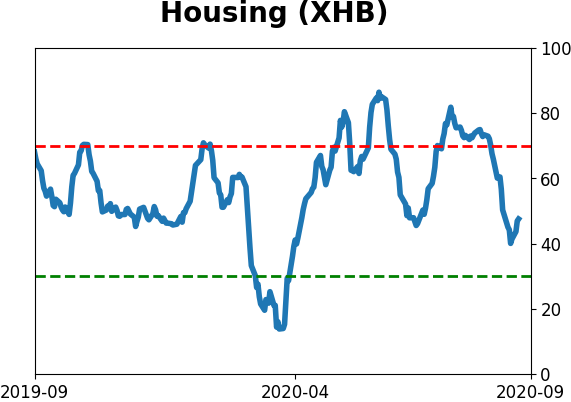
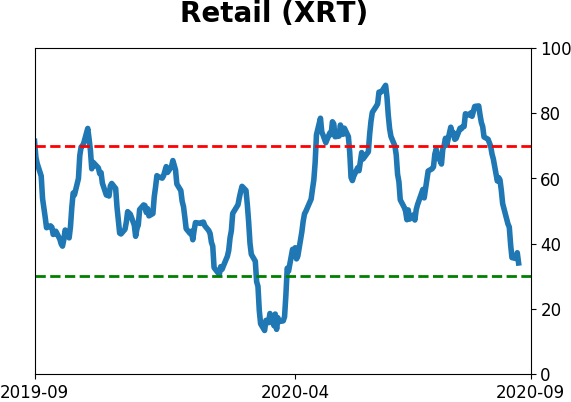
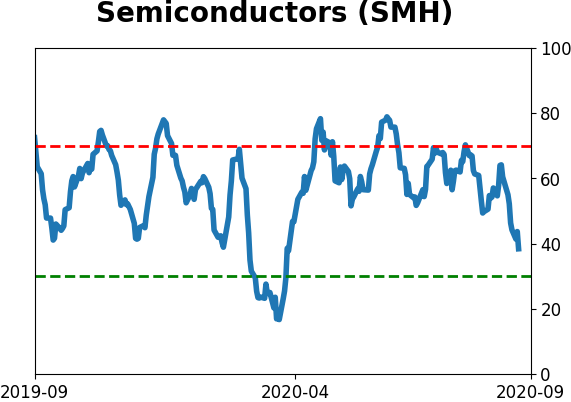
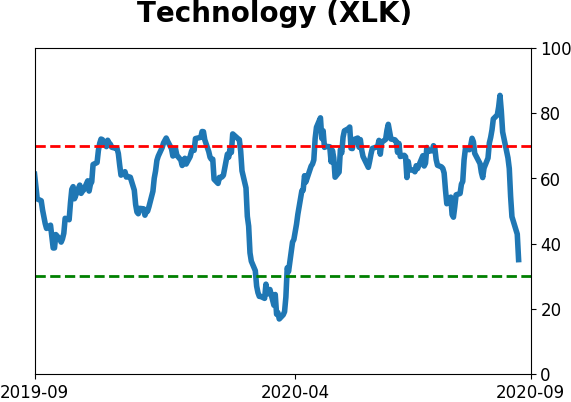
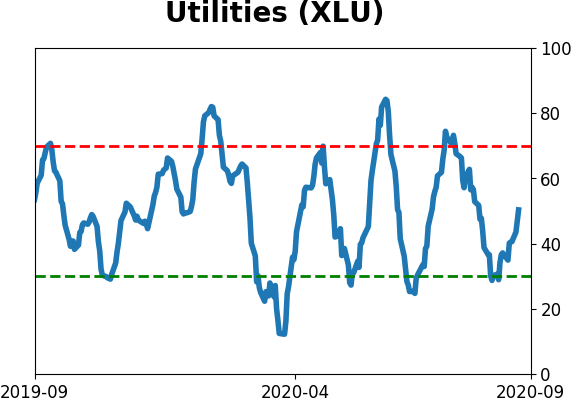
Sector ETF's - 10-Day Moving Average
|
|
|
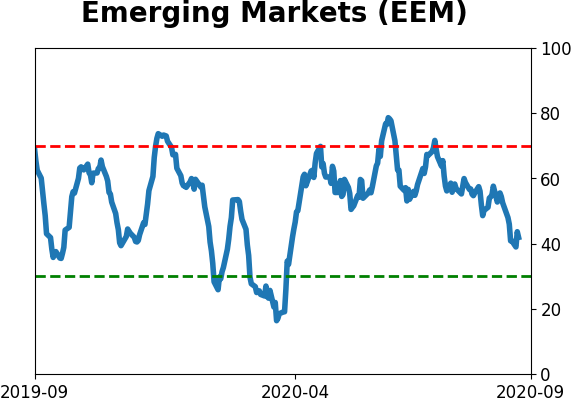
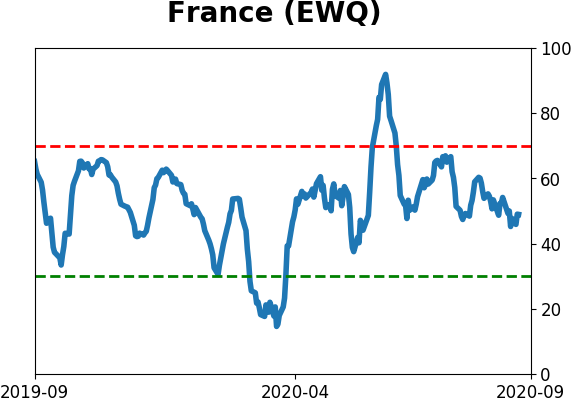
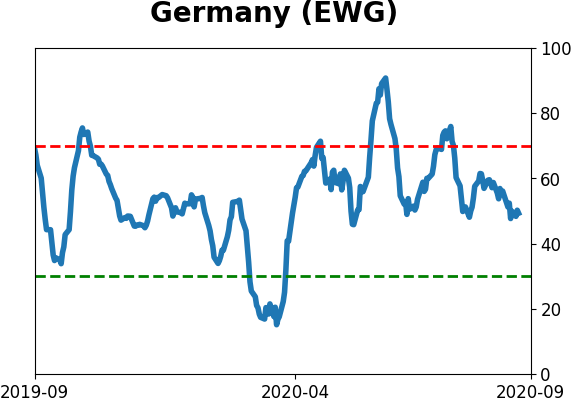
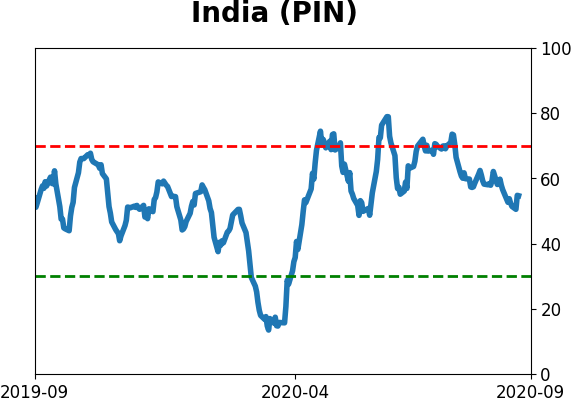
Country ETF's - 10-Day Moving Average
|
|
|
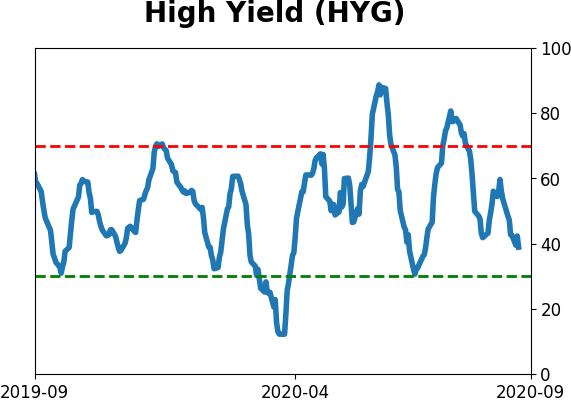
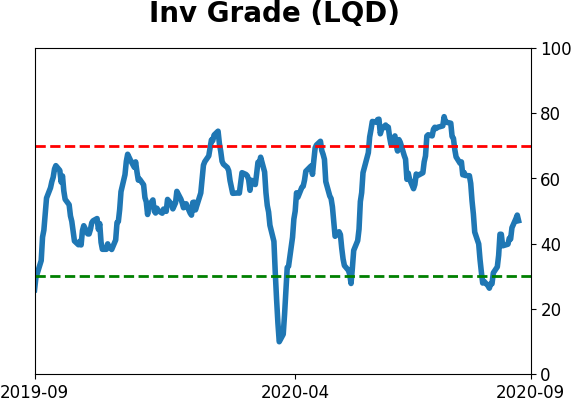
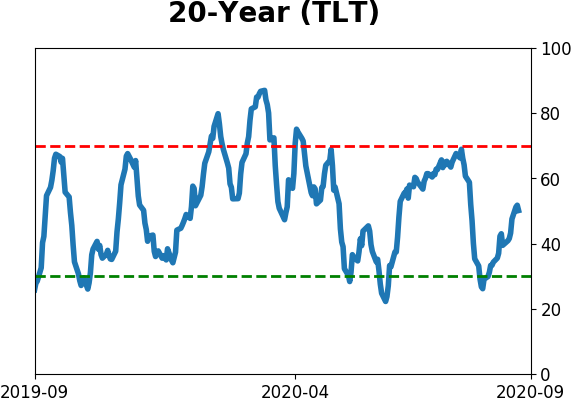
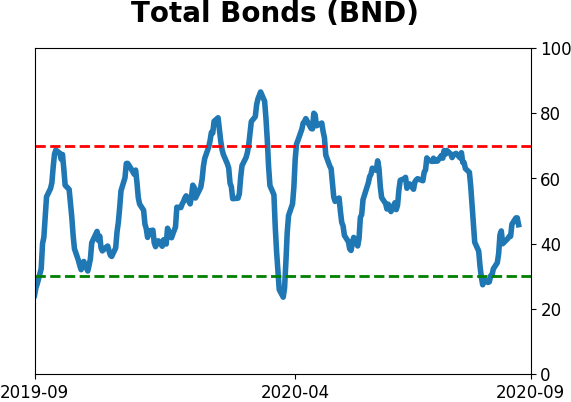
Bond ETF's - 10-Day Moving Average
|
|
|
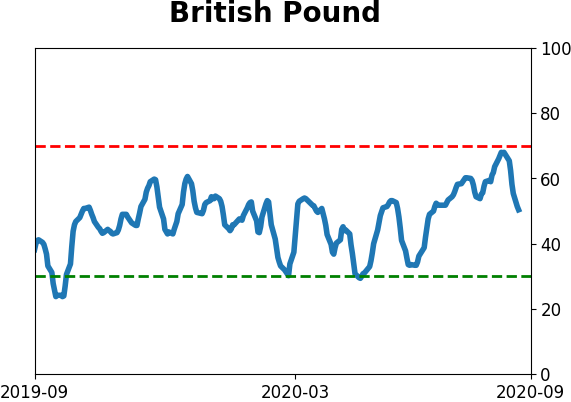
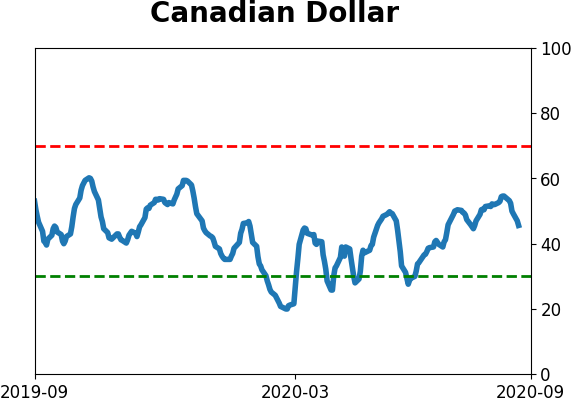
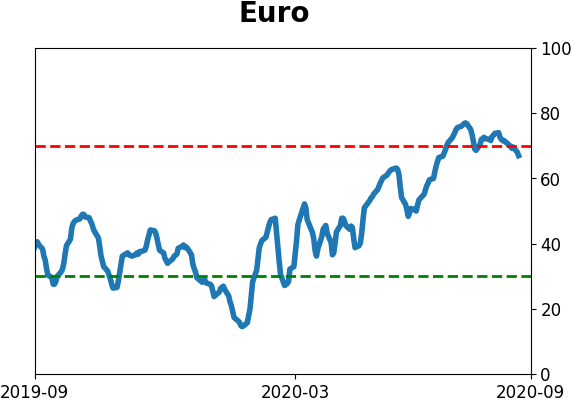
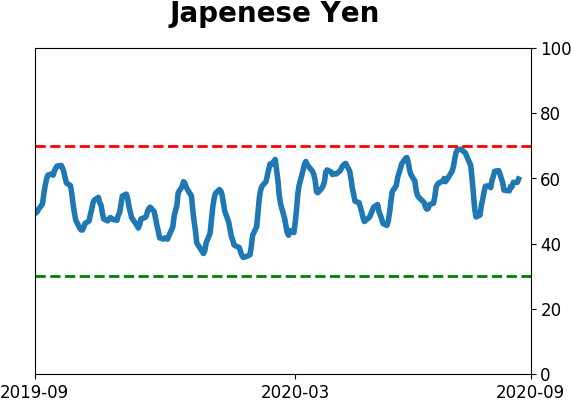
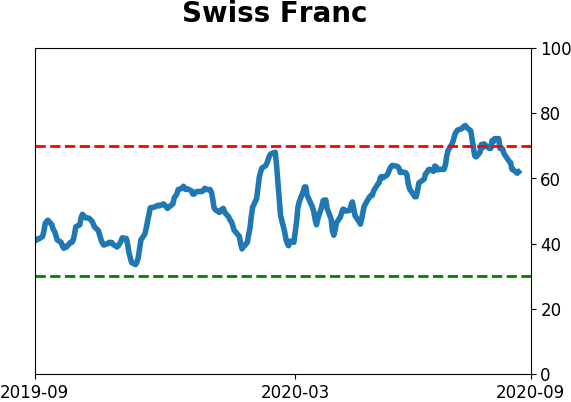
Currency ETF's - 5-Day Moving Average
|
|
|
Commodity ETF's - 5-Day Moving Average
|
|