Headlines
|
|
Days after turning negative, Nasdaq breadth surges:
For weeks, breadth underlying the Nasdaq rally had been weakening, then turned negative. Days after that, stocks on that exchange enjoyed one of the best and more broad rallies in months. This kind of behavior tends to be positive and goes a ways toward offsetting the negatives from August.
Industrial stocks storm back:
Over the past few months, industrial stocks have stormed back relative to the broader market. The ratio of industrial stocks to the S&P 500 recently jumped more than 10% over a 3-month period, one of the most impressive comebacks since 1928. Other big surgest mostly led to lower long-term returns for stocks, however.
Bottom Line:
- Weight of the evidence has been suggesting flat/lower stock prices short- to medium-term, which moderated somewhat with recent weakness; still suggesting higher prices long-term
- Dumb Money Confidence was recently above 80% with evidence of skyrocketing speculation which increased during a down week, typically a bad sign when combined with an unhealthy environment, though that's turning more neutral, and failures were approaching record length
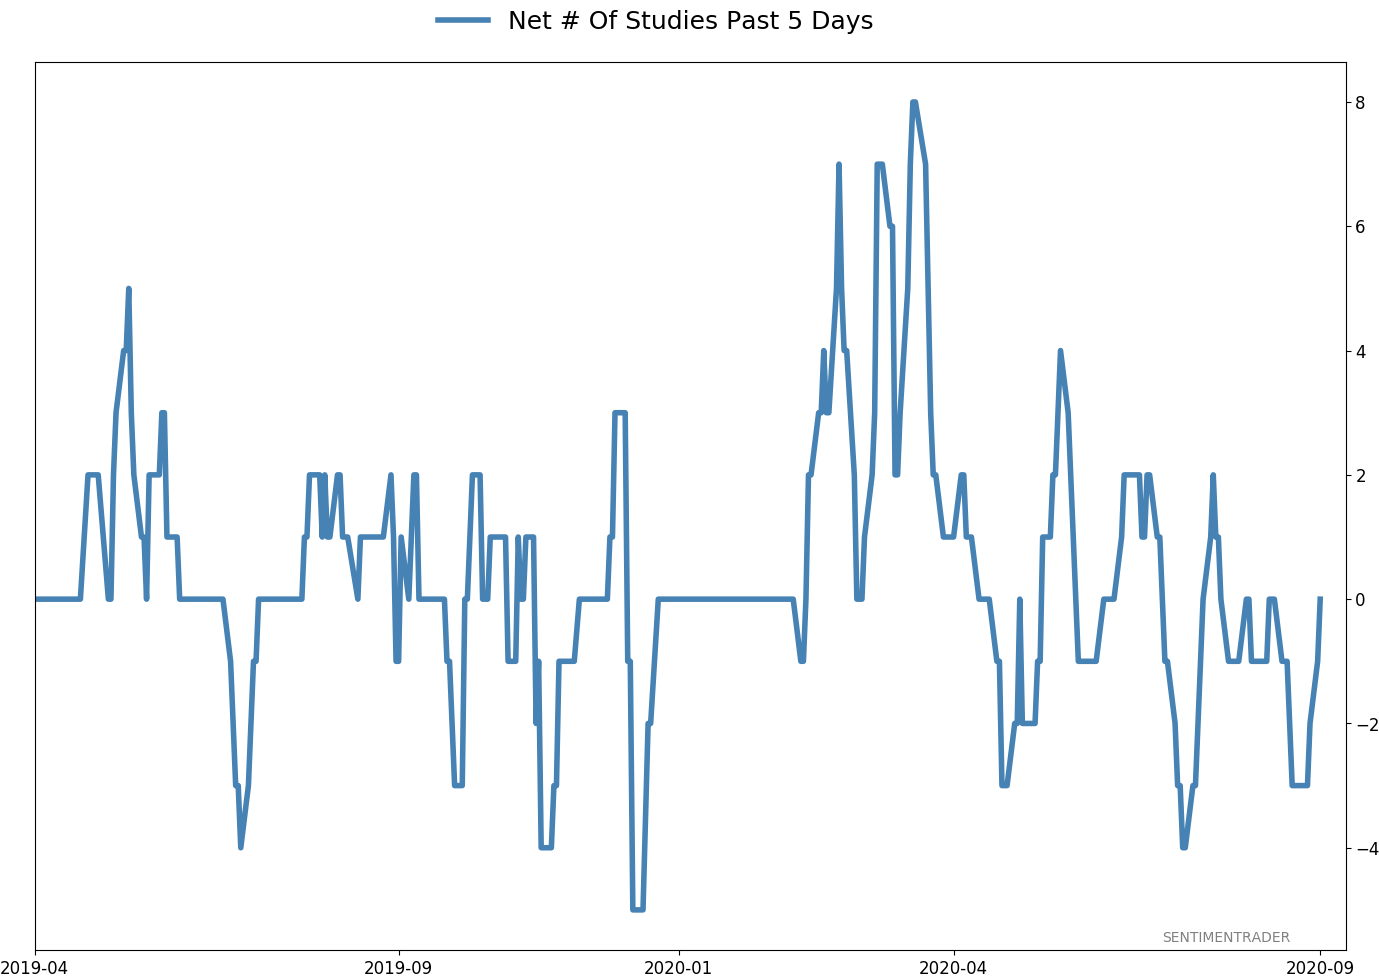
- Active Studies show a heavy positive skew over the longer-term mostly thanks to the March/April/May breadth thrusts, recoveries, and trend changes
- Signs of extremely skewed preference for tech stocks neared exhaustion by late June, especially relative to industrials and financials (here and here)
- Indicators and studies for other markets are showing less consistent forward results
|
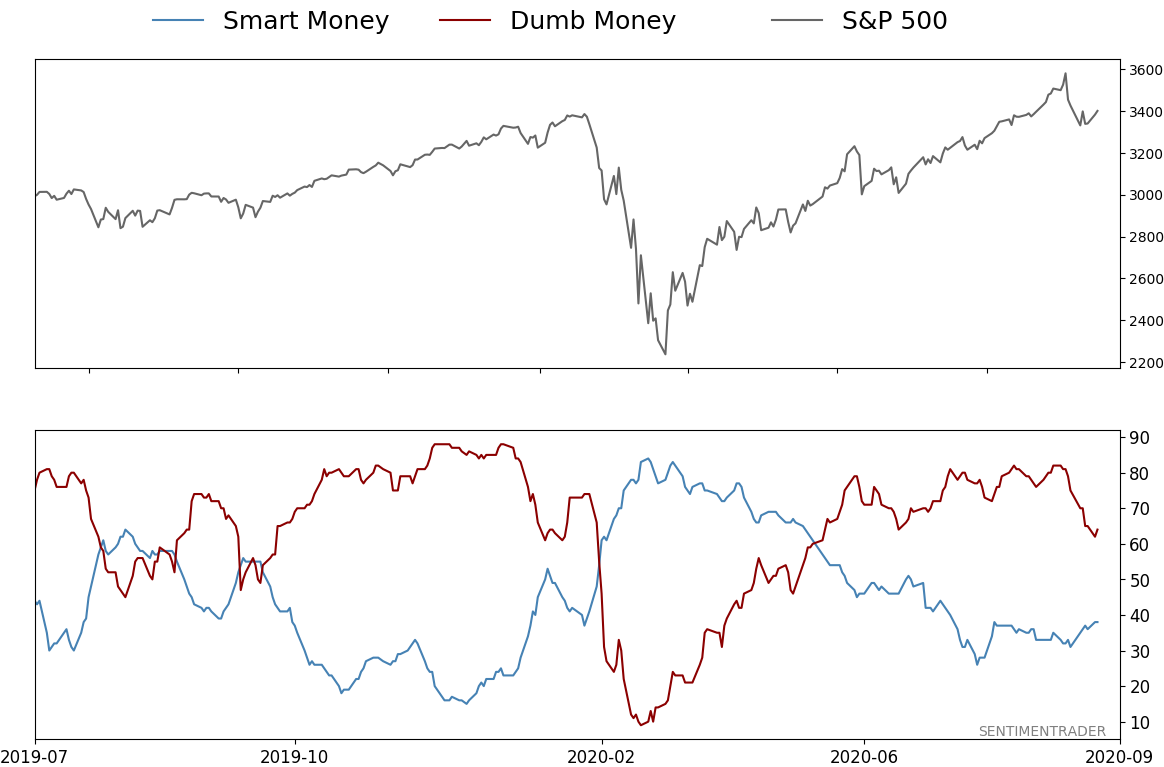
Smart / Dumb Money Confidence
|
Smart Money Confidence: 38%
Dumb Money Confidence: 64%
|
|
Risk Levels
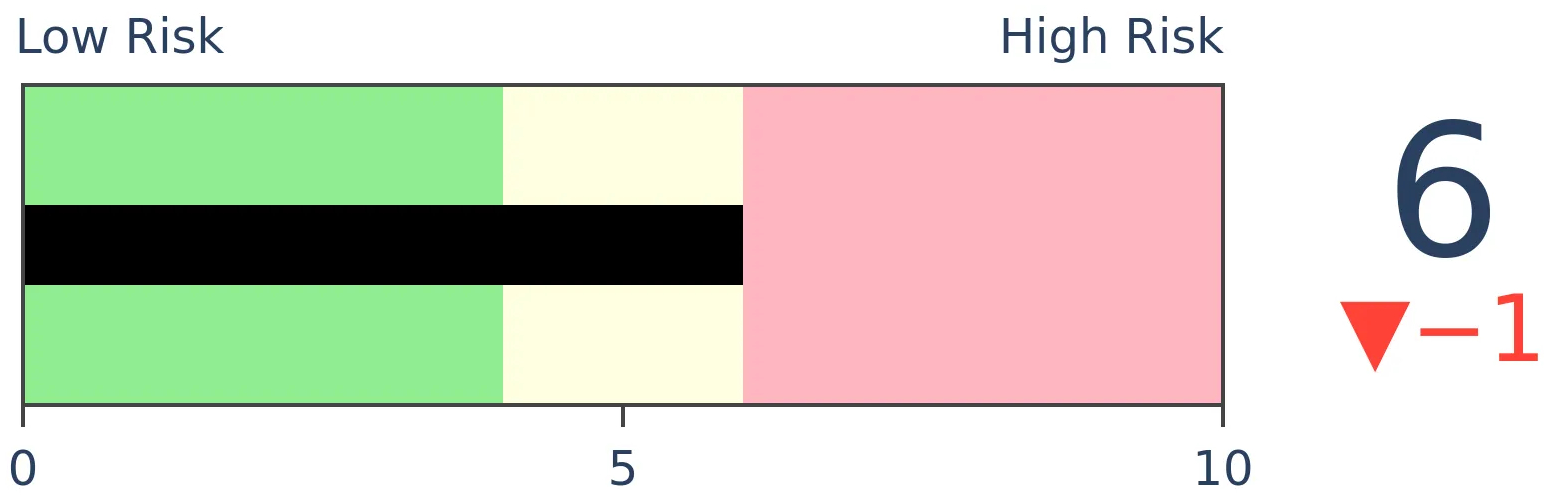
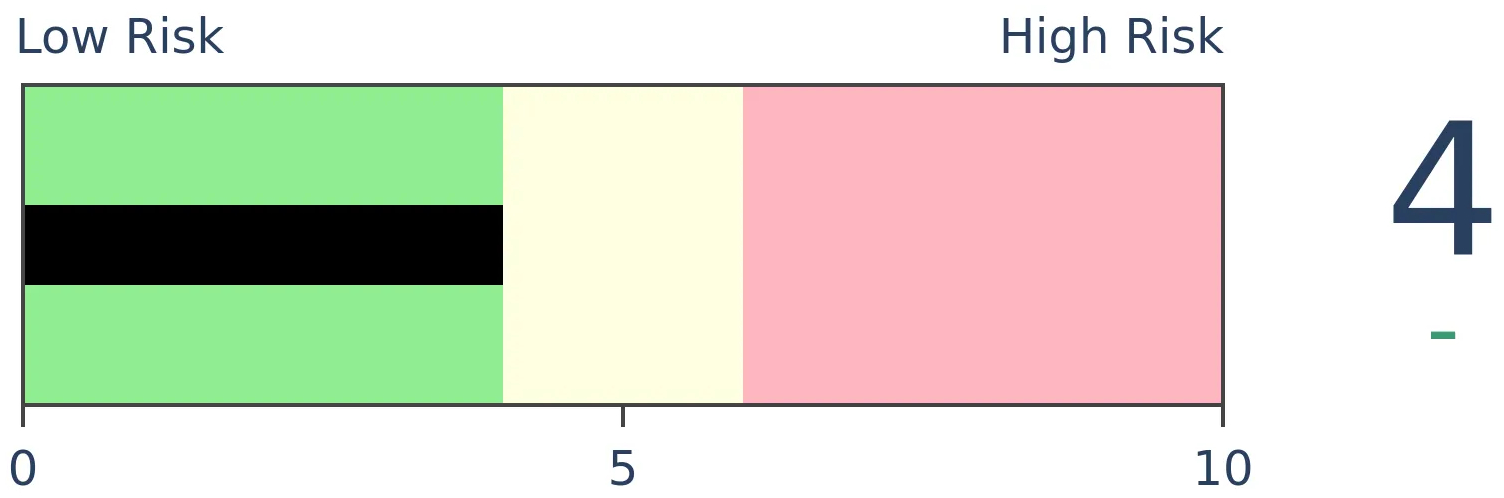
Stocks Short-Term
|
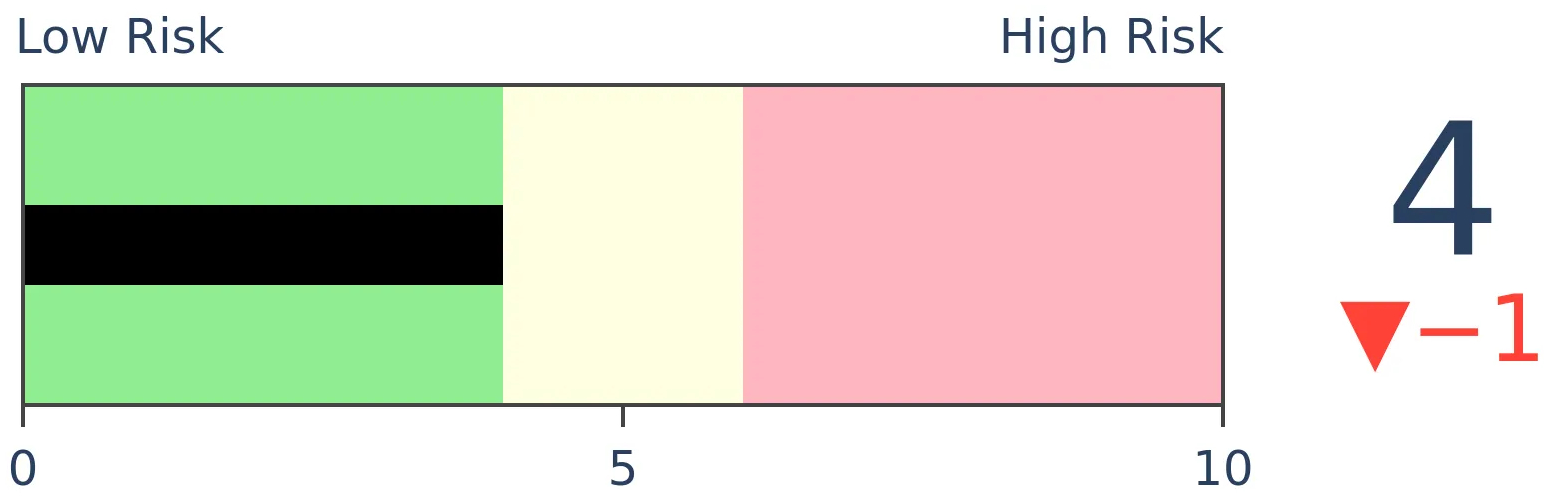
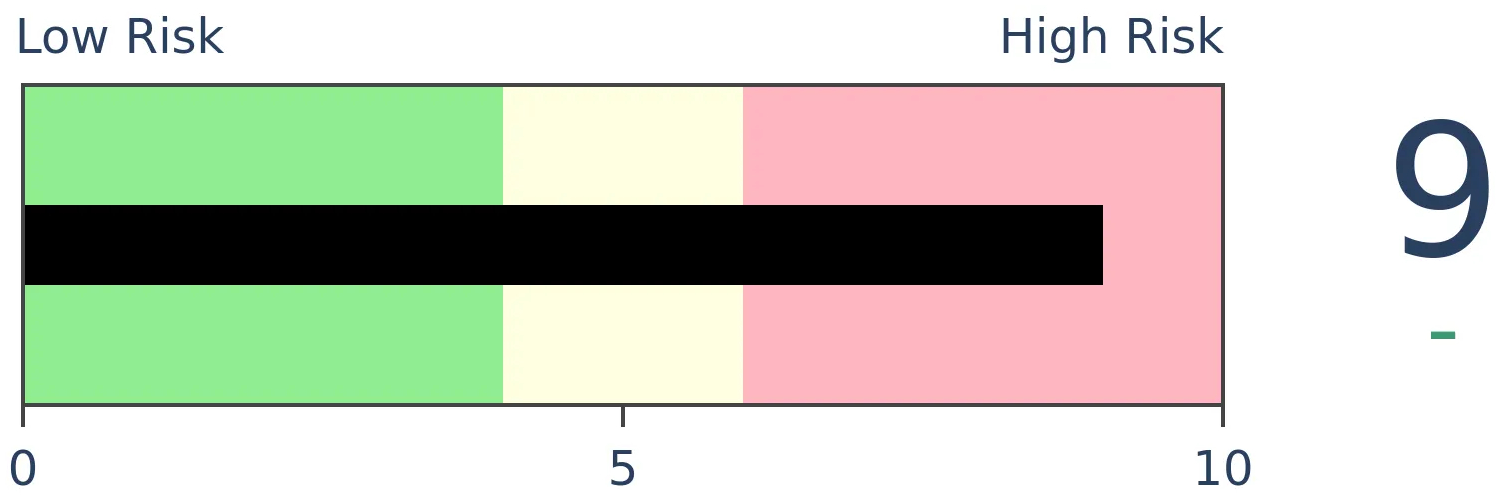
Stocks Medium-Term

|
|
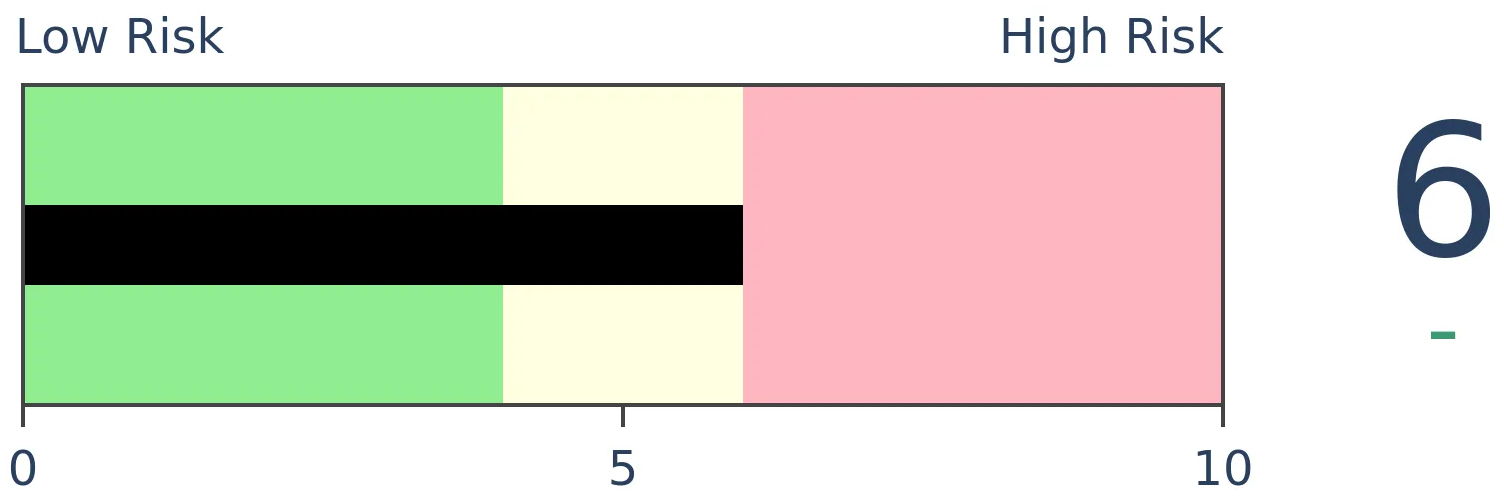
Bonds
|
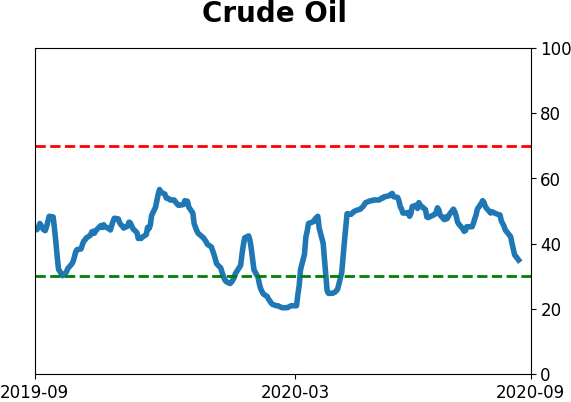
Crude Oil
|
|
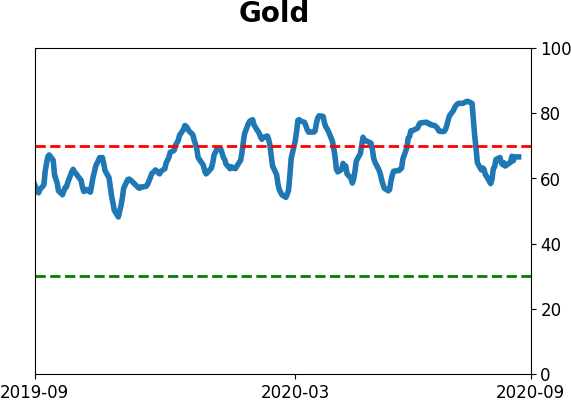
Gold
|
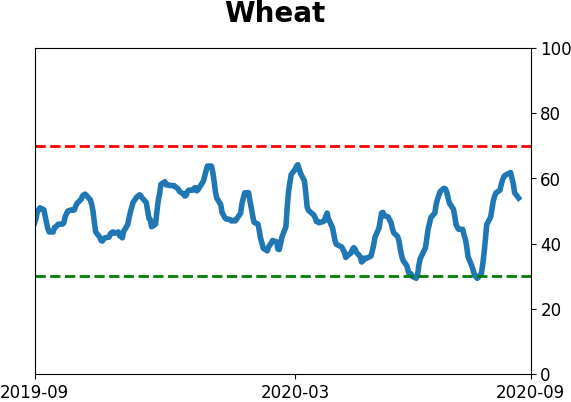
Agriculture
|
|
Research
BOTTOM LINE
For weeks, breadth underlying the Nasdaq rally had been weakening, then turned negative. Days after that, stocks on that exchange enjoyed one of the best and more broad rallies in months. This kind of behavior tends to be positive and goes a ways toward offsetting the negatives from August.
FORECAST / TIMEFRAME
None
|
Leave it to this market to be as perverse as possible.
Just days after it became apparent that underlying momentum in the Nasdaq wasn't just deteriorating but was turning negative, it has one of the most broadly positive days in months.
I'm going to borrow a table from Troy's premium note showing how the Nasdaq has responded after a surge in positive breadth after it had already rallied strongly over the past 5 months.
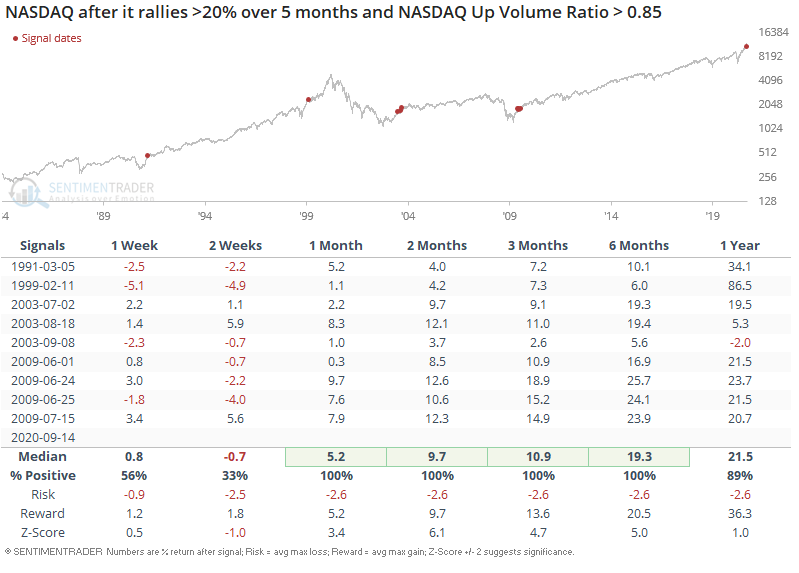
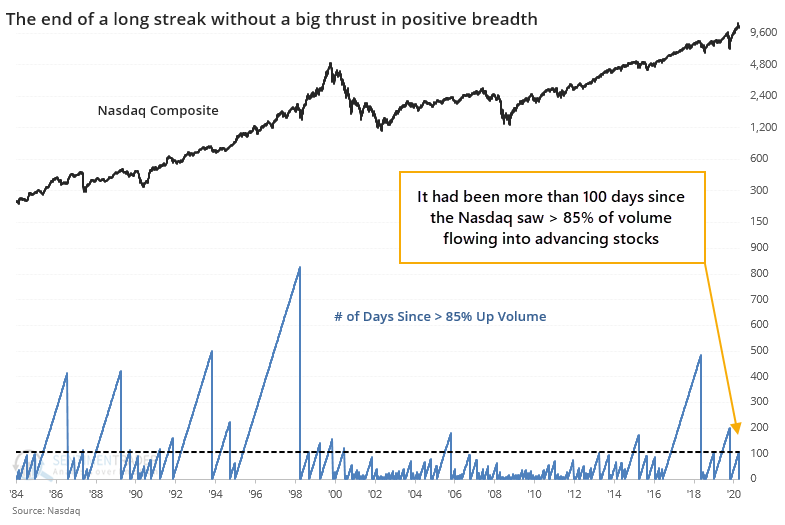
Monday's broad rally was enough to push the 10-day average of the Up Volume Ratio above 50% again, albeit barely. The Nasdaq Composite's annualized returns when this is above 50% are much better than when it's below. Another point in the bulls' favor.
Remarkably, it had been more than 100 days since more than 85% of any day's volume flowed into advancing stocks.
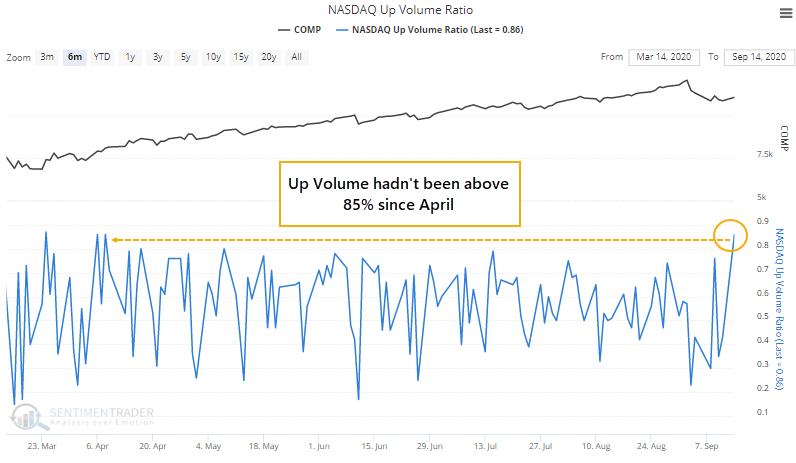
This is one of the longer streaks dating back to 1984.
The table below shows how the Composite performed after its first 85% Up Volume day in several months when the 10-day average of that ratio had been below 50%.
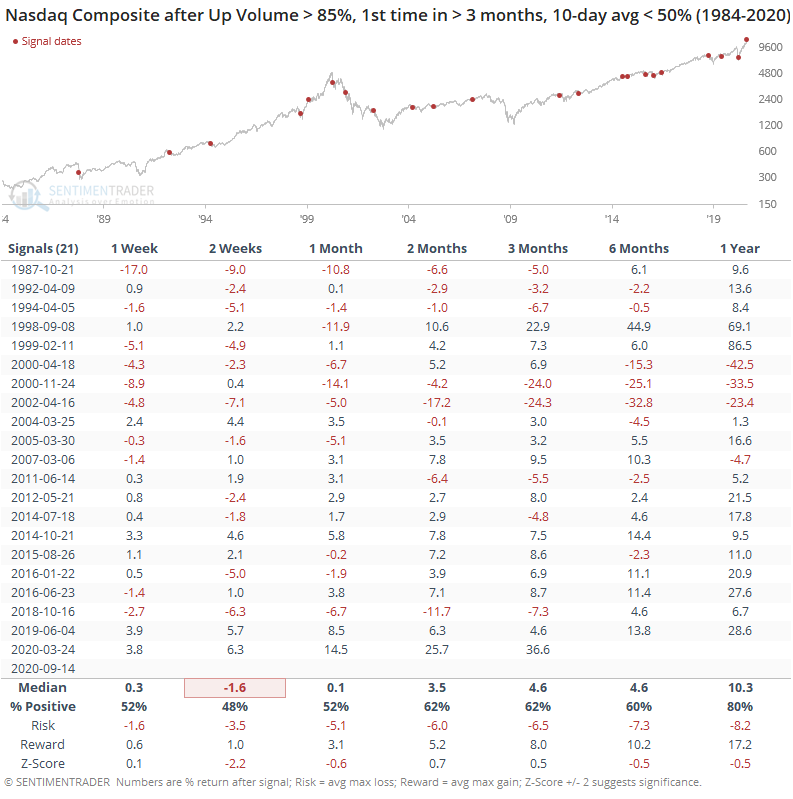
While not as extreme as Troy's study, thanks to a larger sample size, the overall pattern was the same - shorter-term weakness, medium- to long-term strength.
One of the primary reasons that the risk/reward for stocks appeared positive in March-June was the historic number and magnitude of positive breadth thrusts. Perhaps those are still exerting their influences - certainly, they have run over any and all sentiment extremes since then.
The worry over the past couple of months has been that breadth was turning questionable, with a huge number of extremely odd readings, and those have historically not turned out well. Combined with signs of astounding speculation and a neutral-at-best market environment, the risk/reward outlook was poor. If we start to see continued thrusts in some of these breadth figures, it would offset a lot of those oddities from August and make the idea of sustained gains more palatable.
BOTTOM LINE
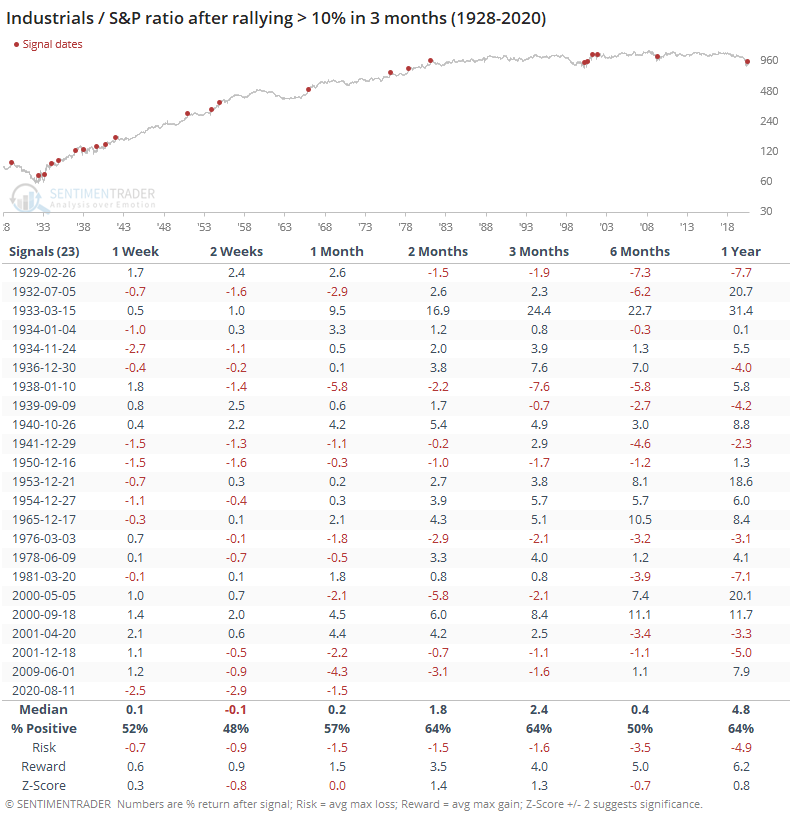
Over the past few months, industrial stocks have stormed back relative to the broader market. The ratio of industrial stocks to the S&P 500 recently jumped more than 10% over a 3-month period, one of the most impressive comebacks since 1928. Other big surgest mostly led to lower long-term returns for stocks, however.
FORECAST / TIMEFRAME
None
|
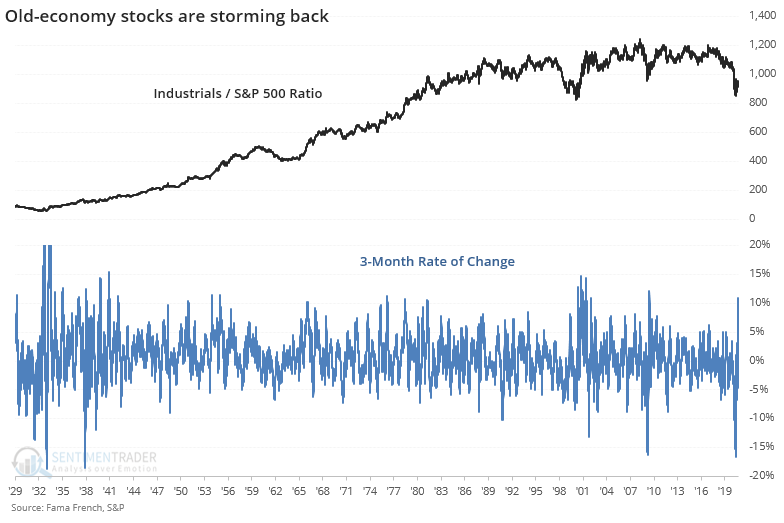
Industrials are surging relative to the rest of the market. This is taken as a good sign for the market as a whole because investors are moving out of the formerly hot sectors and into ones that benefit most on an economic recovery.
We can see below how much the ratio between these stocks and the broader market has swung. A rise of 10% or more, like we've seen in recent months, is historically extreme dating back to 1928.
When these stocks rebounded by this much, relative to the broader market, it has preceded decent shorter-term returns for the broader market and poor long-term ones. The positive 6-month returns came mostly after protracted declines in the 1930s, 1950s, and in 2009.
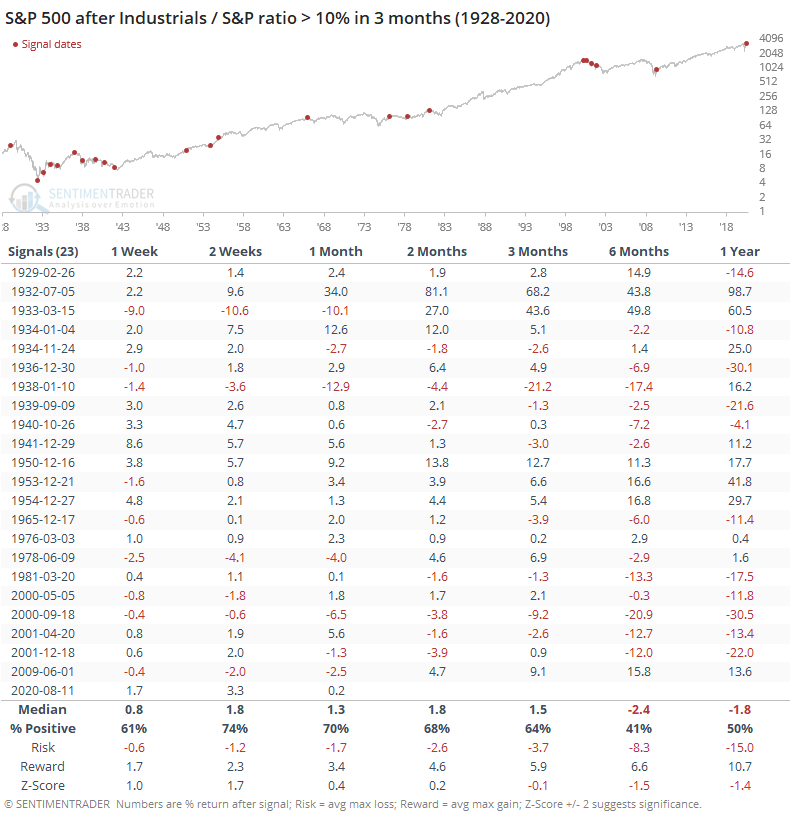
The ratio between them was mediocre. There was a modest tendency for industrials to keep outperforming the broader market but it was slight, and not much beyond random.
The best argument about better longer-term returns is that the last time the ratio cycled from -10% to +10% was in June 2009, though even that didn't preclude the ratio from falling over the next few months.
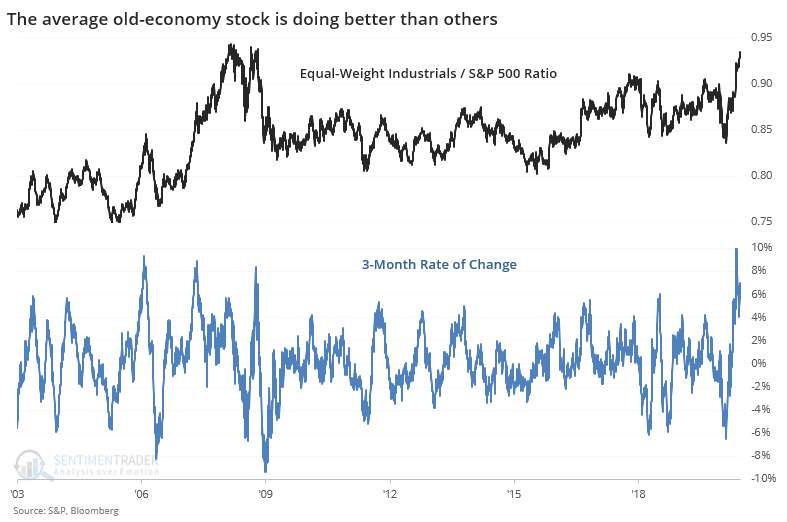
What's being taken as an even better sign is that the average industrial stock has jumped relative to the average stock in other sectors. The equal-weighted industrial index has also surged relative to the equal-weighted S&P 500.
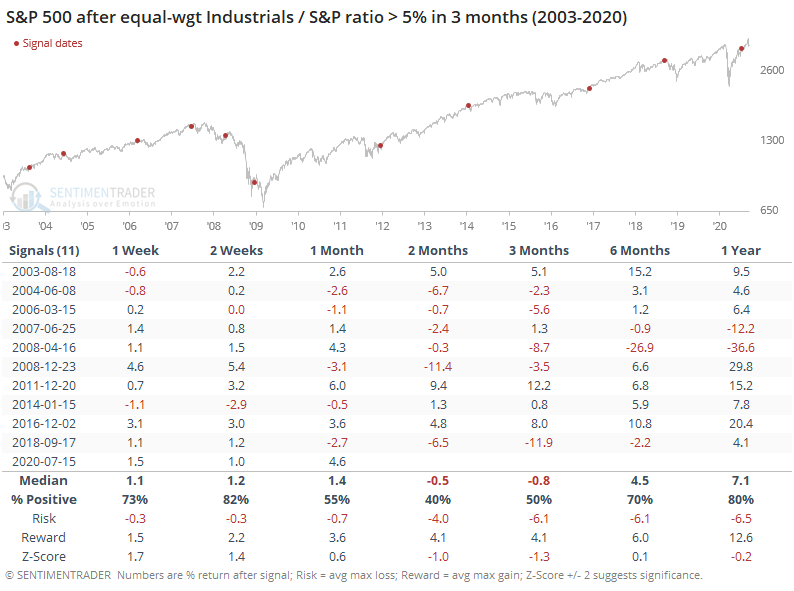
These indexes only go back to 2003, so history is limited and dominated by bull markets. Regardless, the S&P 500's returns over the medium-term were mediocre at best.
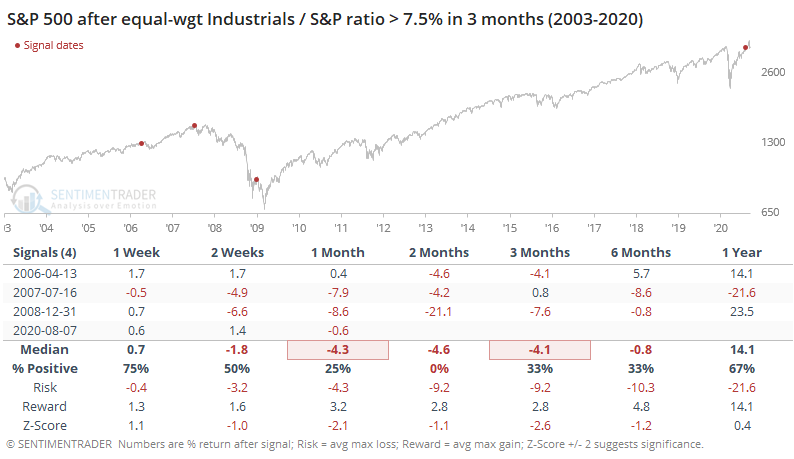
This time, the swing has been even more impressive at +7.5% and returns after the few precedents were even worse.
There are all kinds of smart-sounding reasons why the surge in this ratio should be a good sign for the broader market. Cherry-picked examples from a few charts can "prove" those theories correct. But when we look objectively at a long history, it becomes a lot harder to rely on this as a reason to believe the risk/reward is more positive now than it was months ago. Maybe this will be one of those times when a massive relative surge in industrial stocks proves to be a good sign. It's not the base case.
Active Studies
| Time Frame | Bullish | Bearish | | Short-Term | 0 | 1 | | Medium-Term | 1 | 12 | | Long-Term | 47 | 2 |
|
Indicators at Extremes
Portfolio
| Position | Weight % | Added / Reduced | Date | | Stocks | 15.2 | Reduced 4.2% | 2020-09-03 | | Bonds | 30.0 | Added 30% | 2020-09-09 | | Commodities | 2.4 | Reduced 2.1%
| 2020-09-04 | | Precious Metals | 5.0 | Added 5% | 2020-09-09 | | Special Situations | 4.9 | Added 5.1% | 2020-09-03 | | Cash | 42.5 | | |
|
Updates (Changes made today are underlined)
After stocks bottomed on March 23rd, they enjoyed a historic buying thrust and retraced a larger amount of the decline than "just a bear market rally" tends to. Through June, there were signs of breadth thrusts, recoveries, and trend changes that have an almost unblemished record at preceding higher prices over a 6-12 month time frame. On a shorter-term basis, our indicators have been showing high optimism, with Dumb Money Confidence recently above 80%, along with signs of reckless speculation during what appears to be an unhealthy market environment, historically a bad combination. While there are certainly some outlier indicators that are showing apathy or even outright pessimism, a weight-of-the-evidence approach suggests high risk over a multi-week to multi-month time frame. That has been the case since July, even arguably June and yet the major indexes hit continual new highs through late August. With the indicators and studies failing to precede any weakness, I've been hesitant to lower my already-low exposure. I am getting increasingly anxious about the oddities we're seeing, though, and lowered it again. This account is mostly about comfort with risk for me, and right now I'm not at all comfortable with any of it. In more than 25 years of experience, this is the oddest market I've ever seen. I lowered exposure again - likely the lowest I'm willing to go at this point given longer-term positives - and decided to switch to an equal-weight version of the S&P 500 index. I've become intensely uncomfortable with the concentration in the cap-weighted index. Our studies have been mixed with regard to the potential for the equal-weight version to outperform the cap version going forward, so historical support isn't overwhelming. I'm also increasingly interested again in energy stocks, starting with a small allocation. I got burned in March with the unprecedented geopolitical spat that hammered those stocks then but the longer-term setup is decent. In this account, I’ve roughly followed what has become known as the All Weather portfolio popularized by Ray Dalio. It allocates across four broad assets, designed to hold up no matter the market environment. The goal is modest positive returns while limiting large, sustained losses. I typically use popular ETFs, with low costs. At times, I will swap out for a fund I believe has better prospects, or simply lower fees if not. At other times, I will diverge quite a bit from baseline allocations, largely depending on the indicators and studies we discuss on the site. I've gotten away from this in the past, using "cash" as a substitute for "bonds" and with rates stuck at 0%, that has become less appetizing. I'm trying to get back more toward the baselines with less dramatic swings in either direction. The base allocation I use is the following: Stocks: 35%
Bonds: 45%
Precious Metals: 7.5%
Commodities: 7.5%
Cash / Special Opportunities: 5%
RETURN YTD: -0.4% 2019: 12.6%, 2018: 0.6%, 2017: 3.8%, 2016: 17.1%, 2015: 9.2%, 2014: 14.5%, 2013: 2.2%, 2012: 10.8%, 2011: 16.5%, 2010: 15.3%, 2009: 23.9%, 2008: 16.2%, 2007: 7.8%
|
|
Phase Table
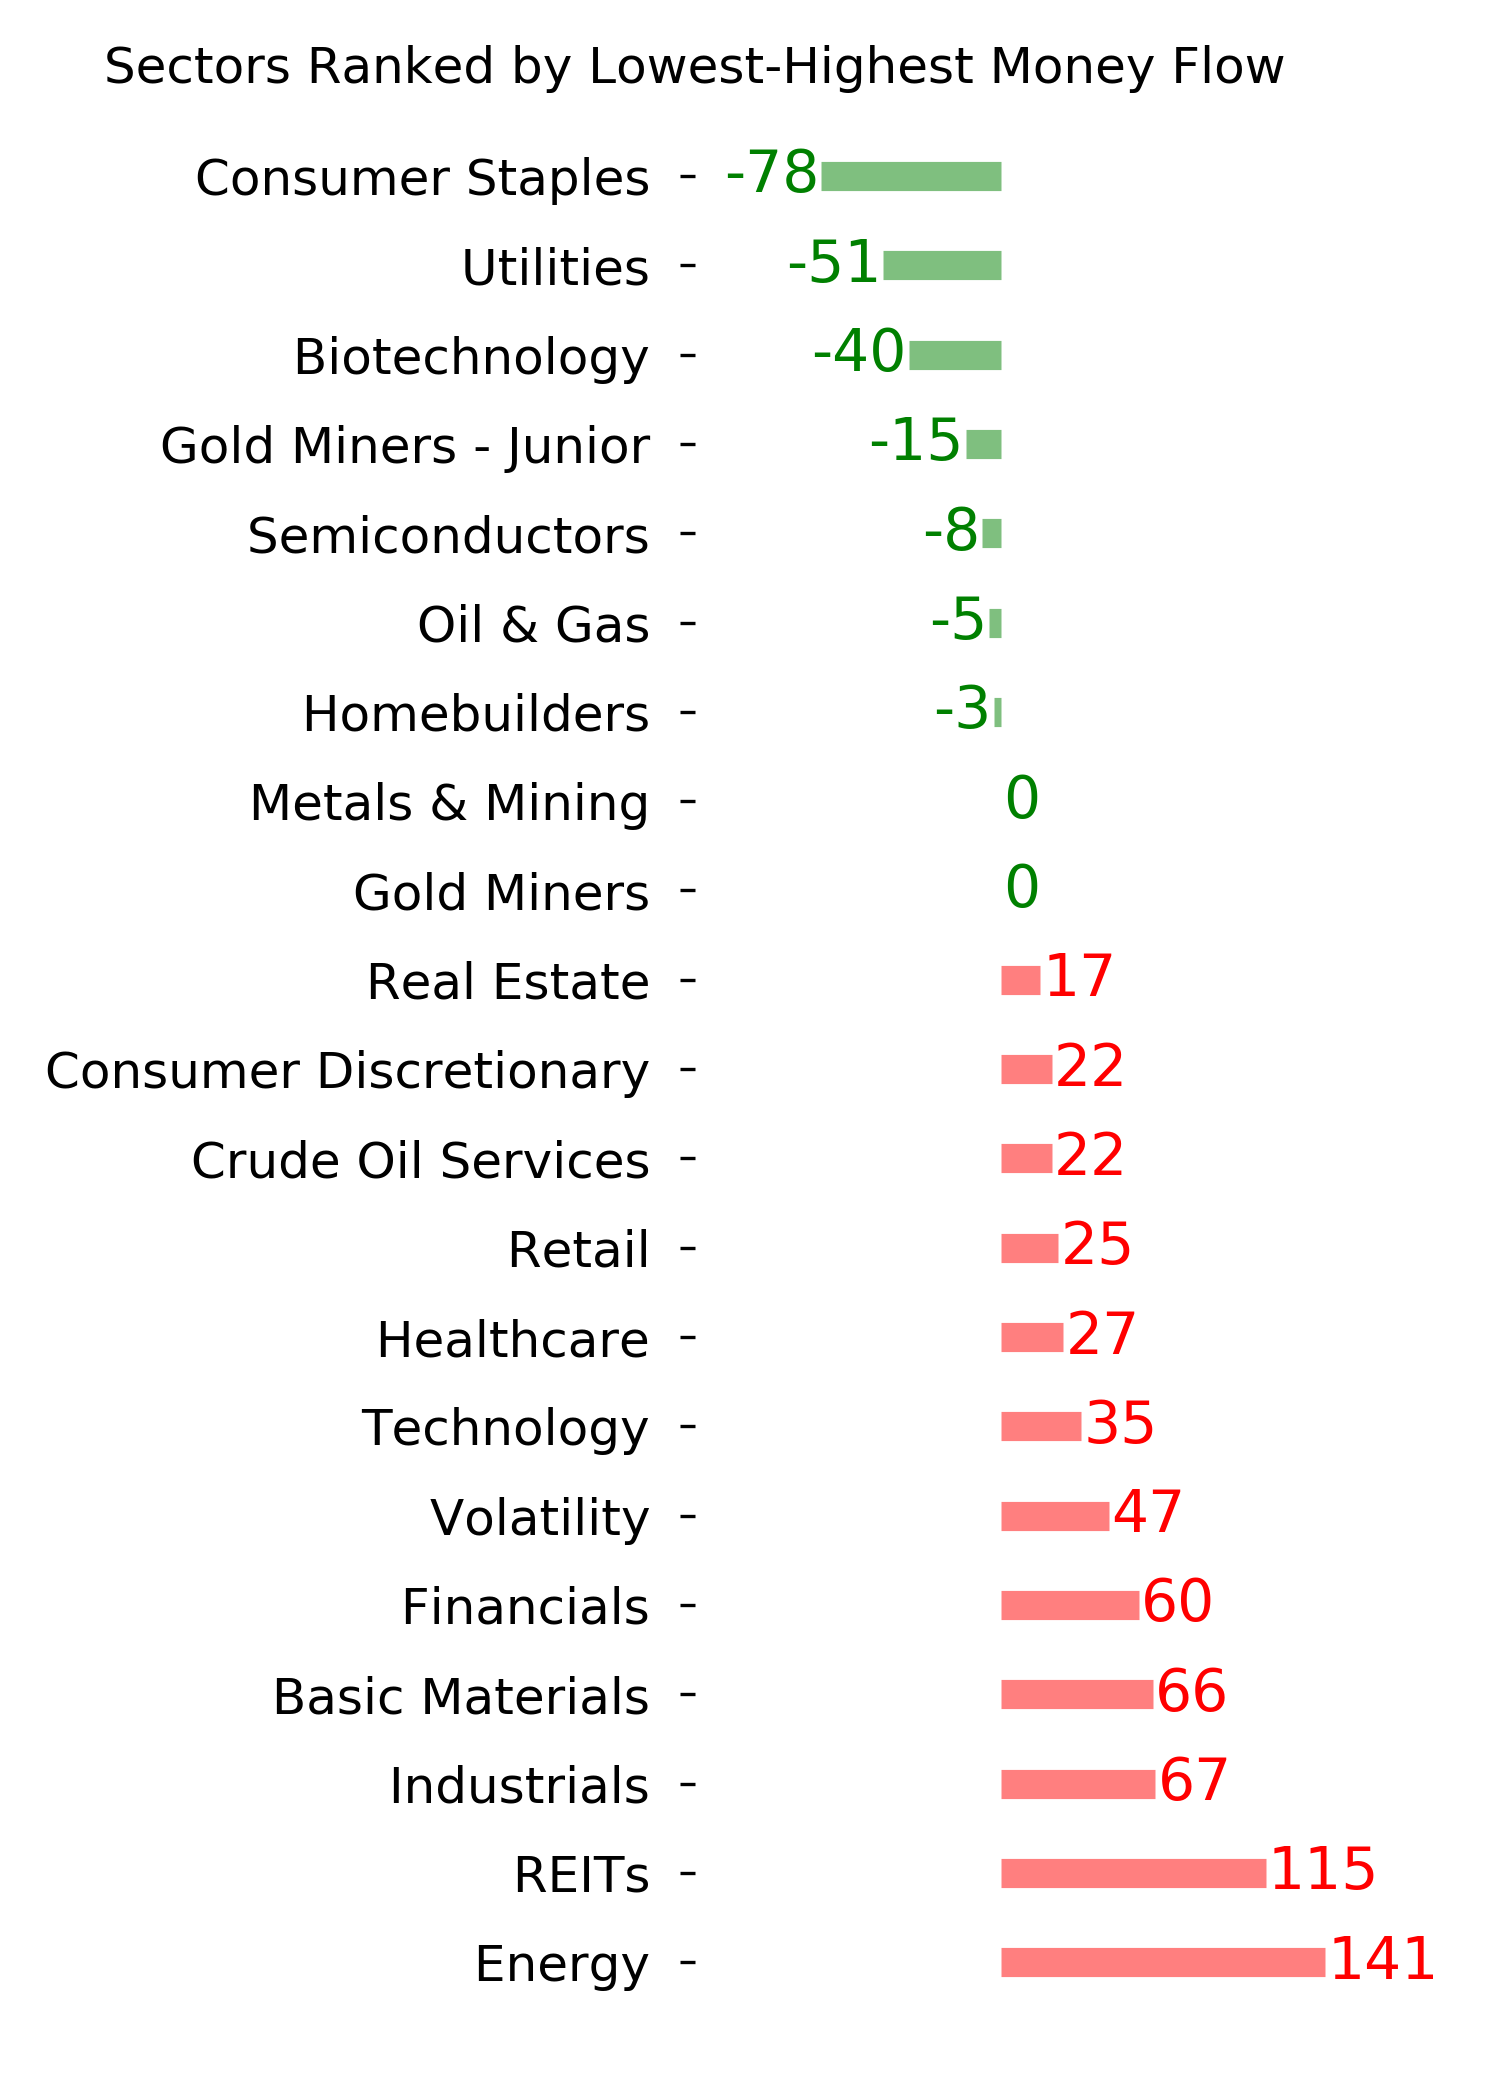
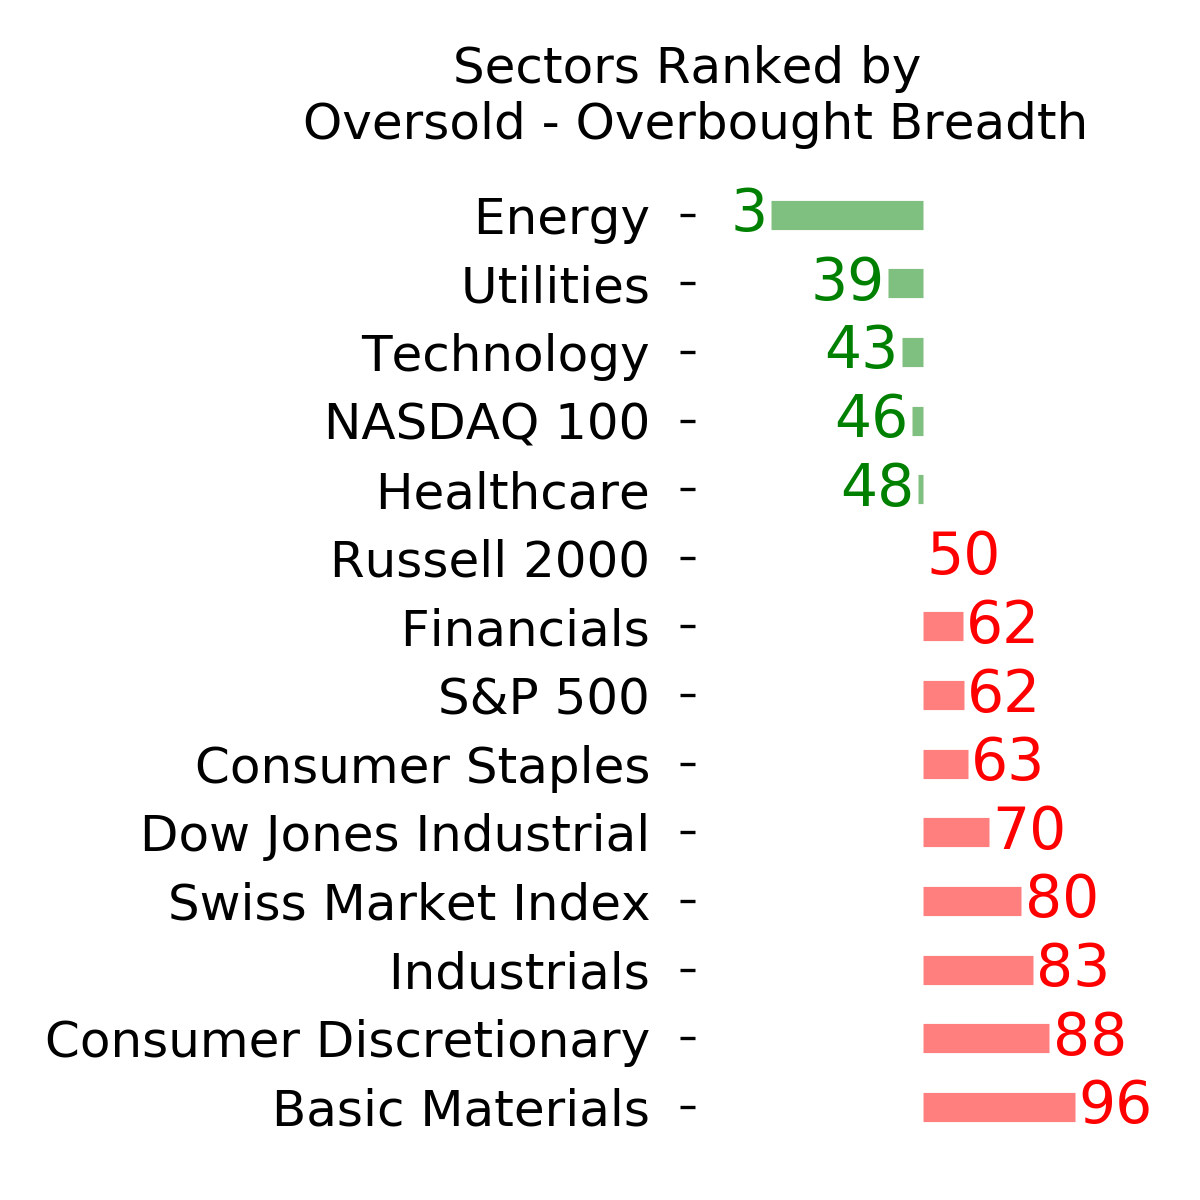
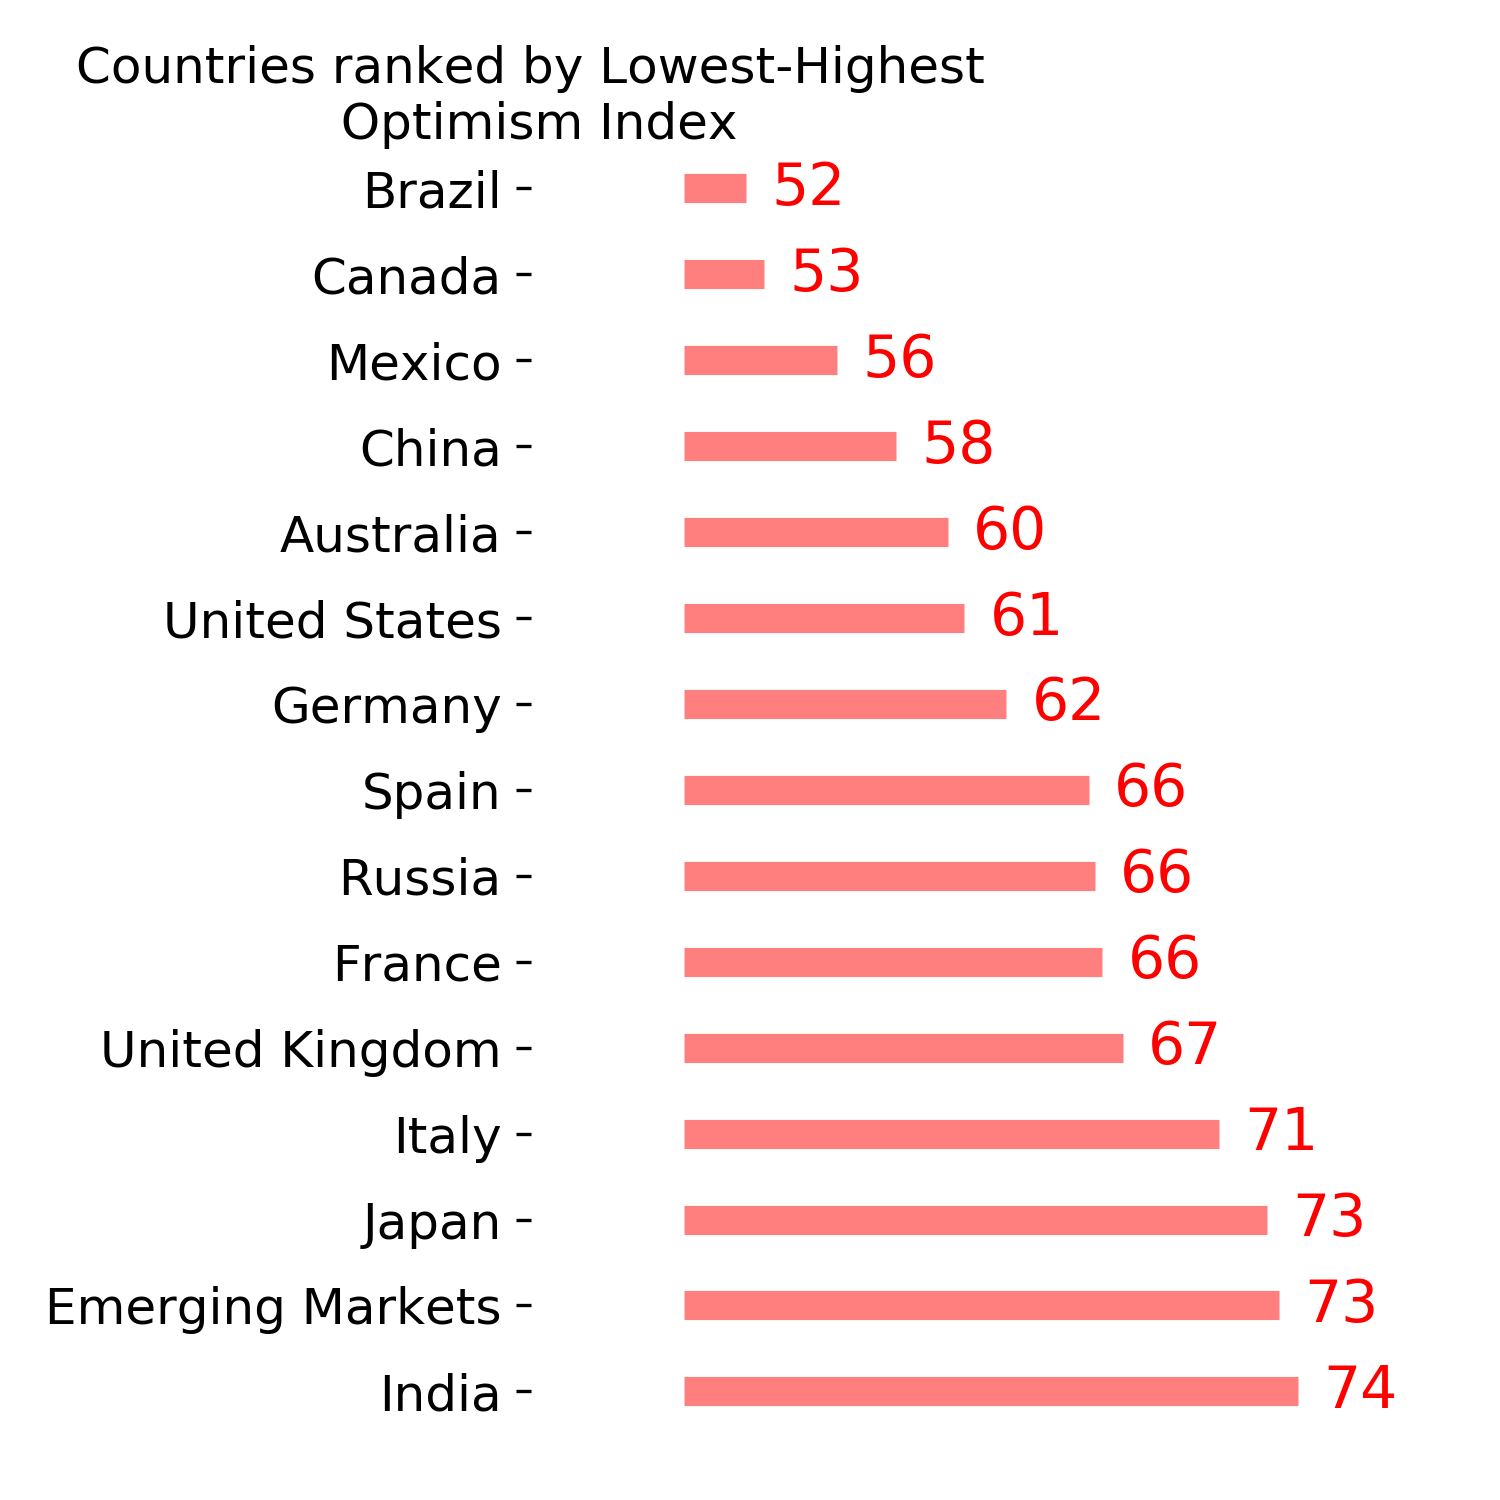
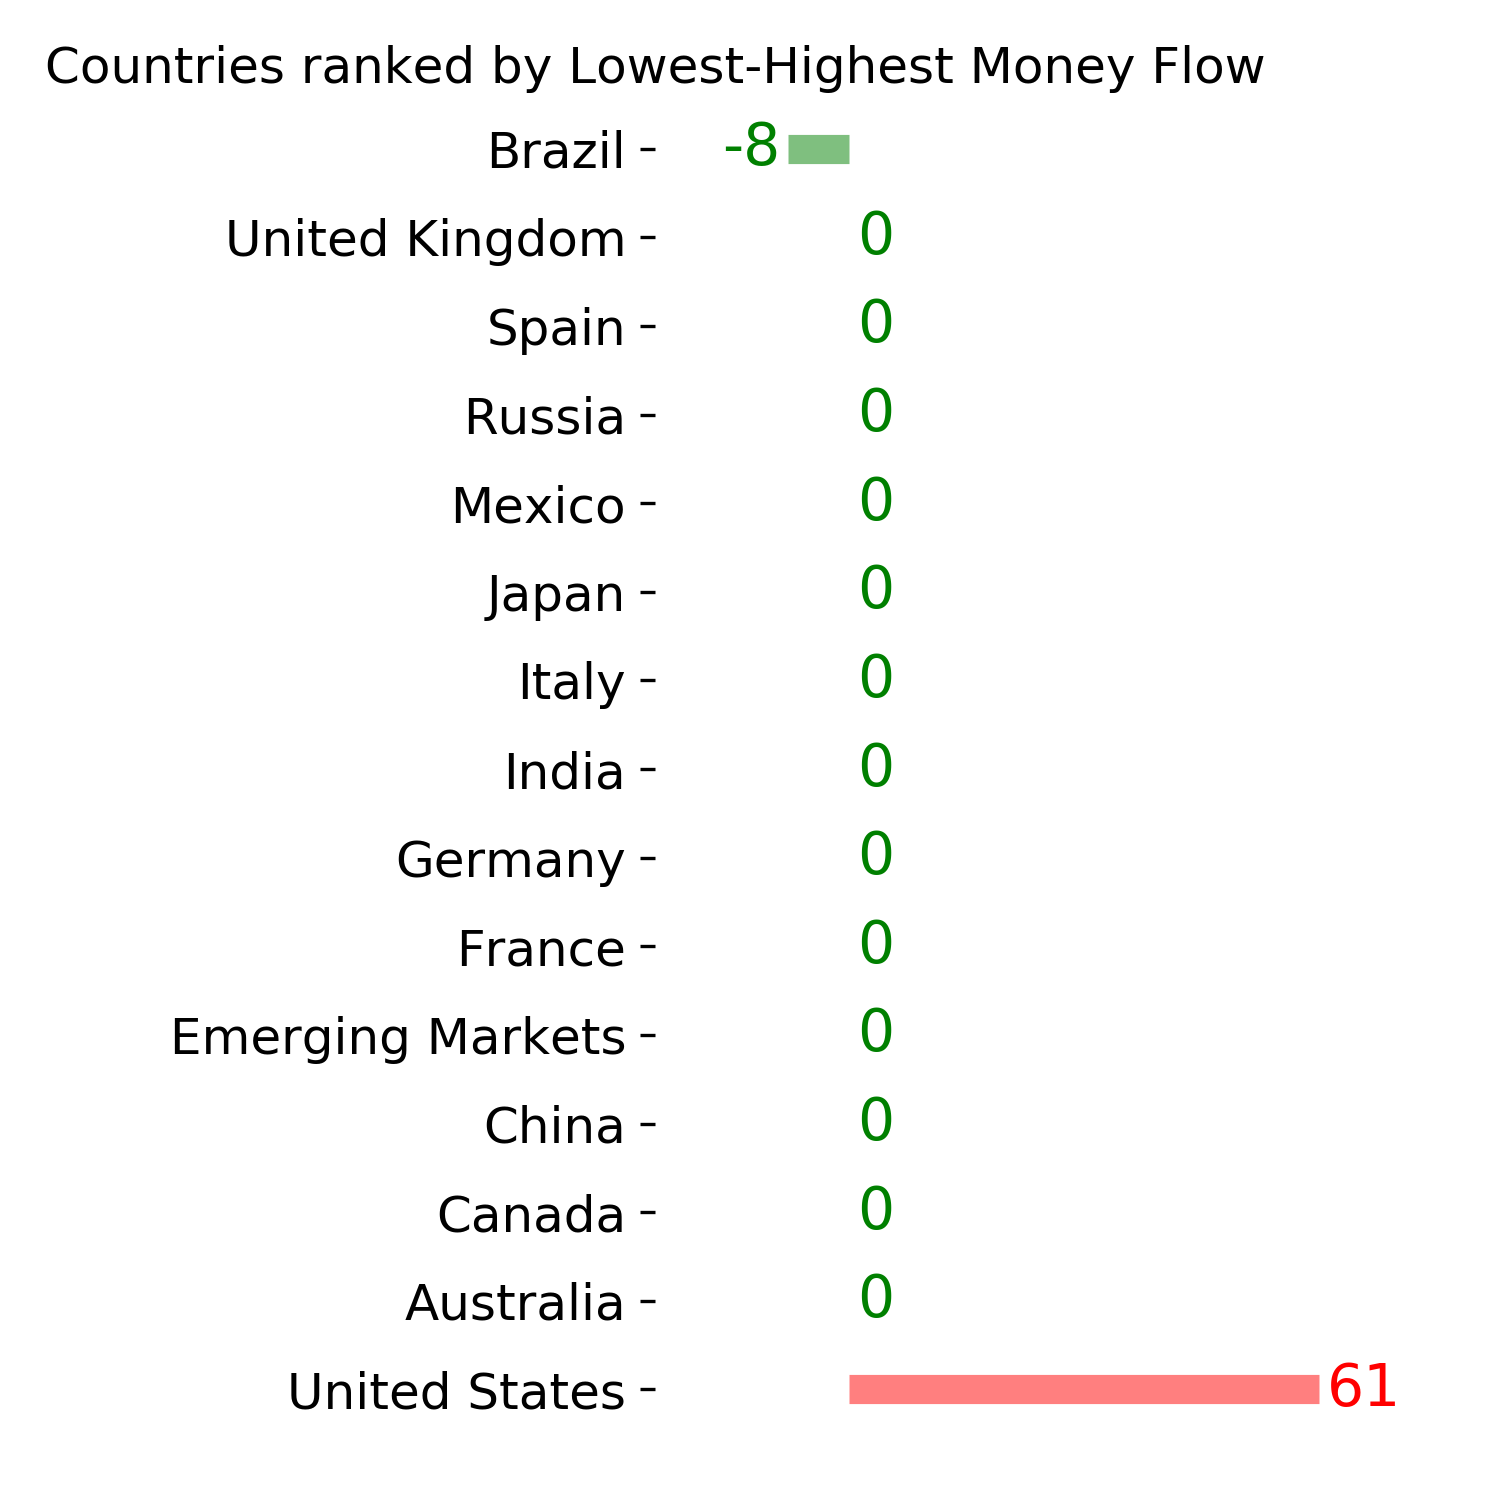
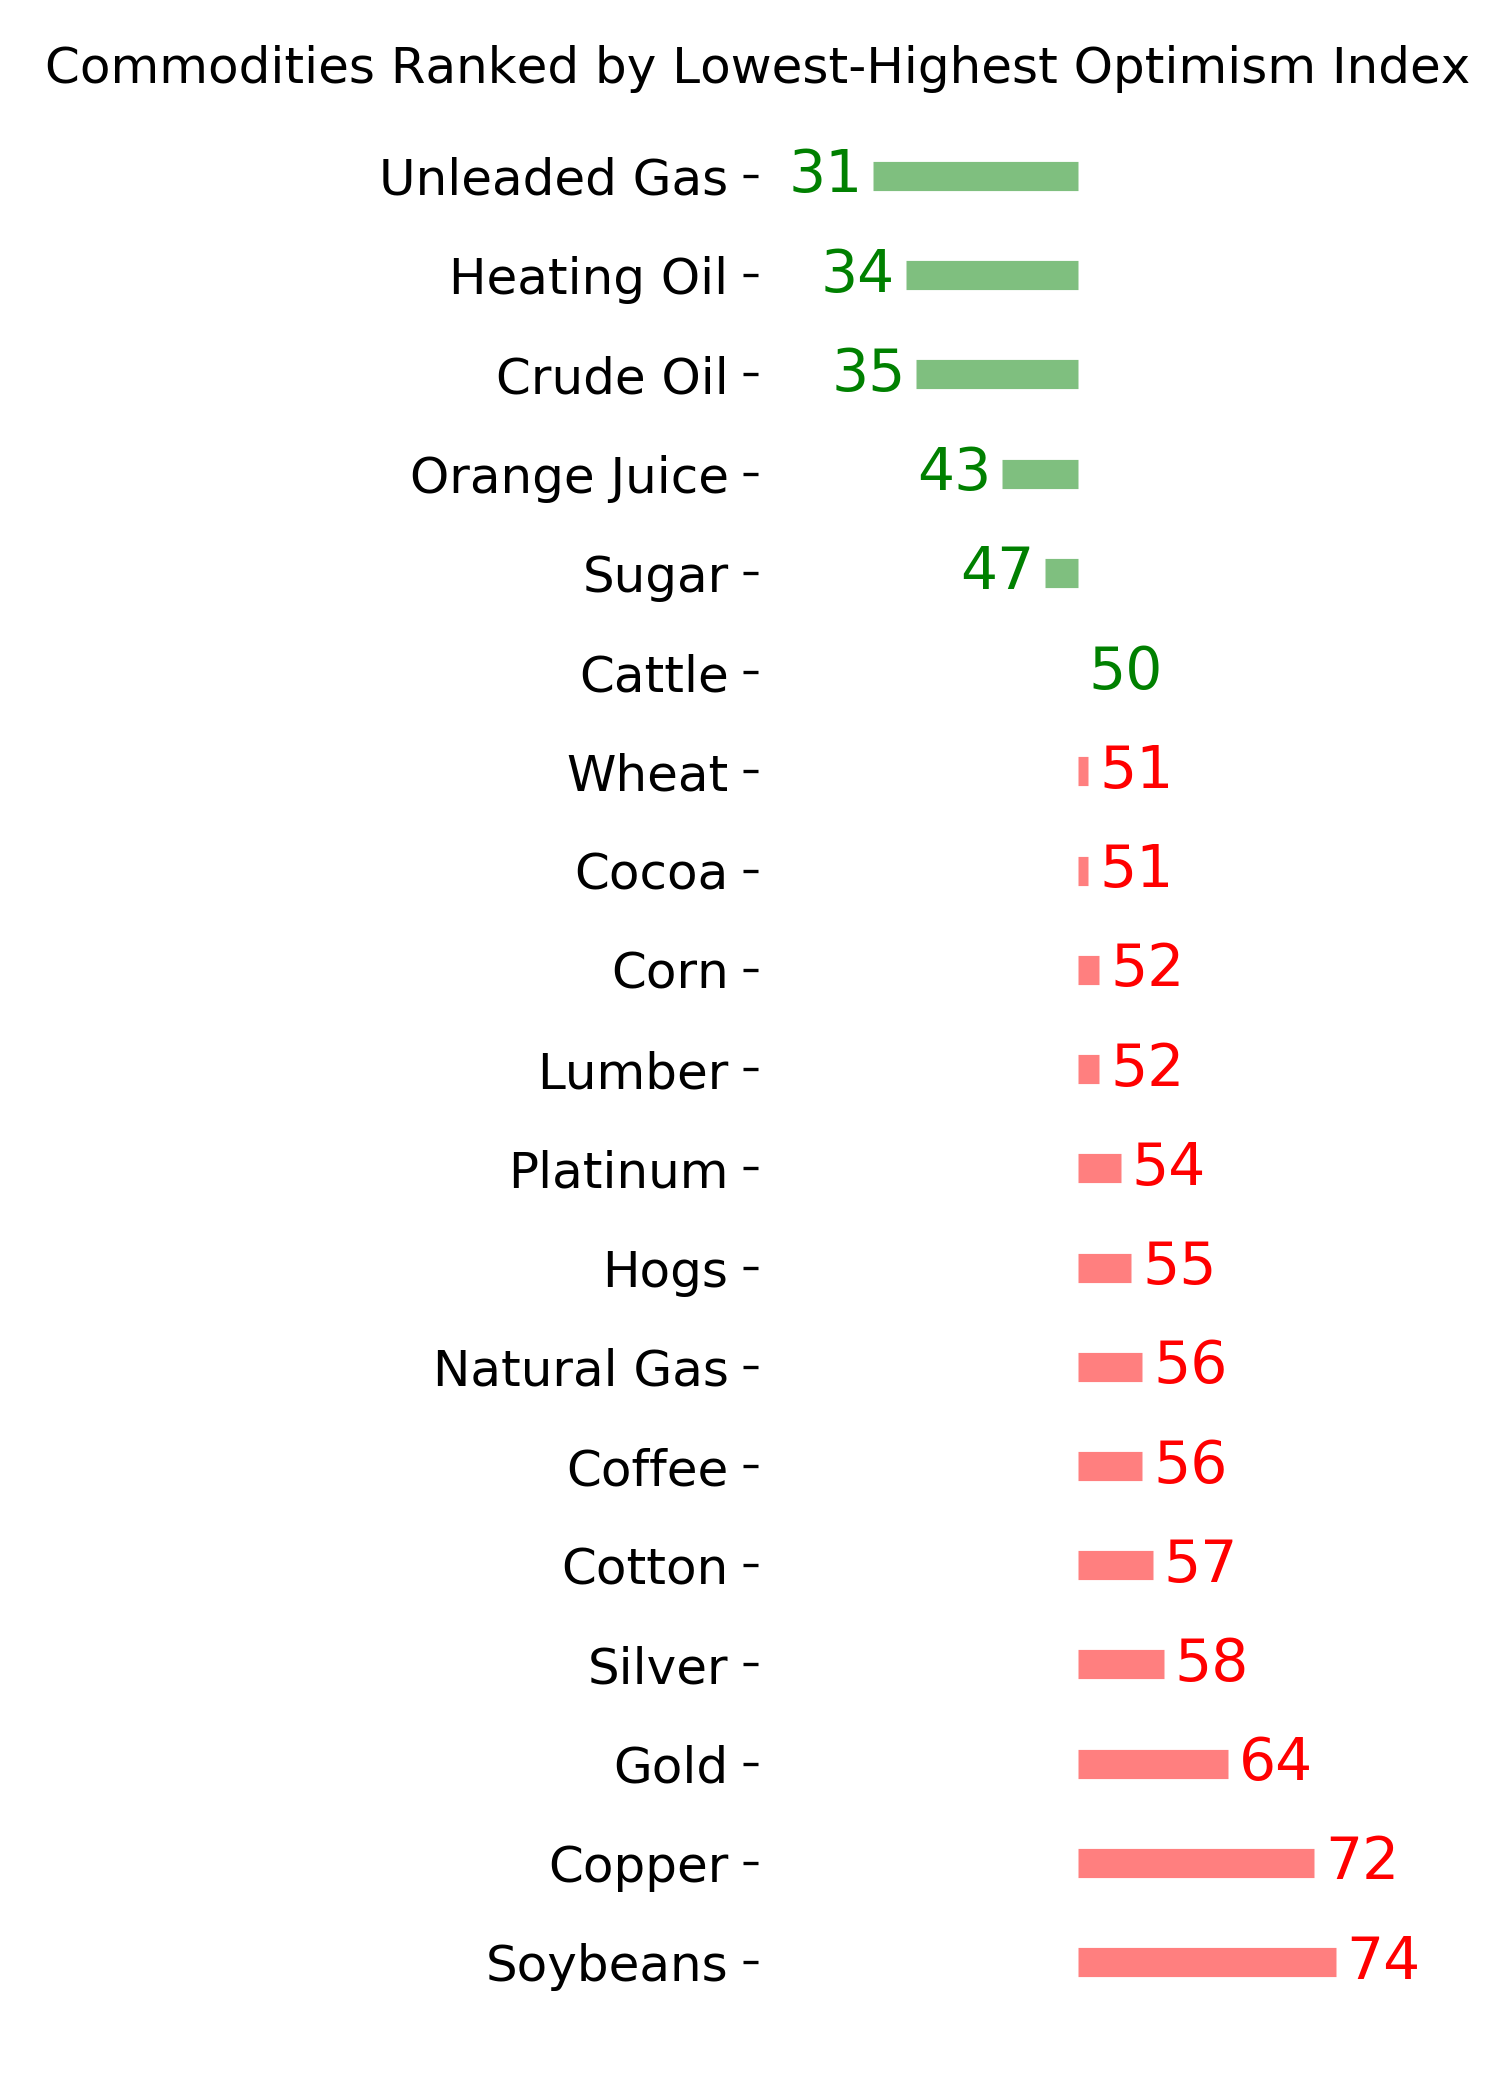
Ranks
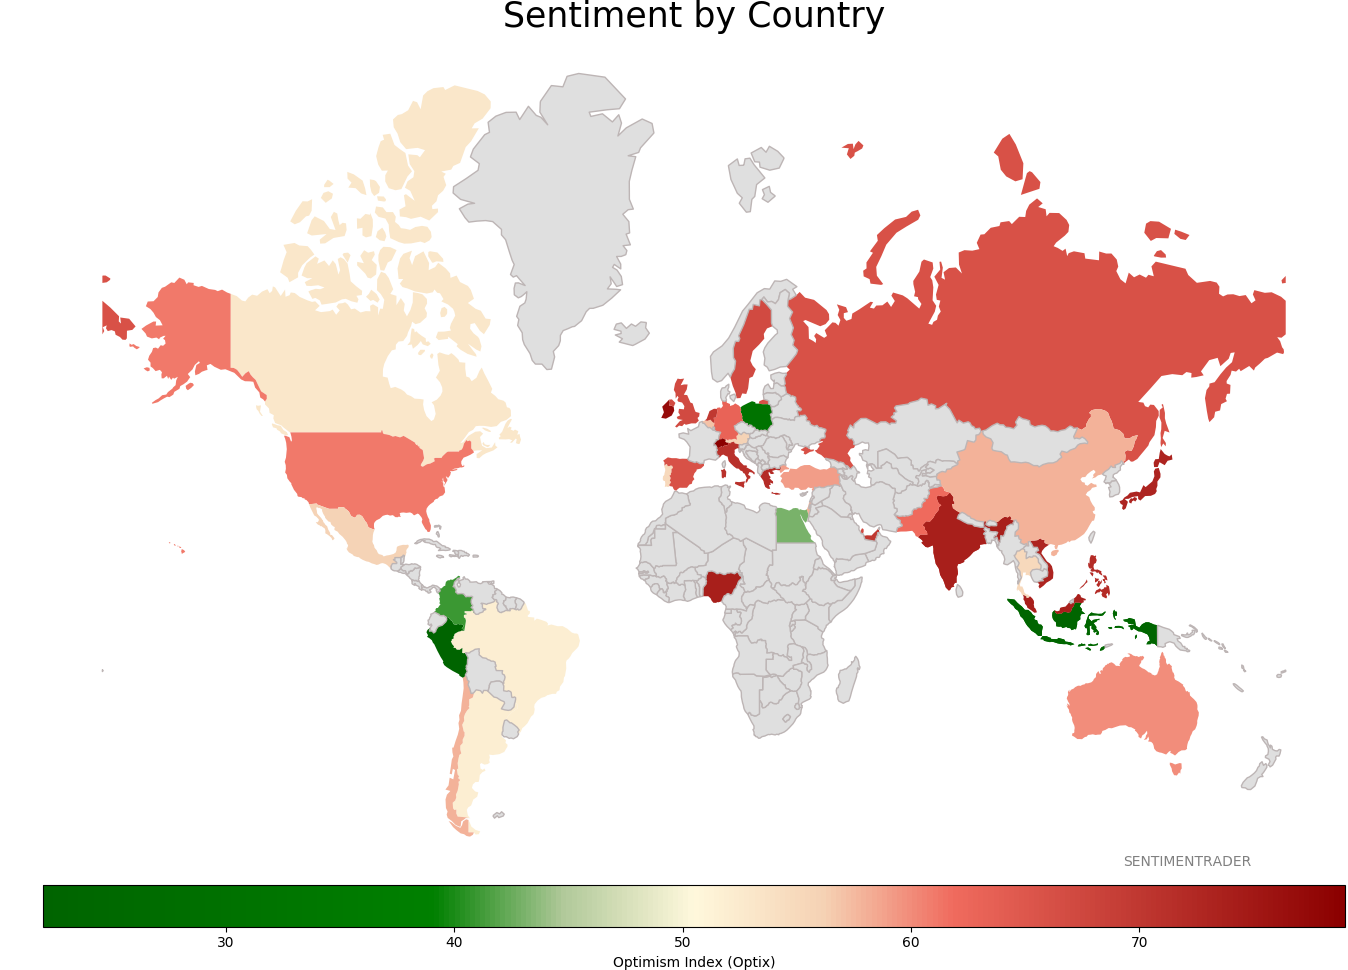
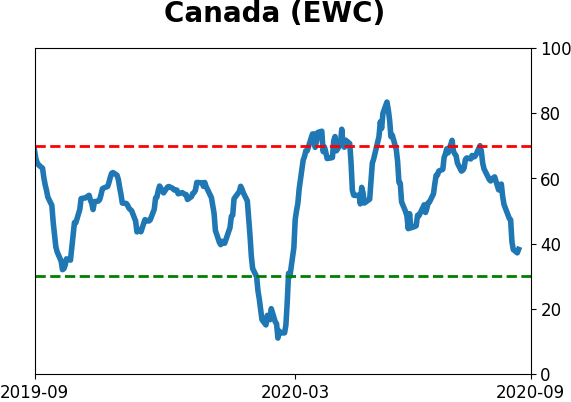
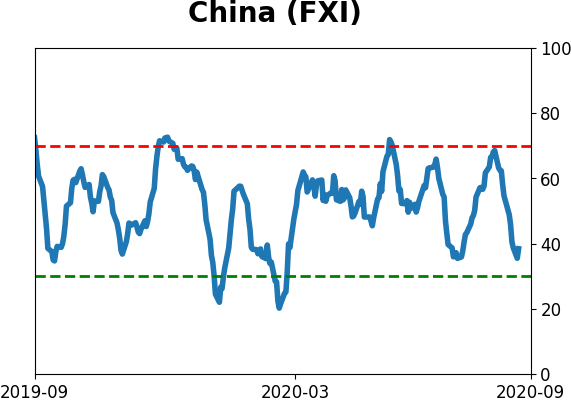
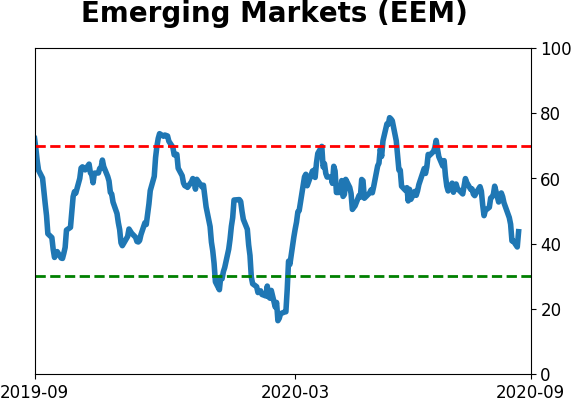
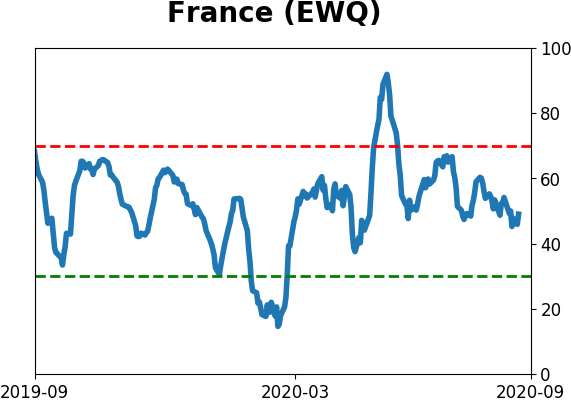
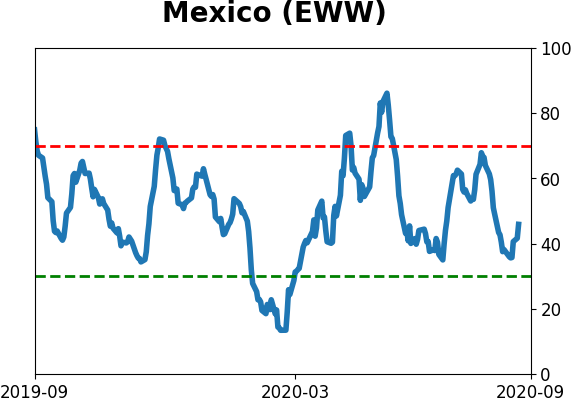
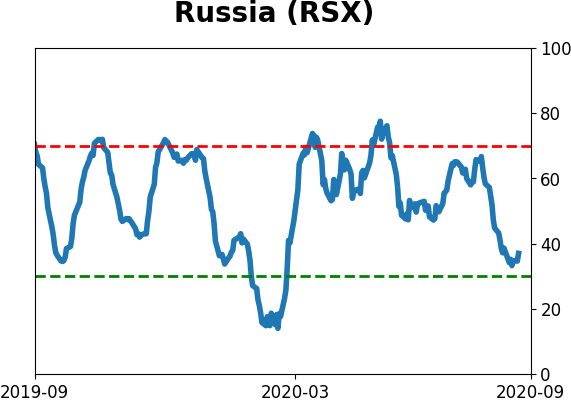
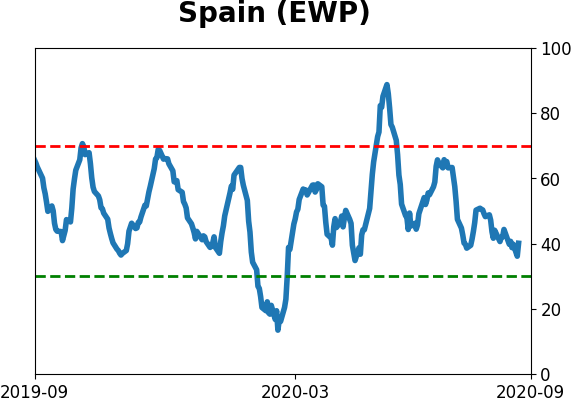
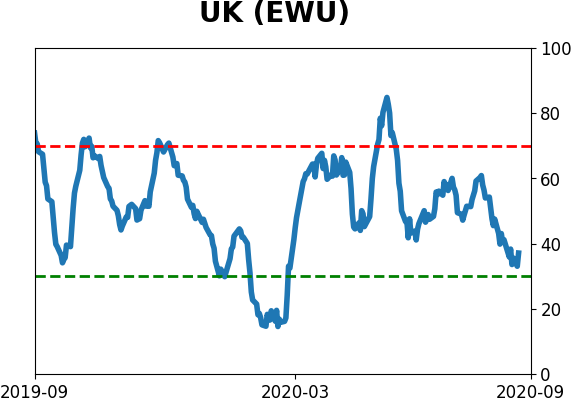
Sentiment Around The World
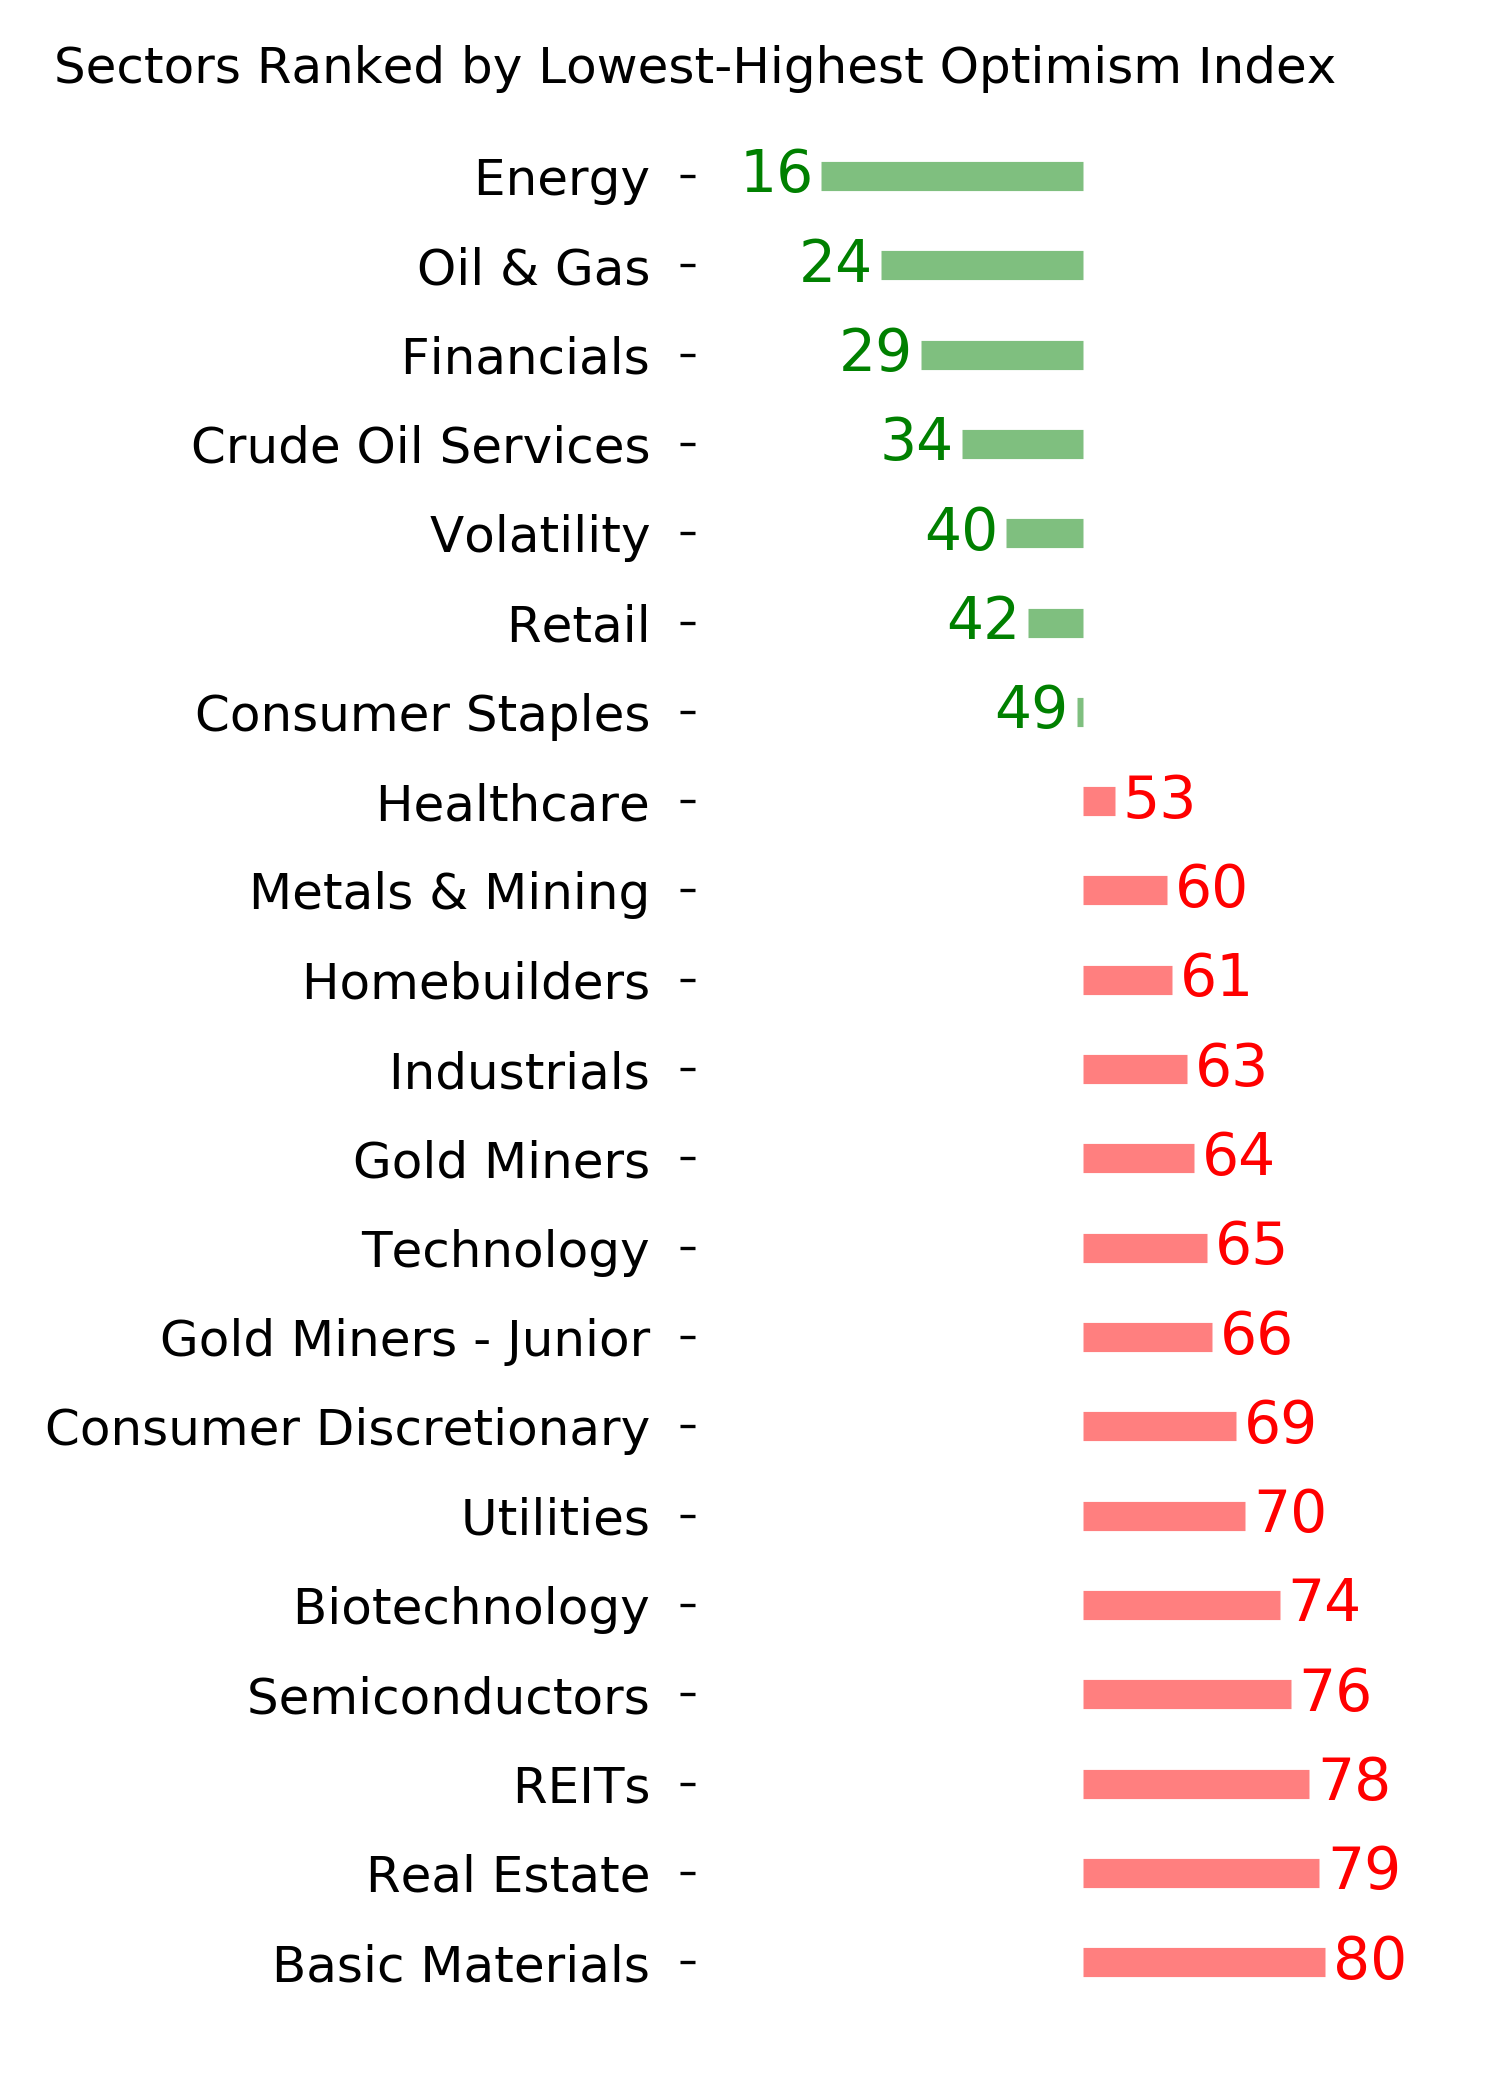
Optimism Index Thumbnails
|
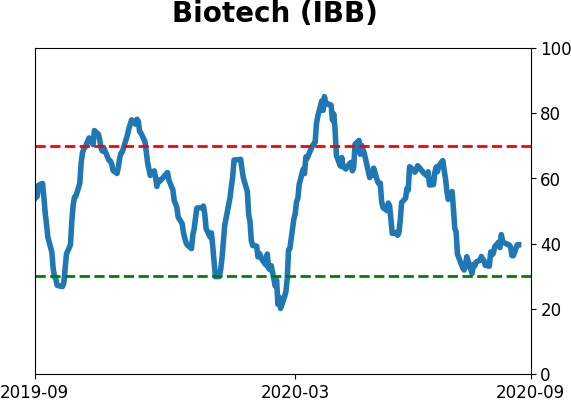
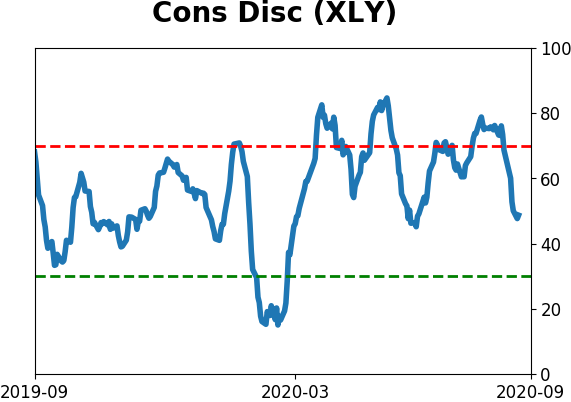
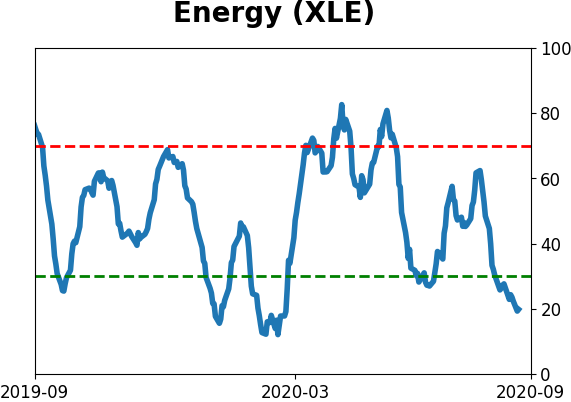
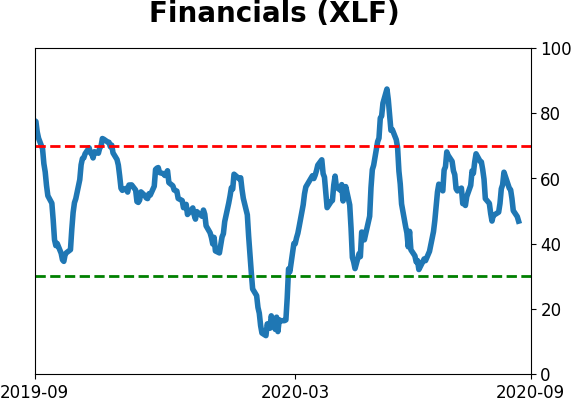
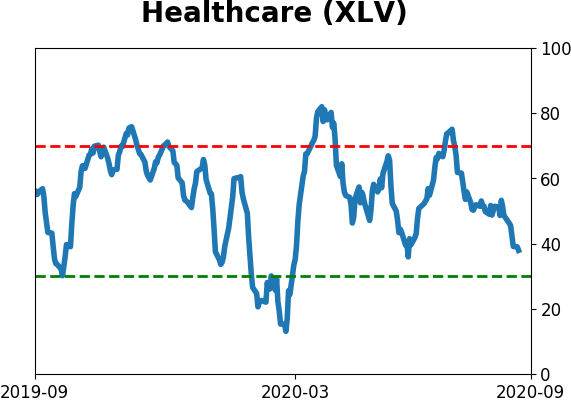
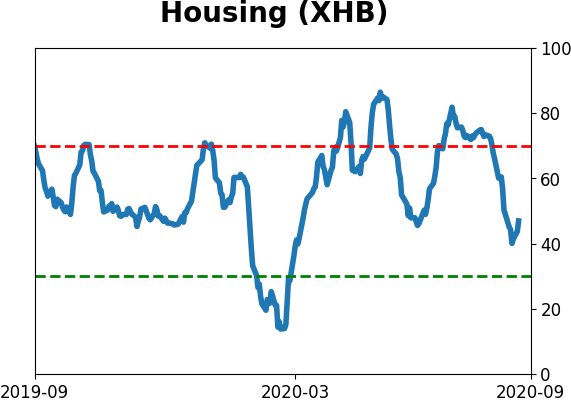
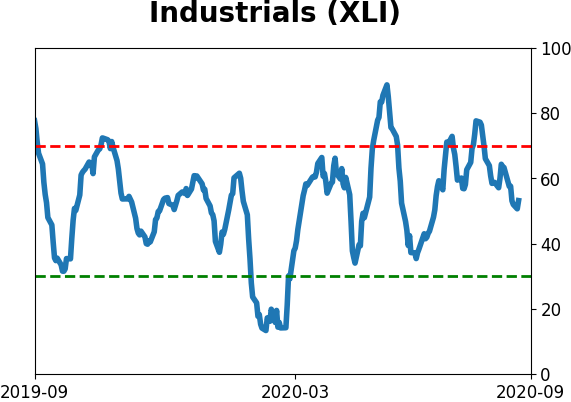
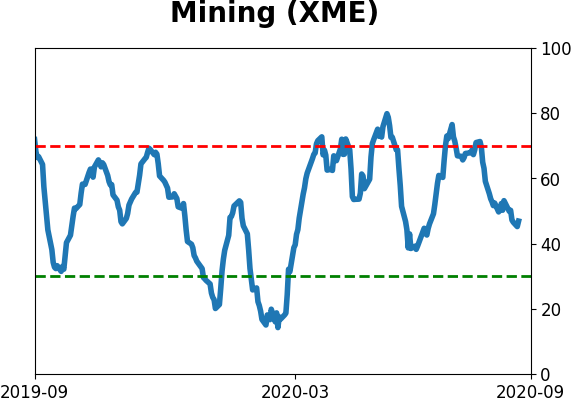
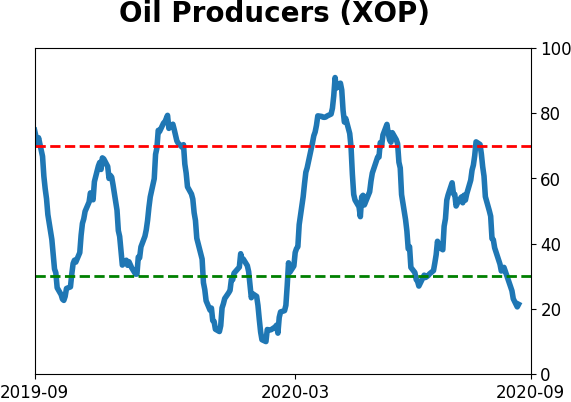
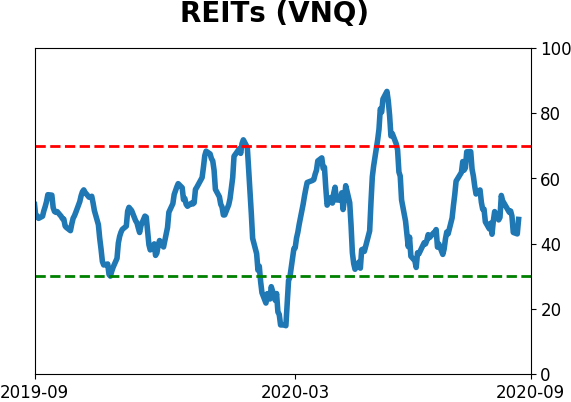
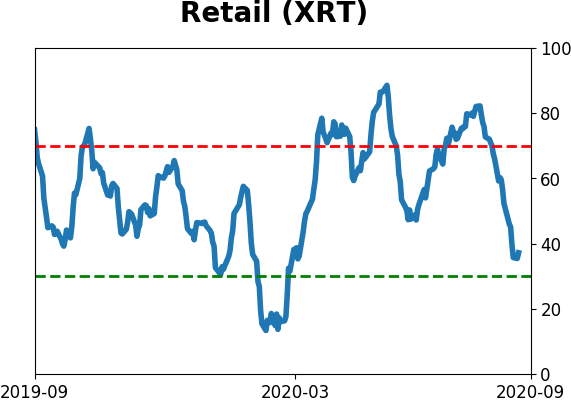
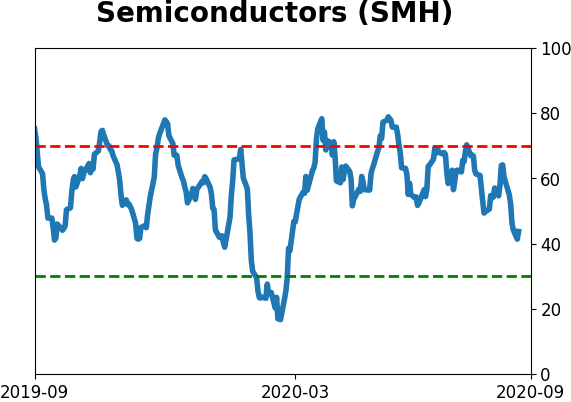
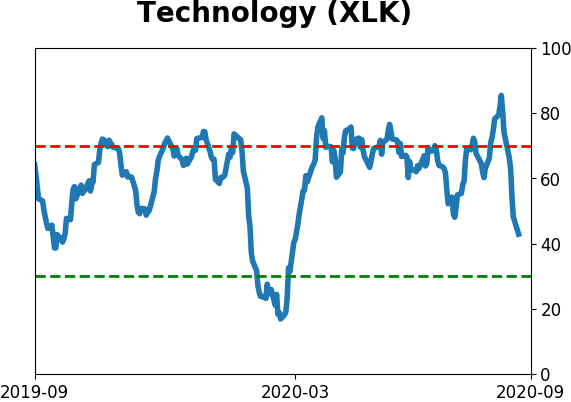
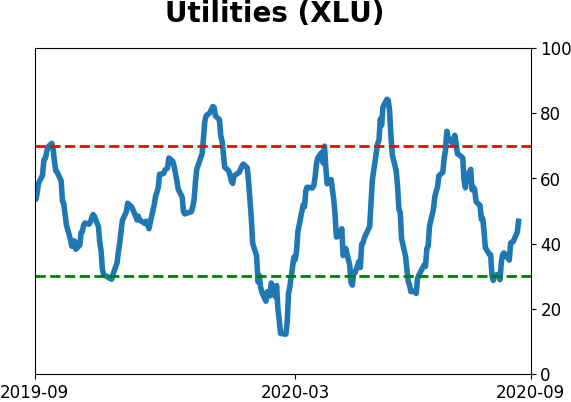
Sector ETF's - 10-Day Moving Average
|
|
|
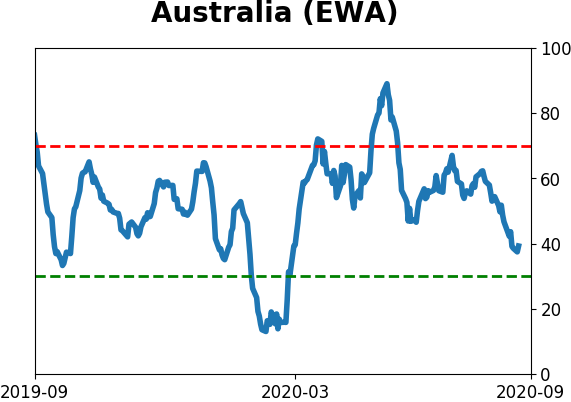
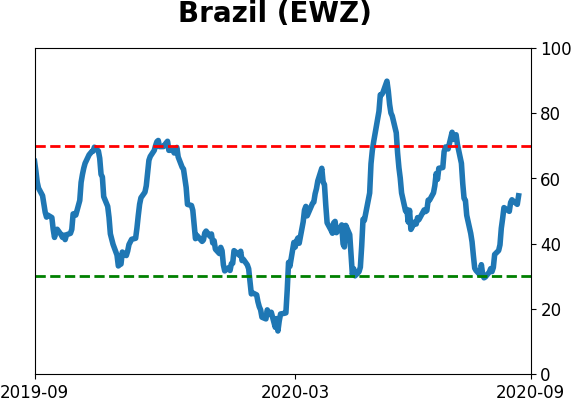
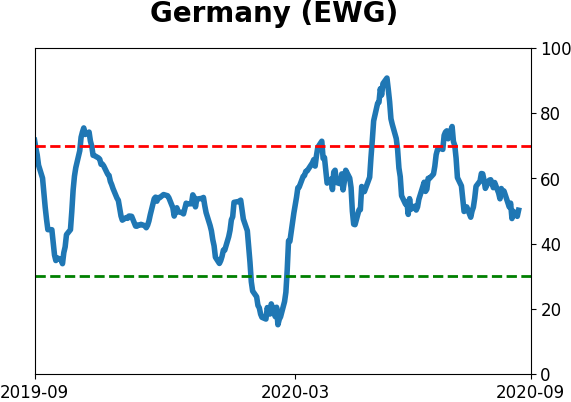
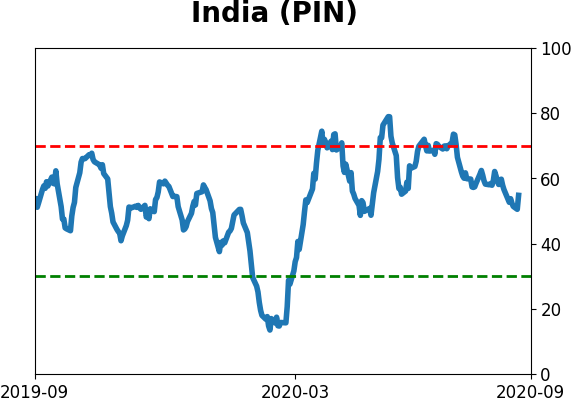
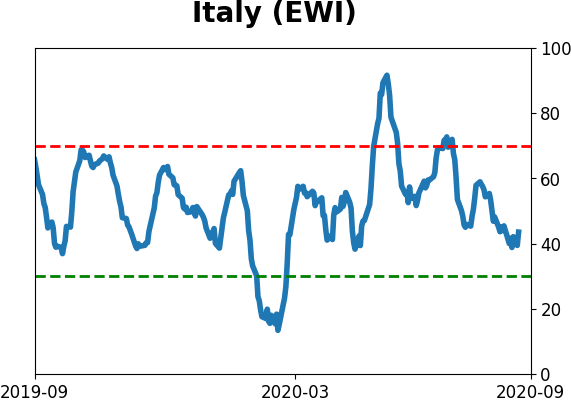
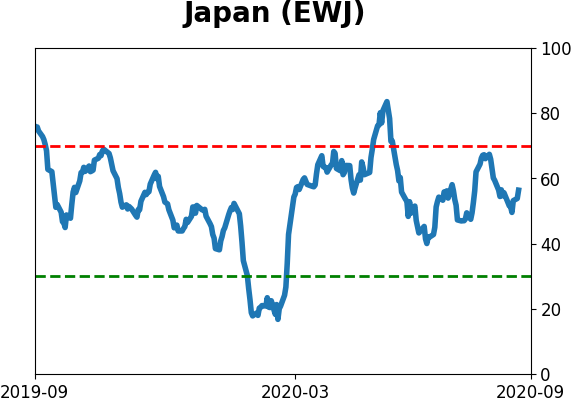
Country ETF's - 10-Day Moving Average
|
|
|
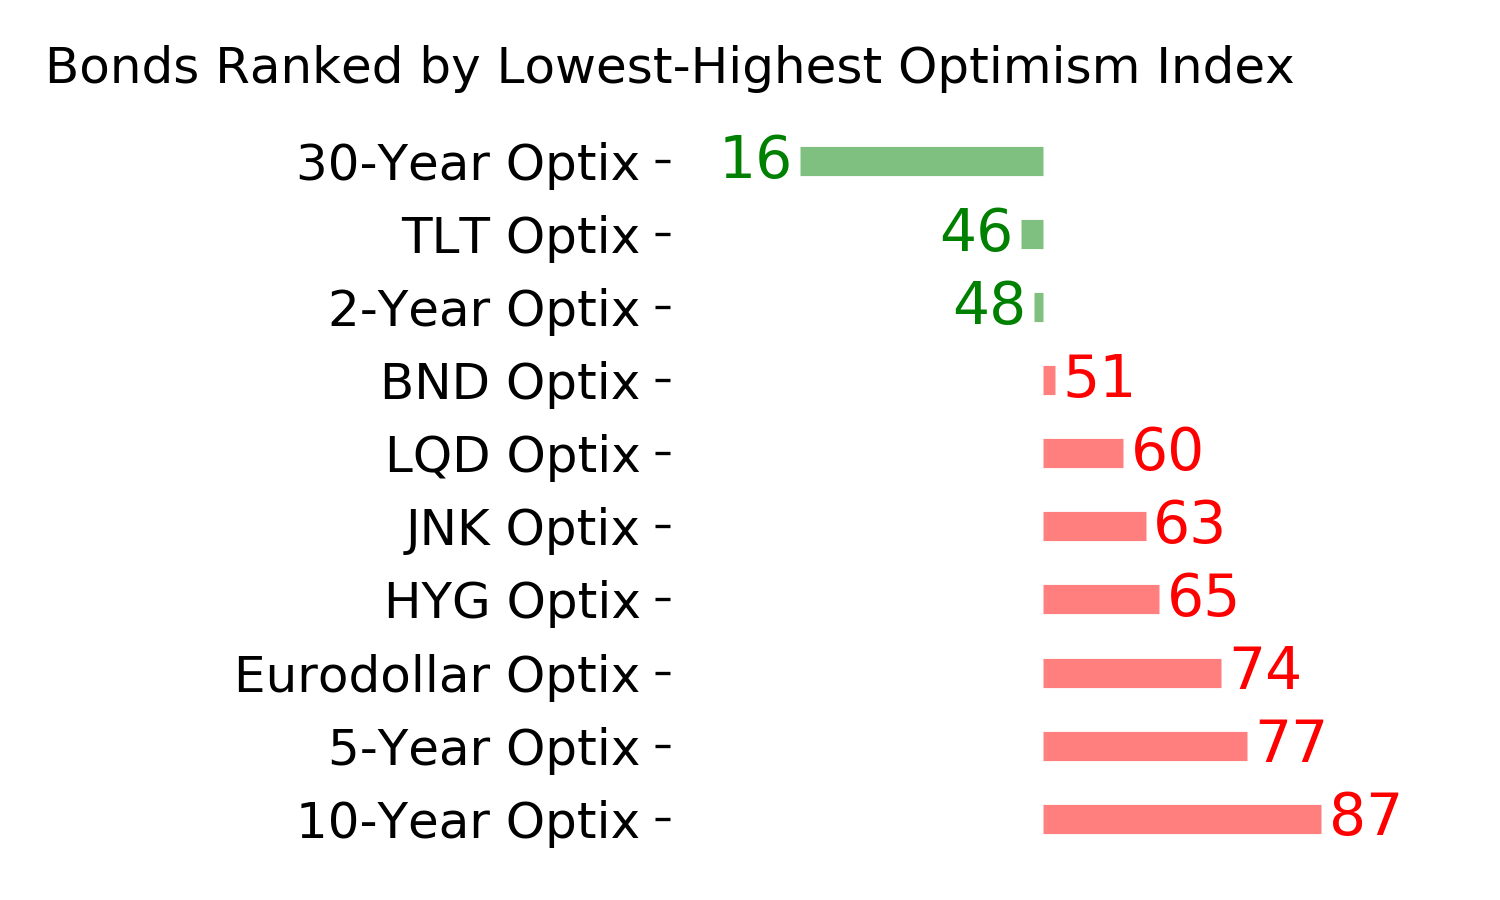
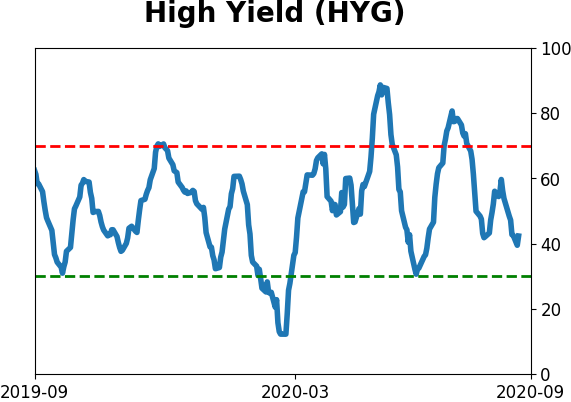
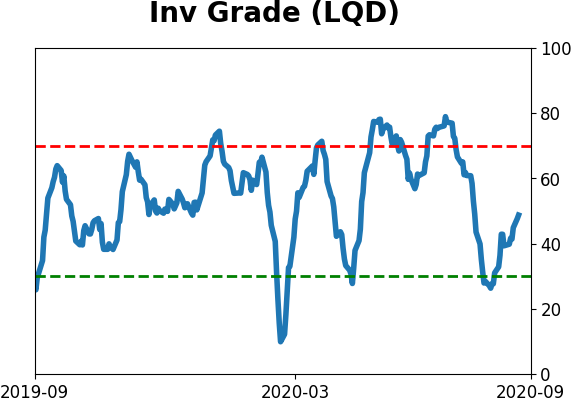
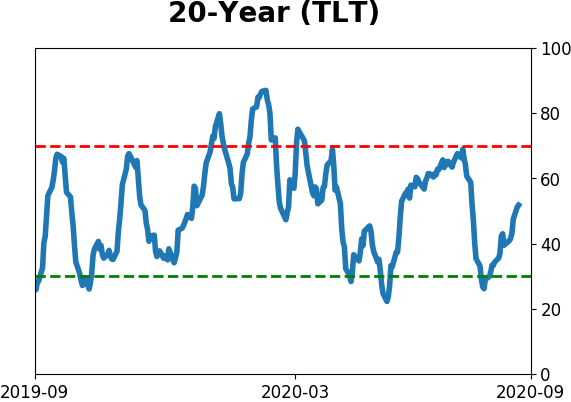
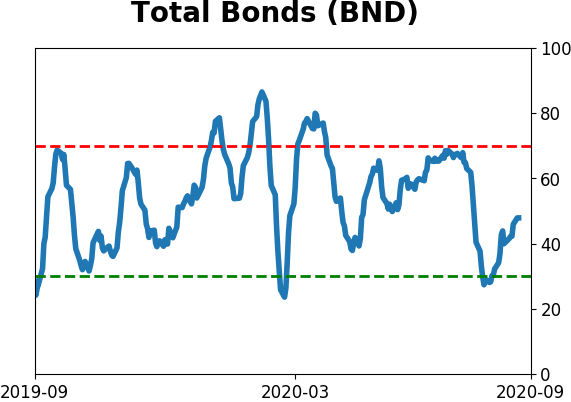
Bond ETF's - 10-Day Moving Average
|
|
|
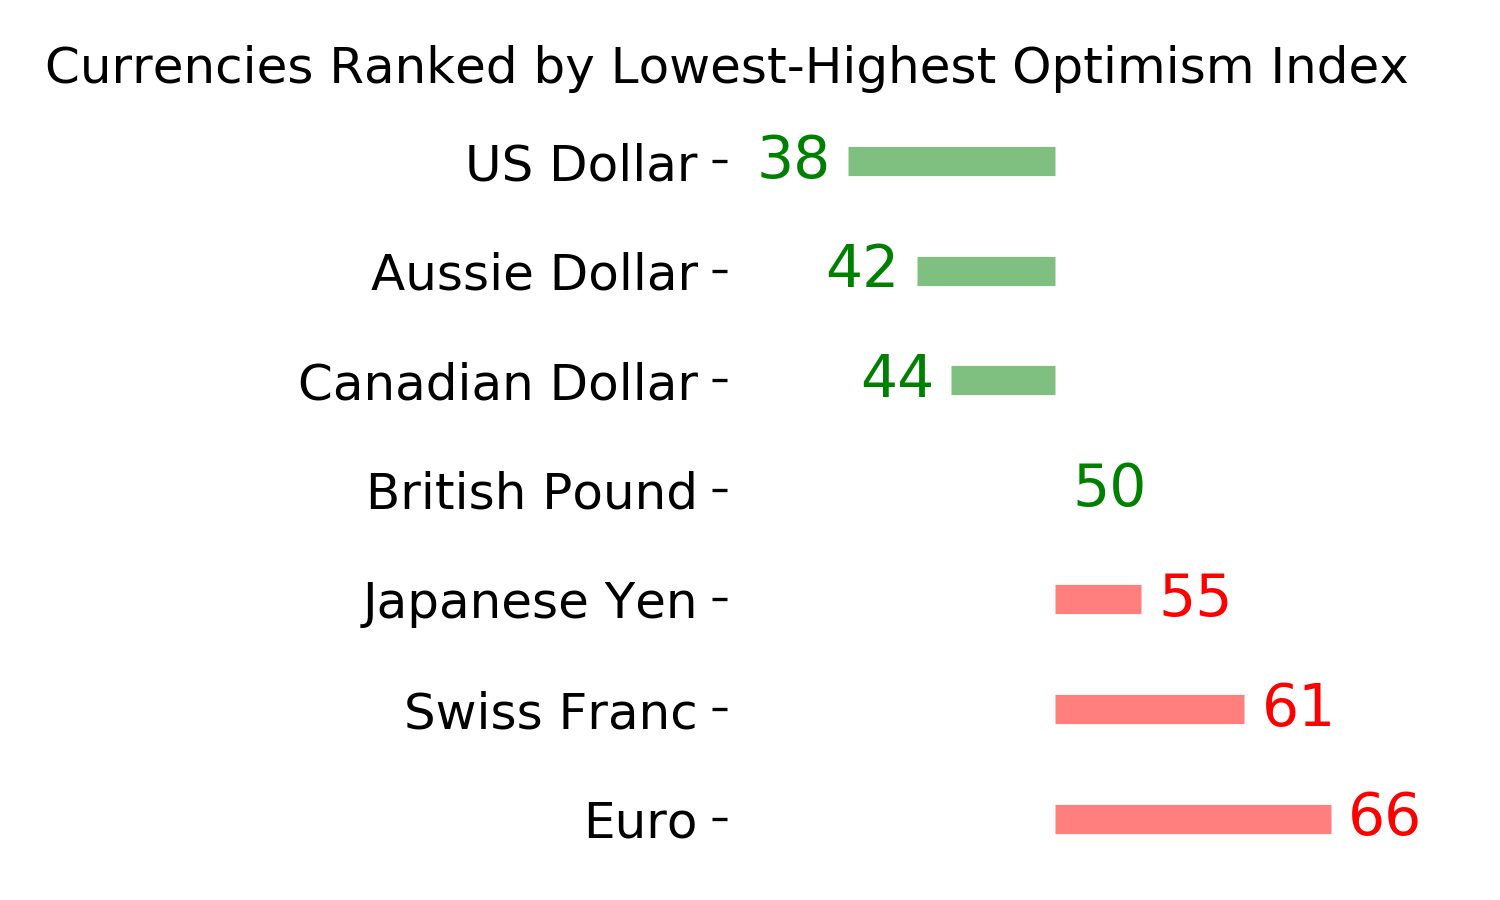
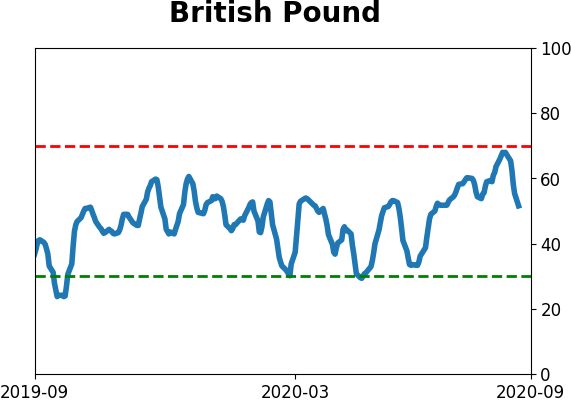
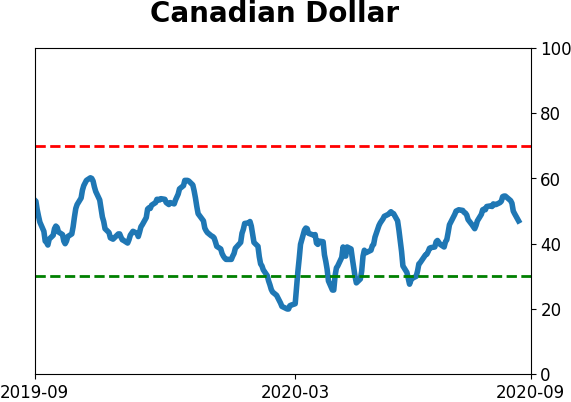
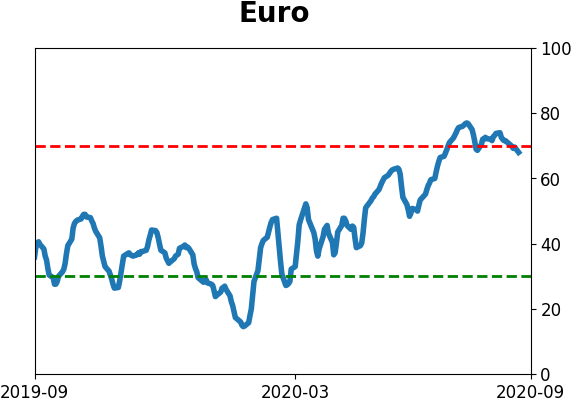
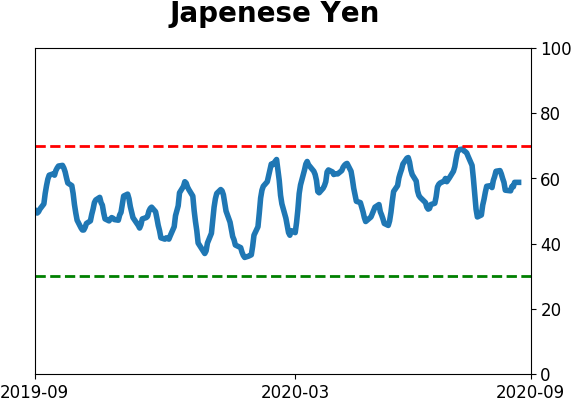
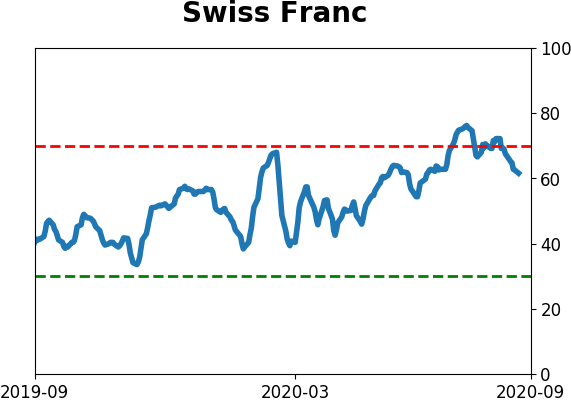
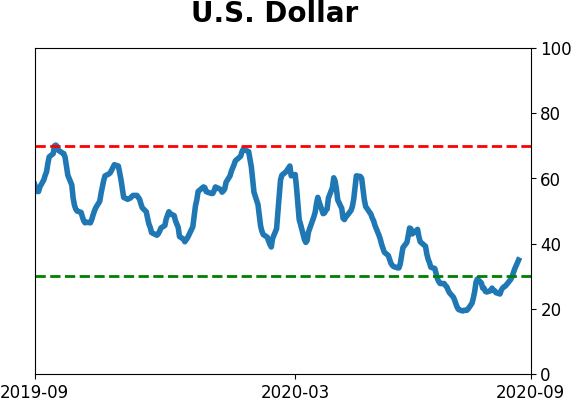
Currency ETF's - 5-Day Moving Average
|
|
|
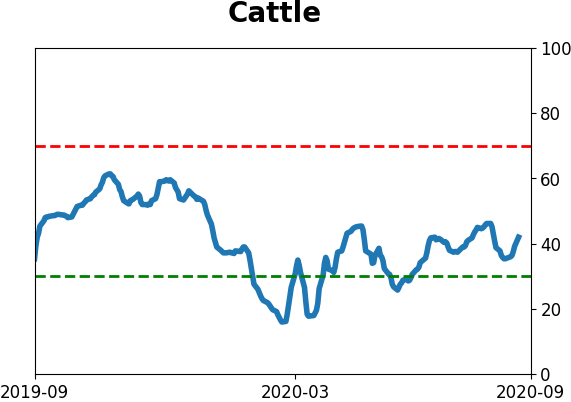
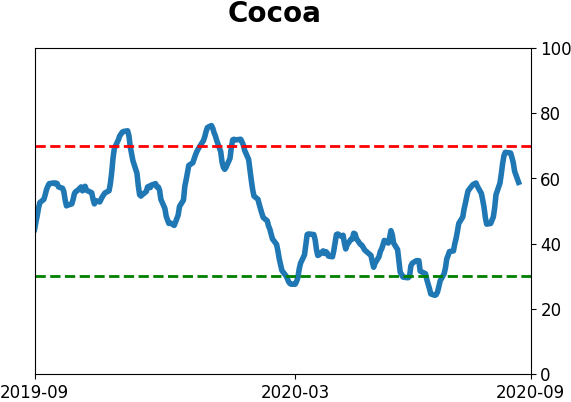
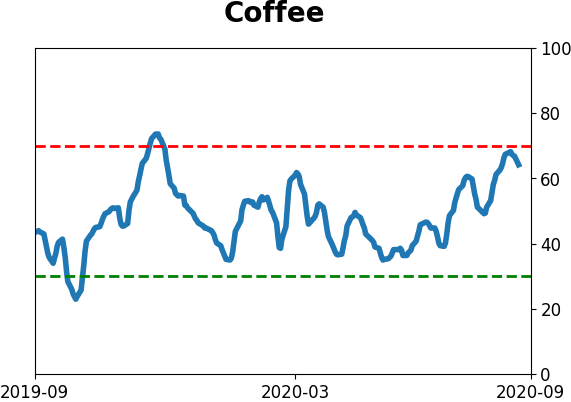
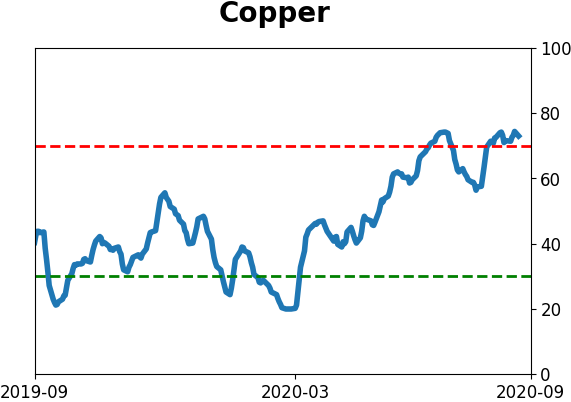
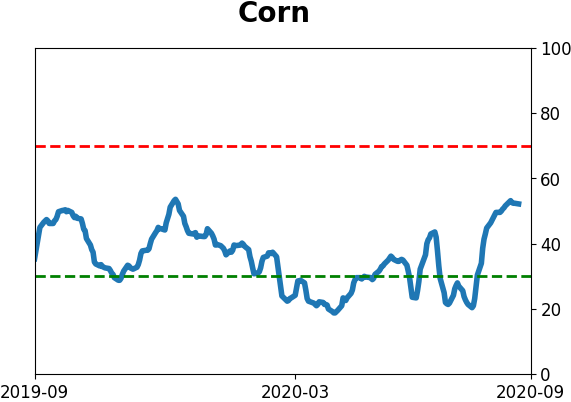
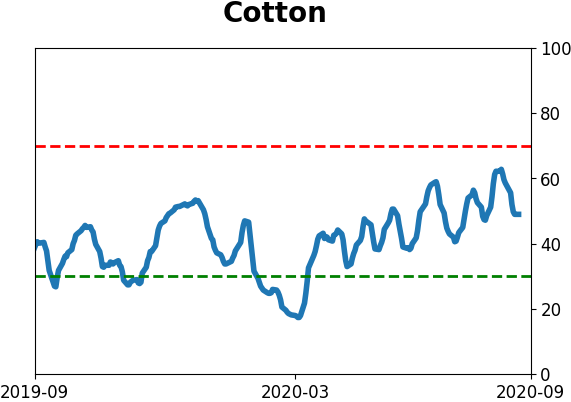
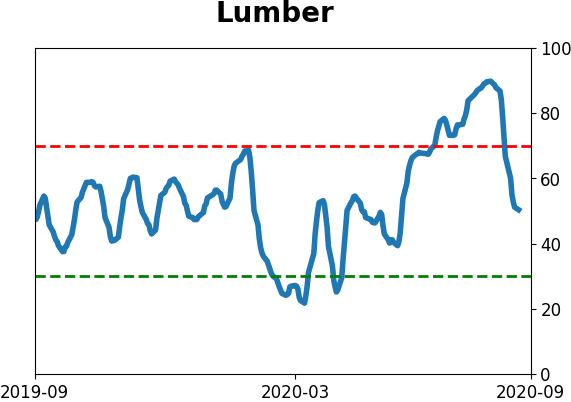
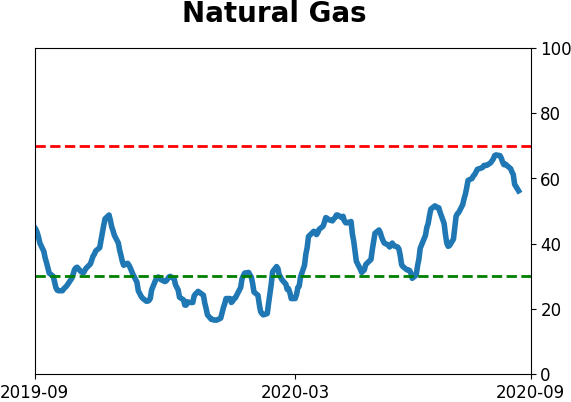
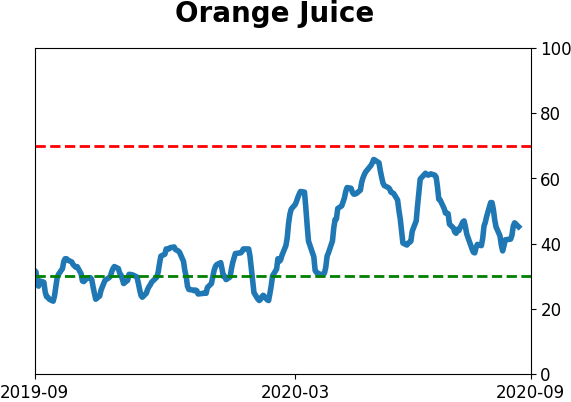
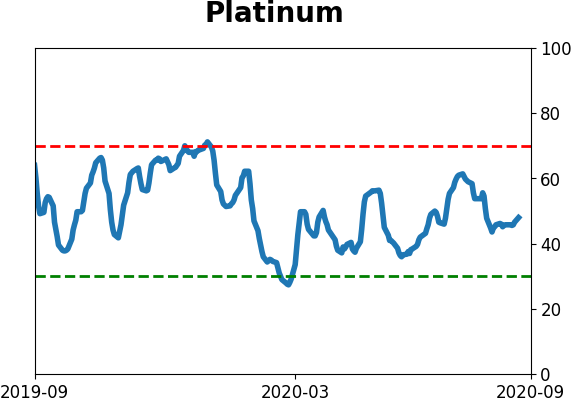
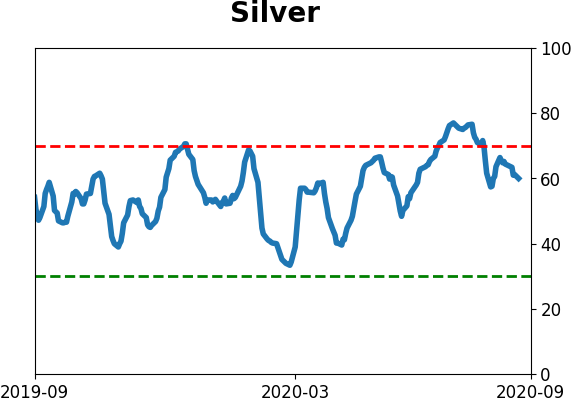
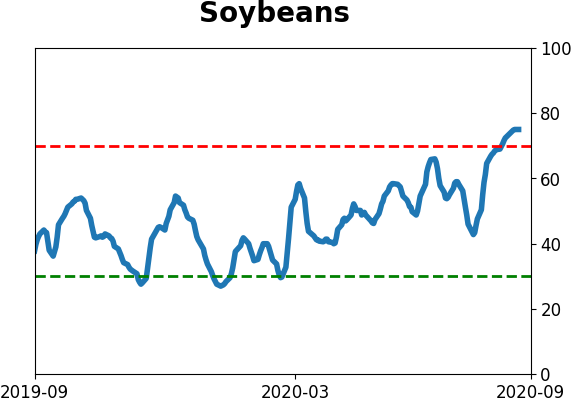
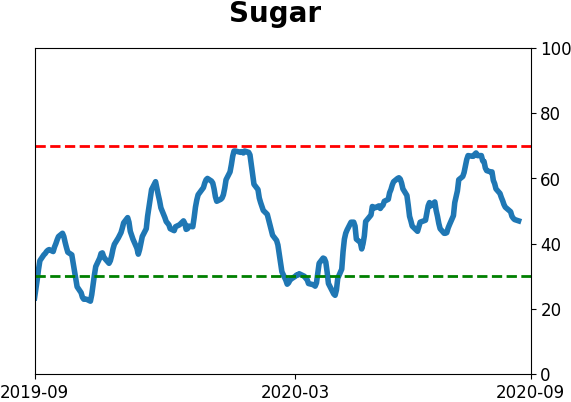
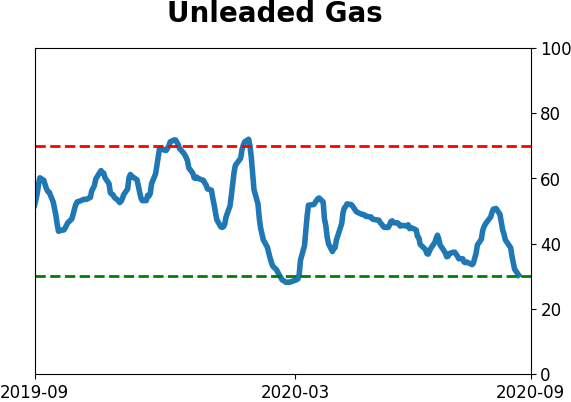
Commodity ETF's - 5-Day Moving Average
|
|