Headlines
|
|
Modest internal Nasdaq selling triggers leveraged bets:
The Nasdaq Composite has seen over a week of declines, but none of the days have seen intense, overwhelming selling pressure. This is one of the "best" declines in terms of breadth. The lack of internal selling has emboldened ETF traders, who have moved into 3x leveraged funds like TQQQ.
Stocks wobble, but options traders aren't losing faith:
Even though stocks took a hit last week, options trades continued to skew toward speculative call options. This activity dropped significantly from the prior week, but it remains above all prior record speculative peaks. Stocks have not done well after the others.
Bottom Line:
|
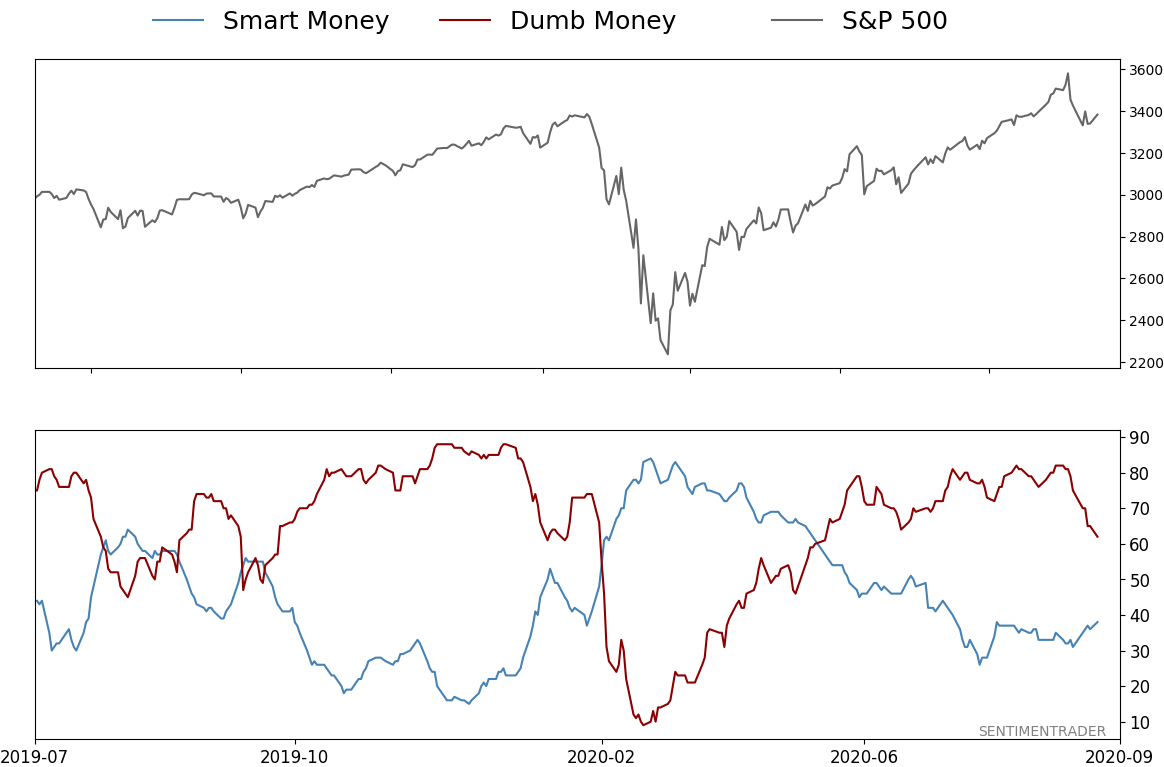
Smart / Dumb Money Confidence
|
Smart Money Confidence: 38%
Dumb Money Confidence: 62%
|
|
Risk Levels
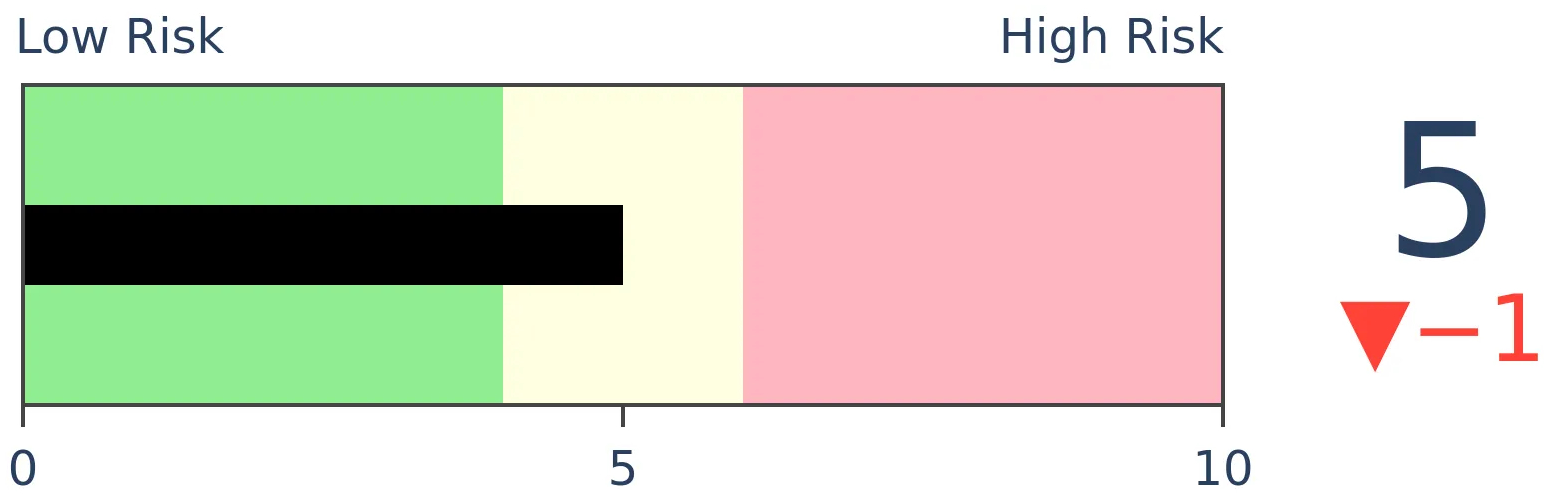
Stocks Short-Term
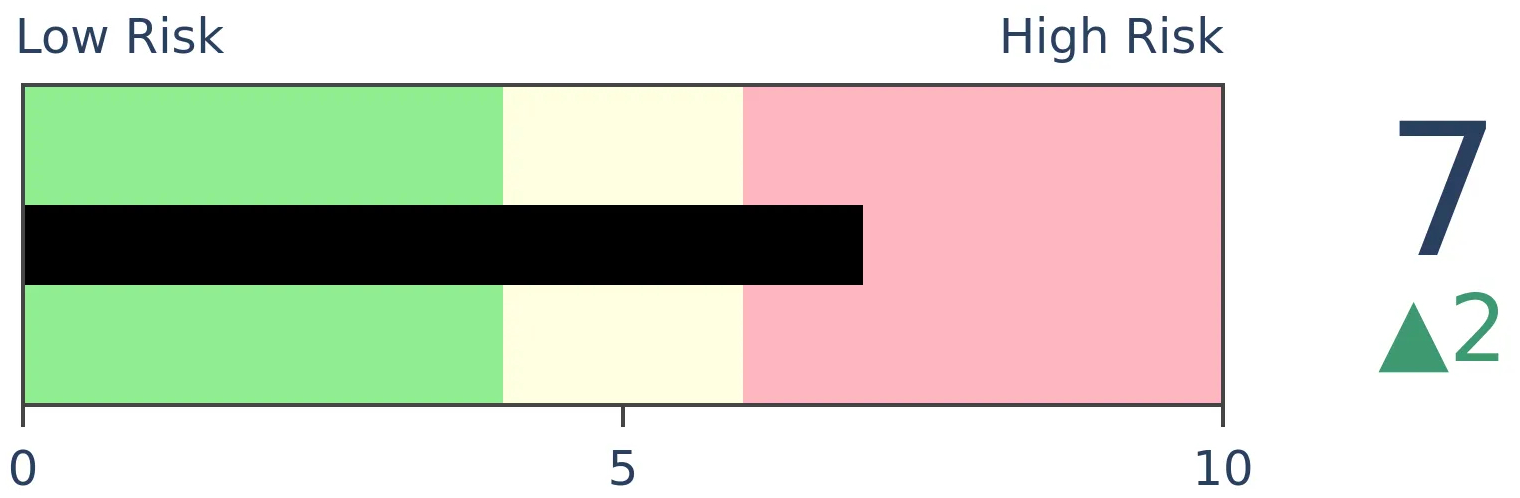
|
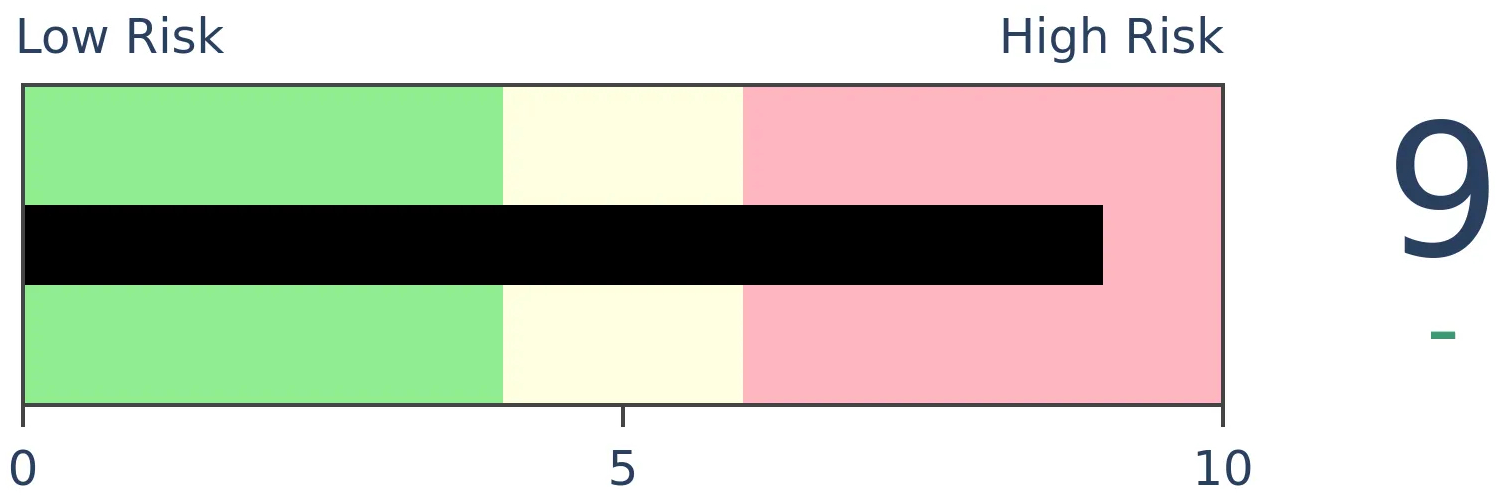
Stocks Medium-Term
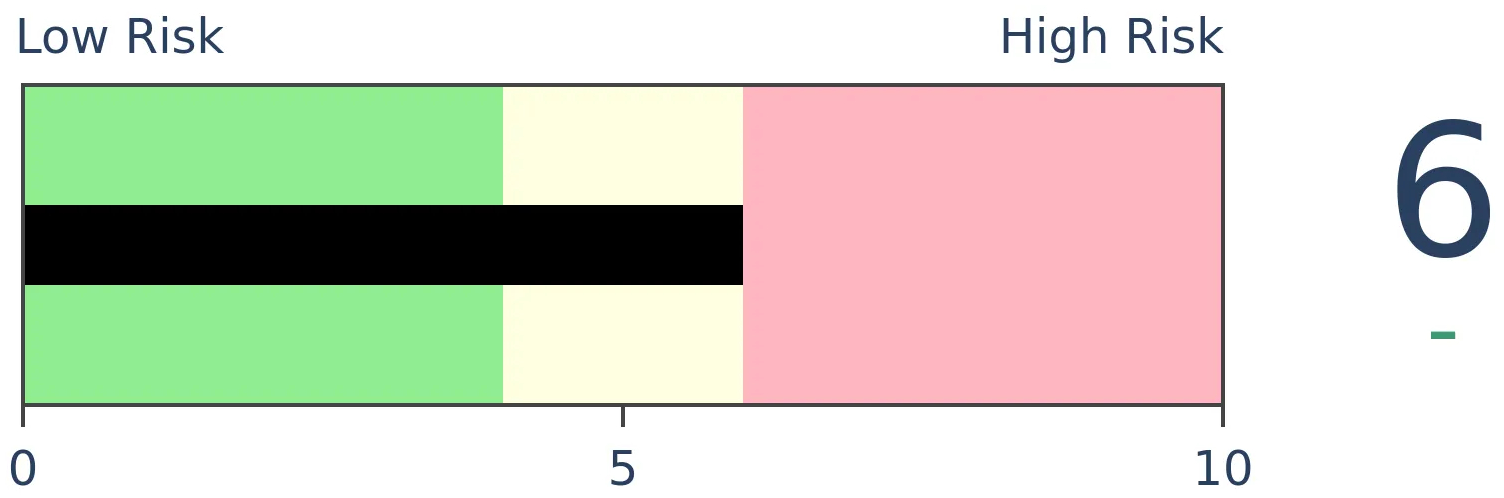
|
|
Bonds
|
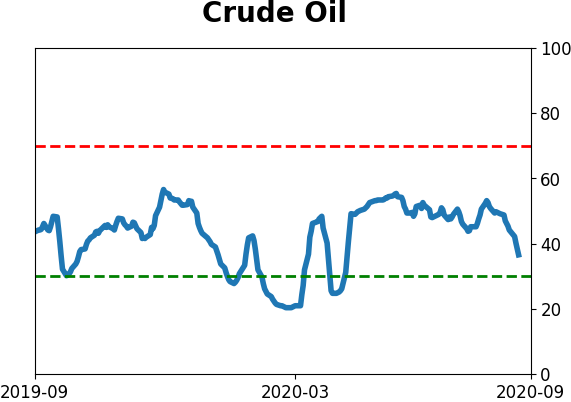
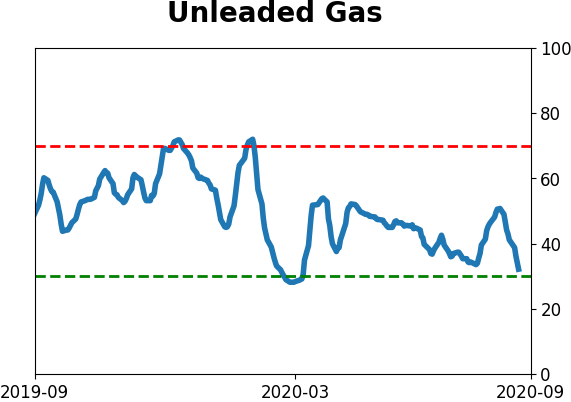
Crude Oil

|
|
Gold

|
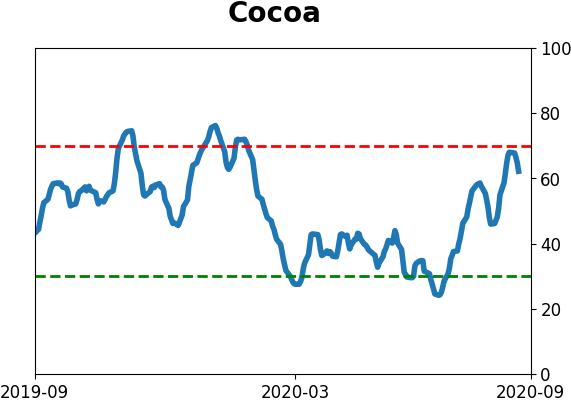
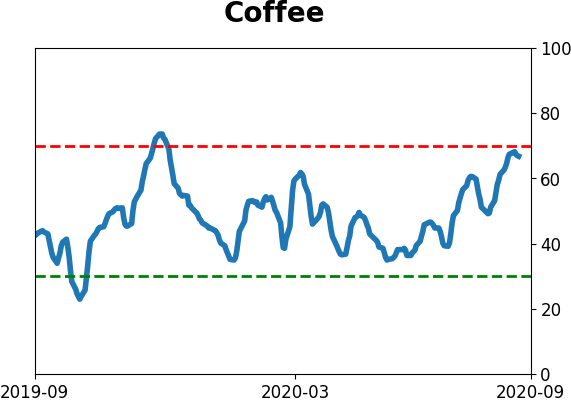
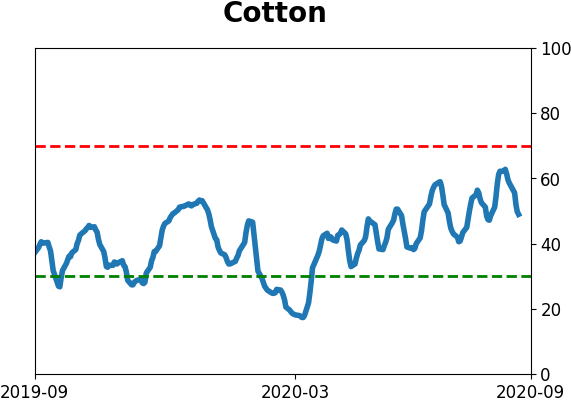
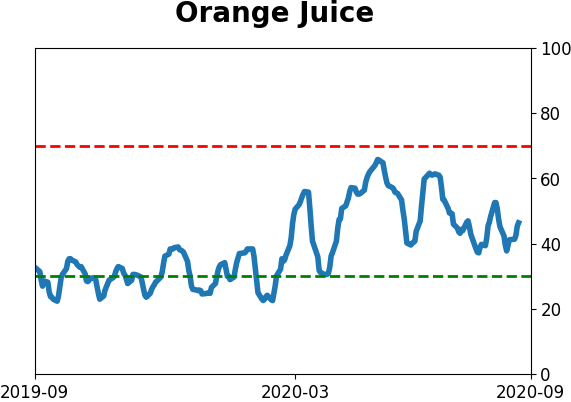
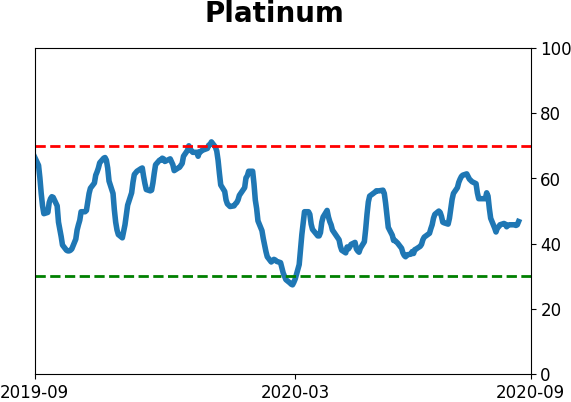
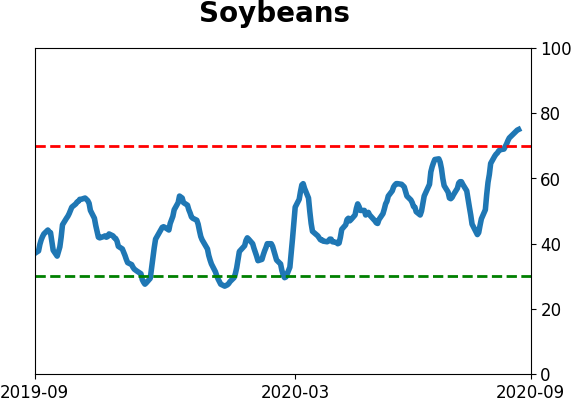
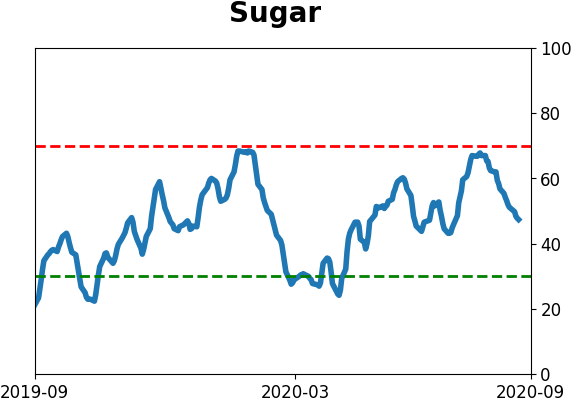
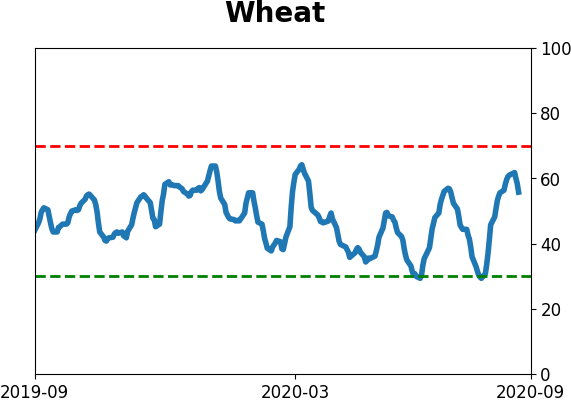
Agriculture
|
|
Research
BOTTOM LINE
The Nasdaq Composite has seen over a week of declines, but none of the days have seen intense, overwhelming selling pressure. This is one of the "best" declines in terms of breadth. The lack of internal selling has emboldened ETF traders, who have moved into 3x leveraged funds like TQQQ.
FORECAST / TIMEFRAME
None
|
The driving force of much of the rally over the past few months has been big tech stocks, driving the Nasdaq higher. We've seen that momentum there is wobbling, and yet traders continue to place record bets that it's going to continue higher.
One of the knocks against the idea that the Nasdaq has suffered damage is that there hasn't been any "real" selling pressure despite the drop over the past week. On the Nasdaq exchange, the 10-day Up Volume Ratio is below 50%, but there hasn't been any single day with heavily lopsided selling.
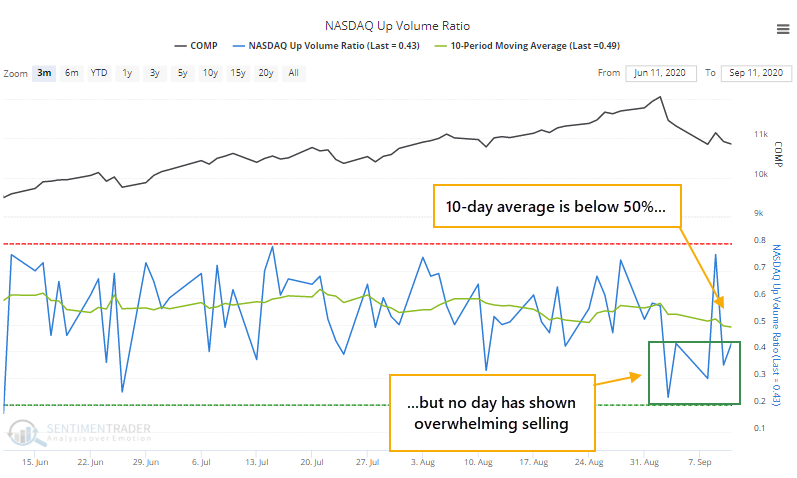
Because there haven't been any days with overwhelming selling, perhaps that calls into question that sentiment has truly soured. If we were seeing a regime change, then it makes sense to believe that we should see some days with a total get-me-out mentality. That hasn't happened.
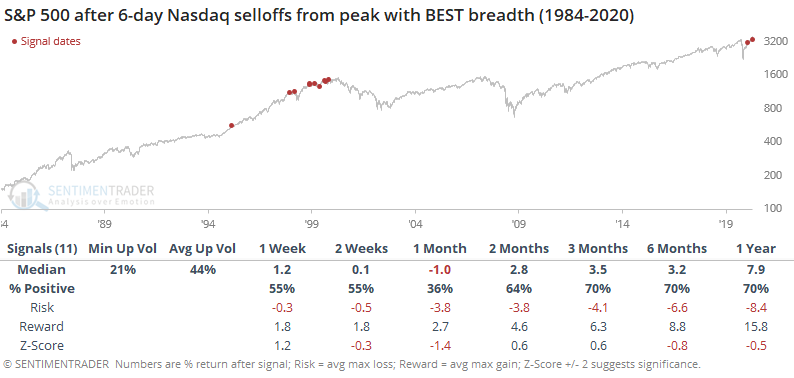
Let's go back and look at every time the Nasdaq hit a 52-week high, then saw at least 6 days of selling with at least a 5% pullback. We'll separate out the instances between those with the best breadth and the worst, to see if it made any difference for forward returns.
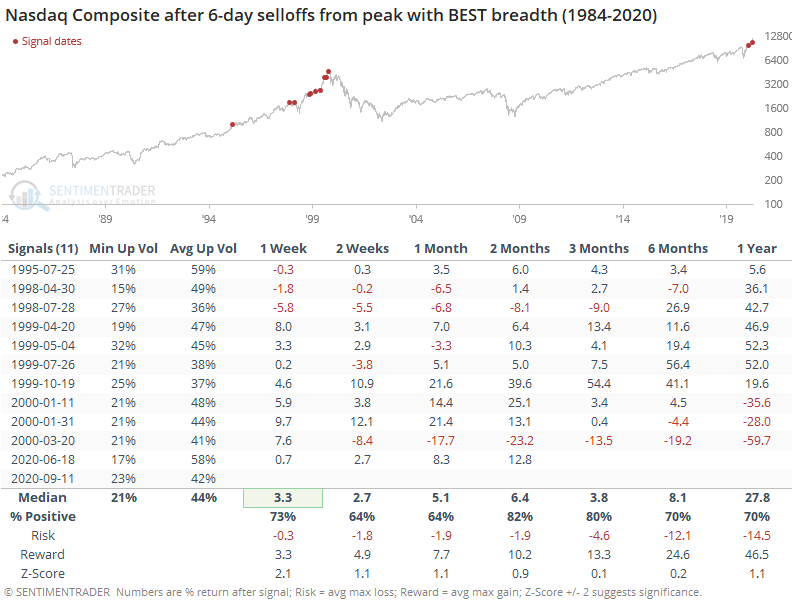
During the selloffs that held up best internally, the Up Volume Ratio averaged 44% during the 6-day selling sprees, with no day dropping below 21% on average. Forward returns were quite good, especially over the next 2-3 months. There were 2 big losses, 1998 and 2000, but most of them triggered during the last gasps of the bubble, and momentum carried the Nasdaq higher (for a while).
For the broader market, represented by the S&P 500, returns were worse over the shorter-term, with the index showing a positive return a month later only 36% of the time. It mostly recovered over the medium-term.
Contrast this to the 6-day selloffs with the worst selling pressure after the initial peak.
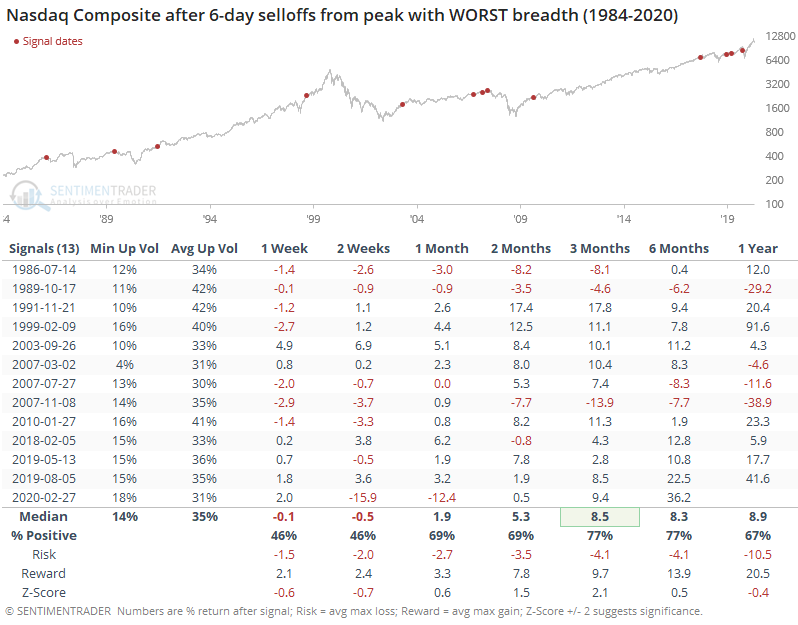
These showed worse performance shorter-term, but better relative returns over the next 3 months. Surprisingly, there wasn't a huge difference between them. Probably the most interesting data point is that the worst-breadth signals were spread out across the entire study period; the best-breadth ones were clustered in the year or two leading up to the peak of the bubble.
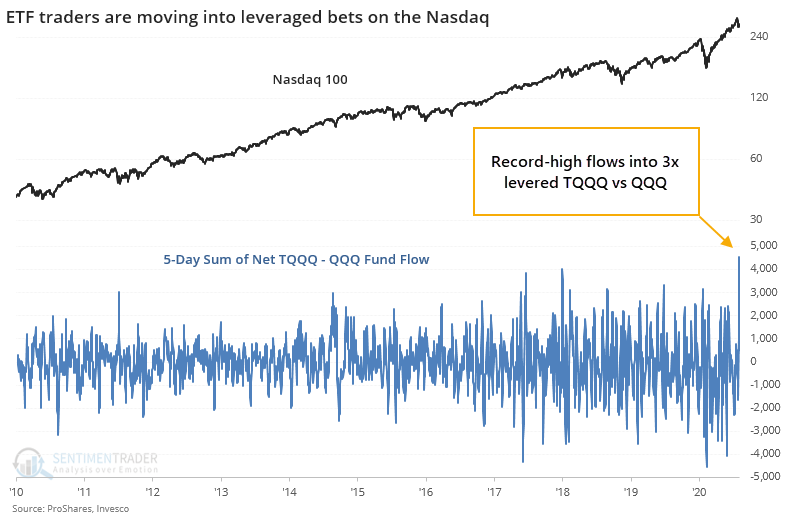
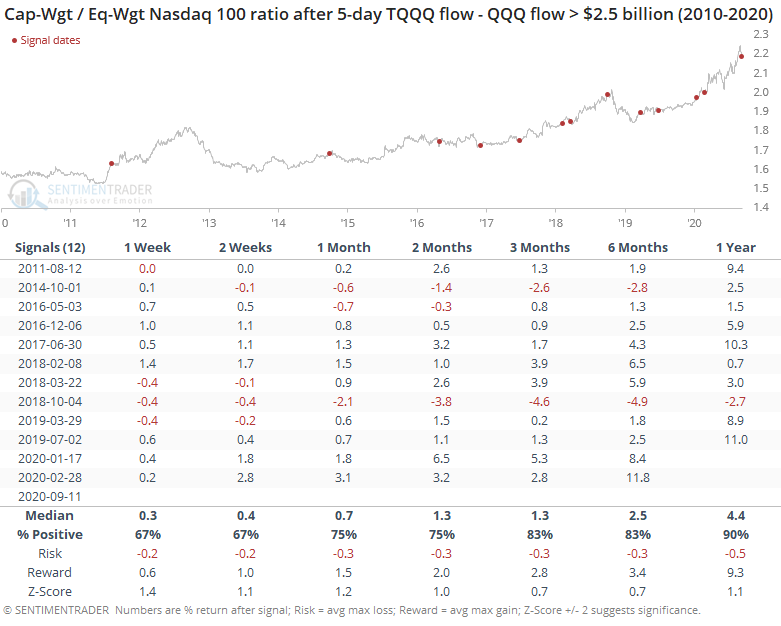
We saw earlier that despite catastrophic losses in some of the options on big tech stocks, traders are still diving in. Sarah Ponczek of Bloomberg notes that we can see this behavior in ETF flows as well. Go-to funds like QQQ are seeing outflows, while triple-leveraged long funds like TQQQ are seeing inflows.
The 5-day difference in flows between the two funds has never been greater.
Whether this actually means anything is questionable. Forward returns after other big relative inflows to TQQQ were mixed, with some short-term weakness but longer-term strength due to the study period being dominated by a bull market.
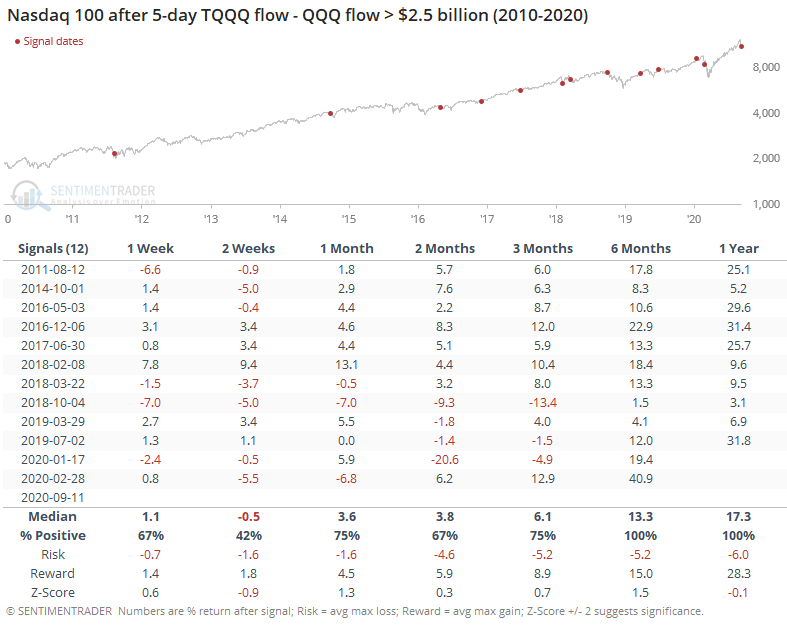
There was also no evidence that these infusions into leveraged funds preceded a drop in the big tech stocks dropping relative to the average tech stock.
During the brief selloff from the highs, we've seen modest evidence that something has changed, and the Nasdaq is likely to see further selling pressure. Pricks of a momentum bubble like the past week have had a slightly better record at preceding declines than sustained rebounds.
The fact that there has been no day with really intense selling appears to be a point in bulls' favor, and it's not canceled out by the rush into leveraged funds. The biggest knock against a sustained run to new highs remains the simple fact that so many options traders are betting on that very outcome, and markets rarely accommodate that kind of behavior for long.
BOTTOM LINE
Even though stocks took a hit last week, options trades continued to skew toward speculative call options. This activity dropped significantly from the prior week, but it remains above all prior record speculative peaks. Stocks have not done well after the others.
FORECAST / TIMEFRAME
None
|
Arguably the biggest story in sentiment in recent weeks has been the behavior of speculative options traders. On Monday, we saw how much this kind of activity spiked heading into September and its potential impact on the broader market.
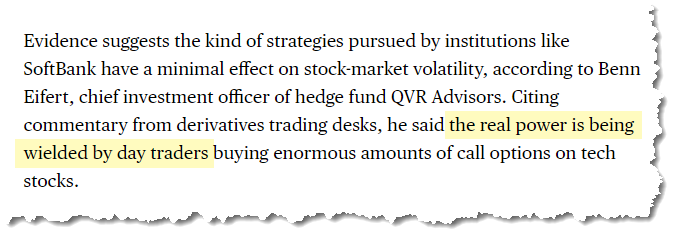
Financial media initially blamed this on the Softbank conglomerate. We've been arguing that Softbank was a straw man; rather, it has been the behavior of the smallest of traders that was the real driving force. That idea gained ground during the week, thanks in large part to Benn Eifert's explanation of how this could happen on Twitter.
The Narrative is shifting
As the week unfolded, Bloomberg noted:
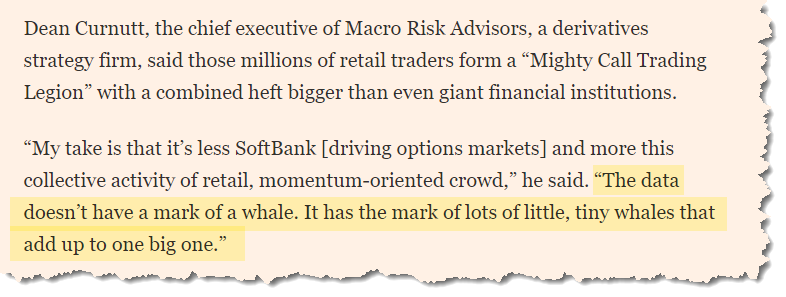
Later, the Financial Times followed with:
Jason Zweig from the Wall Street Journal is always a good source for perspective:
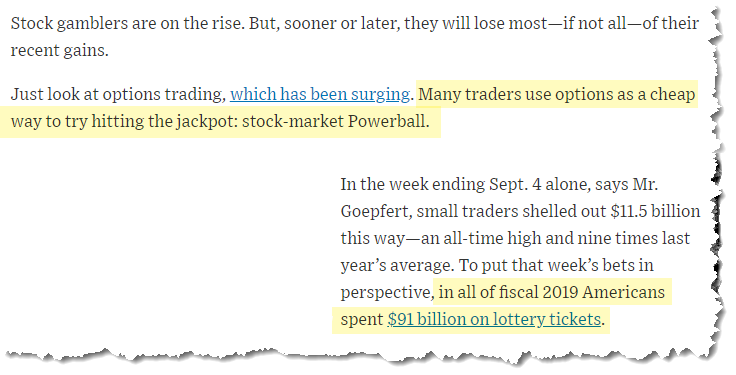
And Barron's:
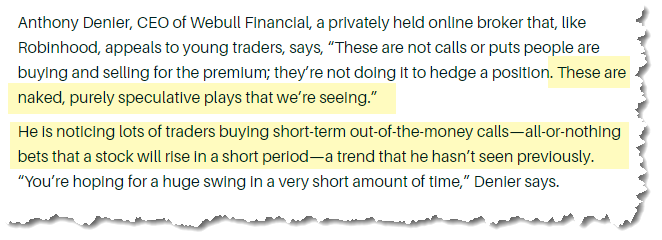
Even so, traders aren't letting up
Okay, so we knew heading into the week that the real story was the speculative activity of the smallest of options traders. It didn't seem to let up during the week. By Friday, options activity was still skewed toward calls, per Bloomberg.
"An Apple call with a $120 strike price expiring on Friday traded nearly 200,000 times on Thursday, making it the day’s most-active option, according to data compiled by Bloomberg. Trading surged even as the value of the contract plunged over 87% to close at $113.49 on Thursday -- well below the option’s strike. Despite the burst, the option’s open interest only increased by about 10,000 contracts, suggesting that the vast majority of the trading volume was positions opened and closed the same day. To see such frenzied activity in what’s effectively a one-day option suggests that day traders are behind the flows, according to Charlie McElligott from Nomura Securities."
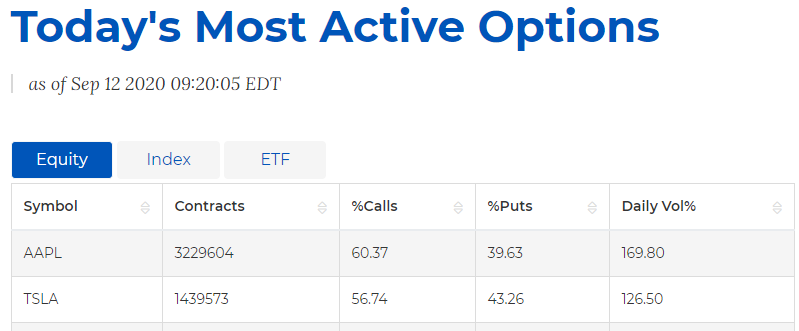
According to the OCC, the two most active options on Friday - by a very wide margin - were Apple and Tesla, two of the biggest speculative darlings heading into last week.
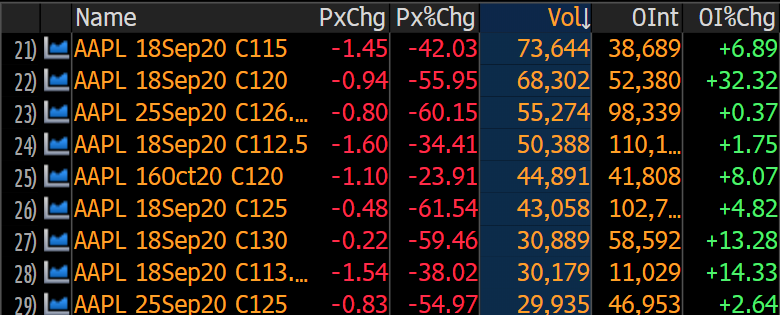
Bloomberg data shows that the most active call options are concentrated in the September 18 expiration. Apple calls are plunging in value with heavy volume, yet open interest is actually rising.
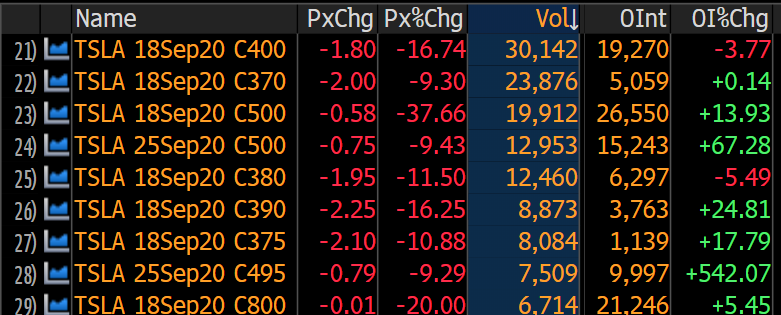
Same with Tesla.
Without being privy to the underlying trades, this would suggest that traders are not pulling back after getting burned, rather they're continuing to bet on higher prices.
Speculative activity still at records
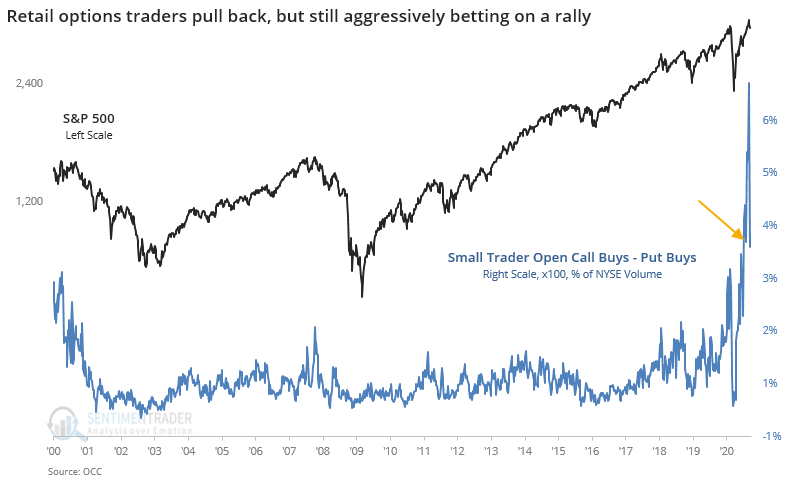
Looking at the weekly data, this is evident. Let's look at data for the smallest of options traders in the most comprehensive, objective way we can. This is the volume of opening call purchases minus opening put purchases, expressed as a percentage of total NYSE volume. To adjust for contract size, we'll multiply the options volume by 100.
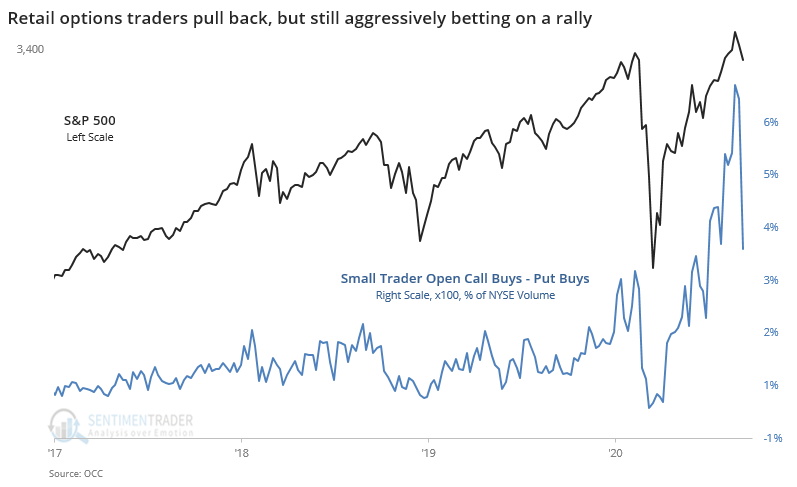
Clearly, there was a big pullback in speculative volume last week, dropping off by more than 50% from the upside panic to start September. But when zooming out, we can see that last week was still higher than any previous record high, by far.
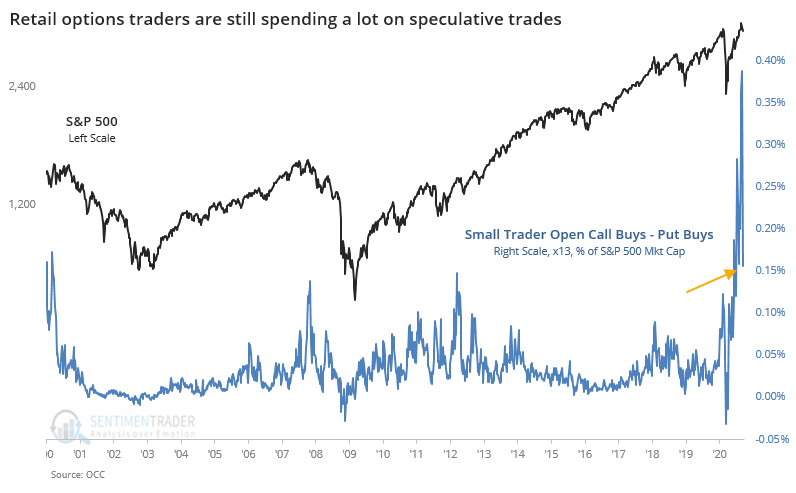
If we use premiums, the amount of money that traders actually spent to buy these options, then we can see pretty much the same story. There was a big drop-off last week in the estimated notional value of these speculative positions.
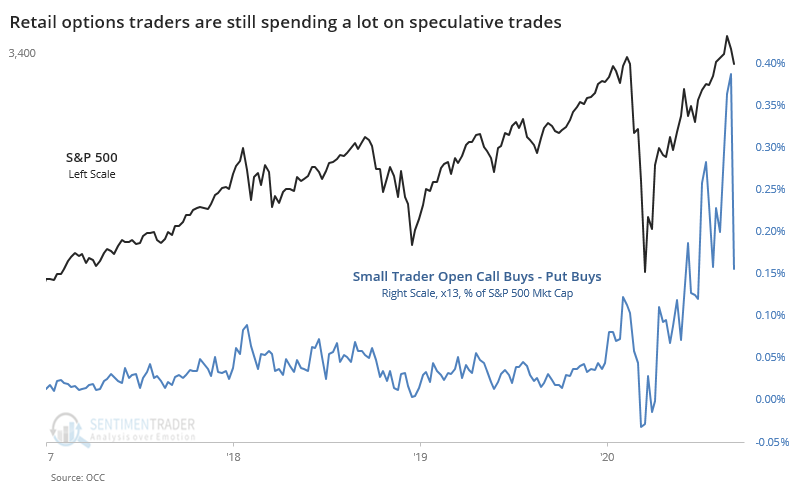
Even so, this past week's activity was still on par with the most speculative frenzies in the past 20 years.
After the 3 other times when speculative activity peaked, stocks struggled in the months ahead.
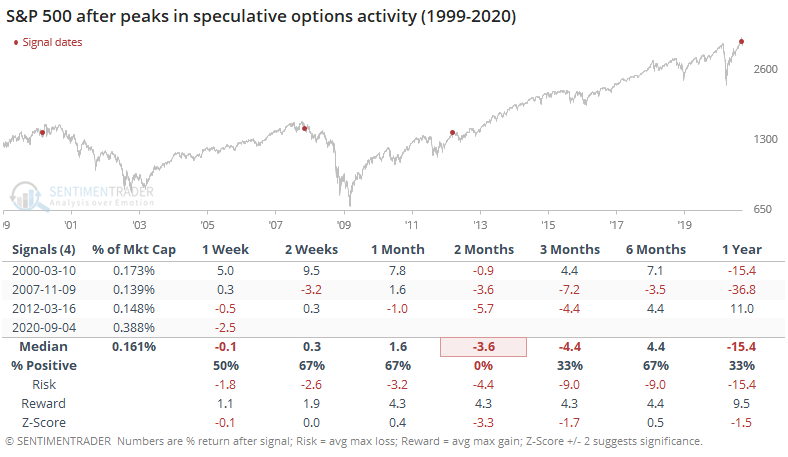
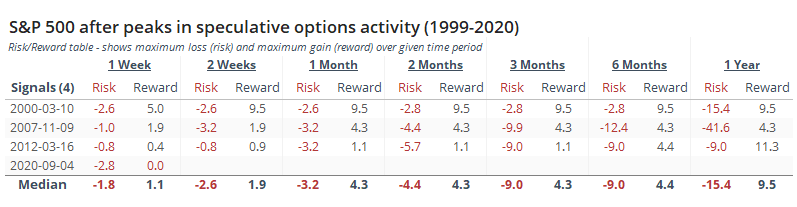
The risk/reward ratio was poor.
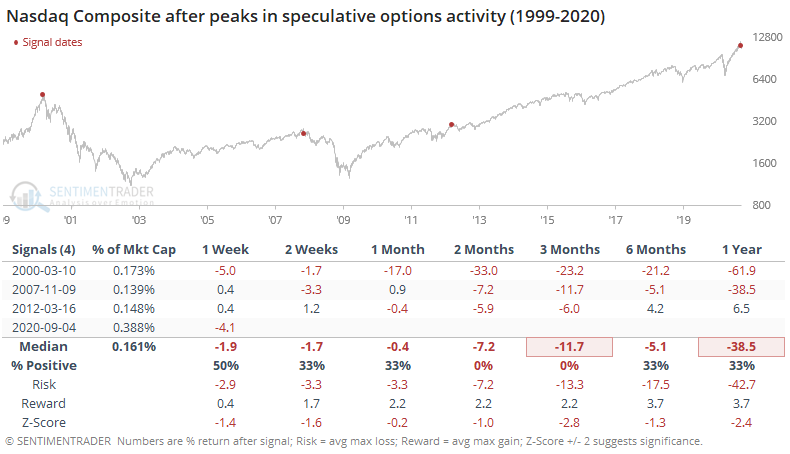
It was worse for the Nasdaq Composite.
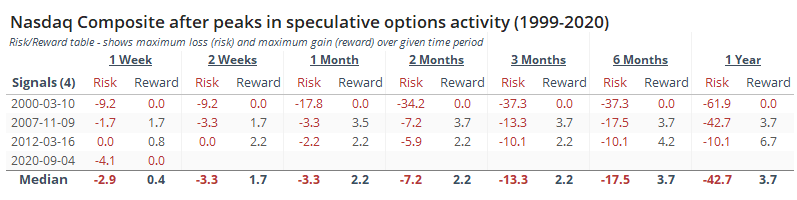
The risk/reward after these signals for the Nasdaq was atrocious.
The bottom line is that speculative options trading has been an issue for quite a while, and it hadn't really mattered. Coming into September, though, it moved into a whole other realm, and we're starting to see some cracks. The biggest worry is that this rush of speculative activity has created a big offsetting underlying position in the stocks, and that needs to be unwound as the options are closed or expire. Most of that will be happening in September. There isn't any way to think that this is a good sign for markets.
Active Studies
| Time Frame | Bullish | Bearish | | Short-Term | 0 | 1 | | Medium-Term | 1 | 12 | | Long-Term | 47 | 2 |
|
Indicators at Extremes
Portfolio
| Position | Weight % | Added / Reduced | Date | | Stocks | 15.2 | Reduced 4.2% | 2020-09-03 | | Bonds | 30.0 | Added 30% | 2020-09-09 | | Commodities | 2.4 | Reduced 2.1%
| 2020-09-04 | | Precious Metals | 5.0 | Added 5% | 2020-09-09 | | Special Situations | 4.9 | Added 5.1% | 2020-09-03 | | Cash | 42.5 | | |
|
Updates (Changes made today are underlined)
After stocks bottomed on March 23rd, they enjoyed a historic buying thrust and retraced a larger amount of the decline than "just a bear market rally" tends to. Through June, there were signs of breadth thrusts, recoveries, and trend changes that have an almost unblemished record at preceding higher prices over a 6-12 month time frame. On a shorter-term basis, our indicators have been showing high optimism, with Dumb Money Confidence recently above 80%, along with signs of reckless speculation during what appears to be an unhealthy market environment, historically a bad combination. While there are certainly some outlier indicators that are showing apathy or even outright pessimism, a weight-of-the-evidence approach suggests high risk over a multi-week to multi-month time frame. That has been the case since July, even arguably June and yet the major indexes hit continual new highs through late August. With the indicators and studies failing to precede any weakness, I've been hesitant to lower my already-low exposure. I am getting increasingly anxious about the oddities we're seeing, though, and lowered it again. This account is mostly about comfort with risk for me, and right now I'm not at all comfortable with any of it. In more than 25 years of experience, this is the oddest market I've ever seen. I lowered exposure again - likely the lowest I'm willing to go at this point given longer-term positives - and decided to switch to an equal-weight version of the S&P 500 index. I've become intensely uncomfortable with the concentration in the cap-weighted index. Our studies have been mixed with regard to the potential for the equal-weight version to outperform the cap version going forward, so historical support isn't overwhelming. I'm also increasingly interested again in energy stocks, starting with a small allocation. I got burned in March with the unprecedented geopolitical spat that hammered those stocks then but the longer-term setup is decent. In this account, I’ve roughly followed what has become known as the All Weather portfolio popularized by Ray Dalio. It allocates across four broad assets, designed to hold up no matter the market environment. The goal is modest positive returns while limiting large, sustained losses. I typically use popular ETFs, with low costs. At times, I will swap out for a fund I believe has better prospects, or simply lower fees if not. At other times, I will diverge quite a bit from baseline allocations, largely depending on the indicators and studies we discuss on the site. I've gotten away from this in the past, using "cash" as a substitute for "bonds" and with rates stuck at 0%, that has become less appetizing. I'm trying to get back more toward the baselines with less dramatic swings in either direction. The base allocation I use is the following: Stocks: 35%
Bonds: 45%
Precious Metals: 7.5%
Commodities: 7.5%
Cash / Special Opportunities: 5%
RETURN YTD: -0.4% 2019: 12.6%, 2018: 0.6%, 2017: 3.8%, 2016: 17.1%, 2015: 9.2%, 2014: 14.5%, 2013: 2.2%, 2012: 10.8%, 2011: 16.5%, 2010: 15.3%, 2009: 23.9%, 2008: 16.2%, 2007: 7.8%
|
|
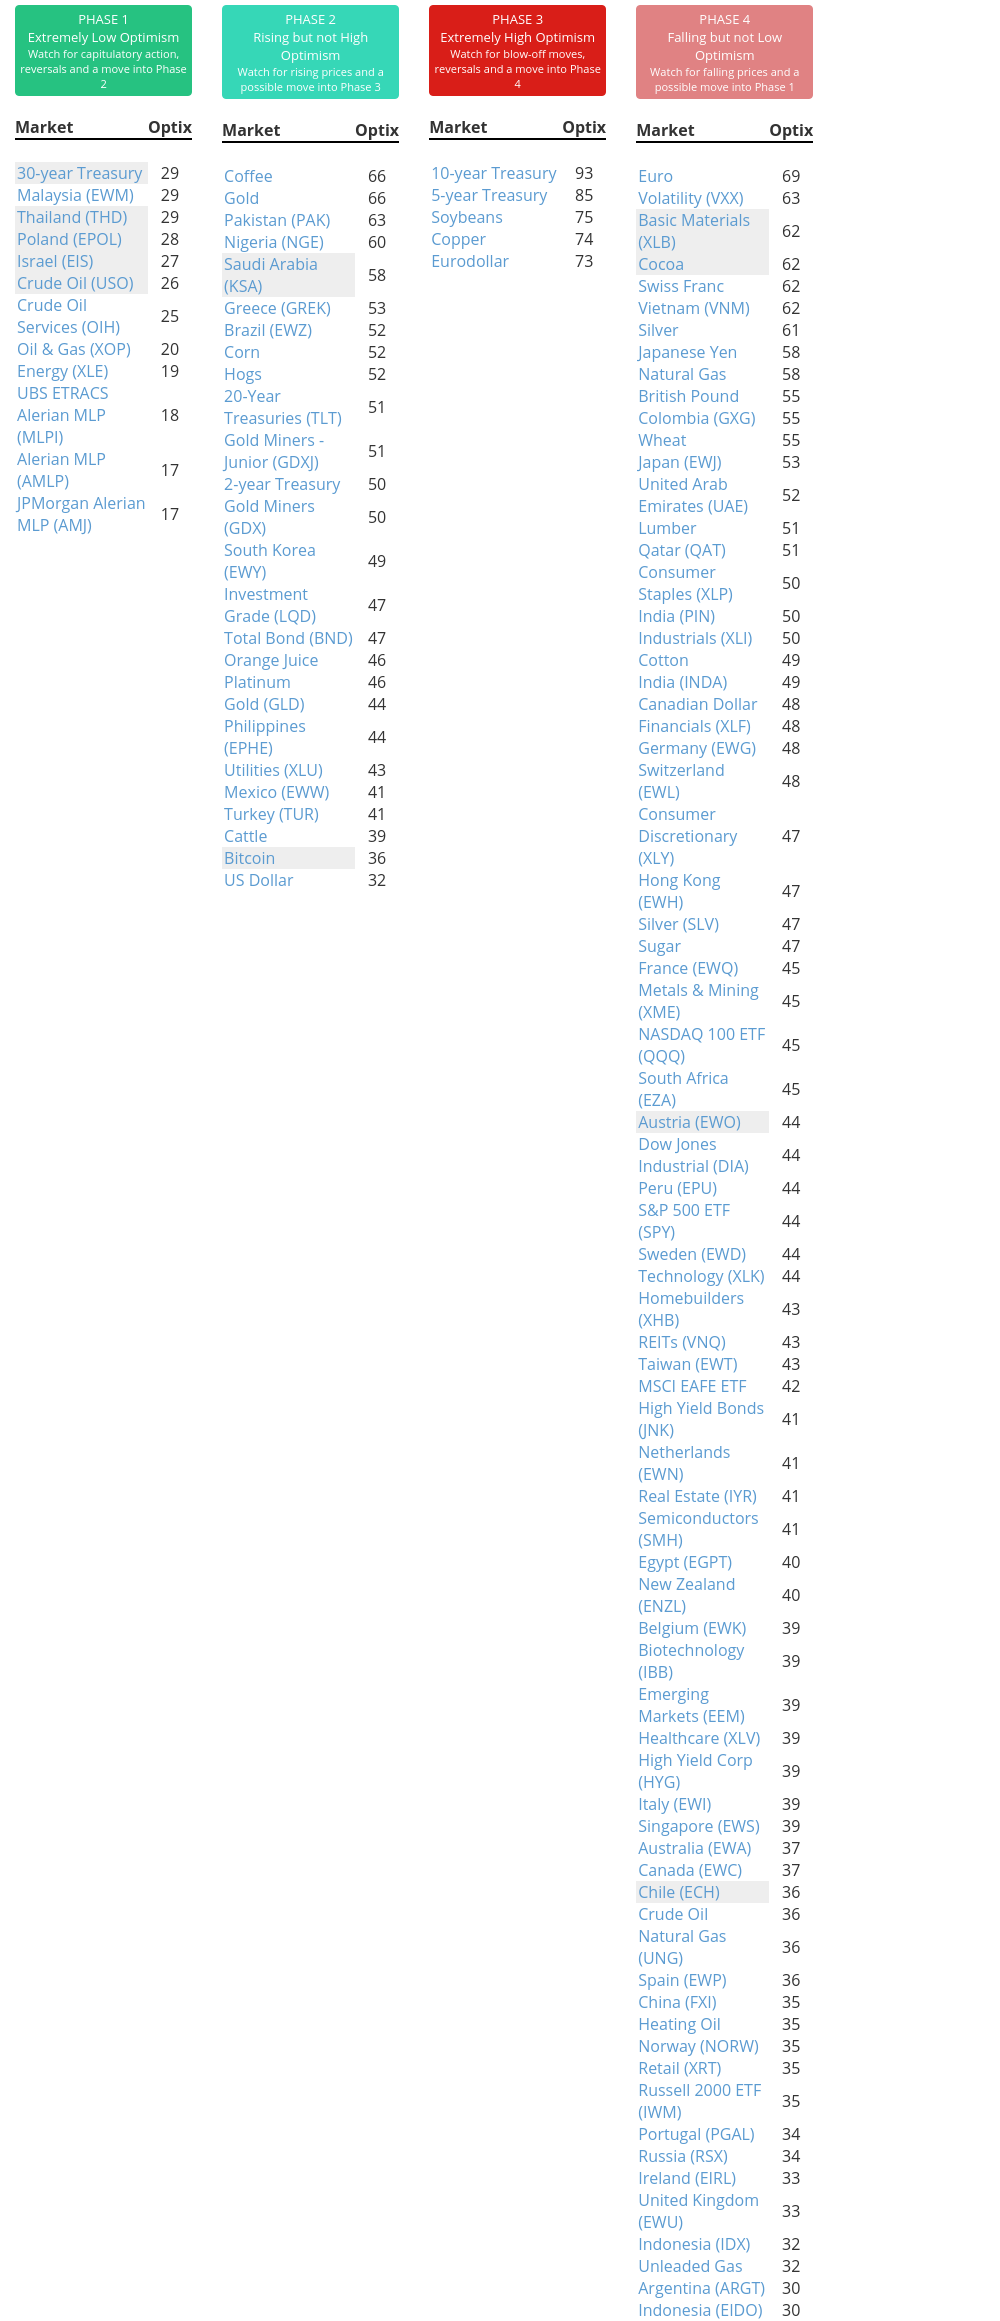
Phase Table
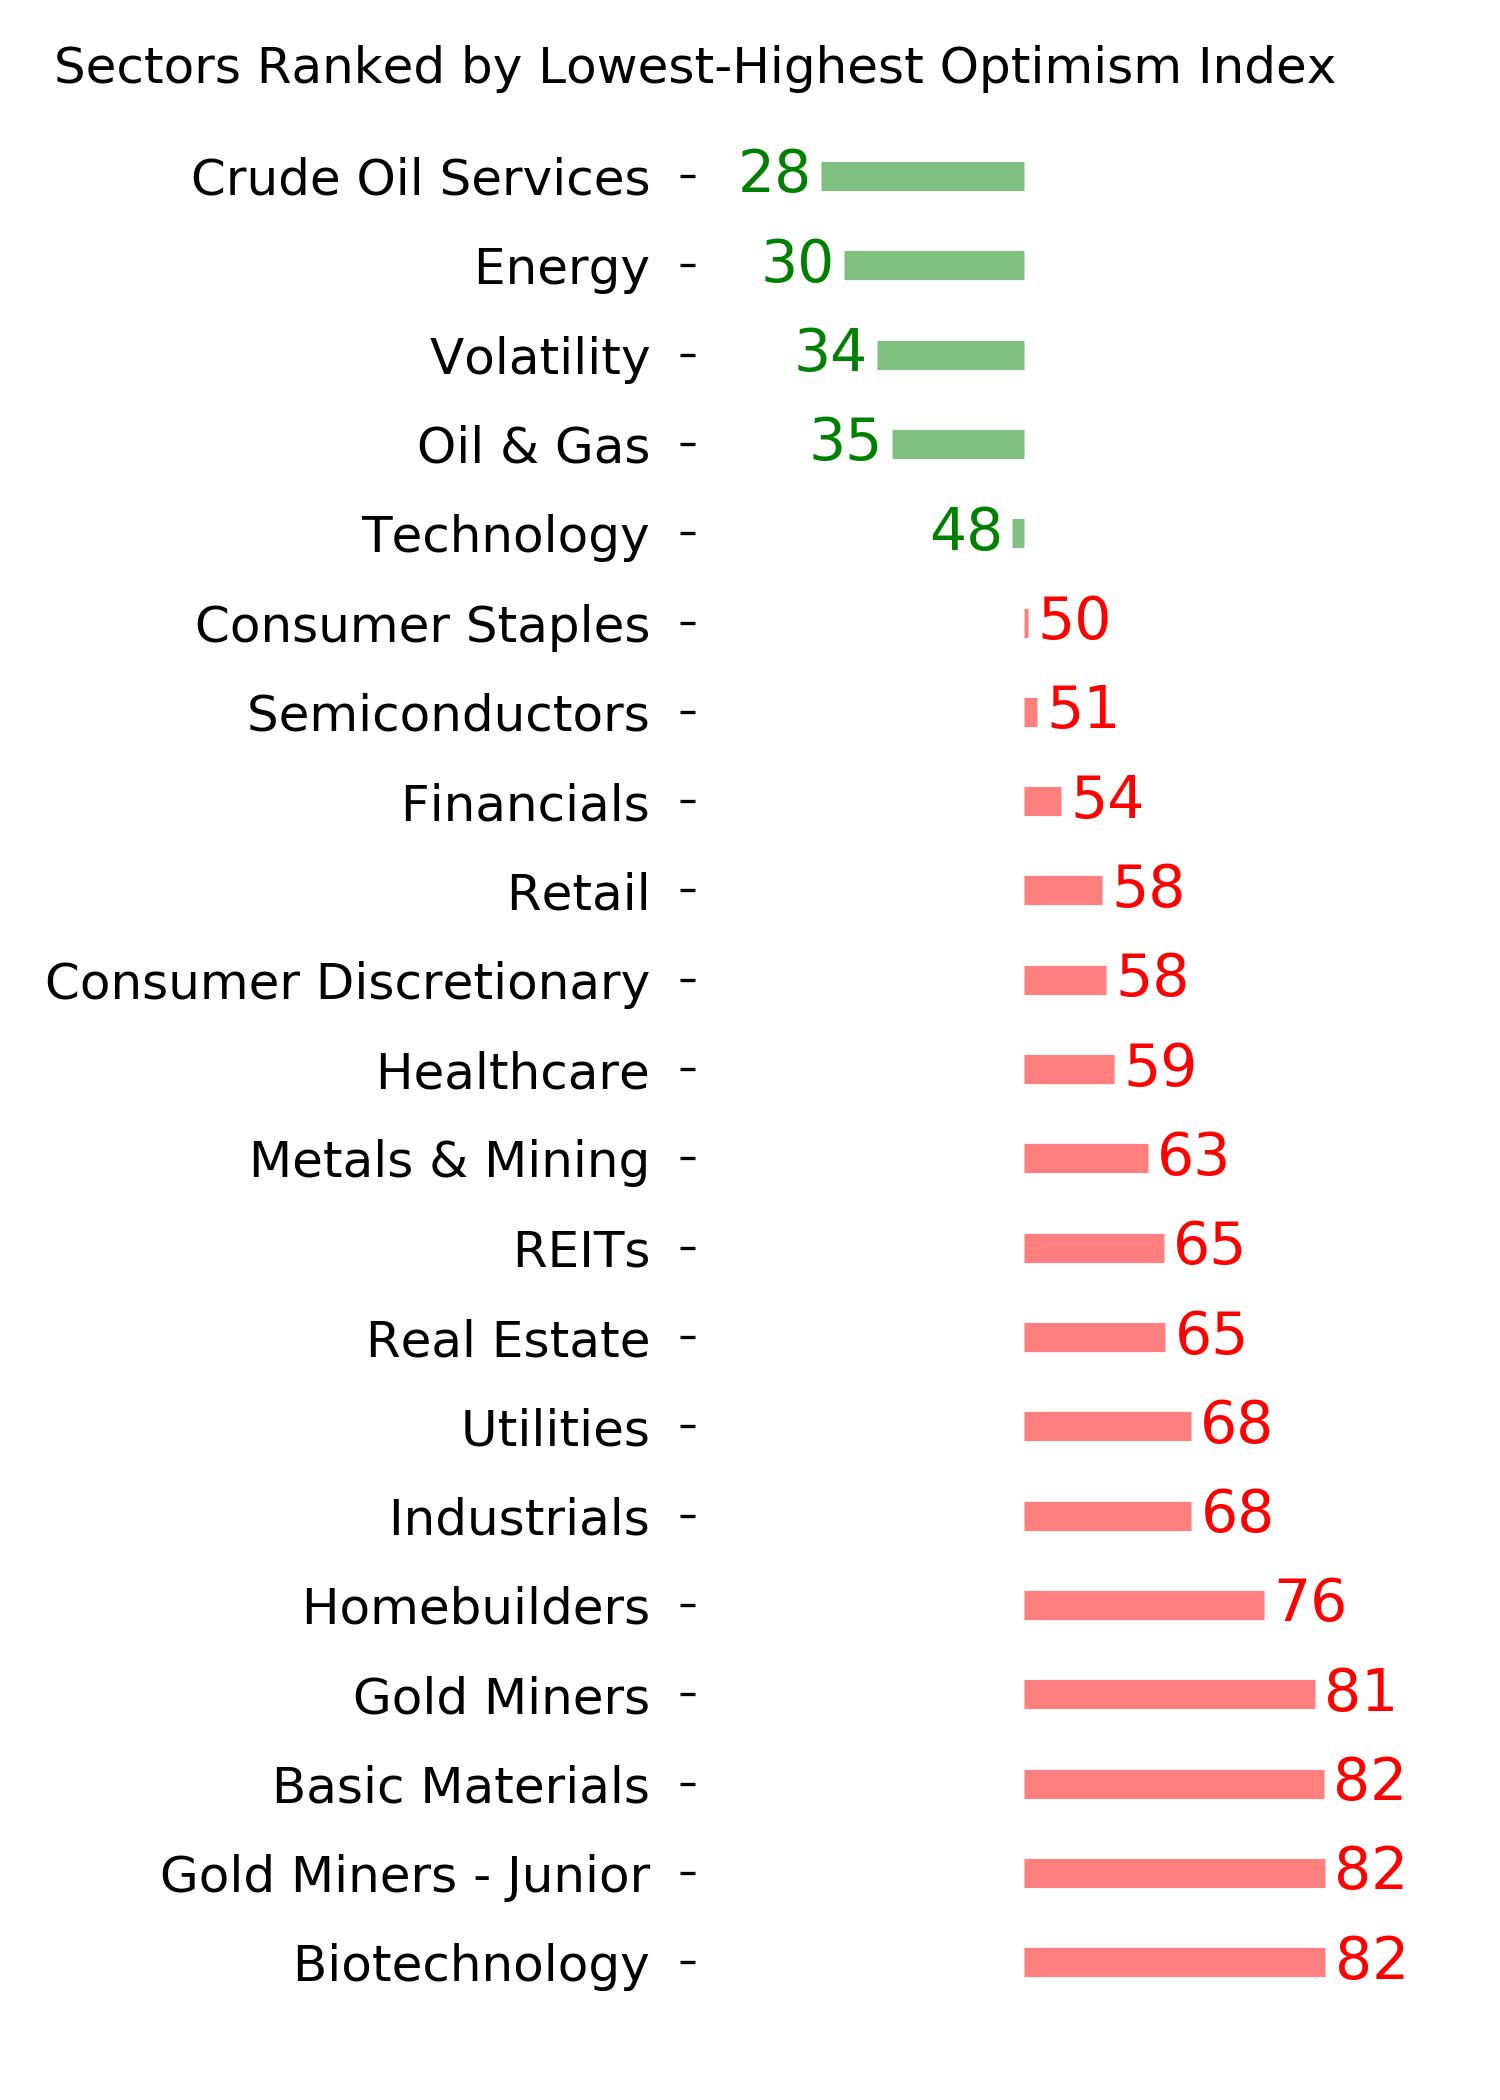
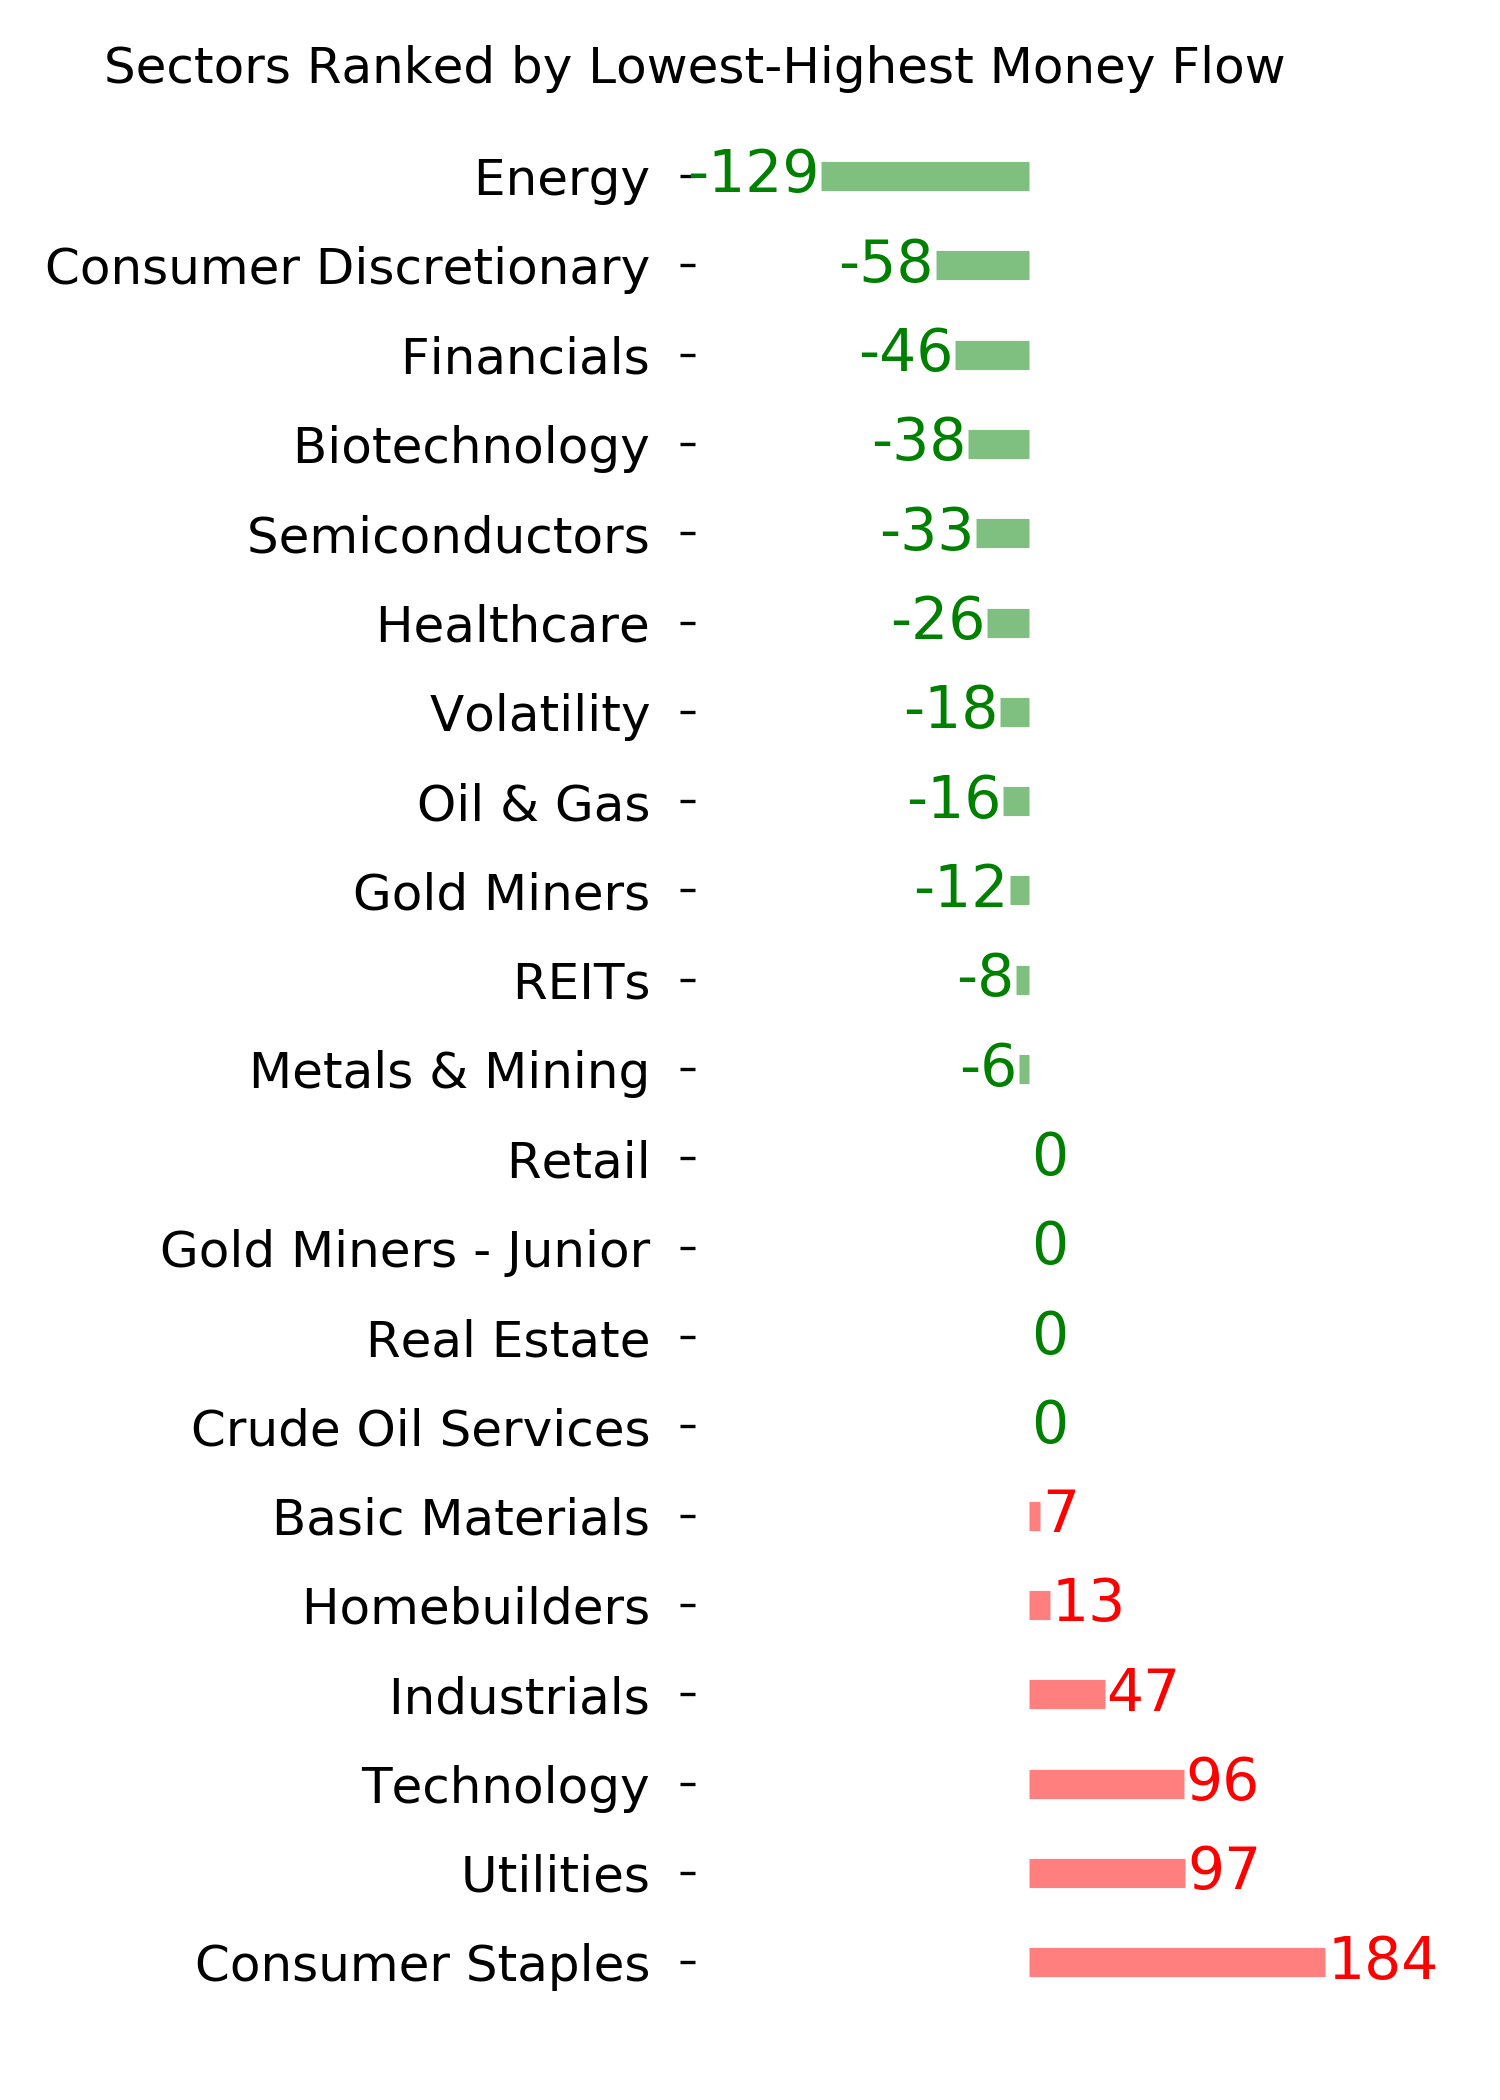
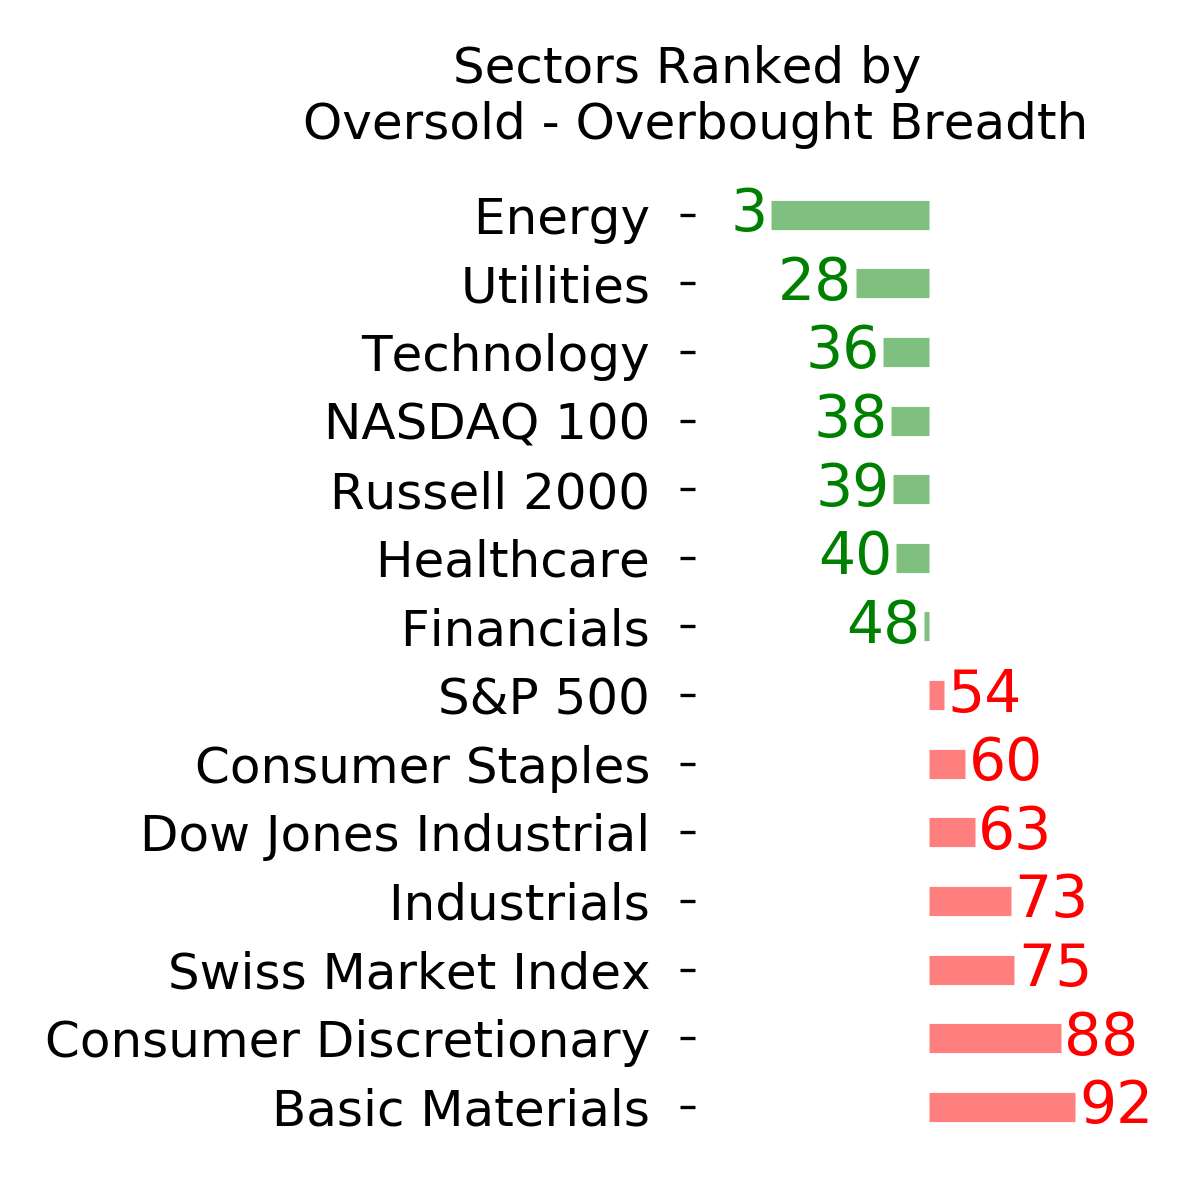
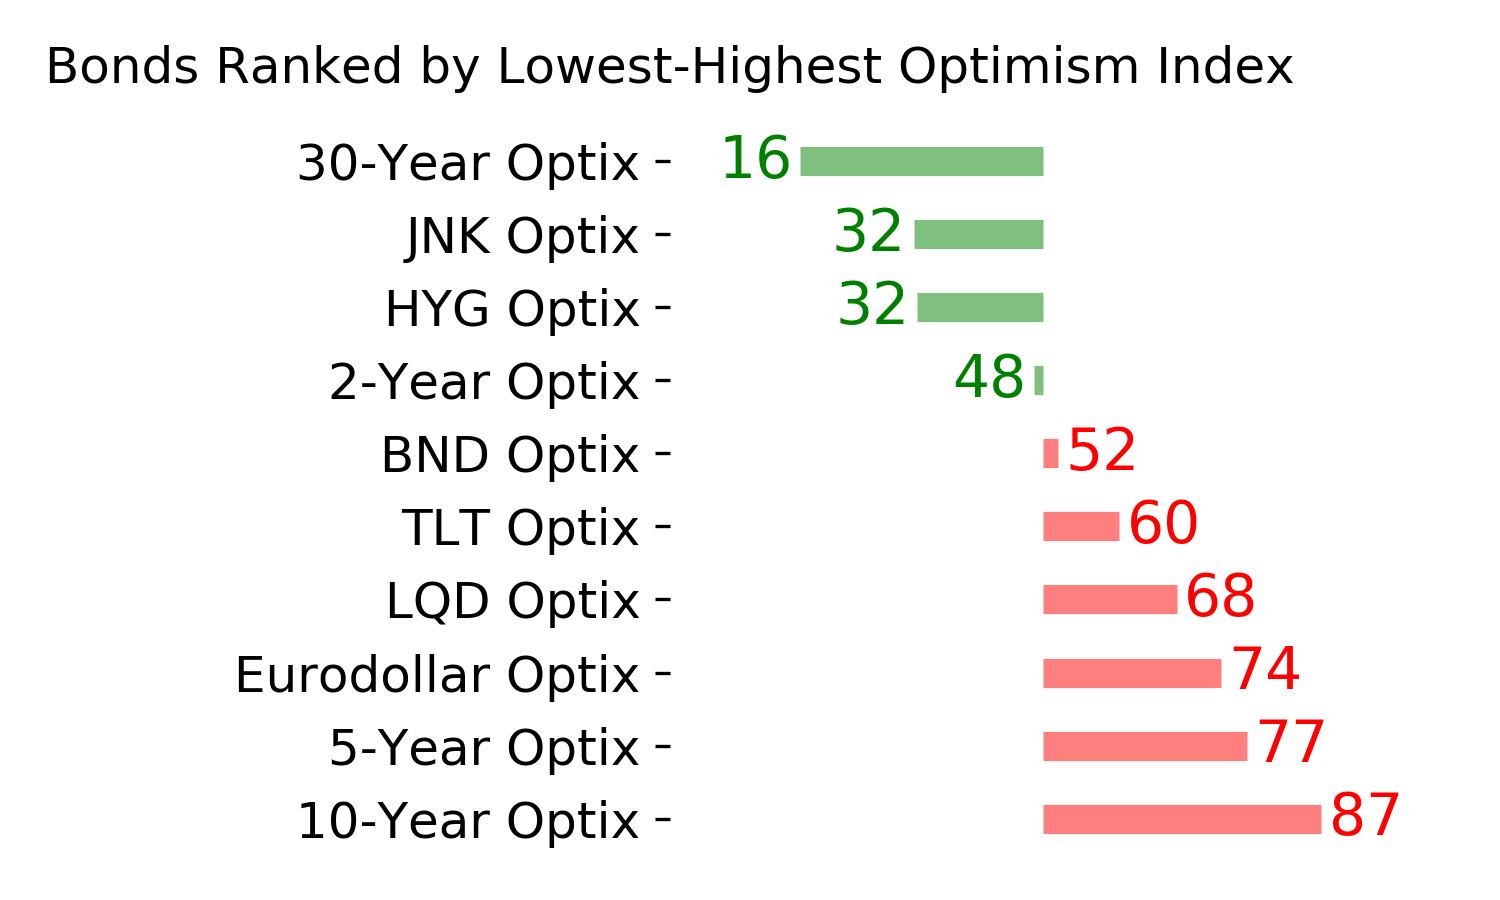
Ranks
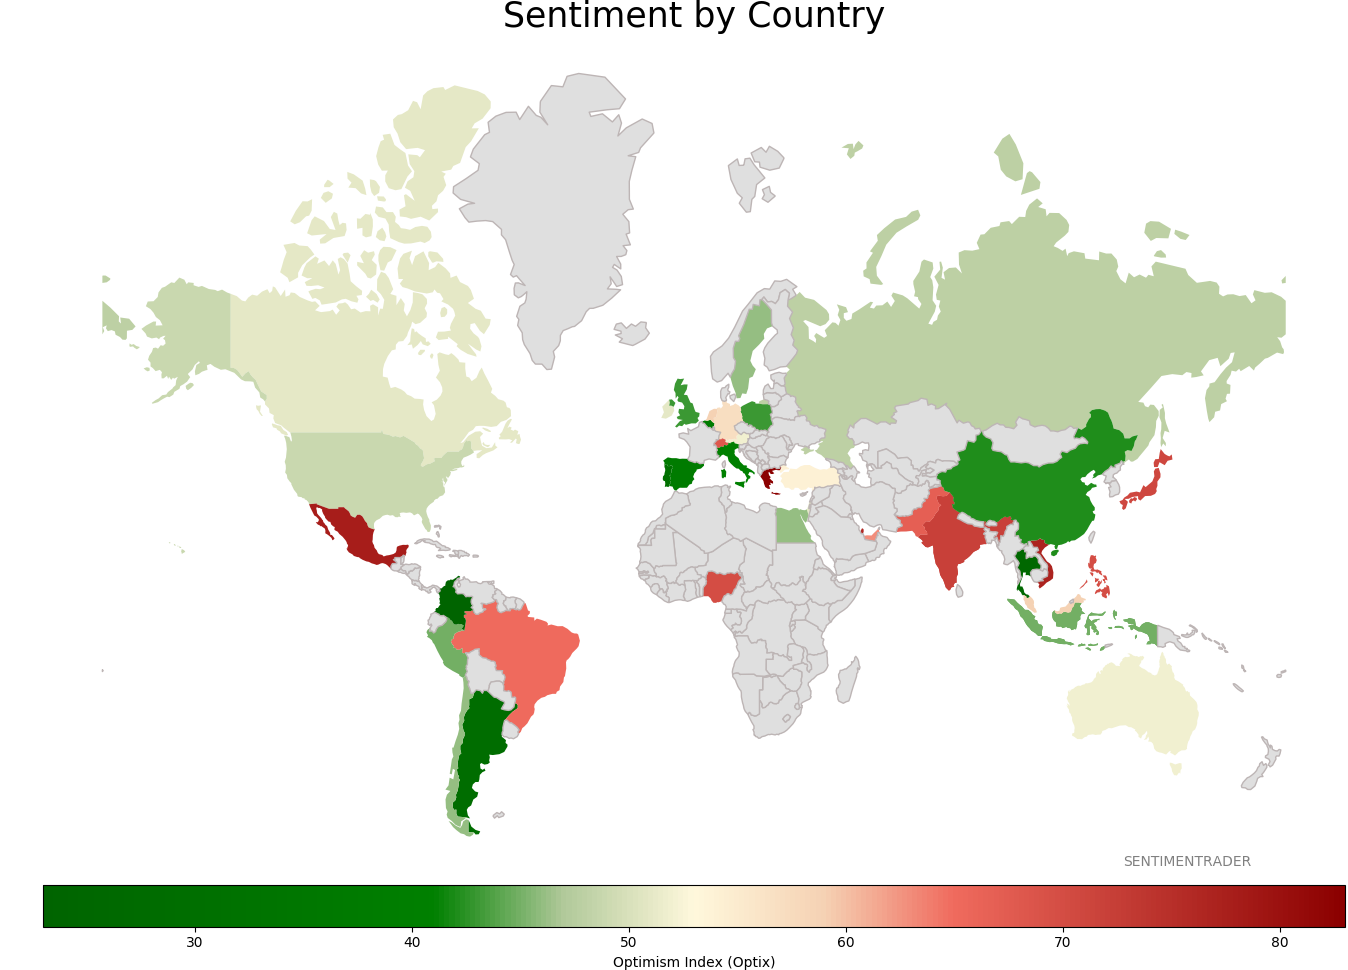
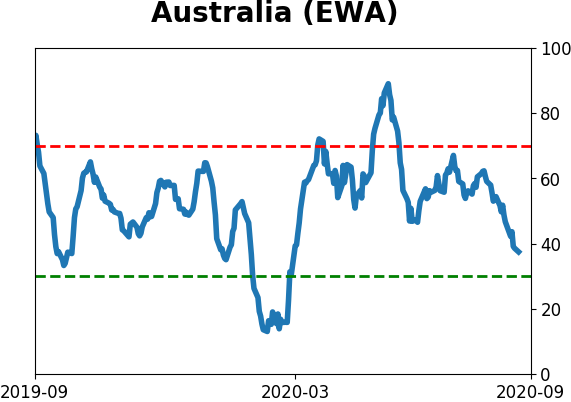
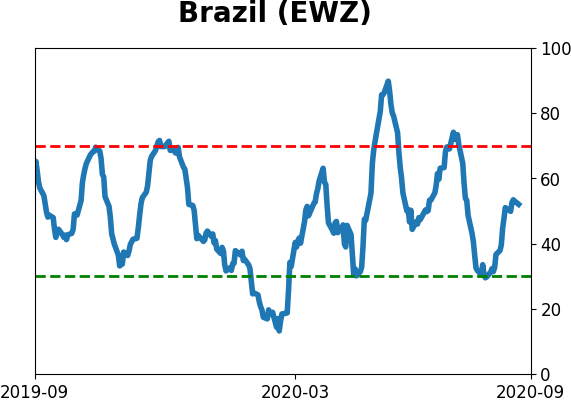
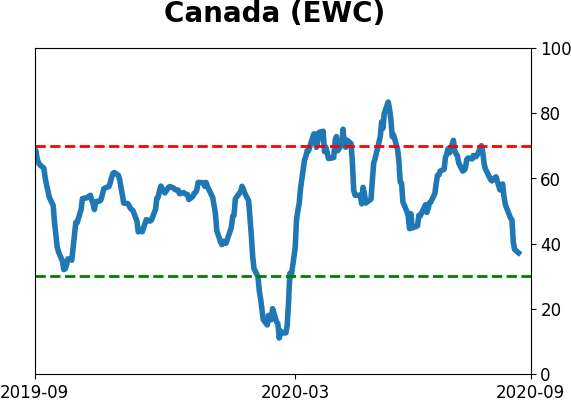
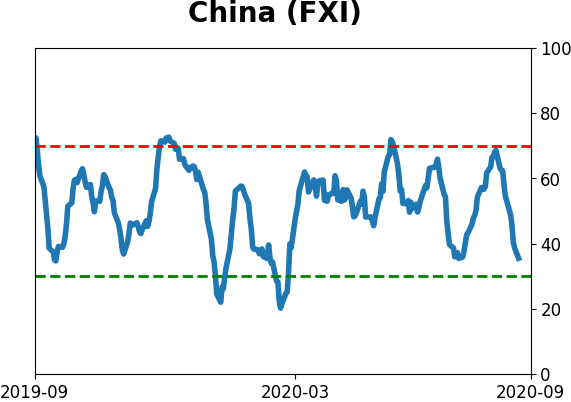
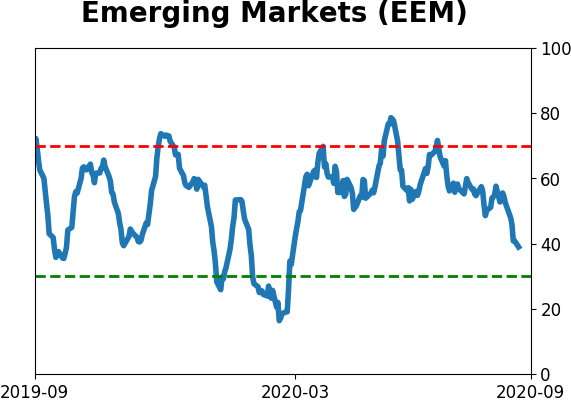
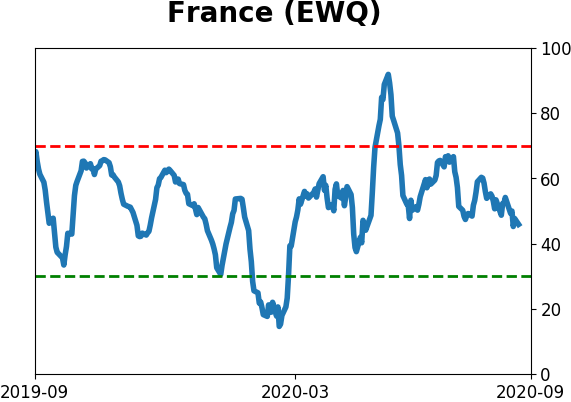
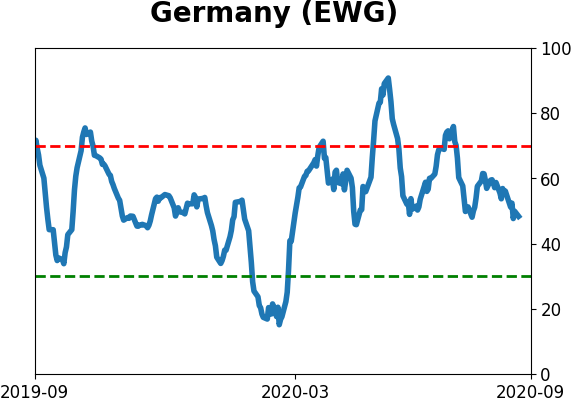
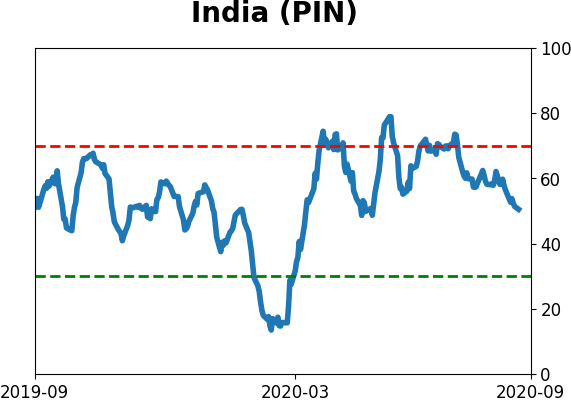
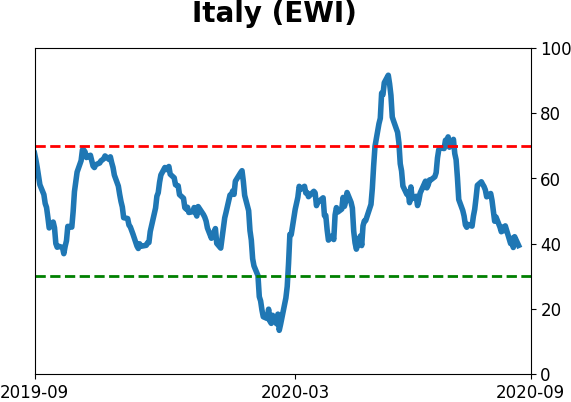
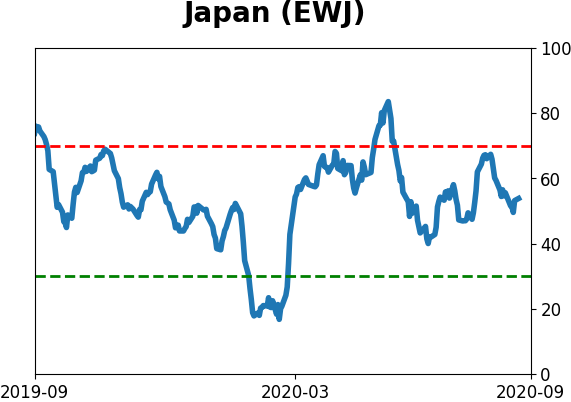
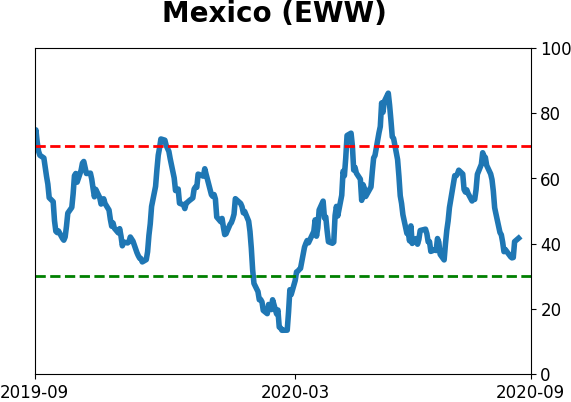
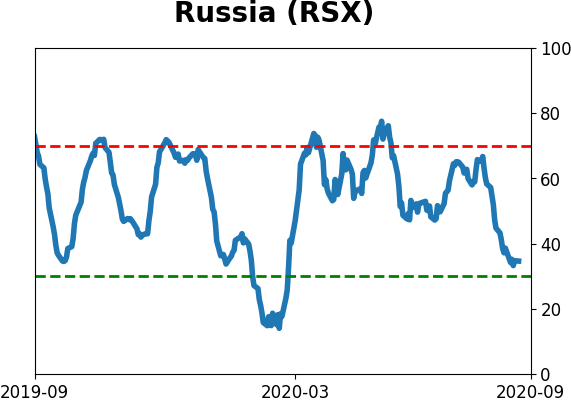
Sentiment Around The World
Optimism Index Thumbnails
|
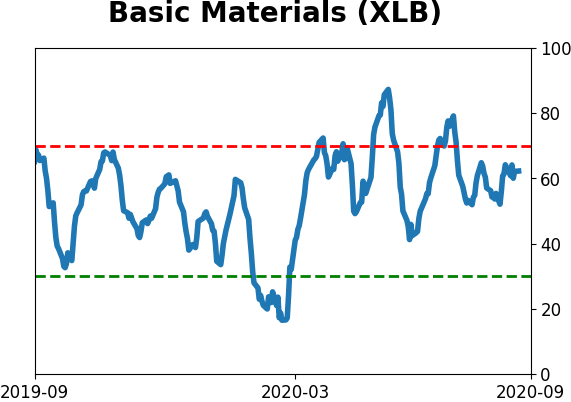
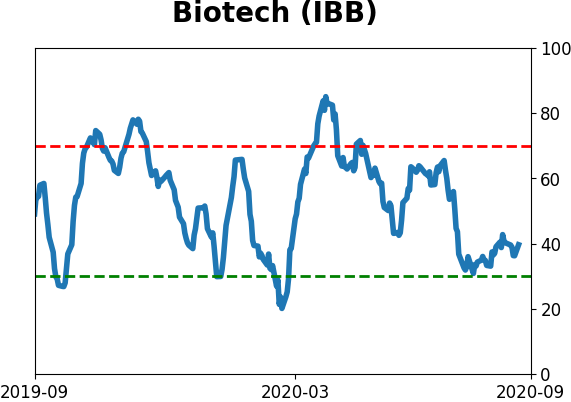
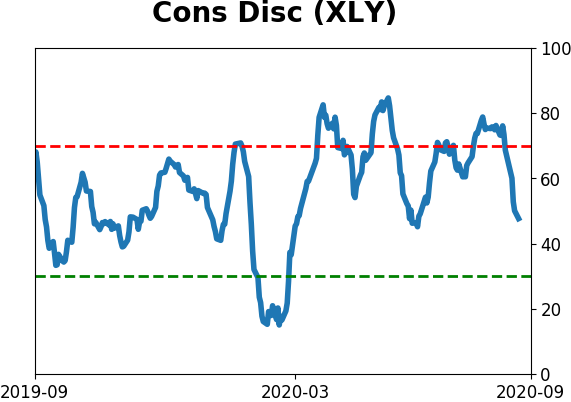
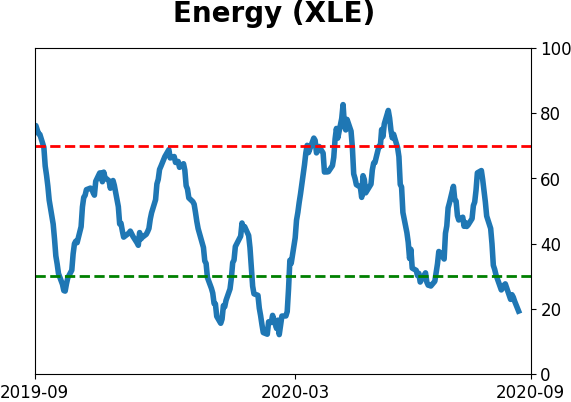
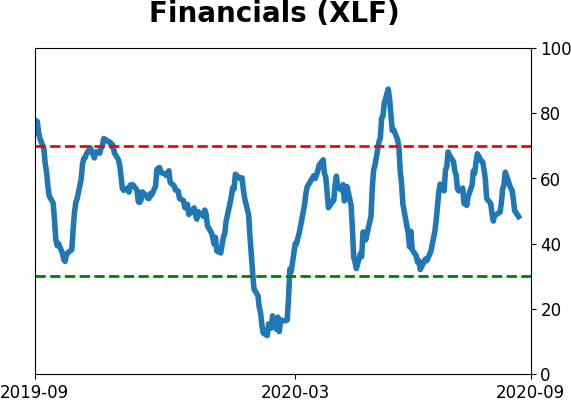
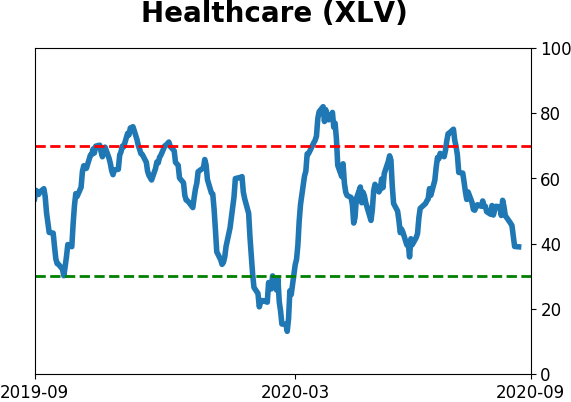
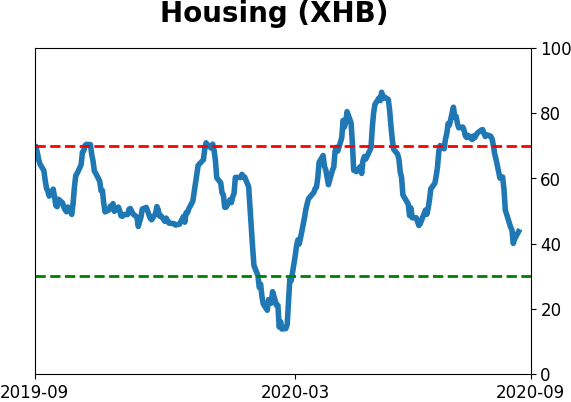
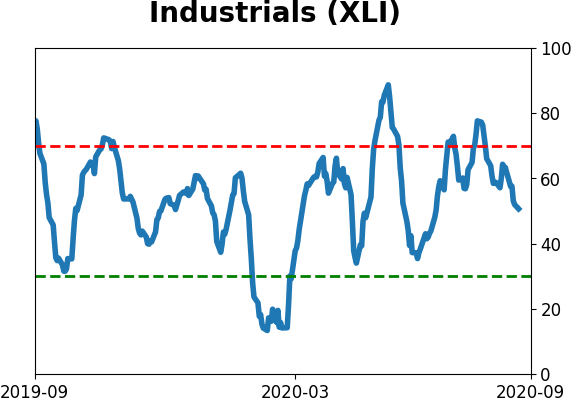
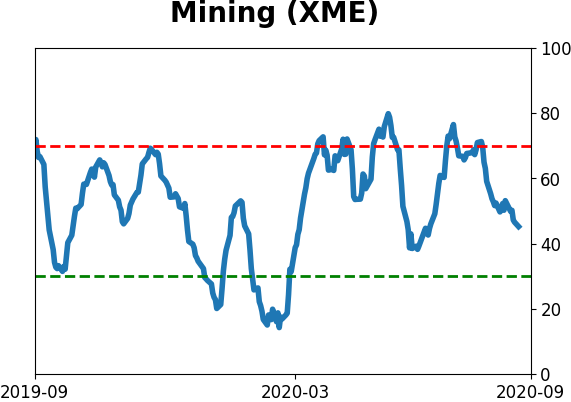
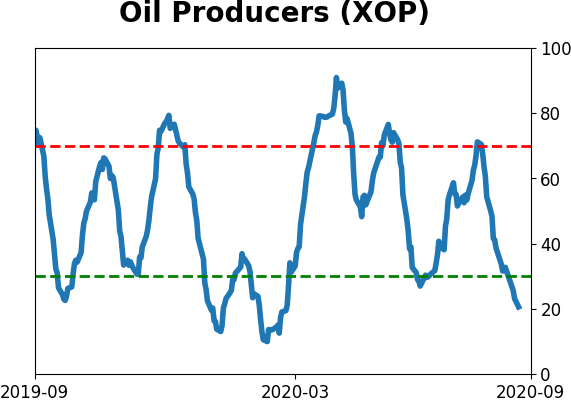
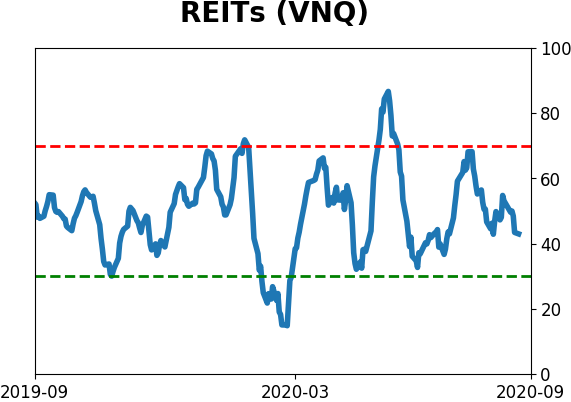
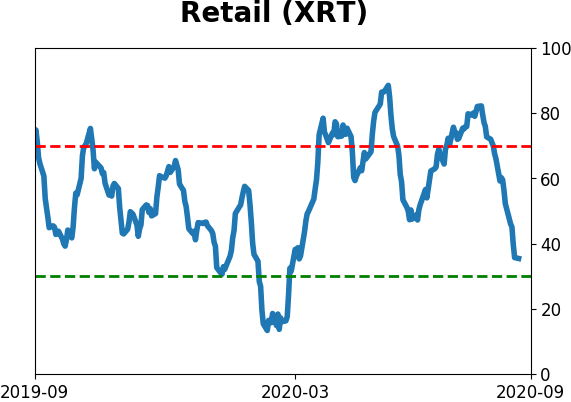
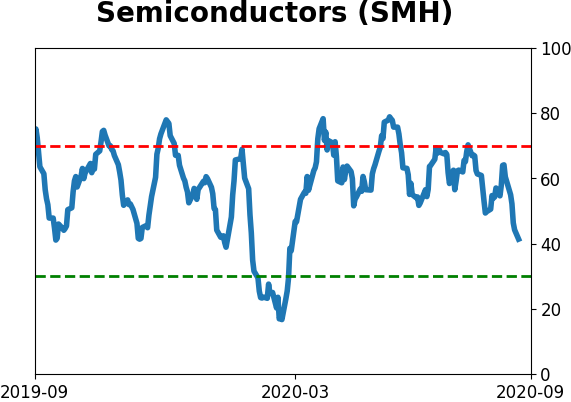
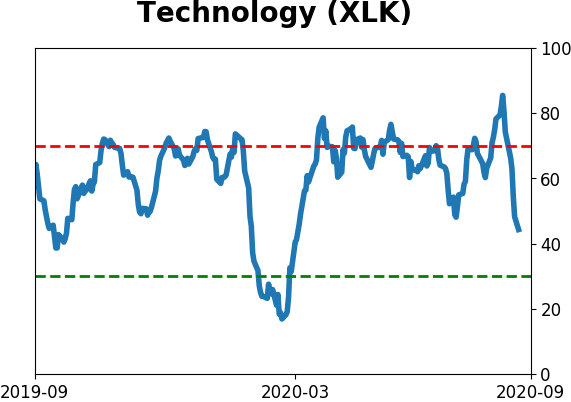
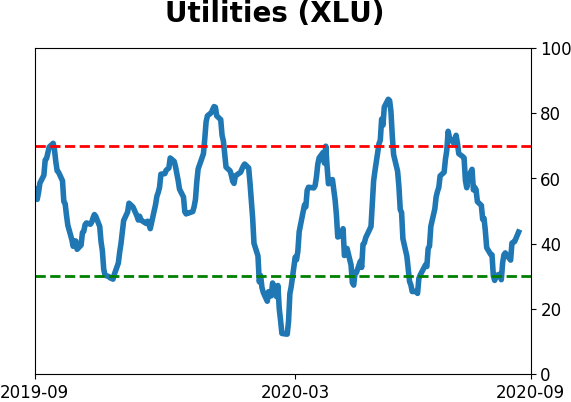
Sector ETF's - 10-Day Moving Average
|
|
|
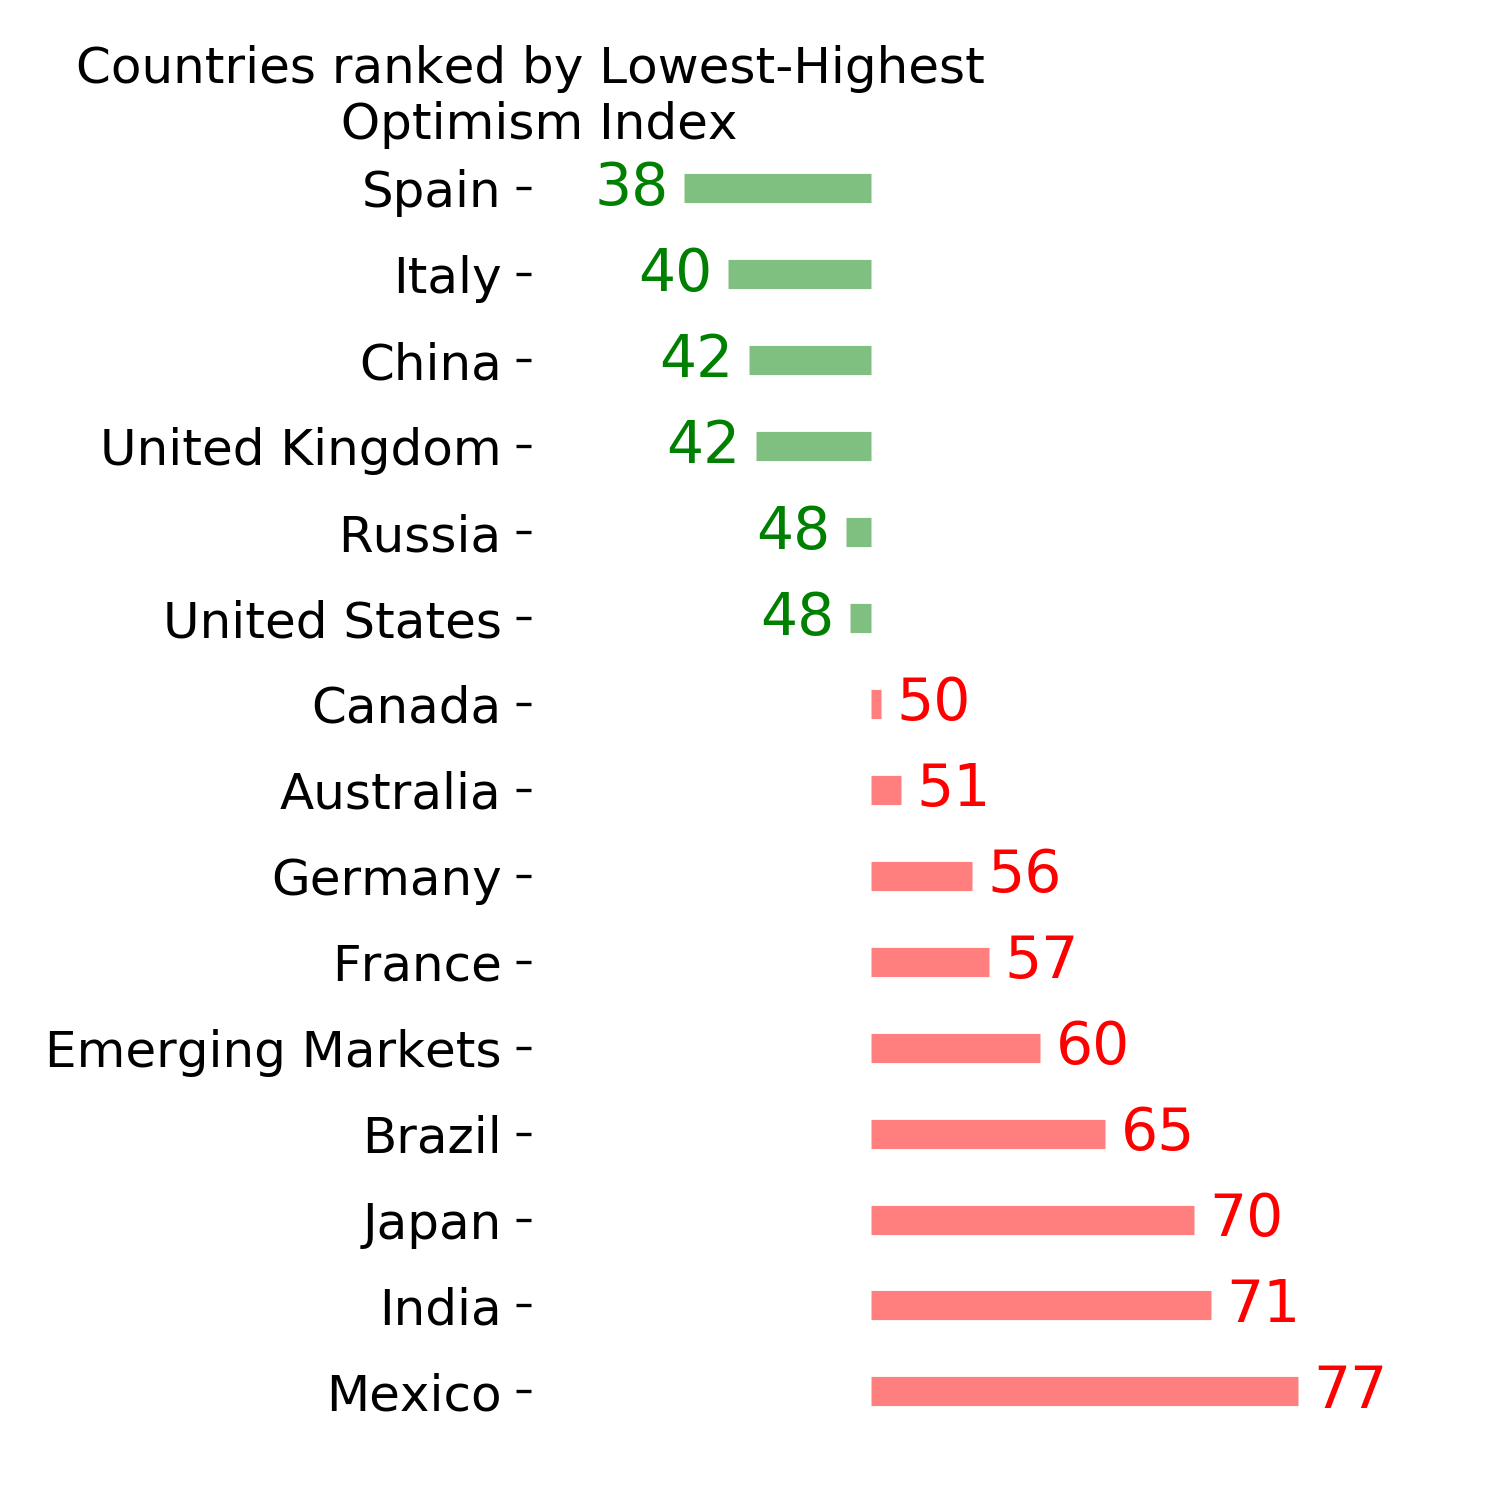
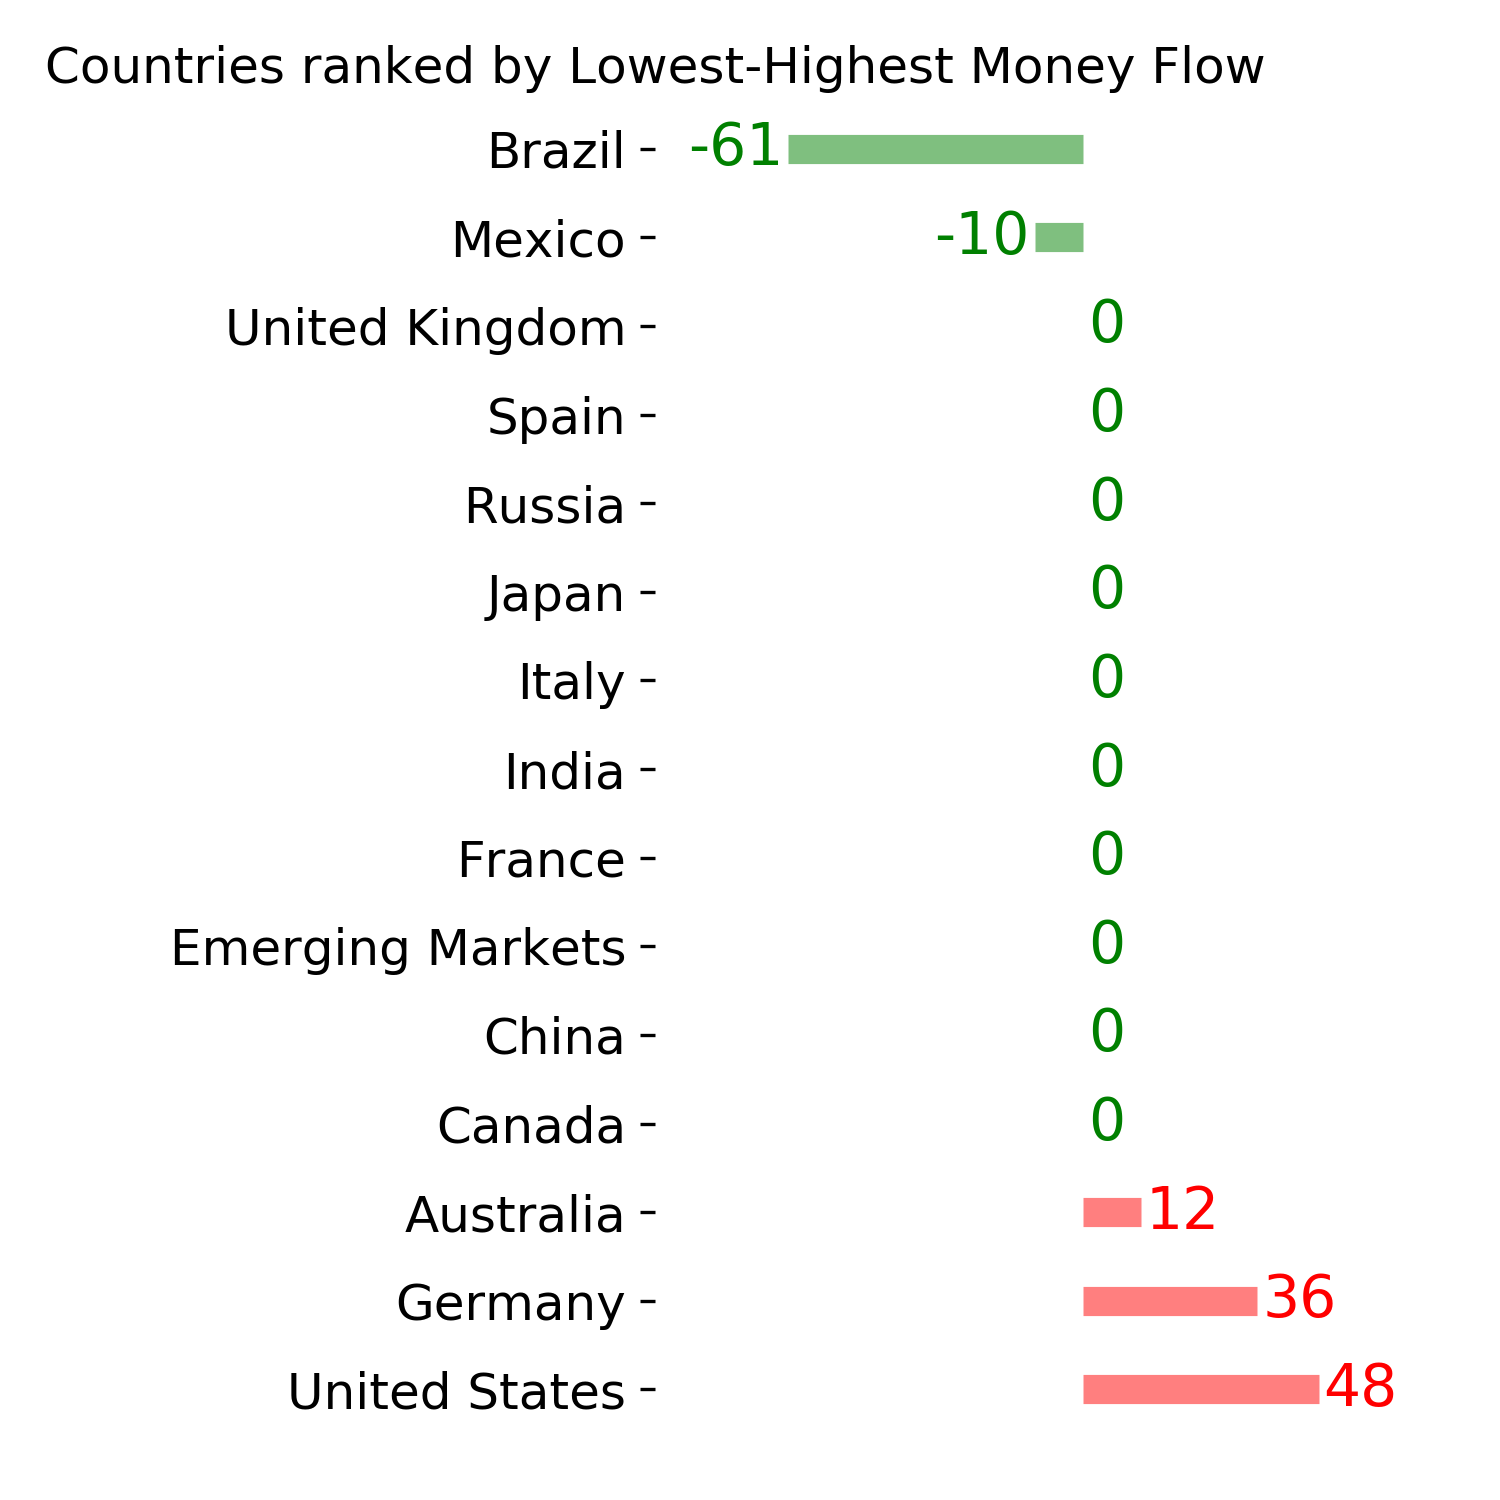
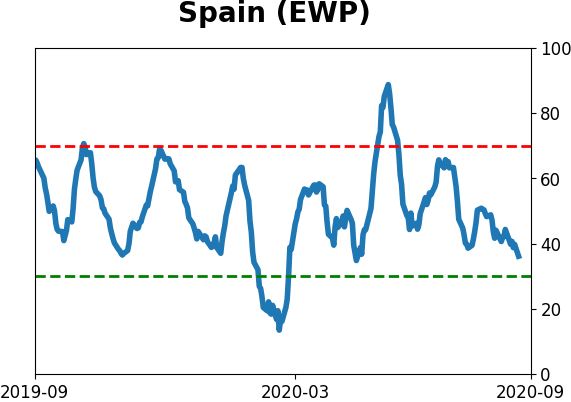
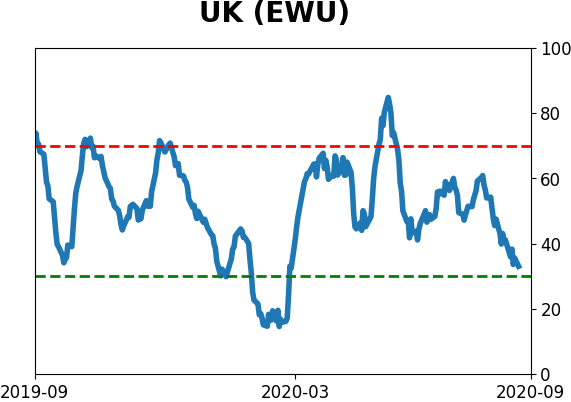
Country ETF's - 10-Day Moving Average
|
|
|
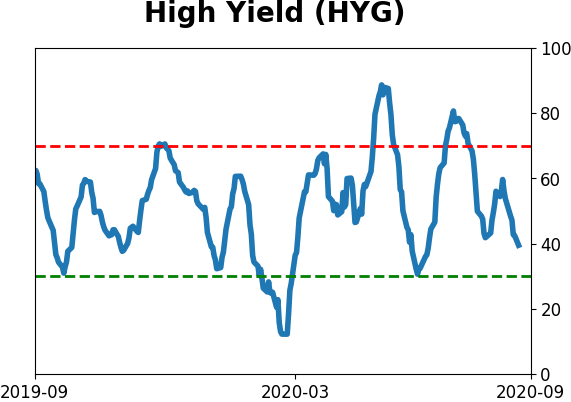
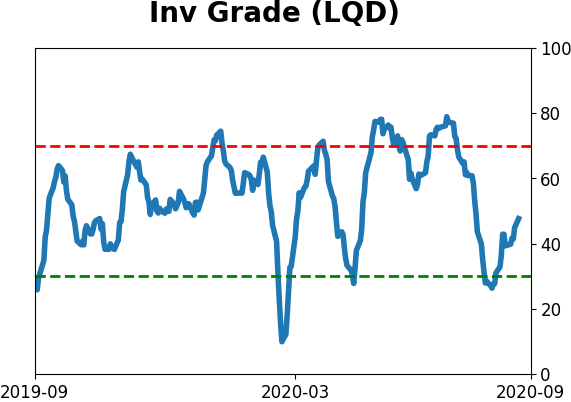
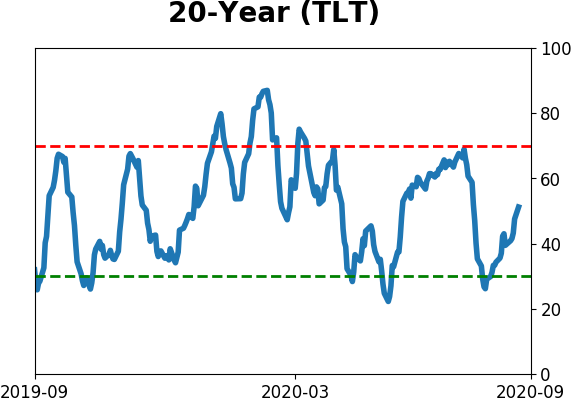
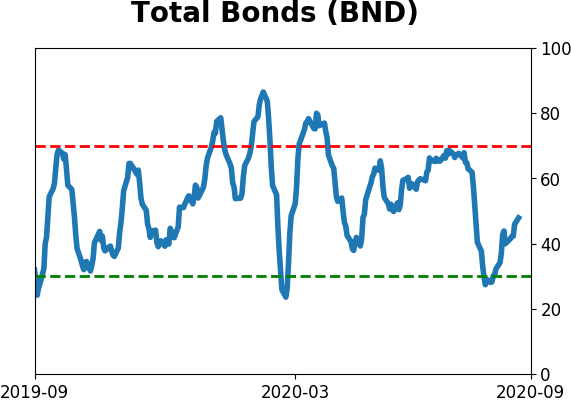
Bond ETF's - 10-Day Moving Average
|
|
|
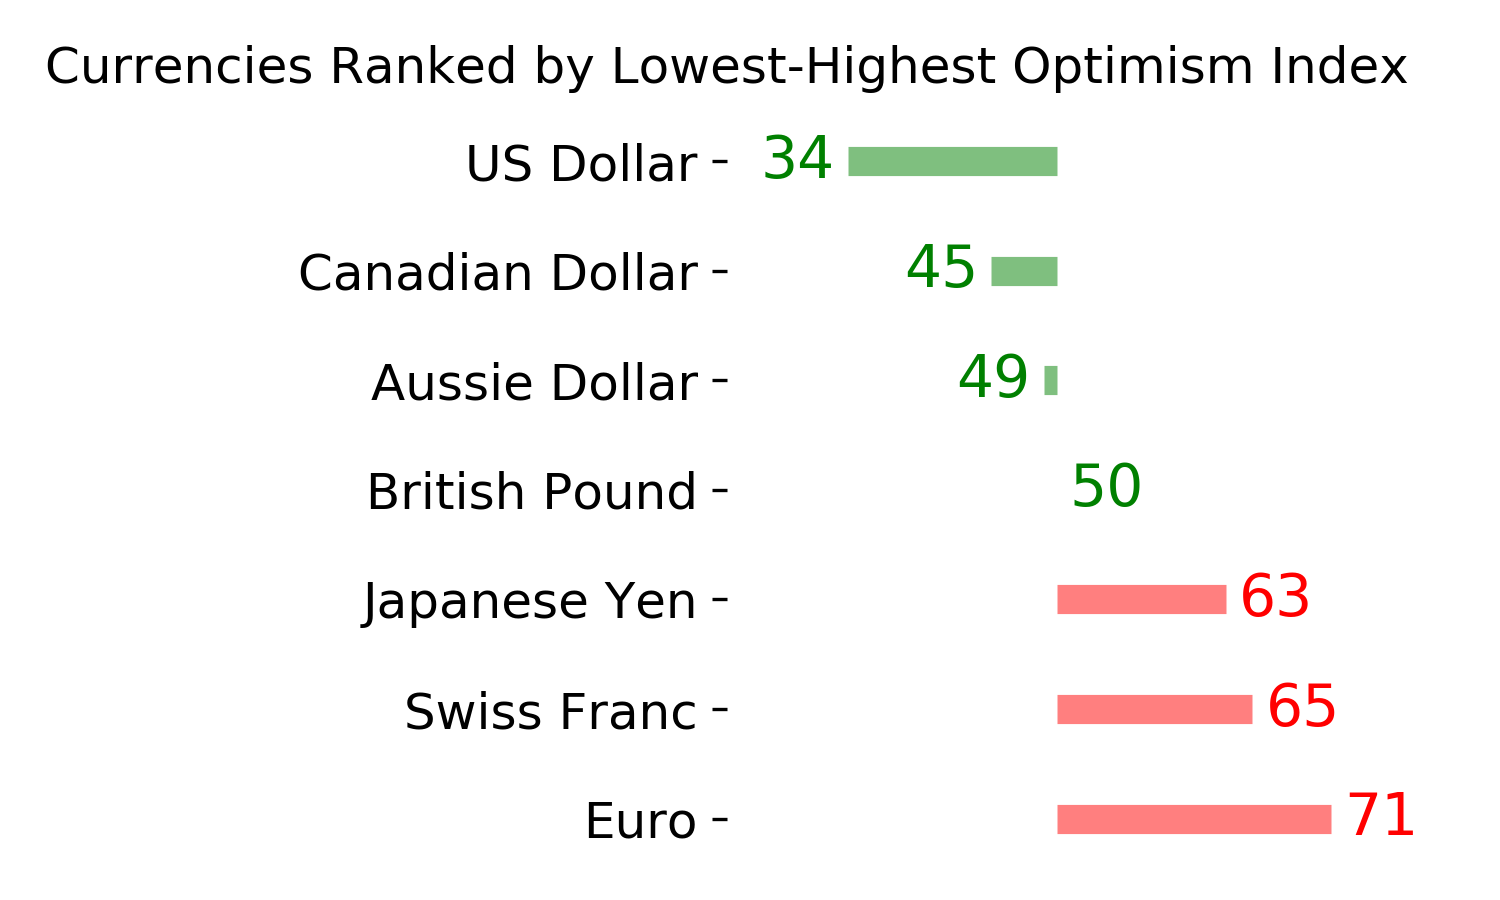
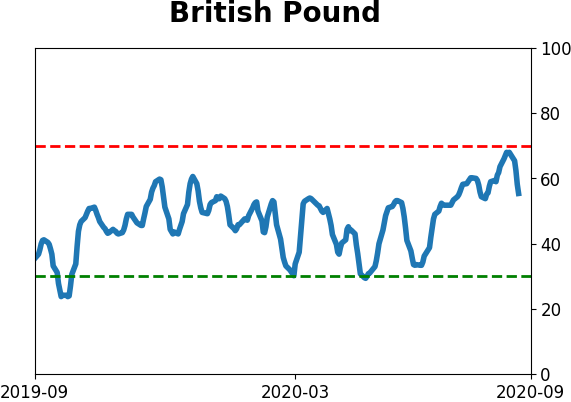
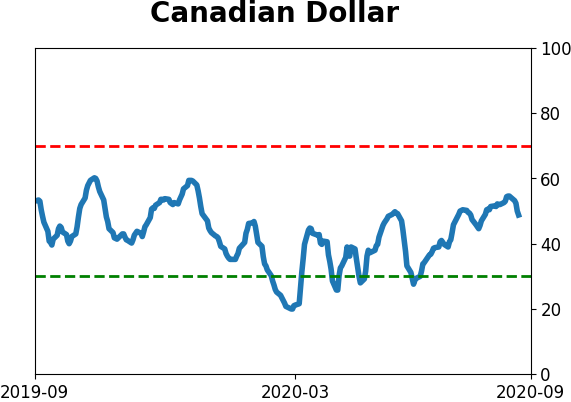
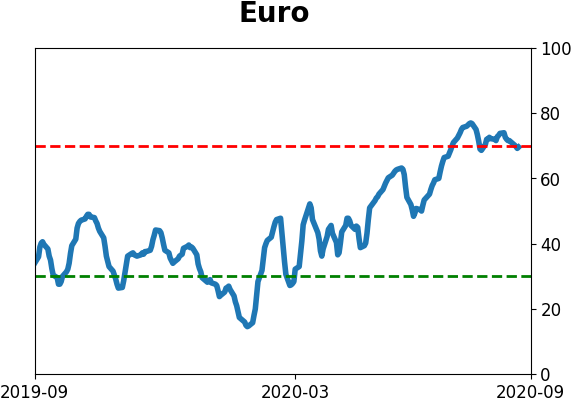
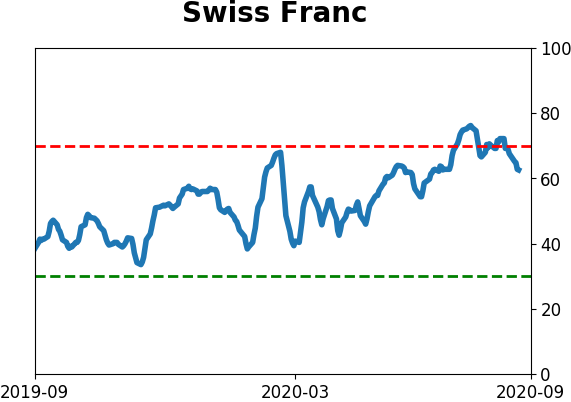
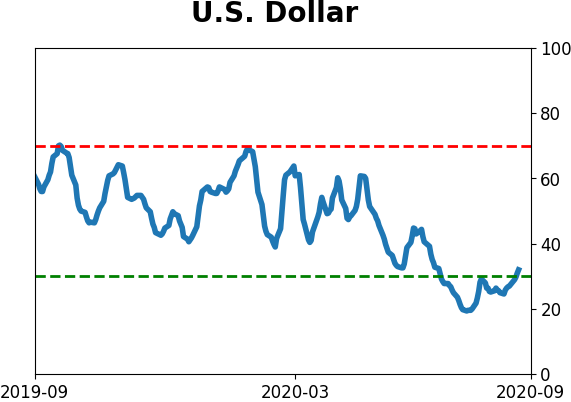
Currency ETF's - 5-Day Moving Average
|
|
|
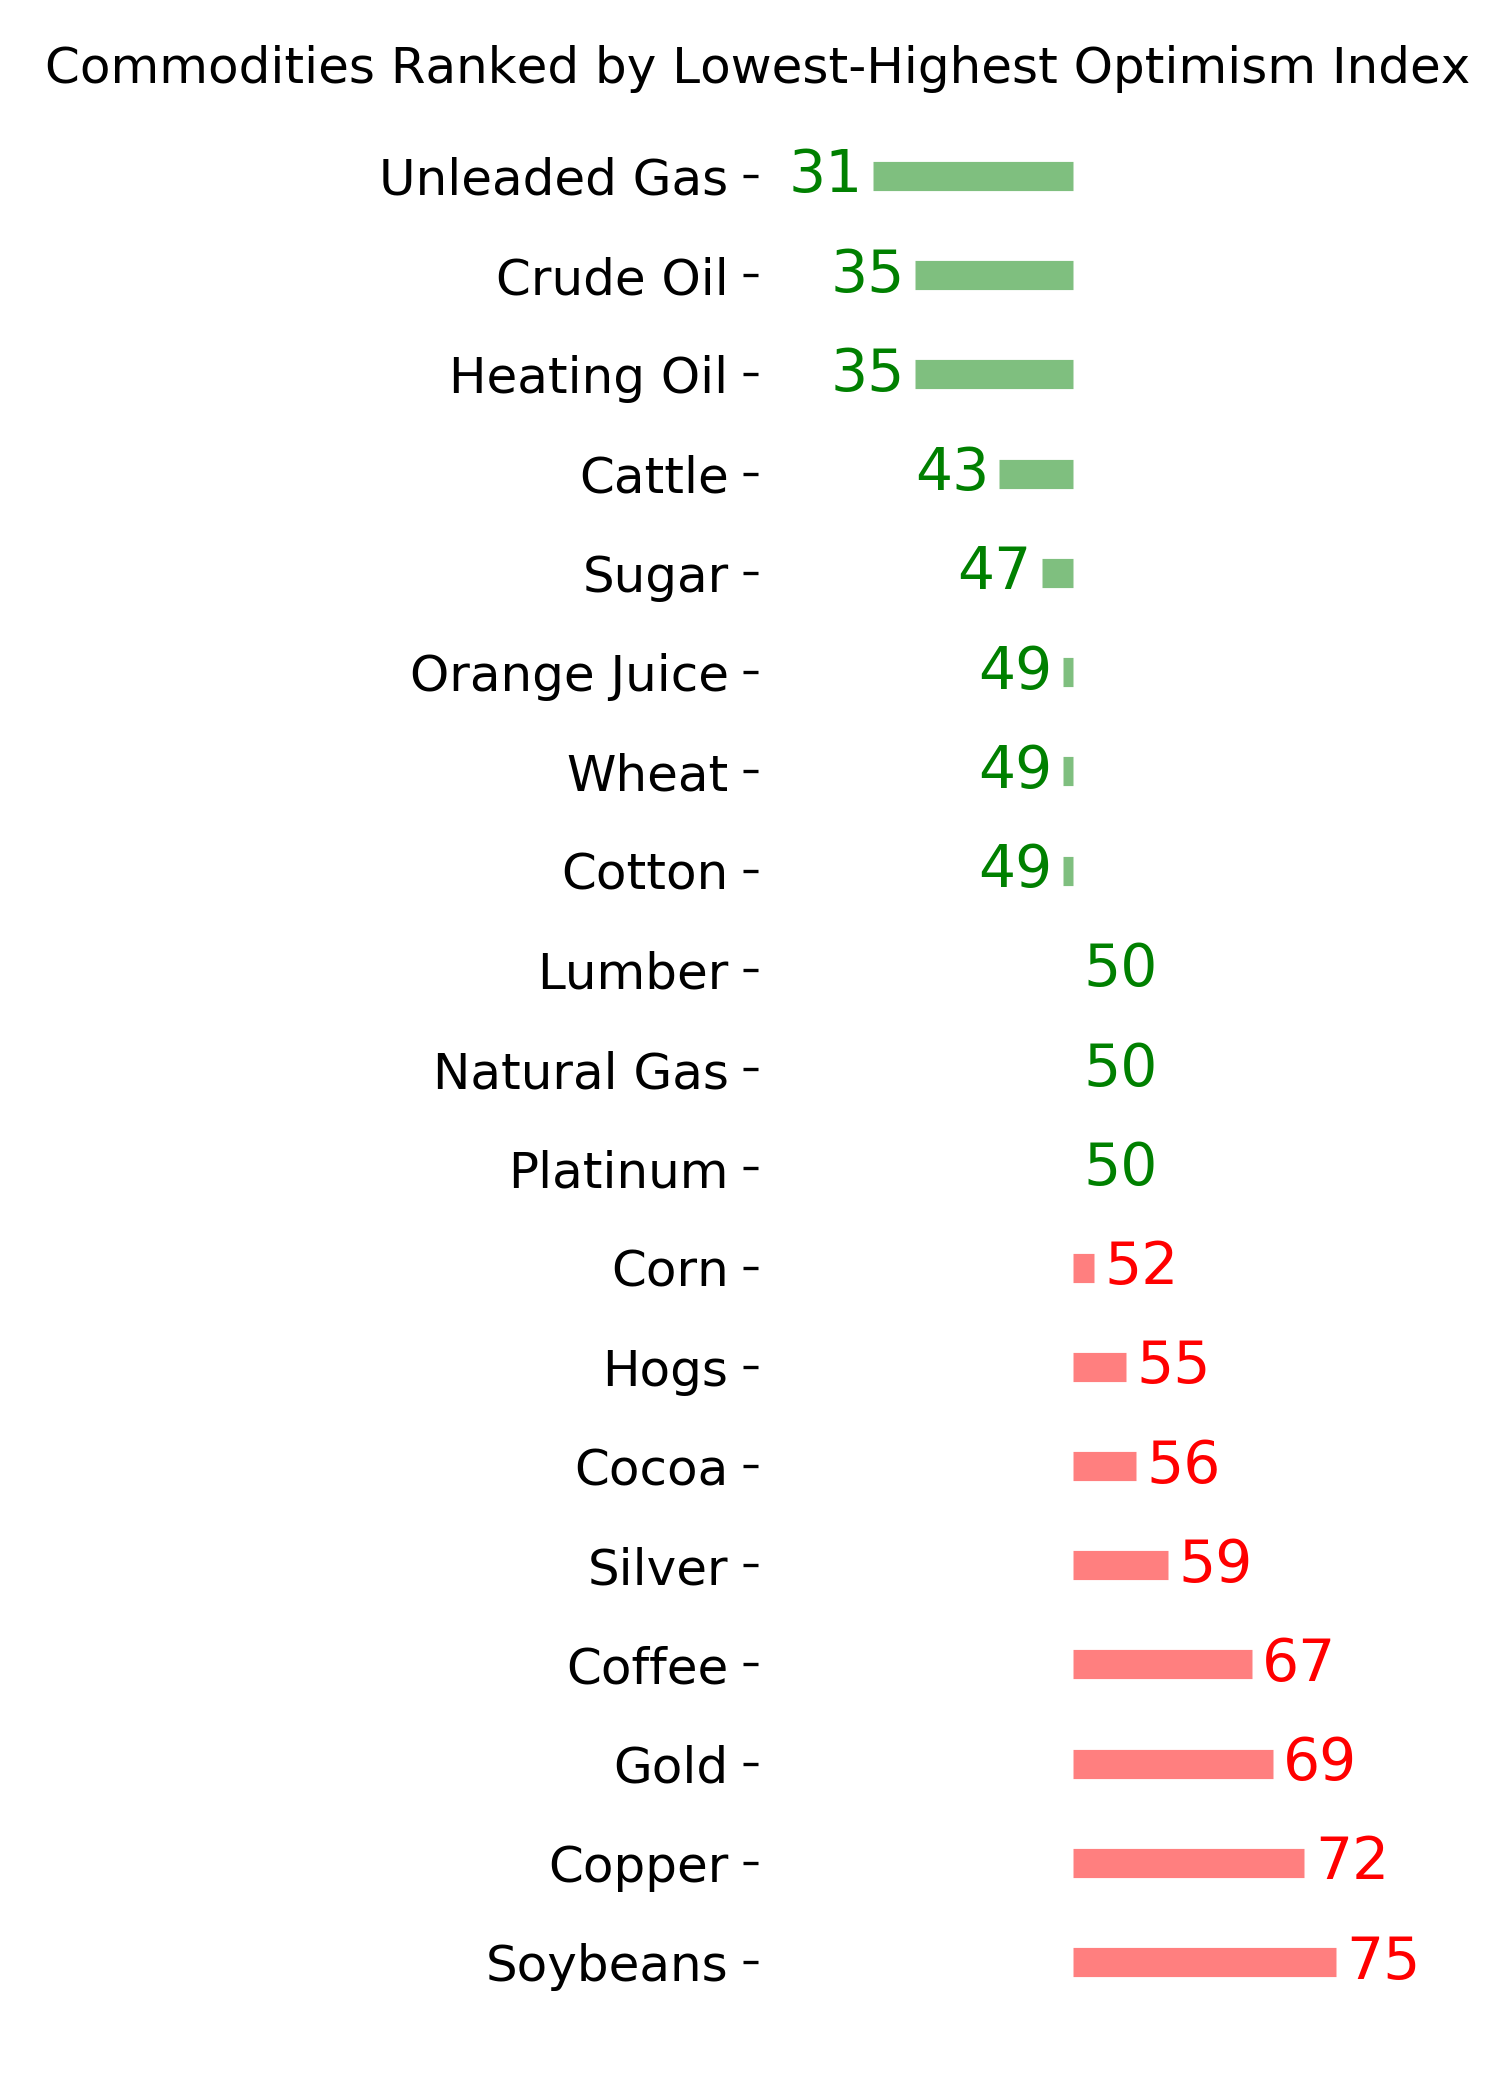
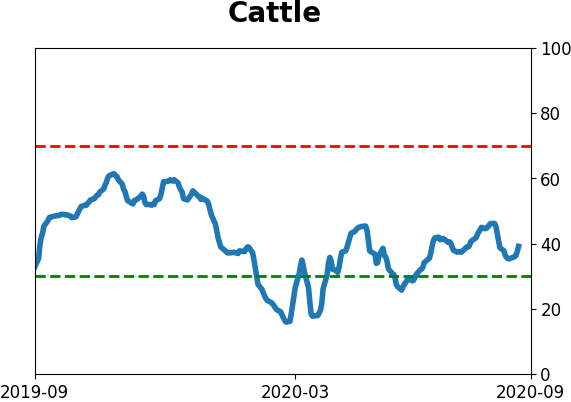
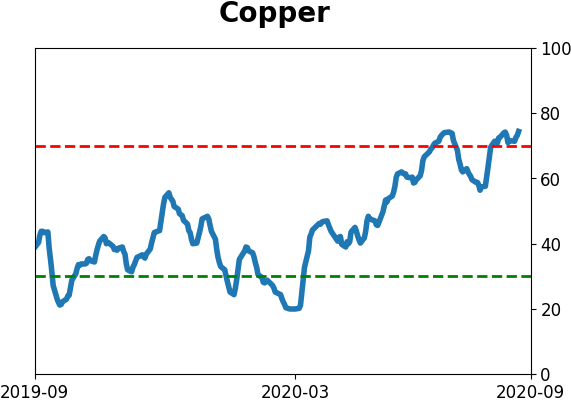
Commodity ETF's - 5-Day Moving Average
|
|