Headlines
|
|
The Nasdaq's momentum bubble gets pricked:
The Nasdaq's momentum has ebbed, with the Composite index falling into its fastest-ever correction. This has ended some streaks of positive price action, and its underlying breadth is now negative on a longer-term basis but already stretched enough short-term to be oversold.
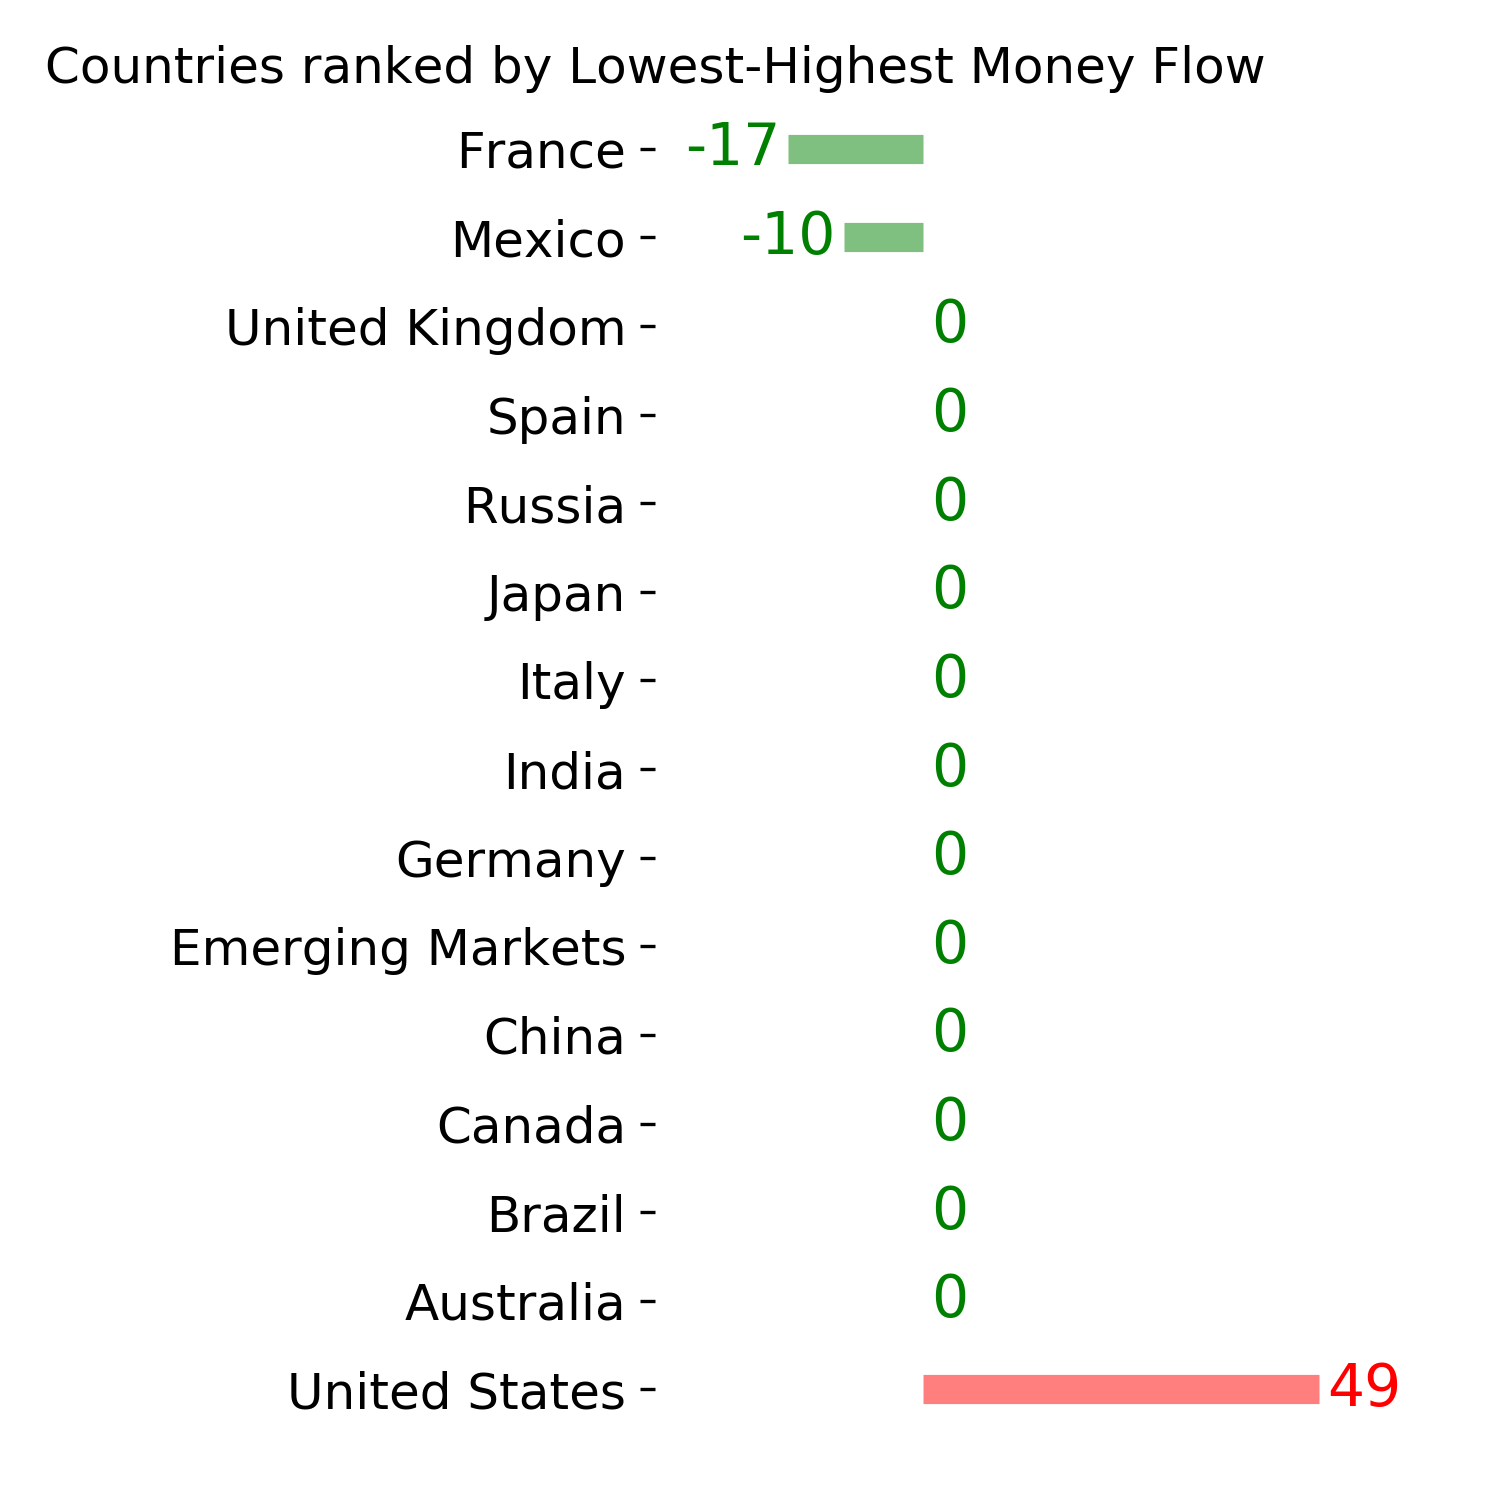
More overseas outflow: One of the more consistent themes this year has been the lack of interest in fund investors for anything overseas. In May and July, we saw how extreme this has been over a prolonged period. It continued into early September, with more than $10 billion flowing out of overseas mutual and exchange-traded funds. The Backtest Engine shows only 4 other weeks with this large of an outflow (2008-01-23, 2008-10-08, 2008-10-15, and 2020-03-25). The first and last preceded almost immediate rallies, while the October 2008 signals were too early. At least it's a sign there is still little enthusiasm for non-domestic stocks.
Bottom Line:
|
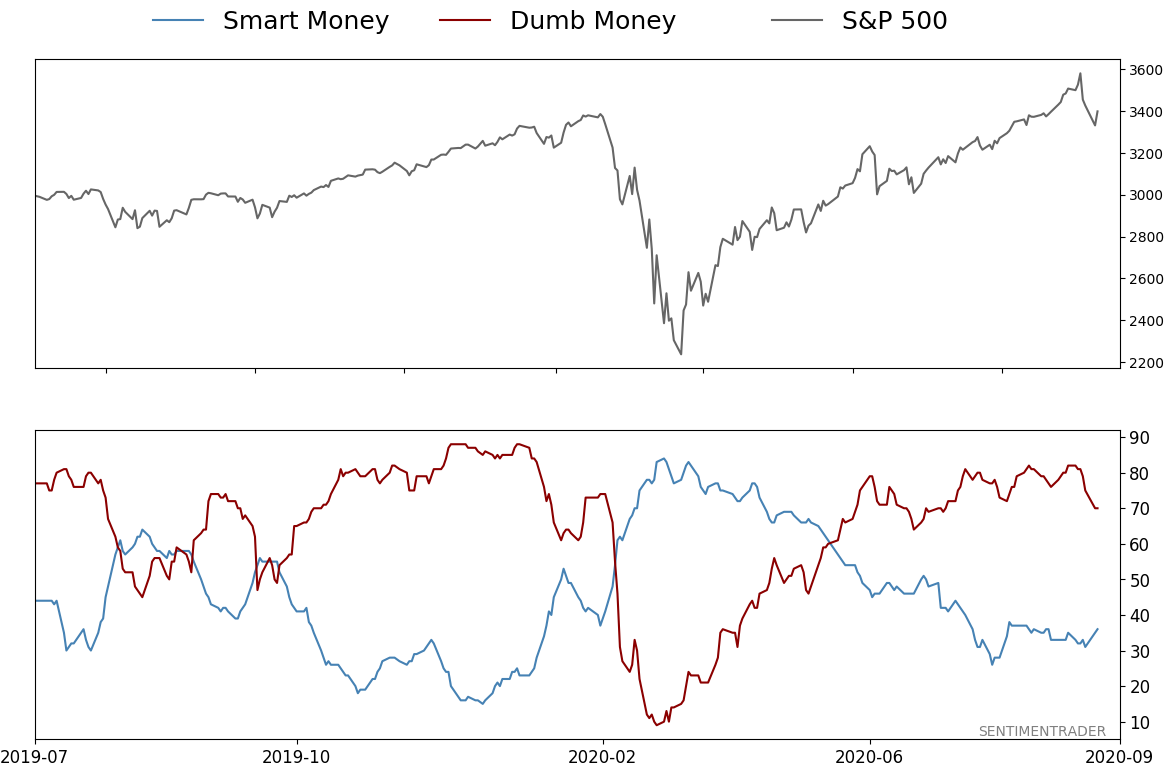
Smart / Dumb Money Confidence
|
Smart Money Confidence: 36%
Dumb Money Confidence: 70%
|
|
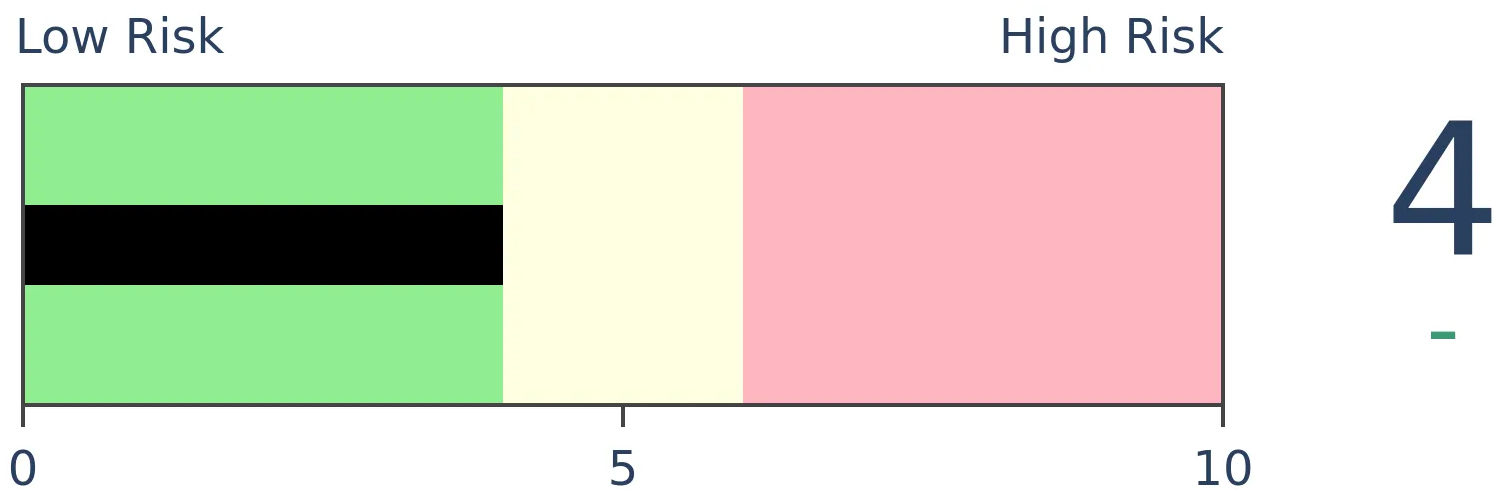
Risk Levels
Stocks Short-Term
|
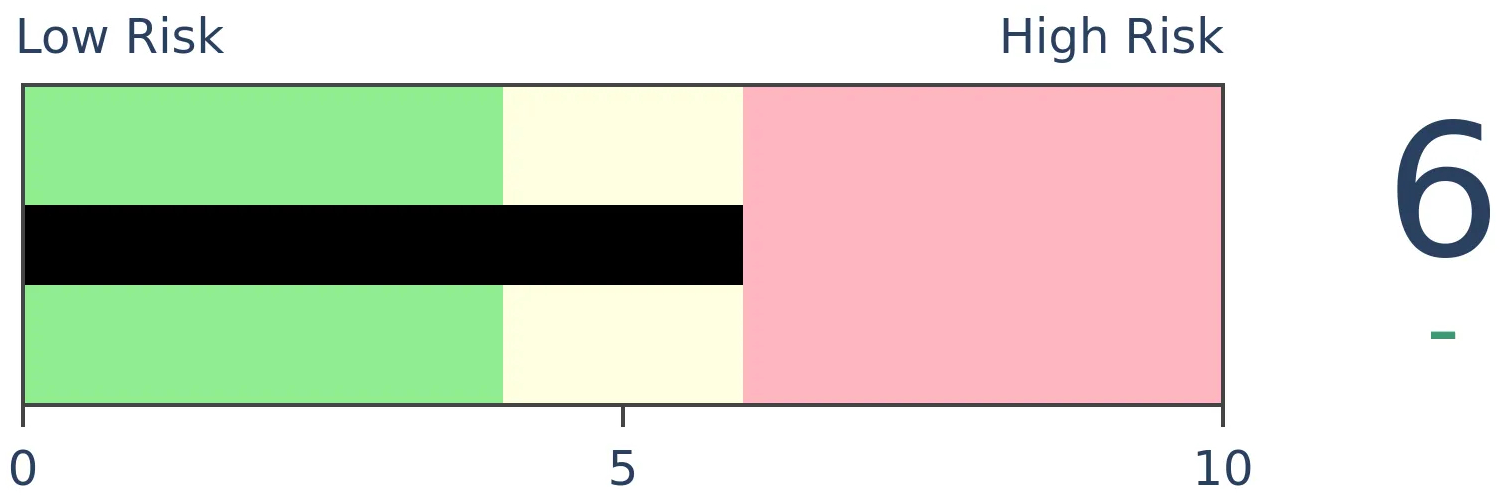
Stocks Medium-Term
|
|
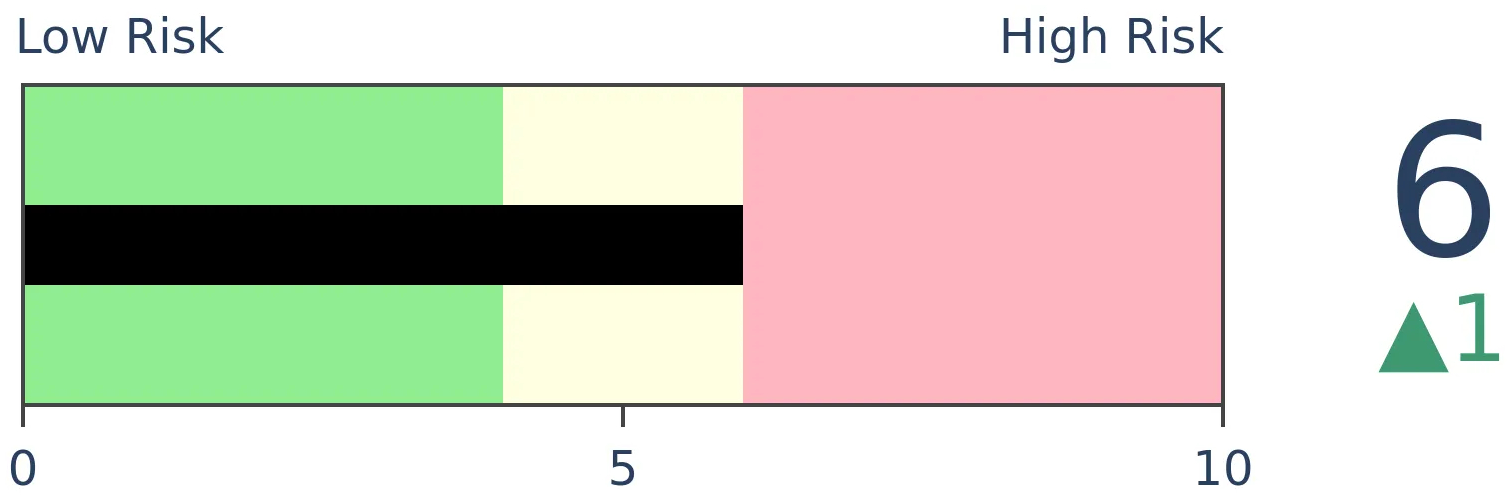
Bonds
|
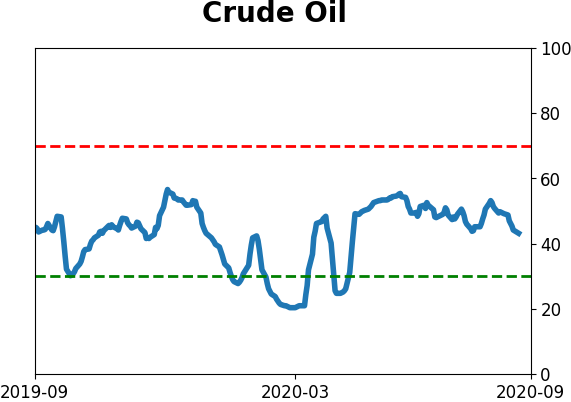
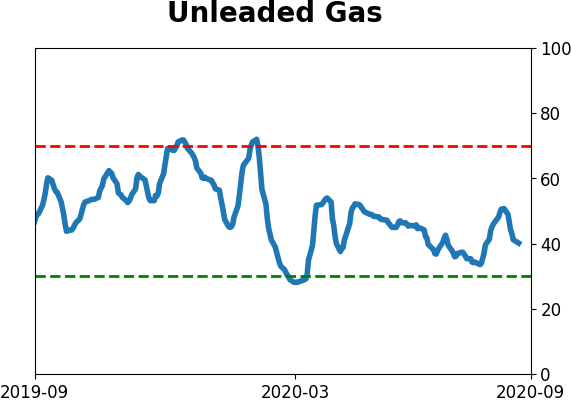
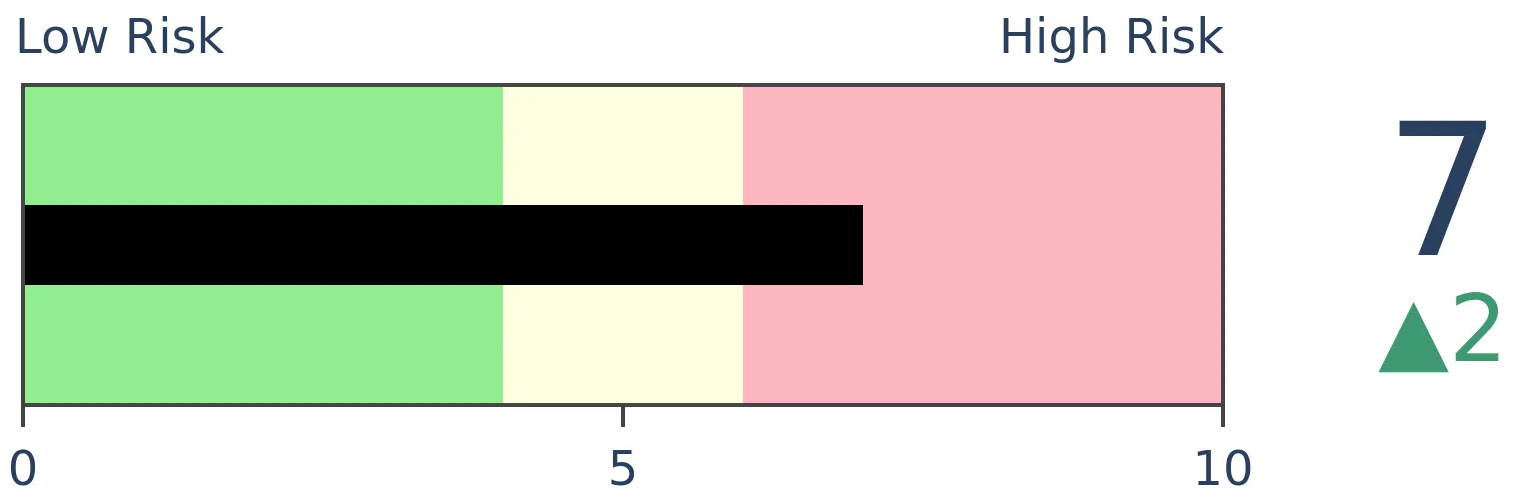
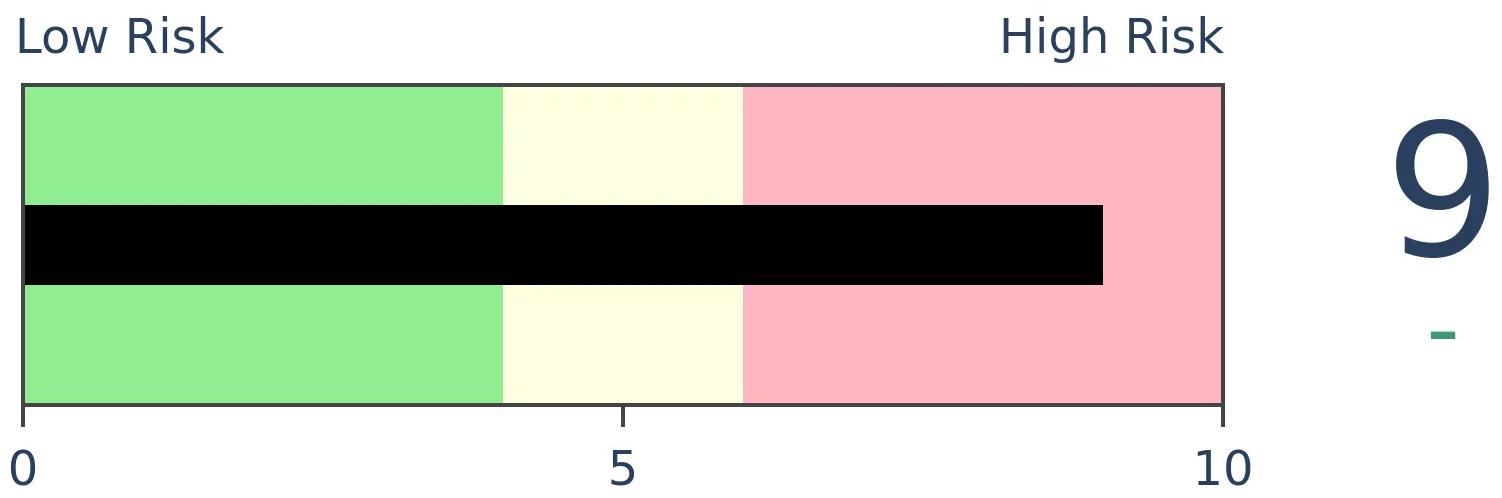
Crude Oil
|
|
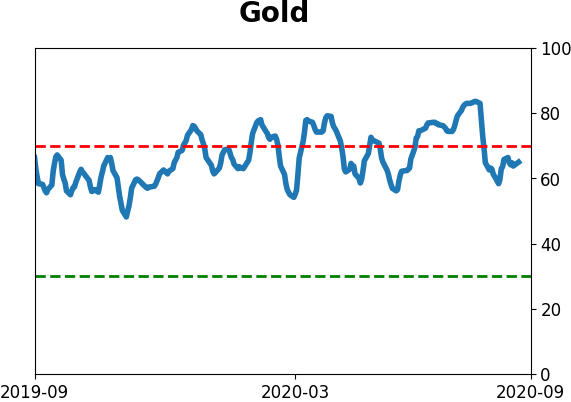
Gold
|
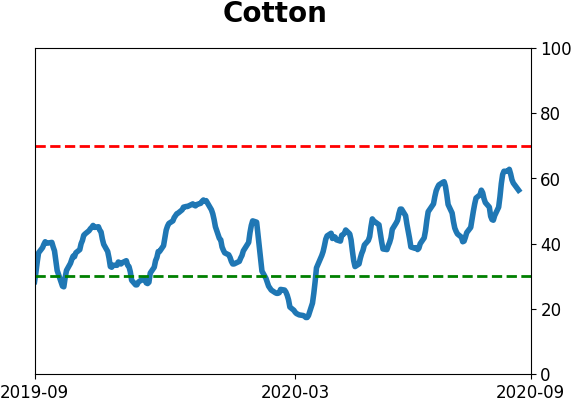
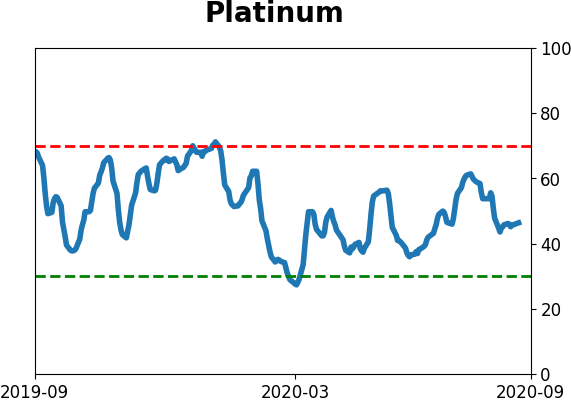
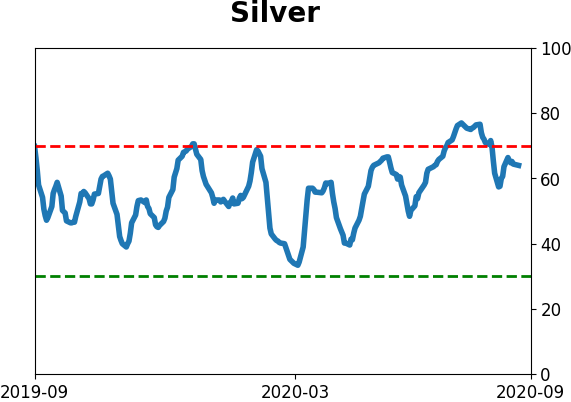
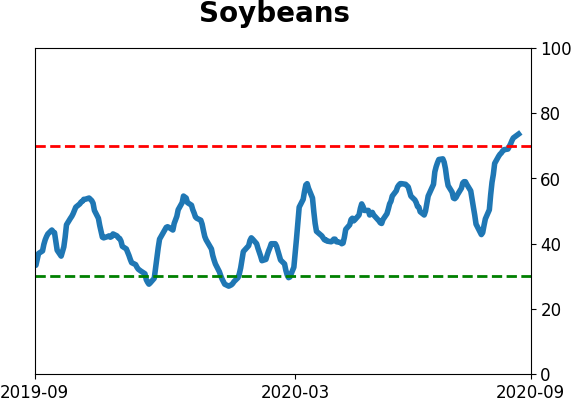
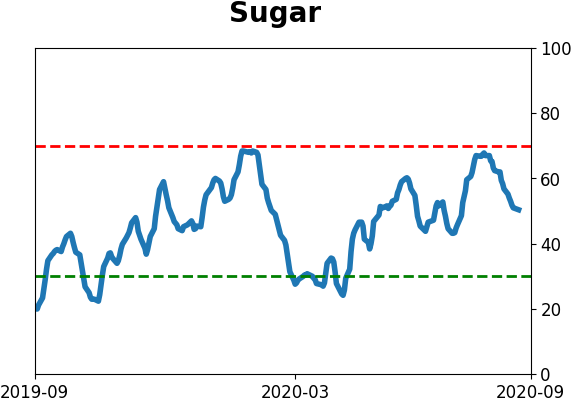
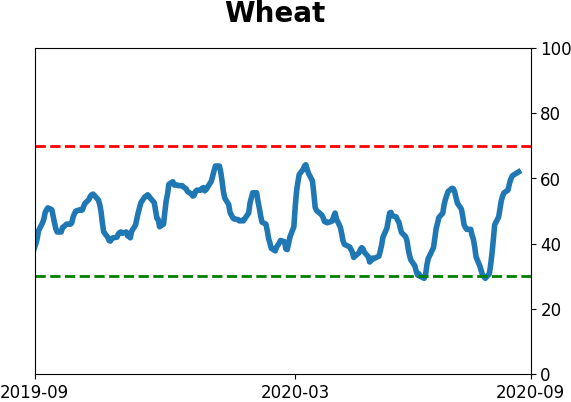
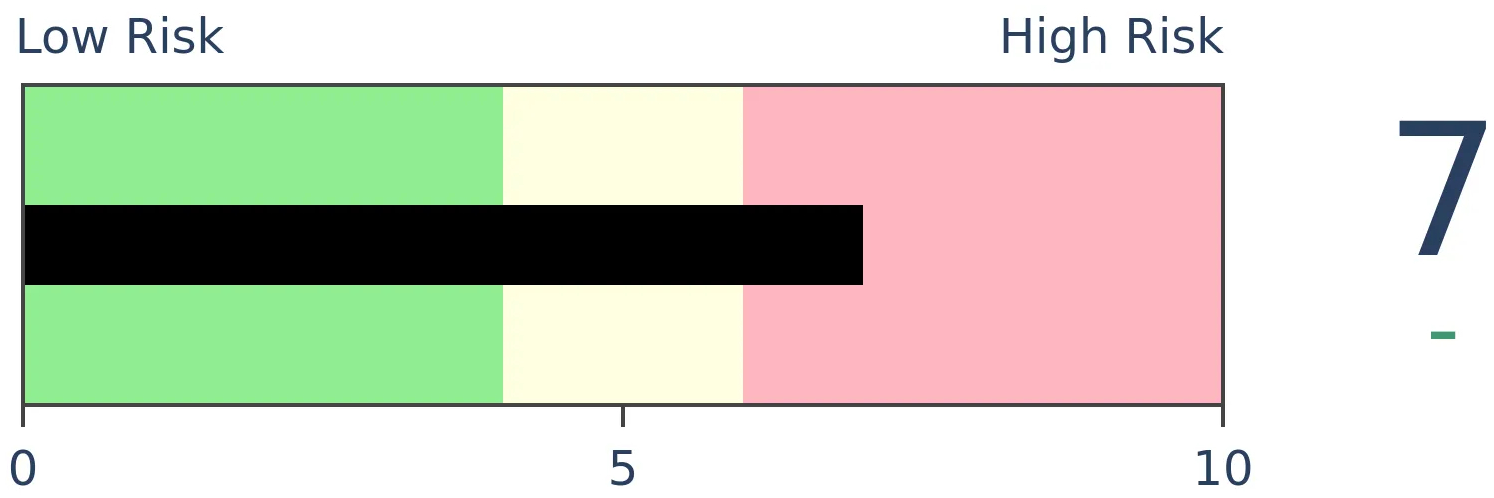
Agriculture
|
|
Research
BOTTOM LINE
The Nasdaq's momentum has ebbed, with the Composite index falling into its fastest-ever correction. This has ended some streaks of positive price action, and its underlying breadth is now negative on a longer-term basis but already stretched enough short-term to be oversold.
FORECAST / TIMEFRAME
None
|
Last week, we looked at other times the Nasdaq Composite formed major peaks. The index tended to go pretty much straight up into the peak then straight down afterward. There wasn't a lot of back-and-forth choppiness.
That's a bit of concern now because that's exactly what the index is doing, and it has set a new 10-day low which ended a couple of its other massive runs.
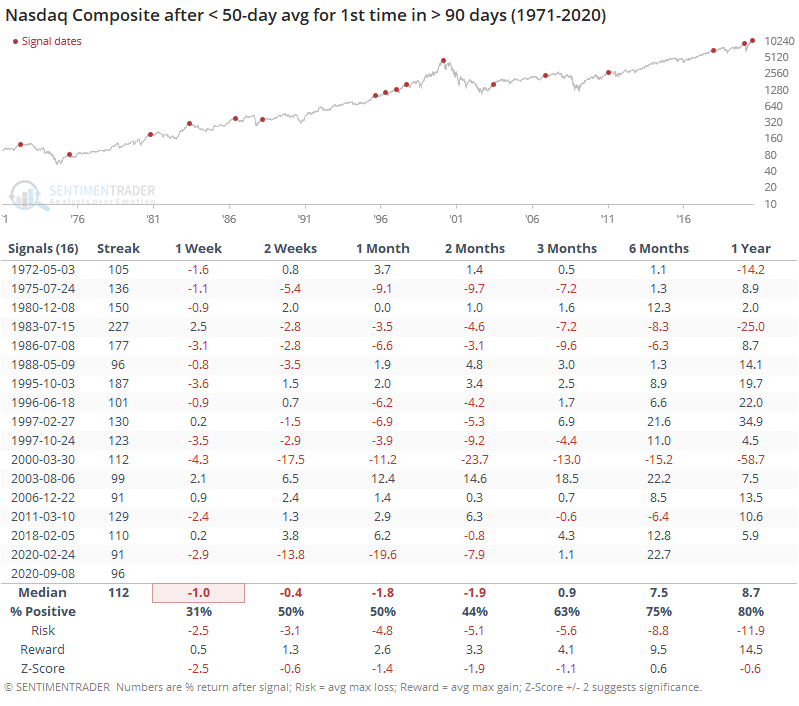
It has also finally dropped below its 50-day moving average for the first time in more than 90 days, ending one of the longer streaks since its 1971 inception.
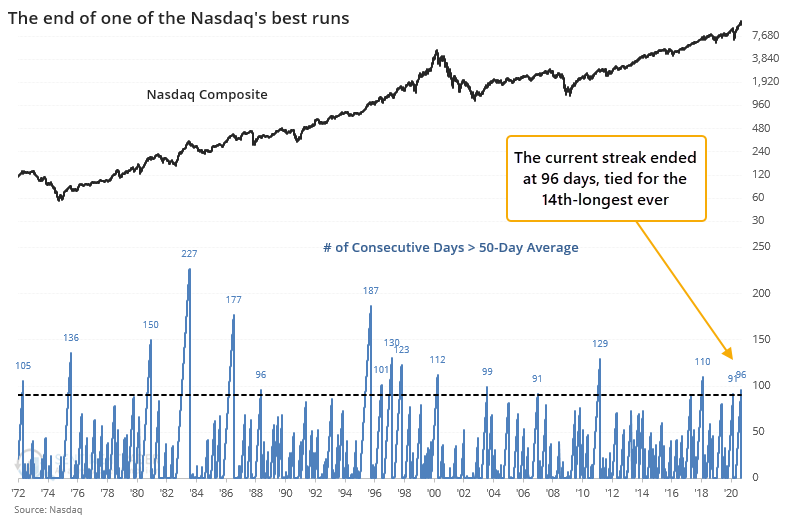
The ends of other long streaks tended to lead to more short-term downside follow-through.
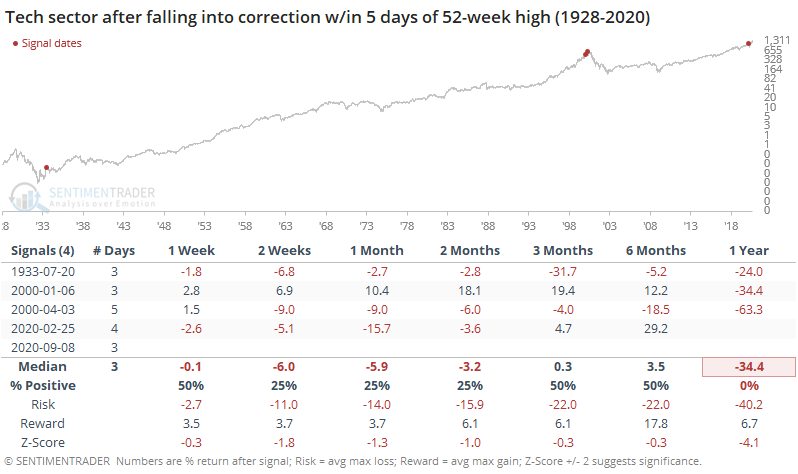
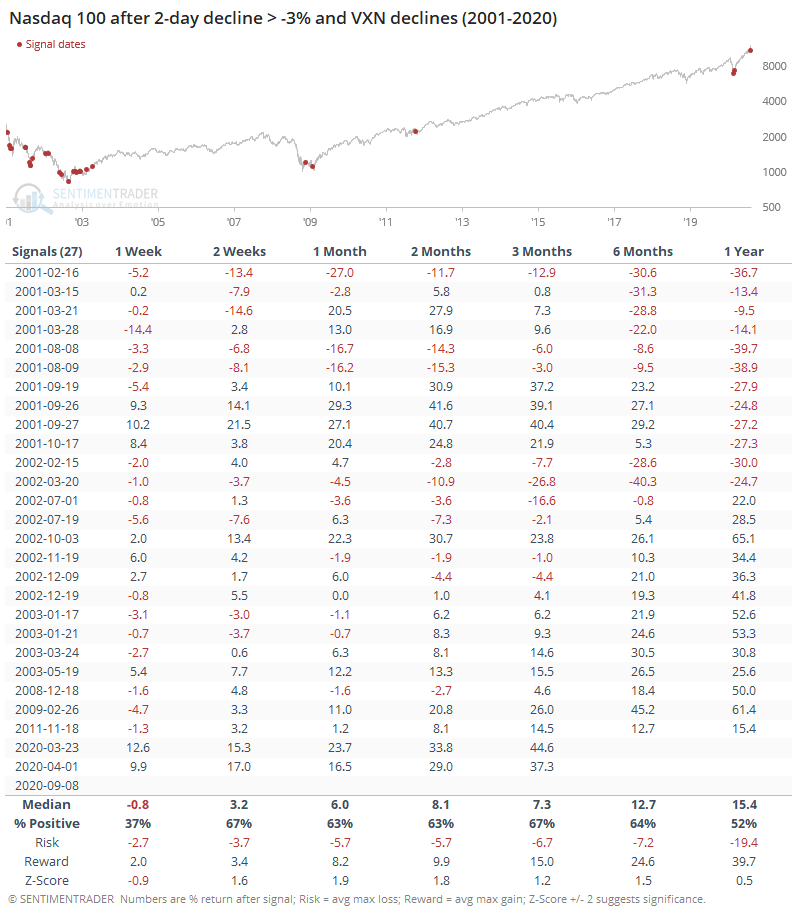
Adding some context, the table below shows what happened when it had reached a multi-year high sometime within the past two weeks.
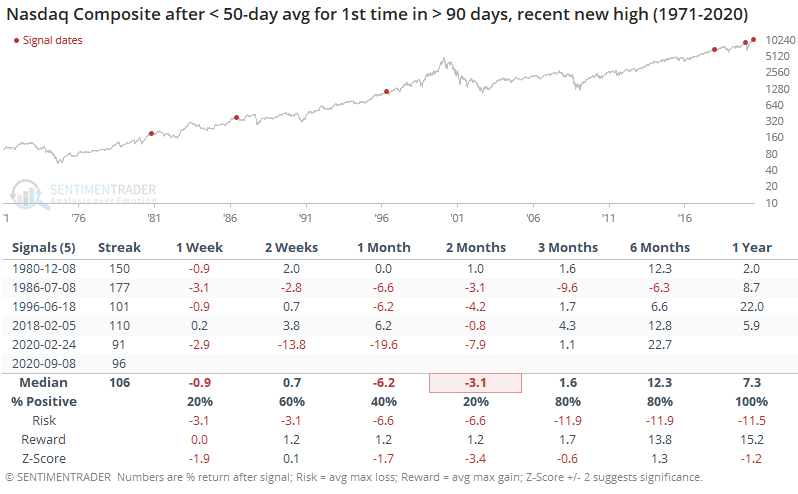
These quick changes in trend tended to persist, though the sample size is painfully small. Over the next 2 months, returns were tepid at best, with high risk relative to reward.
Because of the quick selloff, tech stocks have fallen more than 10% below their 52-week high in only 3 sessions, tied for the fastest-ever correction since 1928.
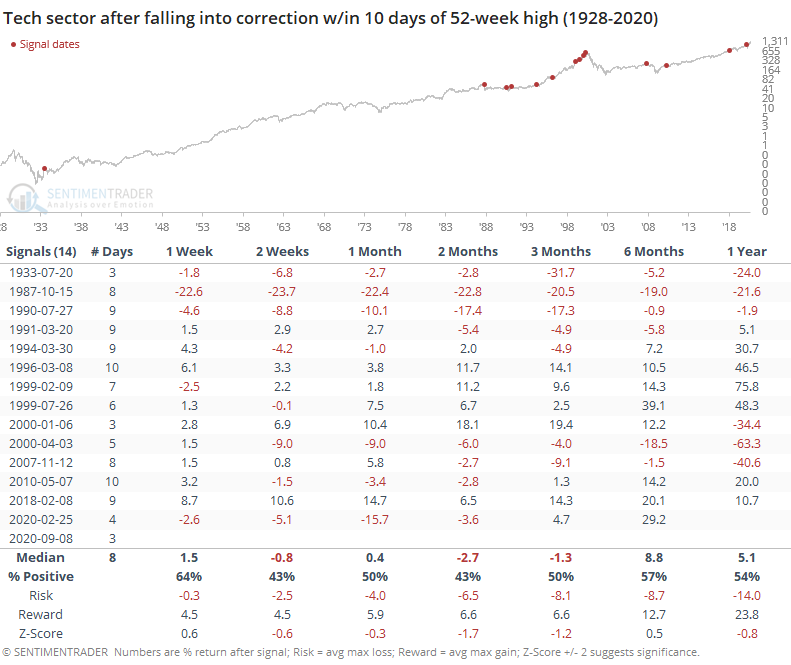
We saw last week that major peaks in the Nasdaq tend to pretty much go straight up, then straight down. So it's not a surprise that the few times the Nasdaq fell into a correction in only a handful of days preceded some of the worst returns.
It's not just the Nasdaq Composite or Nasdaq 100 indexes that fell more than 10% below their highs, most of the underlying stocks have as well. About 73% of Nasdaq 100 stocks dropped more than 10% below their 52-week highs.
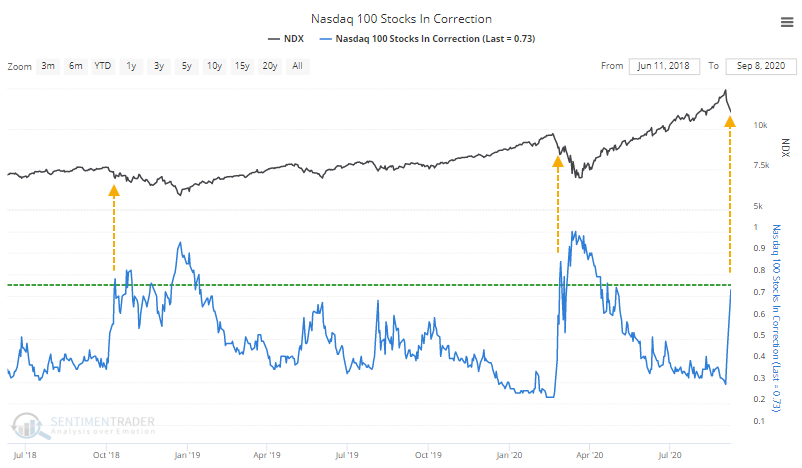
This is about the "oversold" level in healthy markets. Often, this nears the 75% threshold, and then stocks rebound. The problem is when it doesn't - the last two times we saw so many stocks fall into correction territory, it was much closer to the start of a sustained pullback than the end.
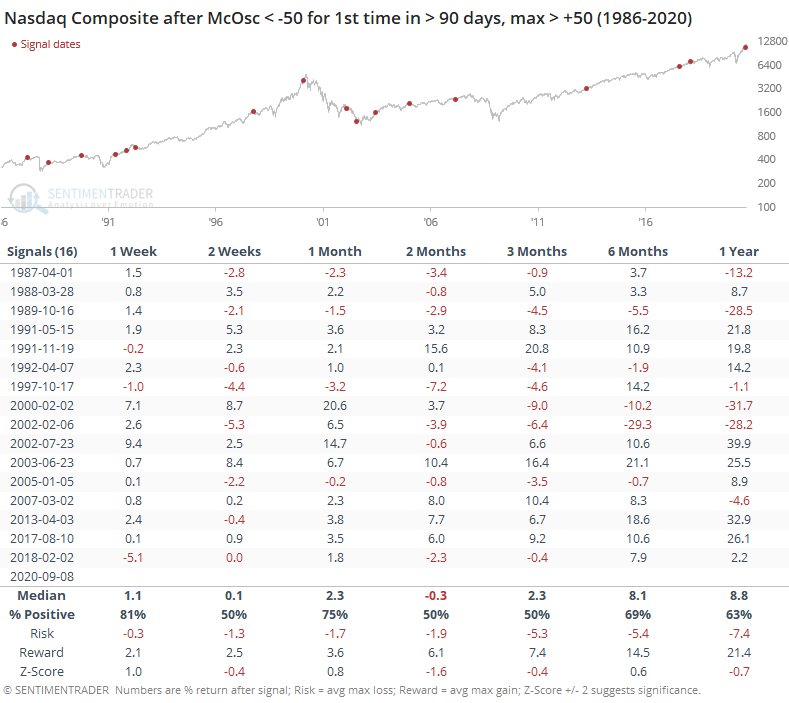
For weeks now, we've been documenting the Nasdaq's oddly negative breadth, even on days when the Composite index soared higher. Now that there have been a few days of heavy selling, the breadth figures are quickly generating oversold readings. The McClellan Oscillator has dropped into oversold territory for the first time since March.
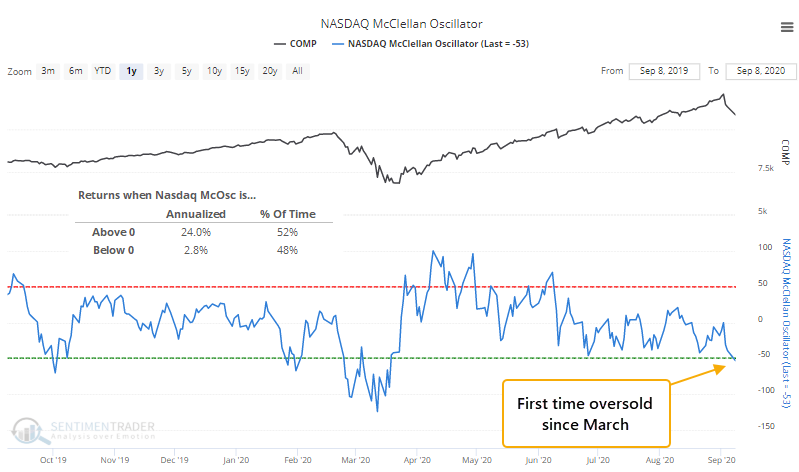
When the Oscillator is above zero, the Nasdaq has returned an annualized +24.0%, compared to only +2.8% when it's below zero. The saving grace could be that breadth has been so bad that it's now stretched too far to the downside. The Backtest Engine shows decent returns when the Oscillator is below -50 during a rising market.
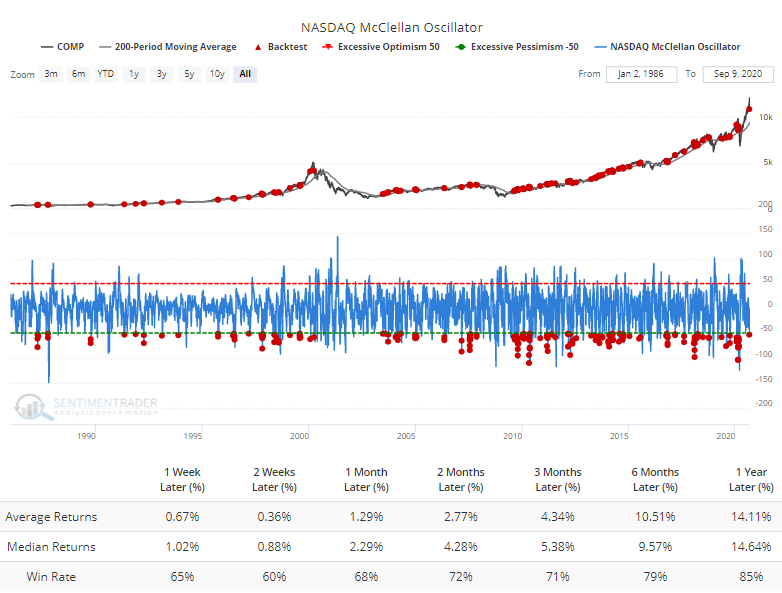
If we investigate that a little further and only look for times when the Oscillator only fell below -50 for the first time in months, after showing impressive positive momentum, then returns were less impressive, especially over the next 2 months.
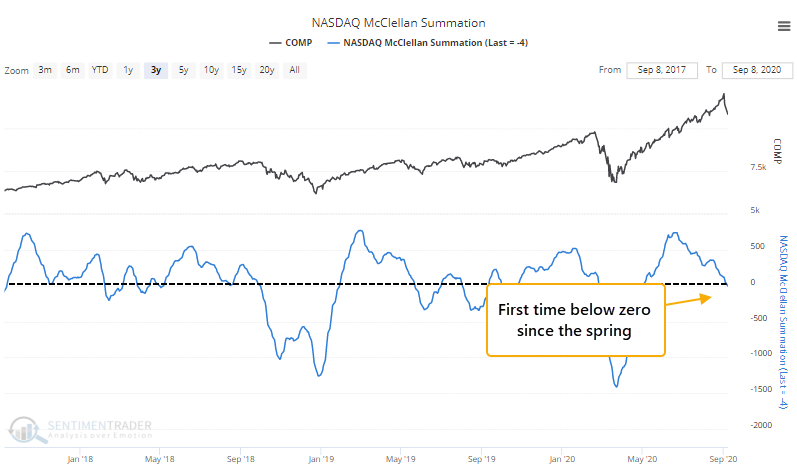
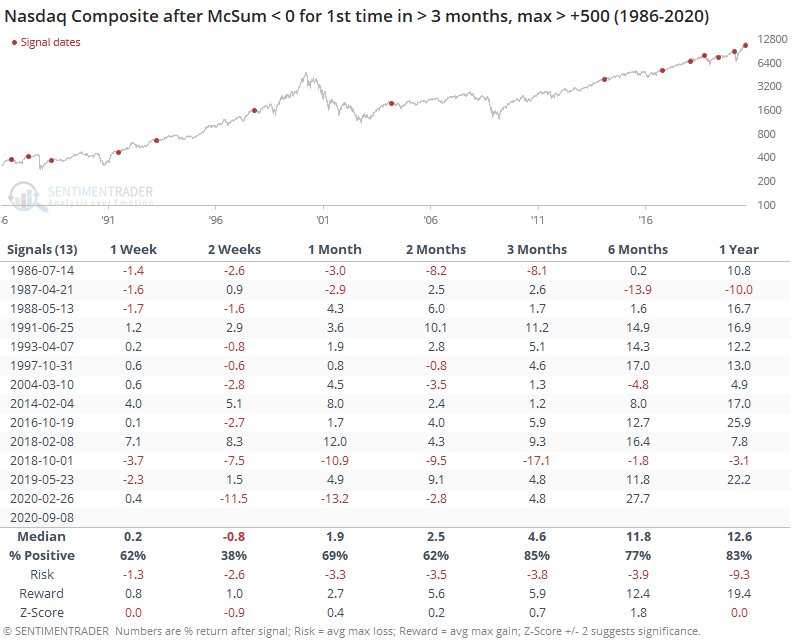
Because the Nasdaq breadth has been waning for a sustained period, the longer-term McClellan Summation Index has also dropped below zero for the first time since the spring.
This kind of waning momentum, following impressive positive readings, also led to some weakness but it tended to be more focused on the shorter-term. Longer-term returns were decent.
Because options traders were scrambling to get exposure to the upside crash in tech stocks, implied volatility on those options was exploding higher as stocks rose, an extremely unusual condition as we noted last week. Now that they've fallen back some, volatility is actually dropping, also an extremely unusual situation.
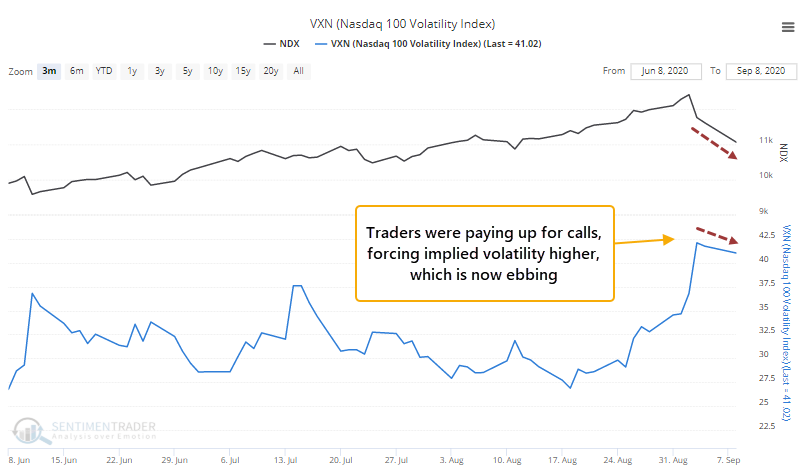
This has usually only happened when options prices were pumped up even more than they are now because traders had panicked during a falling market. It's never happened when volatility was high because of a rally.
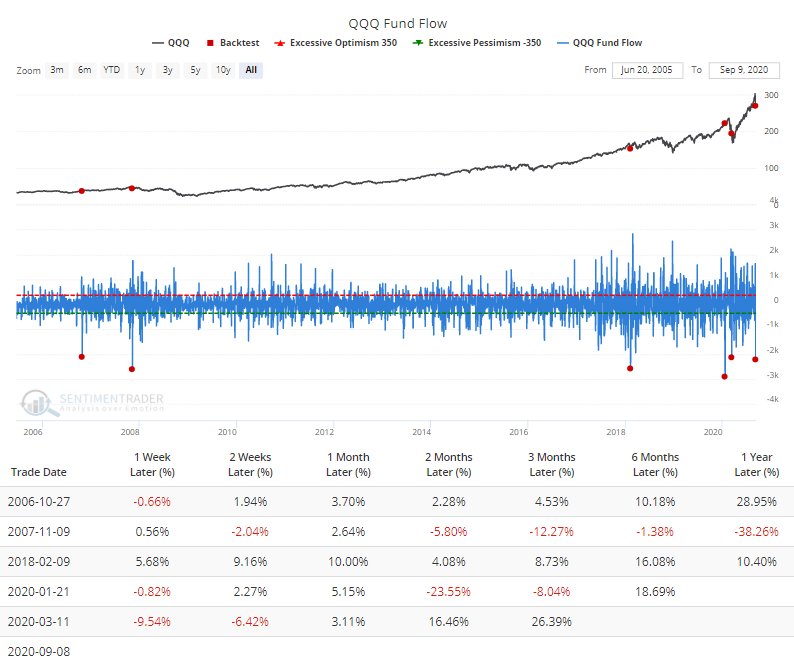
The sudden losses were enough to scare some ETF traders, who pulled more than $2 billion from QQQ in a single day, among the most ever. Fund flows on ETFs are tricky beasts, though, and not always a reliable contrary indicator.
Momentum tends to be sticky. When it ends, it usually doesn't just simply reverse and start up again. We see that with most of the developments above - forward returns up to 2 months later tended to be poor, or at least below average. Longer-term returns were average or a little above. Given the massive amount of speculative fervor built up in recent weeks, this pricking of the Nasdaq's momentum is another worrying sign over the short- to medium-term.
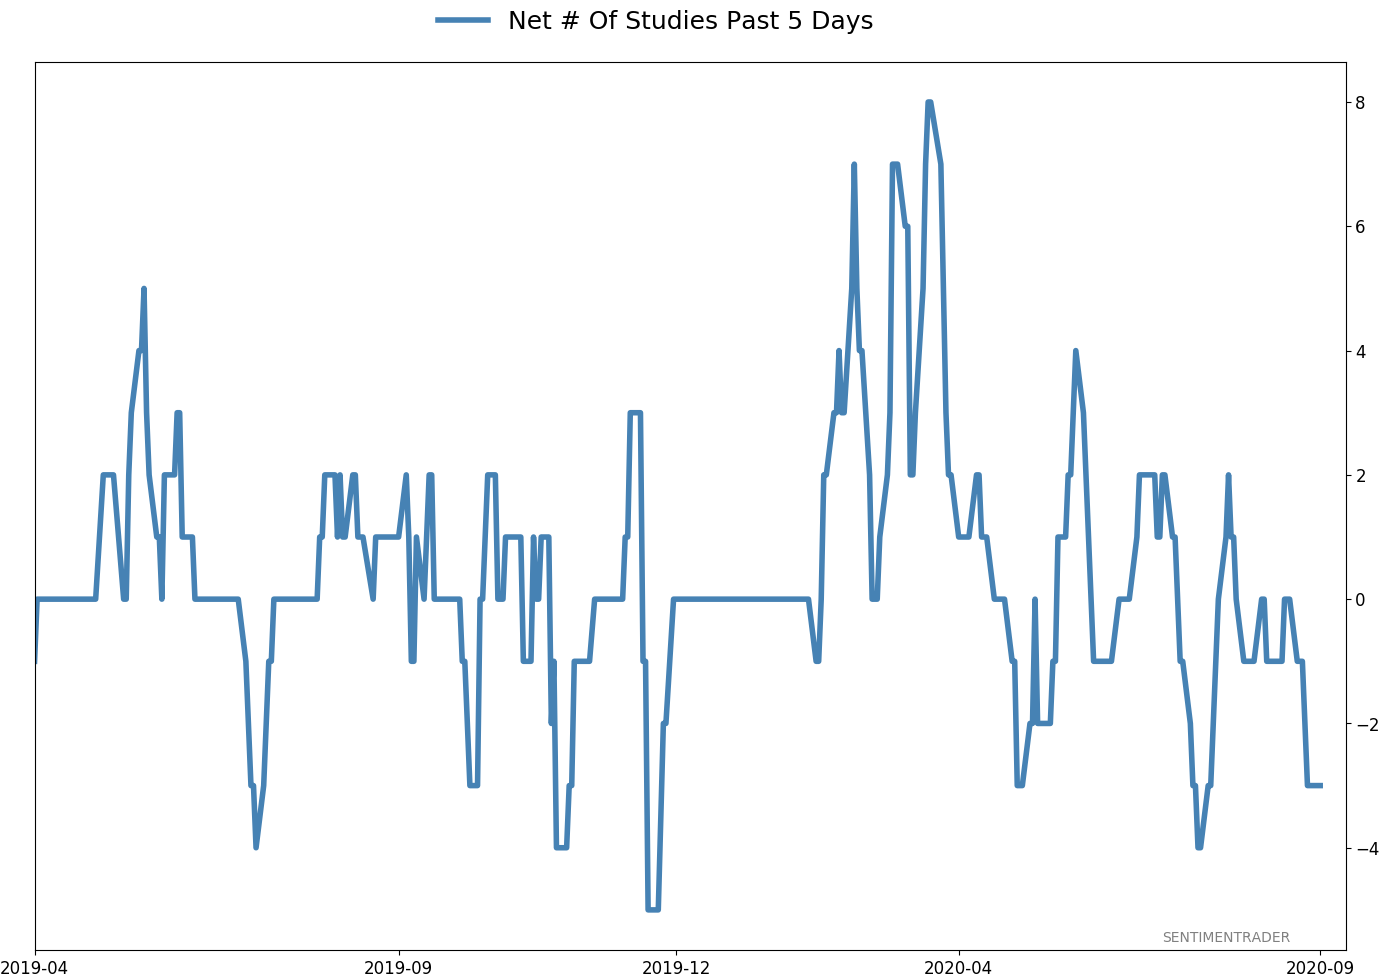
Active Studies
| Time Frame | Bullish | Bearish | | Short-Term | 0 | 1 | | Medium-Term | 1 | 12 | | Long-Term | 47 | 2 |
|
Indicators at Extremes
Portfolio
| Position | Weight % | Added / Reduced | Date | | Stocks | 15.2 | Reduced 4.2% | 2020-09-03 | | Bonds | 30.0 | Added 30% | 2020-09-09 | | Commodities | 2.4 | Reduced 2.1%
| 2020-09-04 | | Precious Metals | 5.0 | Added 5% | 2020-09-09 | | Special Situations | 4.9 | Added 5.1% | 2020-09-03 | | Cash | 42.5 | | |
|
Updates (Changes made today are underlined)
After stocks bottomed on March 23rd, they enjoyed a historic buying thrust and retraced a larger amount of the decline than "just a bear market rally" tends to. Through June, there were signs of breadth thrusts, recoveries, and trend changes that have an almost unblemished record at preceding higher prices over a 6-12 month time frame. On a shorter-term basis, our indicators have been showing high optimism, with Dumb Money Confidence recently above 80%, along with signs of reckless speculation during what appears to be an unhealthy market environment, historically a bad combination. While there are certainly some outlier indicators that are showing apathy or even outright pessimism, a weight-of-the-evidence approach suggests high risk over a multi-week to multi-month time frame. That has been the case since July, even arguably June and yet the major indexes hit continual new highs through late August. With the indicators and studies failing to precede any weakness, I've been hesitant to lower my already-low exposure. I am getting increasingly anxious about the oddities we're seeing, though, and lowered it again. This account is mostly about comfort with risk for me, and right now I'm not at all comfortable with any of it. In more than 25 years of experience, this is the oddest market I've ever seen. I lowered exposure again - likely the lowest I'm willing to go at this point given longer-term positives - and decided to switch to an equal-weight version of the S&P 500 index. I've become intensely uncomfortable with the concentration in the cap-weighted index. Our studies have been mixed with regard to the potential for the equal-weight version to outperform the cap version going forward, so historical support isn't overwhelming. I'm also increasingly interested again in energy stocks, starting with a small allocation. I got burned in March with the unprecedented geopolitical spat that hammered those stocks then but the longer-term setup is decent. In this account, I’ve roughly followed what has become known as the All Weather portfolio popularized by Ray Dalio. It allocates across four broad assets, designed to hold up no matter the market environment. The goal is modest positive returns while limiting large, sustained losses. I typically use popular ETFs, with low costs. At times, I will swap out for a fund I believe has better prospects, or simply lower fees if not. At other times, I will diverge quite a bit from baseline allocations, largely depending on the indicators and studies we discuss on the site. I've gotten away from this in the past, using "cash" as a substitute for "bonds" and with rates stuck at 0%, that has become less appetizing. I'm trying to get back more toward the baselines with less dramatic swings in either direction. The base allocation I use is the following: Stocks: 35%
Bonds: 45%
Precious Metals: 7.5%
Commodities: 7.5%
Cash / Special Opportunities: 5%
RETURN YTD: -0.6% 2019: 12.6%, 2018: 0.6%, 2017: 3.8%, 2016: 17.1%, 2015: 9.2%, 2014: 14.5%, 2013: 2.2%, 2012: 10.8%, 2011: 16.5%, 2010: 15.3%, 2009: 23.9%, 2008: 16.2%, 2007: 7.8%
|
|
Phase Table
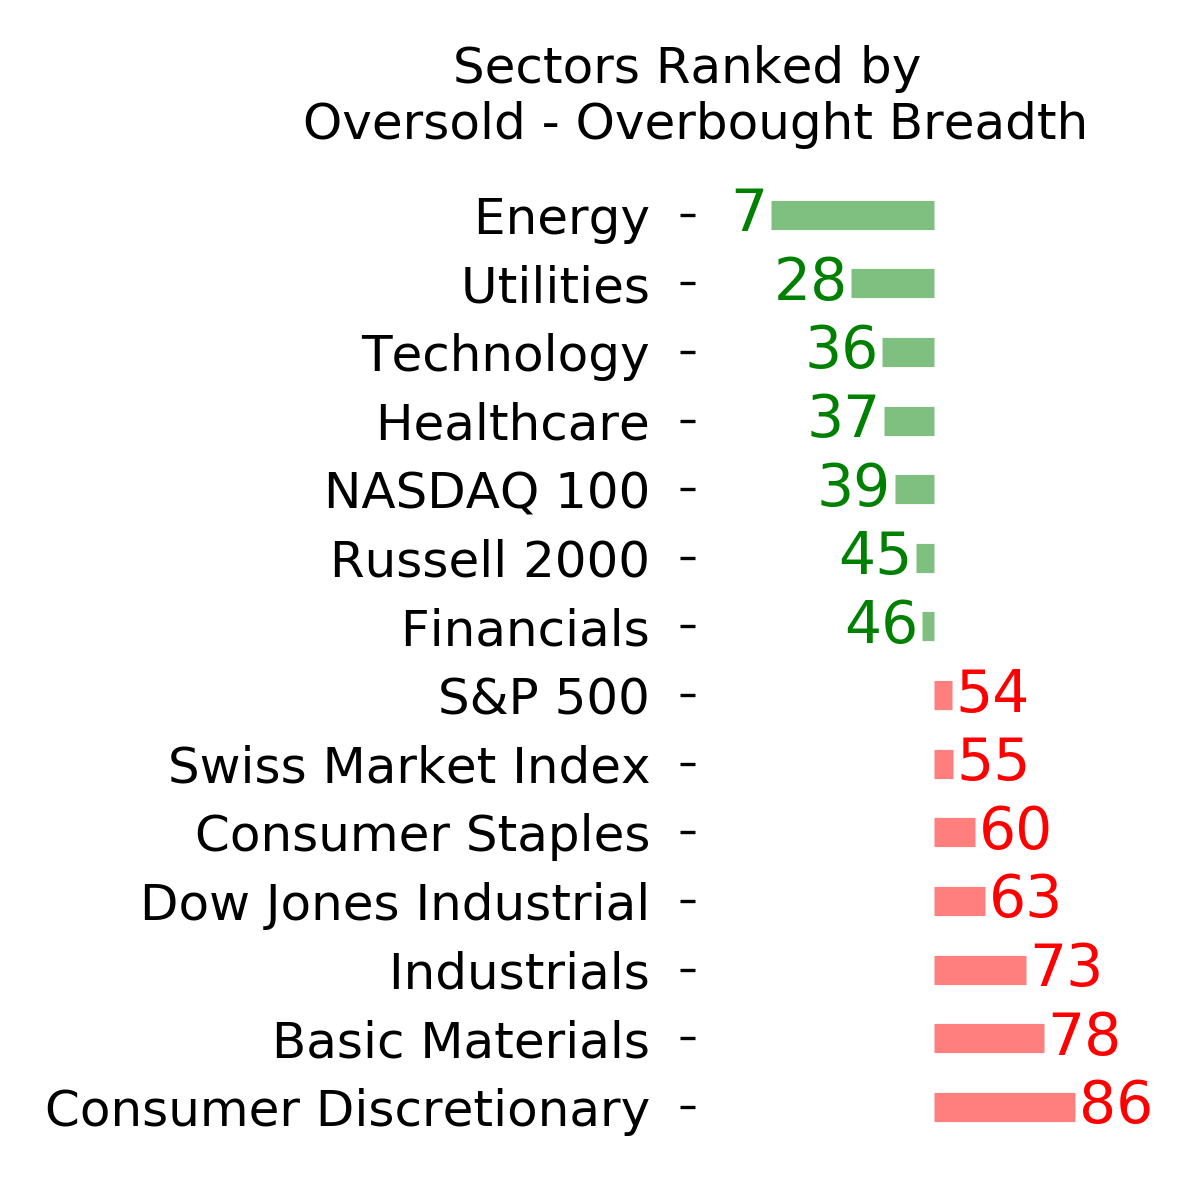
Ranks
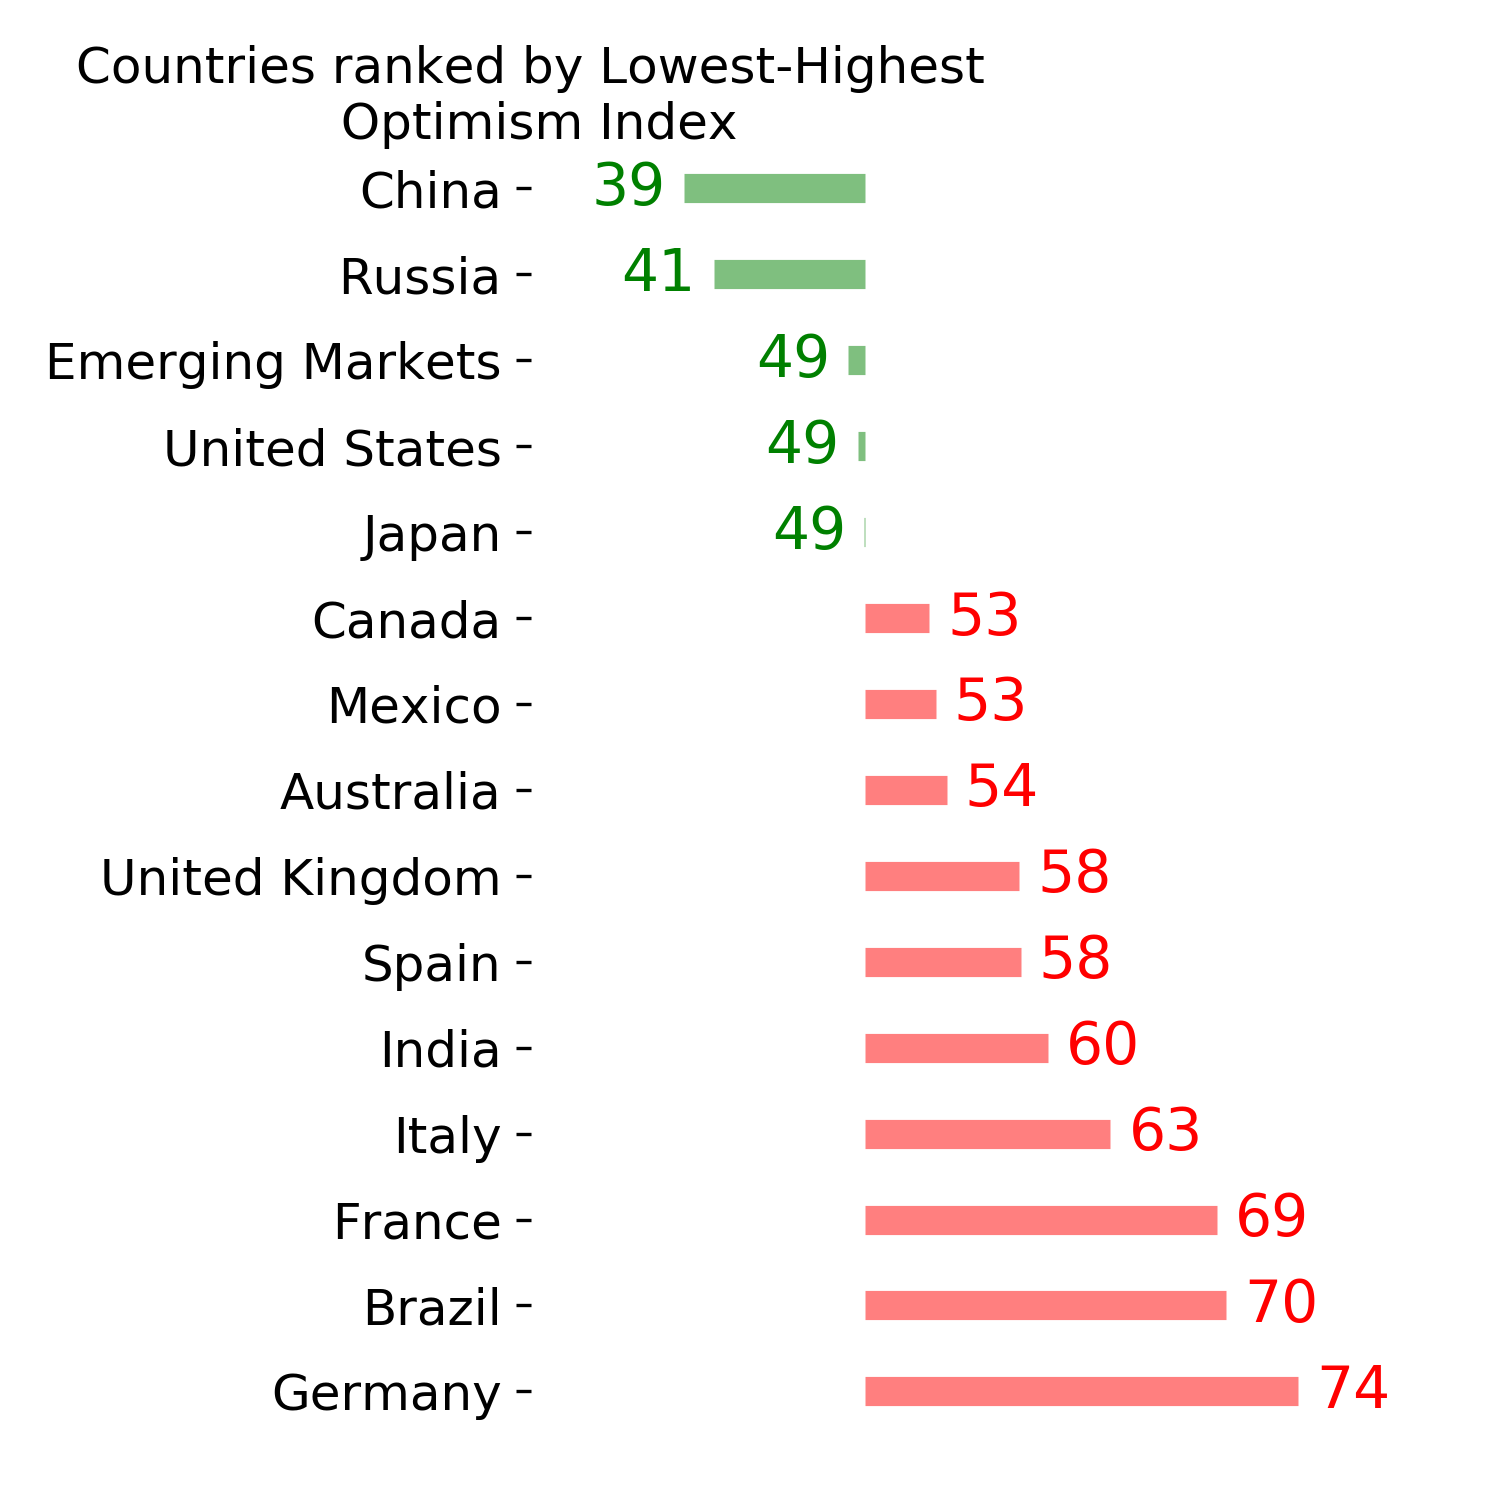
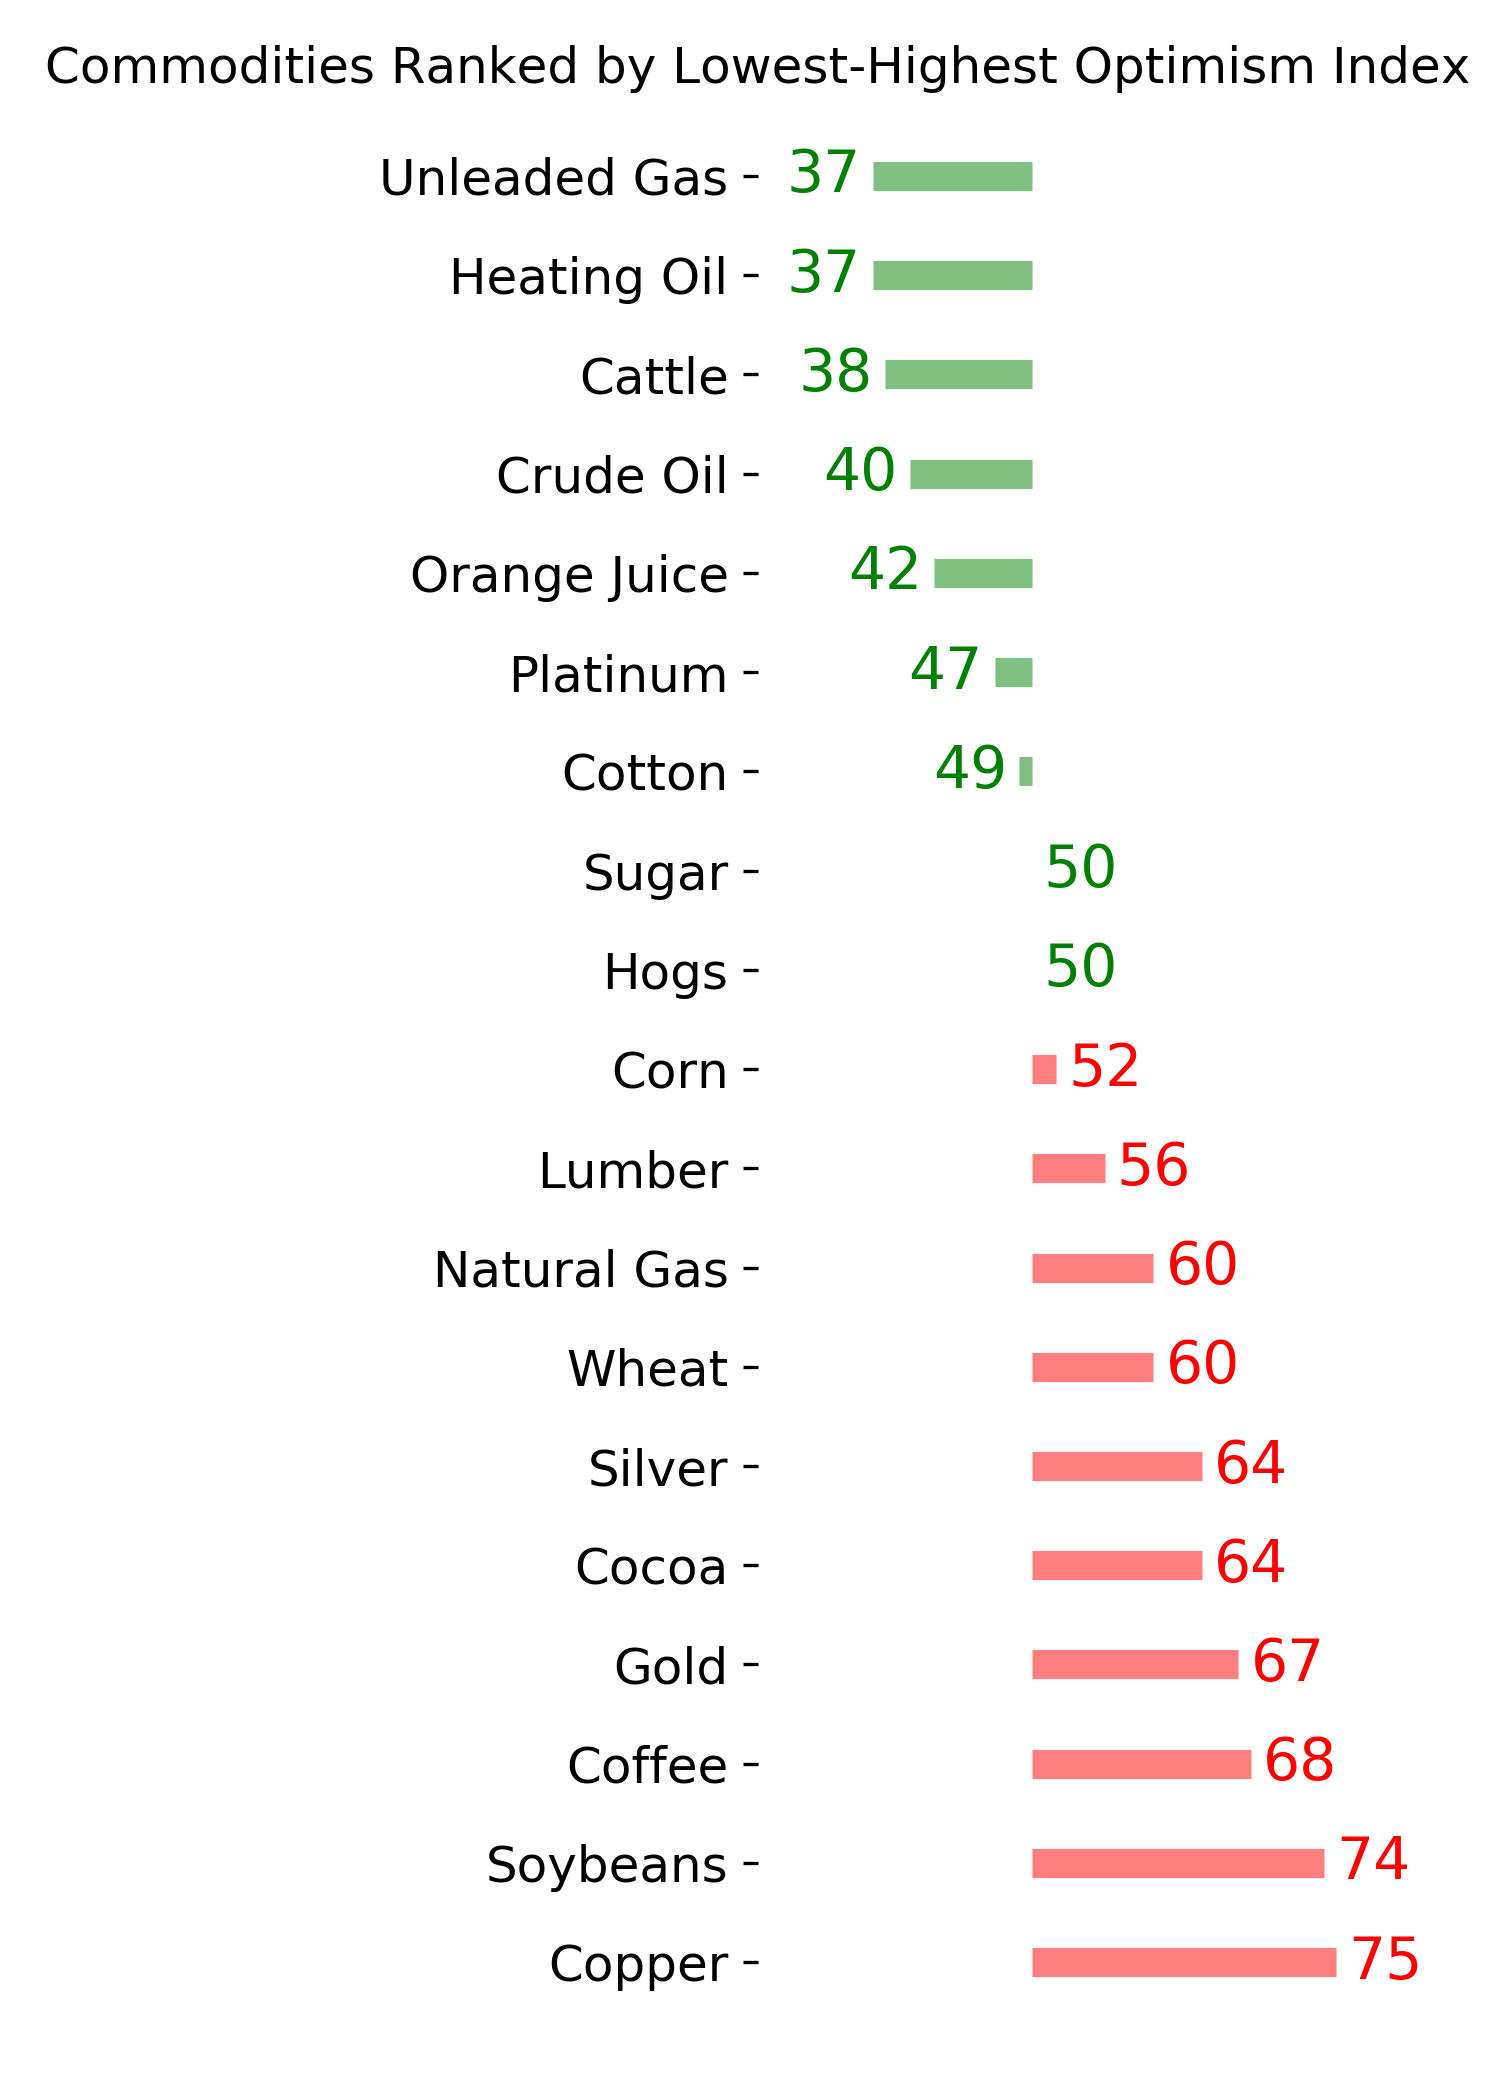
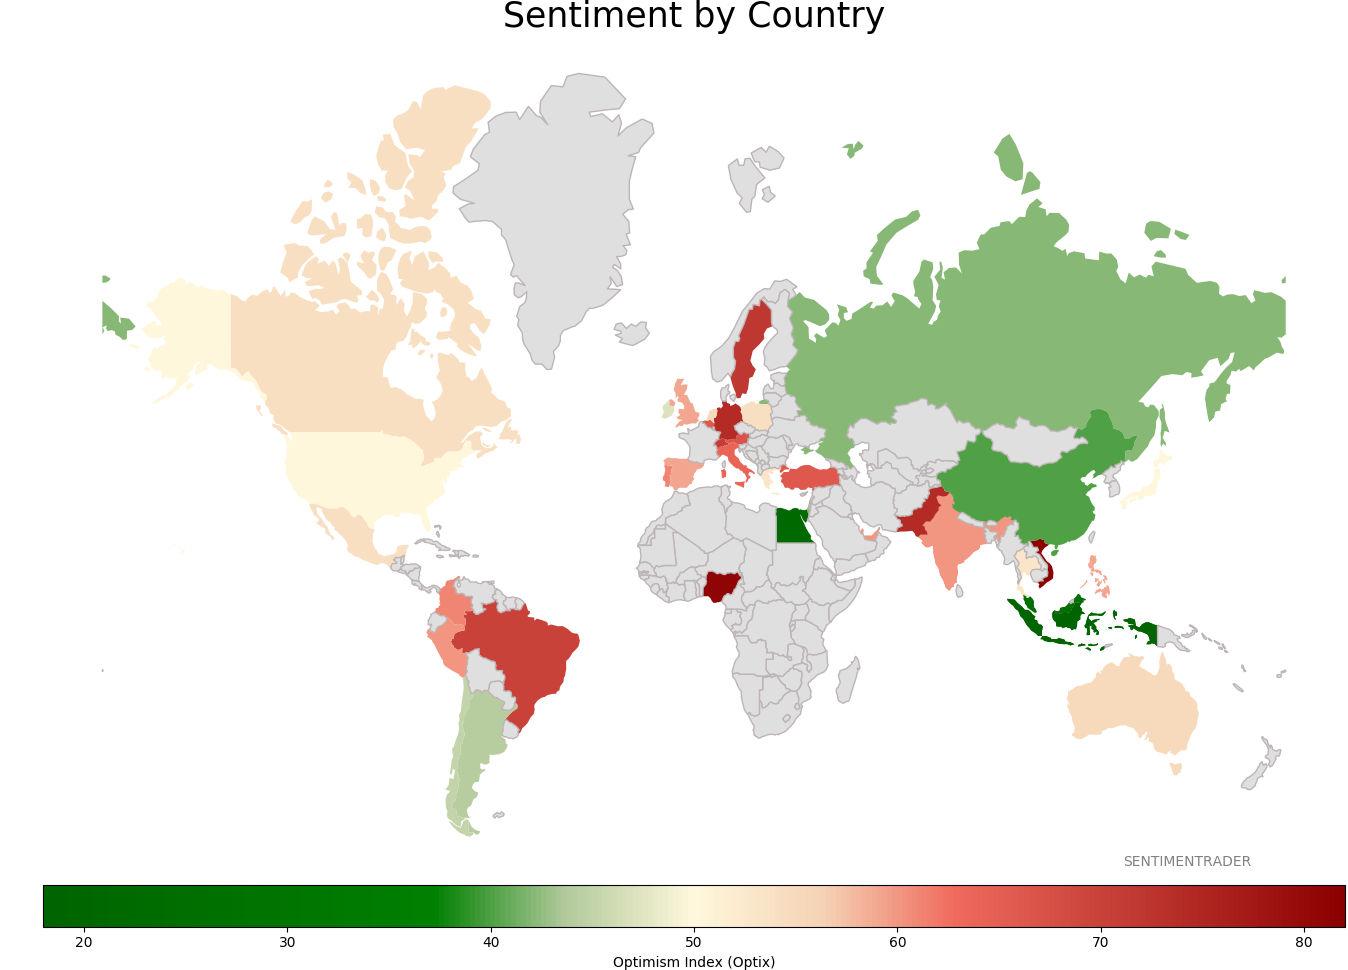
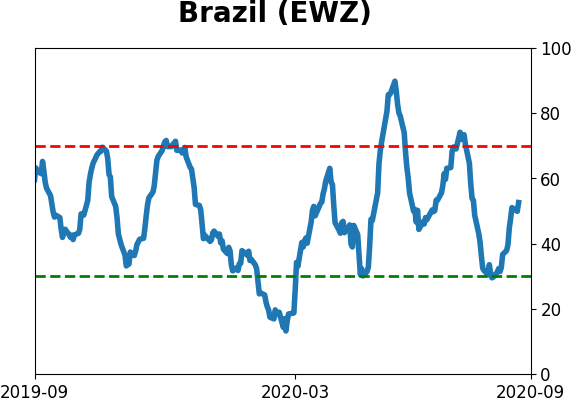
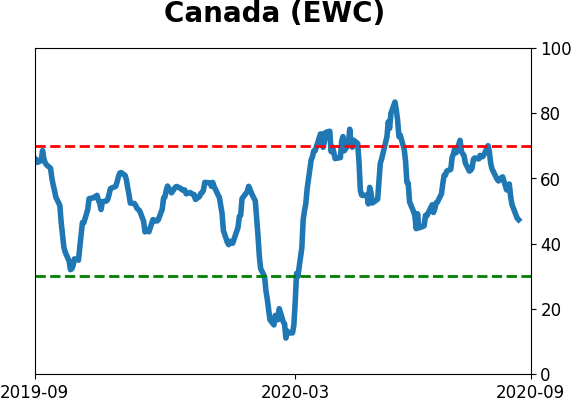
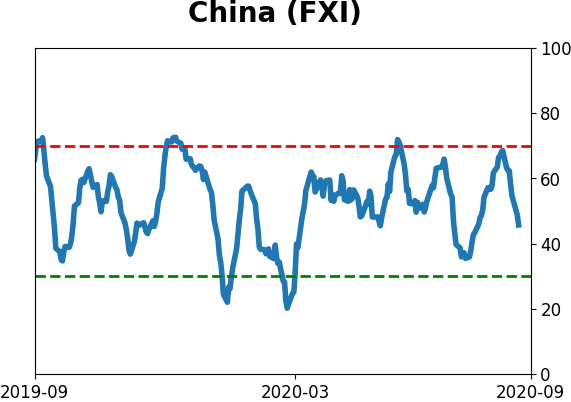
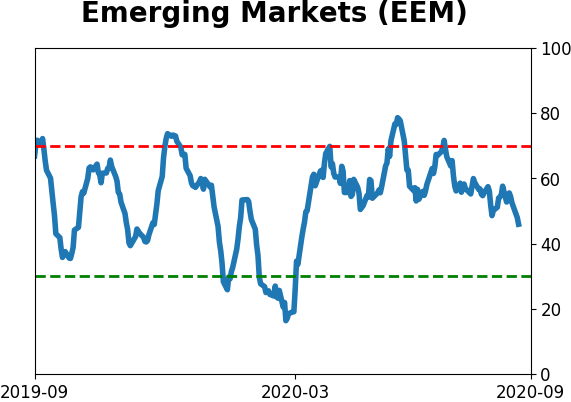
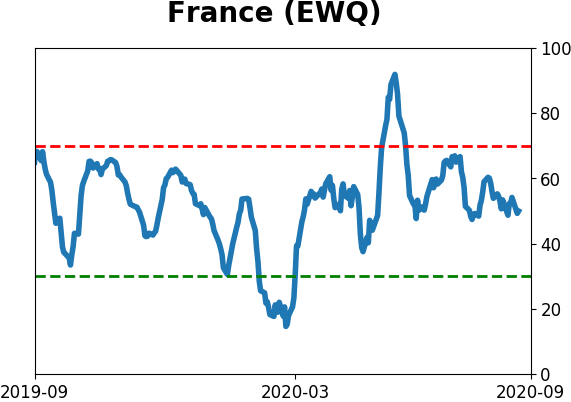
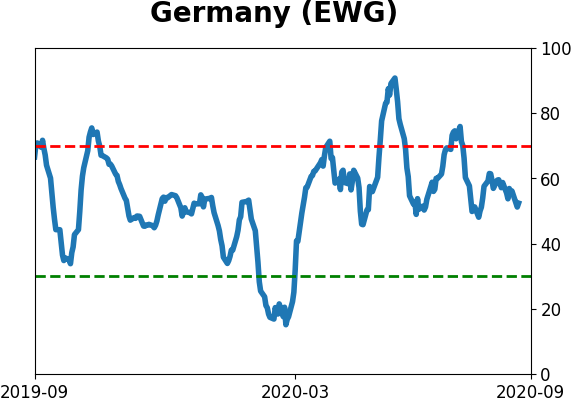
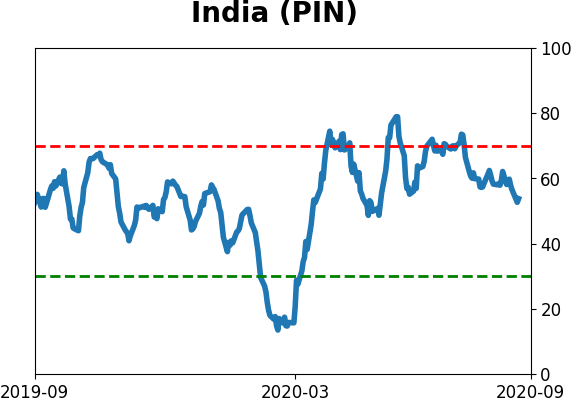
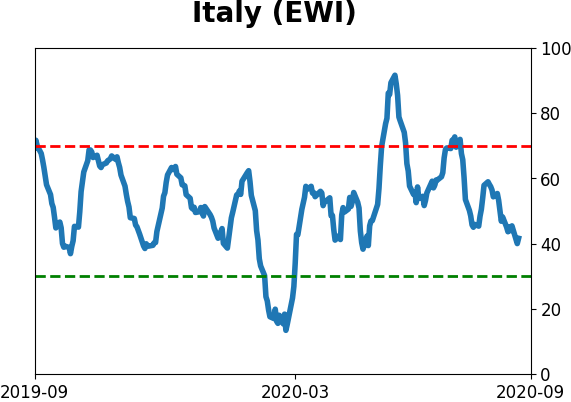
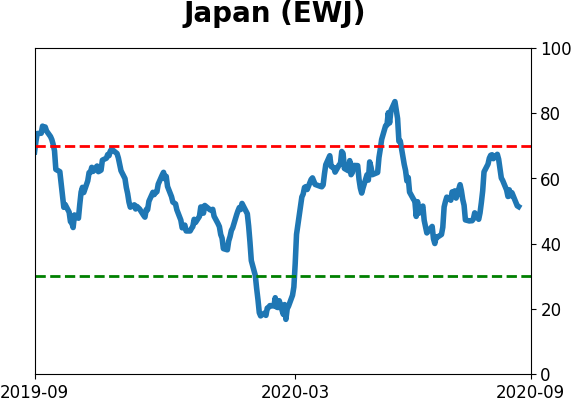
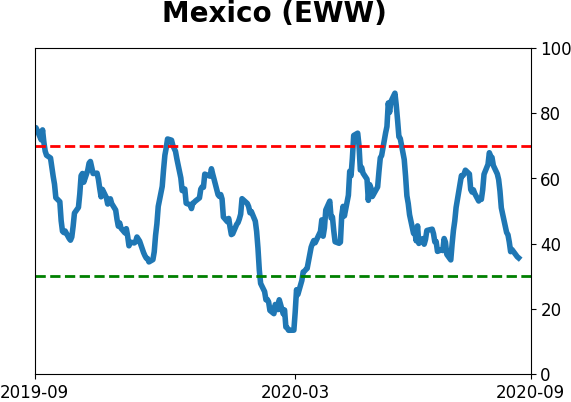
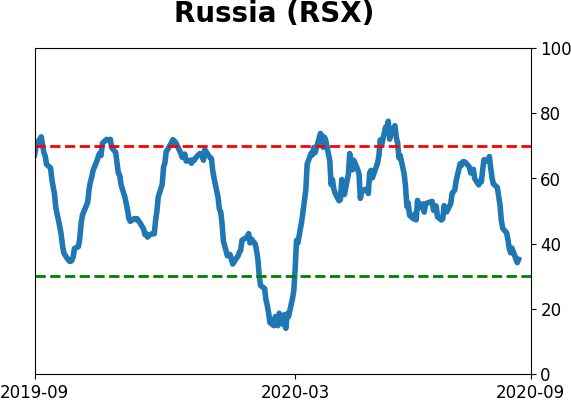
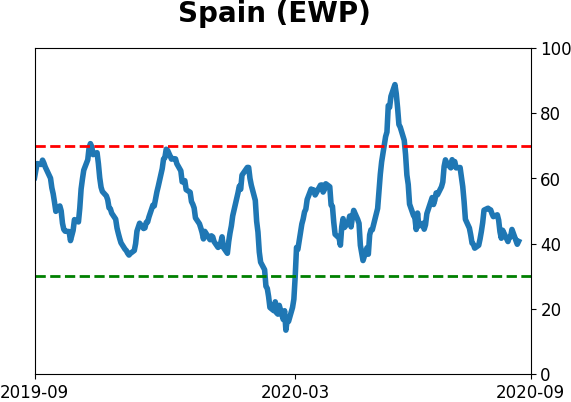
Sentiment Around The World
Optimism Index Thumbnails
|
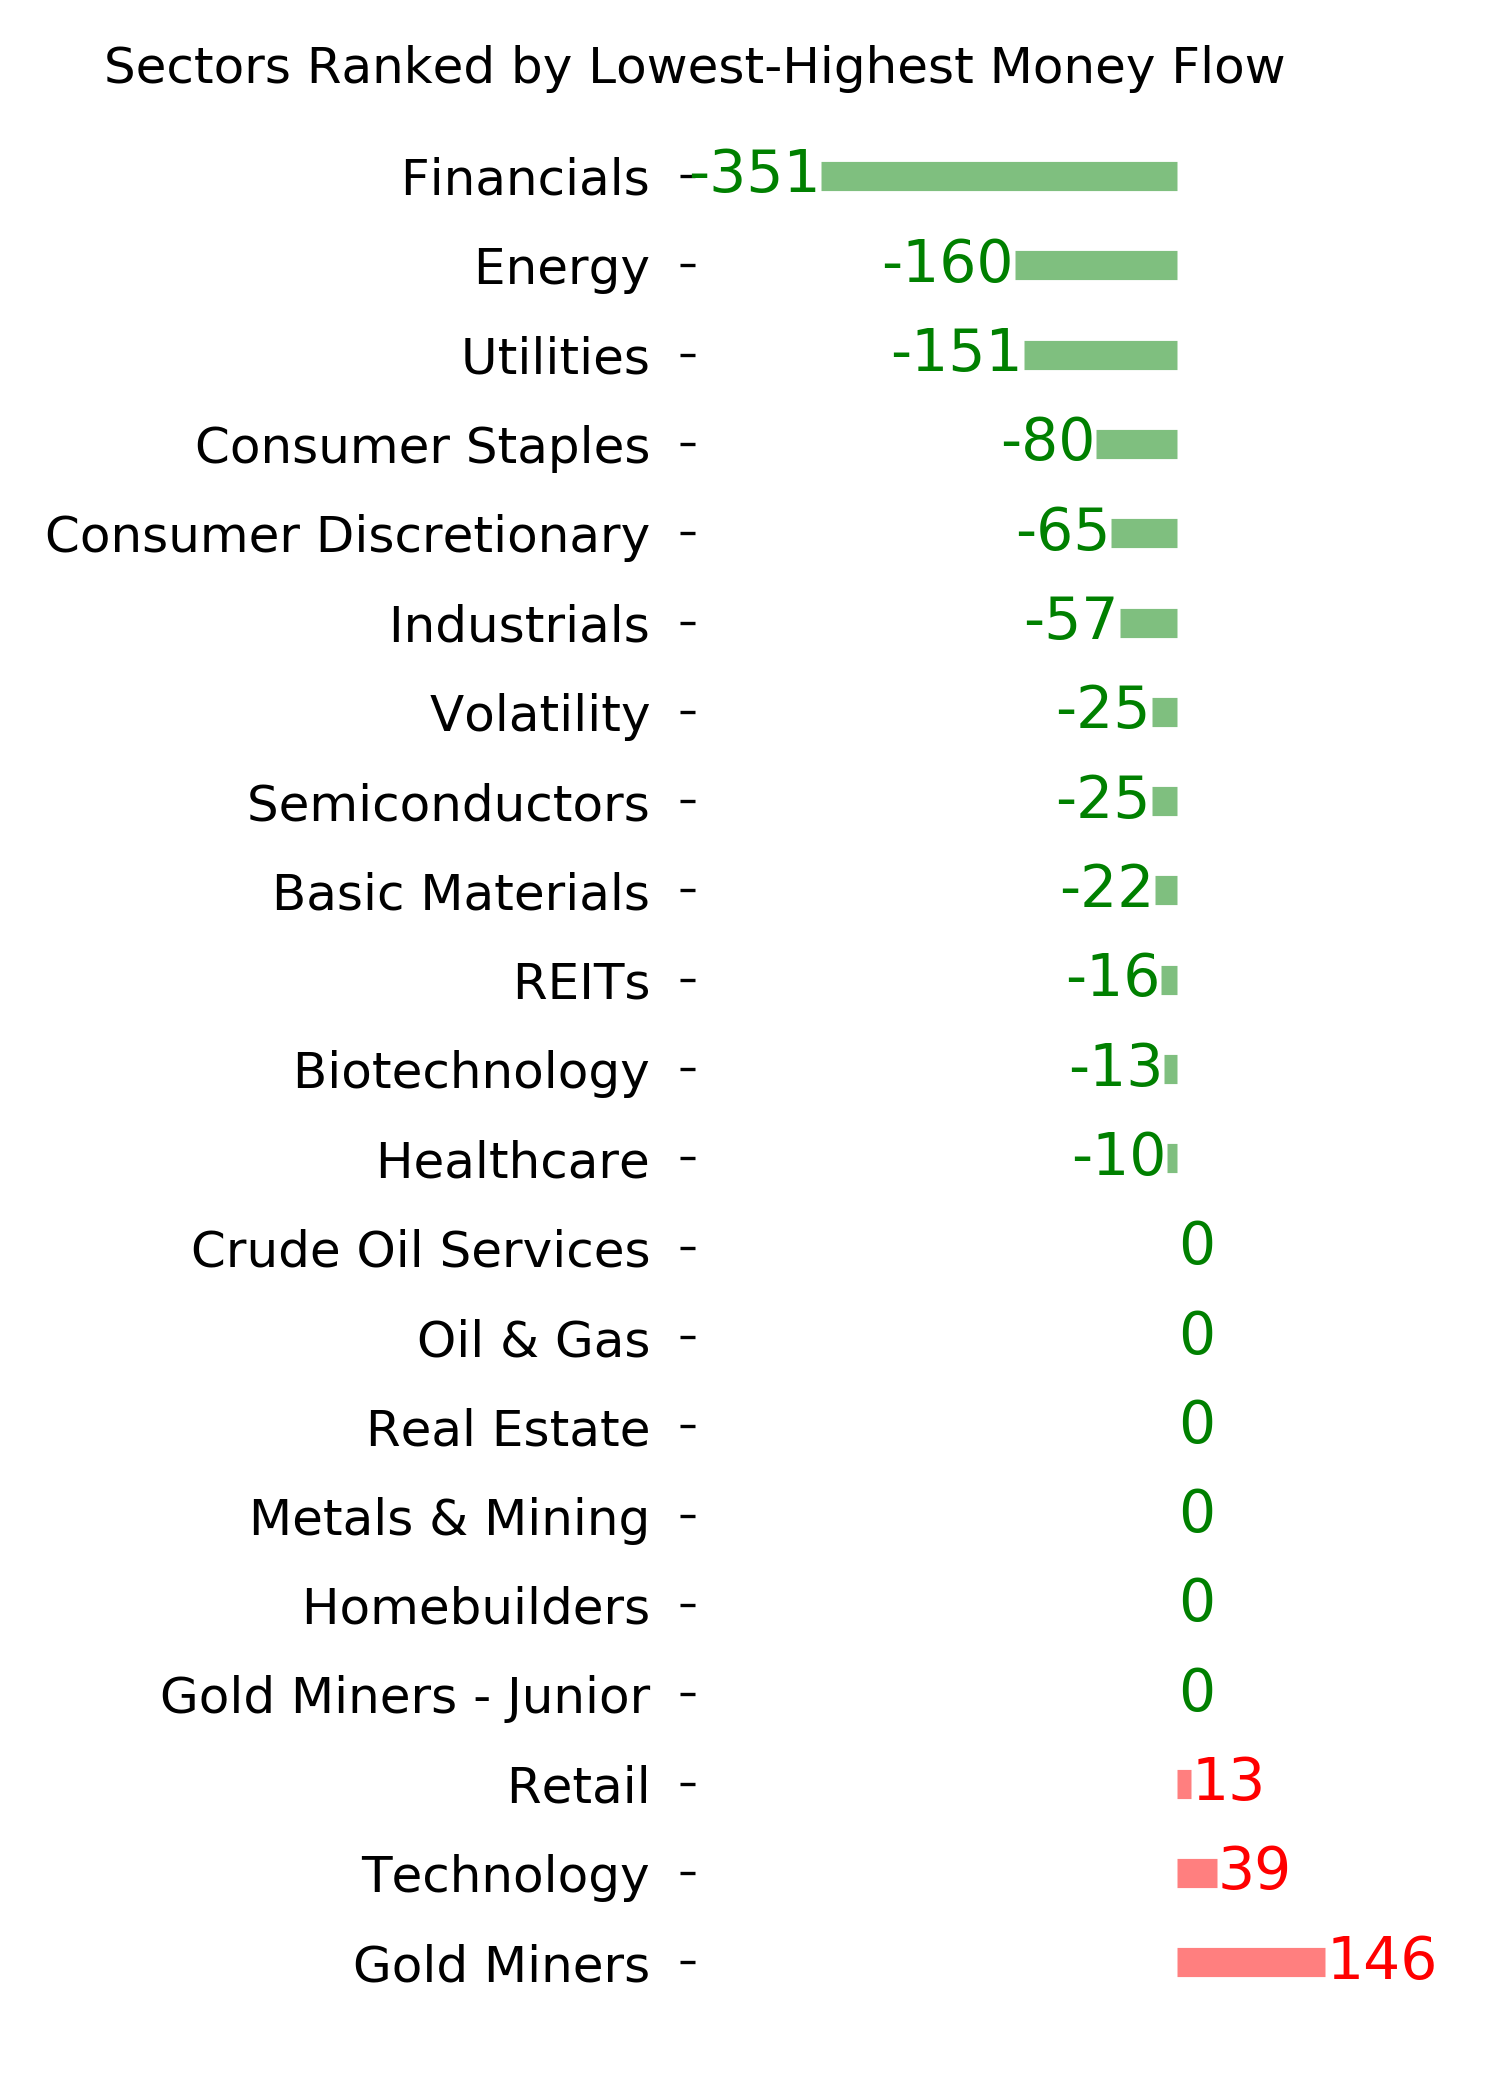
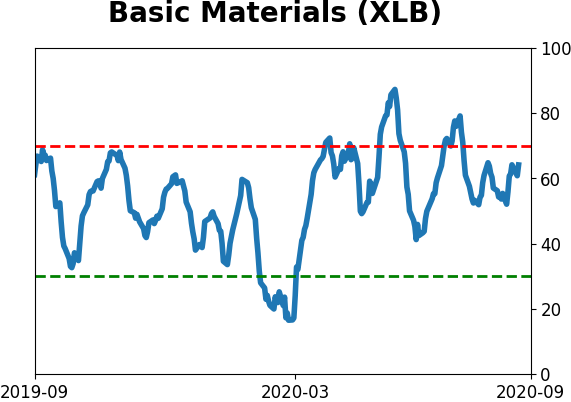
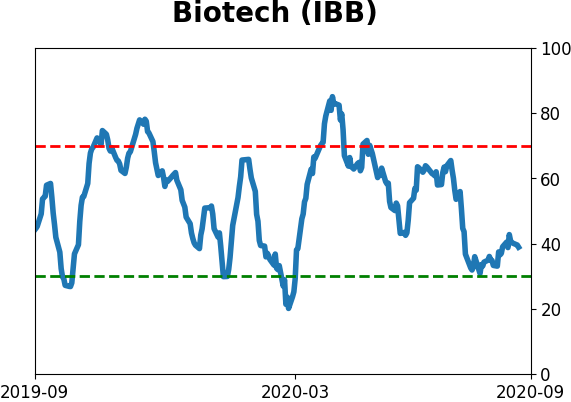
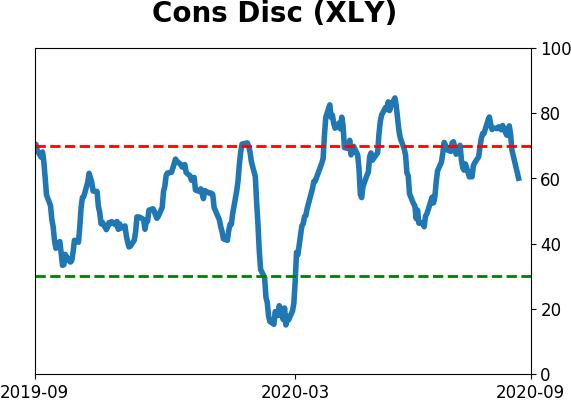
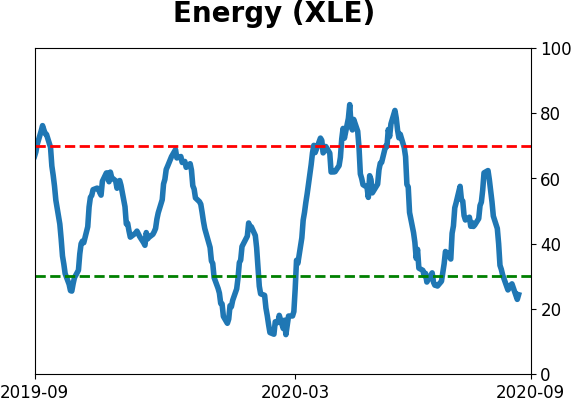
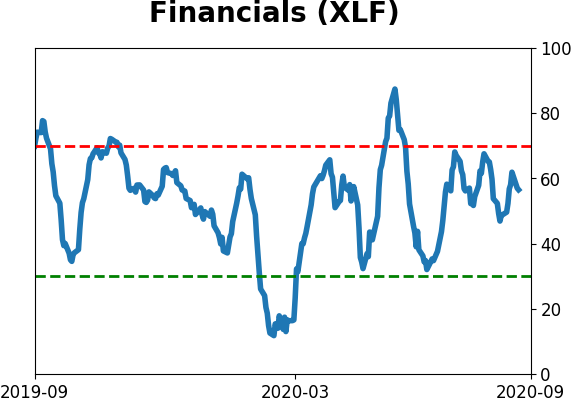
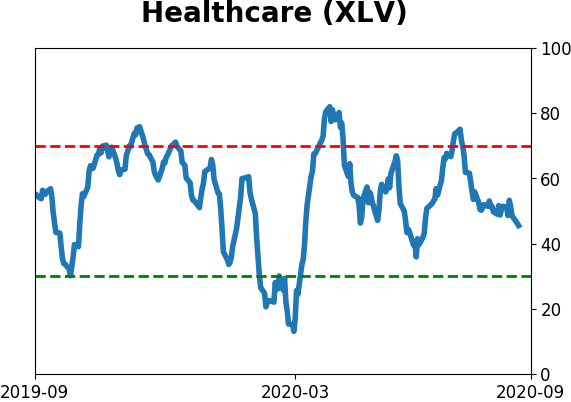
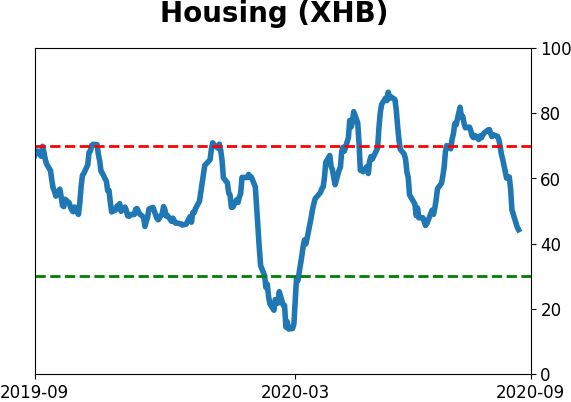
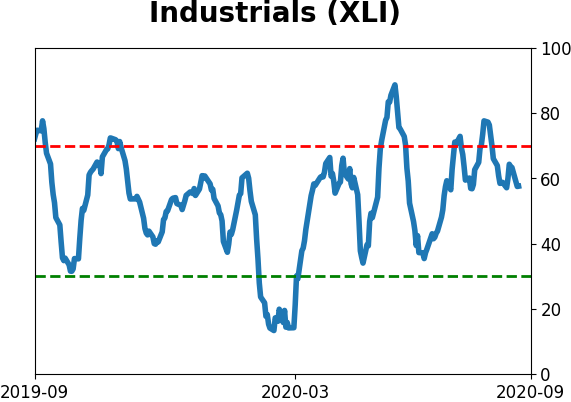
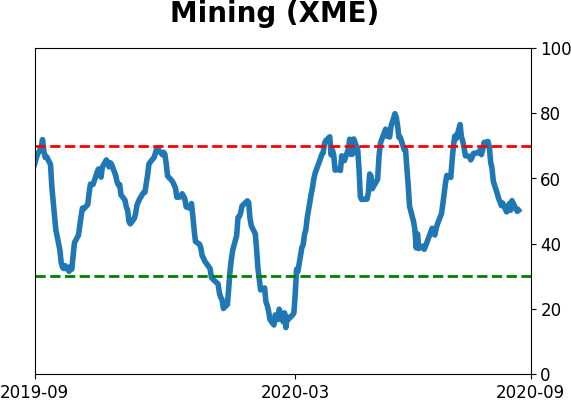
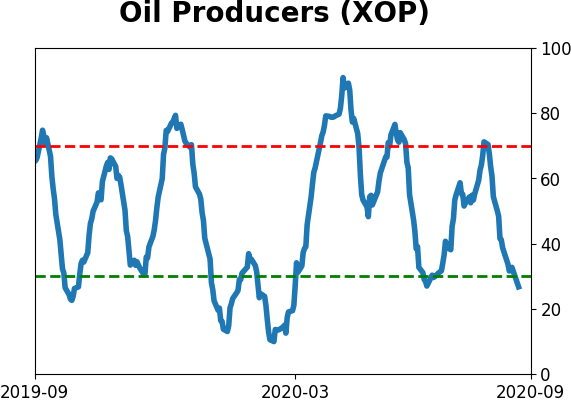
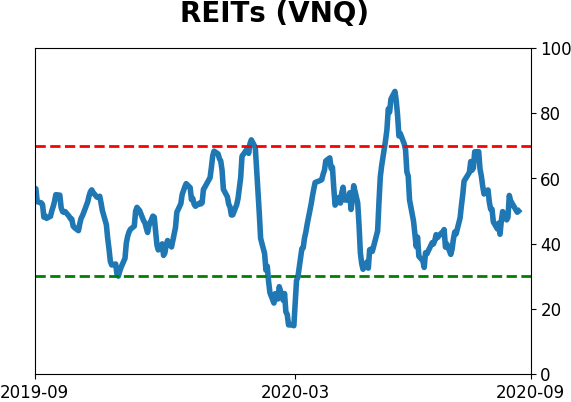
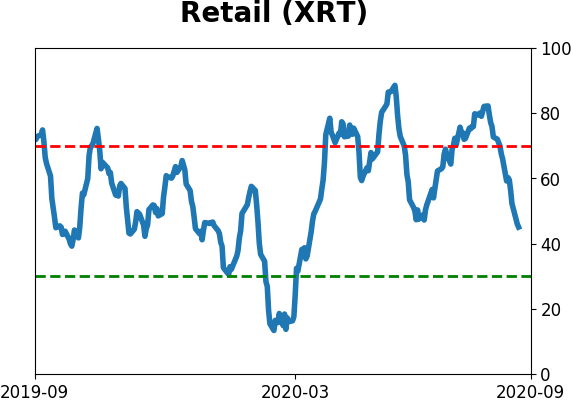
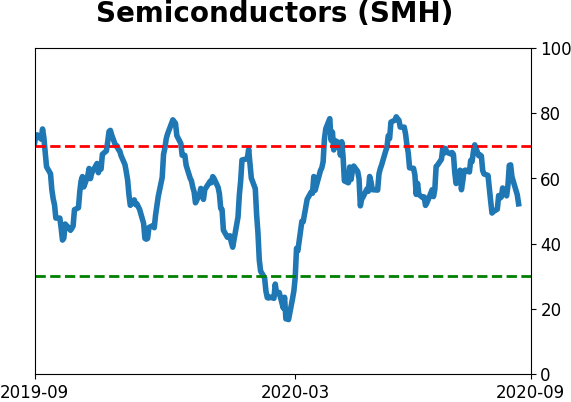
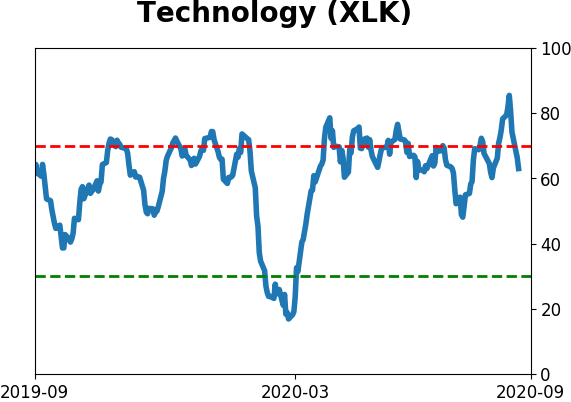
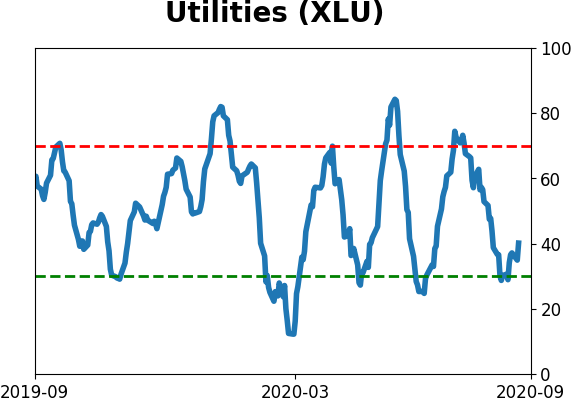
Sector ETF's - 10-Day Moving Average
|
|
|
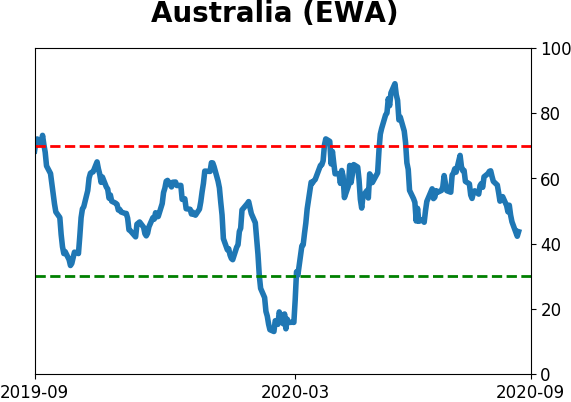
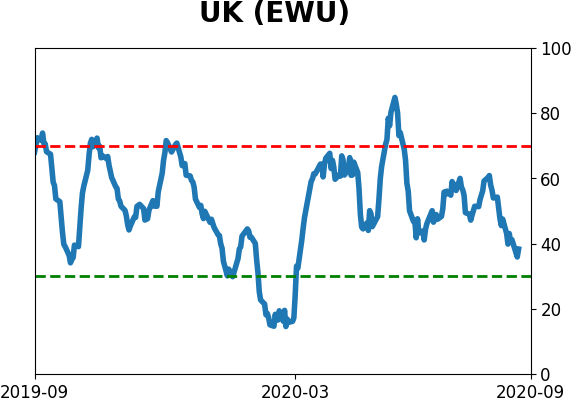
Country ETF's - 10-Day Moving Average
|
|
|
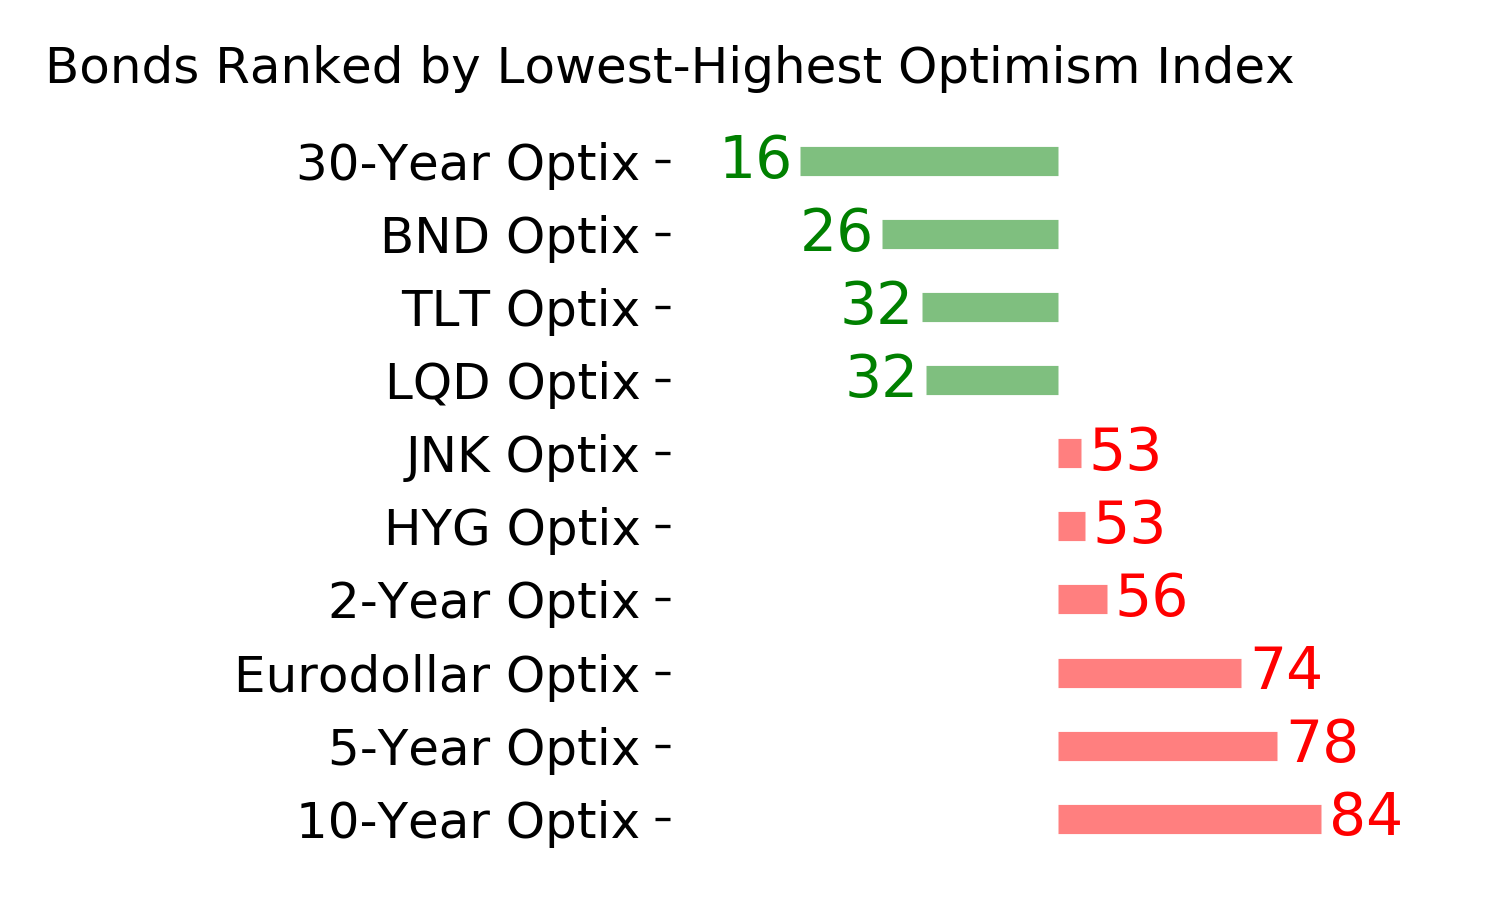
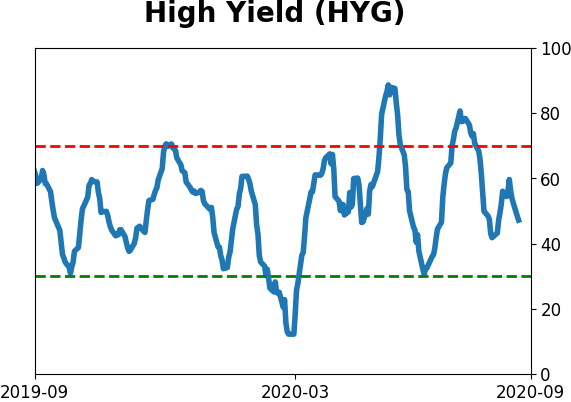
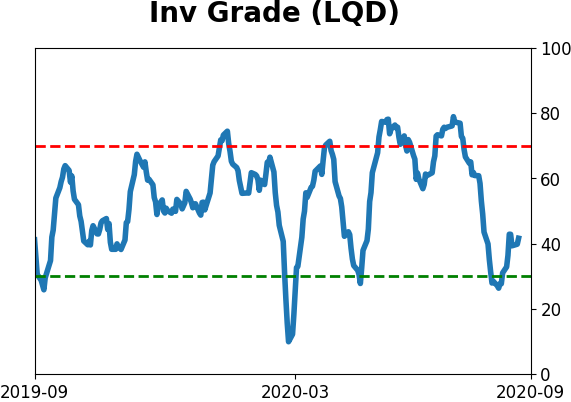
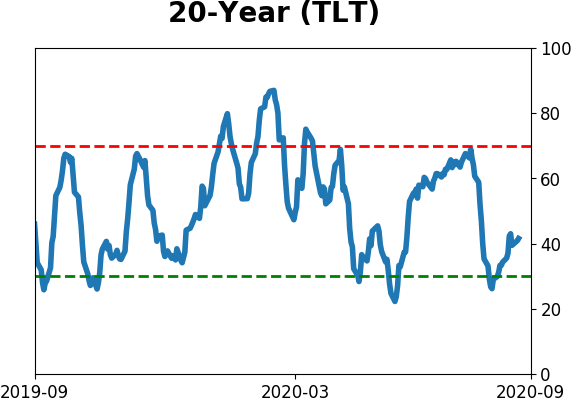
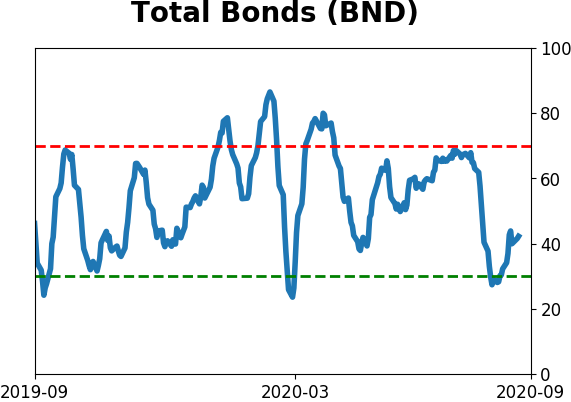
Bond ETF's - 10-Day Moving Average
|
|
|
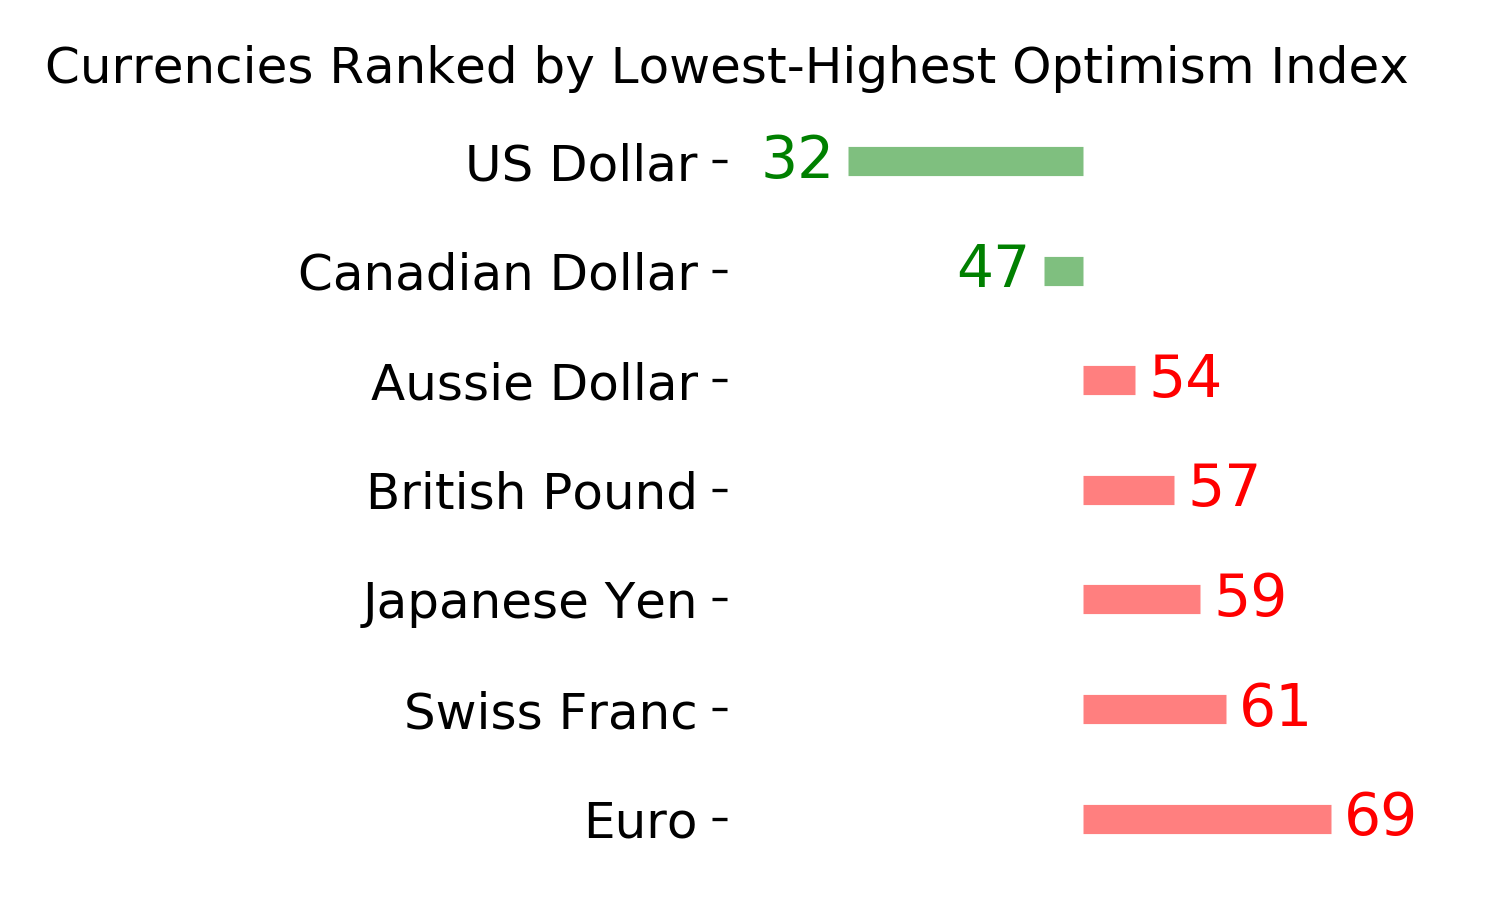
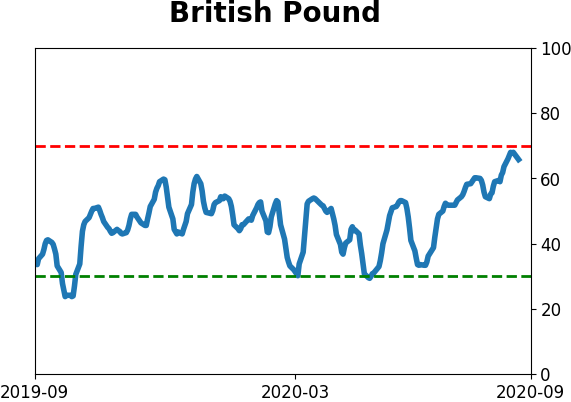
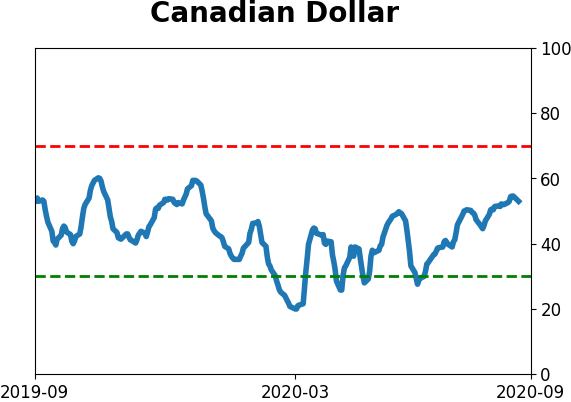
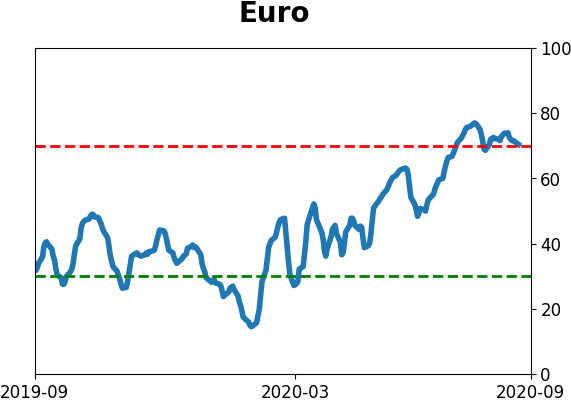
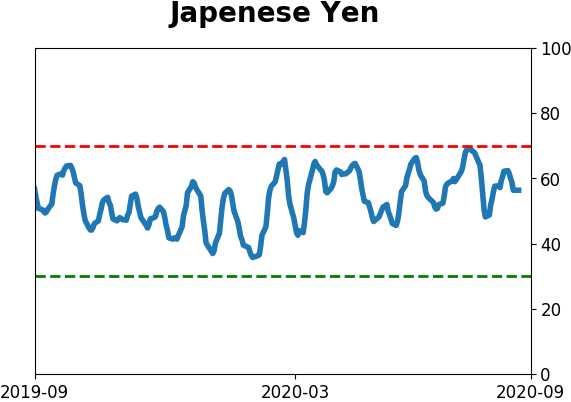
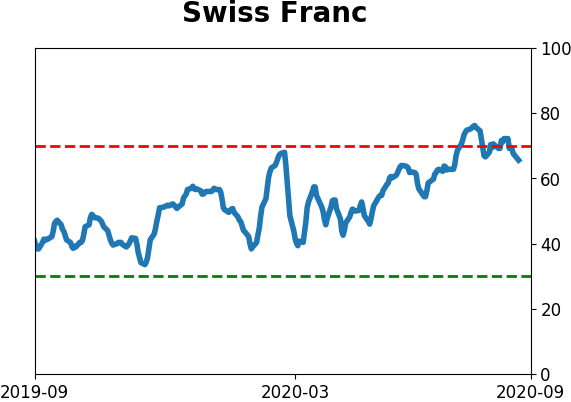
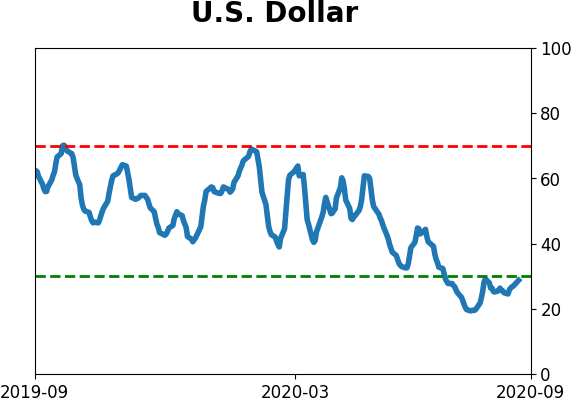
Currency ETF's - 5-Day Moving Average
|
|
|
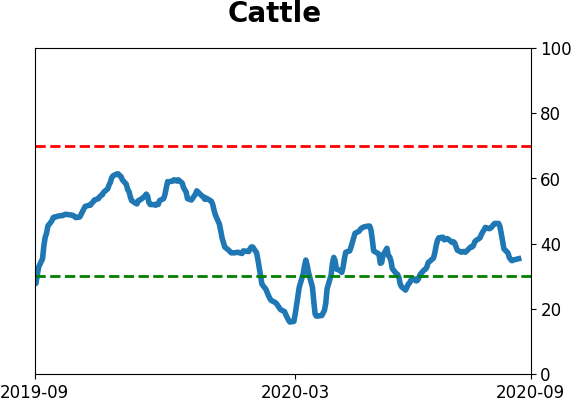
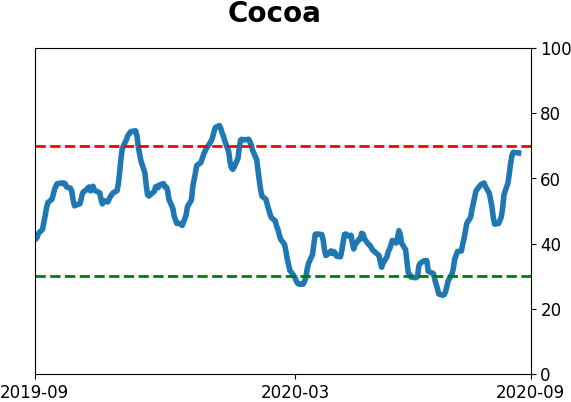
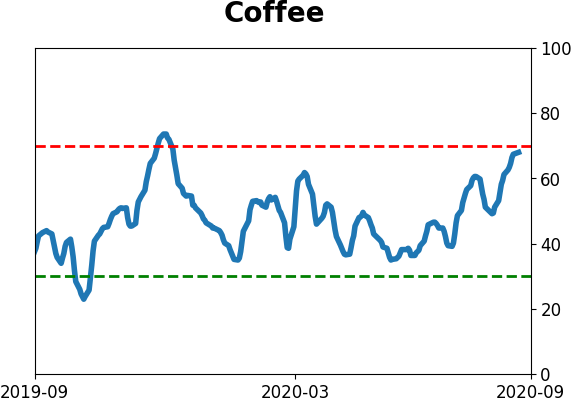
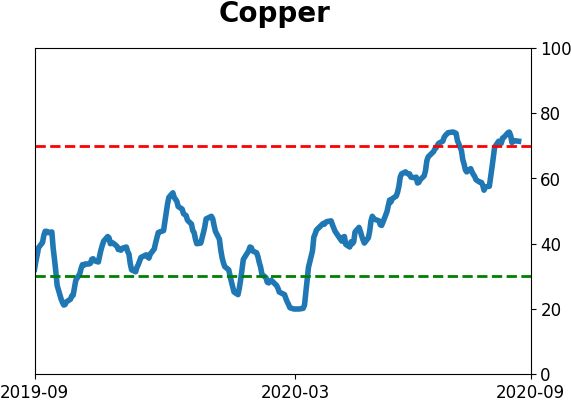
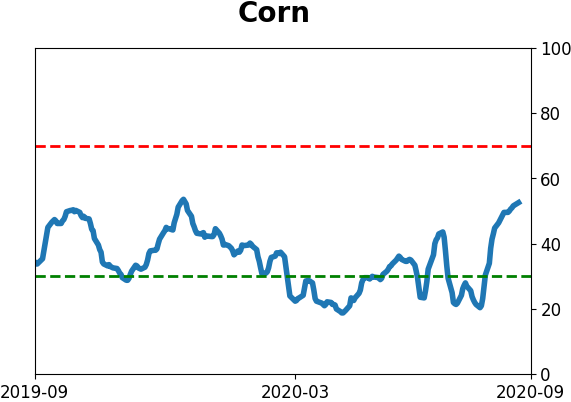
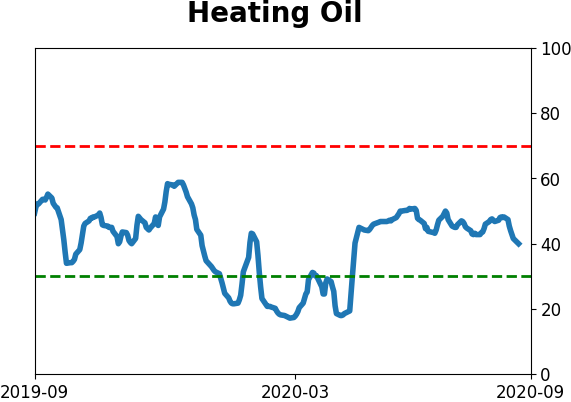
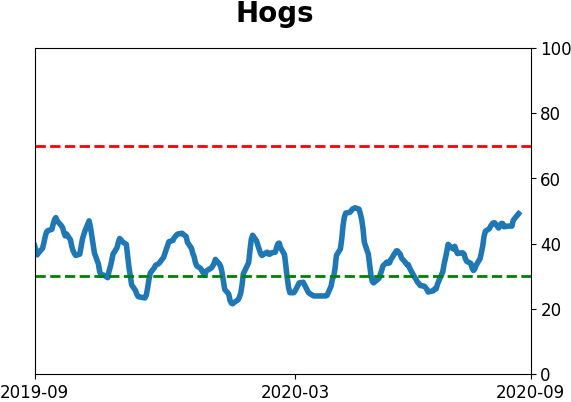
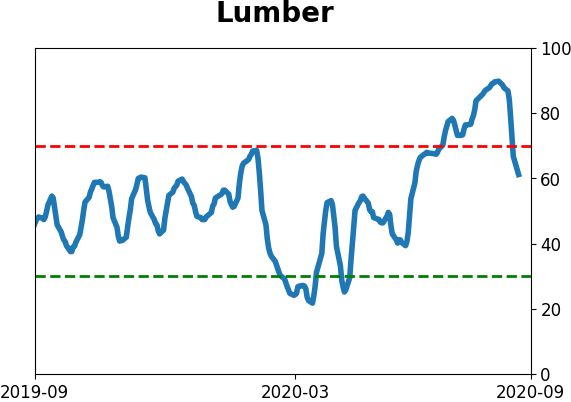
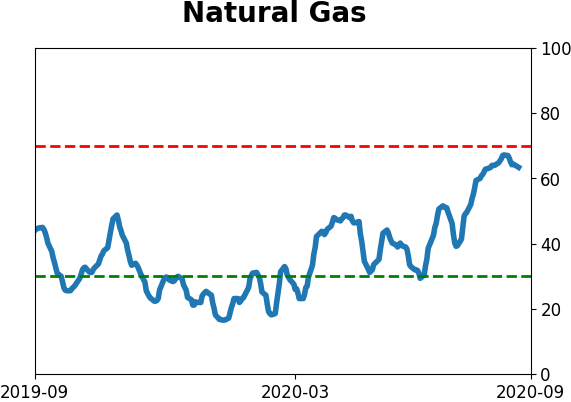
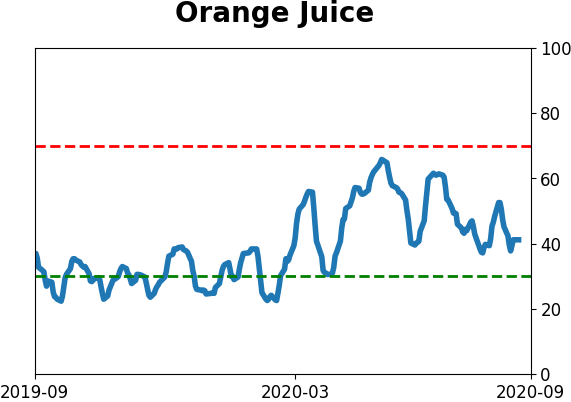
Commodity ETF's - 5-Day Moving Average
|
|