Headlines
|
|
Swallowing a chunk of unnatural supply:
Small options traders increased their bets on a short-term stock rally last week, despite the volatility. This has helped to generate a massive amount of "unnatural" buying pressure in a handful of stocks, most of which will likely need to be unwound in the coming weeks as those options expire.
Nasdaq trend starts to falter: We saw last week that if the Nasdaq Composite happens to follow past precedents, and if this happens to be a major peak, then the index is more likely to fall nearly straight down after going nearly straight up. With more weakness on Monday, that possibility gets a little bit stronger. In the process, it fell below its 50-day moving average for the first time in more than 90 sessions, ending one of its longest streaks above. The ends of other long streaks typically led to further short-term weakness. When the index had been at a multi-year high within the past two weeks, then over the next two months it gained only once out of 5 tries (the dates were 1980-12-08, 1986-07-08, 1996-06-18, 2018-02-05, an d 2020-02-24). We'll have a full table on Wednesday.
Bottom Line:
|
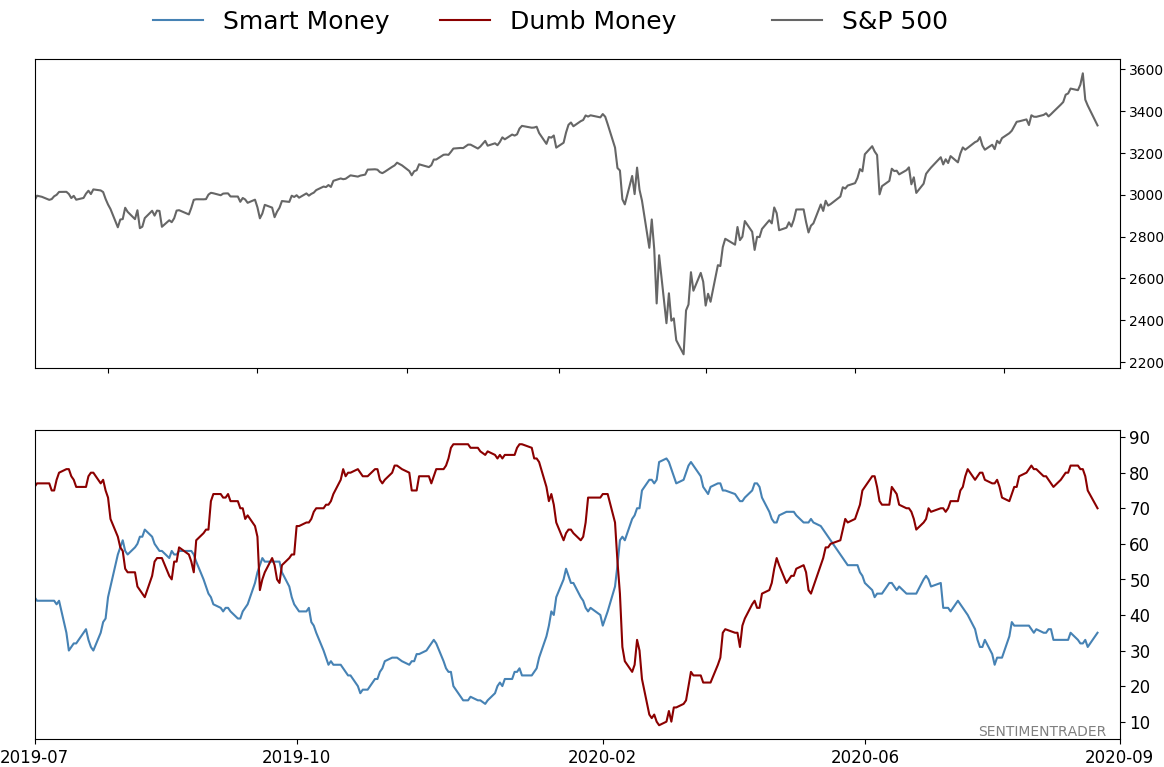
Smart / Dumb Money Confidence
|
Smart Money Confidence: 35%
Dumb Money Confidence: 70%
|
|
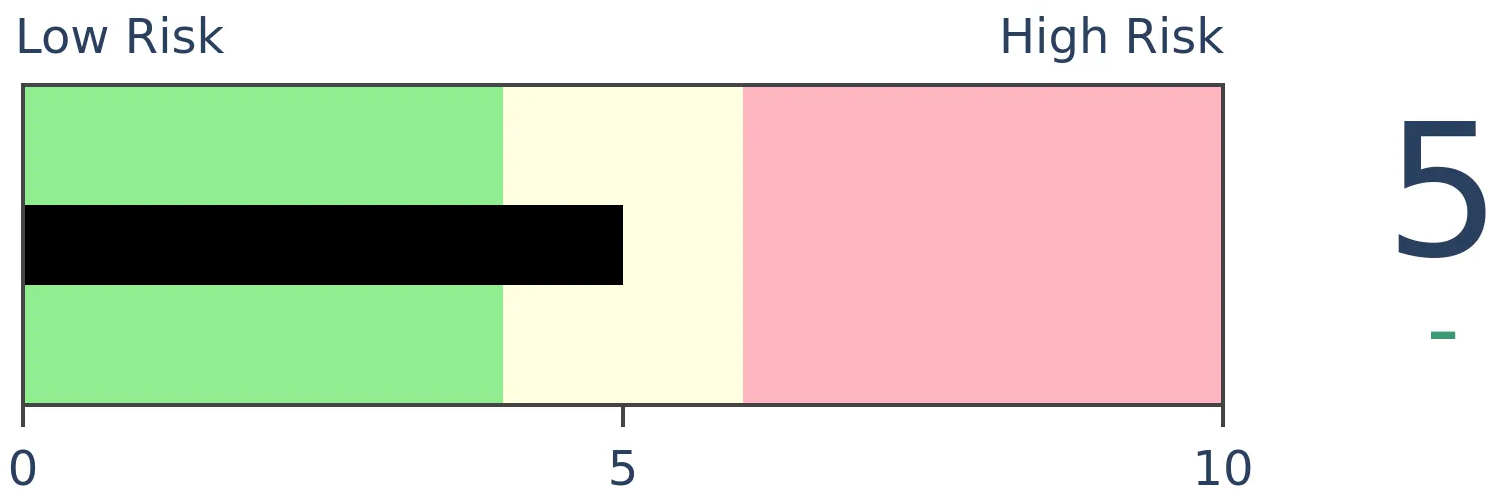
Risk Levels
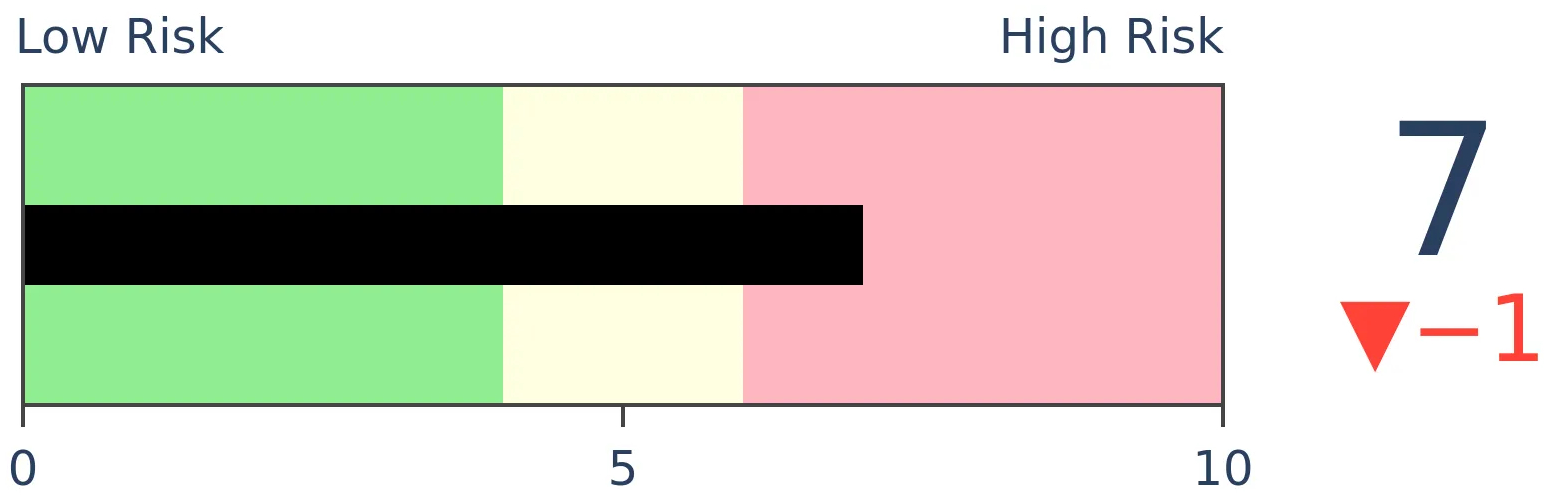
Stocks Short-Term
|
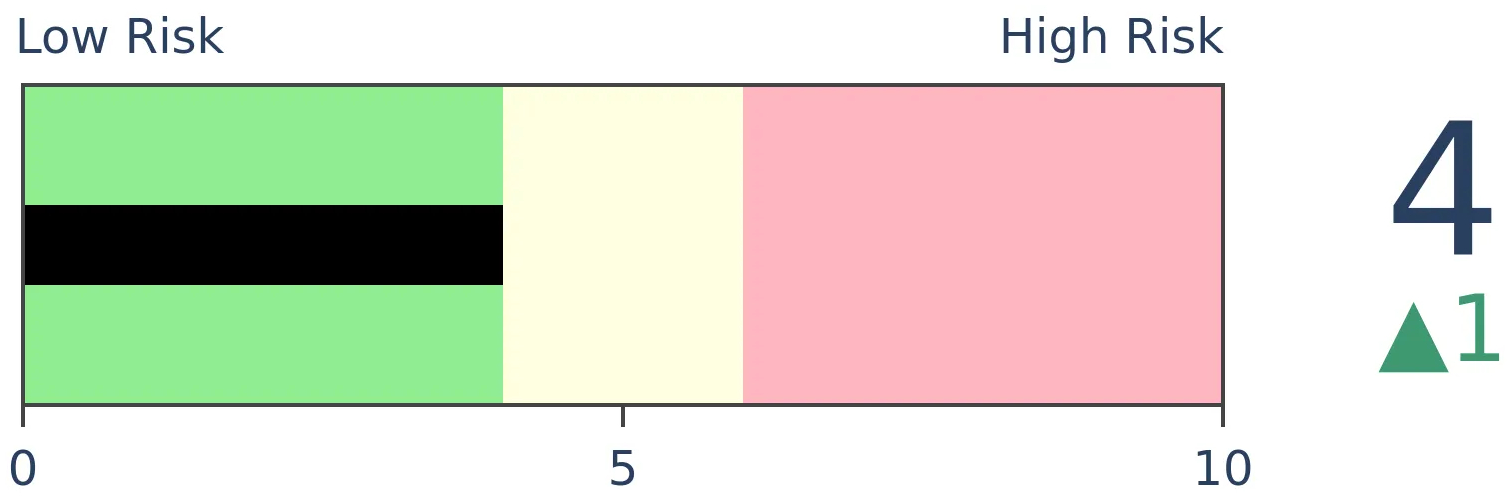
Stocks Medium-Term
|
|
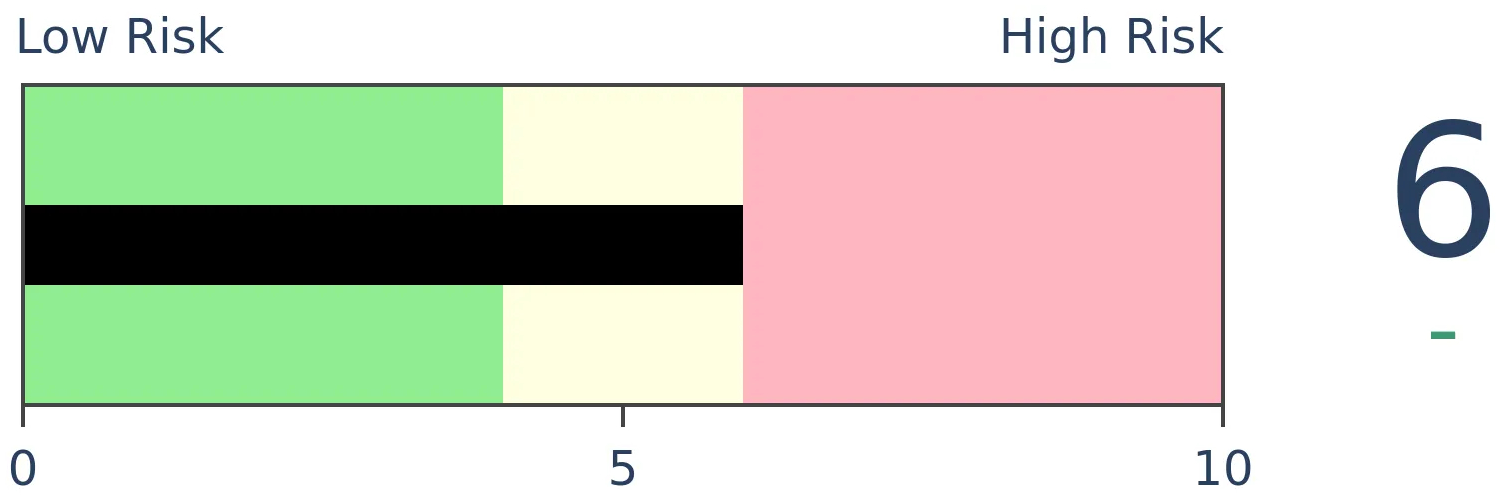
Bonds
|
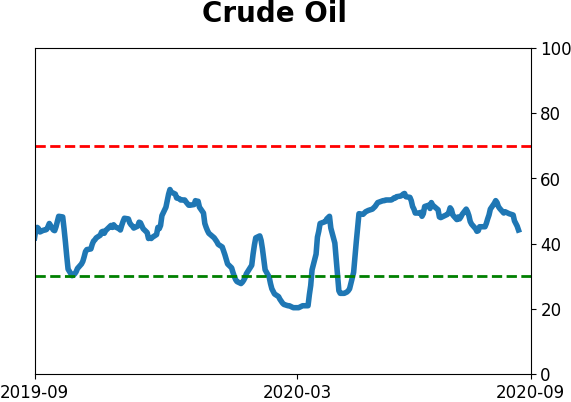
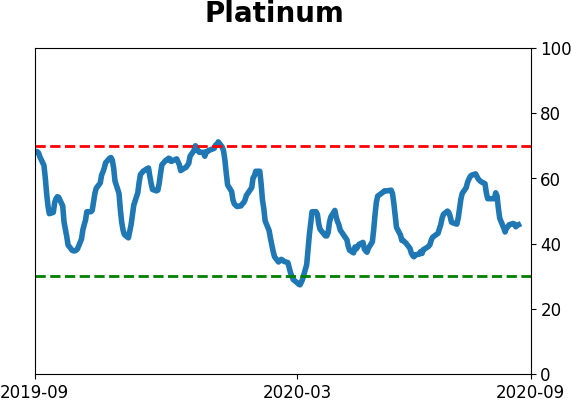
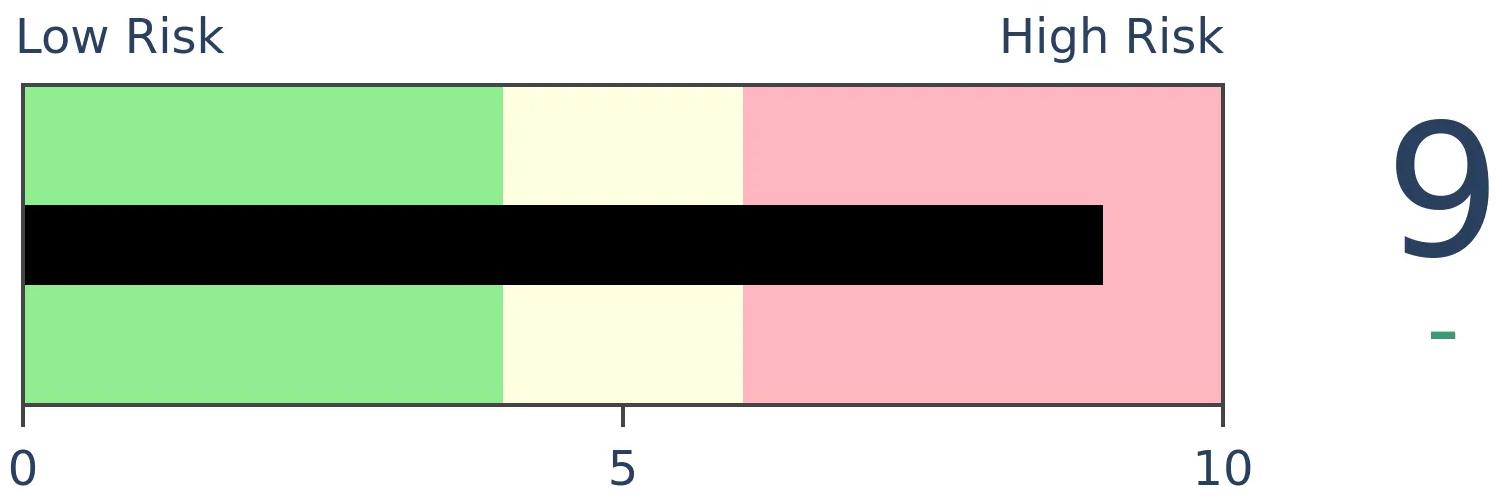
Crude Oil
|
|
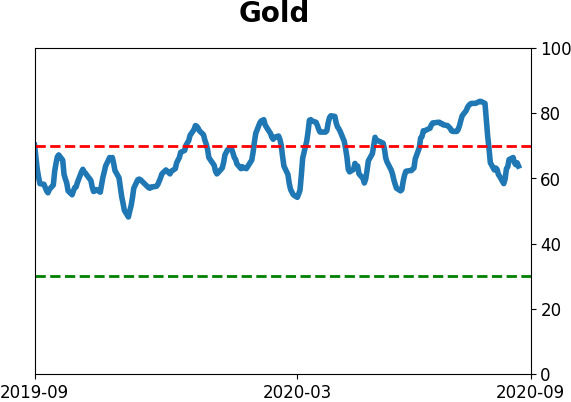
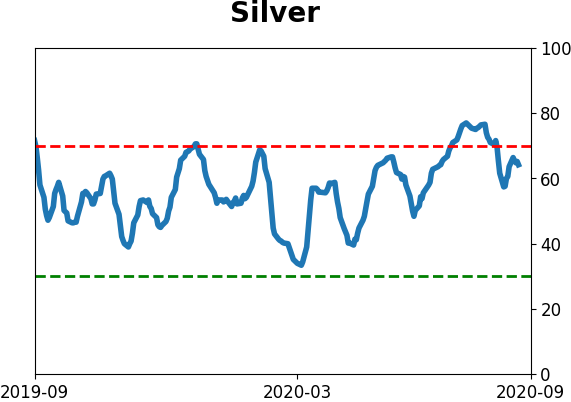
Gold

|
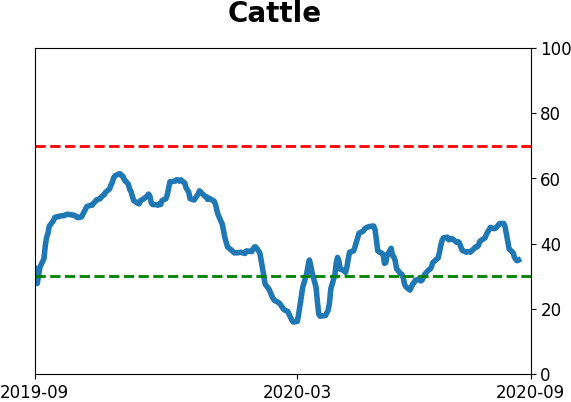
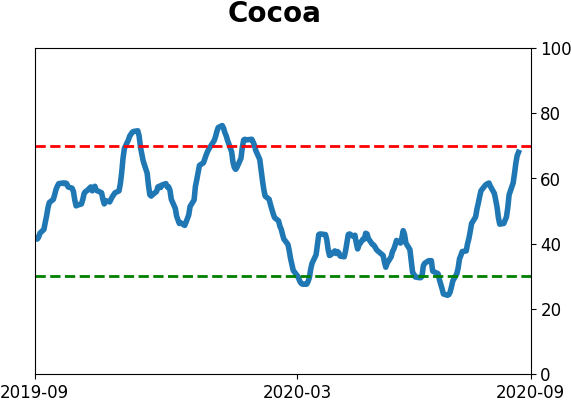
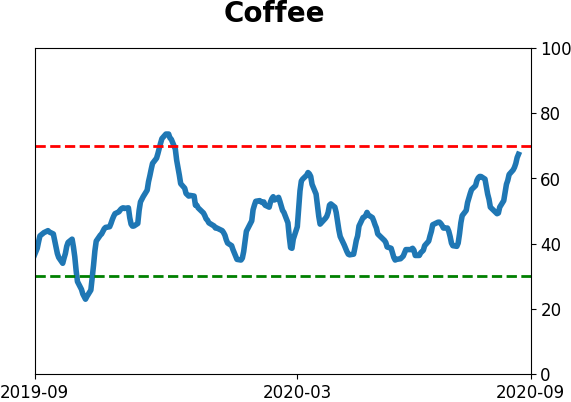
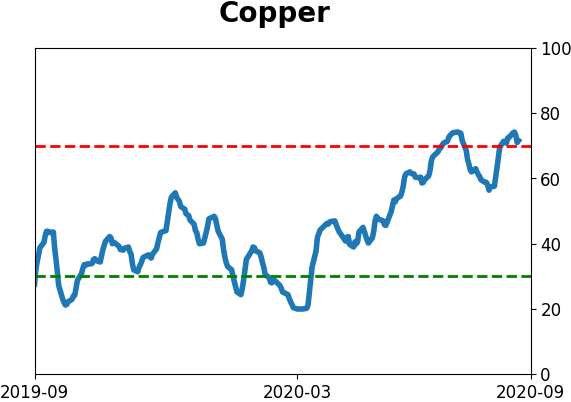
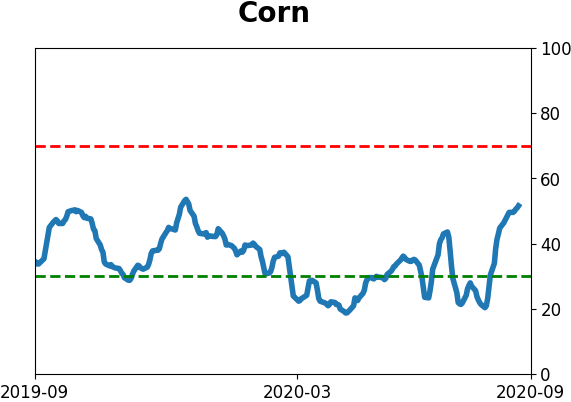
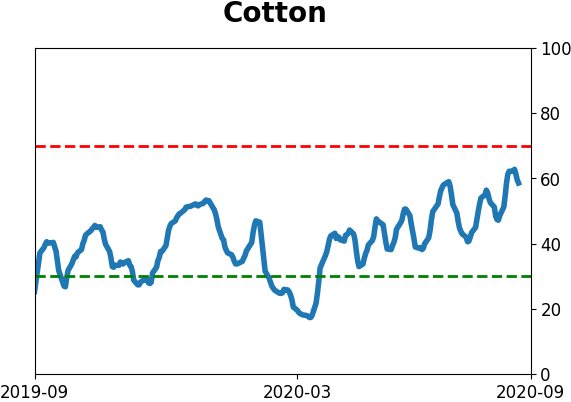
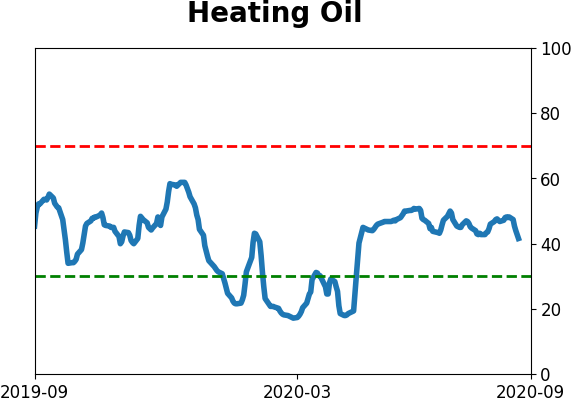
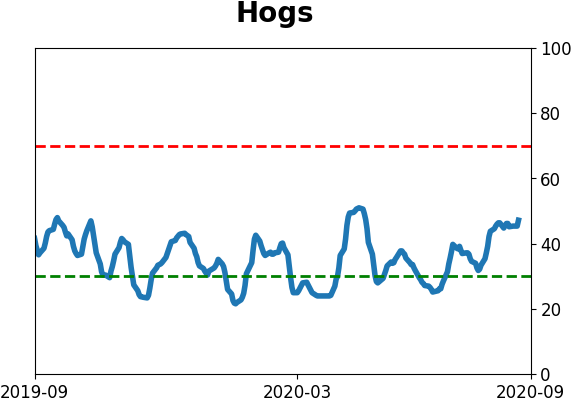
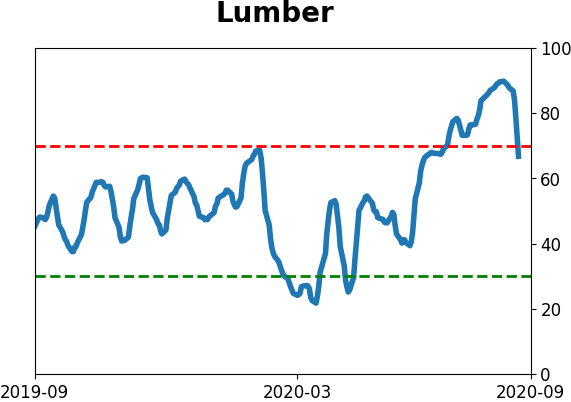
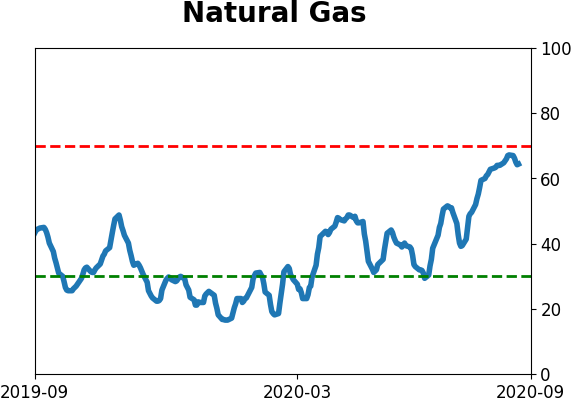
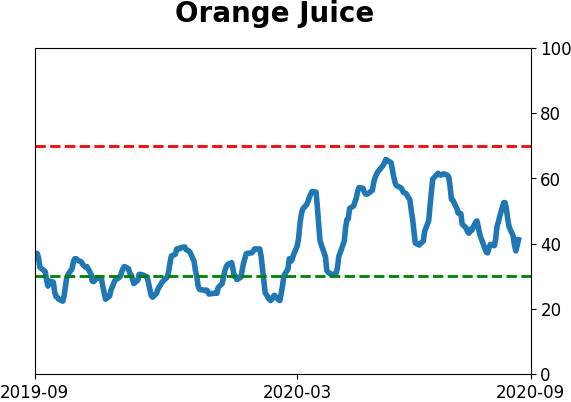
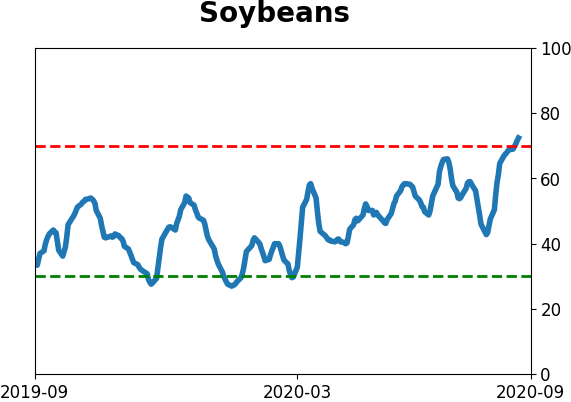
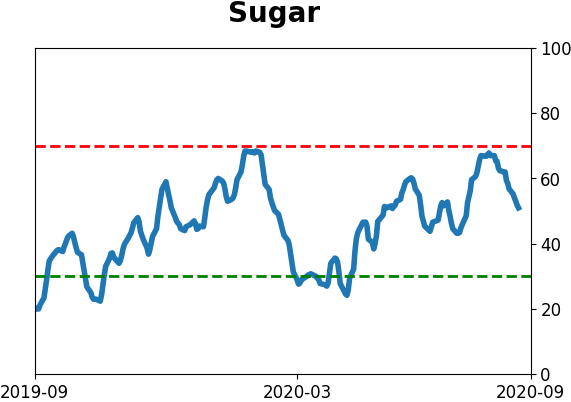
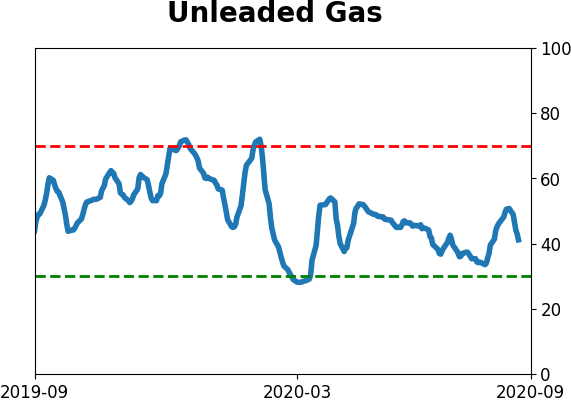
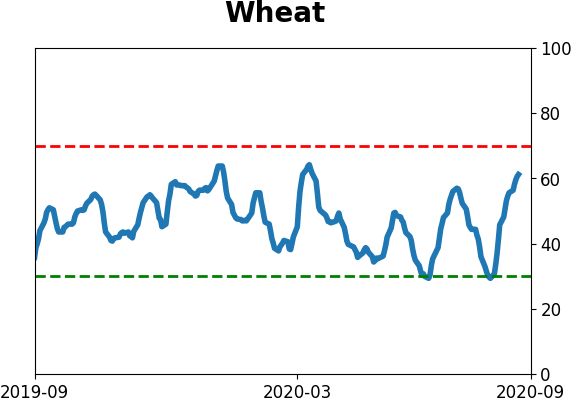
Agriculture
|
|
Research
BOTTOM LINE
Small options traders increased their bets on a short-term stock rally last week, despite the volatility. This has helped to generate a massive amount of "unnatural" buying pressure in a handful of stocks, most of which will likely need to be unwound in the coming weeks as those options expire.
FORECAST / TIMEFRAME
SPY -- Down, Medium-Term
|
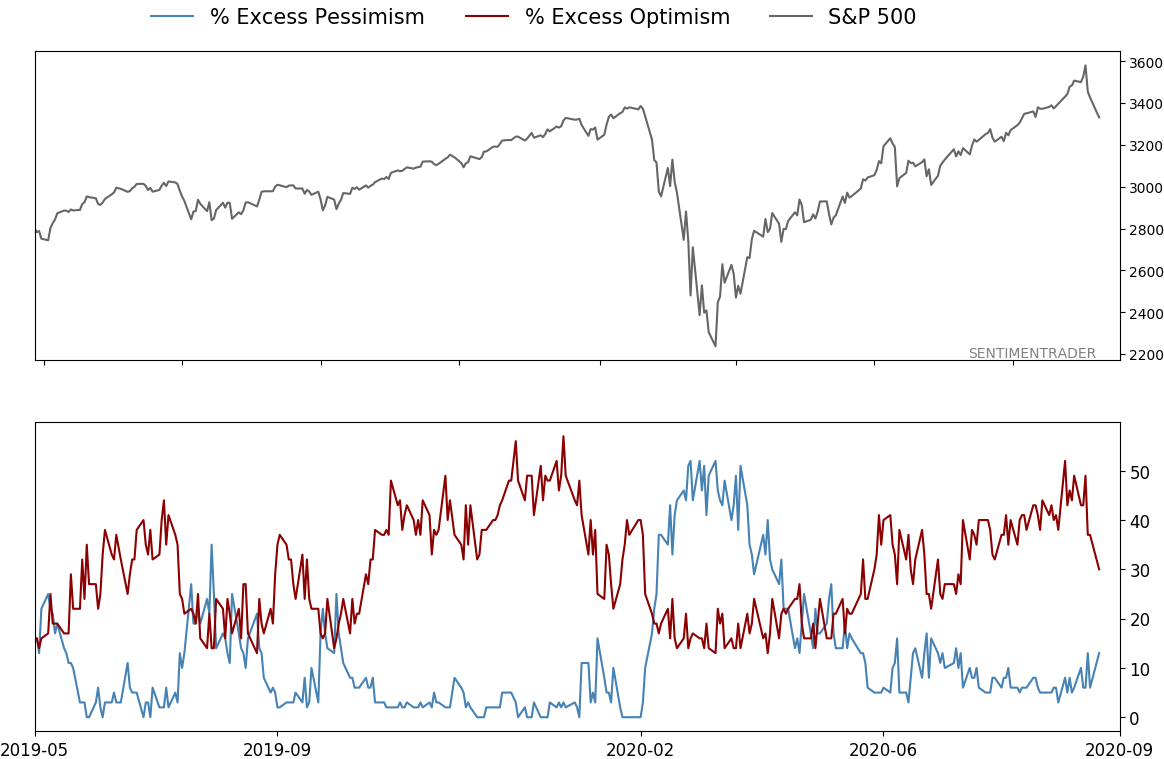
Much of August was dominated by big indexes, which in turn have become dominated by big stocks, soaring to new highs. Under the surface, a lot of oddities have been bubbling, but to no effect. To a near-record degree in August, indexes were hitting highs with more stocks declining than advancing, leading to a nearly unprecedented split between sectors, and even between indexes and their underlying stocks.
Due in part to those oddities, indexes like the S&P 500 had been able to score new high after new high despite high optimism and risk. Almost never before has "dumb money" been so right.
Perhaps now we know why.
The biggest story in markets over the past few days has been the unveiling of Softbank as a large buyer of call options on a few big tech stocks. In a premium note over the weekend, we saw why it's not really the true story at all. It's easy to package and sensationalize a simple narrative that a single huge entity has been buying a bunch of calls. The more accurate story is that it's mom-and-pop driving these stocks higher, not Softbank.
In the weekend piece, we only looked at trades for 10 contracts or fewer. Unless Softbank's traders divided up their orders into tiny lots, these are orders by the average stay-at-home gambler. And last week's volatility didn't discourage them, it did the exact opposite. They added to their bullish bets.
Among trades for 10 contracts or less, 53% of total volume went into buying call options to open. That's a record high.
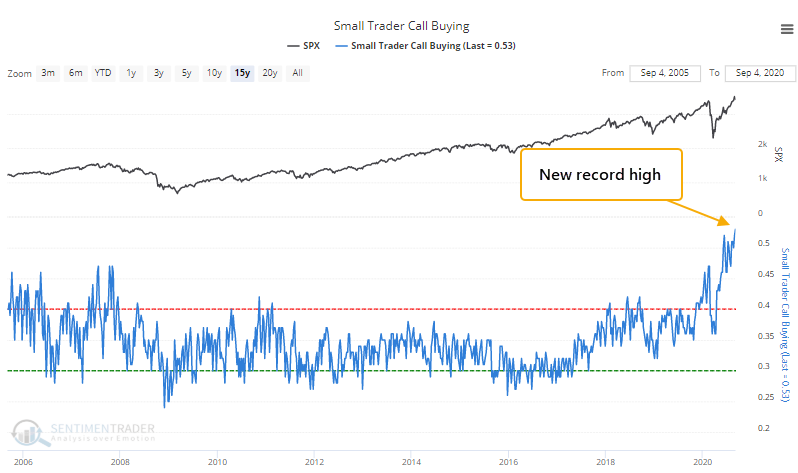
These small traders have become the biggest part of the options market. Since mid-July, trades for 10 contracts or fewer have consistently accounted for more than 60% of all opening call purchase premiums, massively dwarfing larger trade sizes.
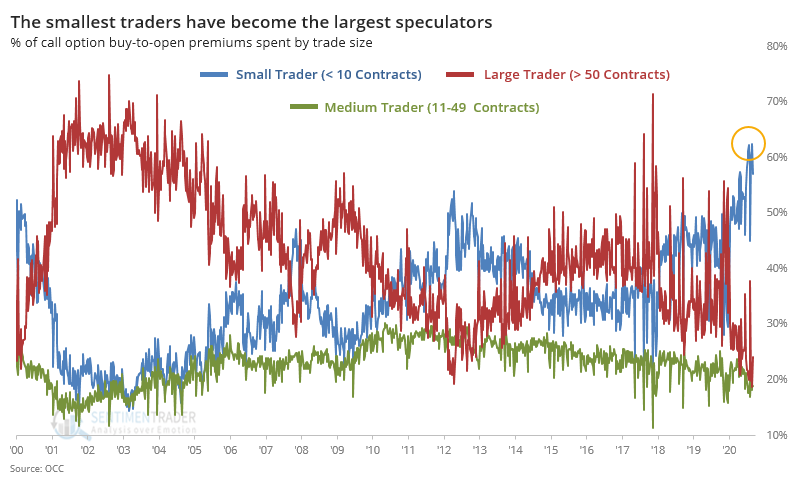
If we expand the universe from what we looked at on Saturday and examine at all trades for under 50 contracts, then we can see how spectacular their activity has become.
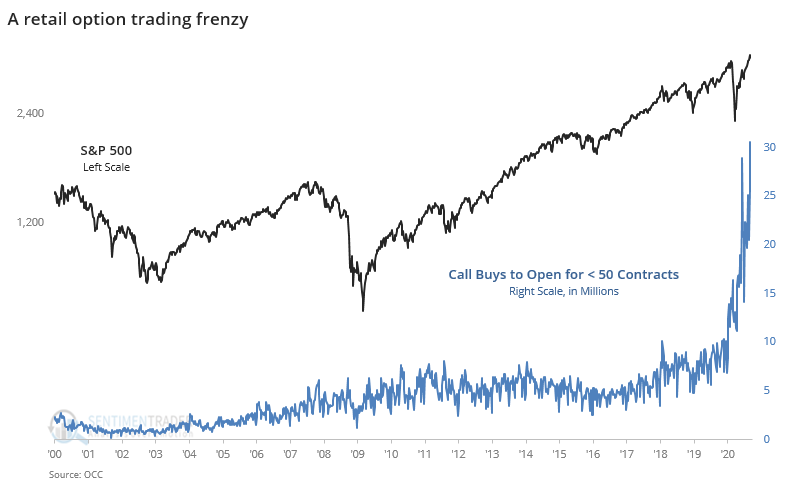
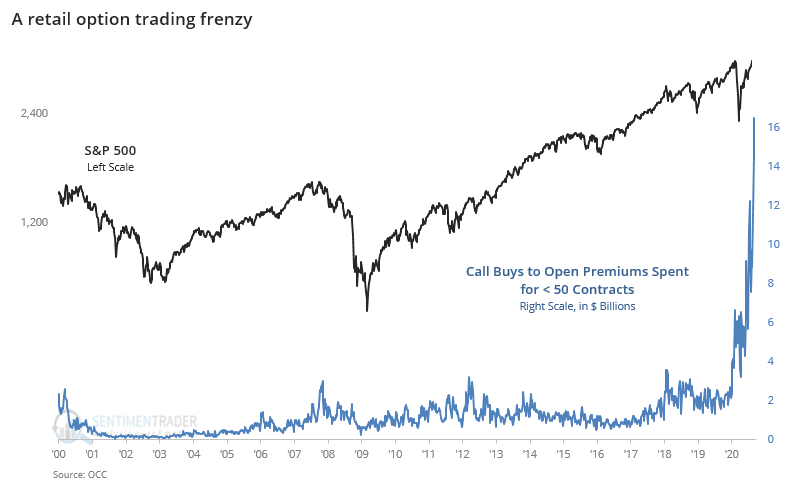
Because options prices have become more expensive in recent weeks - an extremely unusual condition in a rising stock market - these call buyers have spent an ever-increasing amount for their bets, so that the premiums paid for their speculative calls has truly gone parabolic. Last week alone, retail traders spent more than $16.5 billion on these lottery tickets.
This has a multiplicative effect in the underlying stocks under certain conditions, explained in detail by Benn Eifert. He posted a Twitter thread explaining how a buyer of Amazon call options can trigger an avalanche of buy orders on the underlying stock, causing an effect many times greater than the implied leveraged of the options.
When someone buys a call option to open, somebody else has to agree to the other side of that contract and sell it to them. When they sell a call option to open, they're at risk of losing money if the stock price rises. To hedge against that upside risk, they buy the underlying stock, driving the price even higher.
The keys are:
- Delta - how sensitive the option is to changes in the price of the underlying shares
- Gamma - how much that delta changes
To visualize this, imagine Benn's scenario of a single small option trade resulting in a market maker having to buy an increasing amount of stock to stay hedged and limit her risk.
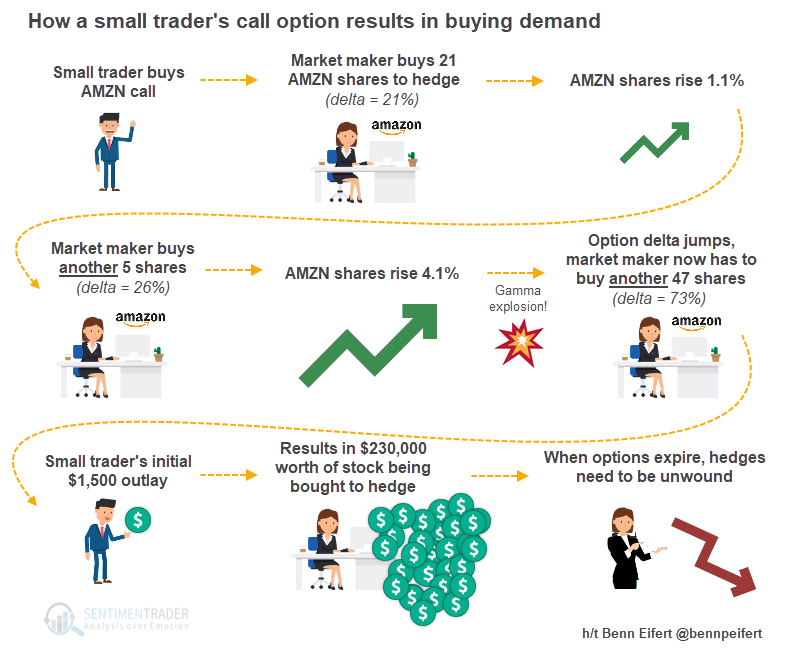
Traders taking the other side of opening options contracts constantly juggle their exposure, and most of the time it has little to no impact on the underlying stocks; it just one more of a thousand different influences. Once every couple of years, though, there seem to be short periods when traders suddenly expand their options presence, gamma changes rapidly, and the underlying dynamics are enough to influence the entire market.
Let's look at this in the most comprehensive way we can without having access to the actual underlying trades. We'll look at the premiums paid for all retail call options bought to open, subtract premiums paid for puts, add a conservative multiplier to estimate how much stock the offsetting traders might have had to buy for a hedge, and compare that to the value of the S&P 500.
This is really stunning, beyond anything we've ever seen before.
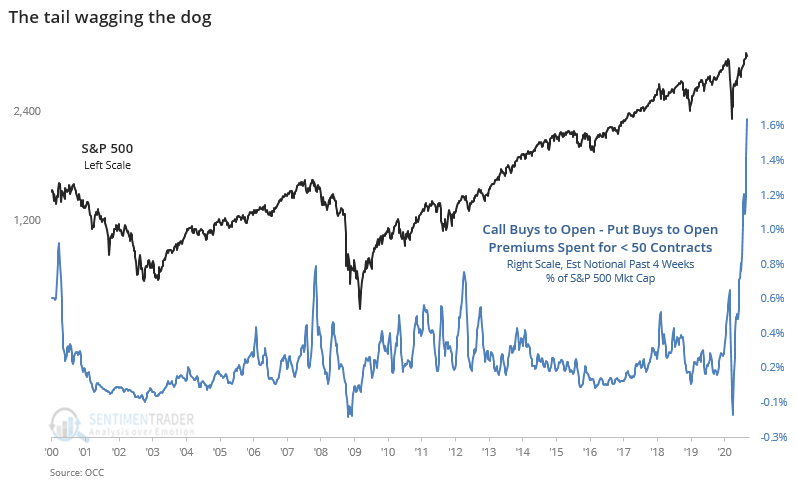
Looked at this way, over the past four weeks, retail traders have (very roughly) generated a net $472 billion notional amount of exposure, accounting for nearly 1.7% of the S&P 500's entire market cap. In reality, their leverage, given dramatic jumps in delta over the past two weeks, was likely much, much higher.
And it was focused in only a handful of stocks. And it was concentrated in soon-to-expire contracts.
This means that in the coming weeks, most of these contracts are going to expire, exposing traders who bought the underlying stocks as a hedge. Unless they sell - and that's a lot of stock to sell. Clearly, there is some underlying "natural" demand for stocks, especially with interest rates essentially pegged at 0%. The big question is whether on a shorter-term time frame it will be enough to absorb what is likely going to be a big chunk of "unnatural" supply.
Active Studies
| Time Frame | Bullish | Bearish | | Short-Term | 0 | 1 | | Medium-Term | 1 | 12 | | Long-Term | 47 | 2 |
|
Indicators at Extremes
Portfolio
| Position | Weight % | Added / Reduced | Date | | Stocks | 15.3 | Reduced 4.2% | 2020-09-03 | | Bonds | 0.0 | Reduced 6.7% | 2020-02-28 | | Commodities | 2.4 | Reduced 2.1%
| 2020-09-04 | | Precious Metals | 0.0 | Reduced 3.6% | 2020-02-28 | | Special Situations | 5.1 | Added 5.1% | 2020-09-03 | | Cash | 77.2 | | |
|
Updates (Changes made today are underlined)
After stocks bottomed on March 23rd, they enjoyed a historic buying thrust and retraced a larger amount of the decline than "just a bear market rally" tends to. Through June, there were signs of breadth thrusts, recoveries, and trend changes that have an almost unblemished record at preceding higher prices over a 6-12 month time frame. On a shorter-term basis, our indicators have been showing high optimism, with Dumb Money Confidence recently above 80%, along with signs of reckless speculation during what appears to be an unhealthy market environment, historically a bad combination. While there are certainly some outlier indicators that are showing apathy or even outright pessimism, a weight-of-the-evidence approach suggests high risk over a multi-week to multi-month time frame. That has been the case since July, even arguably June and yet the major indexes hit continual new highs through late August. With the indicators and studies failing to precede any weakness, I've been hesitant to lower my already-low exposure. I am getting increasingly anxious about the oddities we're seeing, though, and lowered it again. This account is mostly about comfort with risk for me, and right now I'm not at all comfortable with any of it. In more than 25 years of experience, this is the oddest market I've ever seen. I lowered exposure again - likely the lowest I'm willing to go at this point given longer-term positives - and decided to switch to an equal-weight version of the S&P 500 index. I've become intensely uncomfortable with the concentration in the cap-weighted index. Our studies have been mixed with regard to the potential for the equal-weight version to outperform the cap version going forward, so historical support isn't overwhelming. I'm also increasingly interested again in energy stocks, starting with a small allocation. I got burned in March with the unprecedented geopolitical spat that hammered those stocks then but the longer-term setup is decent.
RETURN YTD: -0.9% 2019: 12.6%, 2018: 0.6%, 2017: 3.8%, 2016: 17.1%, 2015: 9.2%, 2014: 14.5%, 2013: 2.2%, 2012: 10.8%, 2011: 16.5%, 2010: 15.3%, 2009: 23.9%, 2008: 16.2%, 2007: 7.8%
|
|
Phase Table
Ranks
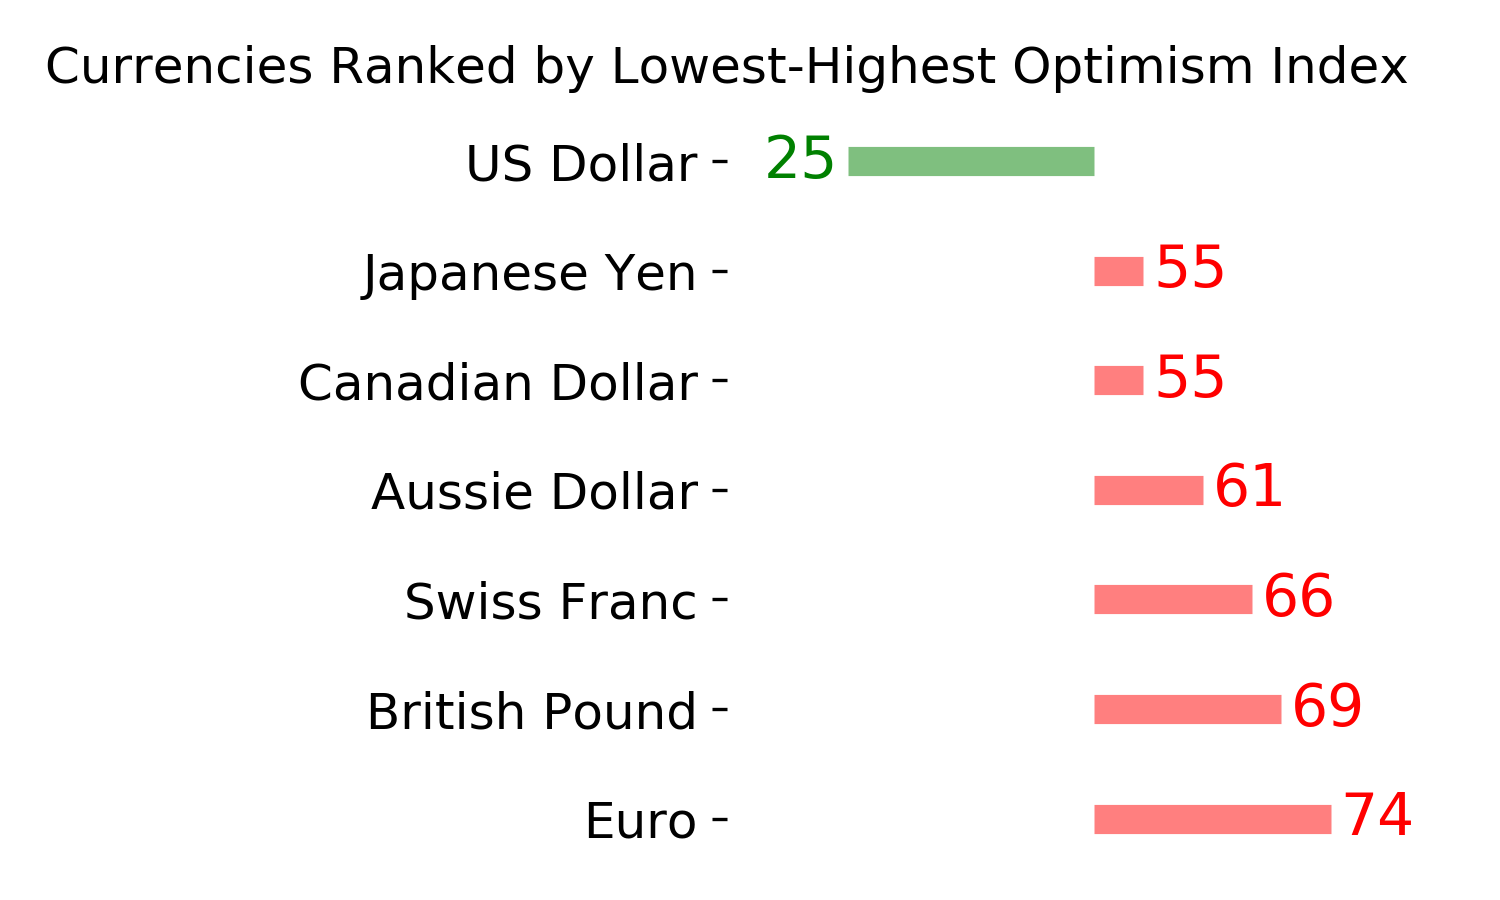
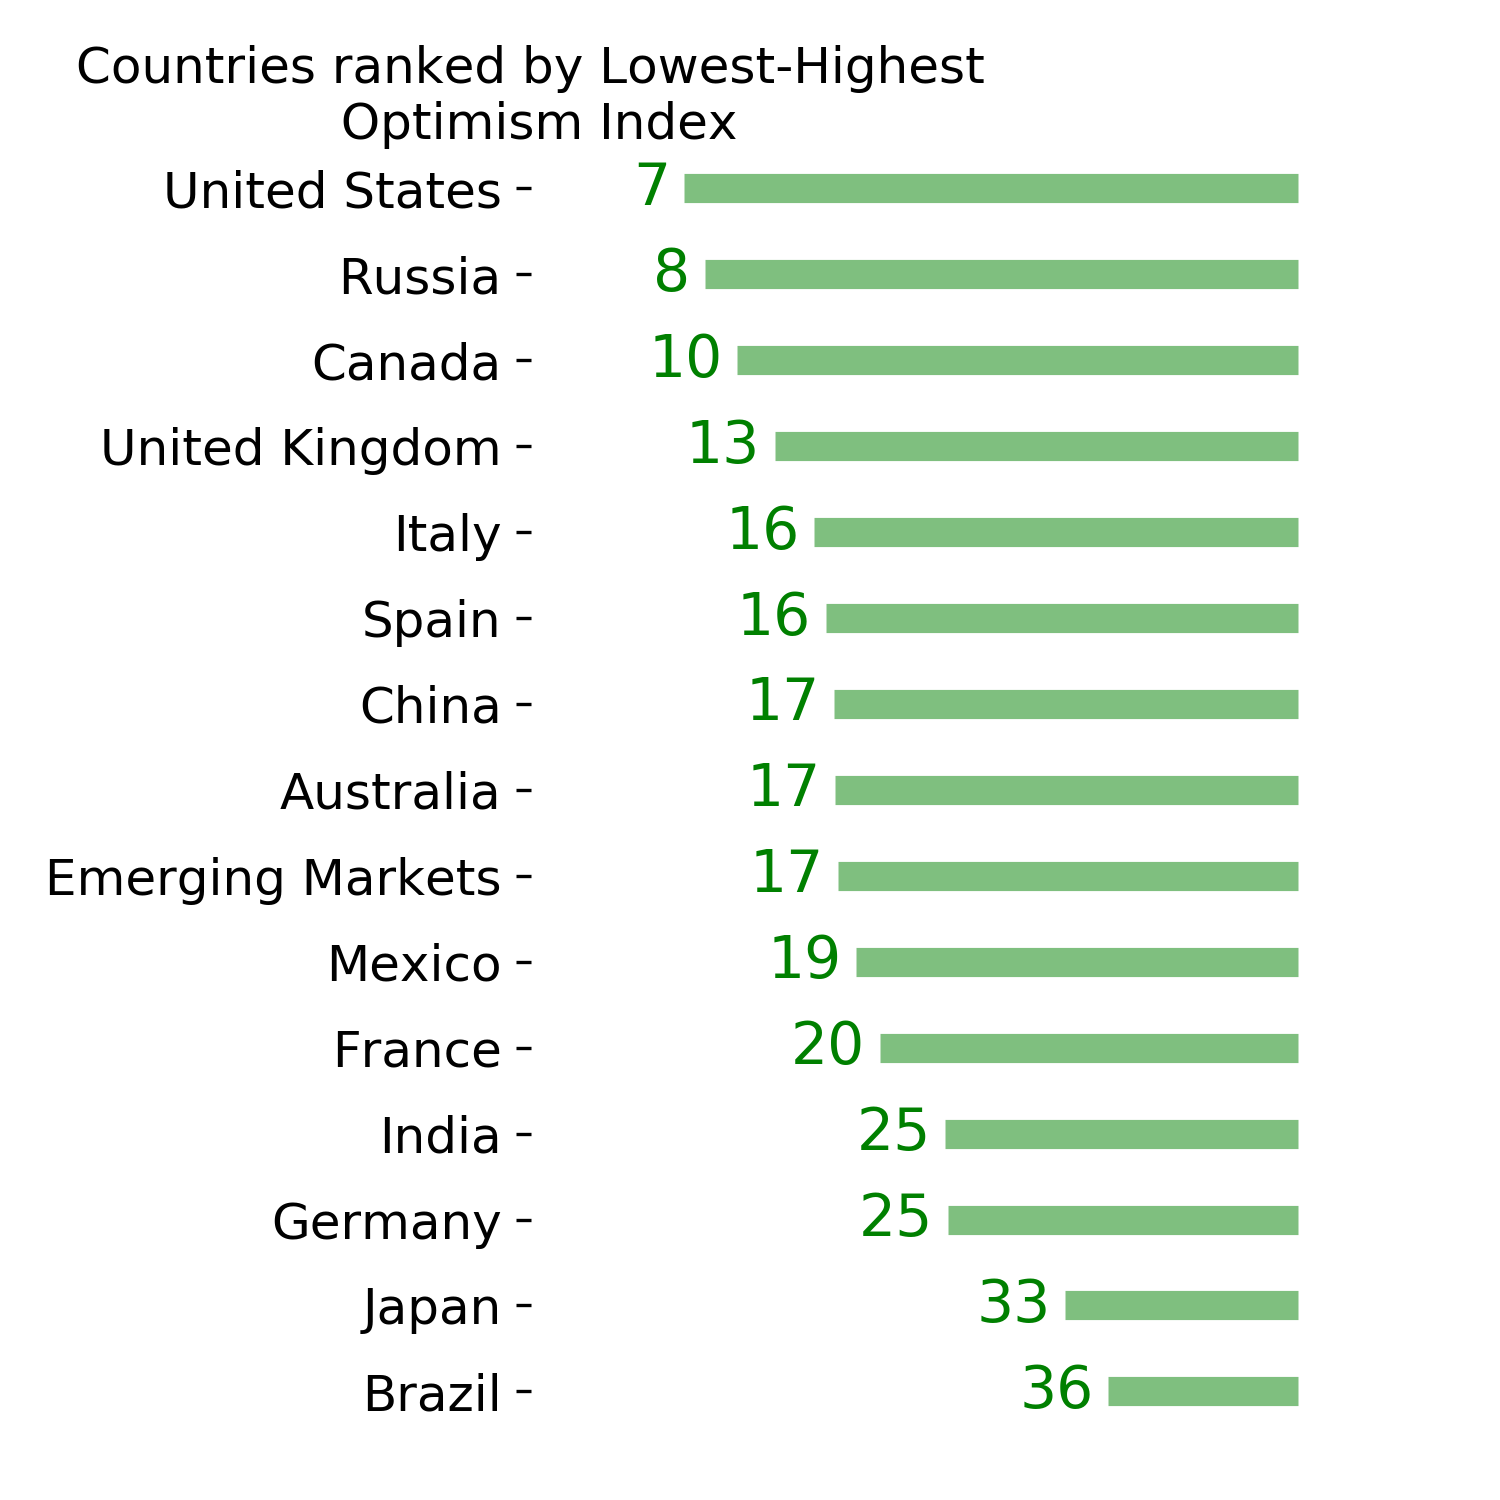
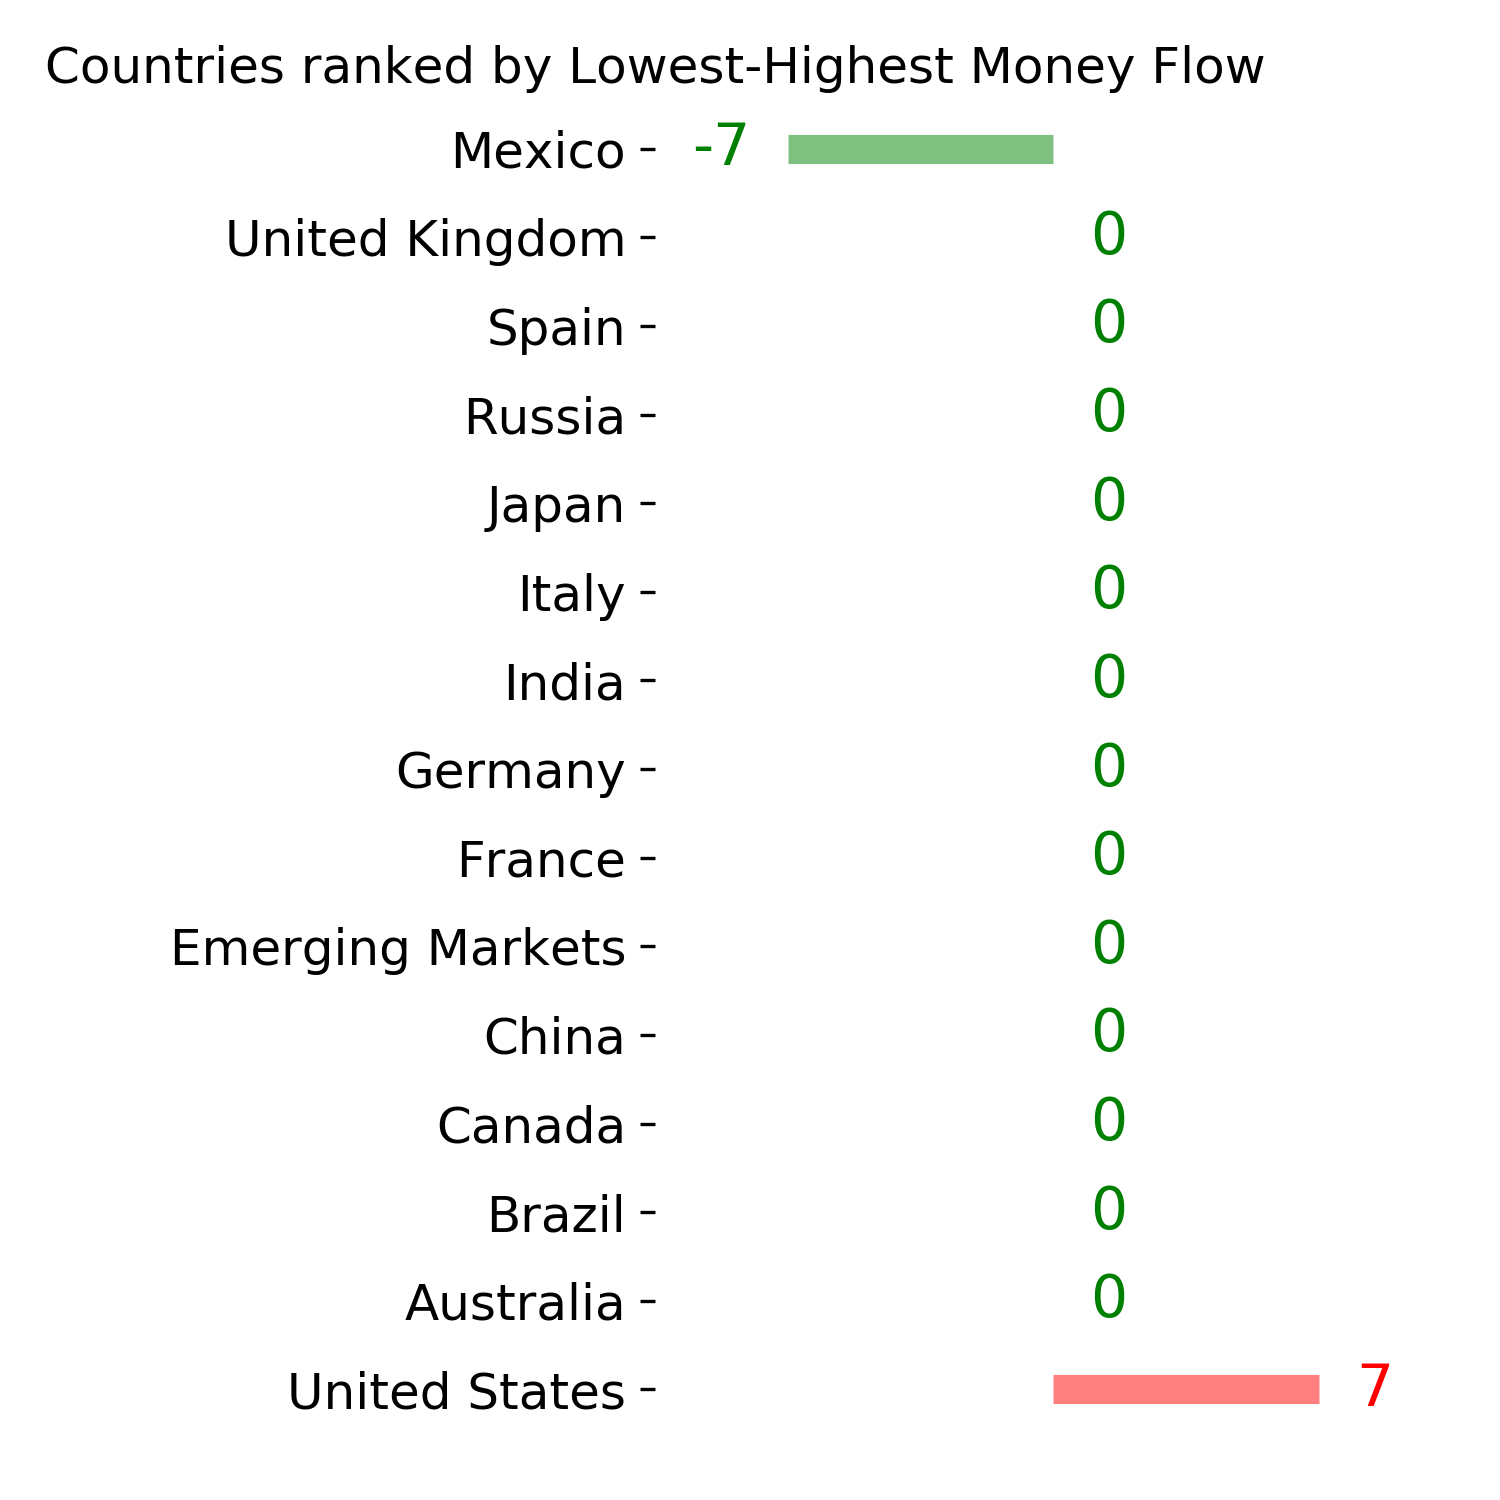
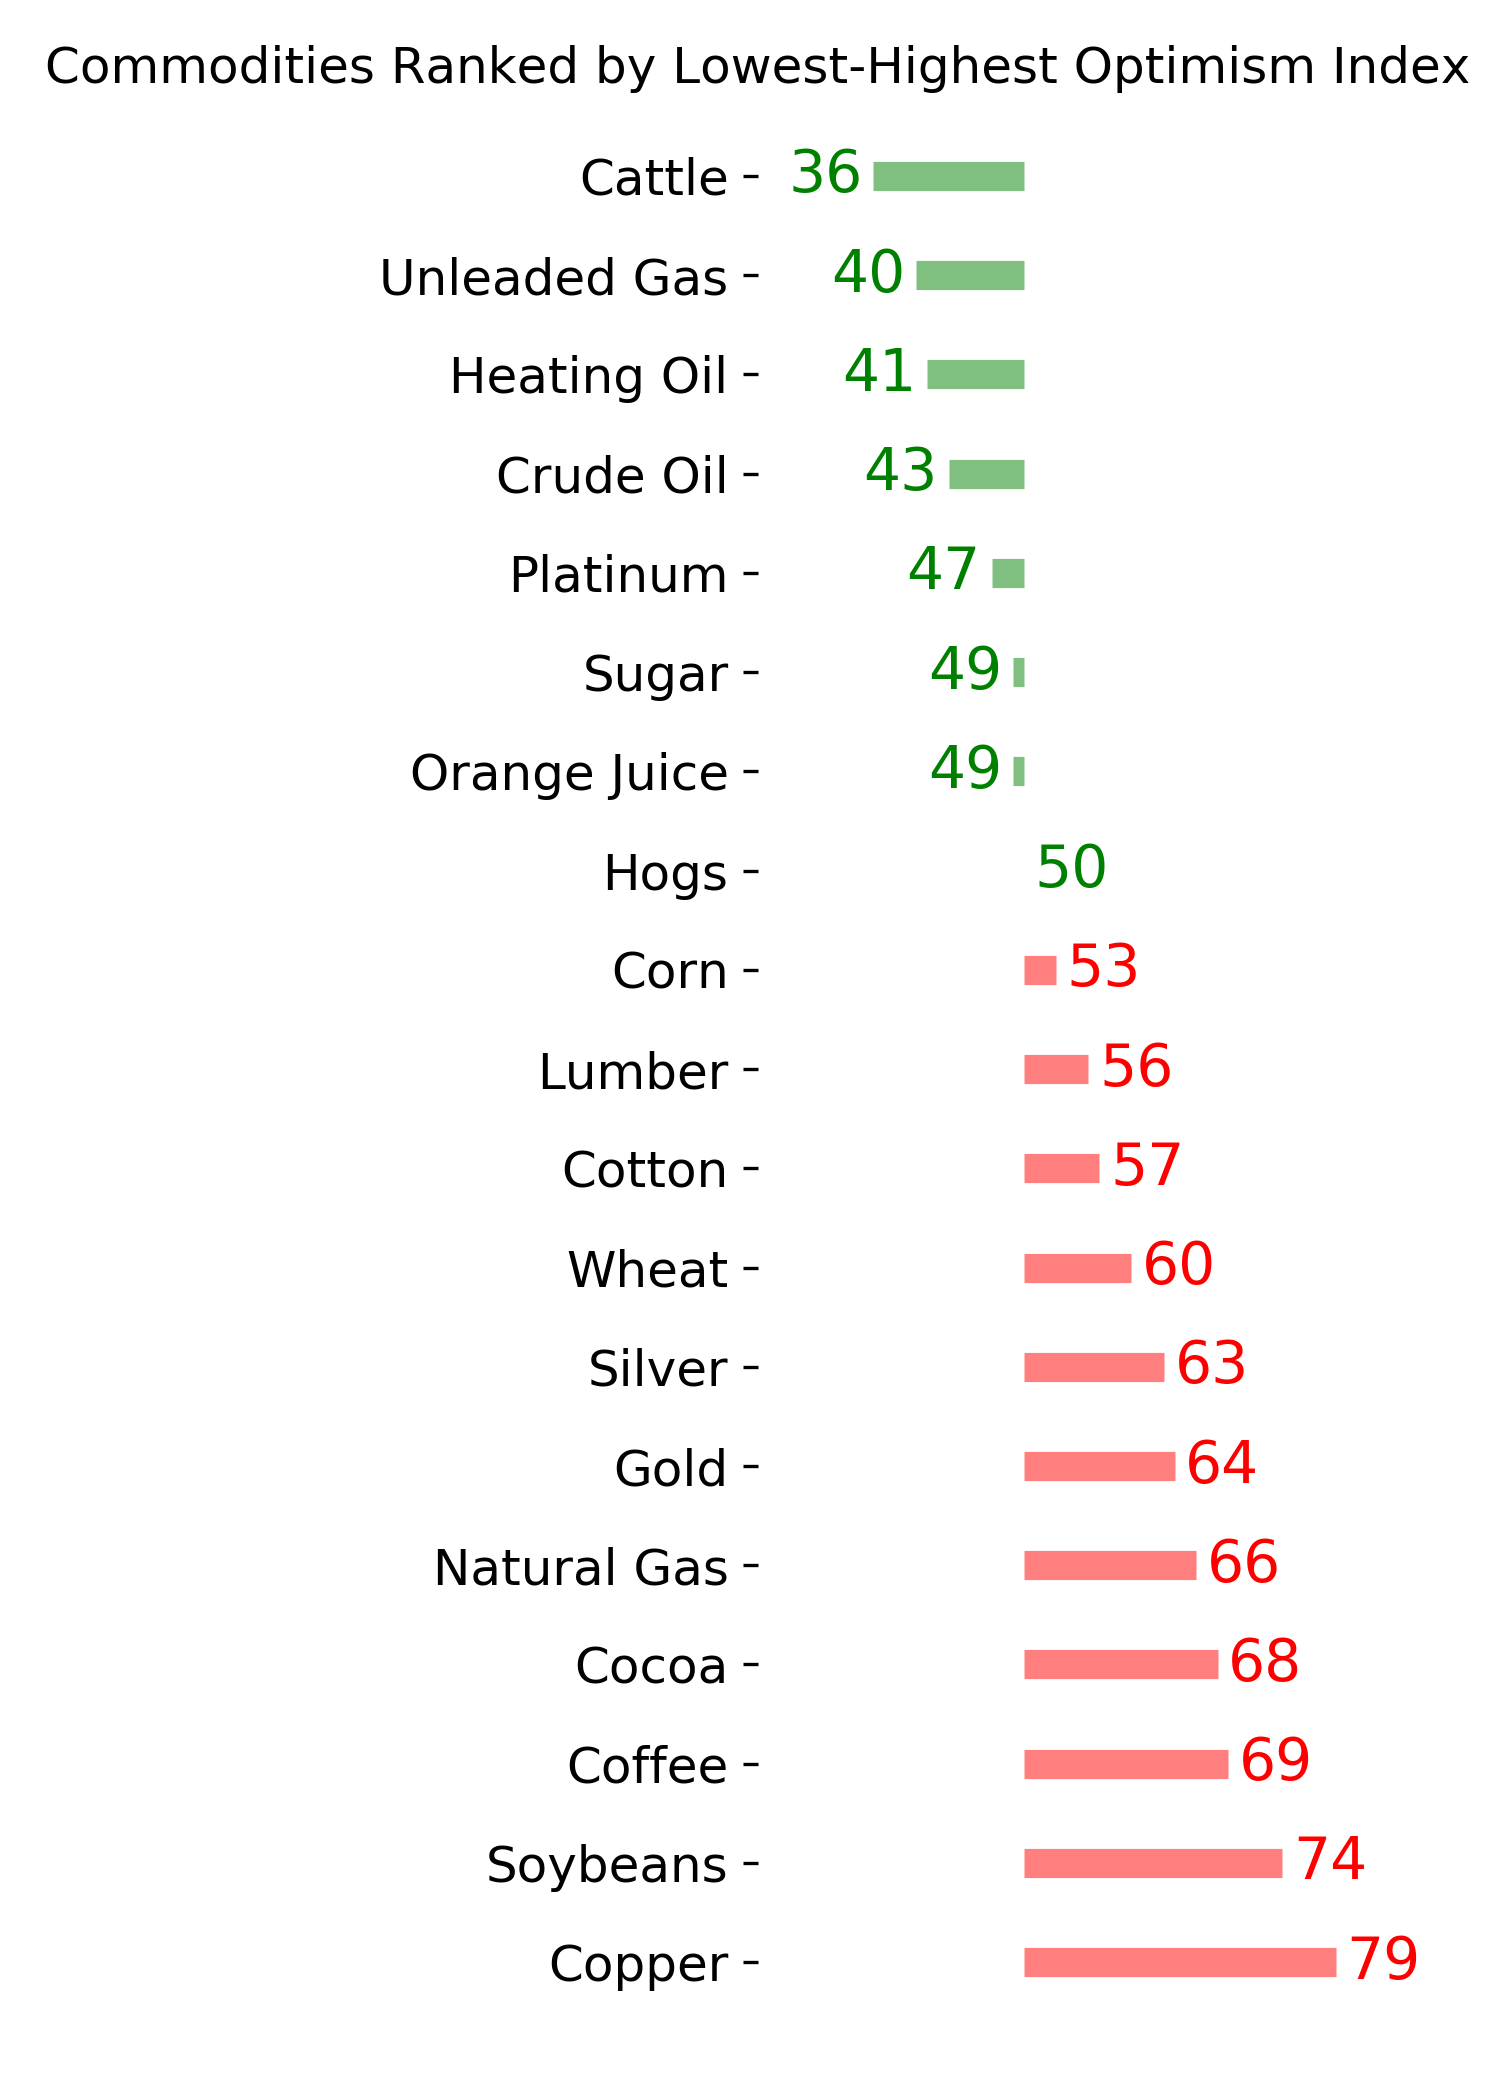
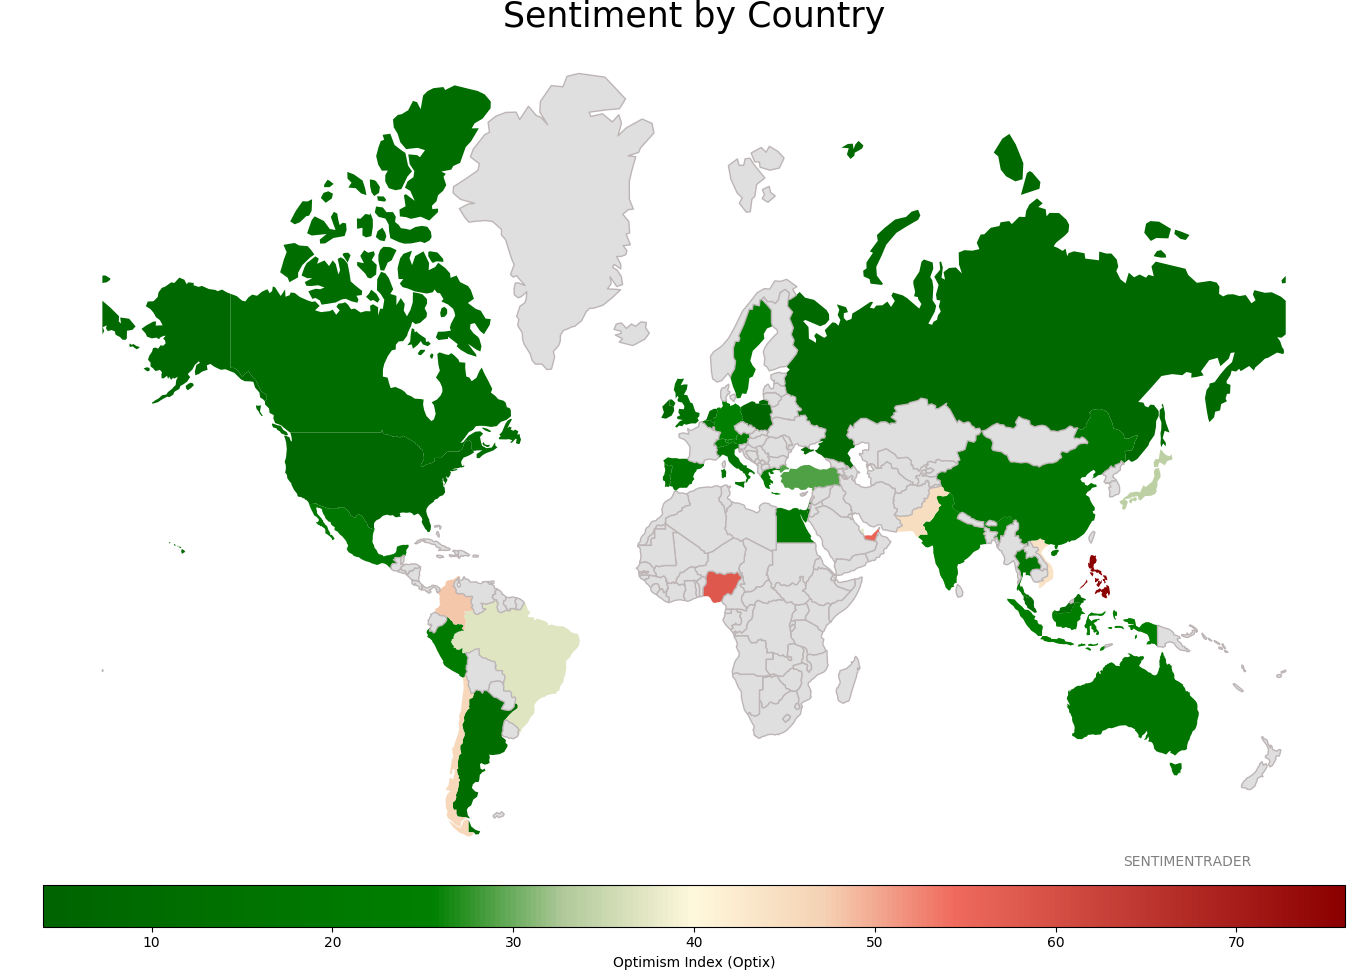
Sentiment Around The World
Optimism Index Thumbnails
|
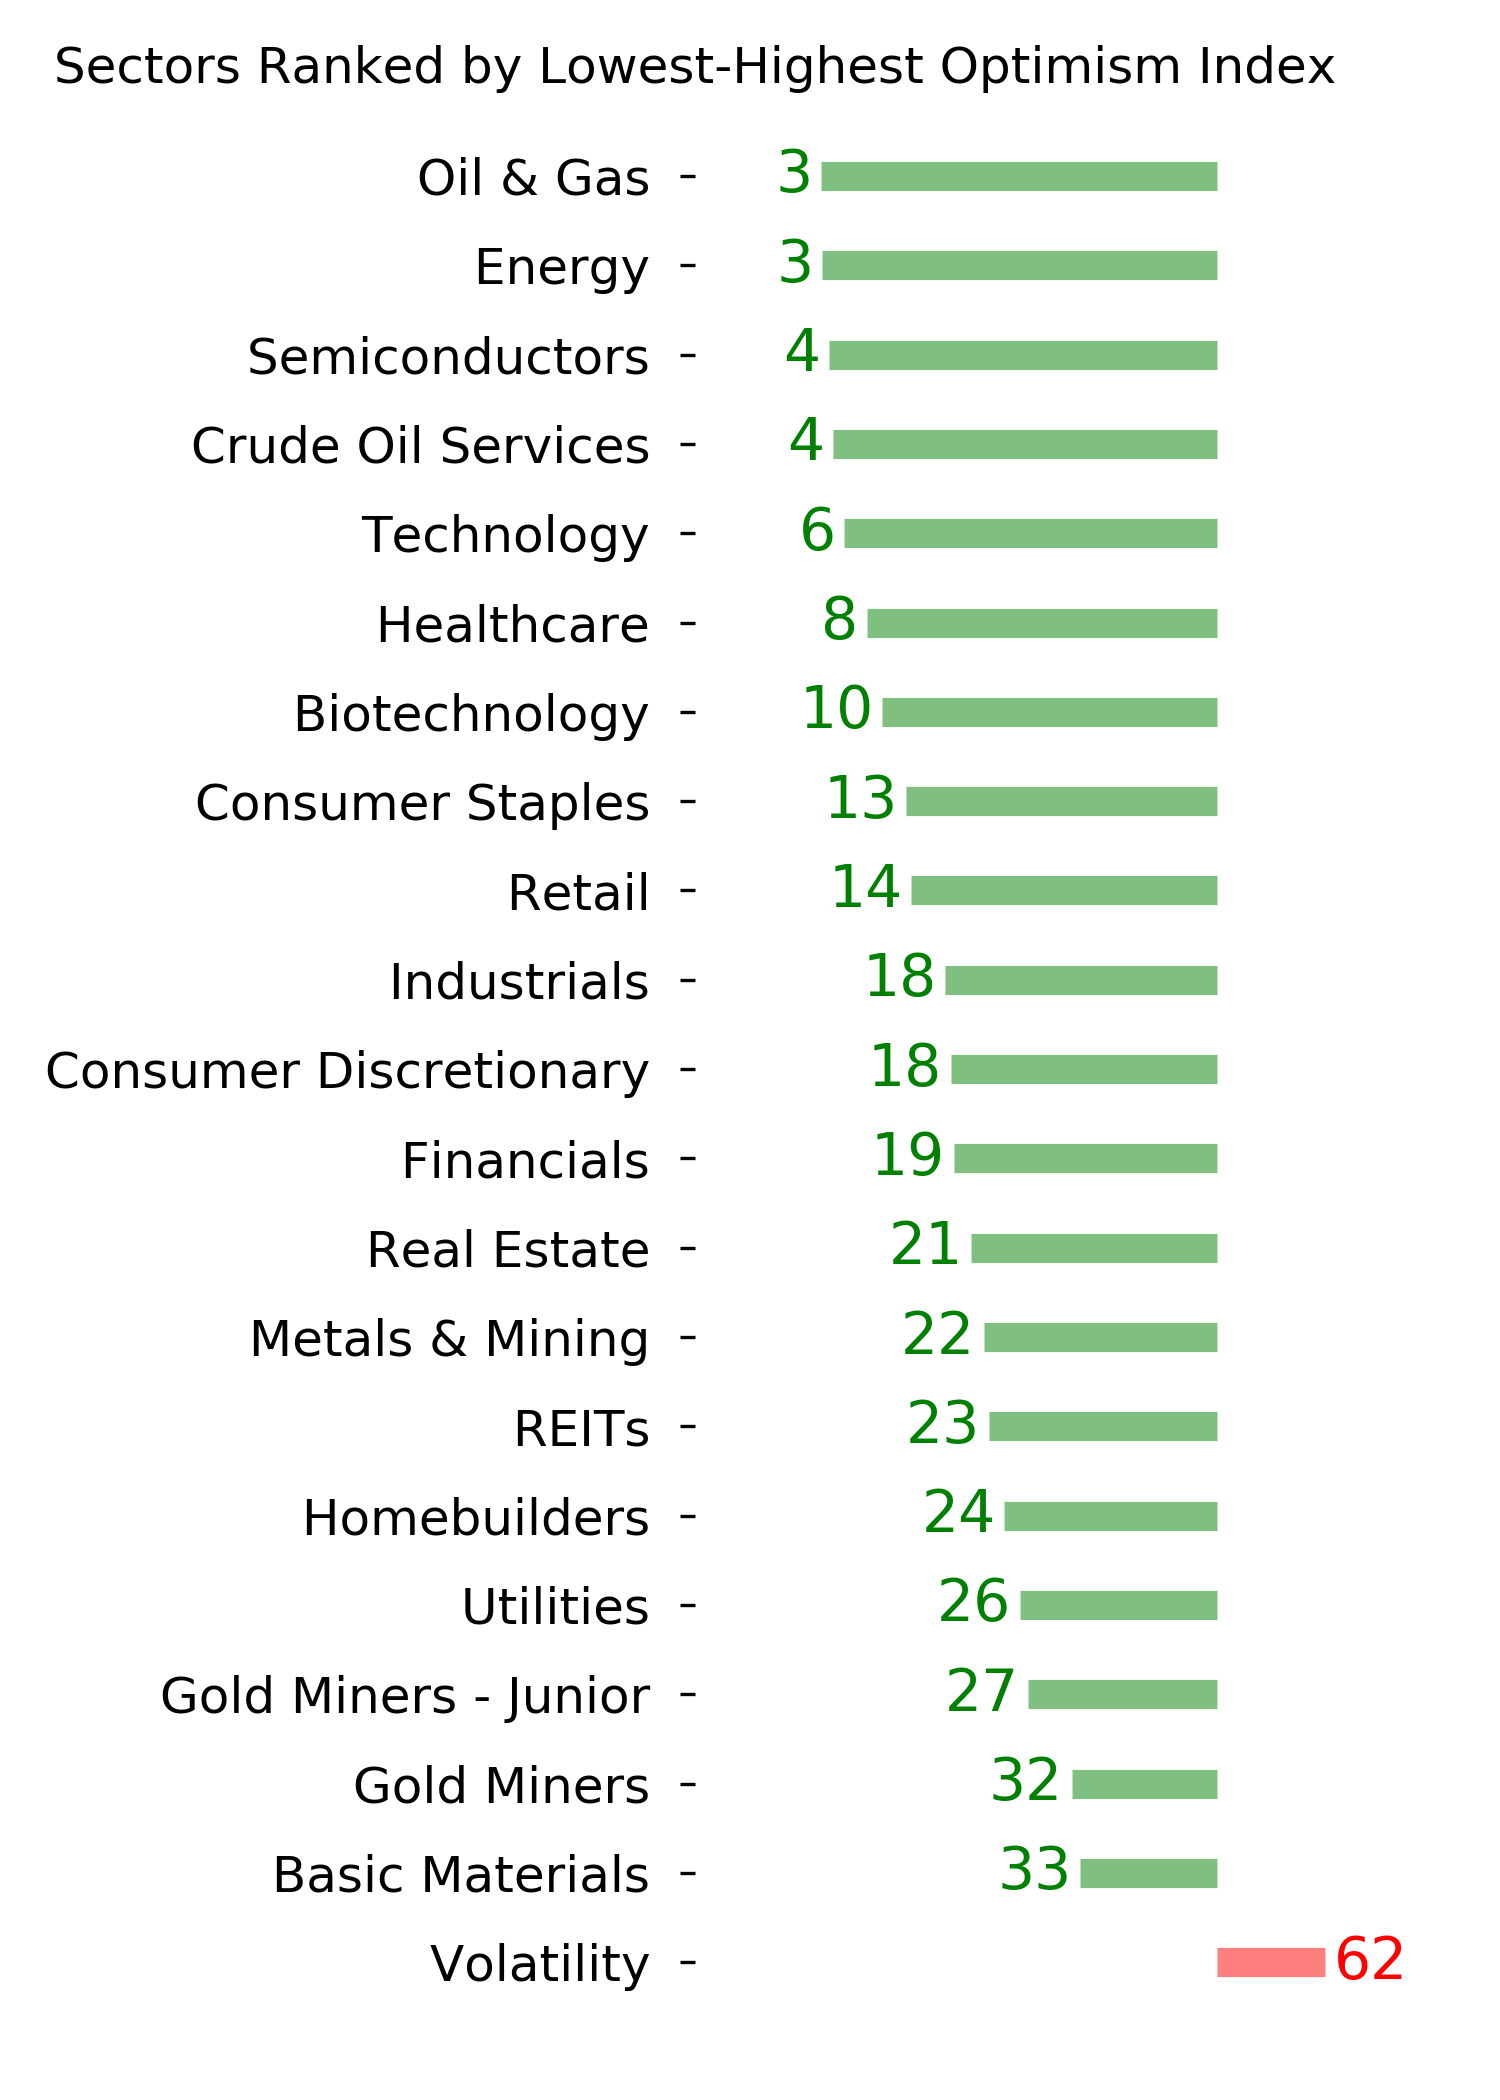
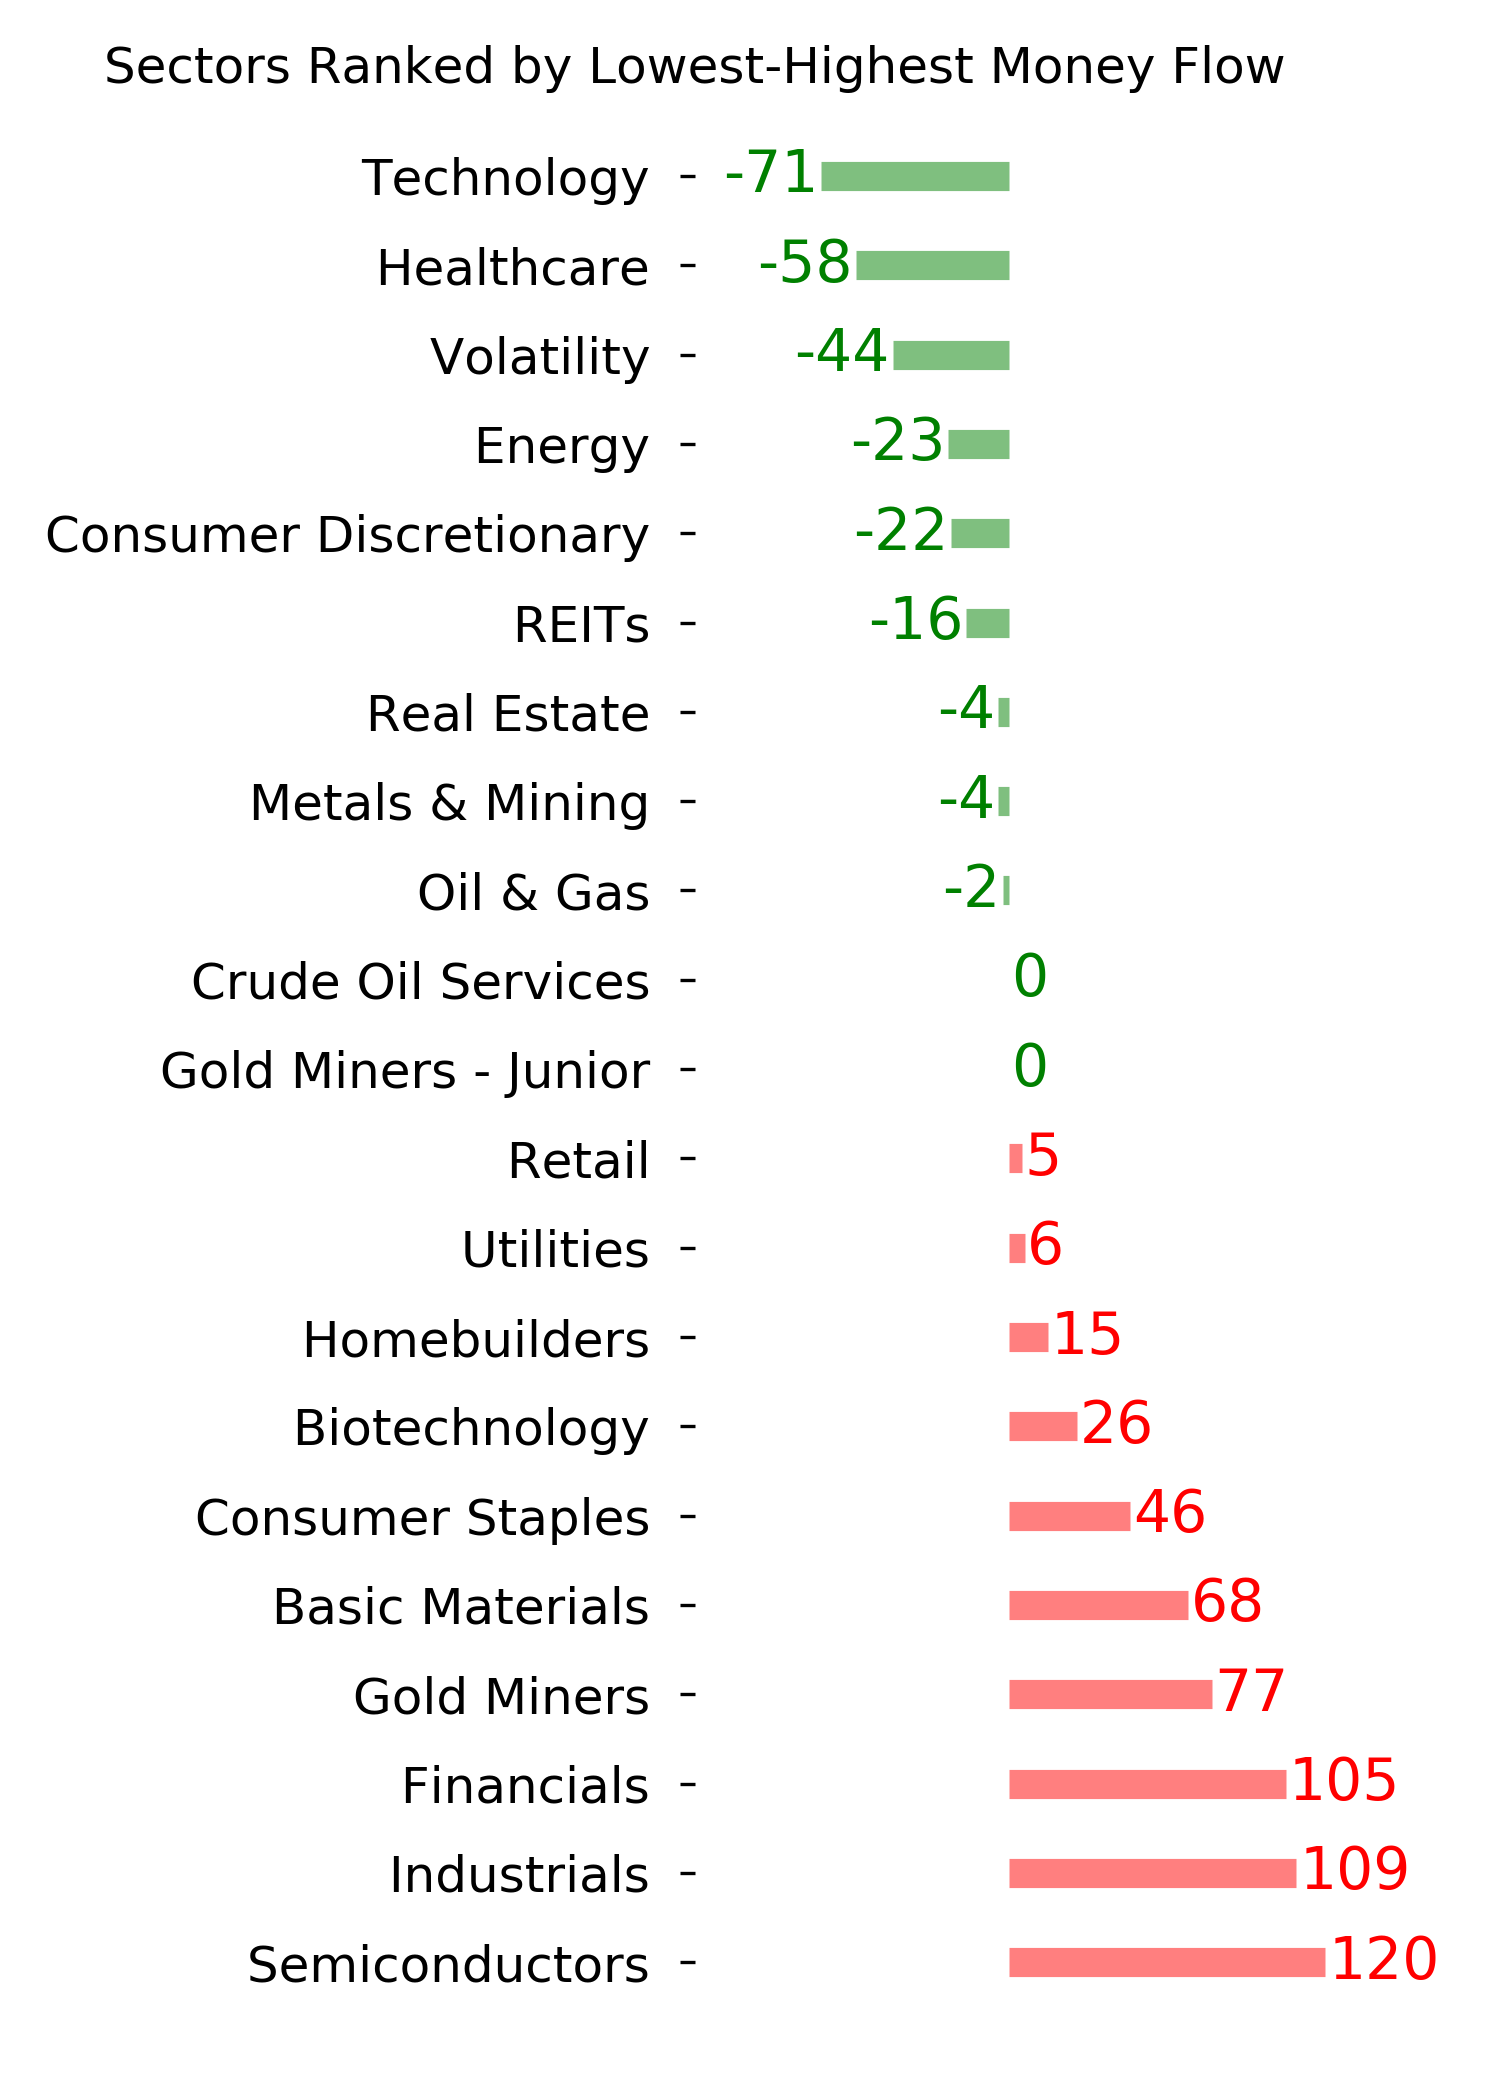
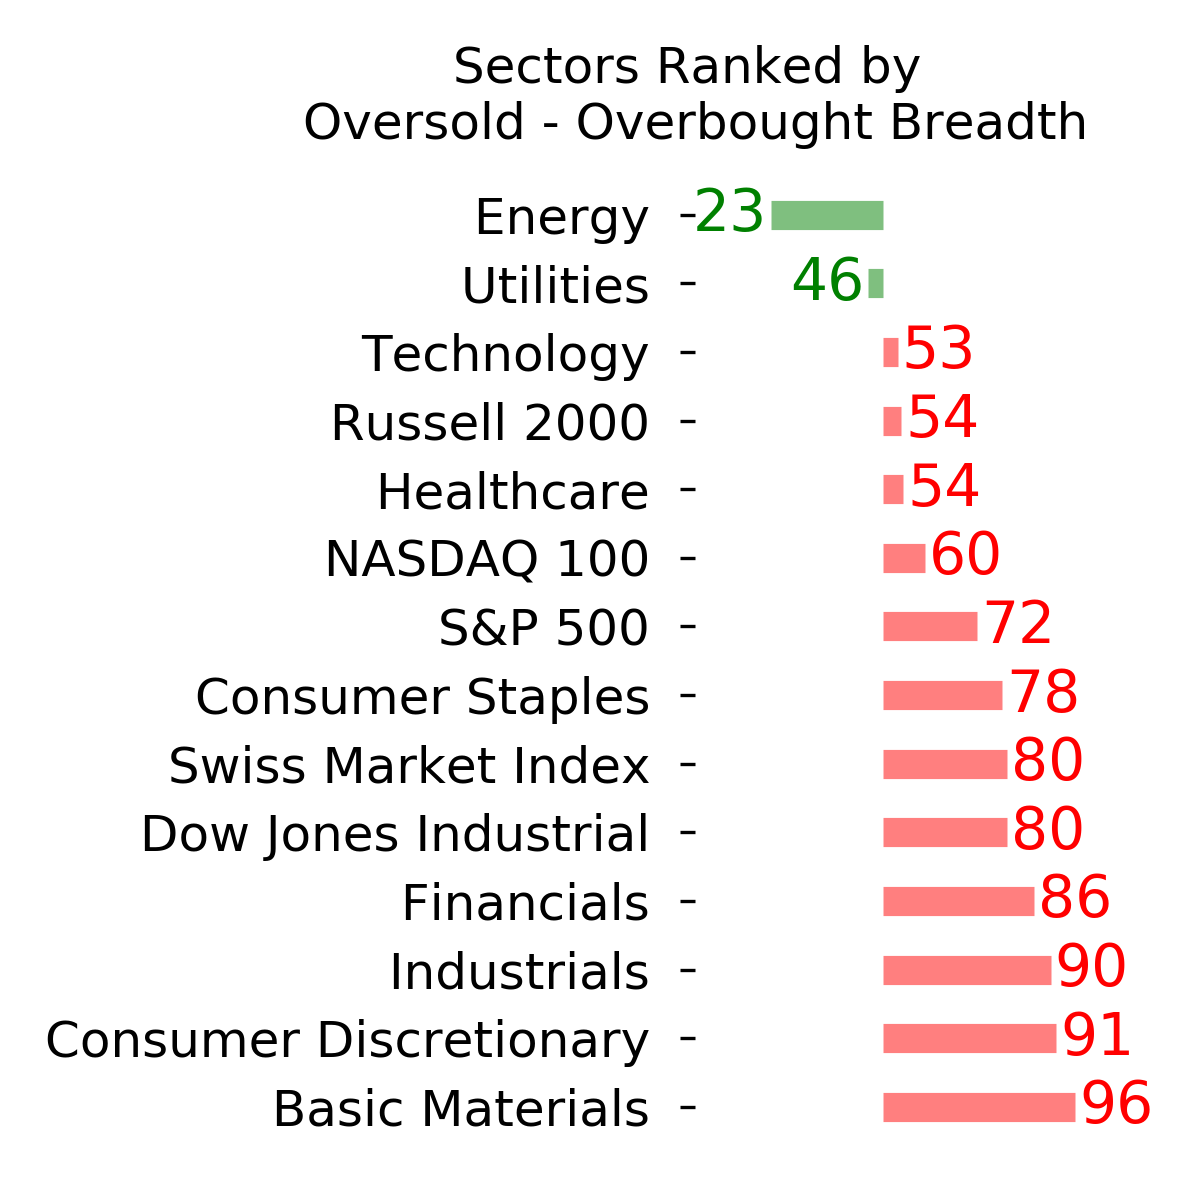
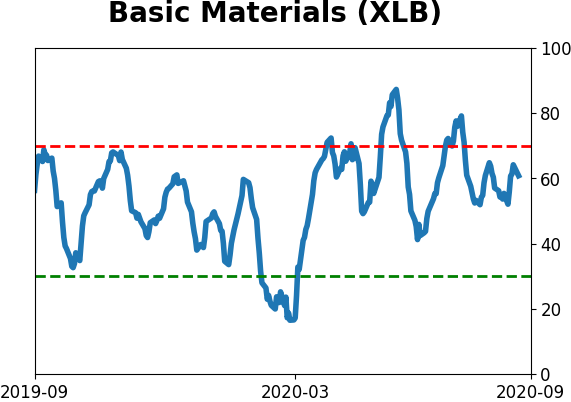
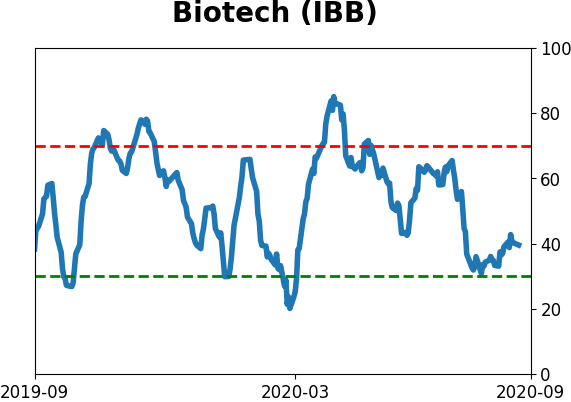
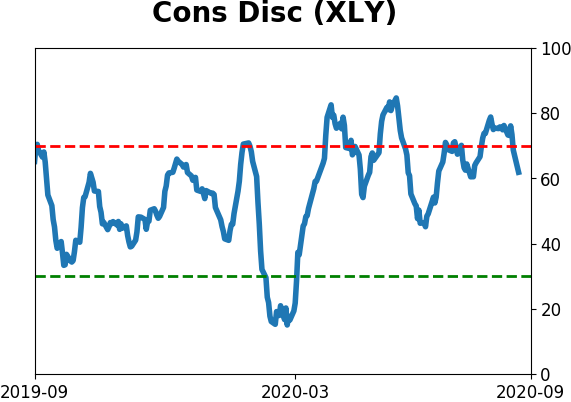
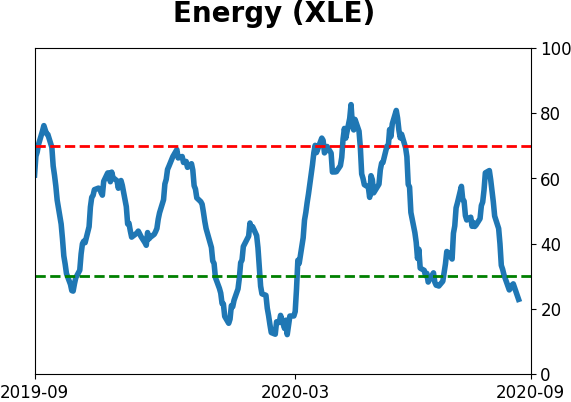
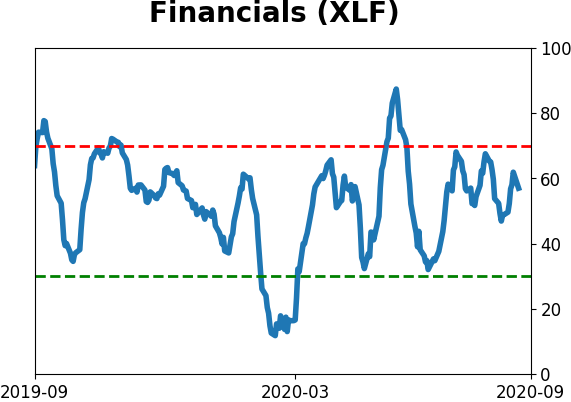
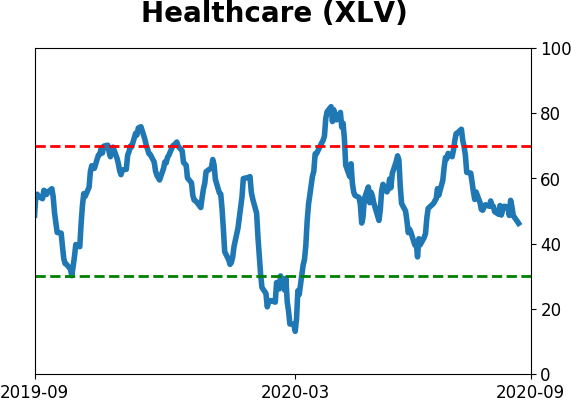
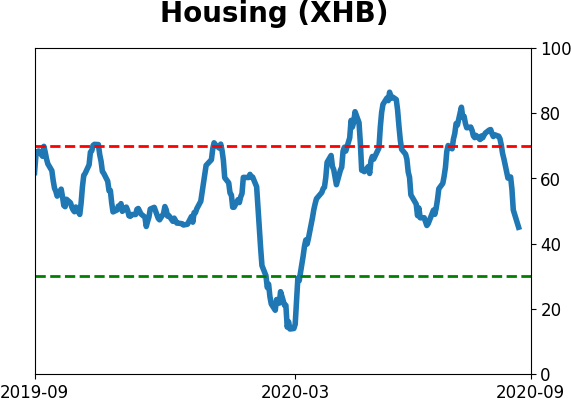
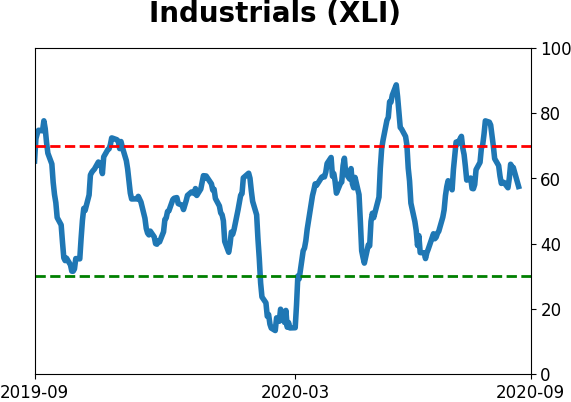
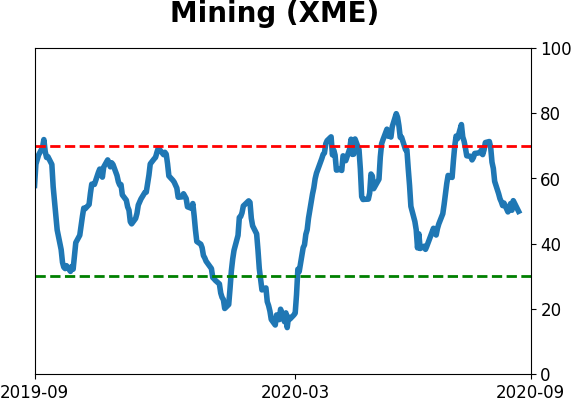
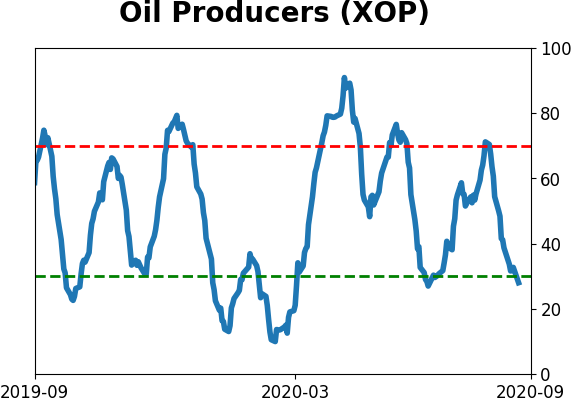
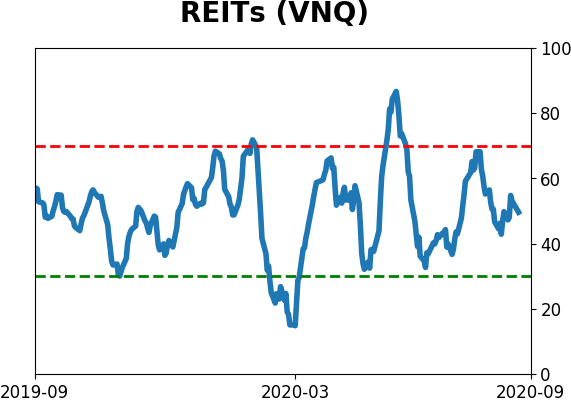
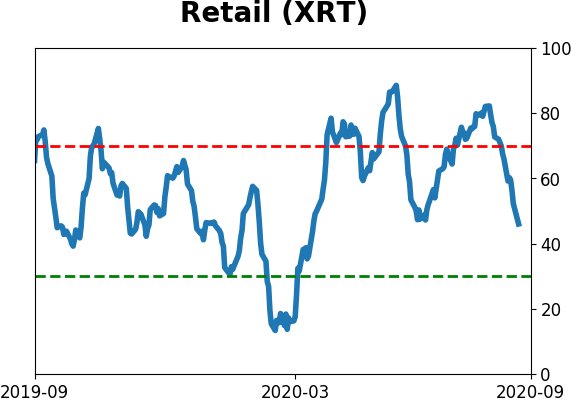
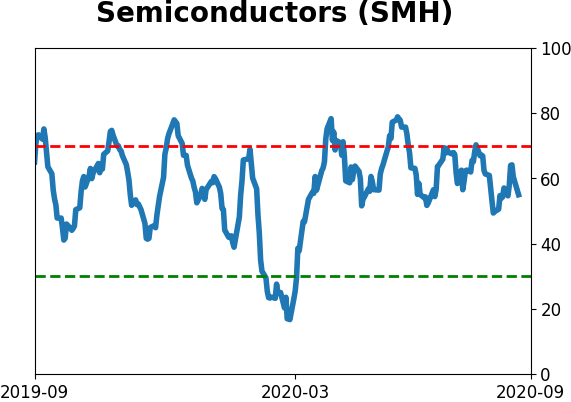
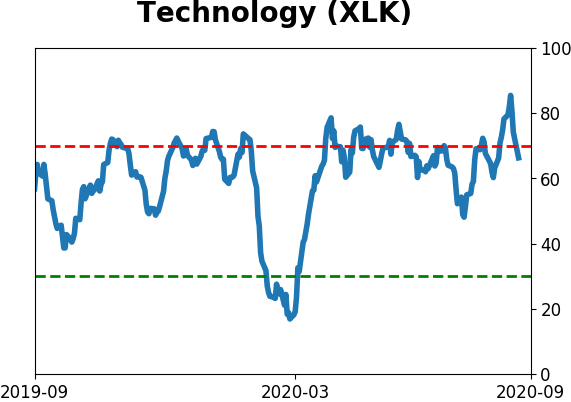
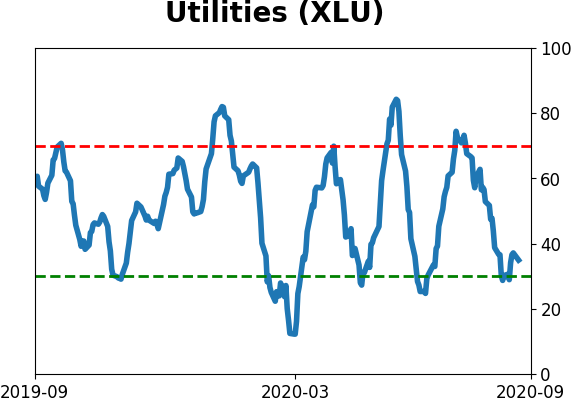
Sector ETF's - 10-Day Moving Average
|
|
|
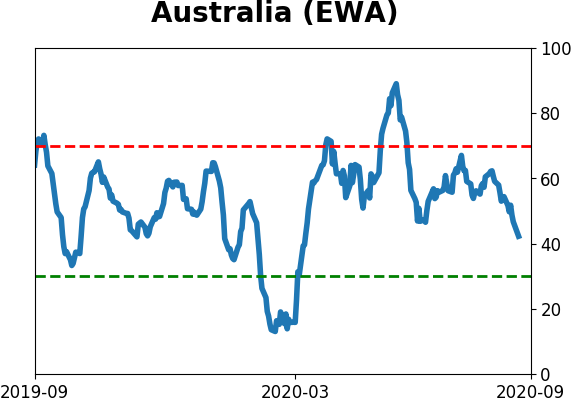
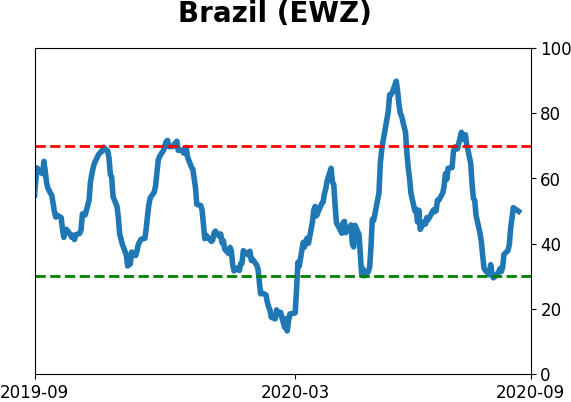
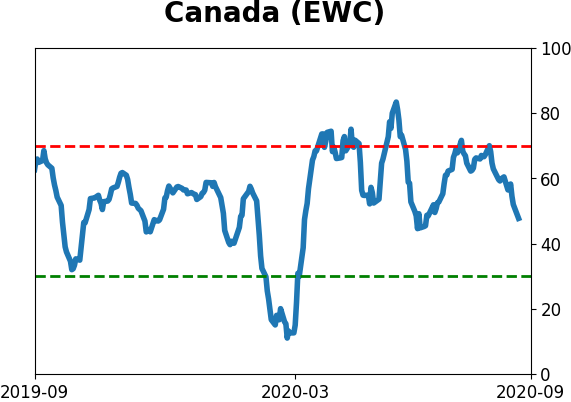
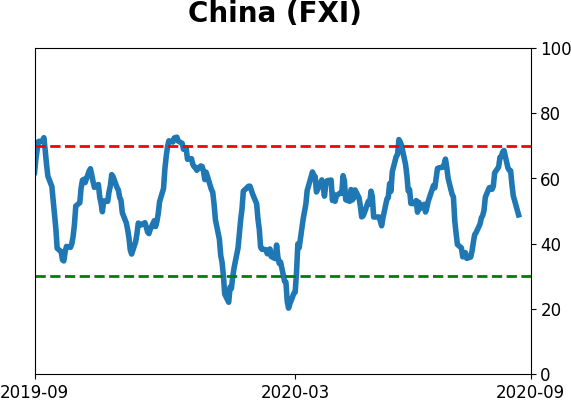
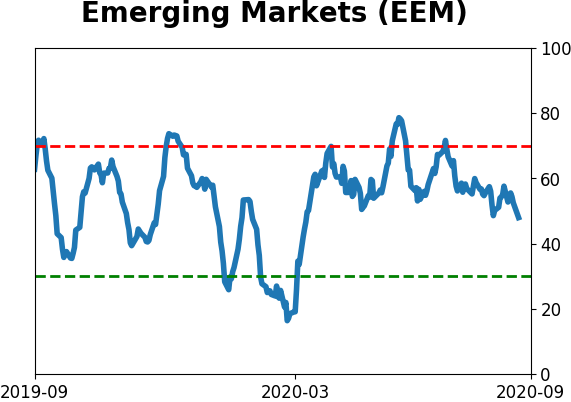
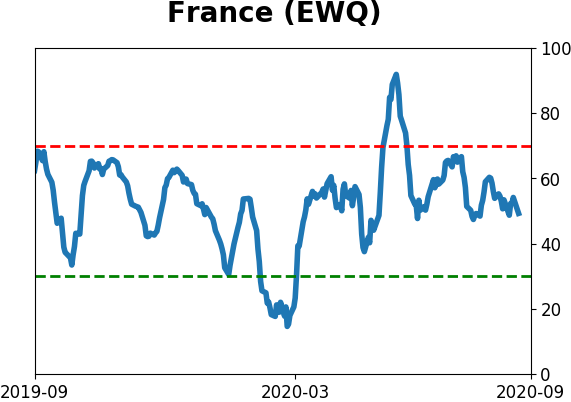
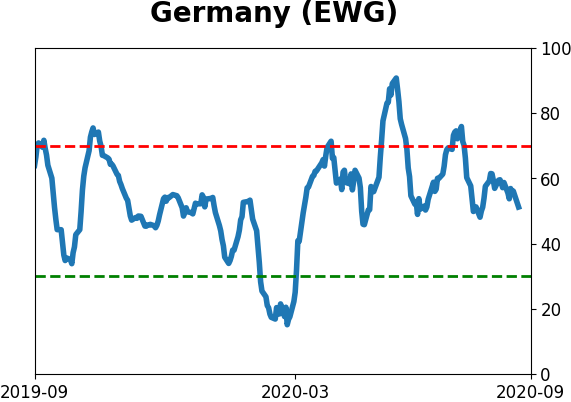
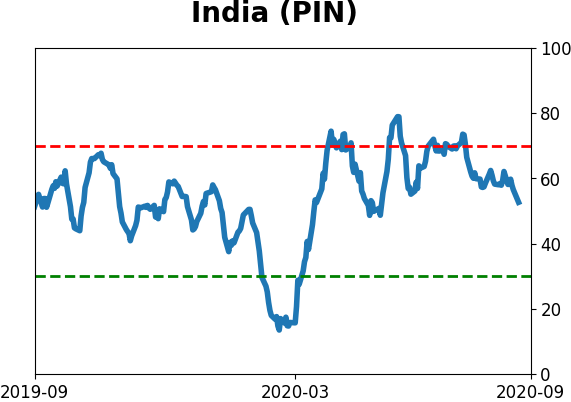
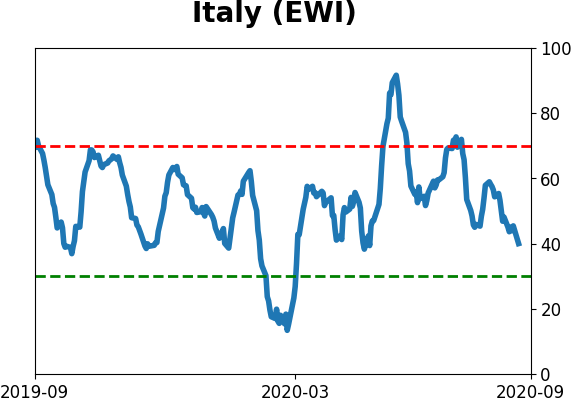
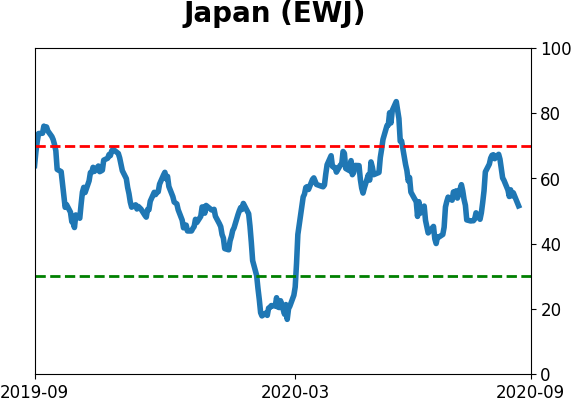
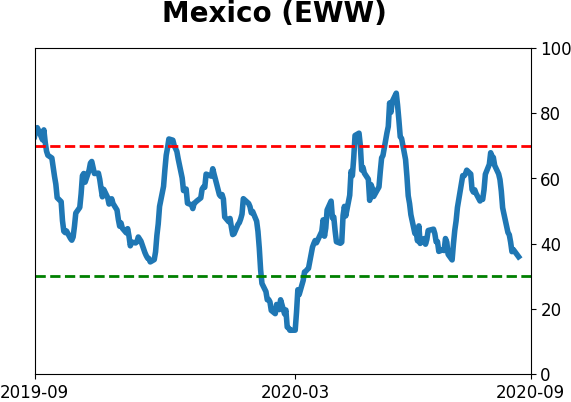
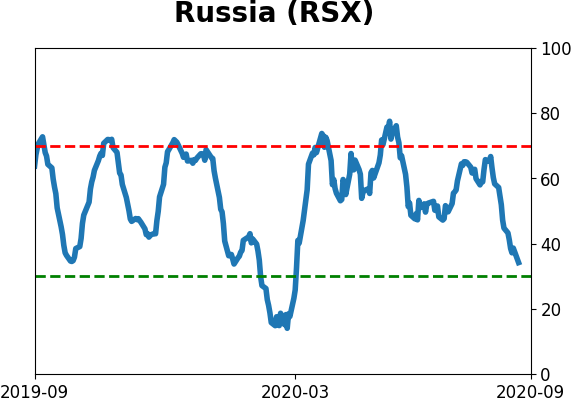
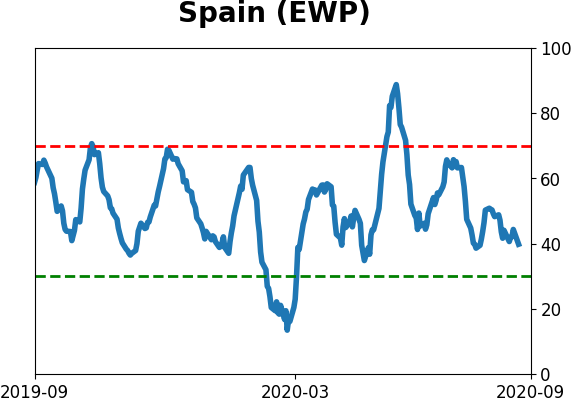
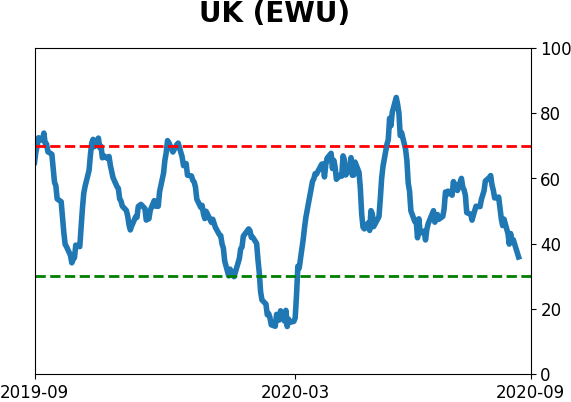
Country ETF's - 10-Day Moving Average
|
|
|
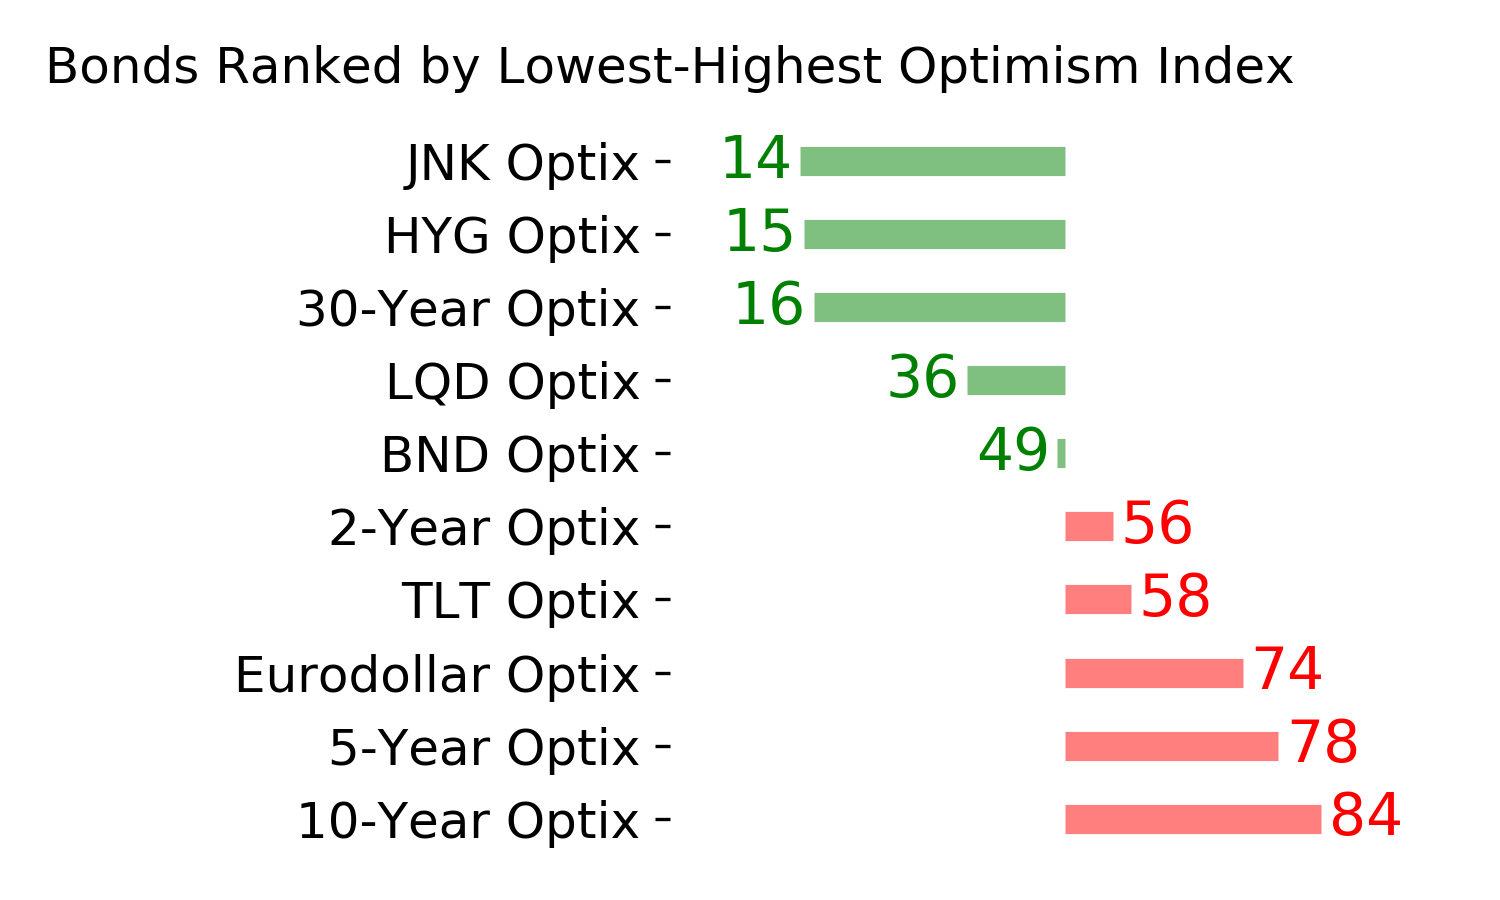
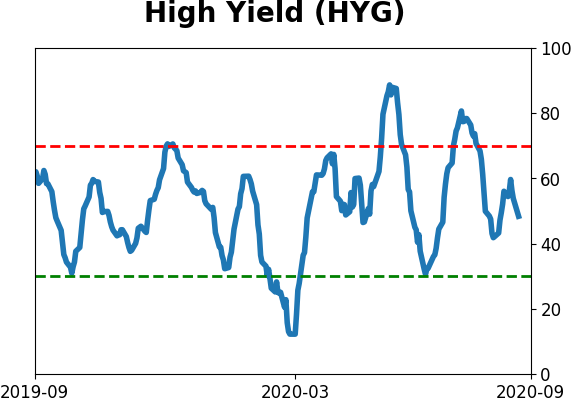
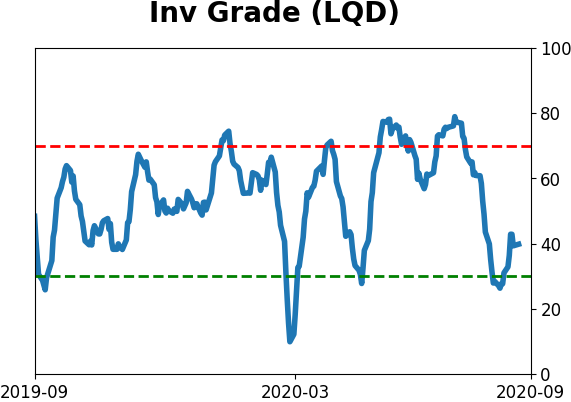
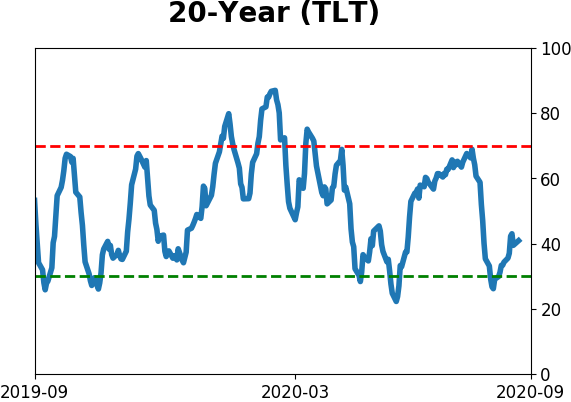
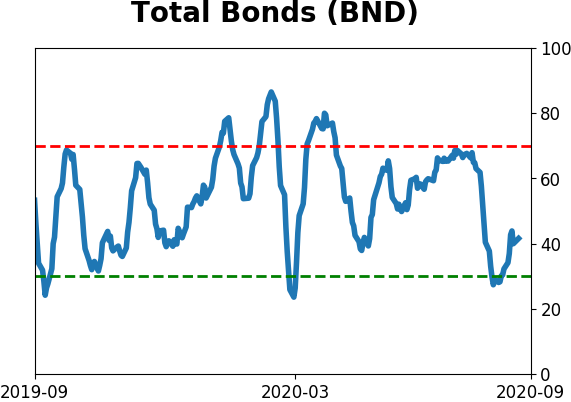
Bond ETF's - 10-Day Moving Average
|
|
|
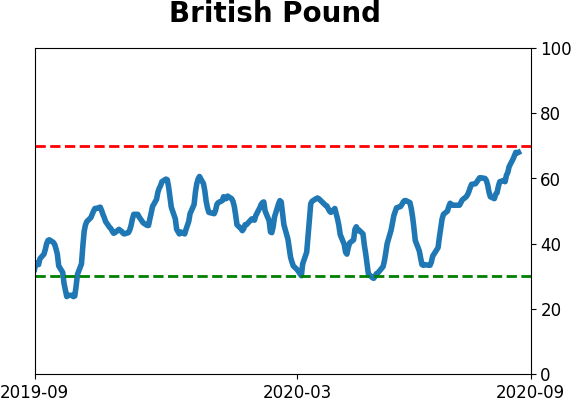
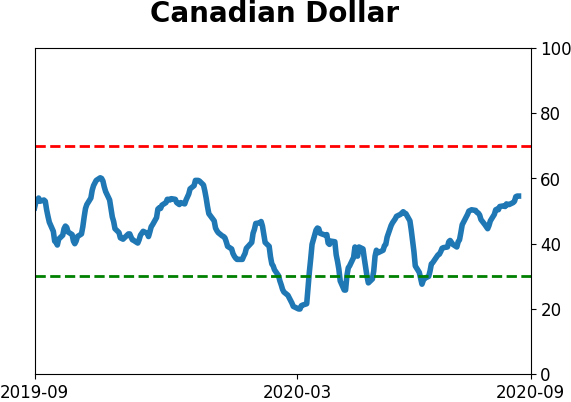
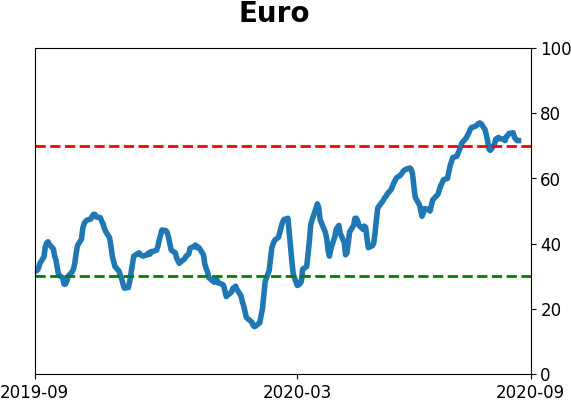
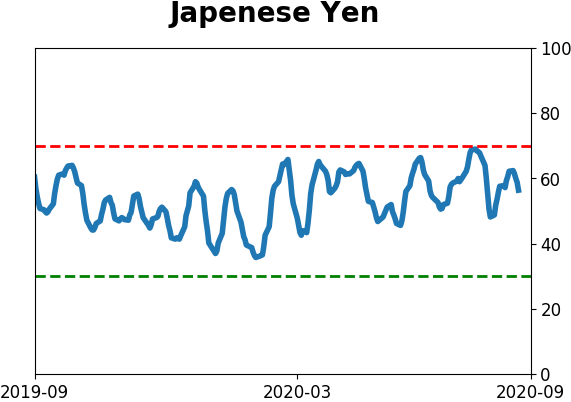
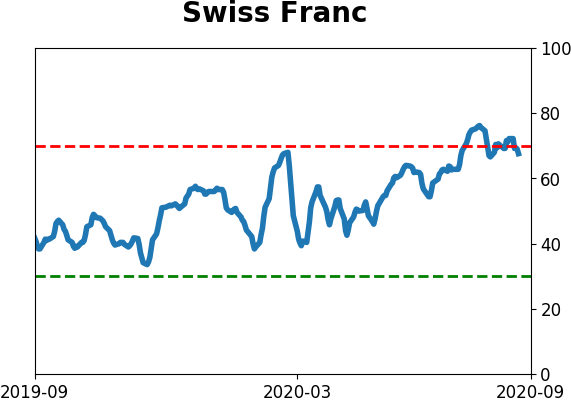
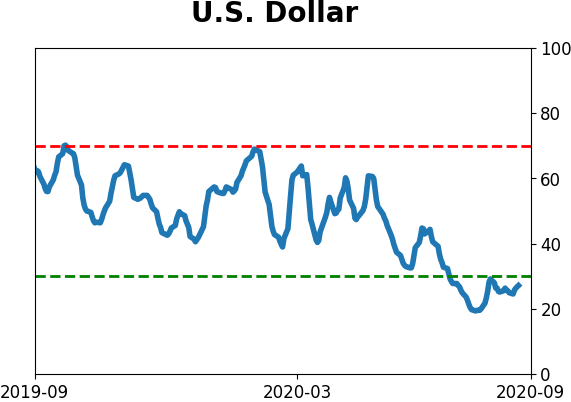
Currency ETF's - 5-Day Moving Average
|
|
|
Commodity ETF's - 5-Day Moving Average
|
|