Daily Report : Once again, traders reach for speculative options; Monster momentum versus poor participation

Jason Goepfert
2020-08-31
Starting in May, options traders showed a willingness to go all-out with speculative trades. After a brief respite, they returned in July and now in August, they have set new records. Compared to overall volume levels, we've never seen such zealous speculative activity.; Stocks have managed a tremendous run in recent days, weeks, and months. That kind of activity tends to continue. But it's being met with a historic bout of poor participation, with relatively few stocks helping to push the indexes along their momentum streaks.
View/Print a PDF version of this Report

Headlines


Once again, traders reach for speculative options: Starting in May, options traders showed a willingness to go all-out with speculative trades. After a brief respite, they returned in July and now in August, they have set new records. Compared to overall volume levels, we've never seen such zealous speculative activity.

Monster momentum versus poor participation: Stocks have managed a tremendous run in recent days, weeks, and months. That kind of activity tends to continue. But it's being met with a historic bout of poor participation, with relatively few stocks helping to push the indexes along their momentum streaks.

More oddities with VIX, breadth: As if we needed more of these. Beginning in earnest in late July, there have been stark divergences between implied volatility, underlying market breadth, and daily changes in the major indexes like S&P 500 and Nasdaq Composite. This is far from normal behavior, and yet it continues. For the Nasdaq, Monday was the 4th session in 10 days when it gained more than 0.5% and yet there were more declining than advancing stocks on that exchange. Only December 1999 exceeds this in 34 years of history. And Monday also marked the largest-ever gain for the VIX on a day the S&P 500 lost so little. Below we can see days when the VIX gained 10% or more.

Bottom Line:

Smart / Dumb Money Confidence

Smart Money Confidence: 33% Dumb Money Confidence: 82%

Risk Levels

Stocks Short-Term

Stocks Medium-Term

Bonds

Crude Oil

Gold

Agriculture

Active Studies

Time FrameBullishBearish
Short-Term01
Medium-Term19
Long-Term471

Indicators at Extremes

% Showing Pessimism: 10%
Bullish for Stocks

VIX
Mutual Fund Flow (no ETFs)
Major Index Combo

Portfolio

PositionWeight %Added / ReducedDate
Stocks19.5Reduced 14.4%2020-08-31
Bonds0.0Reduced 6.7%2020-02-28
Commodities5.6-- Select a Direction -- %
2020-08-31
Precious Metals0.0Reduced 3.6%2020-02-28
Special Situations0.0Reduced 31.9%2020-03-17
Cash74.9
Updates (Changes made today are underlined)

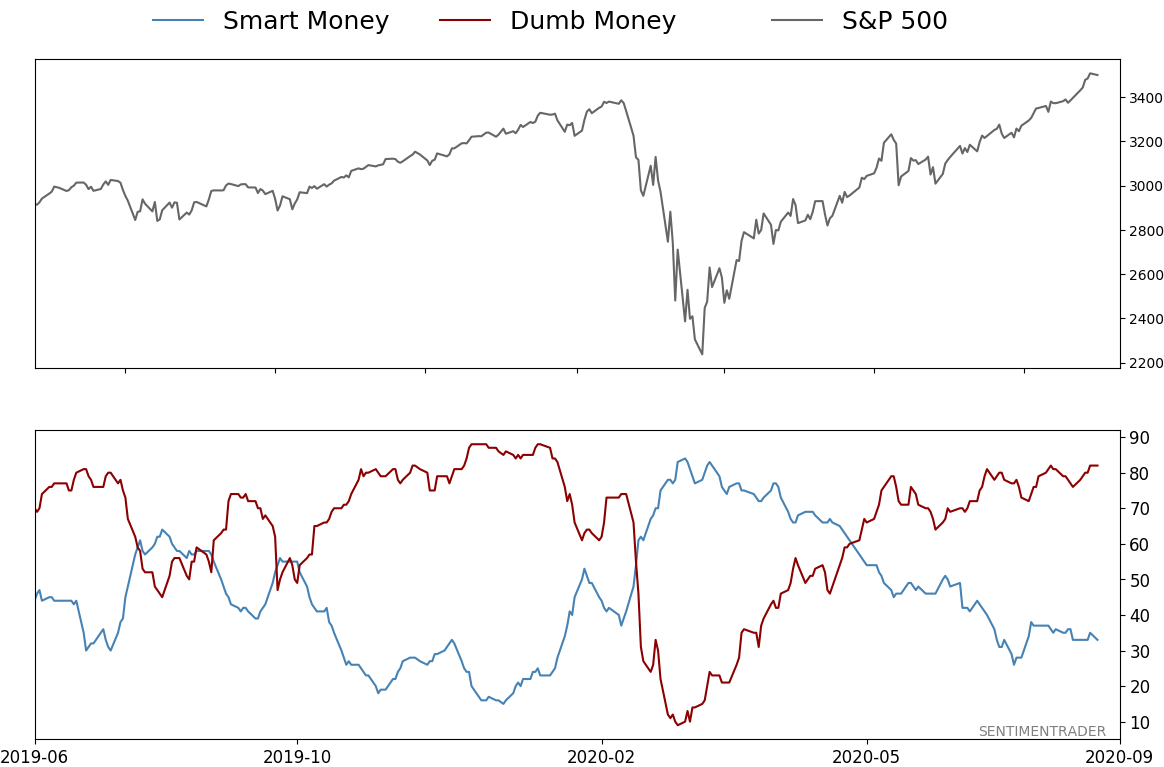
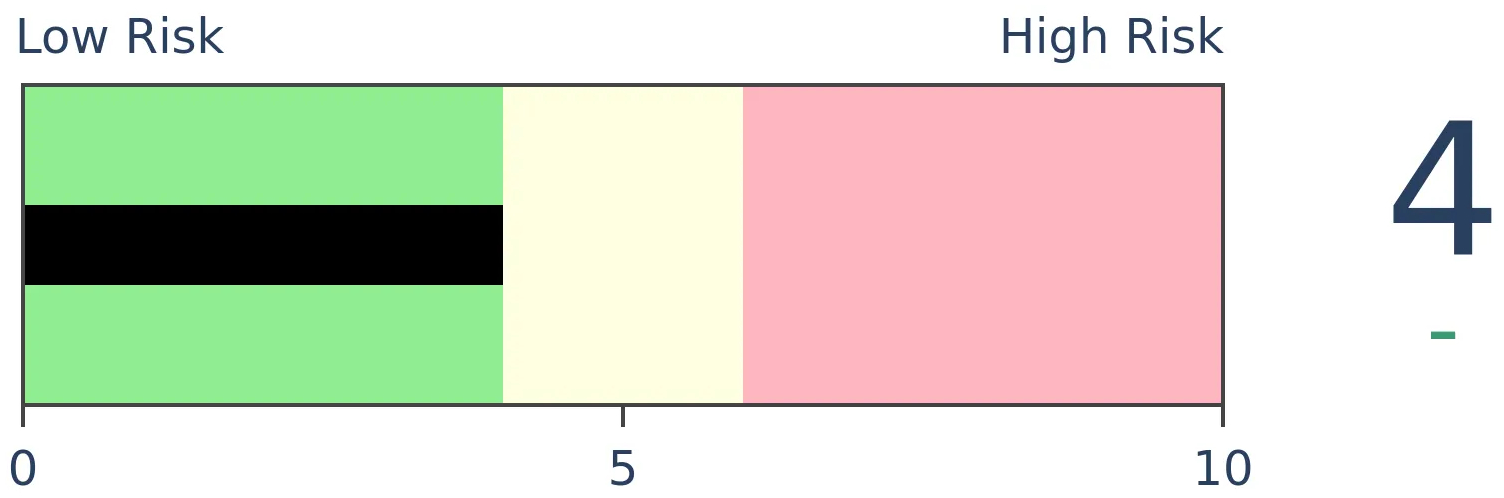
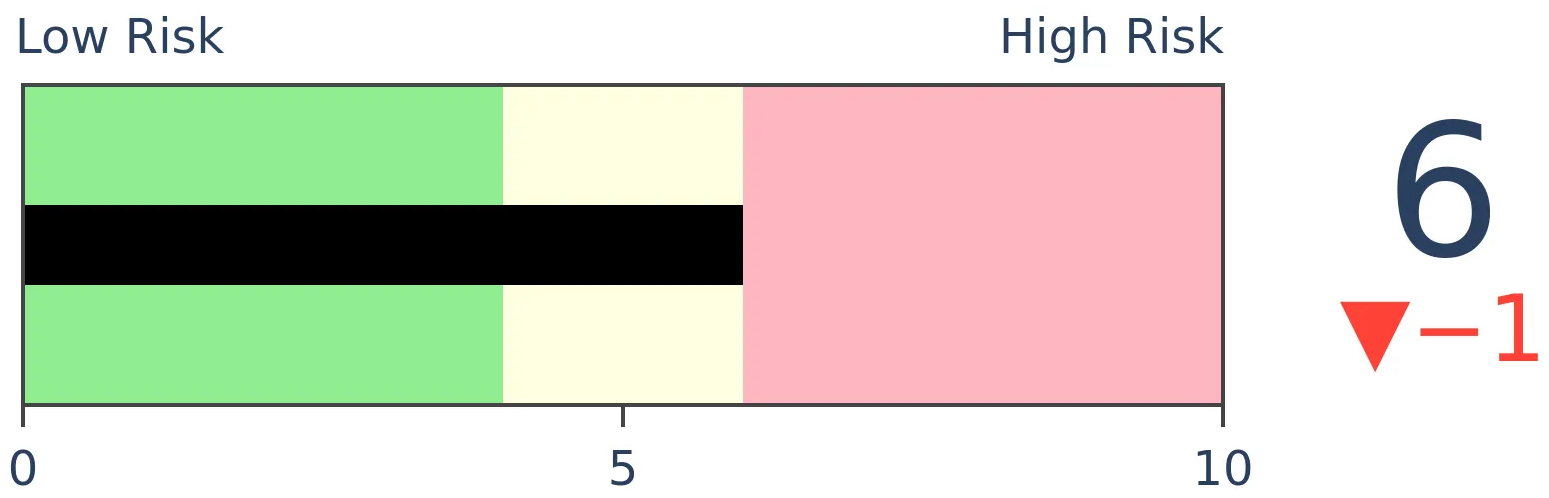
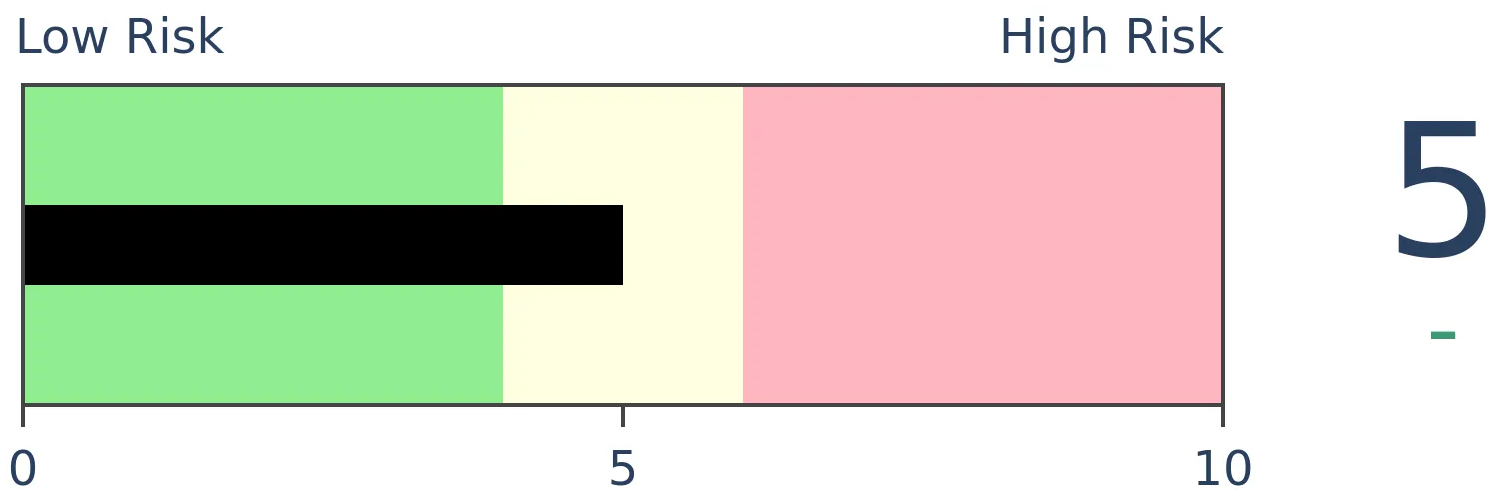
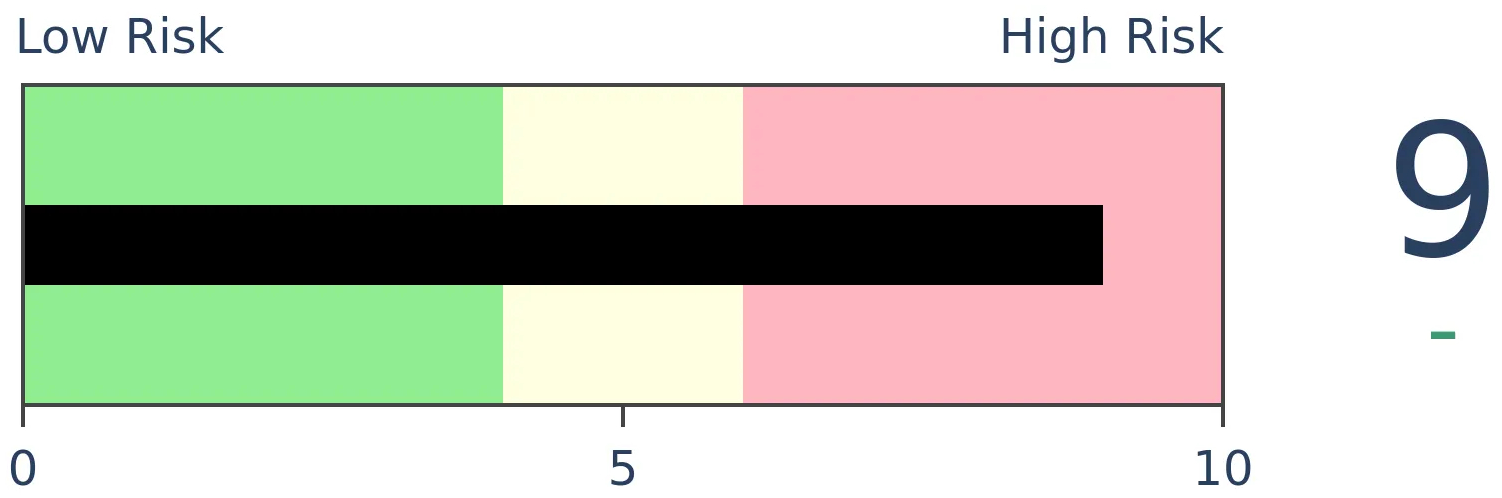
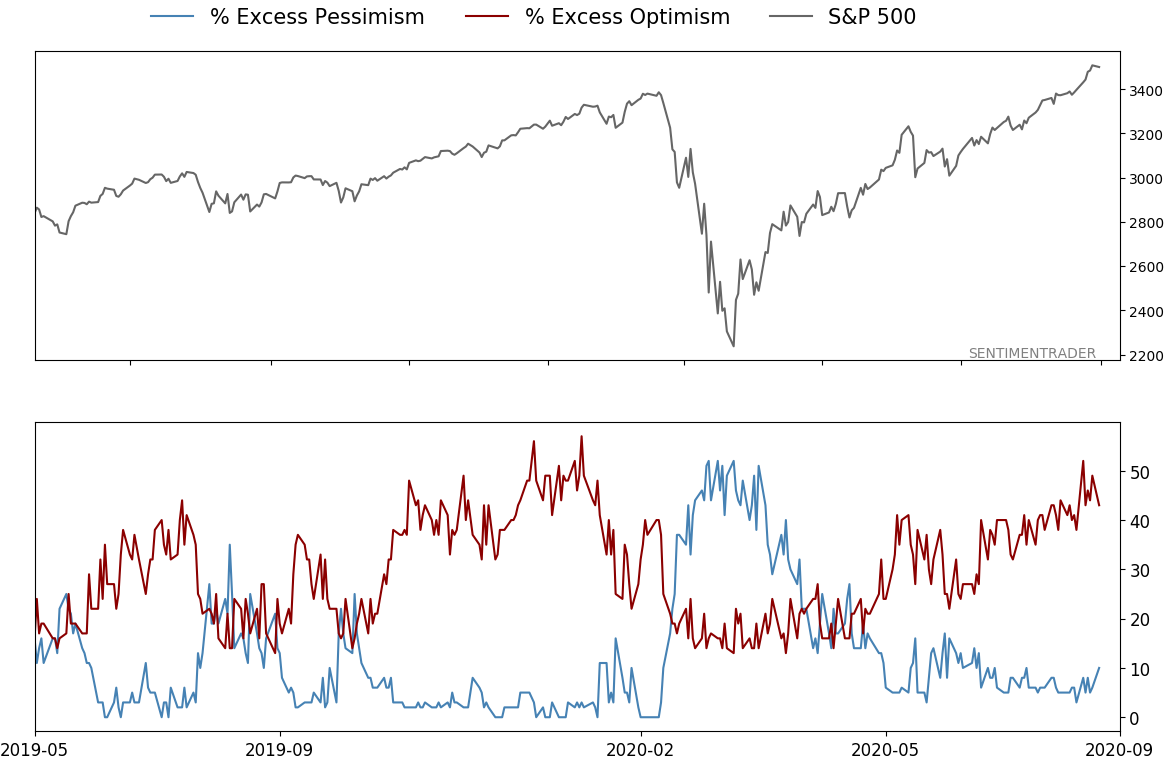
After stocks bottomed on March 23rd, they enjoyed a historic buying thrust and retraced a larger amount of the decline than "just a bear market rally" tends to. Through June, there were signs of breadth thrusts, recoveries, and trend changes that have an almost unblemished record at preceding higher prices over a 6-12 month time frame.

On a shorter-term basis, our indicators have been showing high optimism, with Dumb Money Confidence recently above 80%, along with signs of reckless speculation during what appears to be an unhealthy market environment, historically a bad combination. While there are certainly some outlier indicators that are showing apathy or even outright pessimism, a weight-of-the-evidence approach suggests high risk over a multi-week to multi-month time frame.

That has been the case since July, even arguably June and yet the major indexes hit continual new highs through late August. With the indicators and studies failing to precede any weakness, I've been hesitant to lower my already-low exposure. I am getting increasingly anxious about the oddities we're seeing, though, and lowered it again. This account is mostly about comfort with risk for me, and right now I'm not at all comfortable with any of it.


RETURN YTD: -0.5%*

2019: 12.6%, 2018: 0.6%, 2017: 3.8%, 2016: 17.1%, 2015: 9.2%, 2014: 14.5%, 2013: 2.2%, 2012: 10.8%, 2011: 16.5%, 2010: 15.3%, 2009: 23.9%, 2008: 16.2%, 2007: 7.8%

* NOTE: The account was not properly accounting for reinvested dividends from the money market fund, so that was adjusted on Aug 31.

Phase Table

Ranks

Sentiment Around The World

Optimism Index Thumbnails

Sector ETF's - 10-Day Moving Average
Country ETF's - 10-Day Moving Average
Bond ETF's - 10-Day Moving Average
Currency ETF's - 5-Day Moving Average
Commodity ETF's - 5-Day Moving Average

Sorry, you don't have access to this report

Upgrade your subscription plan to get access