Data &
Technology
Research
Reports
Report Solutions
Reports Library
Actionable
Strategies
Free
Resources
Simple Backtest Calculator
Simple Seasonality Calculator
The Kelly Criterion Calculator
Sentiment Geo Map
Public Research Reports
Free Webinar
Pricing
Company
About
Meet Our Team
In the News
Testimonials
Client Success Stories
Contact
Log inLoginSign up
< BACK TO ALL REPORTS

Daily Report : Another gap preps SPY for record momentum

Jason Goepfert
2020-08-28
The S&P 500 fund, SPY, gapped up for the 5th straight day, hitting record highs. This is just shy of the greatest opening momentum in the fund's history. The others saw subdued forward returns.
View/Print a PDF version of this Report

Headlines


Another gap preps SPY for record momentum: The S&P 500 fund, SPY, gapped up for the 5th straight day, hitting record highs. This is just shy of the greatest opening momentum in the fund's history. The others saw subdued forward returns.

The latest Commitments of Traders report was released, covering positions through Tuesday: The 3-Year Min/Max Screen shows that "smart money" hedgers mostly continued their same themes, selling the euro and holding long stocks. They became more aggressive in selling commodities including sugar and coffee. Their total short position in the contracts making up the DBA exchange-traded fund reached more than 70,000 contracts. The Backtest Engine shows that over the past 9 years, a short position this large preceded losses in DBA in the months ahead every time (in 2011, DBA managed to gain for months before giving back its gains). If these contracts can continue to gain, it will suggest a major trend change.

Bottom Line:

  • Weight of the evidence has been suggesting flat/lower stock prices short- to medium-term again; still suggesting higher prices long-term
  • Indicators show high optimism, with Dumb Money Confidence above 80% with signs of reckless speculation during what appears to be an unhealthy market environment, historically a bad combination, though it's easing somewhat and so far the dangerous / odd conditions have not mattered to the major indexes
  • Active Studies show a heavy positive skew over the medium- to long-term; breadth thrusts, recoveries, and trend changes have an almost unblemished record at preceding higher prices over a 6-12 month time frame
  • Signs of extremely skewed preference for tech stocks neared exhaustion by late June, especially relative to industrials and financials (here and here)
  • Indicators and studies for other markets are showing less consistent forward results, though it's not a great sign for Treasuries that hedgers are net short and optimism on metals recently became extreme with concerning 100-day analogs, with "perfect" breadth among miners recently dipping a bit.

Smart / Dumb Money Confidence

Smart Money Confidence: 35% Dumb Money Confidence: 82%

Risk Levels

Stocks Short-Term

Stocks Medium-Term

Bonds

Crude Oil

Gold

Agriculture

Active Studies

Click here to view the Active Research the site.
Time FrameBullishBearish
Short-Term01
Medium-Term18
Long-Term471

Indicators at Extremes

Click here to view on the site (% Extremes and "Excess" tabs on the dashboard).
% Showing Pessimism: 6%
Bullish for Stocks

Inverse ETF Volume
VIX
OEX Put/Call Ratio
Mutual Fund Flow (no ETFs)
Major Index Combo
% Showing Optimism: 49%
Bearish for Stocks

Smart Money / Dumb Money Confidence Spread
Intermediate Term Optimism Index (Optix)
Smart Money Confidence
Short-term Optimism Index (Optix)
Dumb Money Confidence
% Showing Excess Optimism
AIM (Advisor and Investor Model)
NYSE High/Low Ratio
SPY Liquidity Premium
Rydex Ratio
Rydex Money Market %
Fidelity Funds Breadth
OEX Determination Index
Equity Put/Call Ratio De-Trended
VIX Term Structure
Stock/Bond Ratio
ISE Equity Call/Put Ratio
Equity Put/Call Ratio
OEX Open Interest Ratio
Total Put/Call Ratio
NAAIM Exposure Index
SKEW Index
ROBO Put/Call Ratio
Options Speculation Index
Retail Money Market Ratio
NYSE Available Cash
Equity / Money Market Asset Ratio
Mutual Fund Cash Level

Portfolio

PositionWeight %Added / ReducedDate
Stocks29.8Reduced 9.1%2020-06-11
Bonds0.0Reduced 6.7%2020-02-28
Commodities5.2Added 2.4%
2020-02-28
Precious Metals0.0Reduced 3.6%2020-02-28
Special Situations0.0Reduced 31.9%2020-03-17
Cash65.0
Updates (Changes made today are underlined)

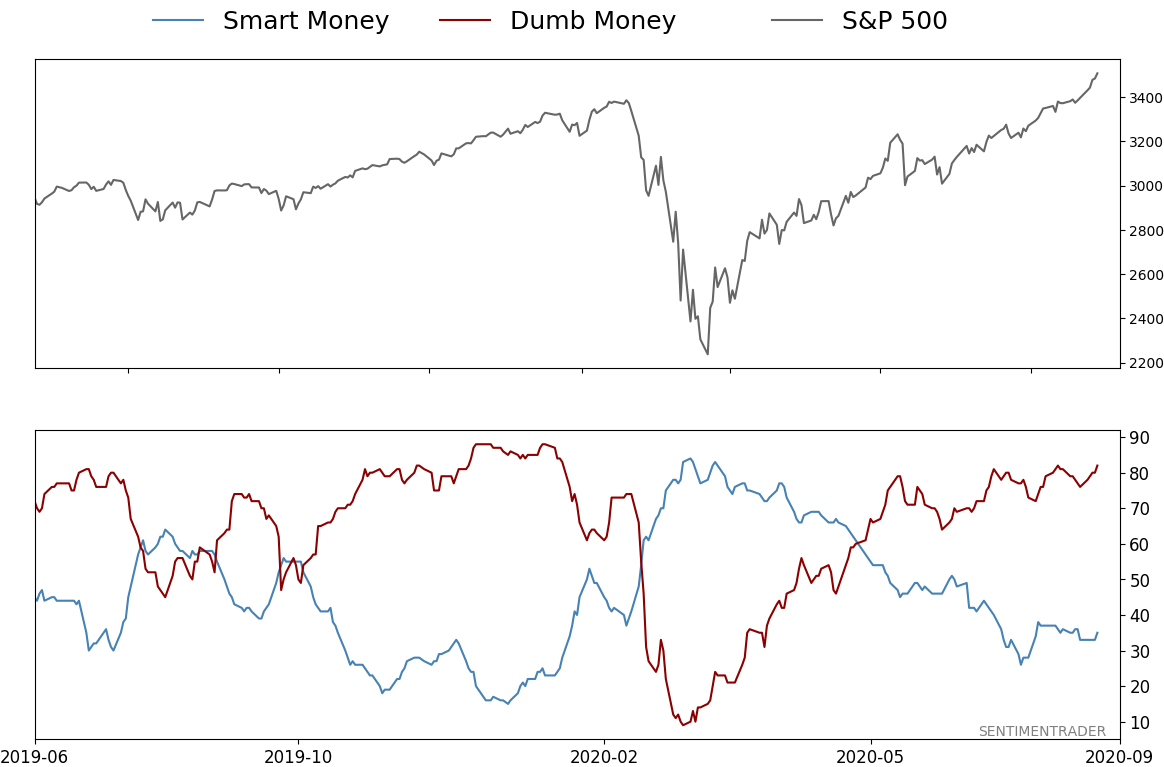
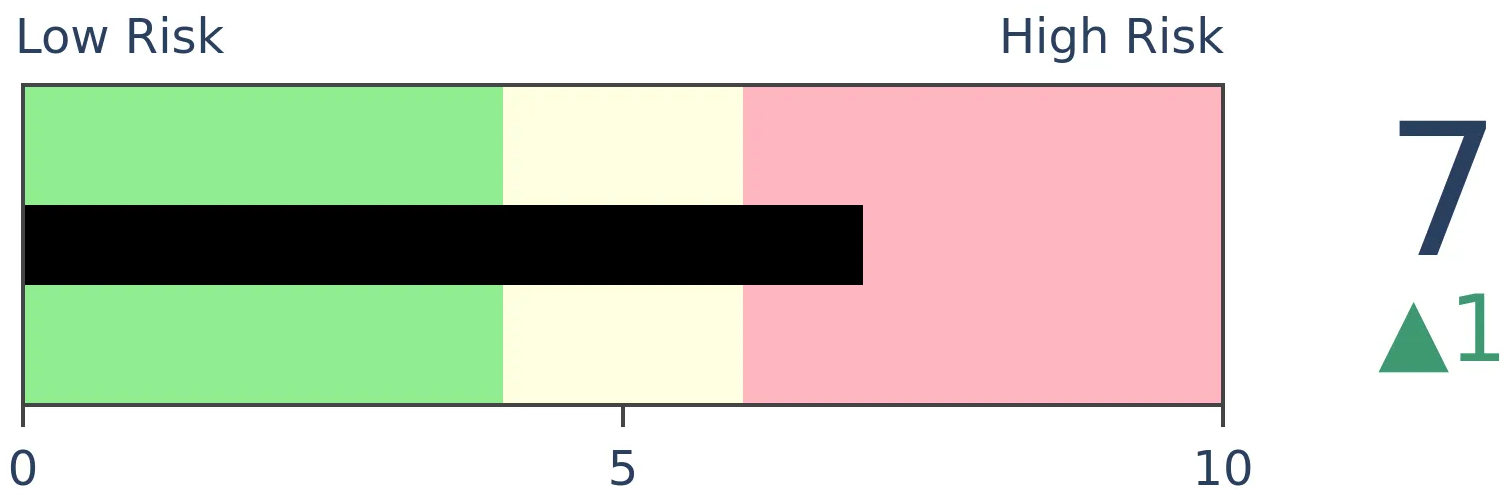
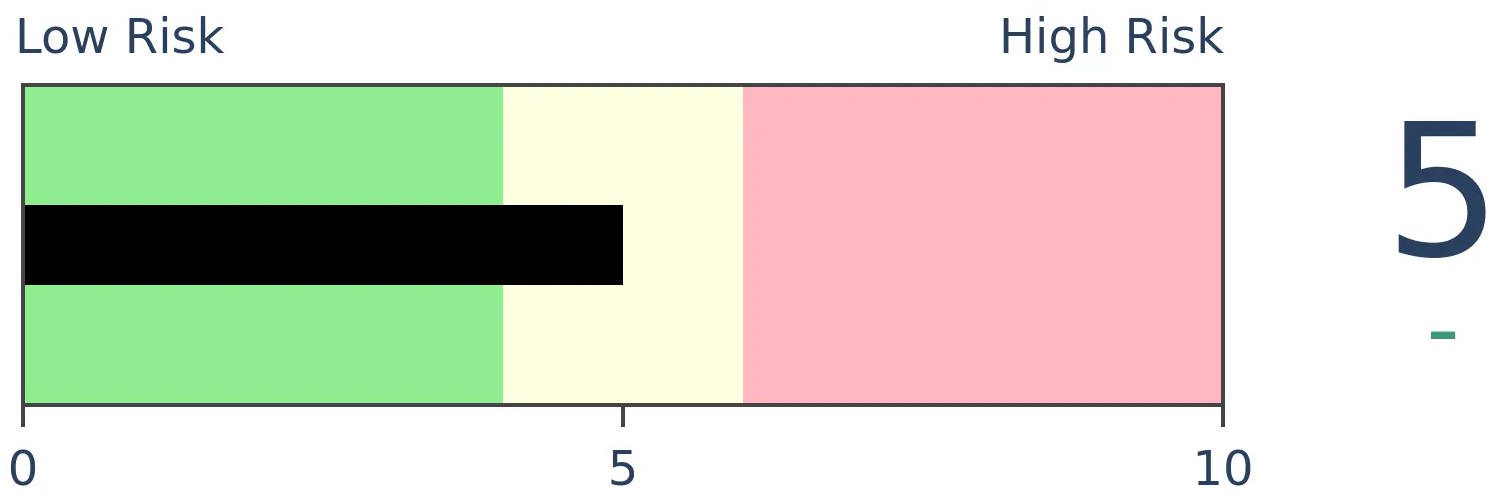
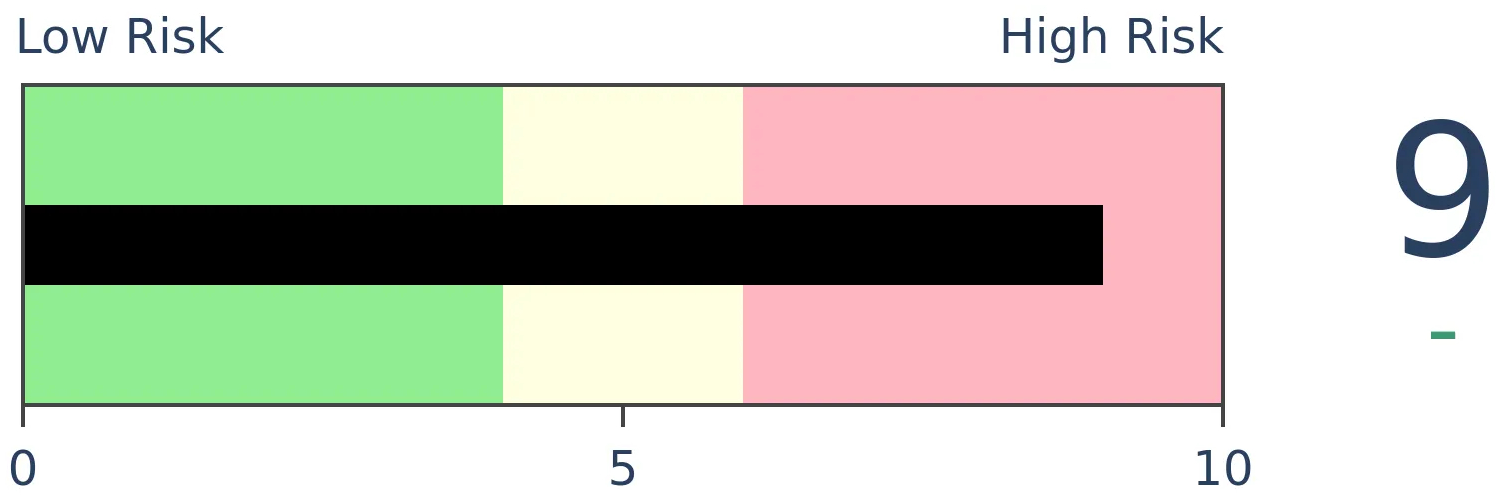
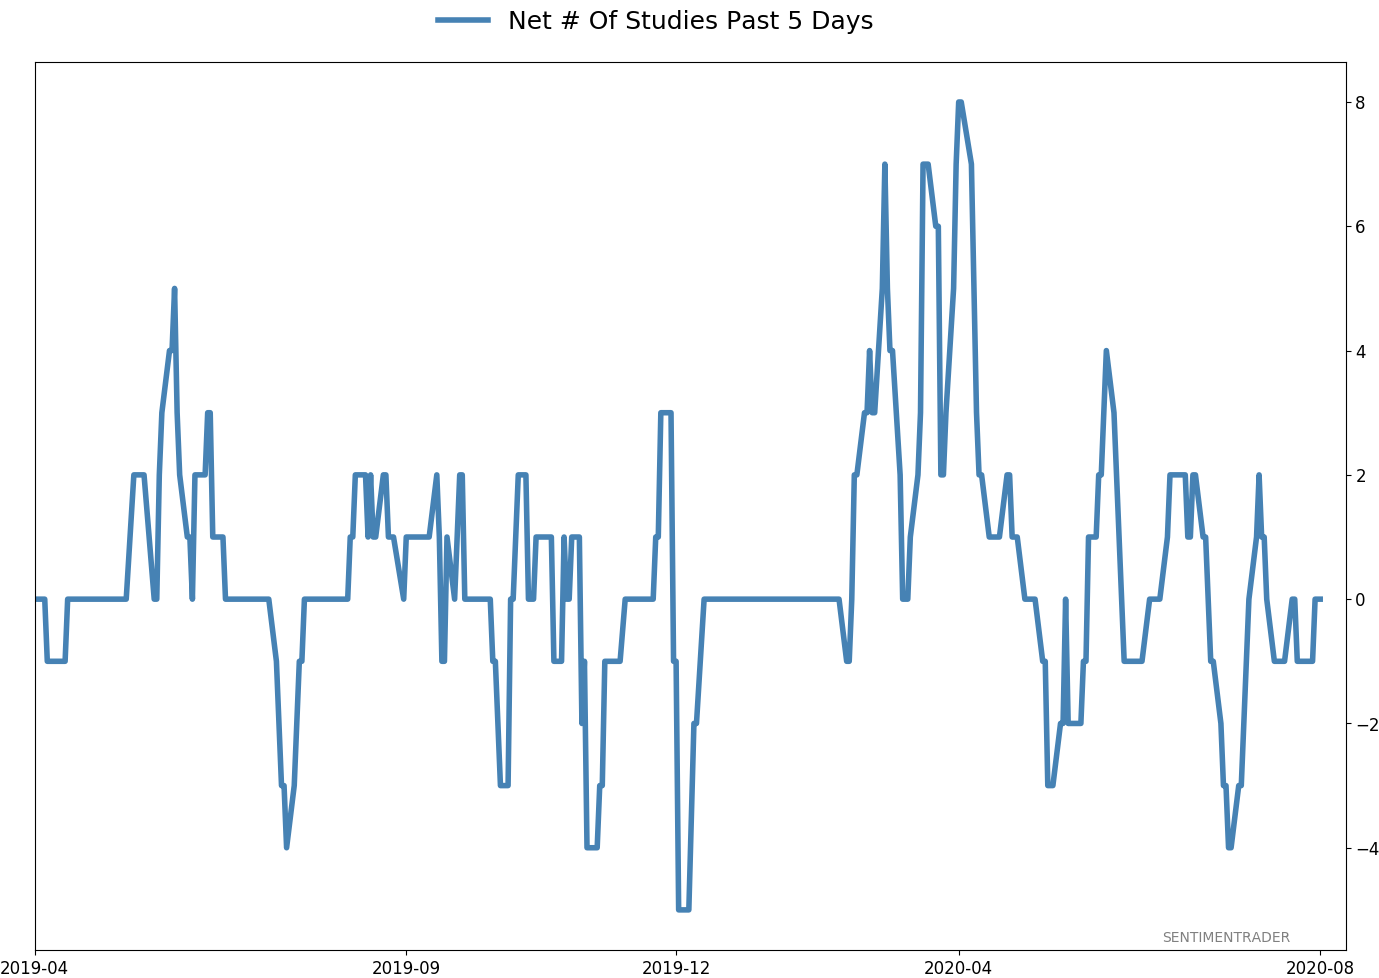
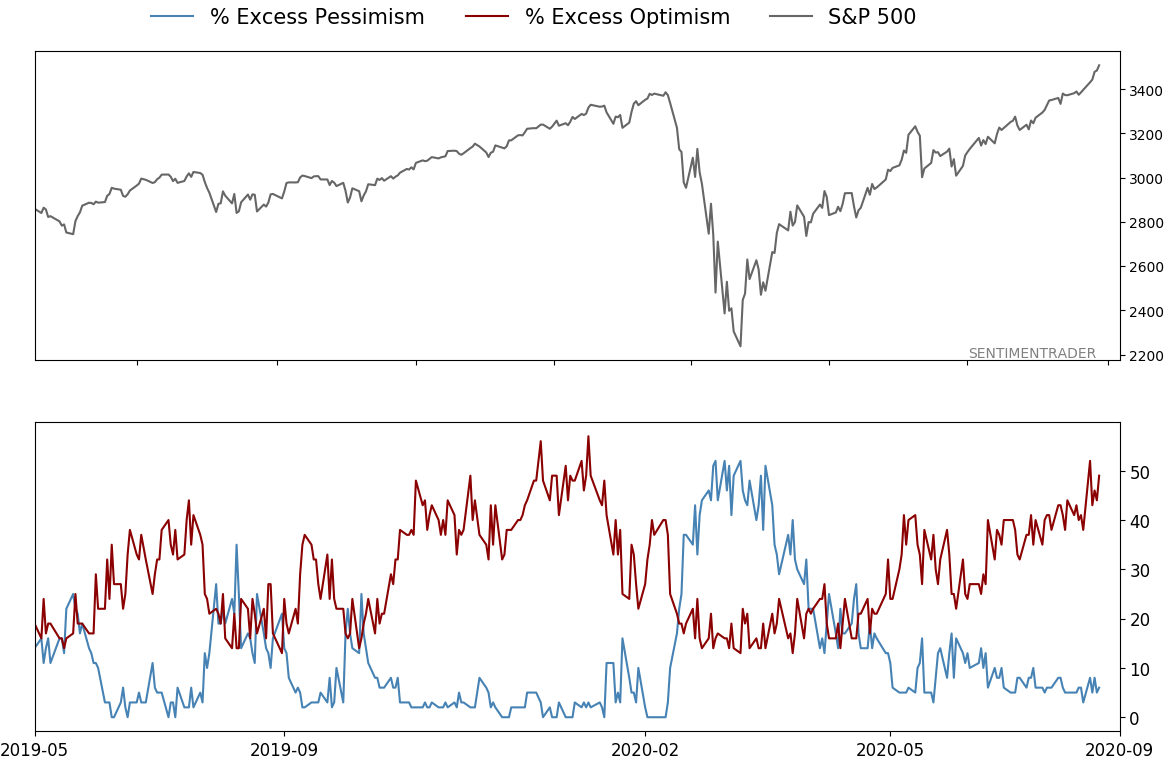
After stocks bottomed on March 23rd, they enjoyed a historic buying thrust and retraced a larger amount of the decline than "just a bear market rally" tends to. Through June, there were signs of breadth thrusts, recoveries, and trend changes that have an almost unblemished record at preceding higher prices over a 6-12 month time frame.

On a shorter-term basis, our indicators have been showing high optimism, with Dumb Money Confidence recently above 80%, along with signs of reckless speculation during what appears to be an unhealthy market environment, historically a bad combination. While there are certainly some outlier indicators that are showing apathy or even outright pessimism, a weight-of-the-evidence approach suggests high risk over a multi-week to multi-month time frame.

I've been carrying a low (too low) level of exposure to stocks, as well as bonds and gold. I don't see a good opportunity to add to any of those currently, with poor prospects pretty much all the way around. As worried as I am over the medium-term, I would only grudgingly reduce my exposure even further given the longer-term positives we spent so much time discussing in the spring. At this point, I would only look seriously at lowering exposure further if the S&P 500 starts to show some sign of faltering, which so far has been almost completely absent.


RETURN YTD: -1.2%

2019: 12.6%, 2018: 0.6%, 2017: 3.8%, 2016: 17.1%, 2015: 9.2%, 2014: 14.5%, 2013: 2.2%, 2012: 10.8%, 2011: 16.5%, 2010: 15.3%, 2009: 23.9%, 2008: 16.2%, 2007: 7.8%

Phase Table

Click here to view the Phase Table on the site.

Ranks

Click here to view on the site (Ranks tab on the Dashboard).

Sentiment Around The World

Click here to view on the site.

Optimism Index Thumbnails

Sector ETF's - 10-Day Moving Average
Country ETF's - 10-Day Moving Average
Bond ETF's - 10-Day Moving Average
Currency ETF's - 5-Day Moving Average
Commodity ETF's - 5-Day Moving Average

Sorry, you don't have access to this report

Upgrade your subscription plan to get access
Go to Dasboard
DATA &
TECHnologies
IndicatorEdge
‍
BackTestEdge
‍
Other Tools
‍
DataEdge API
RESEARCH
reports
Research Solution
‍
Reports Library
‍
actionable
Strategies
Trading Strategies
‍
Smart Stock Scanner
‍
FREE
RESOUrCES
Simple Backtest
Calculator
Simple Seasonality
Calculator
The Kelly Criterion
Calculator
Sentiment Geo Map
‍
Public Research Reports
‍
Free Webinar
COMPANY
‍
About
‍
Meet our Team
‍
In the News
‍
Testimonials
‍
Client Success Stories
Pricing
Bundle pricing
‍
Announcements
‍
FAQ
© 2024 Sundial Capital Research Inc. All rights reserved.
Setsail Marketing
TermsPrivacyAffiliate Program
Risk Disclosure: Futures and forex trading contains substantial risk and is not for every investor. An investor could potentially lose all or more than the initial investment. Risk capital is money that can be lost without jeopardizing ones’ financial security or life style. Only risk capital should be used for trading and only those with sufficient risk capital should consider trading. Past performance is not necessarily indicative of future results.

Hypothetical Performance Disclosure: Hypothetical performance results have many inherent limitations, some of which are described below. No representation is being made that any account will or is likely to achieve profits or losses similar to those shown; in fact, there are frequently sharp differences between hypothetical performance results and the actual results subsequently achieved by any particular trading program. One of the limitations of hypothetical performance results is that they are generally prepared with the benefit of hindsight. In addition, hypothetical trading does not involve financial risk, and no hypothetical trading record can completely account for the impact of financial risk of actual trading. for example, the ability to withstand losses or to adhere to a particular trading program in spite of trading losses are material points which can also adversely affect actual trading results. There are numerous other factors related to the markets in general or to the implementation of any specific trading program which cannot be fully accounted for in the preparation of hypothetical performance results and all which can adversely affect trading results.

Testimonial Disclosure: Testimonials appearing on this website may not be representative of other clients or customers and is not a guarantee of future performance or success.