Headlines
|
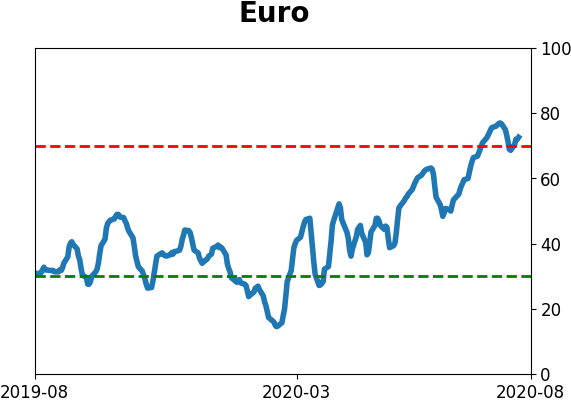
| Environment turning healthier but sentiment still a risk: The market environment for stocks is turning more positive though the high number of oddities is concerning. Sentiment remains highly optimistic even though there are some outlier indicators. Mom & pop sell while newsletters tell them to buy: The AAII survey of mom & pop investors remains historically low, showing extreme pessimism despite rising prices. It's one of the few surveys showing pessimism, as others like Investor's Intelligence showing that newsletter writers are extremely optimistic. This is the greatest divergence in opinions ever, and it slightly favors mom & pop. The latest Commitments of Traders report was released, covering positions through Tuesday: The 3-Year Min/Max Screen shows that "smart money" hedgers mostly continued their same outlooks, adding to longs in the U.S. dollar, particularly against the euro. They're now holding about 37% of the open interest in the euro net short, the most since 2011 and exceeding the prior extremes from October 2013 and January/February 2018 when the euro had big trouble maintaining further upside. In major equity index futures, where hedgers have truly lived up to their moniker as the smart money, they reduced their net long to about $24 billion. That's about half of what it was in May, but is still above prior extremes from the past decade. Bottom Line:
|
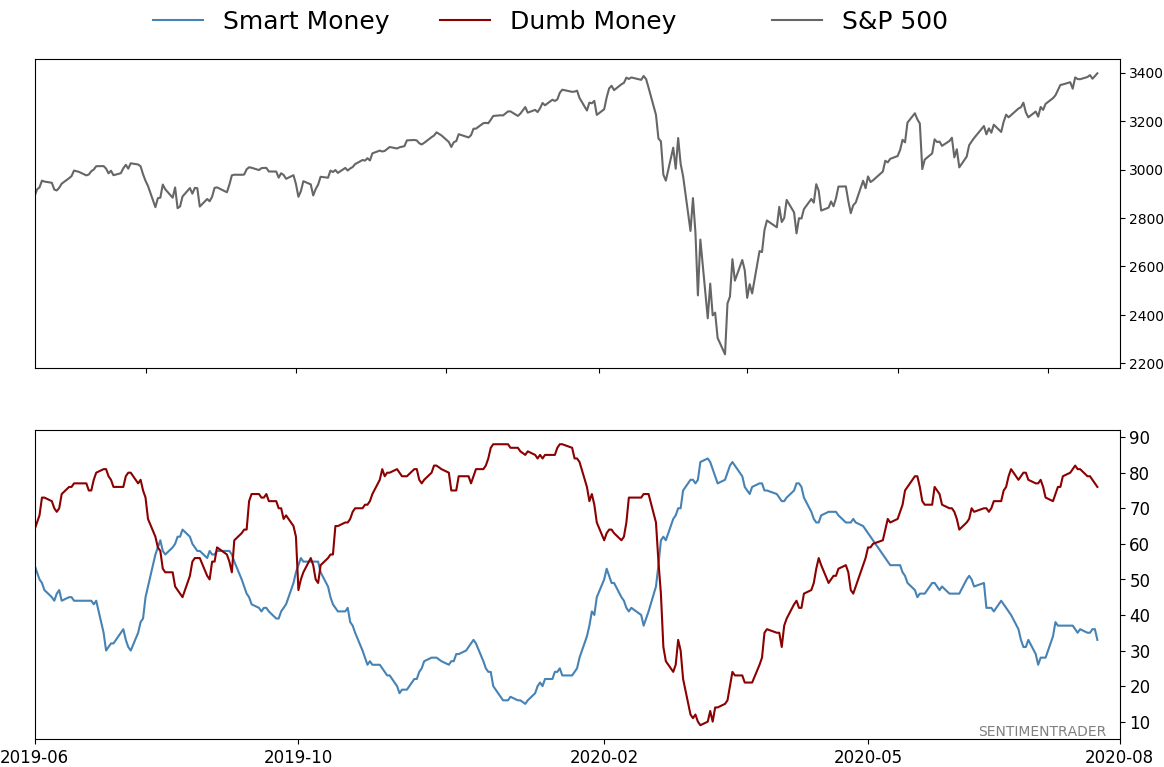
Smart / Dumb Money Confidence
Smart Money Confidence: 33% Dumb Money Confidence: 76% |
|
Risk Levels
Stocks Short-Term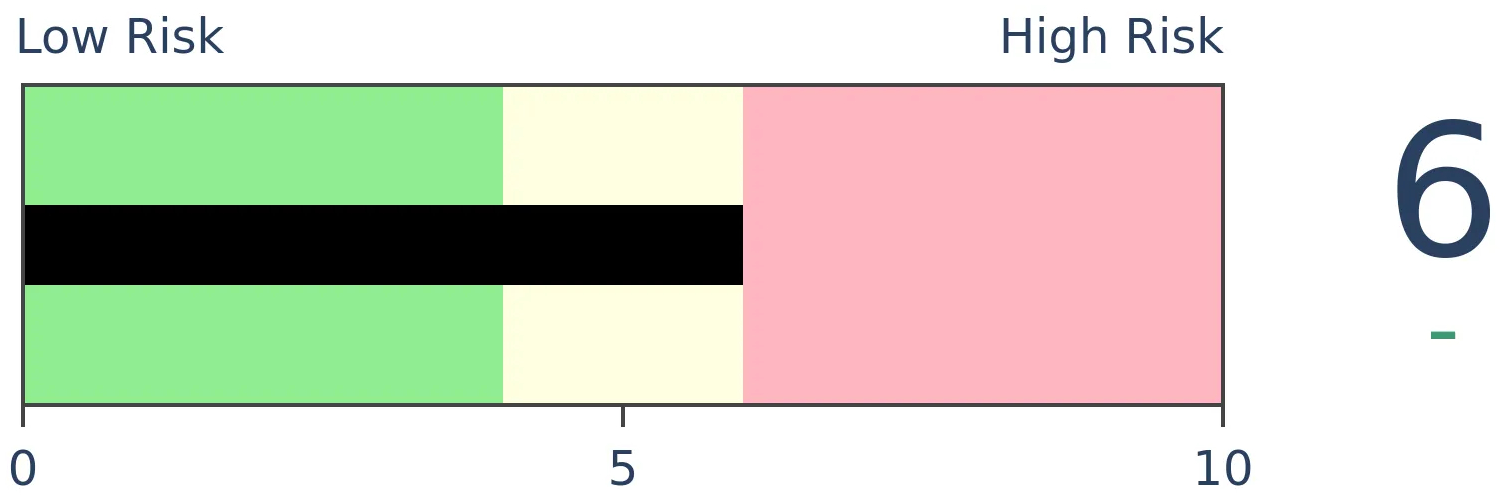 |
Stocks Medium-Term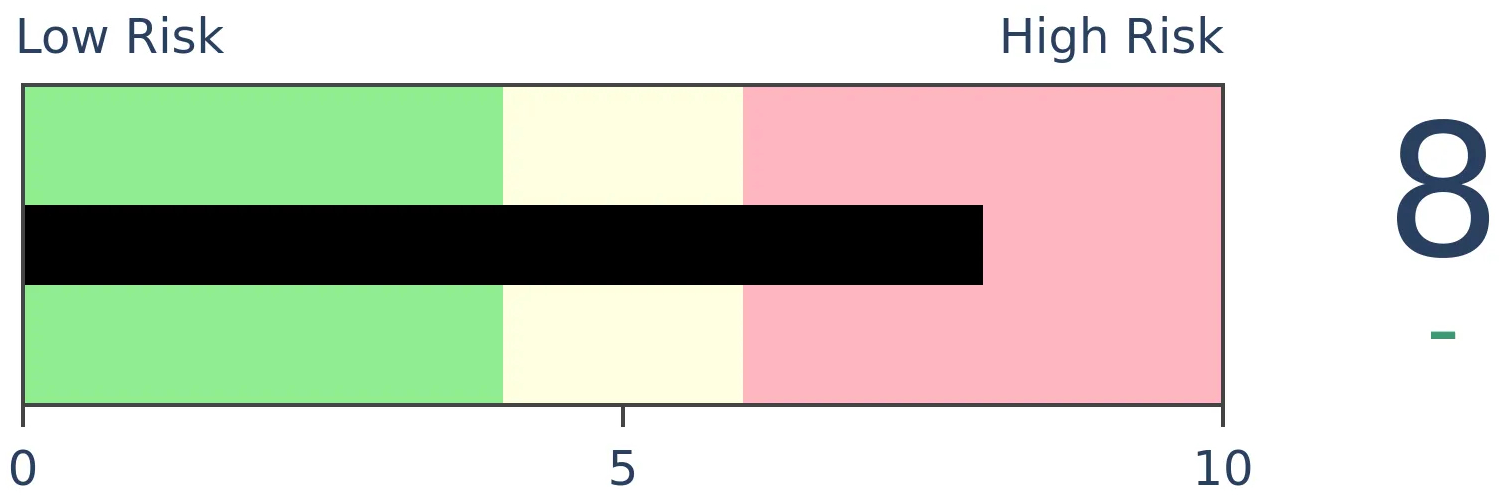 |
|
Bonds |
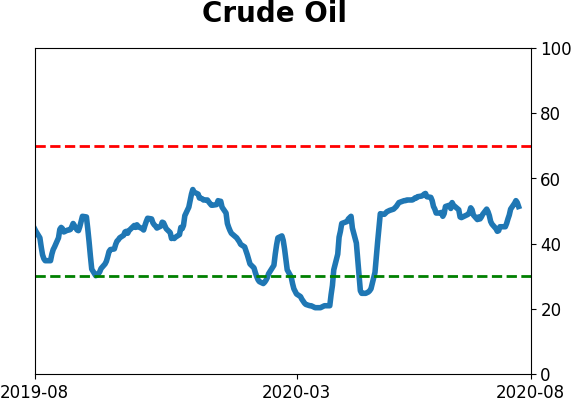
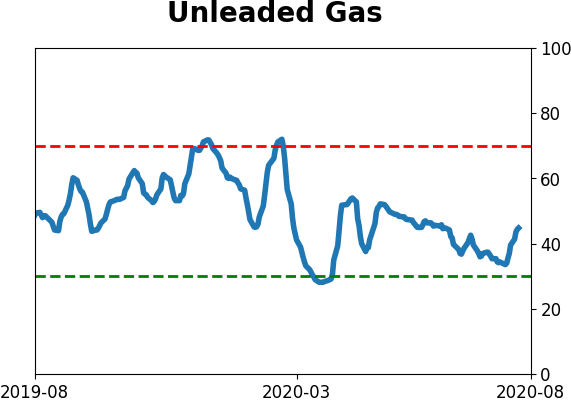
Crude Oil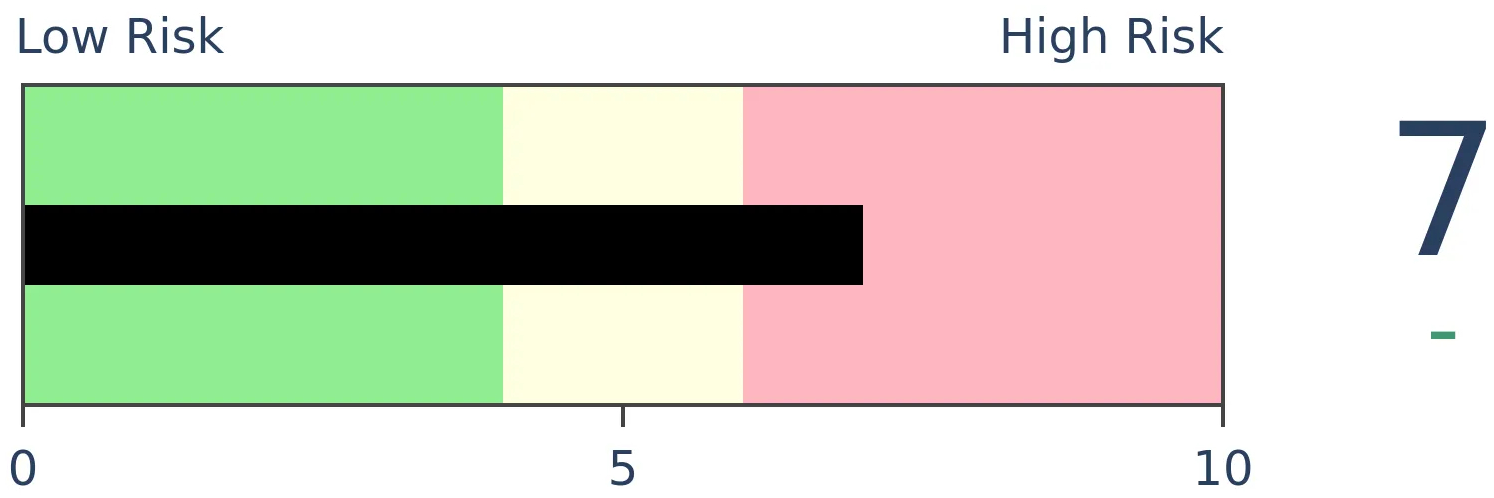 |
|
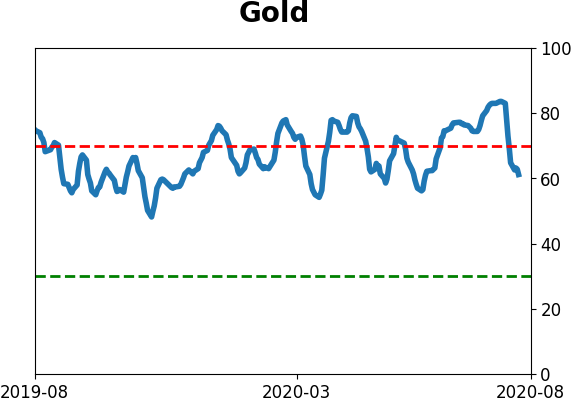
Gold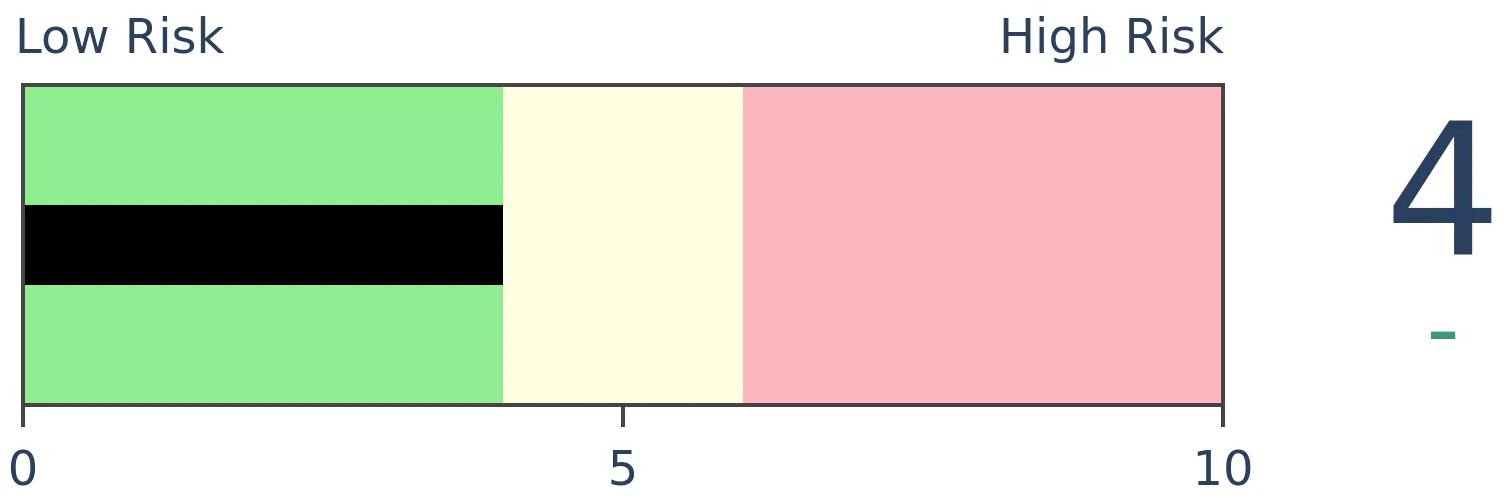 |
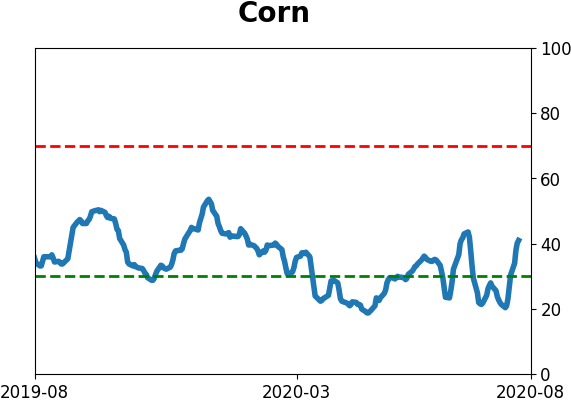
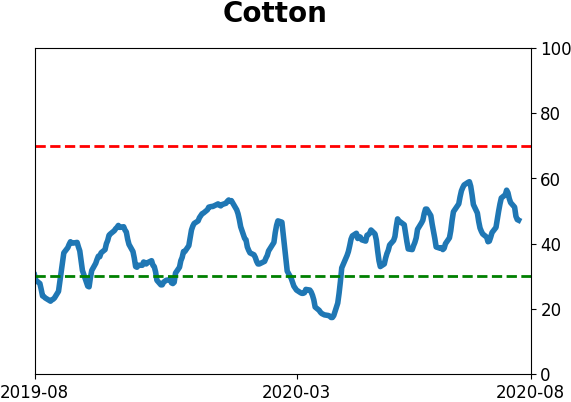
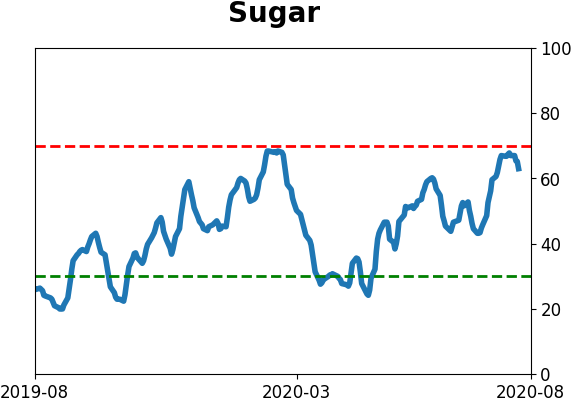
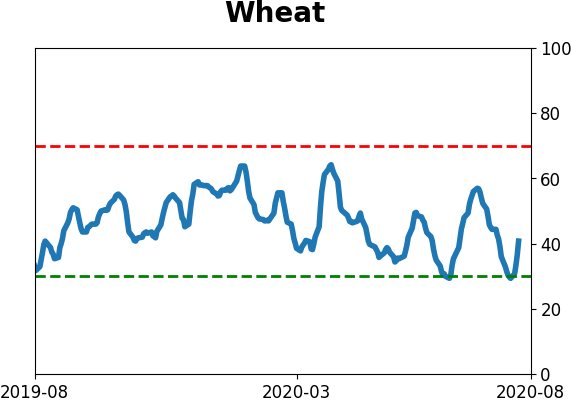
Agriculture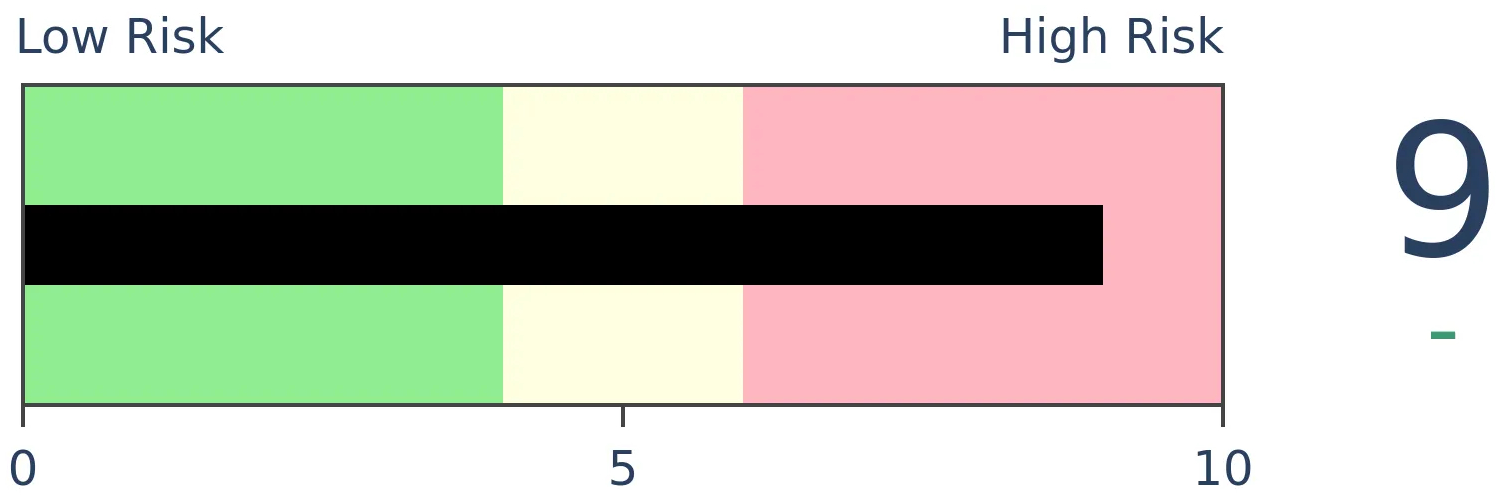 |
|
Research
BOTTOM LINE
The market environment for stocks is turning more positive though the high number of oddities is concerning. Sentiment remains highly optimistic even though there are some outlier indicators.
FORECAST / TIMEFRAME
None |
It pays to step back periodically and re-assess recent developments, which we've been doing weekly. The key questions are whether the market environment is healthy, and how markets are reacting to changes in sentiment as a result.
Environment turning more positive
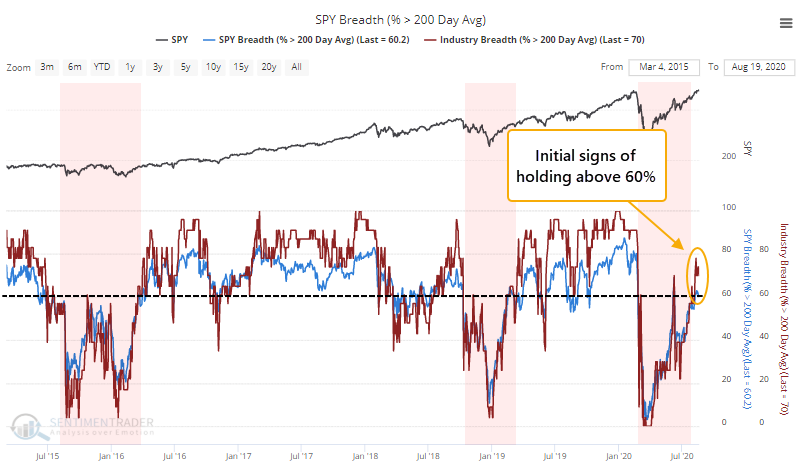
While the breadth thrusts, recoveries, and trend changes have been strongly positive for months, the broader market environment has been neutral at best. The S&P 500 has managed to hold above a rising 200-day average, but its price pattern is mixed, with a higher high but also a lower low. And participation has been an issue.
This week, we're seeing some initial signs that more than 60% of stocks, industries, and sectors are holding above their own averages. The vast majority of time, a healthy environment will see all of those hold well above 60%, rarely dipping below 40%. We're only now seeing the very early stages that this might be the case. There are a lot of qualifiers in that sentence.
The biggest worry at this point is the number of oddities that have built up in recent weeks. We've seen multiple days with larg-ish gains in the indexes, but very weak breadth underlying them.
It hasn't mattered so far, and there have been a few years historically when it didn't matter at all. It's a secondary consideration but still worrying, especially given the still-iffy market environment.
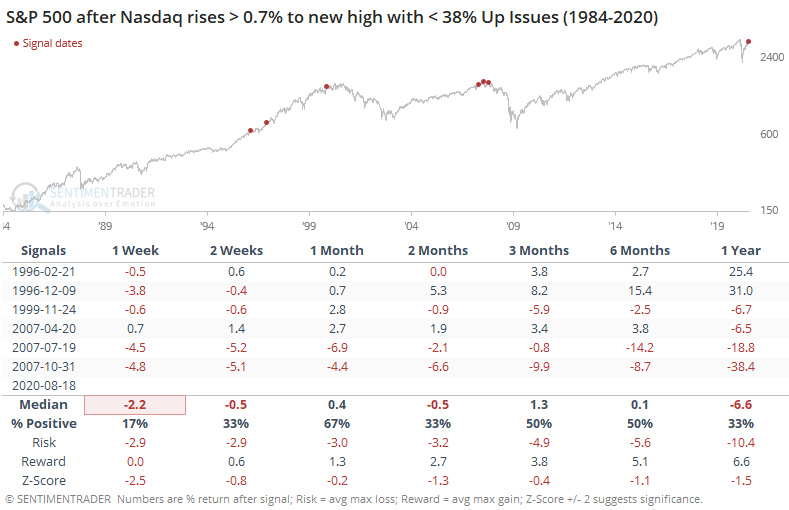
This was an issue once again on Friday. The Nasdaq Composite rose more than 0.4% to a 52-week high, and yet a pathetic 29% of stocks on that exchange managed to rise. This is the lowest in history, at least back to 1984. The next-lowest was a day in July. So, clearly it's been an issue for a while and yet the index continues to levitate.
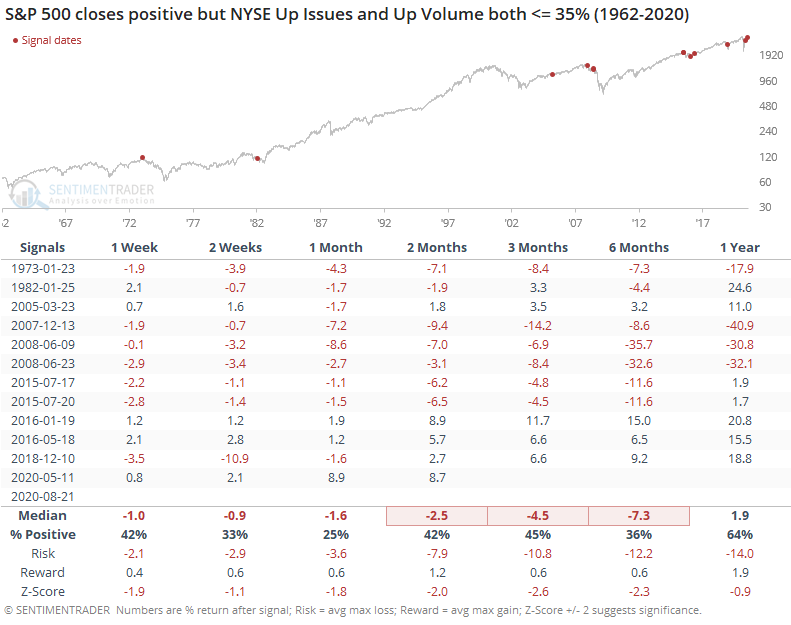
The S&P 500 rose more than 0.3% on Friday, yet the Up Issues Ratio and Up Volume Ratio were both 35% or less. This is the worst ever, dating back to 1962. Even for a day the S&P rose by any amount, it's some of the worst breadth we've ever seen.
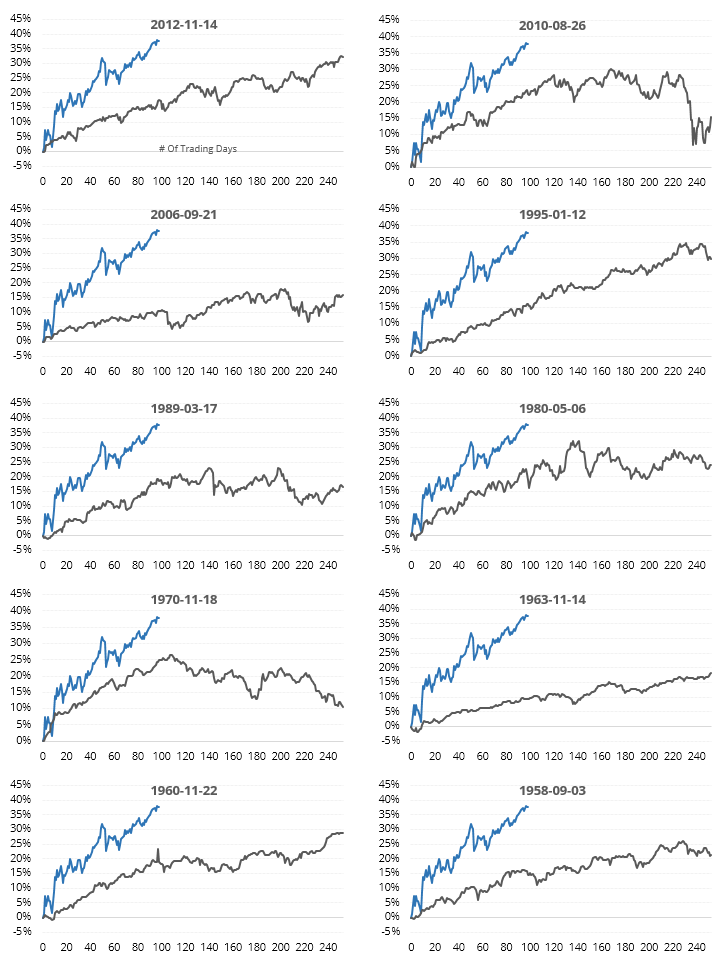
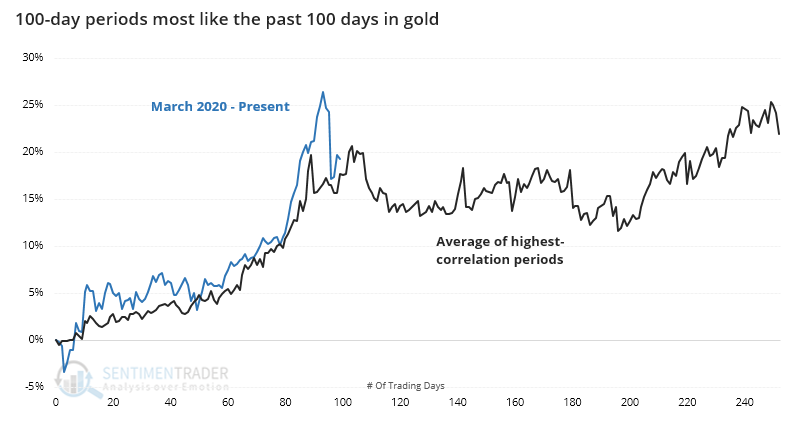
A lot of comparisons have been made to the post-2009 recovery, but as we saw earlier this week, there are other time periods that have a higher correlation. Below, we can see thumbnails of the most recent signals (the dates show the start of the 100-day comparisons). It's interesting to note how many of them started to run into a little bit of trouble around day #100 - 120.
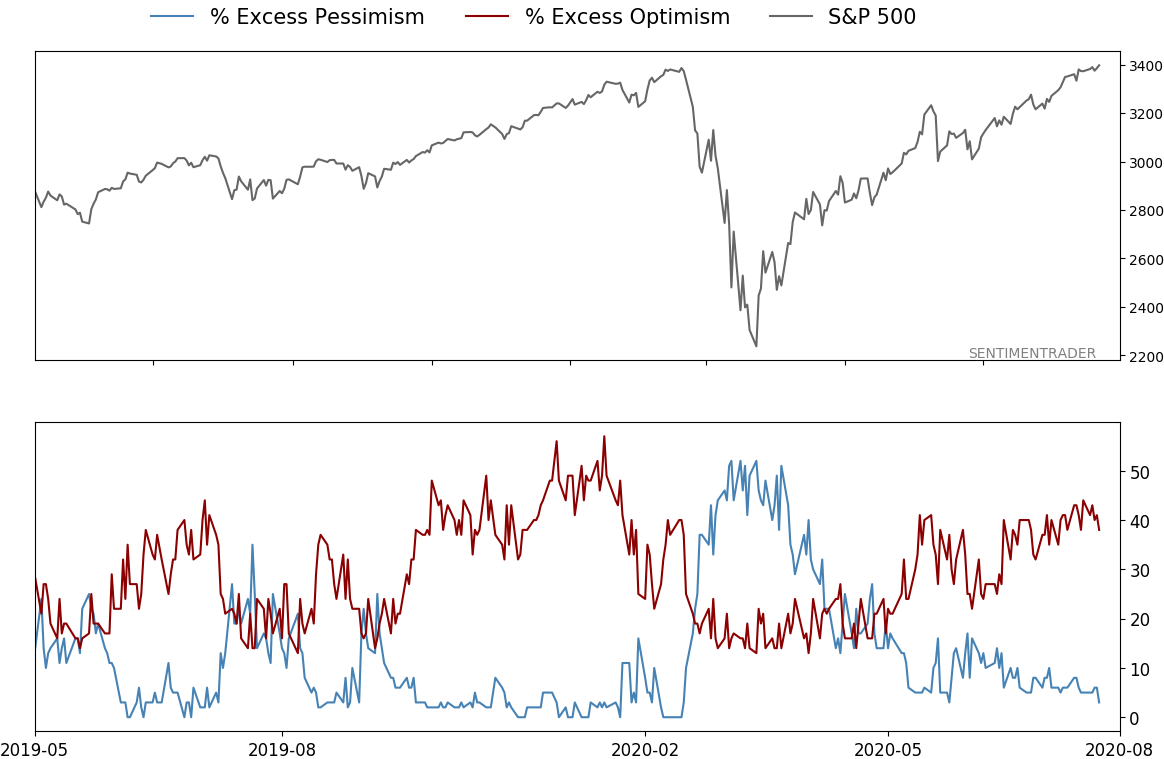
Sentiment is still extremely optimistic
There wasn't much that was new this week. There are outliers, of course, like fund flows. But the majority of our core indicators are still showing high confidence that stocks will rally.
In recent years, when this was the case, stocks fell back soon twice but managed to continue their rallies for a while twice as well. A very general guideline was that most of the weakness was felt once the "creeper" trends were broken decisively, even just using a 20-day moving average on the S&P for that determination.
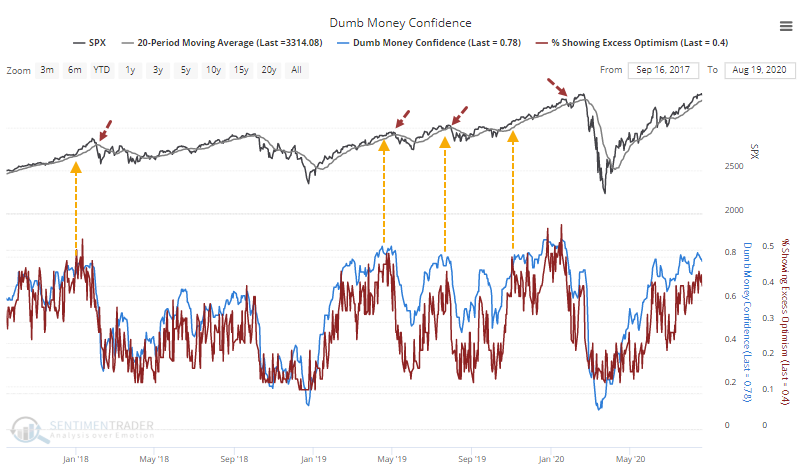
We tend to shy away from suggesting triggers, as everyone has their own favorite methodology for determining trends on different time frames. That also means that we are typically early since sentiment and our studies tend to precede turns in price. Whatever the trigger, if stocks start to experience some weakness (the indexes, anyway - many individual stocks already have) then the setup is ripe for a pullback.
Other markets
The biggest development we looked at in other markets was the same type of analog in gold that we did for stocks. By the time gold had enjoyed 100-day streaks like the past 100, it ran into some issues.
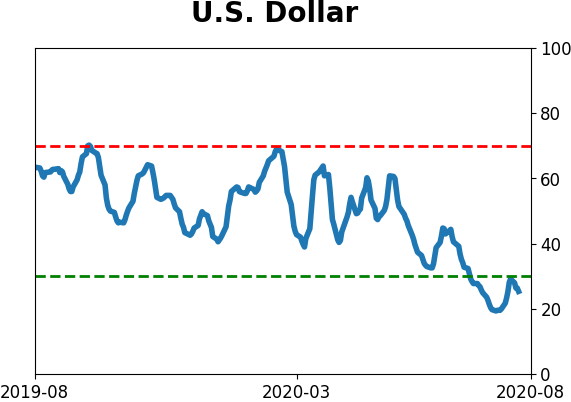
It has also struggled after the dollar enjoyed a price reversal like it did on Wednesday.
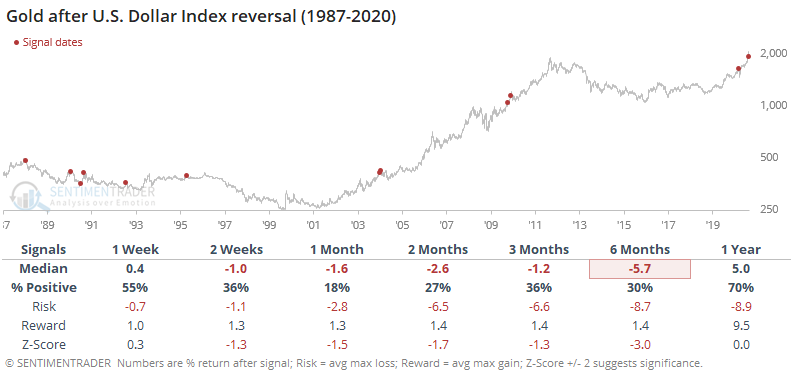
Momentum in the dollar has been very weak, and that tends to persist over the medium- to long-term. Shorter-term, reversals like it saw this week, and heavy pessimism, are better signs shorter-term.
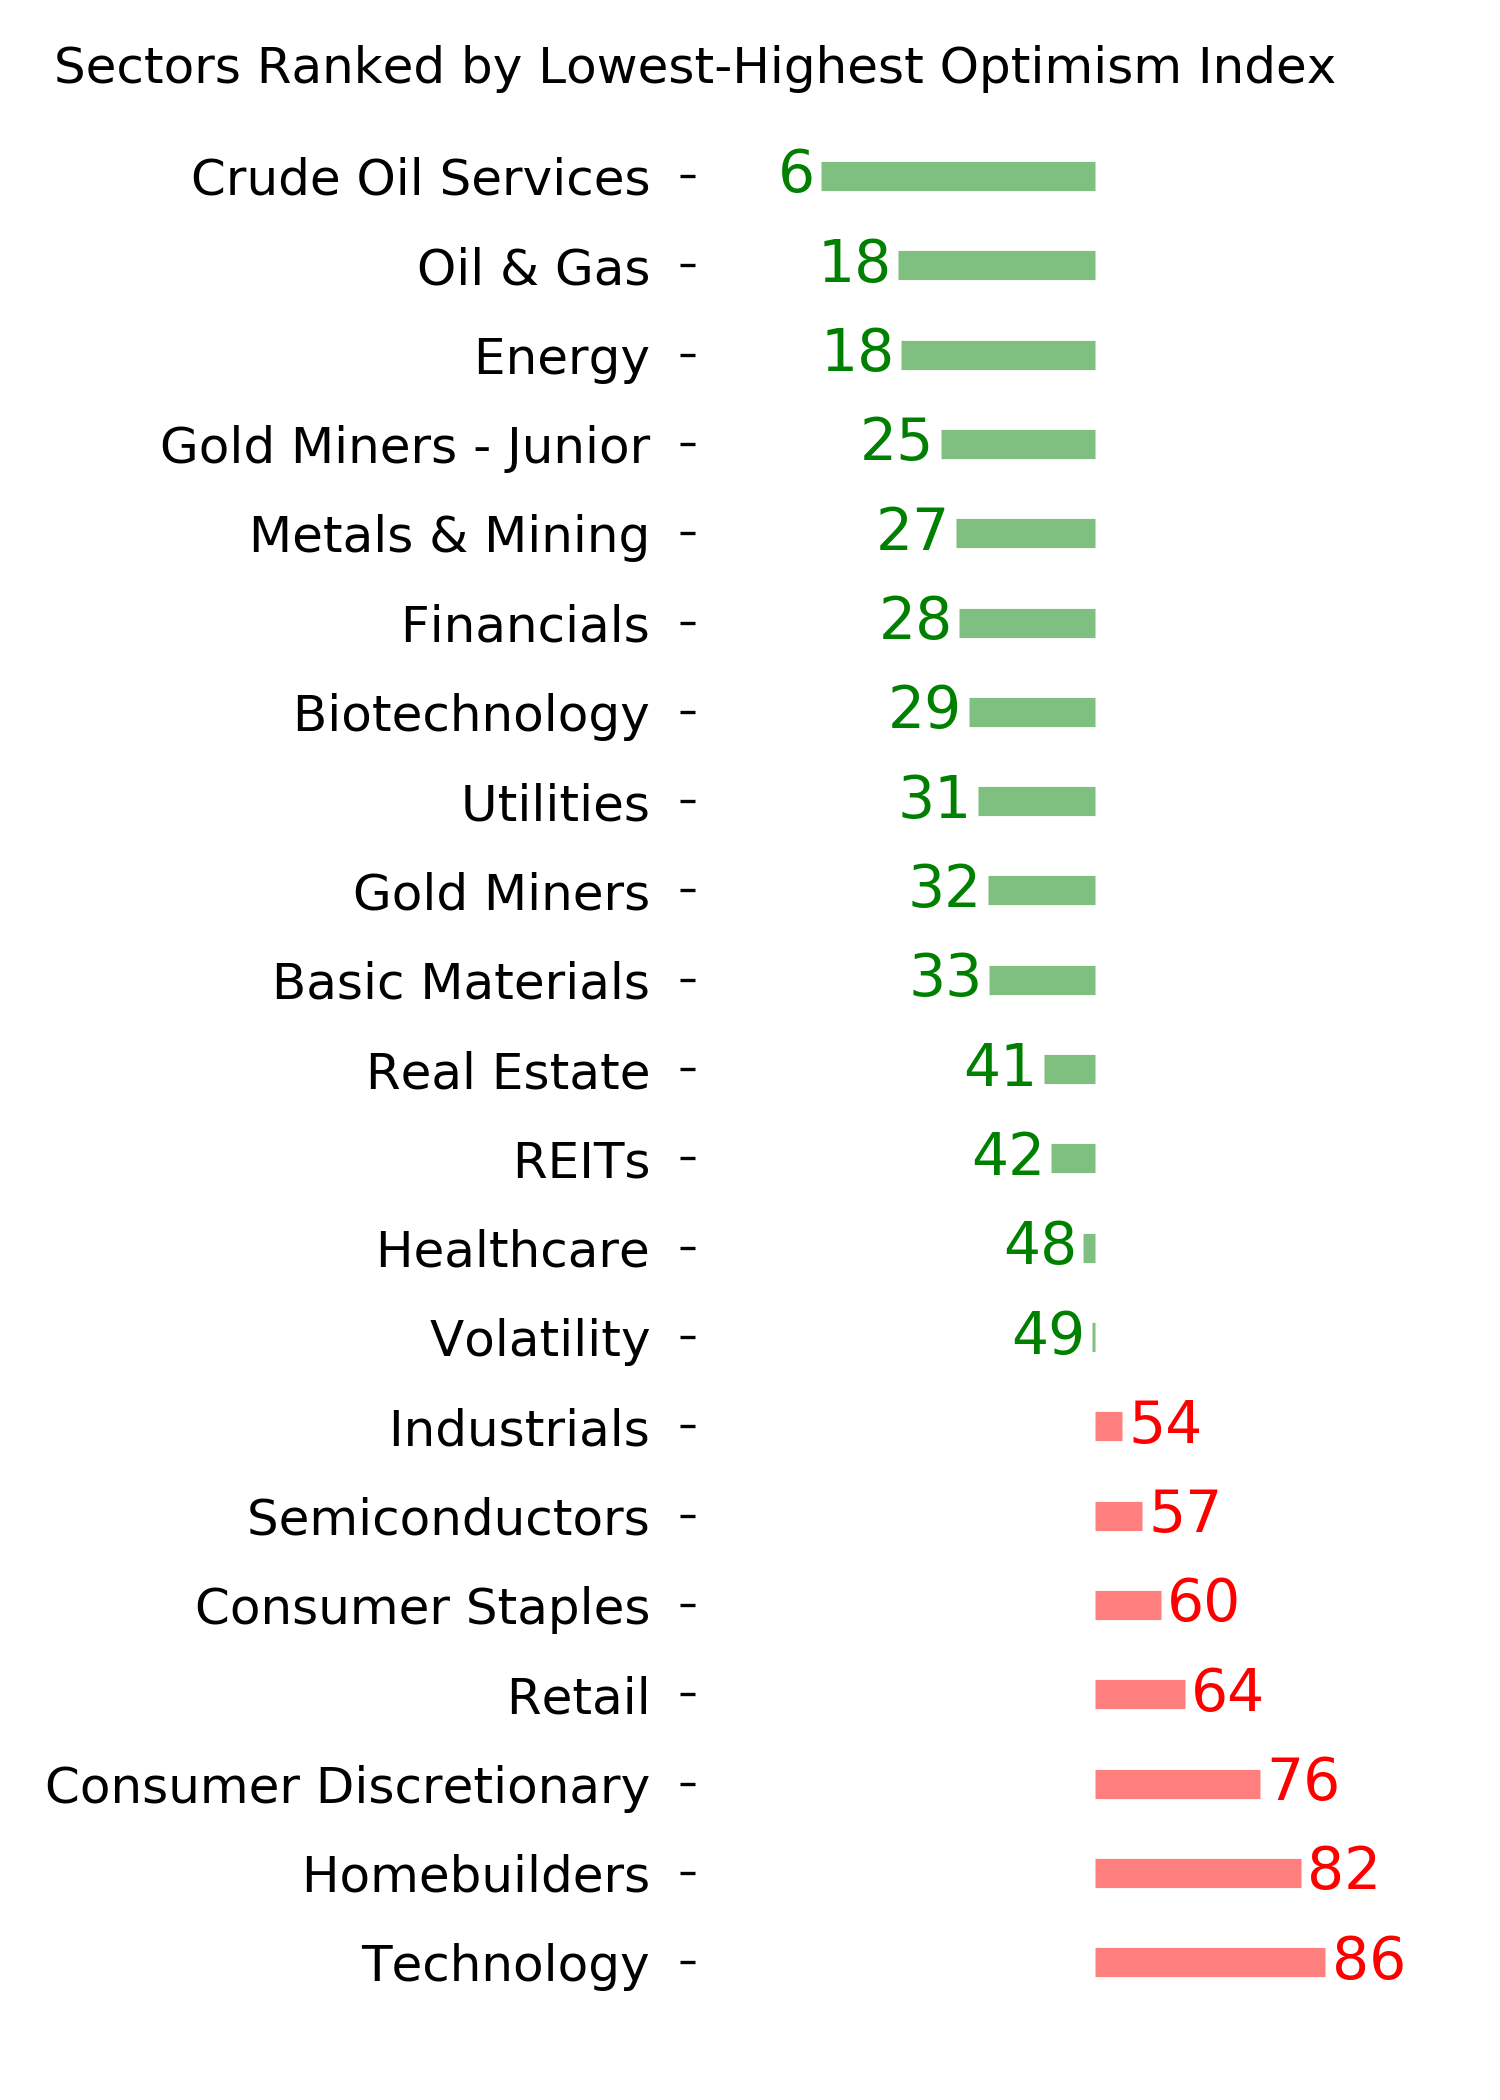
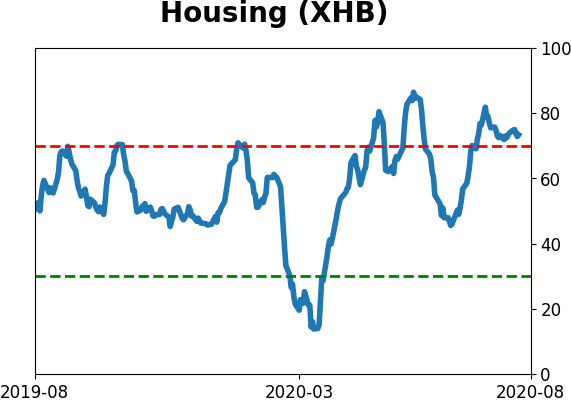
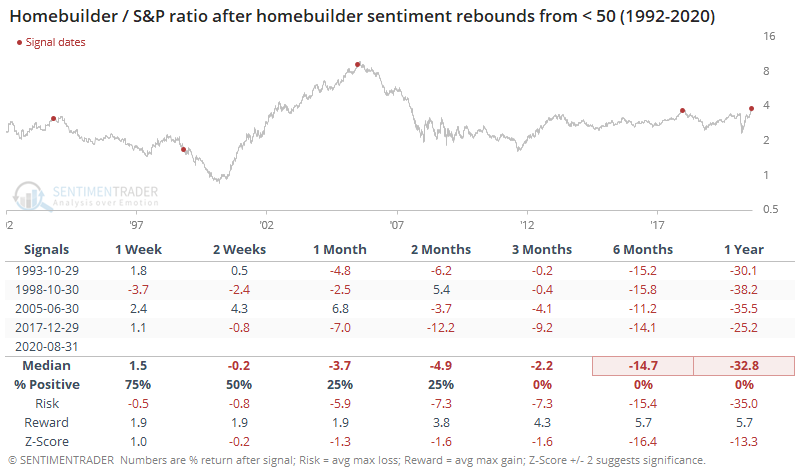
Among sectors, the biggest development was record optimism among homebuilders. The sample size is tiny, but other times builders' sentiment had recovered enough to hit new highs, the sector struggled both absolutely and relatively.
BOTTOM LINE
The AAII survey of mom & pop investors remains historically low, showing extreme pessimism despite rising prices. It's one of the few surveys showing pessimism, as others like Investor's Intelligence showing that newsletter writers are extremely optimistic. This is the greatest divergence in opinions ever, and it slightly favors mom & pop.
FORECAST / TIMEFRAME
None |
Much has been made of the idea that despite much real-money evidence to the contrary, individual investors are not optimistic. Pretty much the sole source of this opinion is a weekly survey from the American Association of Individual Investors.
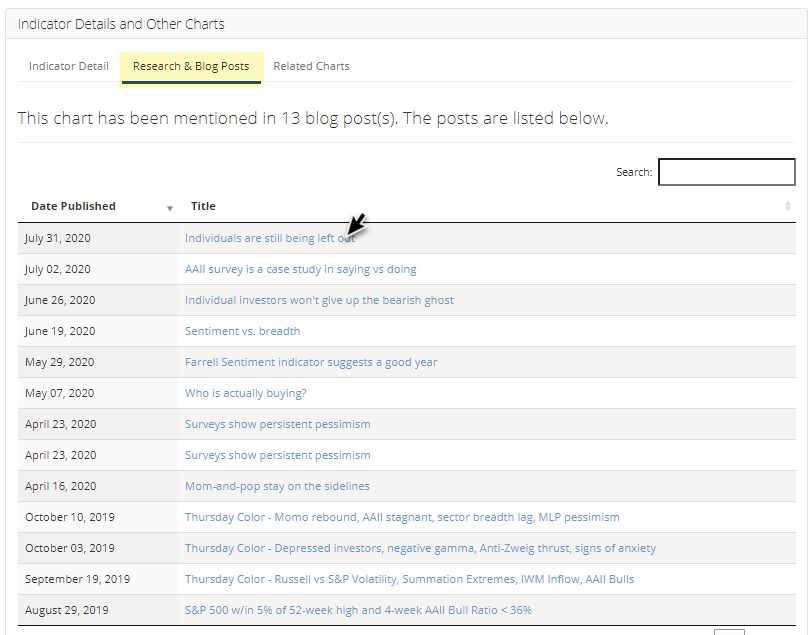
We've discussed this multiple times in recent months and don't need to rehash it. A good way to see what research we've published on any given indicator is to pull up its chart, then scroll to the bottom of the page and click the tab for Research & Blog Posts. This is the one for the percentage of AAII members that are bullish on stocks. Clicking the title will pull up that piece of research.
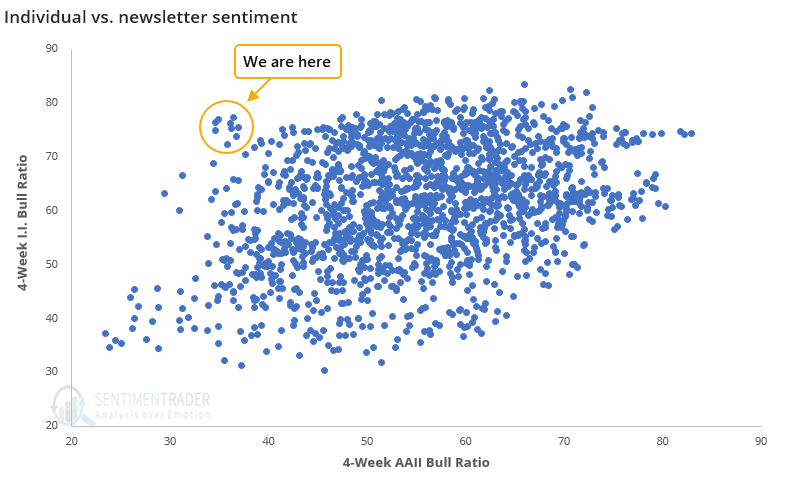
Even though stocks hit records again this week, the percentage of bulls remains low and bears remains high, so the Bull Ratio is still extremely low. That's not only unusual given stocks' returns in recent months, it's unusual compared to other surveys.
The poll of newsletter writers by Investor's Intelligence, for example, is showing extremely high optimism. That makes our current juncture the most unusual in the more than 30 years that both surveys have been released. Never before have we seen such pessimism from individuals at the same time as there has been such optimism from newsletters.
The spread between the 4-week average of the Bull Ratios from both surveys just hit a record low.
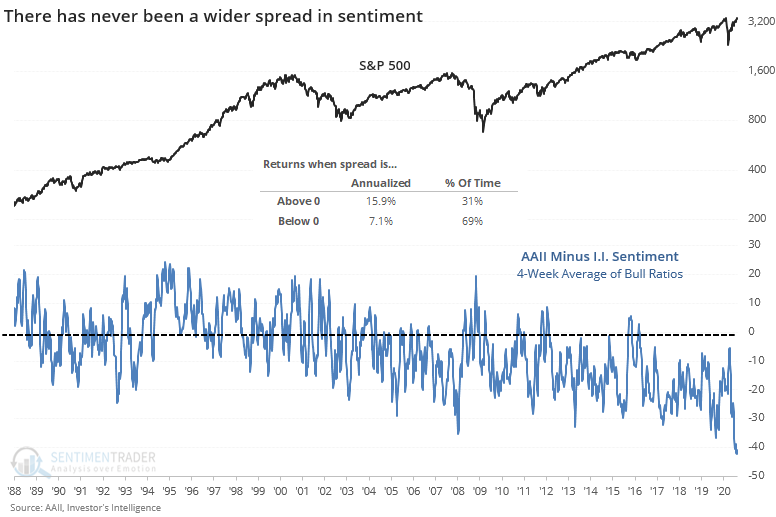
We can see from the chart that the S&P 500's annualized return when the spread is positive (AAII > Investor's Intelligence) is +15.9%. That's more than twice as high as when the spread is negative. In other words, when individuals were more optimistic than newsletter writers, then stocks performed better. So much for the idea that mom & pop are always the dumb money.
The table below shows the S&P's returns after any week when the spread between the two surveys was at its lowest level in at least 3 years.
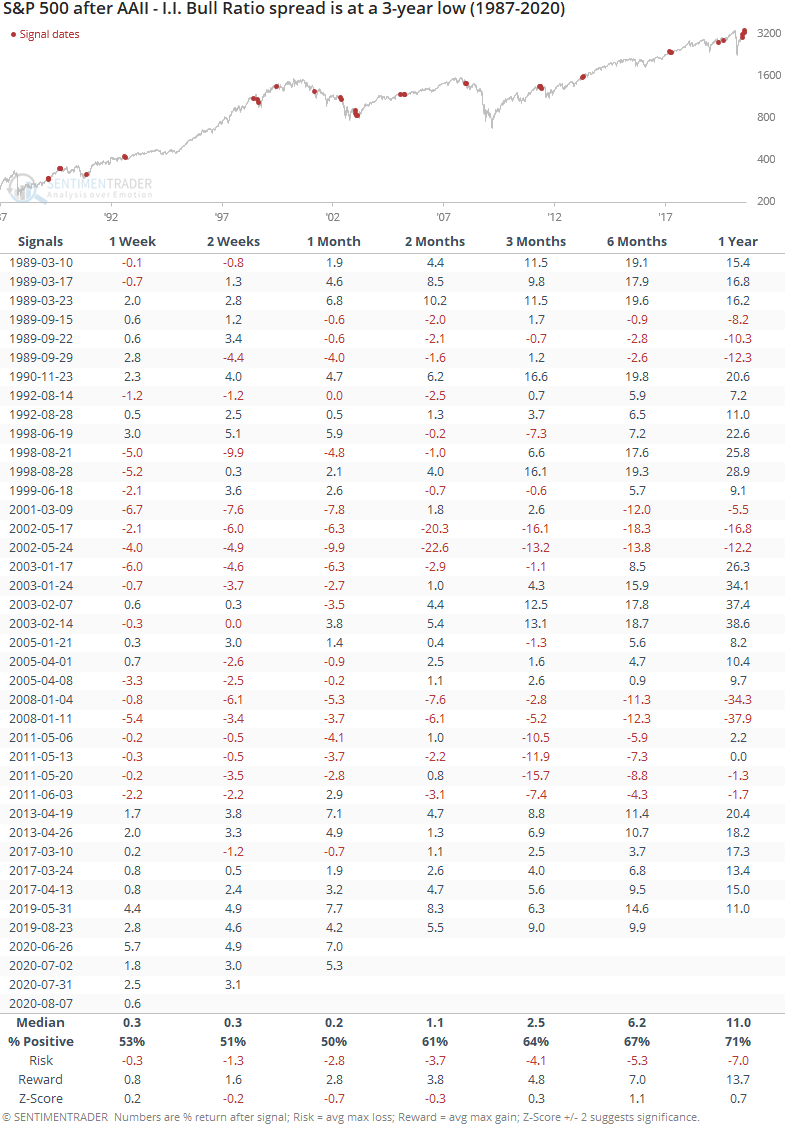
Returns were below average, but highly variable. It preceded several large declines, but also several large rallies.
People who are bullish on stocks will point to the AAII survey and trot out the tired, incorrect cliche that stocks are climbing a wall of worry. Bears will point to the I.I. survey and suggest that optimism is too high and stocks will fall.
We prefer to incorporate all of the evidence and see what sorts out. Currently, there are exceptions but there is much more evidence that optimism is excessively high, especially when looking at where investors are actually putting their money instead of just giving their opinions.
There is no perfect sentiment indicator, and surveys rank among the lower tier of them. They can be useful, primarily when in agreement and at one extreme or another. The current divergence between AAII and others is exceptional, and likely doesn't mean much. If anything, it might be a very slight negative given historical reactions under similar conditions.
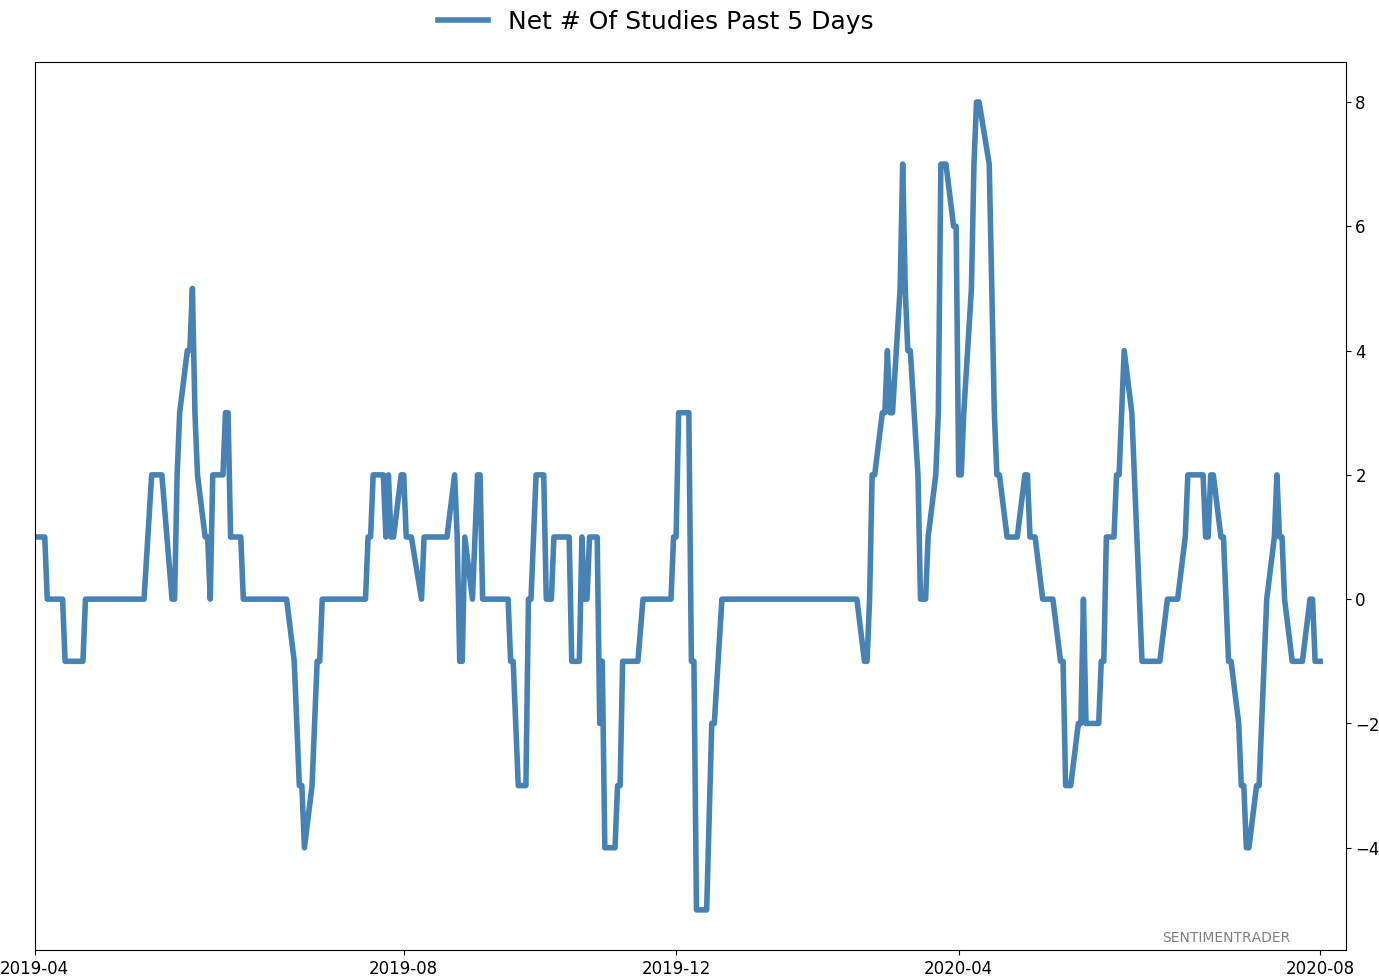
Active Studies
| Time Frame | Bullish | Bearish | | Short-Term | 0 | 1 | | Medium-Term | 8 | 13 | | Long-Term | 47 | 1 |
|
Indicators at Extremes
Portfolio
| Position | Weight % | Added / Reduced | Date | | Stocks | 29.8 | Reduced 9.1% | 2020-06-11 | | Bonds | 0.0 | Reduced 6.7% | 2020-02-28 | | Commodities | 5.2 | Added 2.4%
| 2020-02-28 | | Precious Metals | 0.0 | Reduced 3.6% | 2020-02-28 | | Special Situations | 0.0 | Reduced 31.9% | 2020-03-17 | | Cash | 65.0 |
|
|
|
Updates (Changes made today are underlined)
After stocks bottomed on March 23rd, they enjoyed a historic buying thrust and retraced a larger amount of the decline than "just a bear market rally" tends to. Through June, there were signs of breadth thrusts, recoveries, and trend changes that have an almost unblemished record at preceding higher prices over a 6-12 month time frame. On a shorter-term basis, our indicators have been showing high optimism, with Dumb Money Confidence recently above 80%, along with signs of reckless speculation during what appears to be an unhealthy market environment, historically a bad combination. While there are certainly some outlier indicators that are showing apathy or even outright pessimism, a weight-of-the-evidence approach suggests high risk over a multi-week to multi-month time frame. I've been carrying a low (too low) level of exposure to stocks, as well as bonds and gold. I don't see a good opportunity to add to any of those currently, with poor prospects pretty much all the way around. As worried as I am over the medium-term, I would only grudgingly reduce my exposure even further given the longer-term positives we spent so much time discussing in the spring. At this point, I would only look seriously at lowering exposure further if the S&P 500 starts to show some sign of faltering, which so far has been almost completely absent.
RETURN YTD: -2.4% 2019: 12.6%, 2018: 0.6%, 2017: 3.8%, 2016: 17.1%, 2015: 9.2%, 2014: 14.5%, 2013: 2.2%, 2012: 10.8%, 2011: 16.5%, 2010: 15.3%, 2009: 23.9%, 2008: 16.2%, 2007: 7.8%
|
|
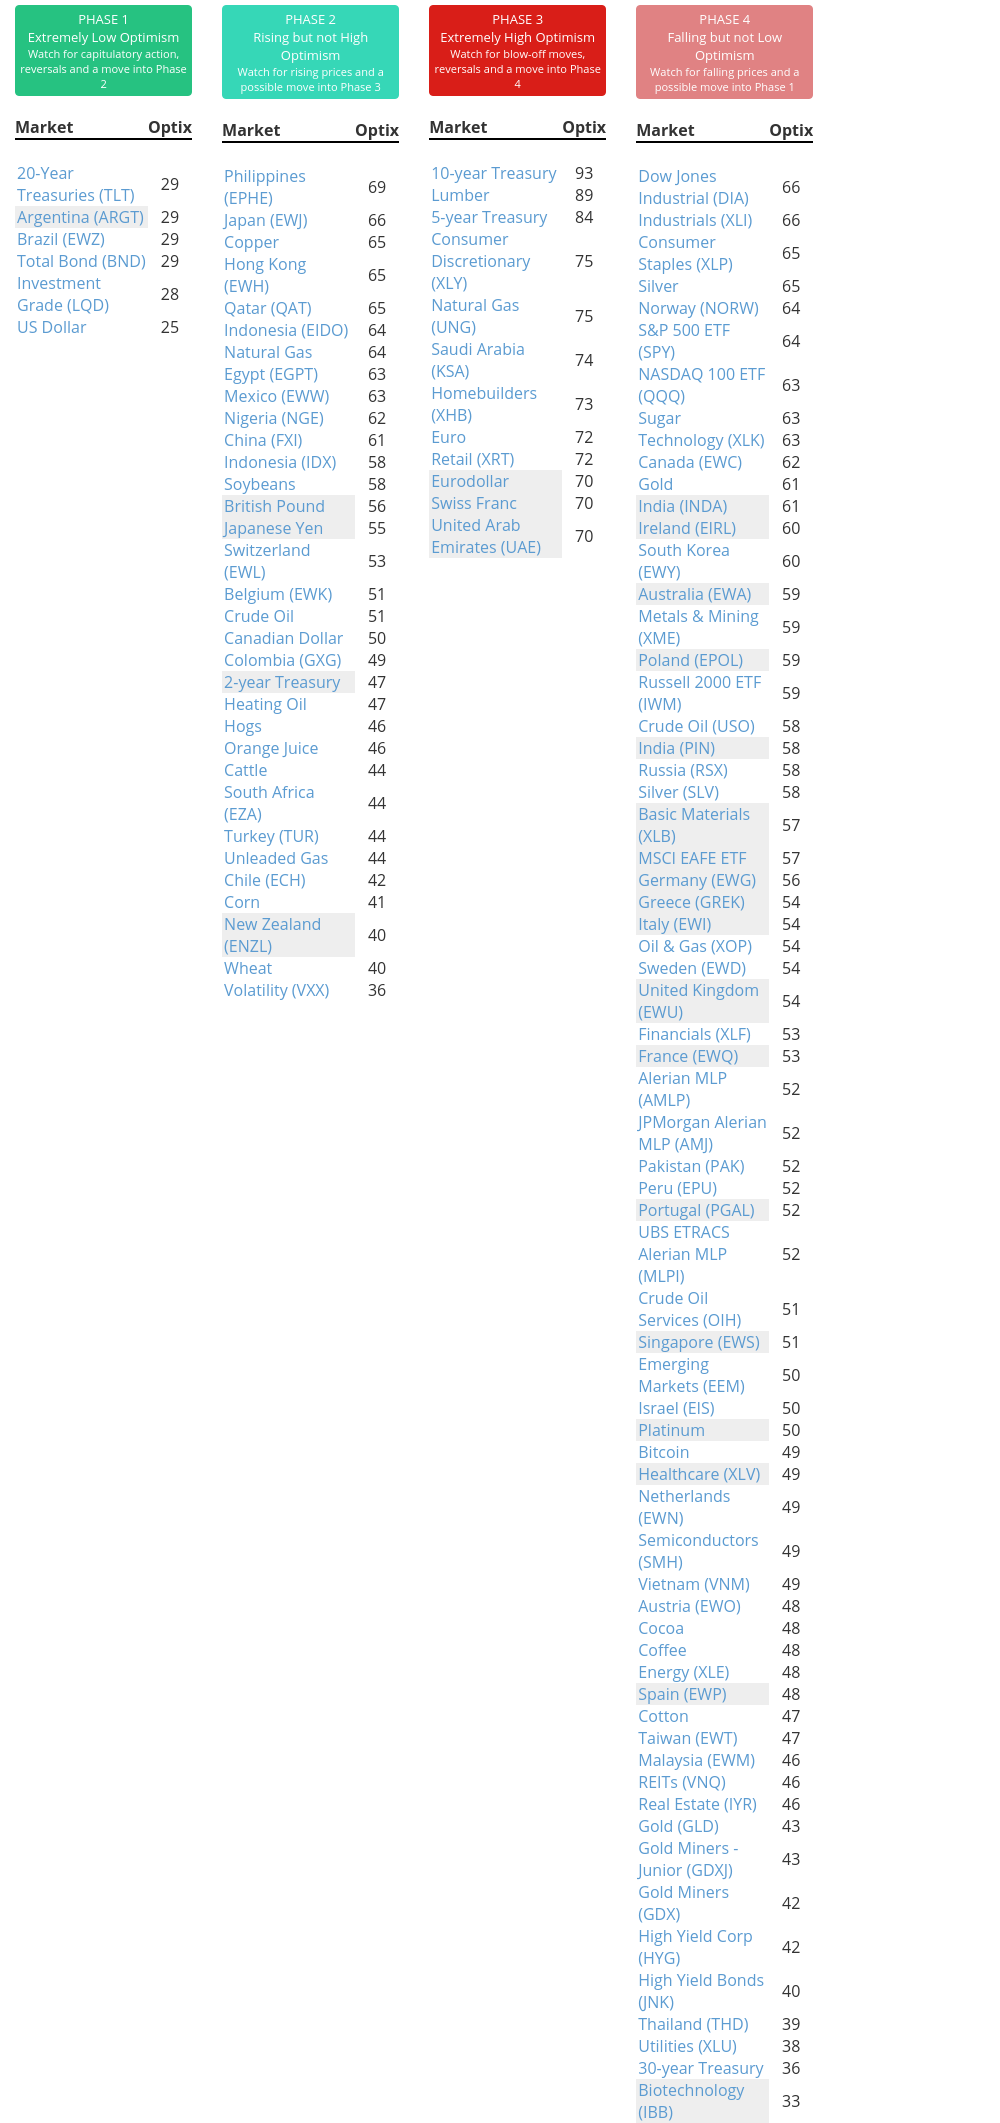
Phase Table
Ranks
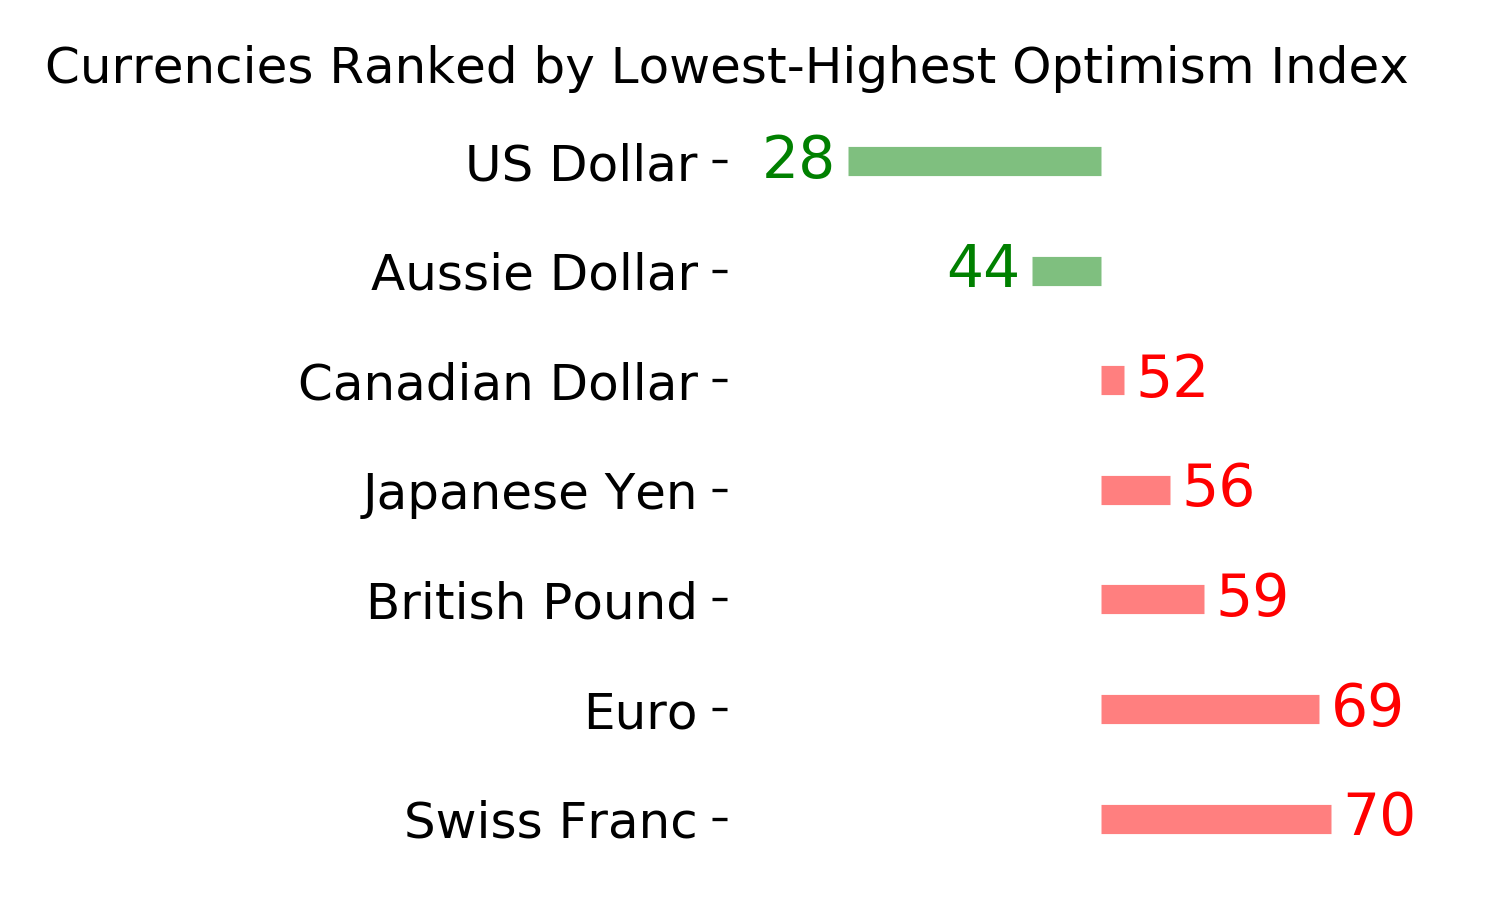
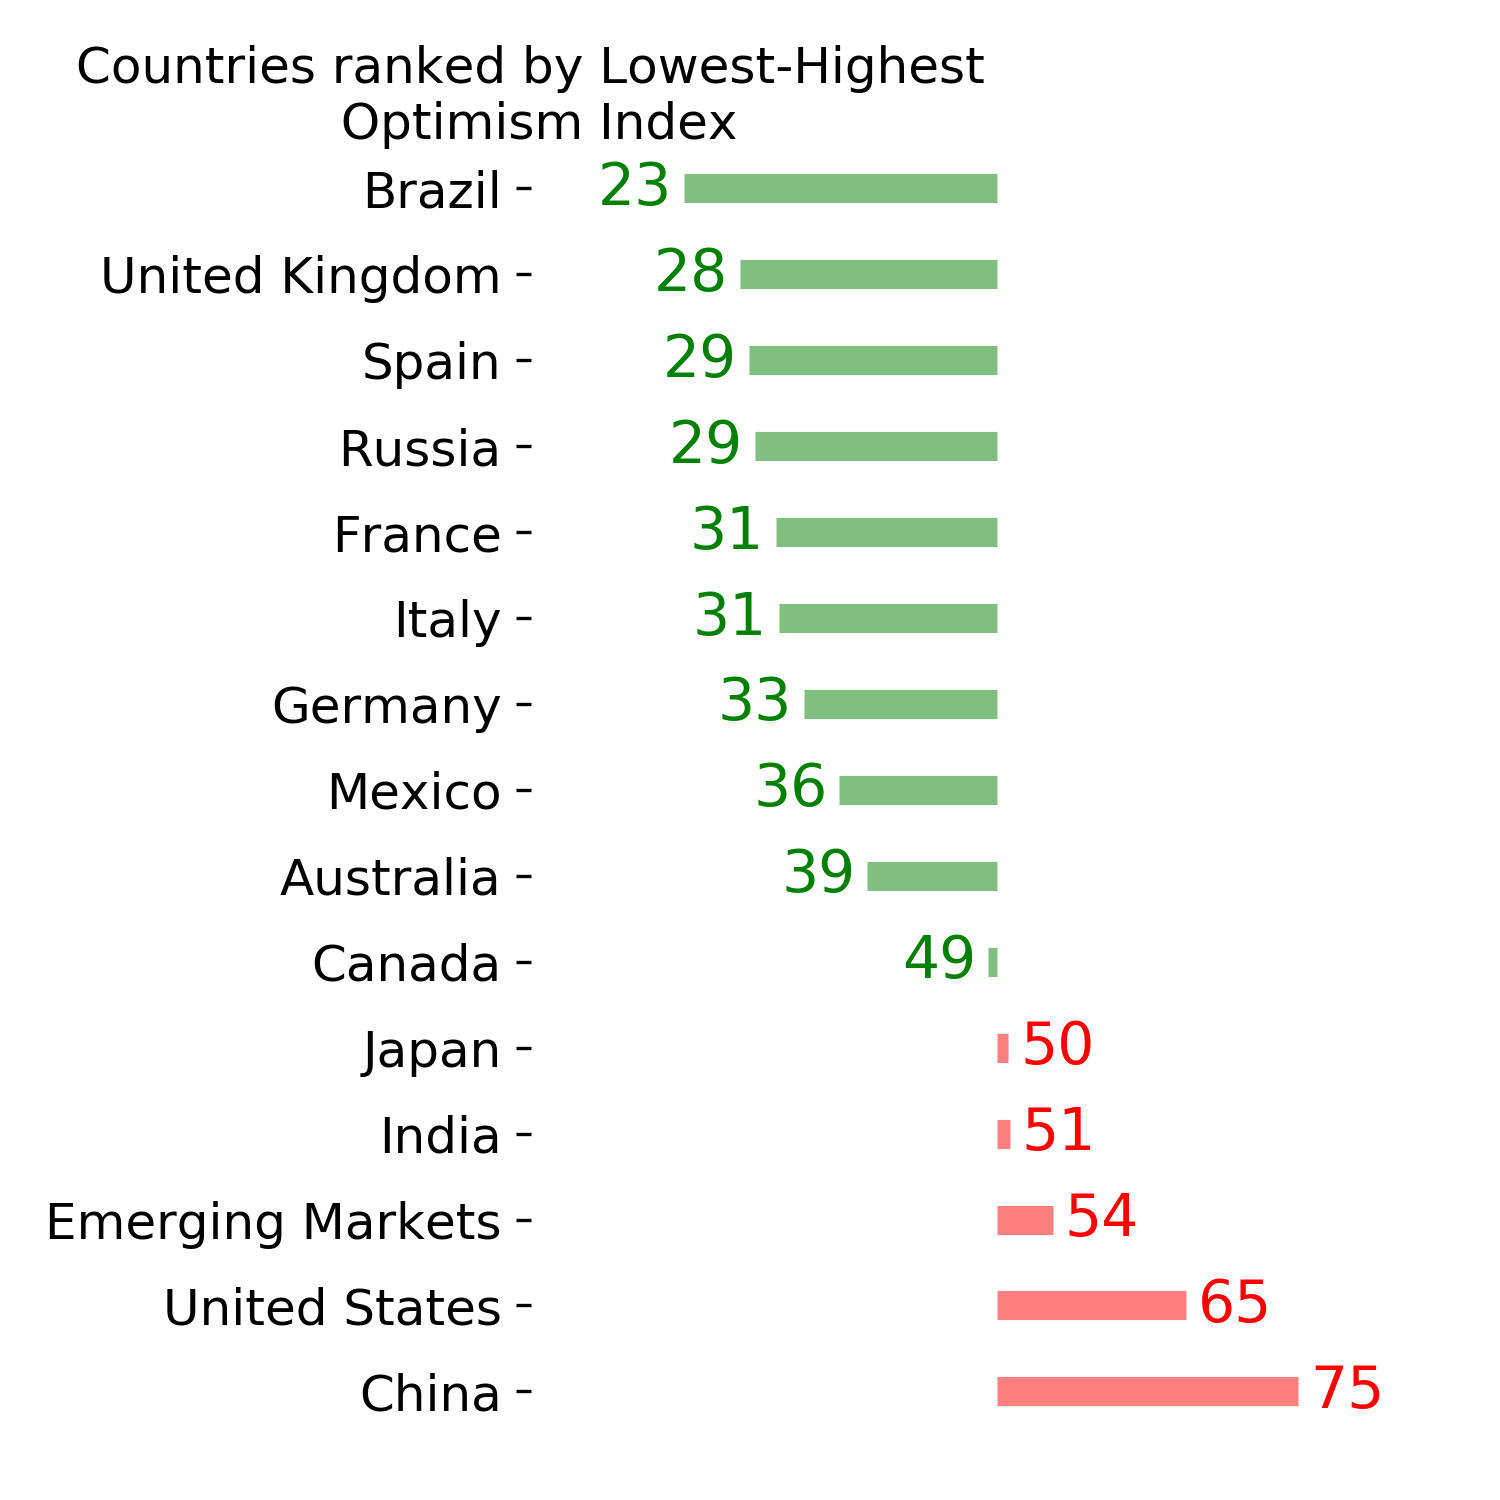
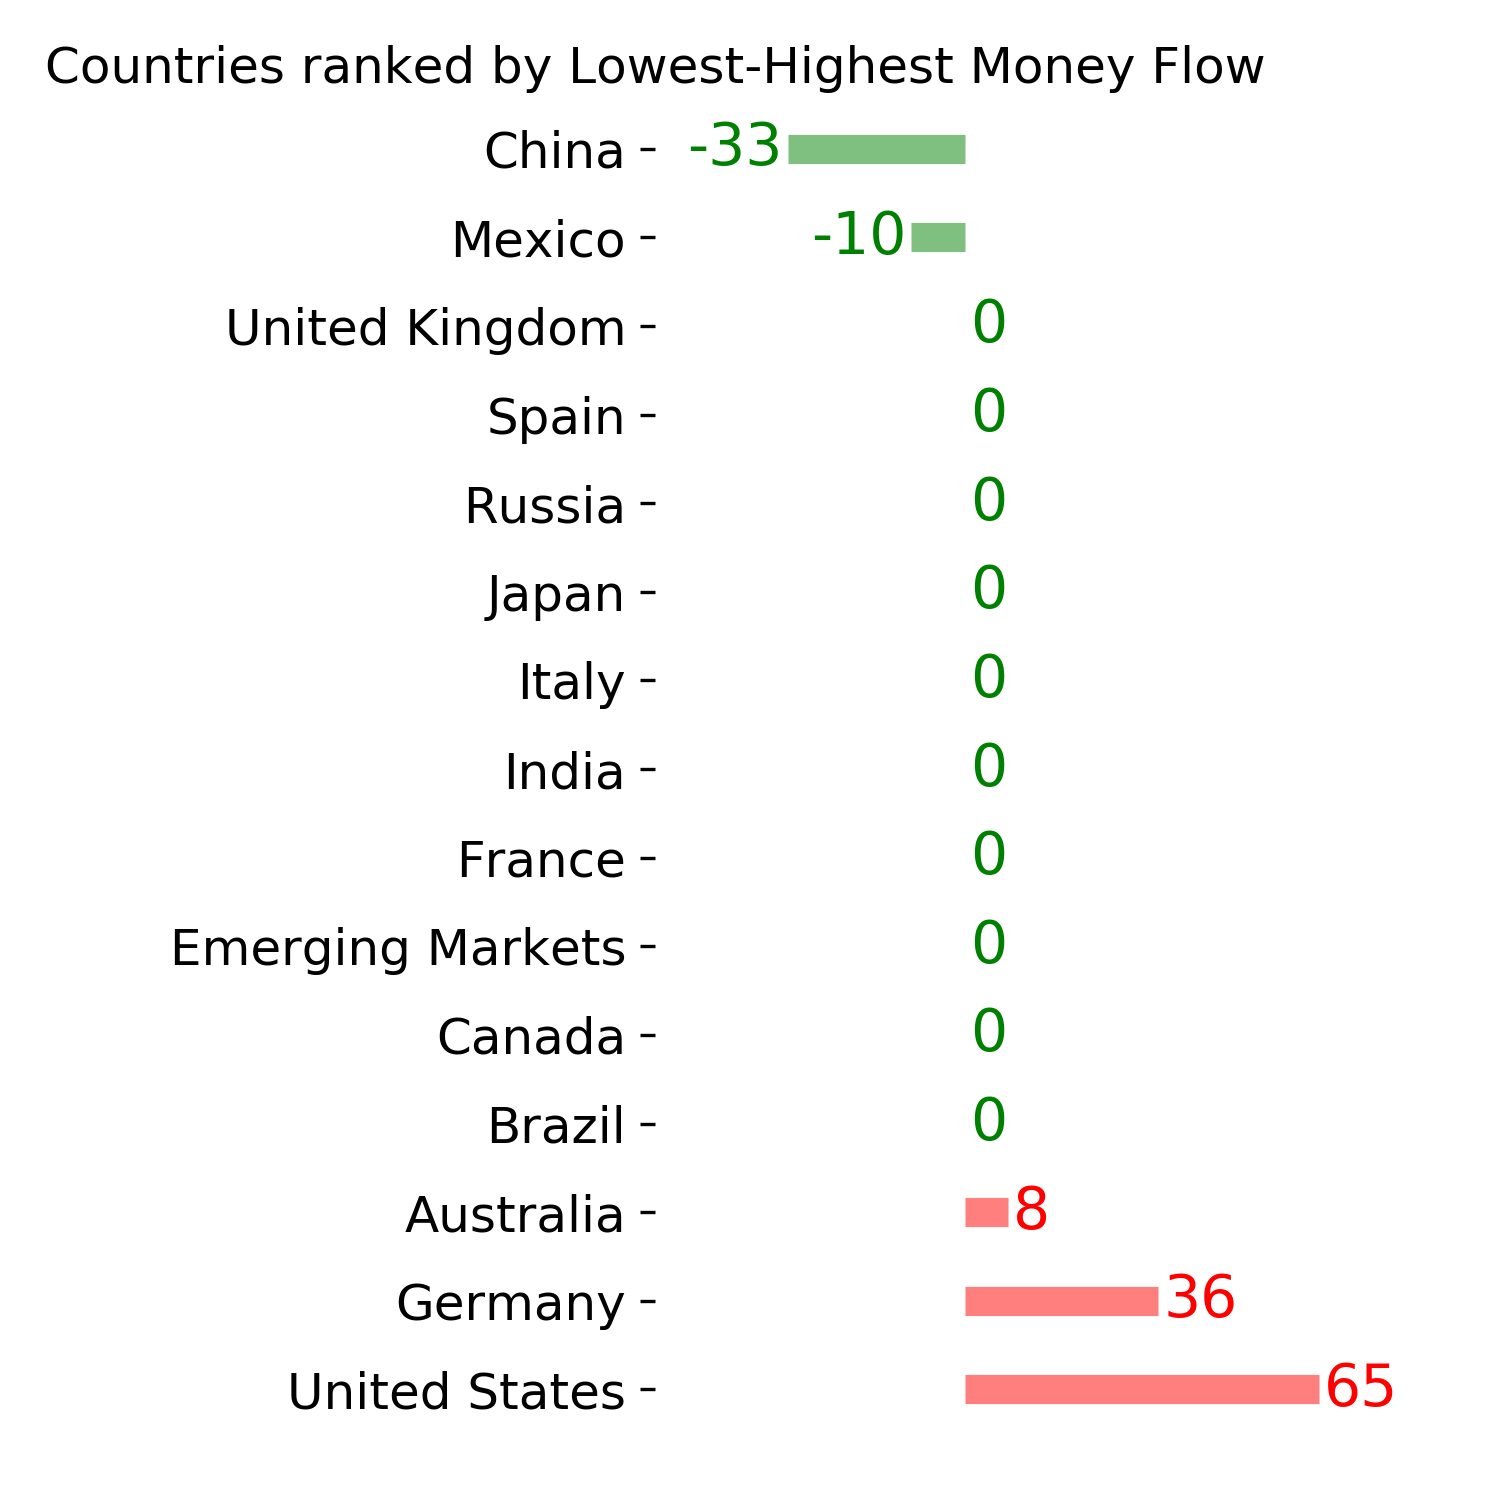
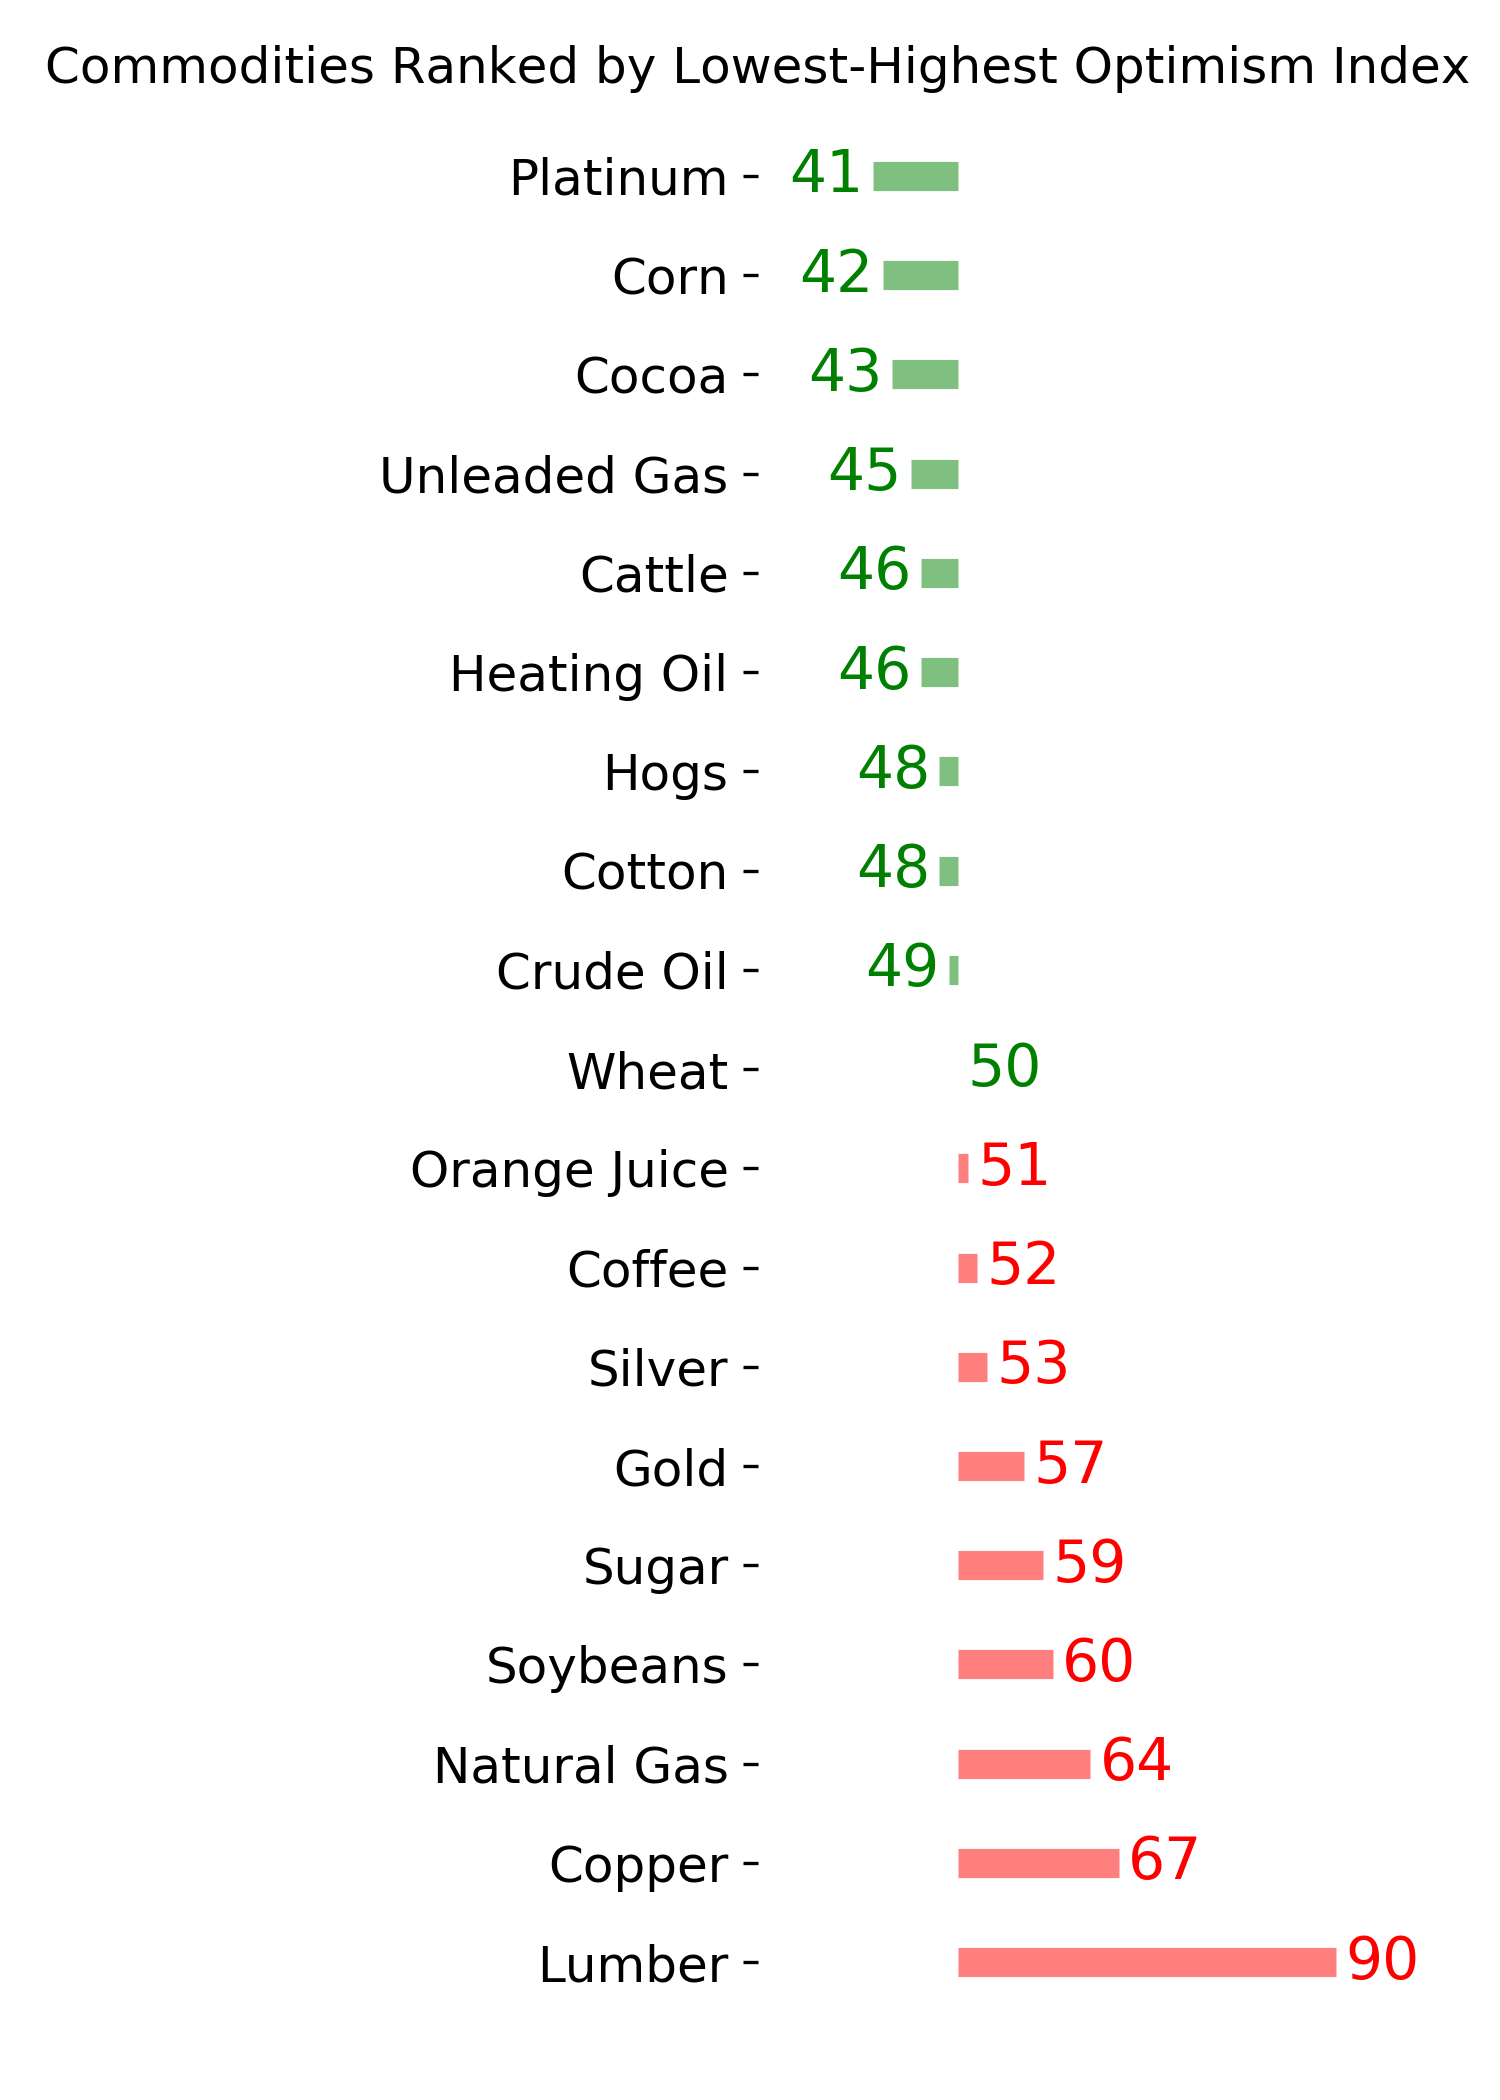
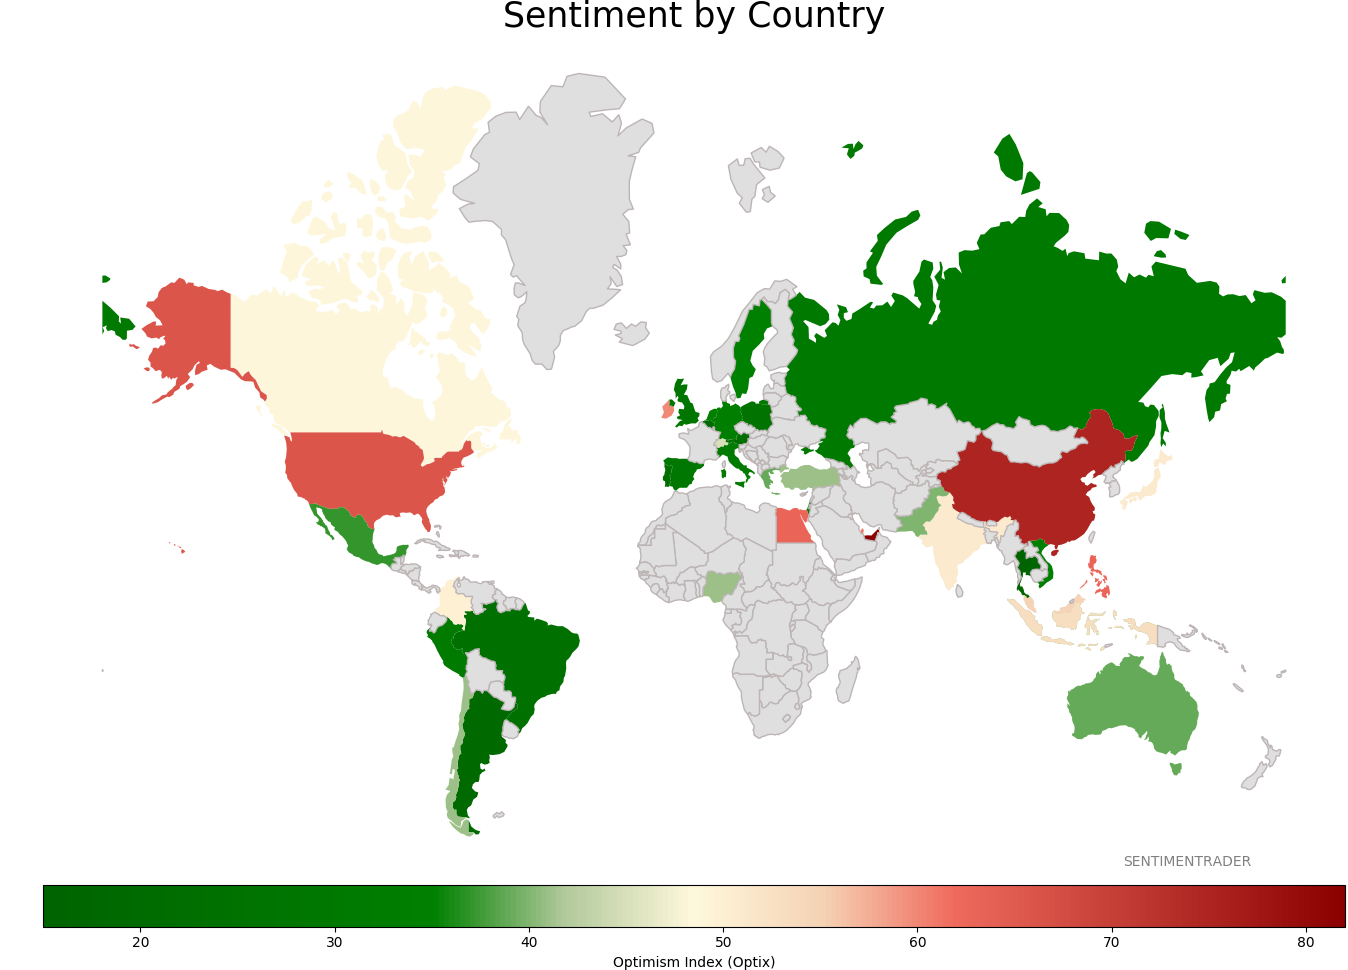
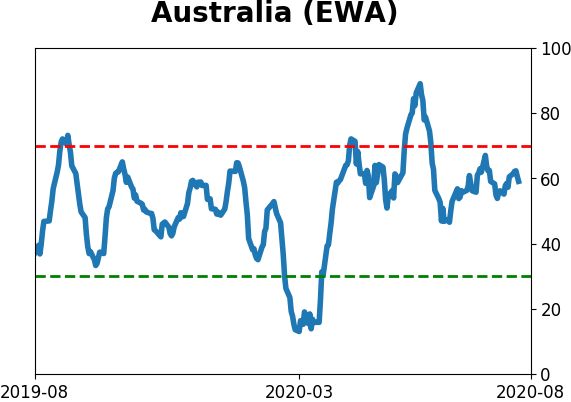
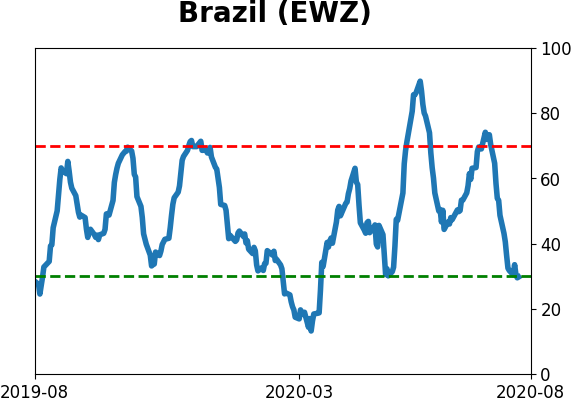
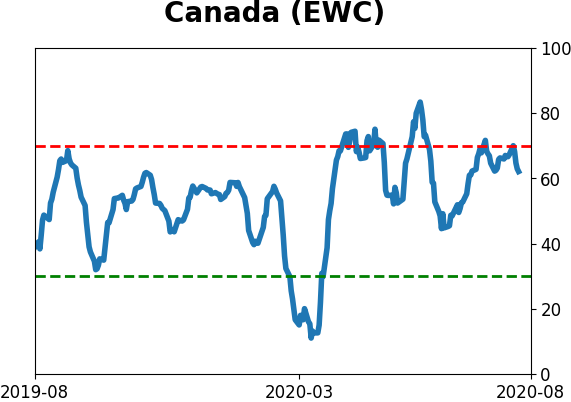
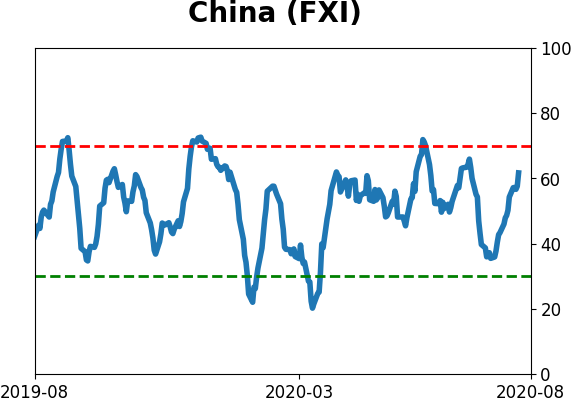
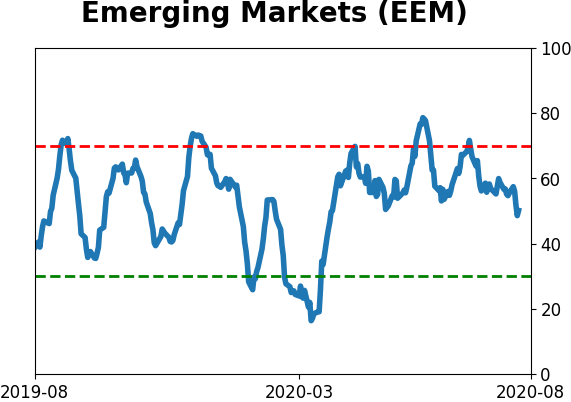
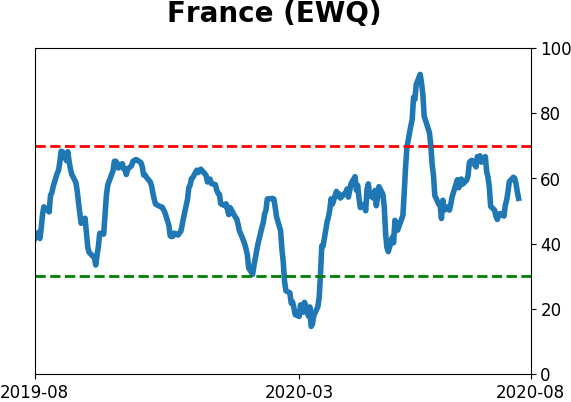
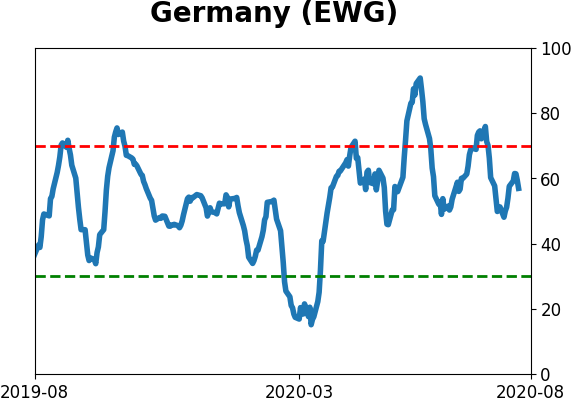
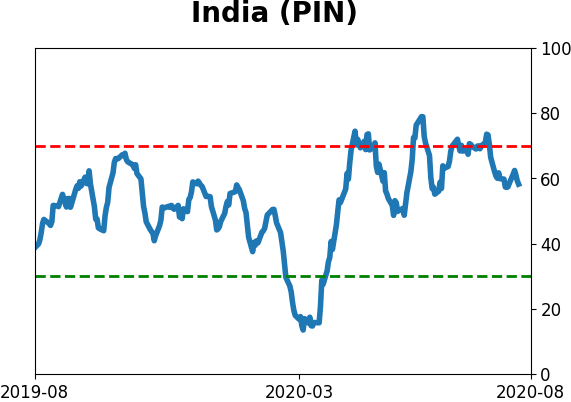
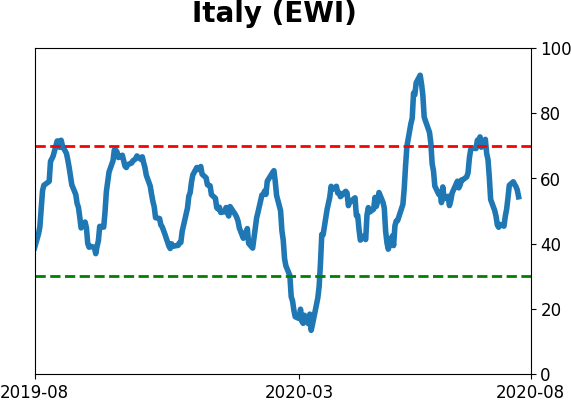
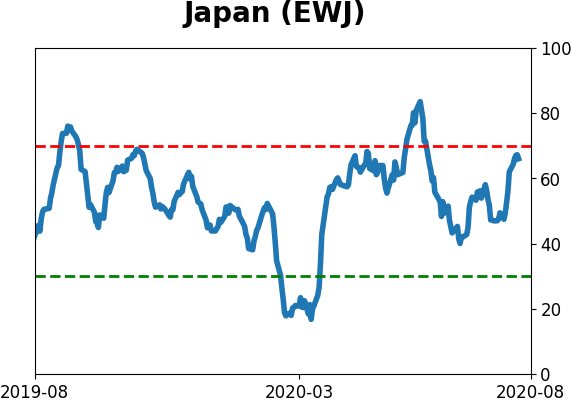
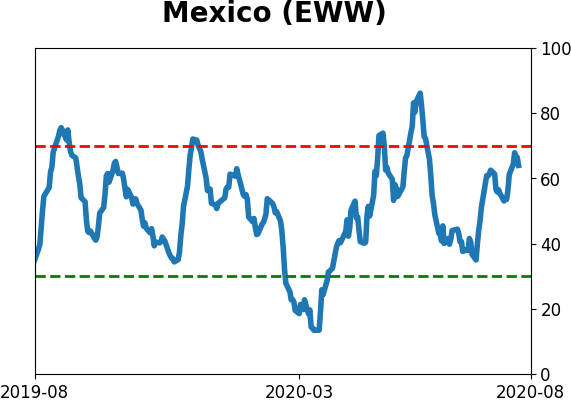
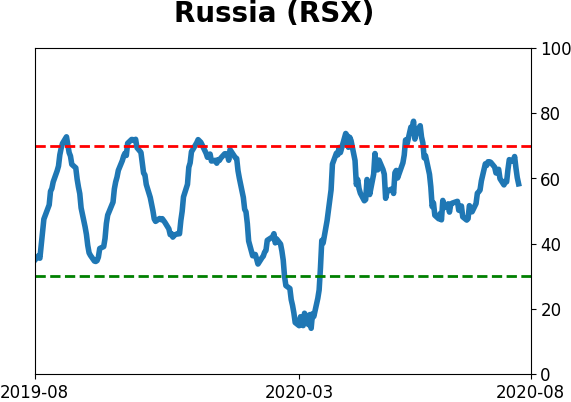
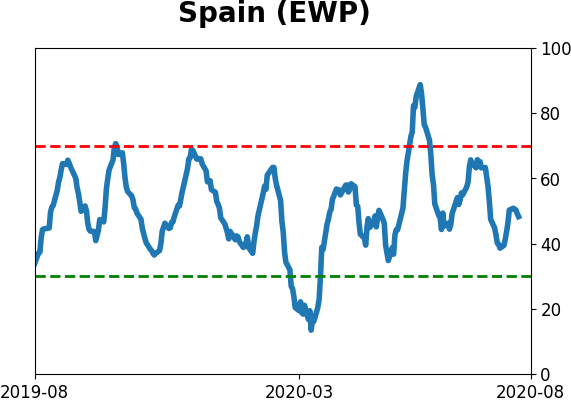
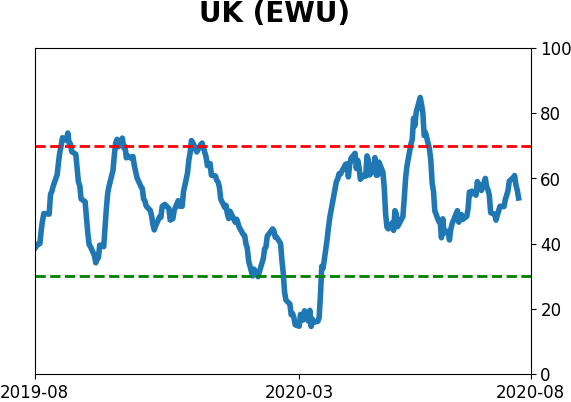
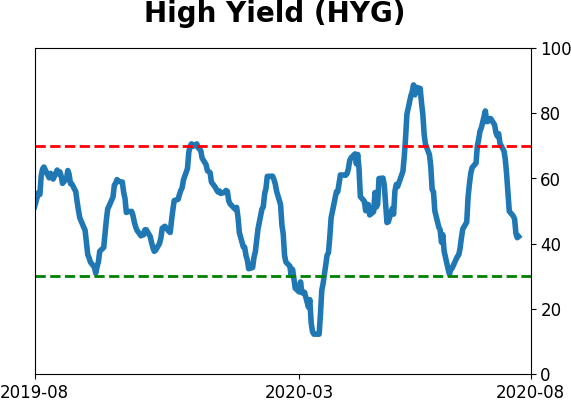
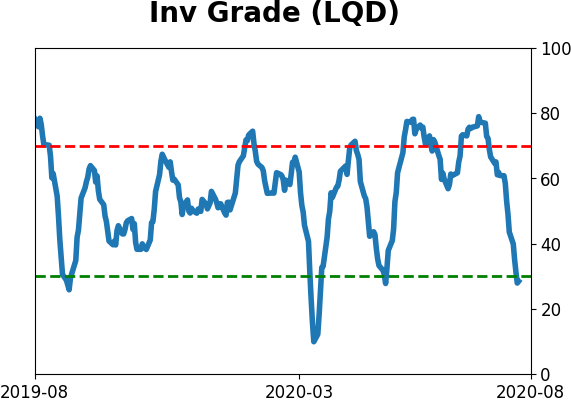
Sentiment Around The World
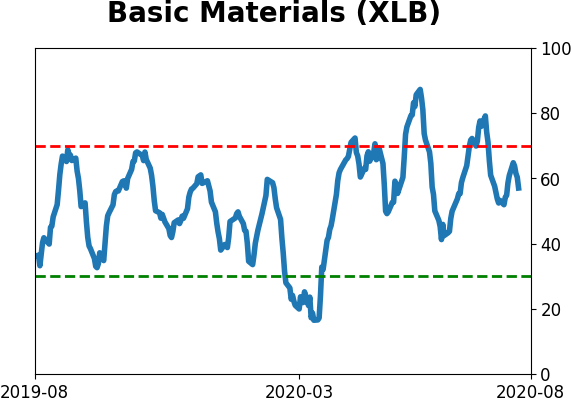
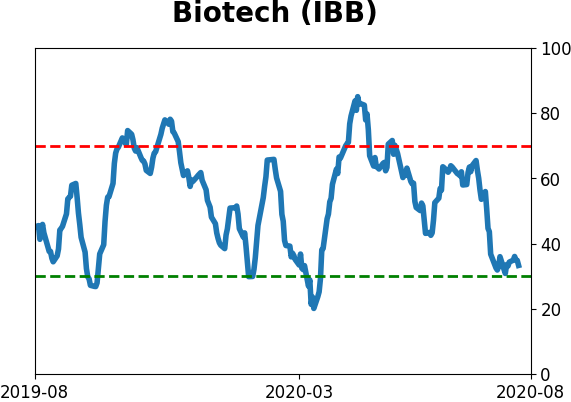
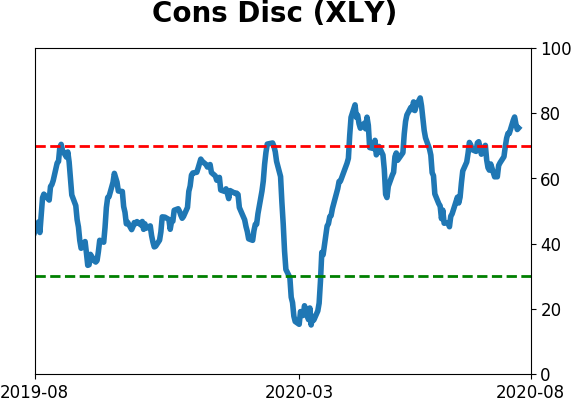
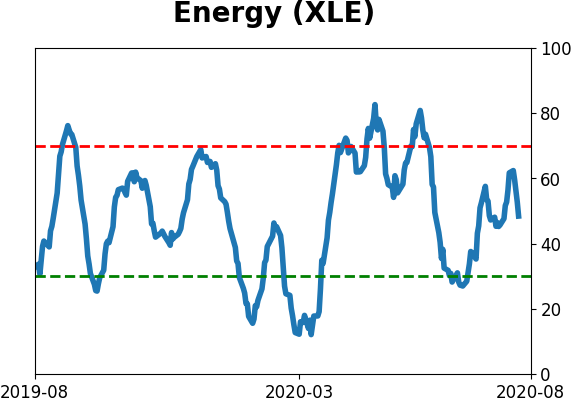
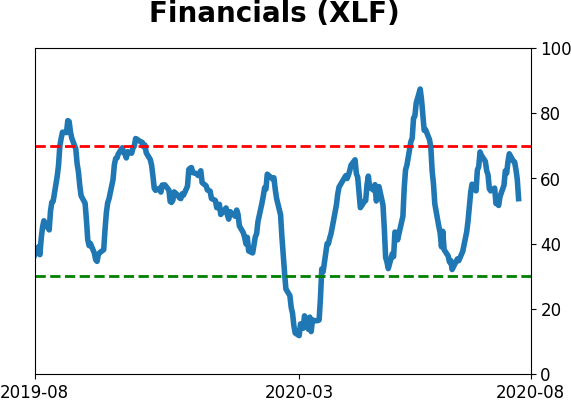
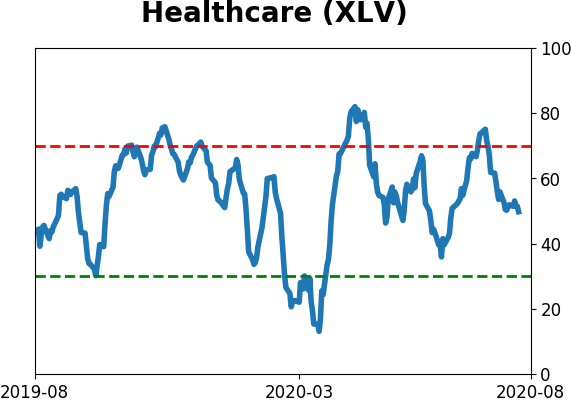
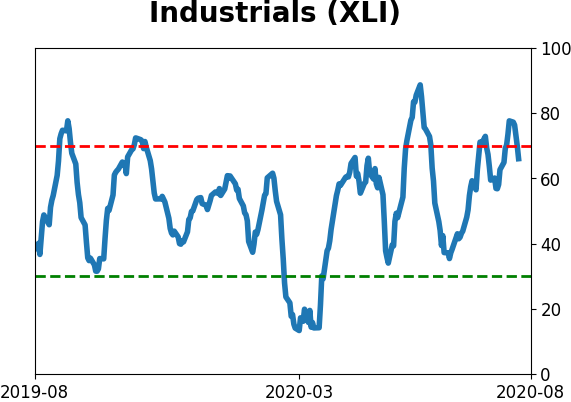
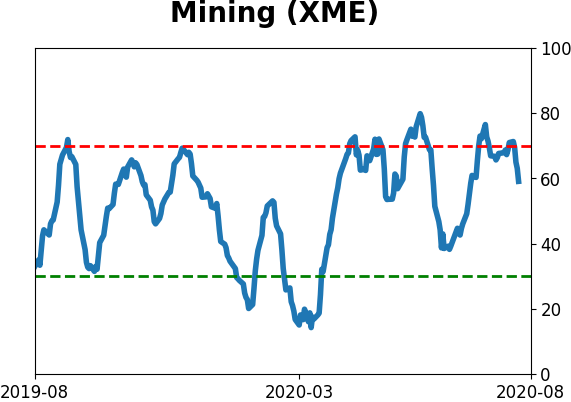
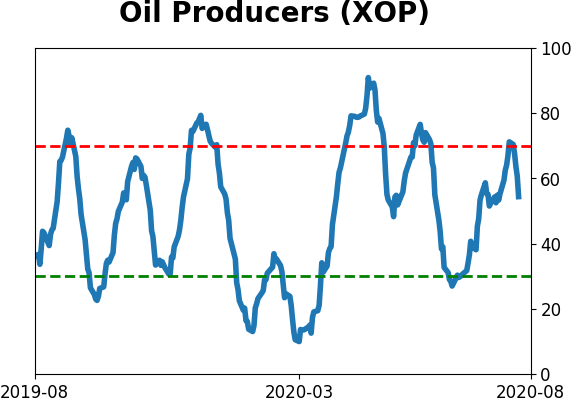
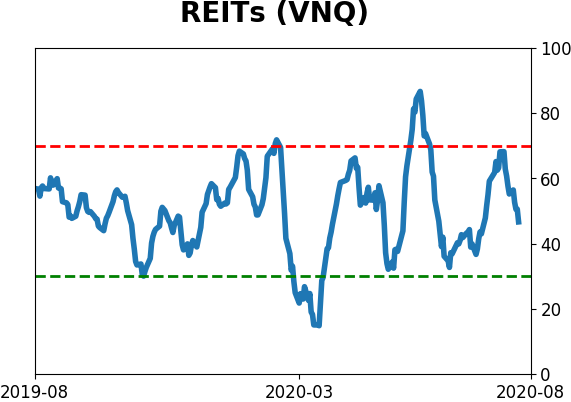
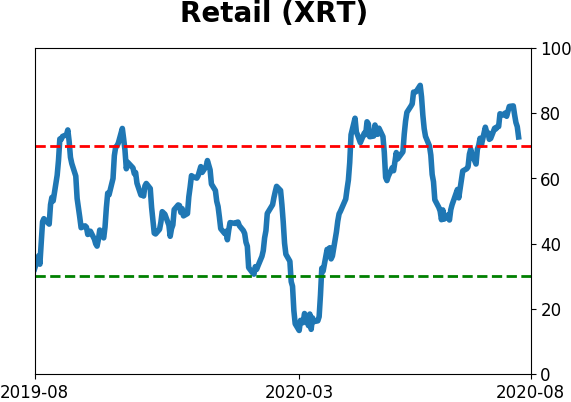
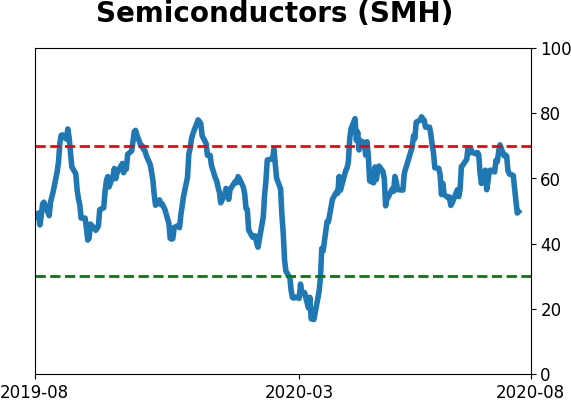
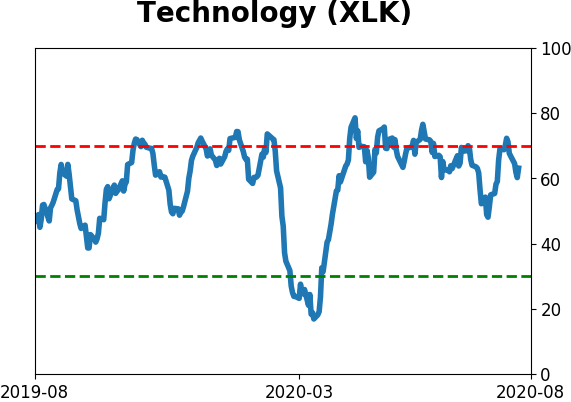
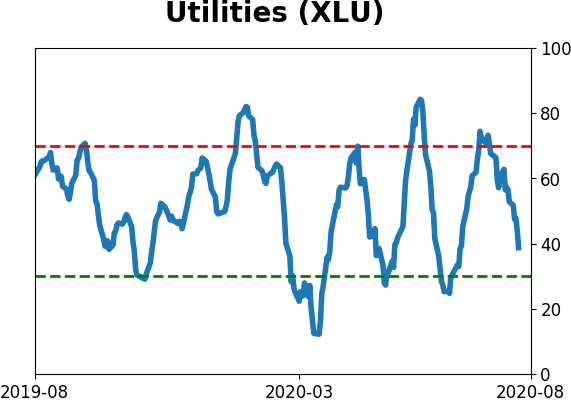
Optimism Index Thumbnails
| Sector ETF's - 10-Day Moving Average |
|
| Country ETF's - 10-Day Moving Average |
|
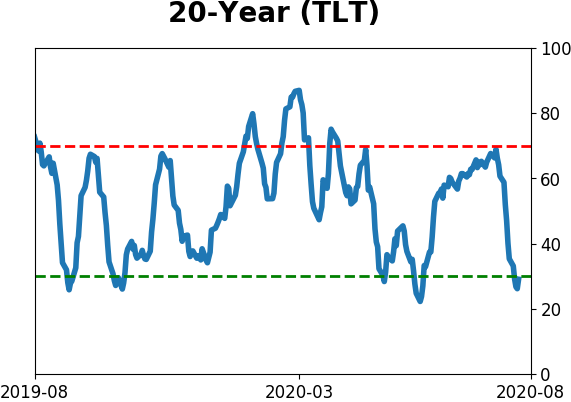
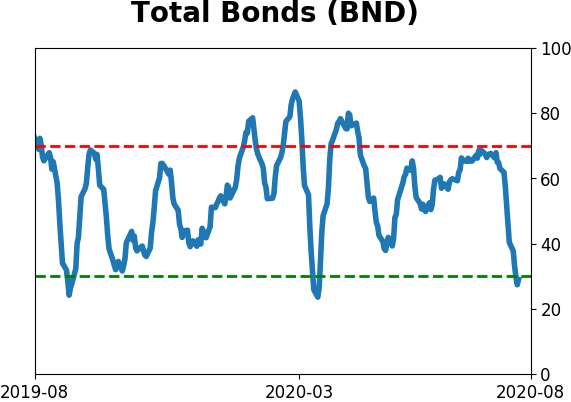
| Bond ETF's - 10-Day Moving Average |
|
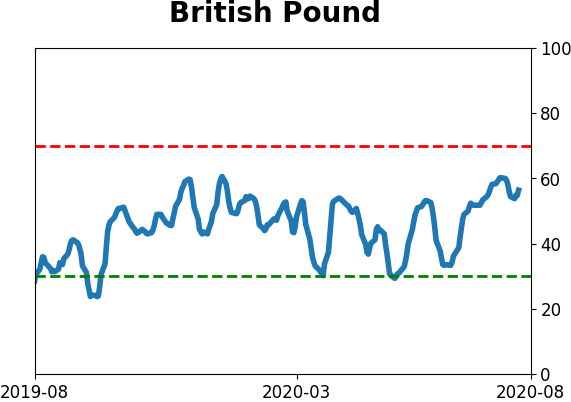
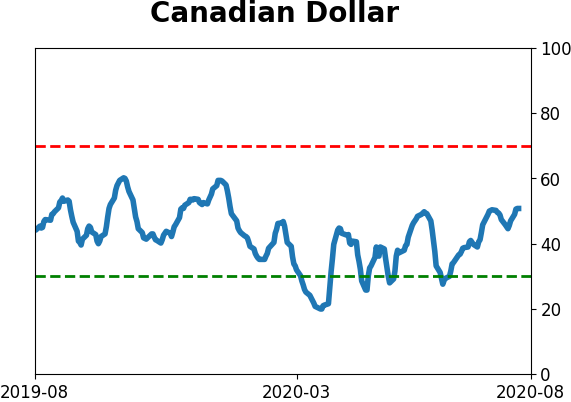
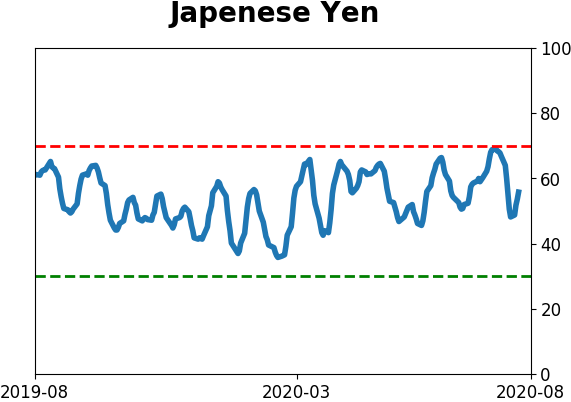
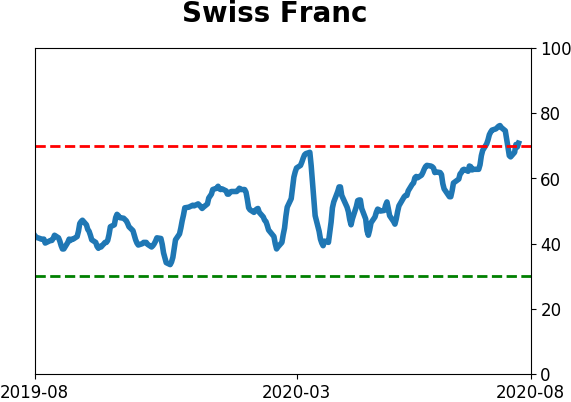
| Currency ETF's - 5-Day Moving Average |
|
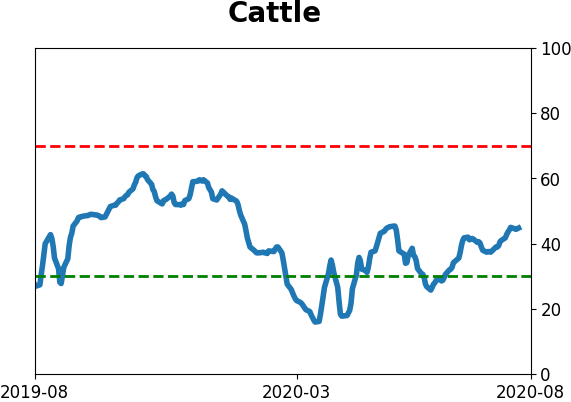
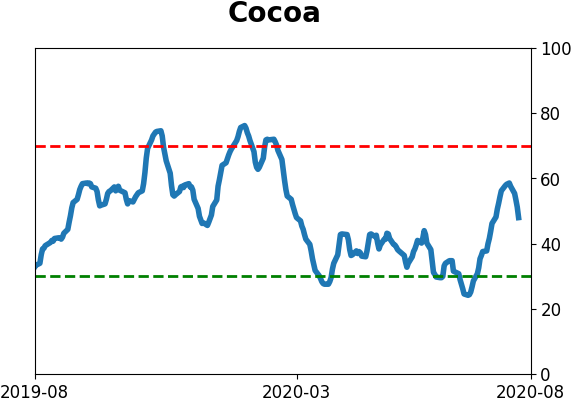
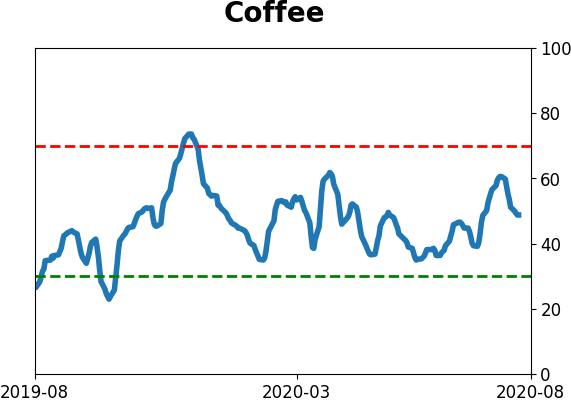
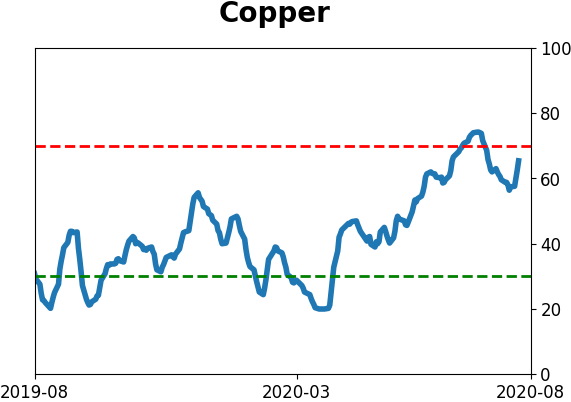
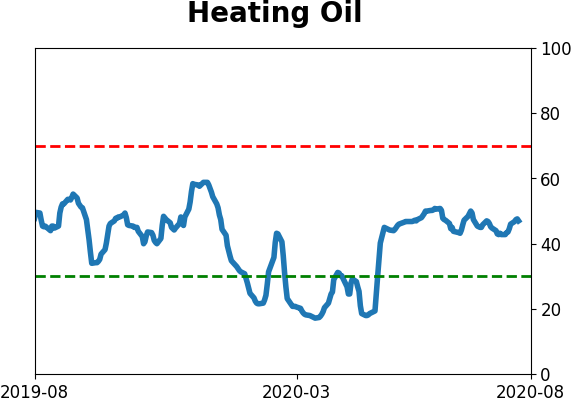
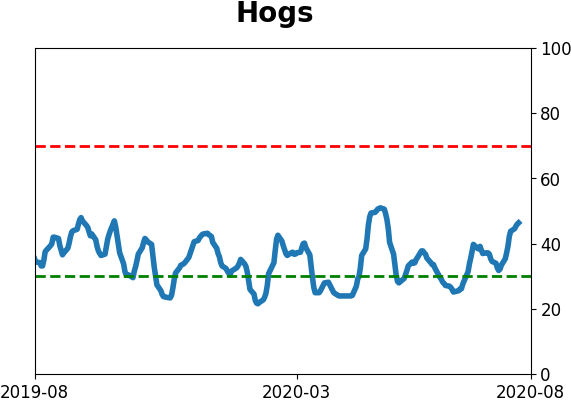
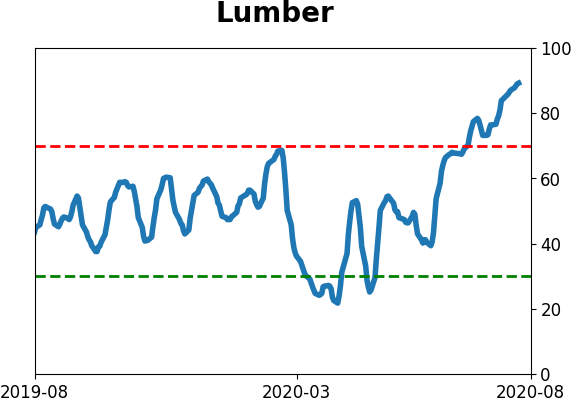
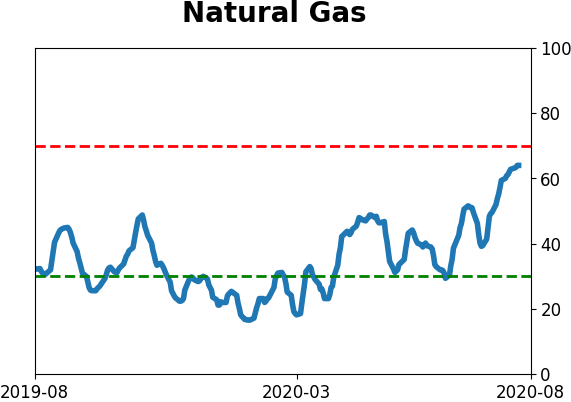
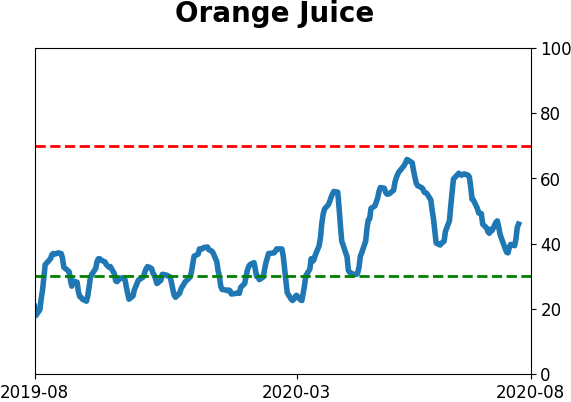
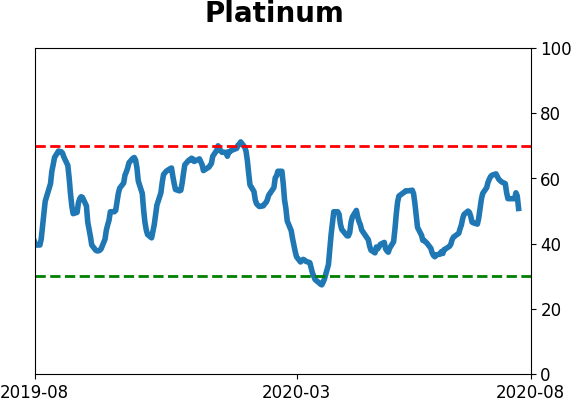
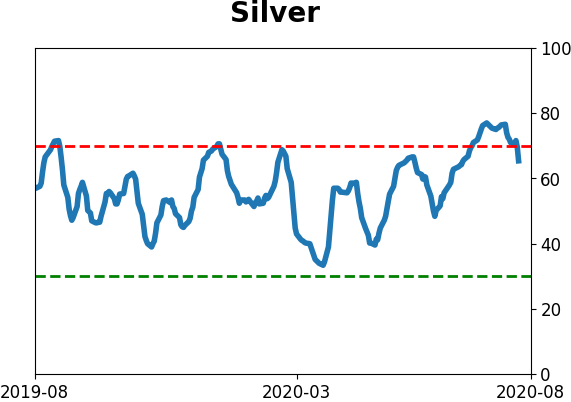
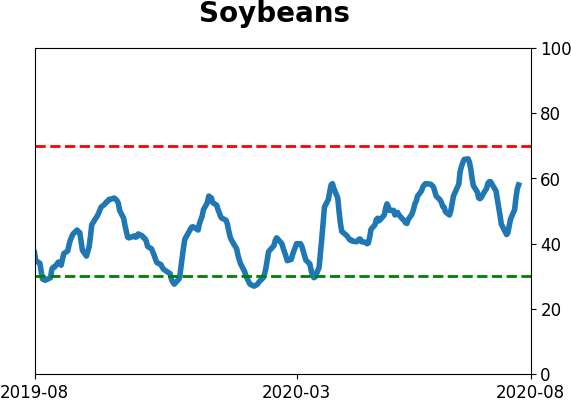
| Commodity ETF's - 5-Day Moving Average |
|