Headlines
|
|
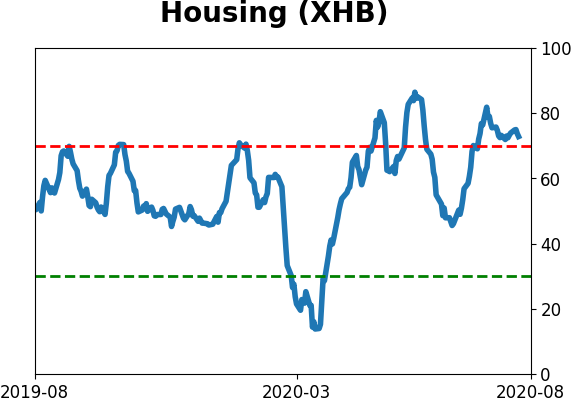
Homebuilders have never been more optimistic despite high costs:
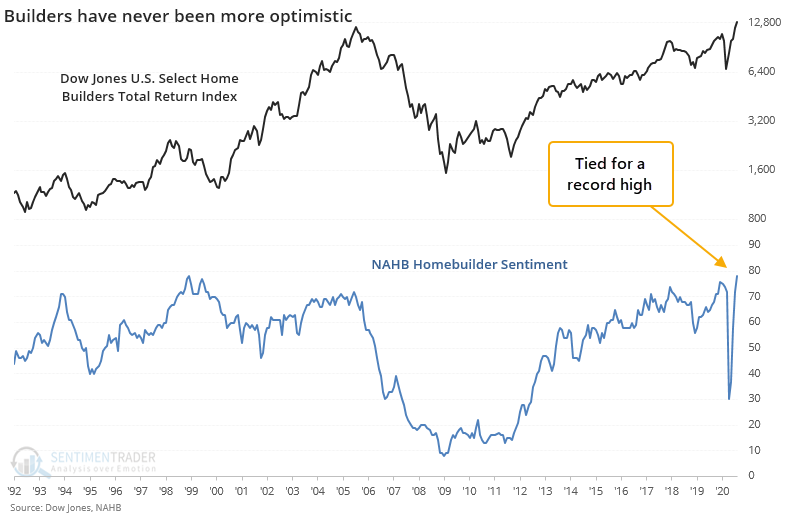
Homebuilding stocks recovered quickly from the pandemic panic, and sentiment has followed. A survey of homebuilders just recorded its most optimistic reading ever, which has precede trouble for their stock prices. This comes as optimism on one of their major inputs is nearing record highs as well.
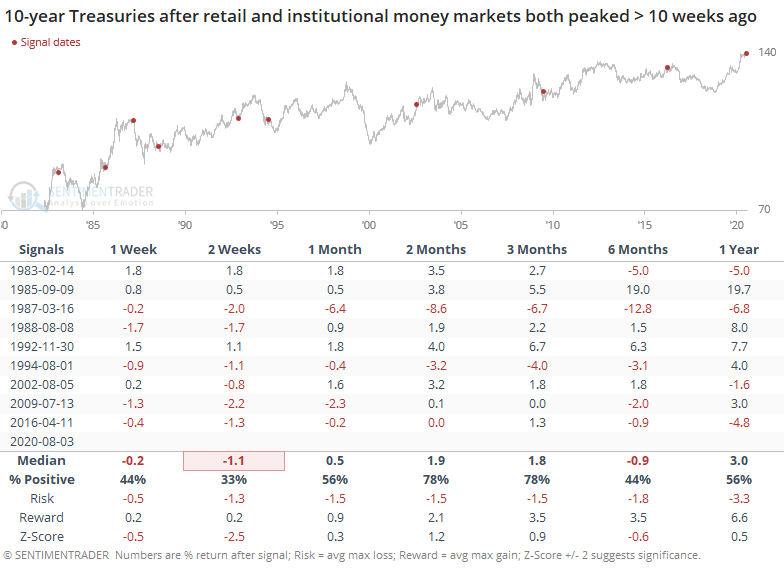
10 straight weeks of money market leakage:
Retail and institutional investors alike have been pulling assets from money market funds. It has now been 10 weeks since either group of traders have set a new high in money market assets. This has been a good sign for stocks, not so much for the dollar or bonds.
Stocks down, indexes up: It was another of those frustrating days for many investors, when indexes jump but most stocks decline. For the Nasdaq Composite, this was the 4th time in 15 days when it rose 0.7% or more, yet breadth was negative (either number of issues or volume). For a day the Nasdaq closed at a new high, it was the 3rd time in 15 days, the most since 2007. Because of the negative momentum in breadth, the McClellan Oscillator for the Nasdaq will close below -25, the 6th-worst reading ever for a day the index closed at a 52-week high. The other days were 2000-02-04, 2000-02-10, 2012-03-01, 2017-11-08, and 2020-07-09. Weird market.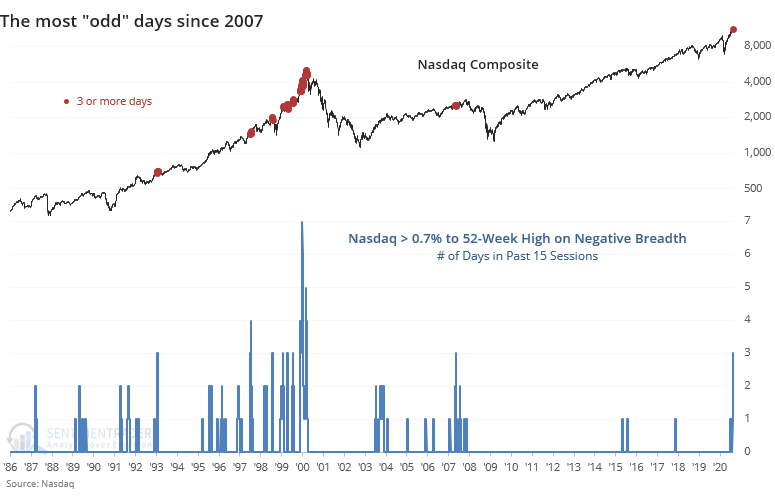
Bottom Line:
|
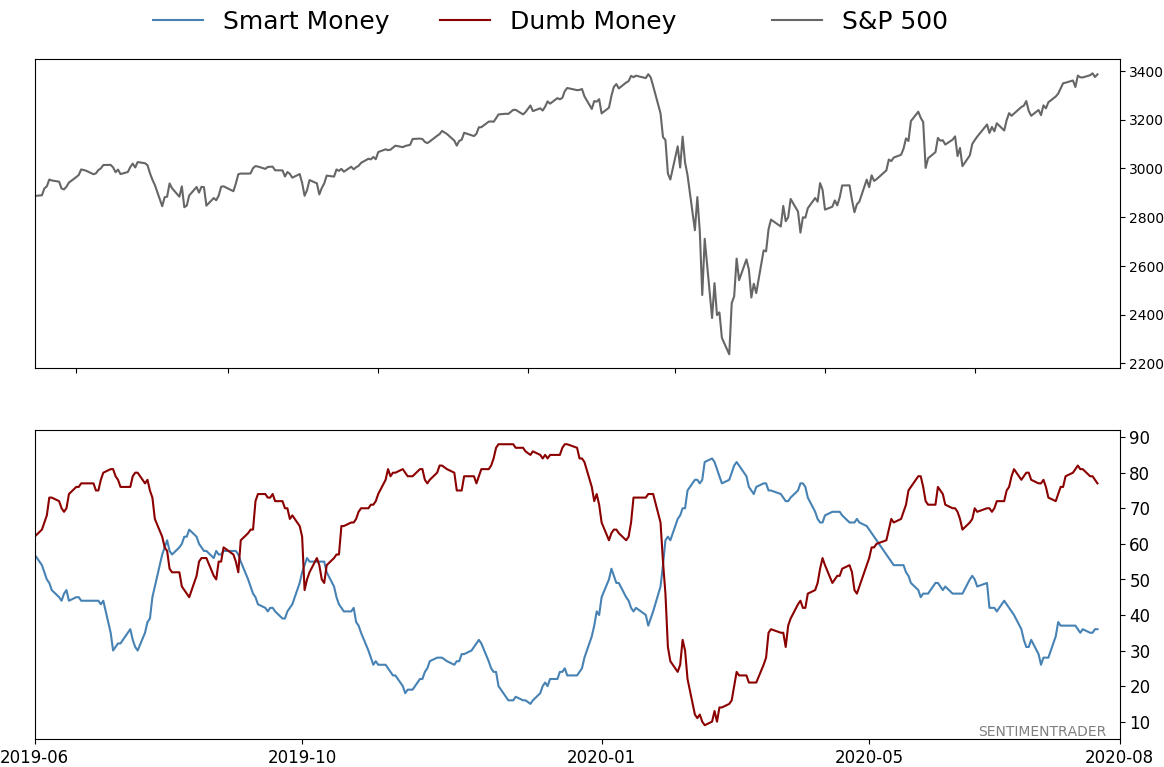
Smart / Dumb Money Confidence
|
Smart Money Confidence: 36%
Dumb Money Confidence: 77%
|
|
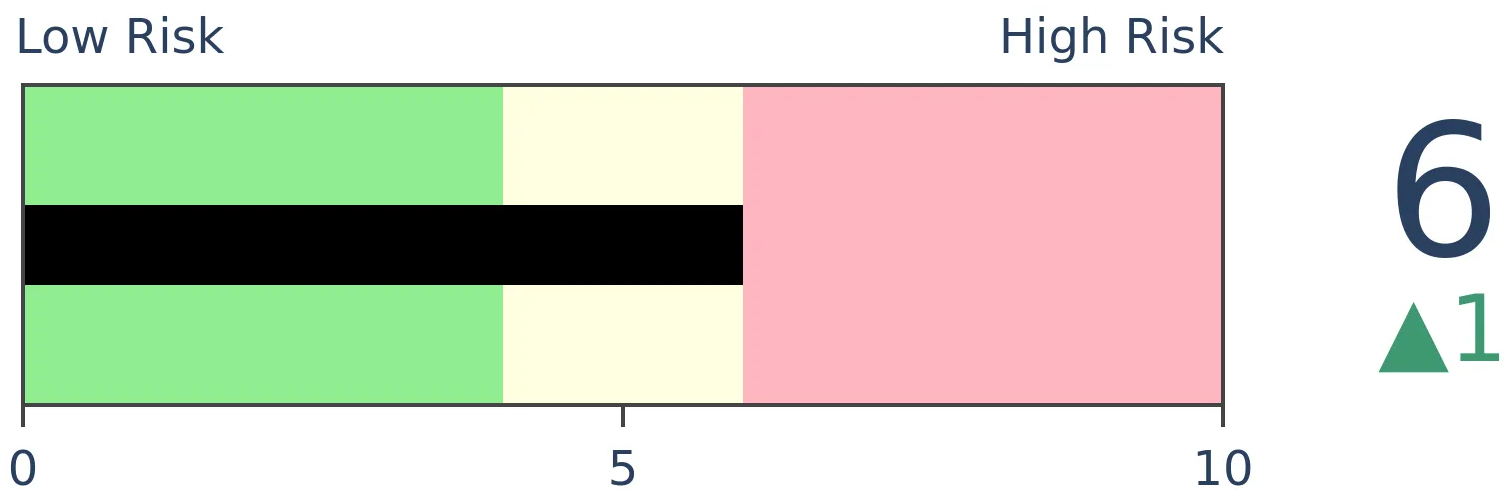
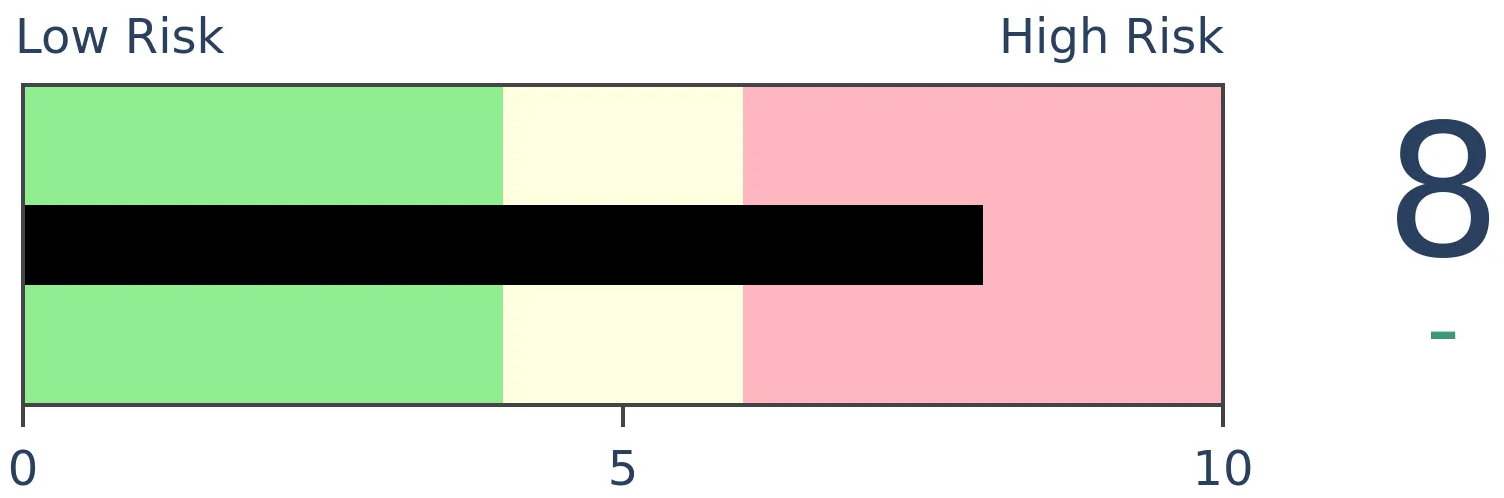
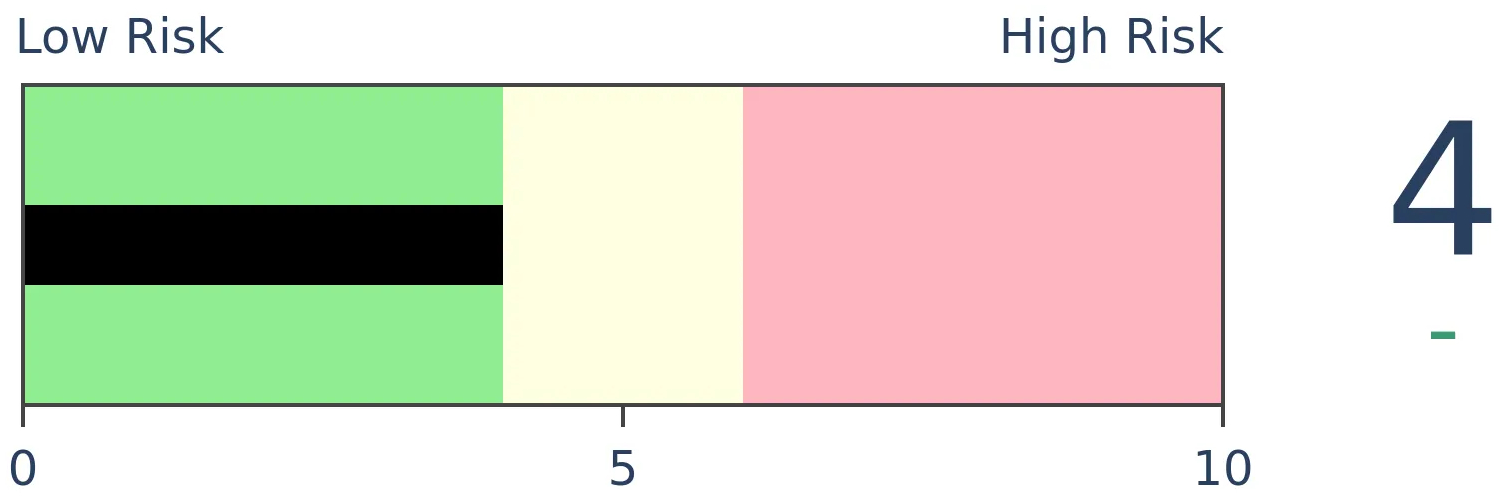
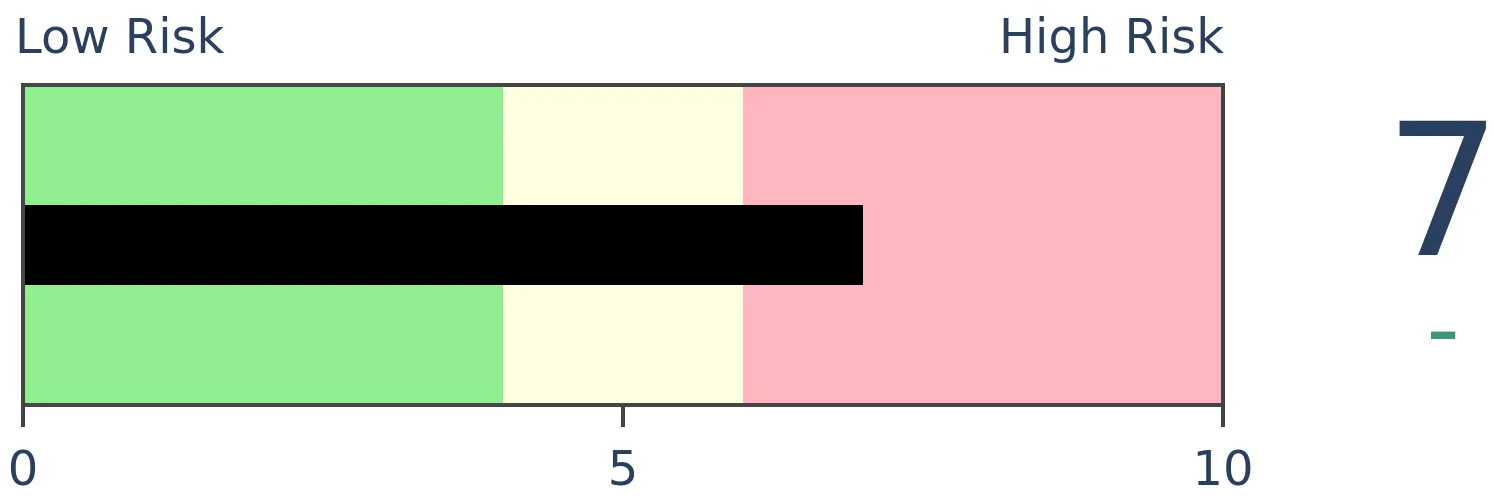
Risk Levels
Stocks Short-Term
|
Stocks Medium-Term
|
|
Bonds
|
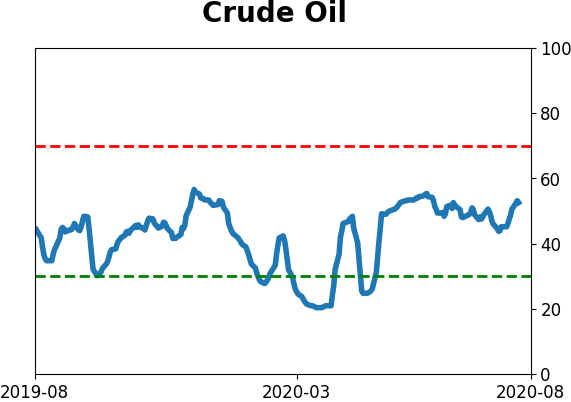
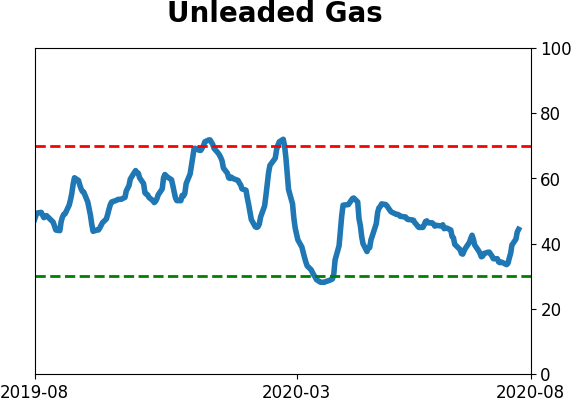
Crude Oil
|
|
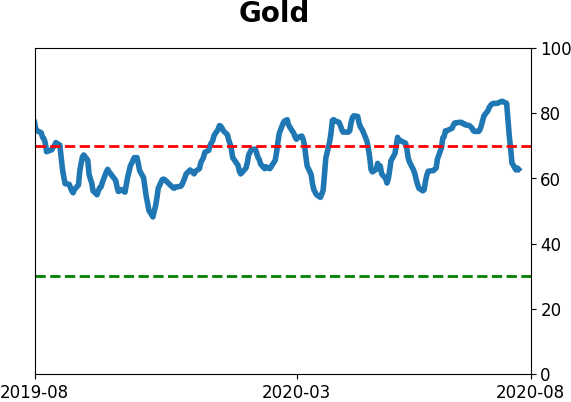
Gold

|
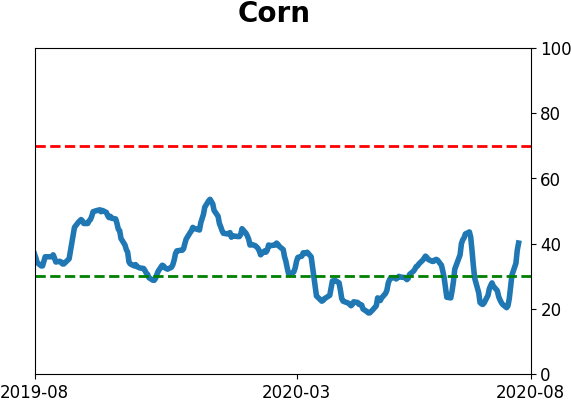
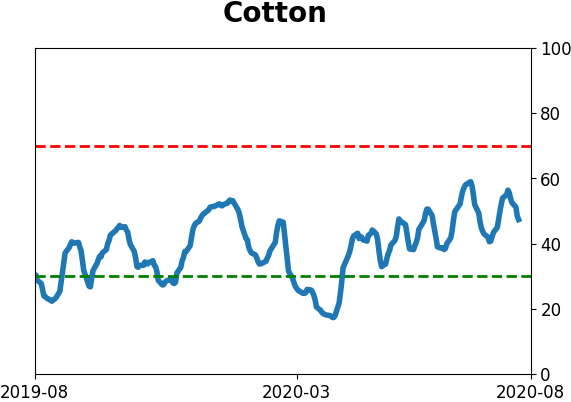
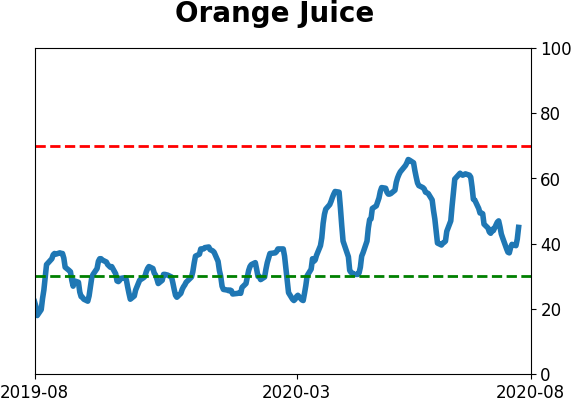
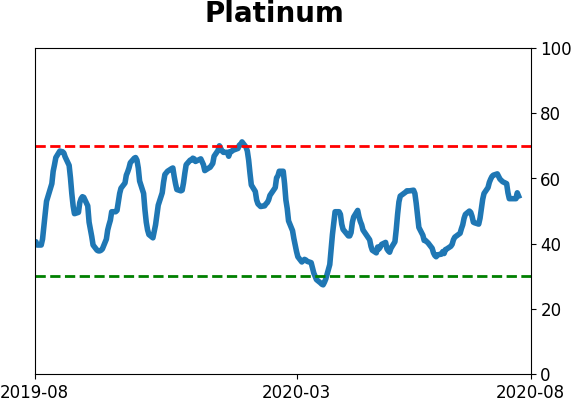
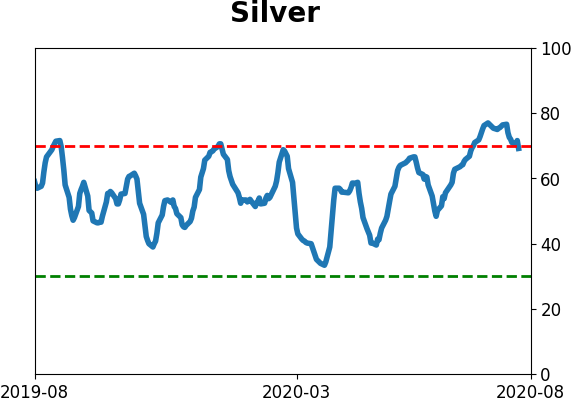
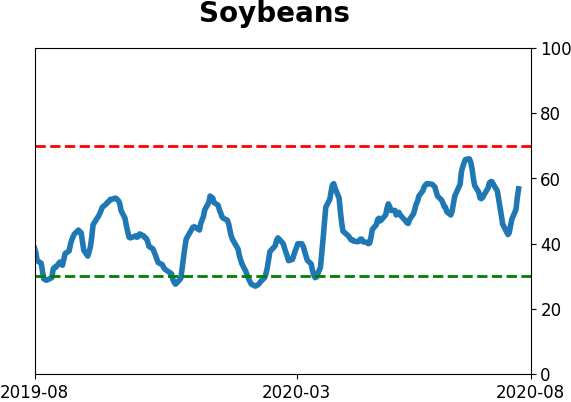
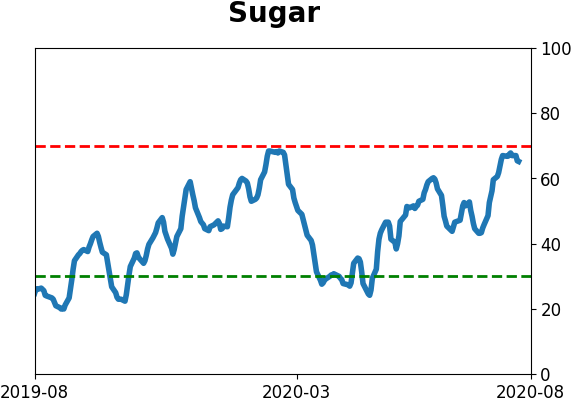
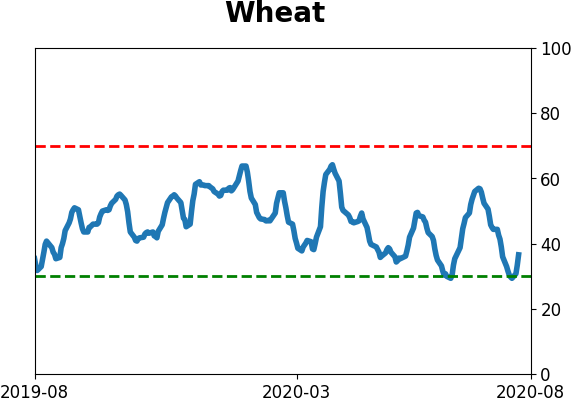
Agriculture
|
|
Research
BOTTOM LINE
Homebuilding stocks recovered quickly from the pandemic panic, and sentiment has followed. A survey of homebuilders just recorded its most optimistic reading ever, which has precede trouble for their stock prices. This comes as optimism on one of their major inputs is nearing record highs as well.
FORECAST / TIMEFRAME
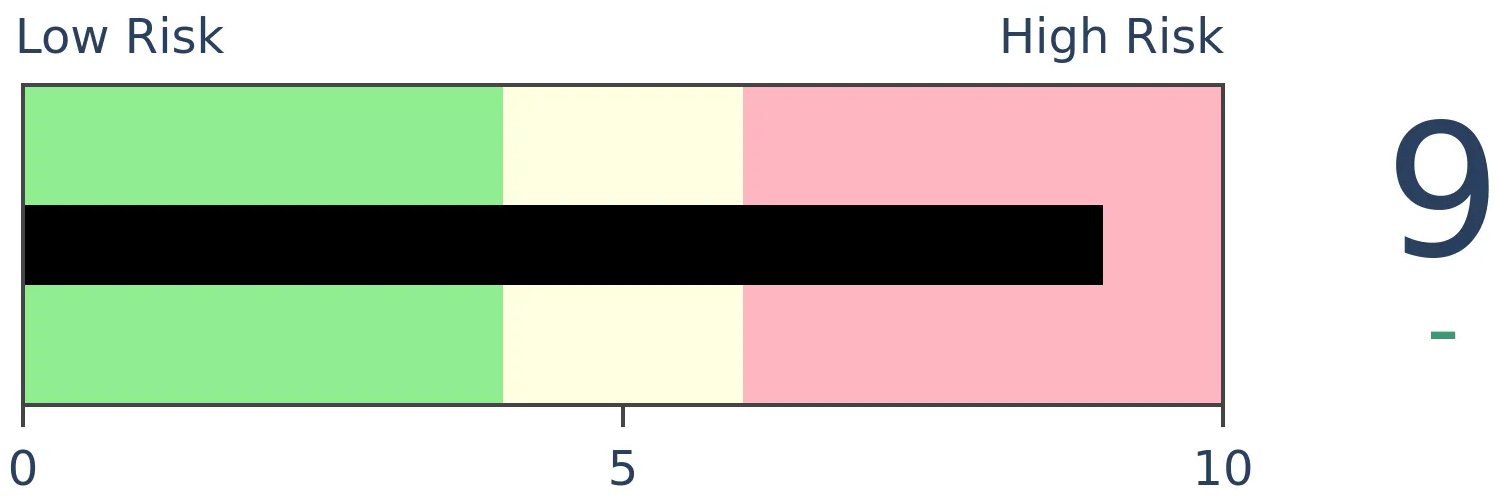
XHB -- Down, Long-Term
|
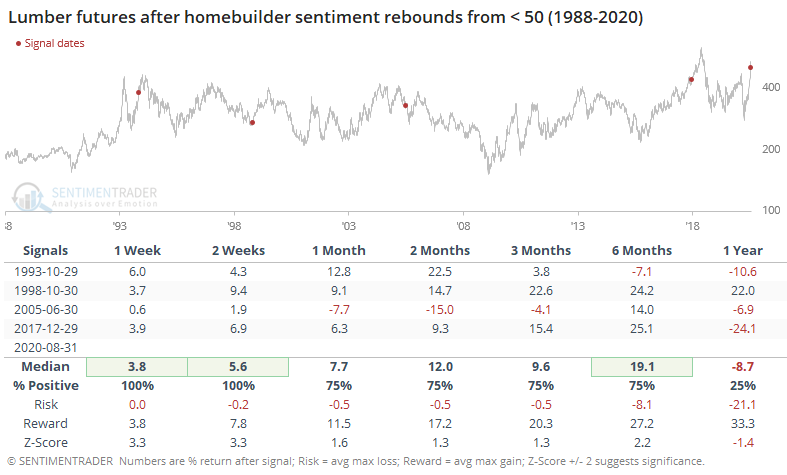
Thanks to a housing market that has held up surprisingly well despite the tumult of 2020, homebuilders have never been more optimistic. A monthly survey by the National Association of Home Builders shows that builders enjoyed the tailwind of low mortgage rates.
"Derived from a monthly survey that NAHB has been conducting for 35 years, the NAHB/Wells Fargo Housing Market Index gauges builder perceptions of current single-family home sales and sales expectations for the next six months as “good,” “fair” or “poor.” The survey also asks builders to rate traffic of prospective buyers as “high to very high,” “average” or “low to very low.” Scores for each component are then used to calculate a seasonally adjusted index where any number over 50 indicates that more builders view conditions as good than poor. All the HMI indices posted gains in August."
This is quite a reversal from an index that had been at an 8-year low only a few months ago.
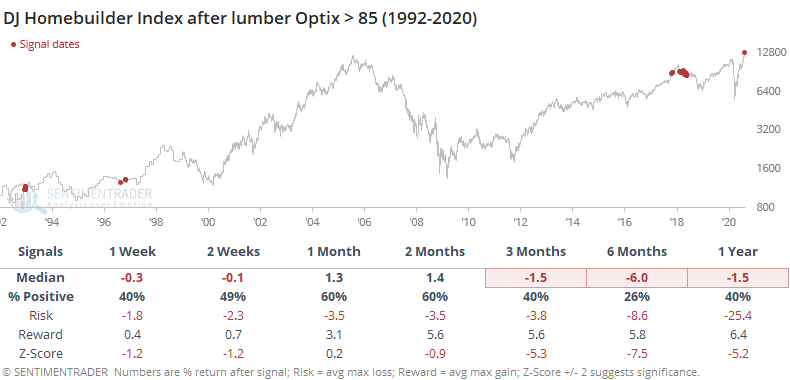
When the survey rebounds from below 50 to approach or exceed its prior multi-year high, it hasn't been a great sign for their homebuilders' stock prices going forward.
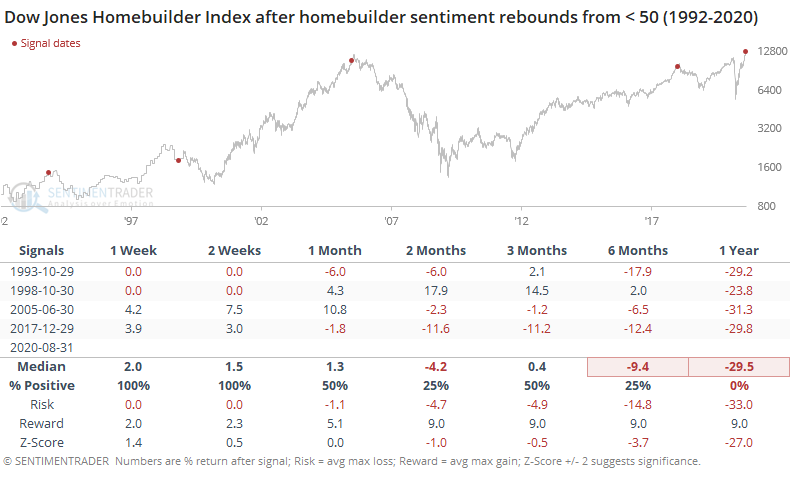
While builders managed to show large gains over the short- to medium-term in 1998 and 2005, a year later the DJ Homebuilder Index was at least 20% lower a year later.
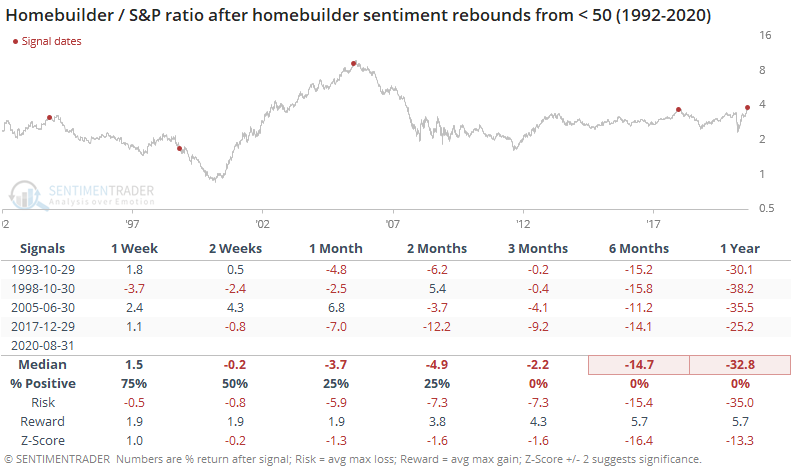
These stocks did even worse relative to the broader market.
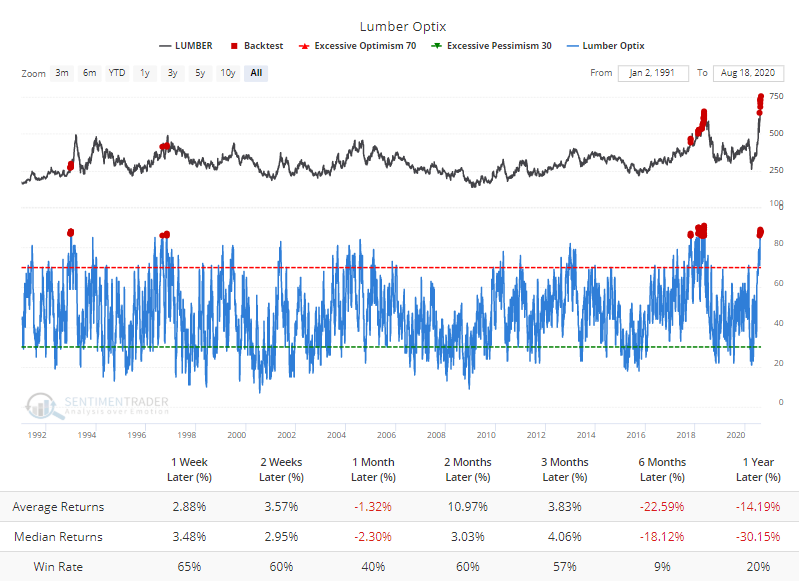
For lumber, it was mostly a good shorter-term sign, though those gains were able to persist over the next 12 months only in 1998.
ETF investors have taken note, putting more than an average of $5 million per day into the XHB fund over the past 20 sessions.
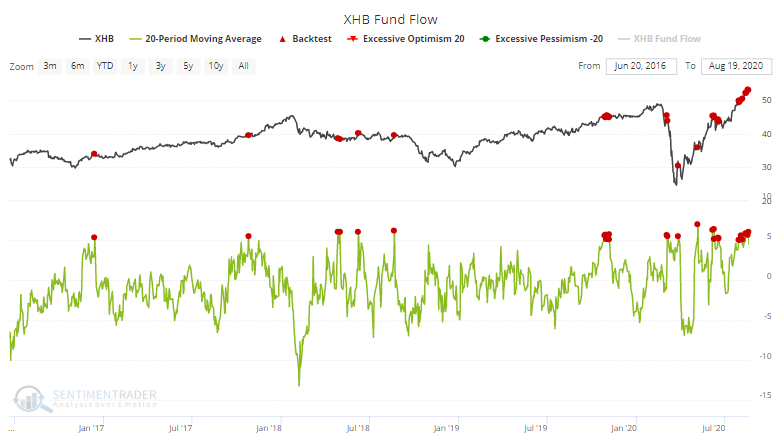
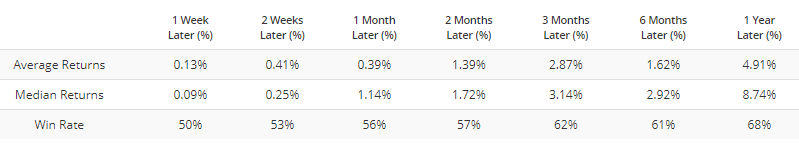
The Backtest Engine shows that future returns were muted when flows were this high.
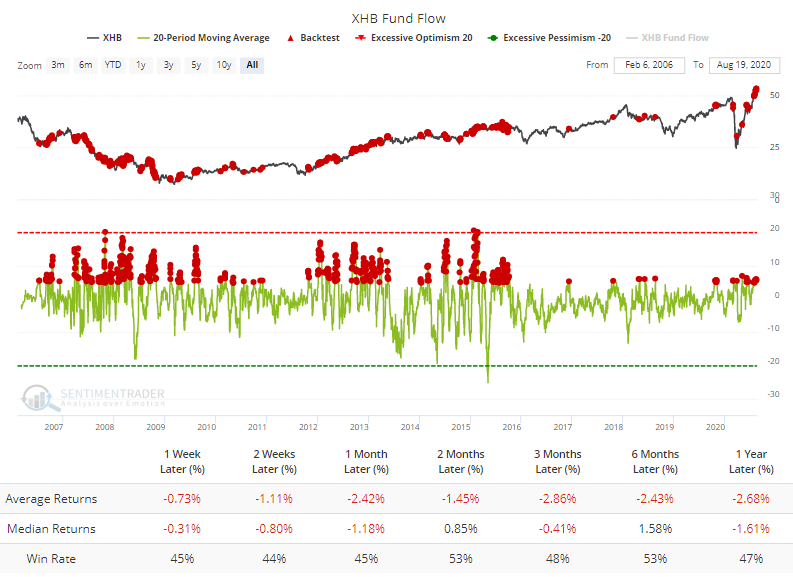
Returns were significantly better when the fund averaged a $5 million per day outflow.
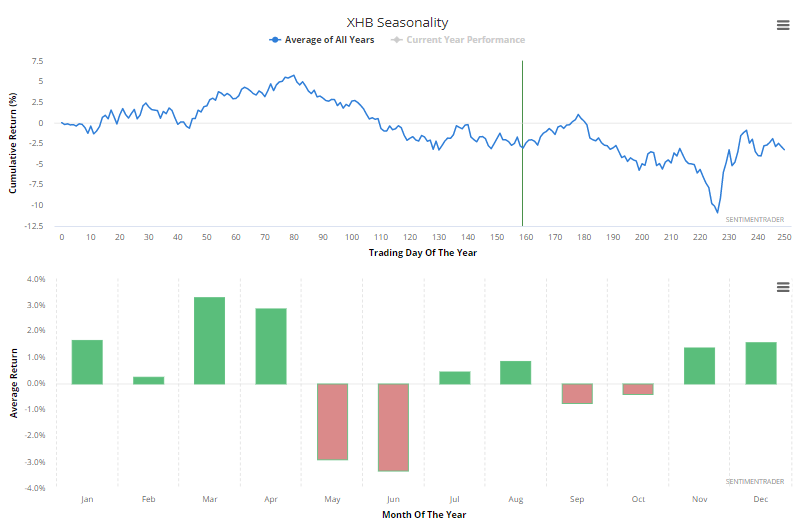
For what it's worth, the seasonal pattern isn't great right now, as homebuilding stocks have tended to show low returns into September/October.
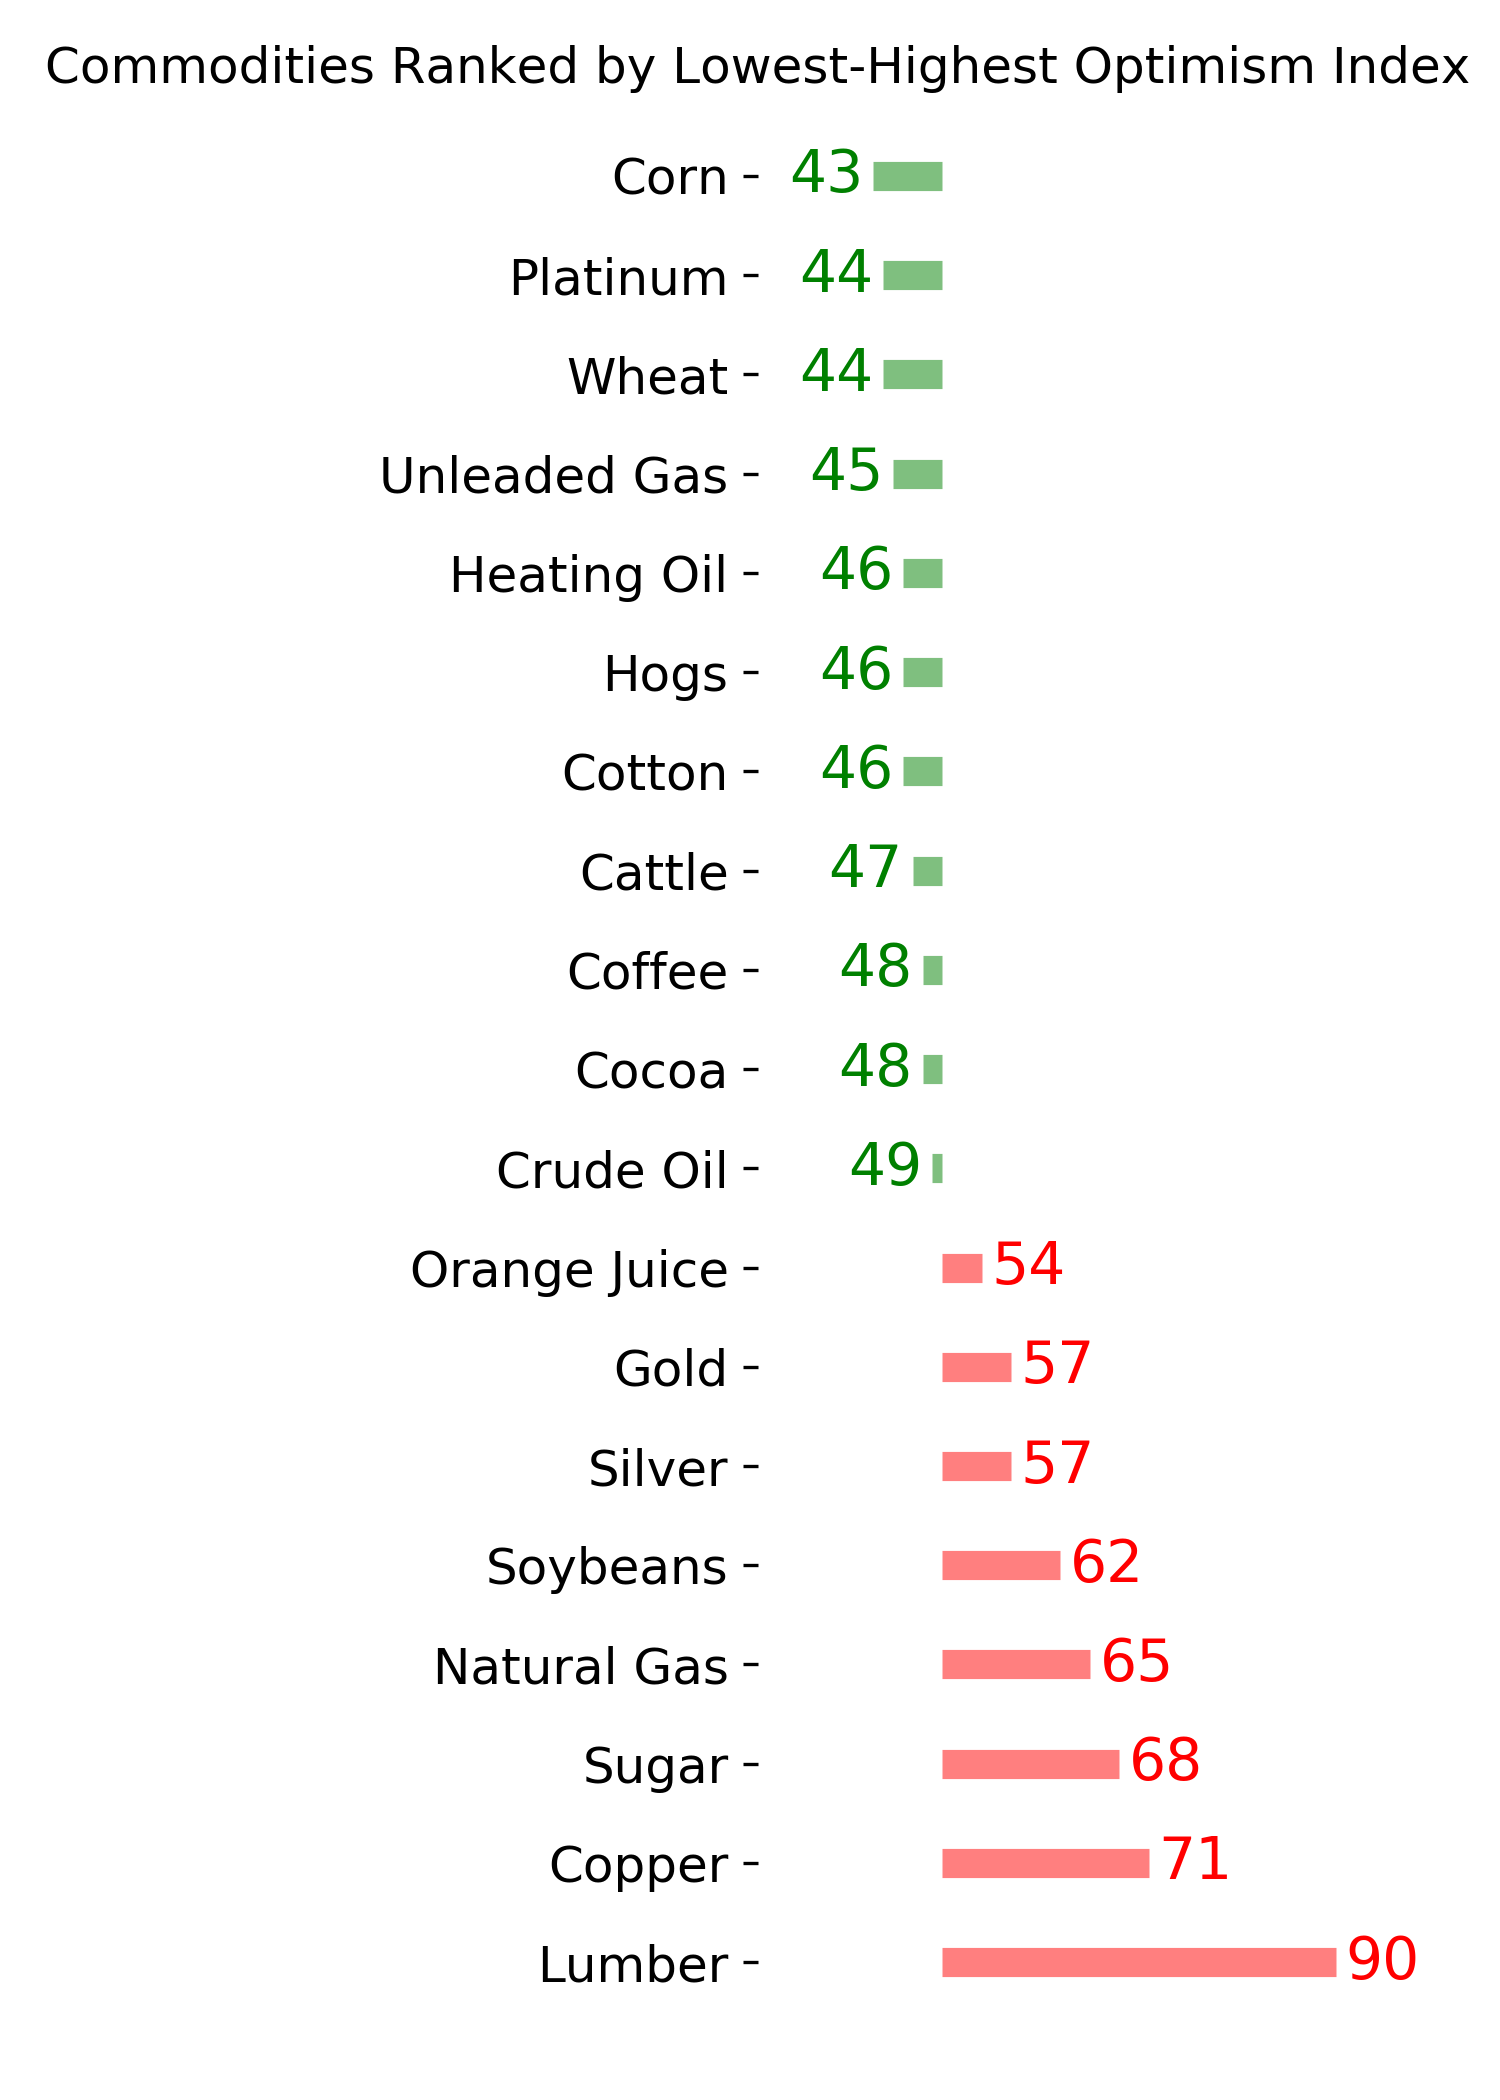
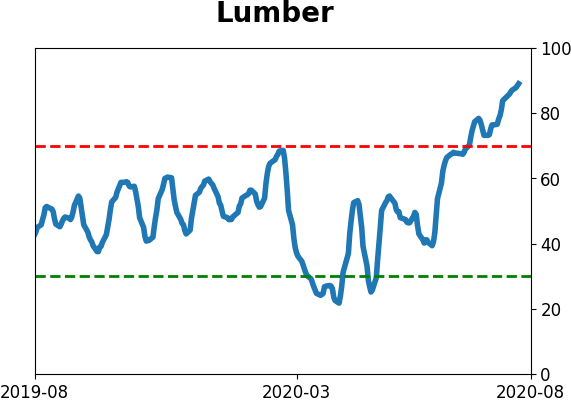
Not only do homebuilding stocks face a potential headwind from such high optimism, as the survey release notes, high lumber prices are a potential negative as well.
“However, the V-shaped recovery for housing has produced a staggering increase for lumber prices, which have more than doubled since mid-April. Such cost increases could dampen momentum in the housing market this fall, despite historically low interest rates.”
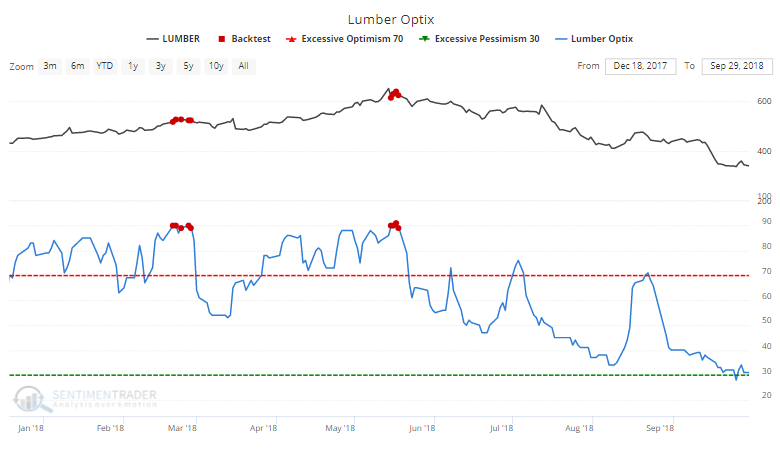
The Optimism Index for lumber just reached its 2nd-highest level in 30 years. Only a few sessions in 2018 exceeded this kind of confidence.
Looking at lesser extremes, the Backtest Engine shows that it's unusual to see it get above 85. It was way early in the spike in 1993 but otherwise triggered later in the cycles, preceding tough 6-12 month returns.
Even if lumber prices retreat from this high optimism, it hasn't necessarily been a boon to homebuilding stocks.
Overall, the run in the builders has been impressive, but the combination of high input costs and even higher optimism has traditionally been a major drag on their absolute and relative performance over a medium- to long-term time frame.
BOTTOM LINE
Retail and institutional investors alike have been pulling assets from money market funds. It has now been 10 weeks since either group of traders have set a new high in money market assets. This has been a good sign for stocks, not so much for the dollar or bonds.
FORECAST / TIMEFRAME
SPY -- Up, Long-Term
|
According to the Federal Reserve, investors have been consistently pulling money out of money market funds. In June, we saw that institutions were finally pulling back from their rabid thirst for money markets, and retail investors have followed suit.
It's now been 10 weeks since both retail and institutional investors had set a new high in money market assets.
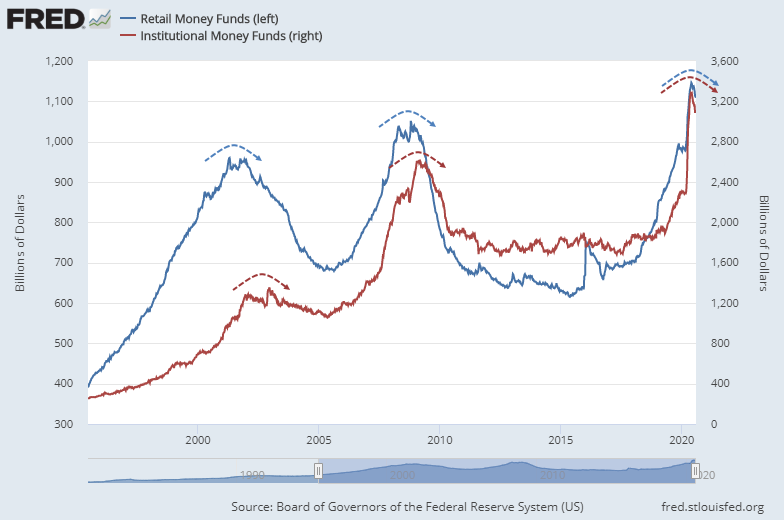
All that money has got to go somewhere - that's the theory anyway. Others would point out that if these money market investors are now buying stocks with all that cash, then there has to be someone selling it to them on the other side, unless they're buying some of that new issuance, maybe part of the reason IPOs have been popping.
Regardless of theory, empirically these reversals in money market assets have been a good sign for stocks.
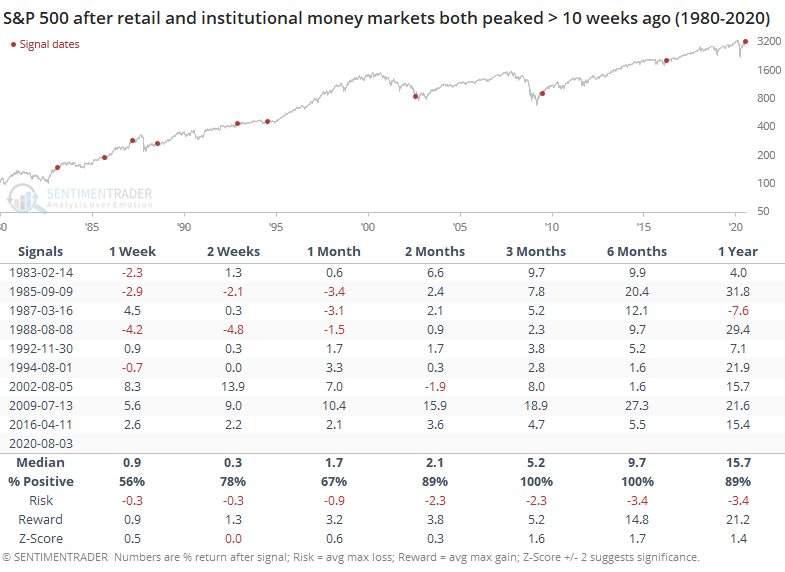
Prior to the past 20 years, the S&P's short- to medium-term returns were mixed to slightly negative after these drops in money market assets. Since then, it has marked the ends of bear markets (if we want to include 2015 in that description). That's hard to ignore.
Bonds tended to slide shorter-term as rates rose.
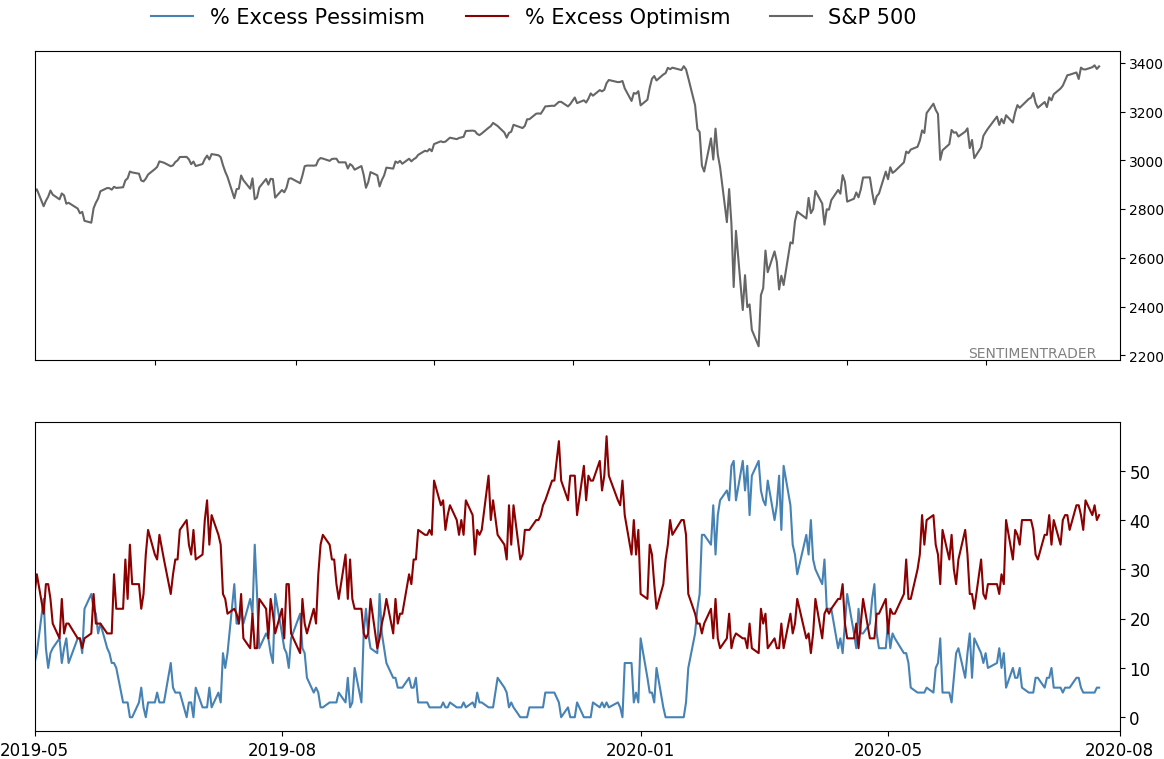
We've noted many times that not all sentiment metrics agree, and haven't for months. There have been curious outliers, including fund flows like this, hedger activity in major equity index futures, and some surveys. Many more indicators have shown excessive optimism, and so far it hasn't mattered, which is unusual for this kind of market environment.
The weight of the evidence continues to suggest short- to medium-term weakness for stocks, but with significant longer-term positives. Fund flows are one of those positives.
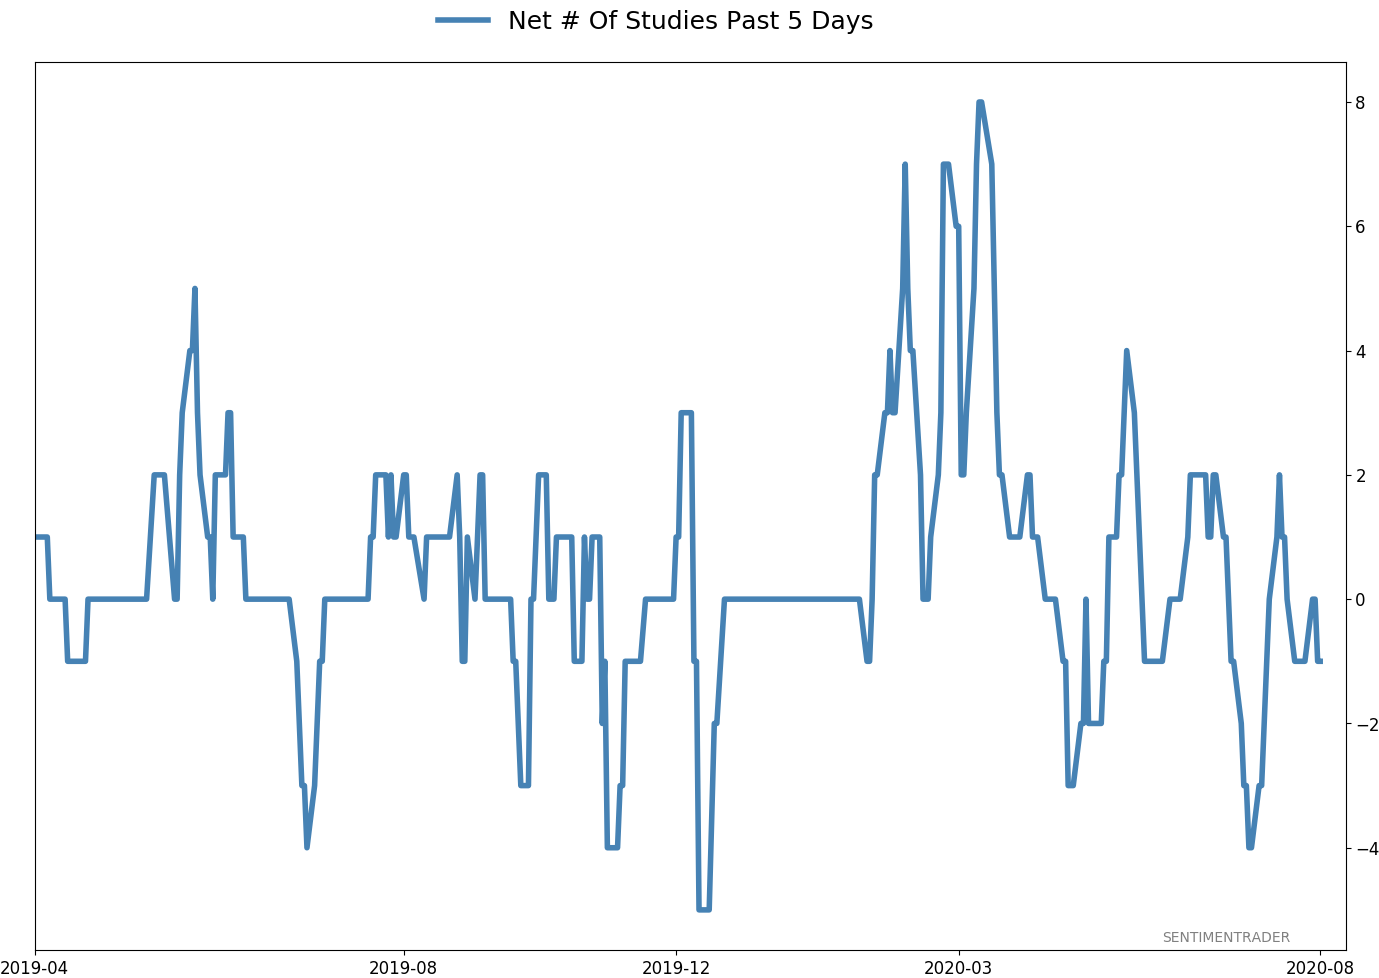
Active Studies
| Time Frame | Bullish | Bearish | | Short-Term | 0 | 1 | | Medium-Term | 8 | 13 | | Long-Term | 47 | 1 |
|
Indicators at Extremes
Portfolio
| Position | Weight % | Added / Reduced | Date | | Stocks | 29.8 | Reduced 9.1% | 2020-06-11 | | Bonds | 0.0 | Reduced 6.7% | 2020-02-28 | | Commodities | 5.2 | Added 2.4%
| 2020-02-28 | | Precious Metals | 0.0 | Reduced 3.6% | 2020-02-28 | | Special Situations | 0.0 | Reduced 31.9% | 2020-03-17 | | Cash | 65.0 | | |
|
Updates (Changes made today are underlined)
After stocks bottomed on March 23rd, they enjoyed a historic buying thrust and retraced a larger amount of the decline than "just a bear market rally" tends to. Through June, there were signs of breadth thrusts, recoveries, and trend changes that have an almost unblemished record at preceding higher prices over a 6-12 month time frame. On a shorter-term basis, our indicators have been showing high optimism, with Dumb Money Confidence recently above 80%, along with signs of reckless speculation during what appears to be an unhealthy market environment, historically a bad combination. While there are certainly some outlier indicators that are showing apathy or even outright pessimism, a weight-of-the-evidence approach suggests high risk over a multi-week to multi-month time frame. I've been carrying a low (too low) level of exposure to stocks, as well as bonds and gold. I don't see a good opportunity to add to any of those currently, with poor prospects pretty much all the way around. As worried as I am over the medium-term, I would only grudgingly reduce my exposure even further given the longer-term positives we spent so much time discussing in the spring. At this point, I would only look seriously at lowering exposure further if the S&P 500 drops below approximately 3220, an initial sign that its recent mini-breakout had failed.
RETURN YTD: -2.5% 2019: 12.6%, 2018: 0.6%, 2017: 3.8%, 2016: 17.1%, 2015: 9.2%, 2014: 14.5%, 2013: 2.2%, 2012: 10.8%, 2011: 16.5%, 2010: 15.3%, 2009: 23.9%, 2008: 16.2%, 2007: 7.8%
|
|
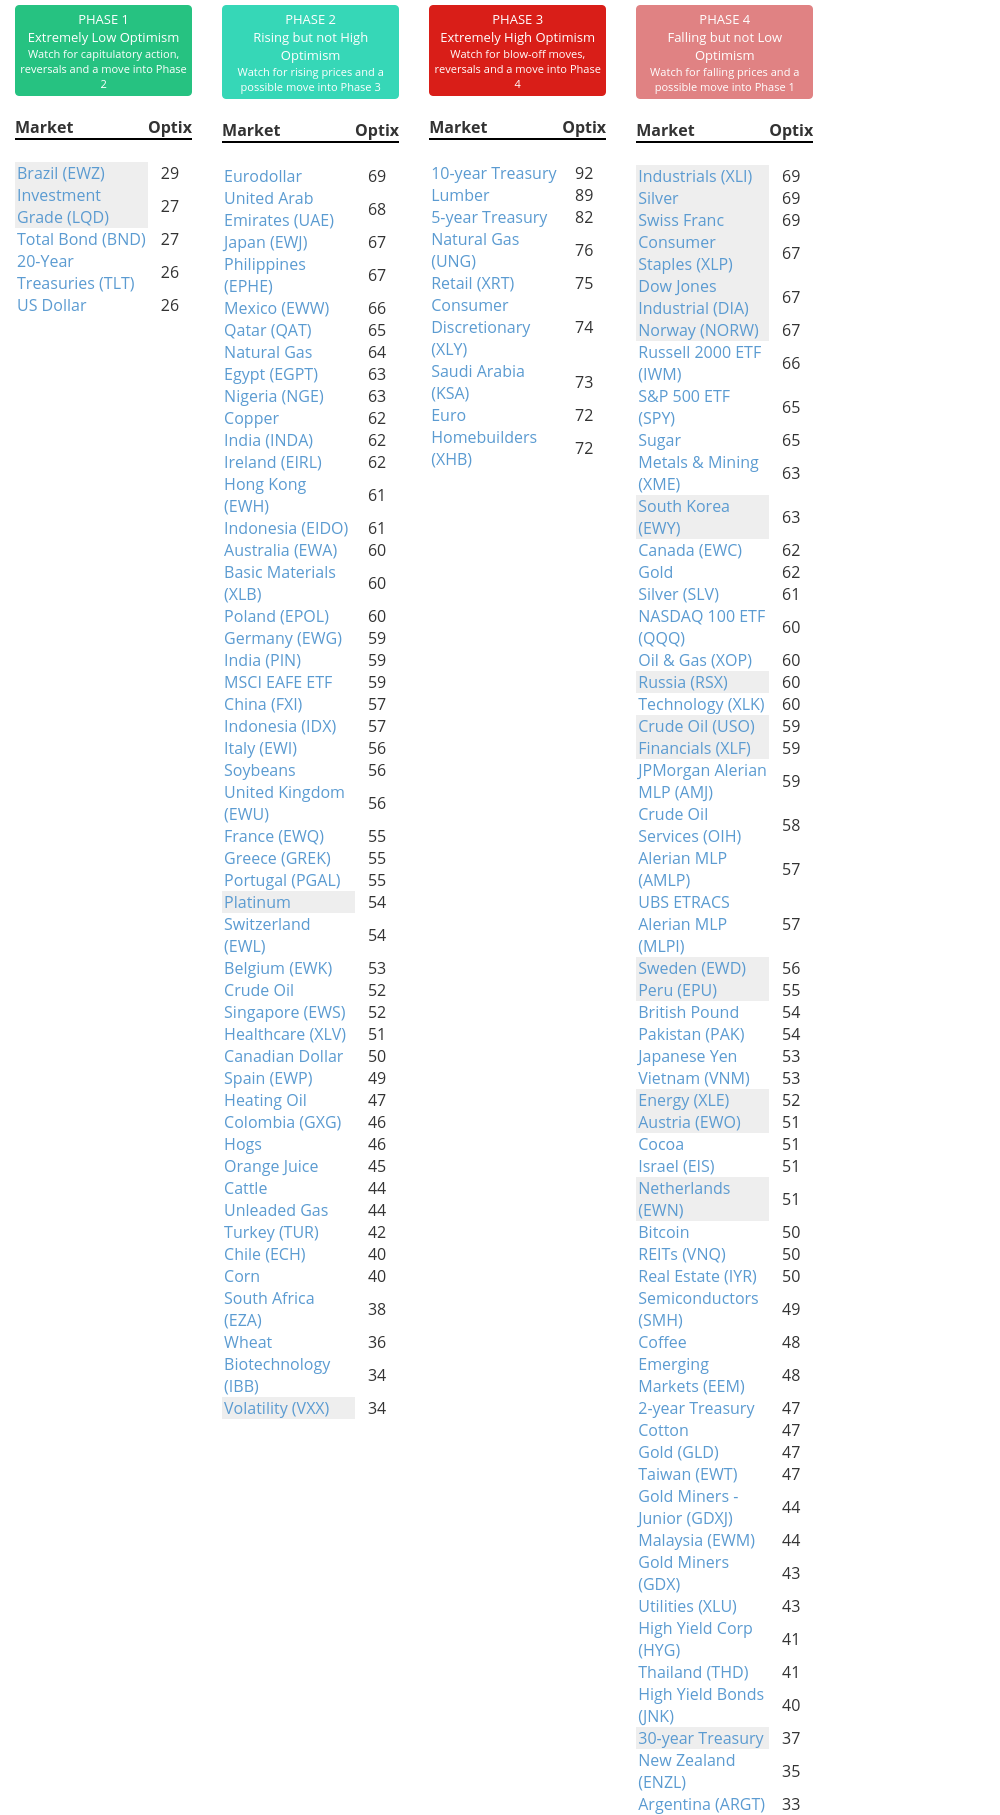
Phase Table
Ranks
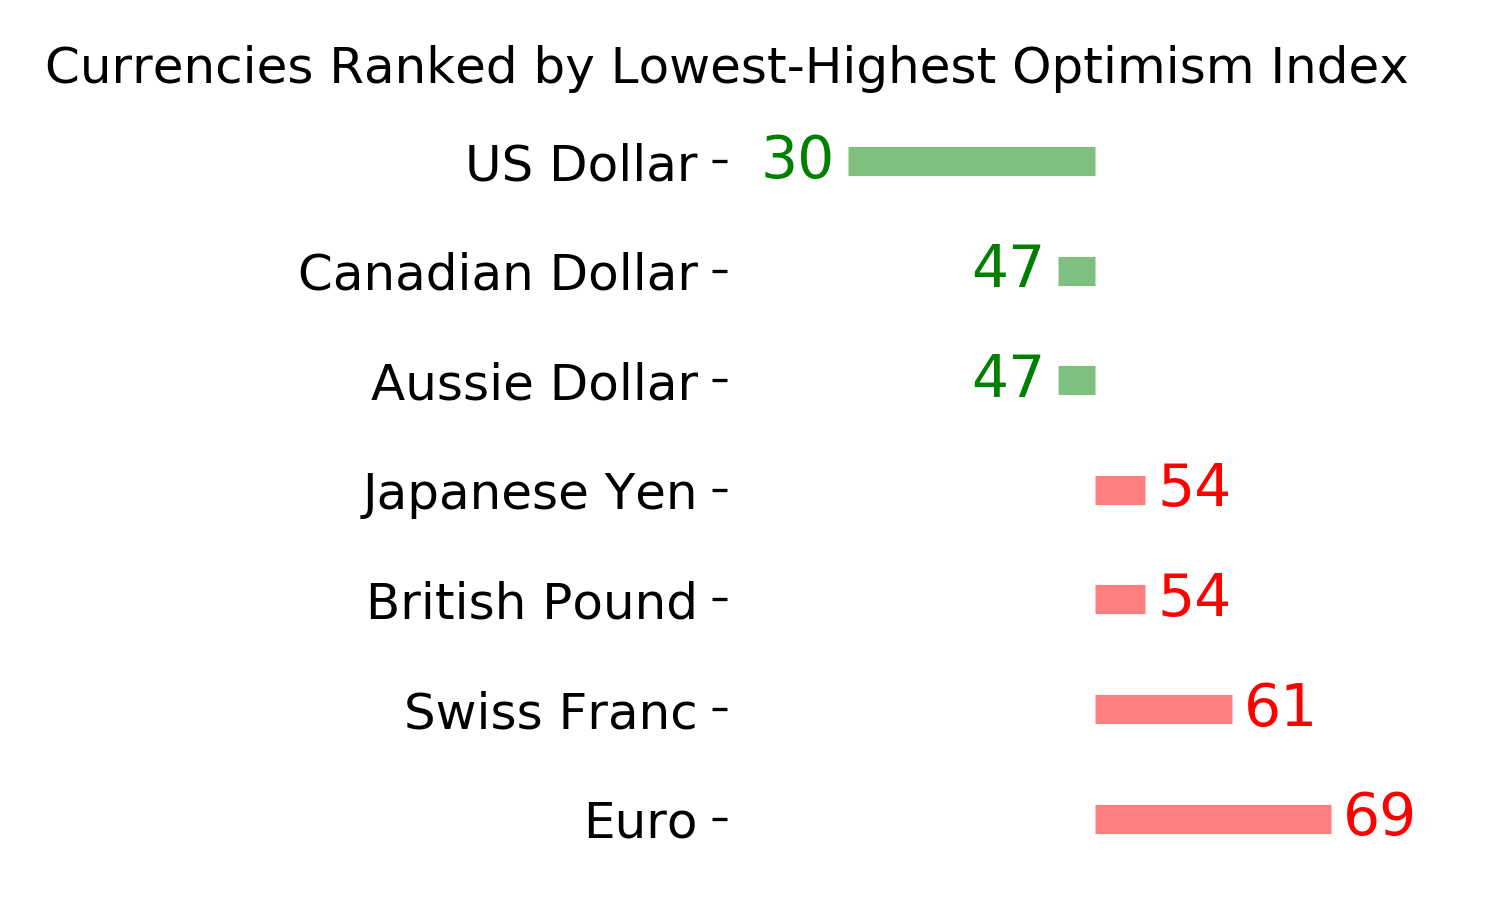
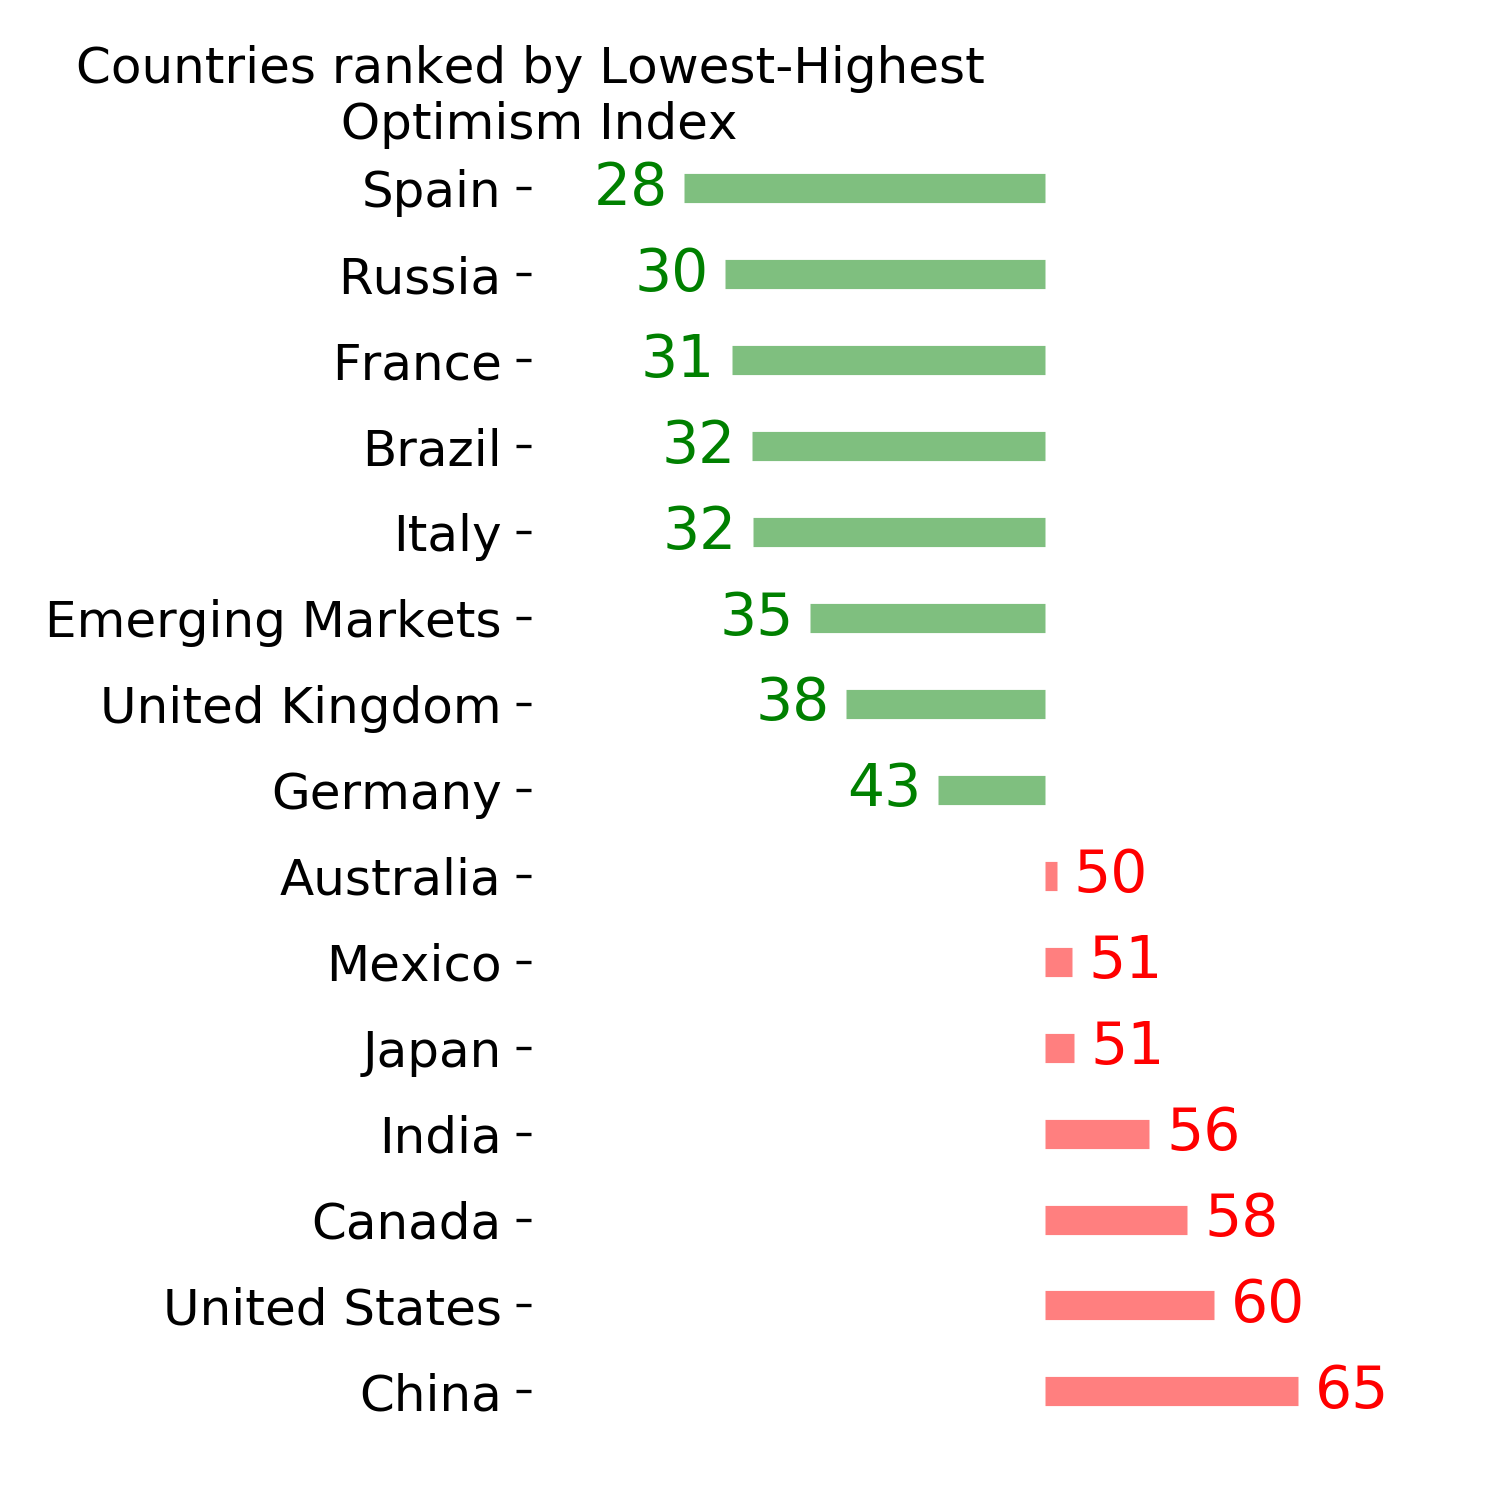
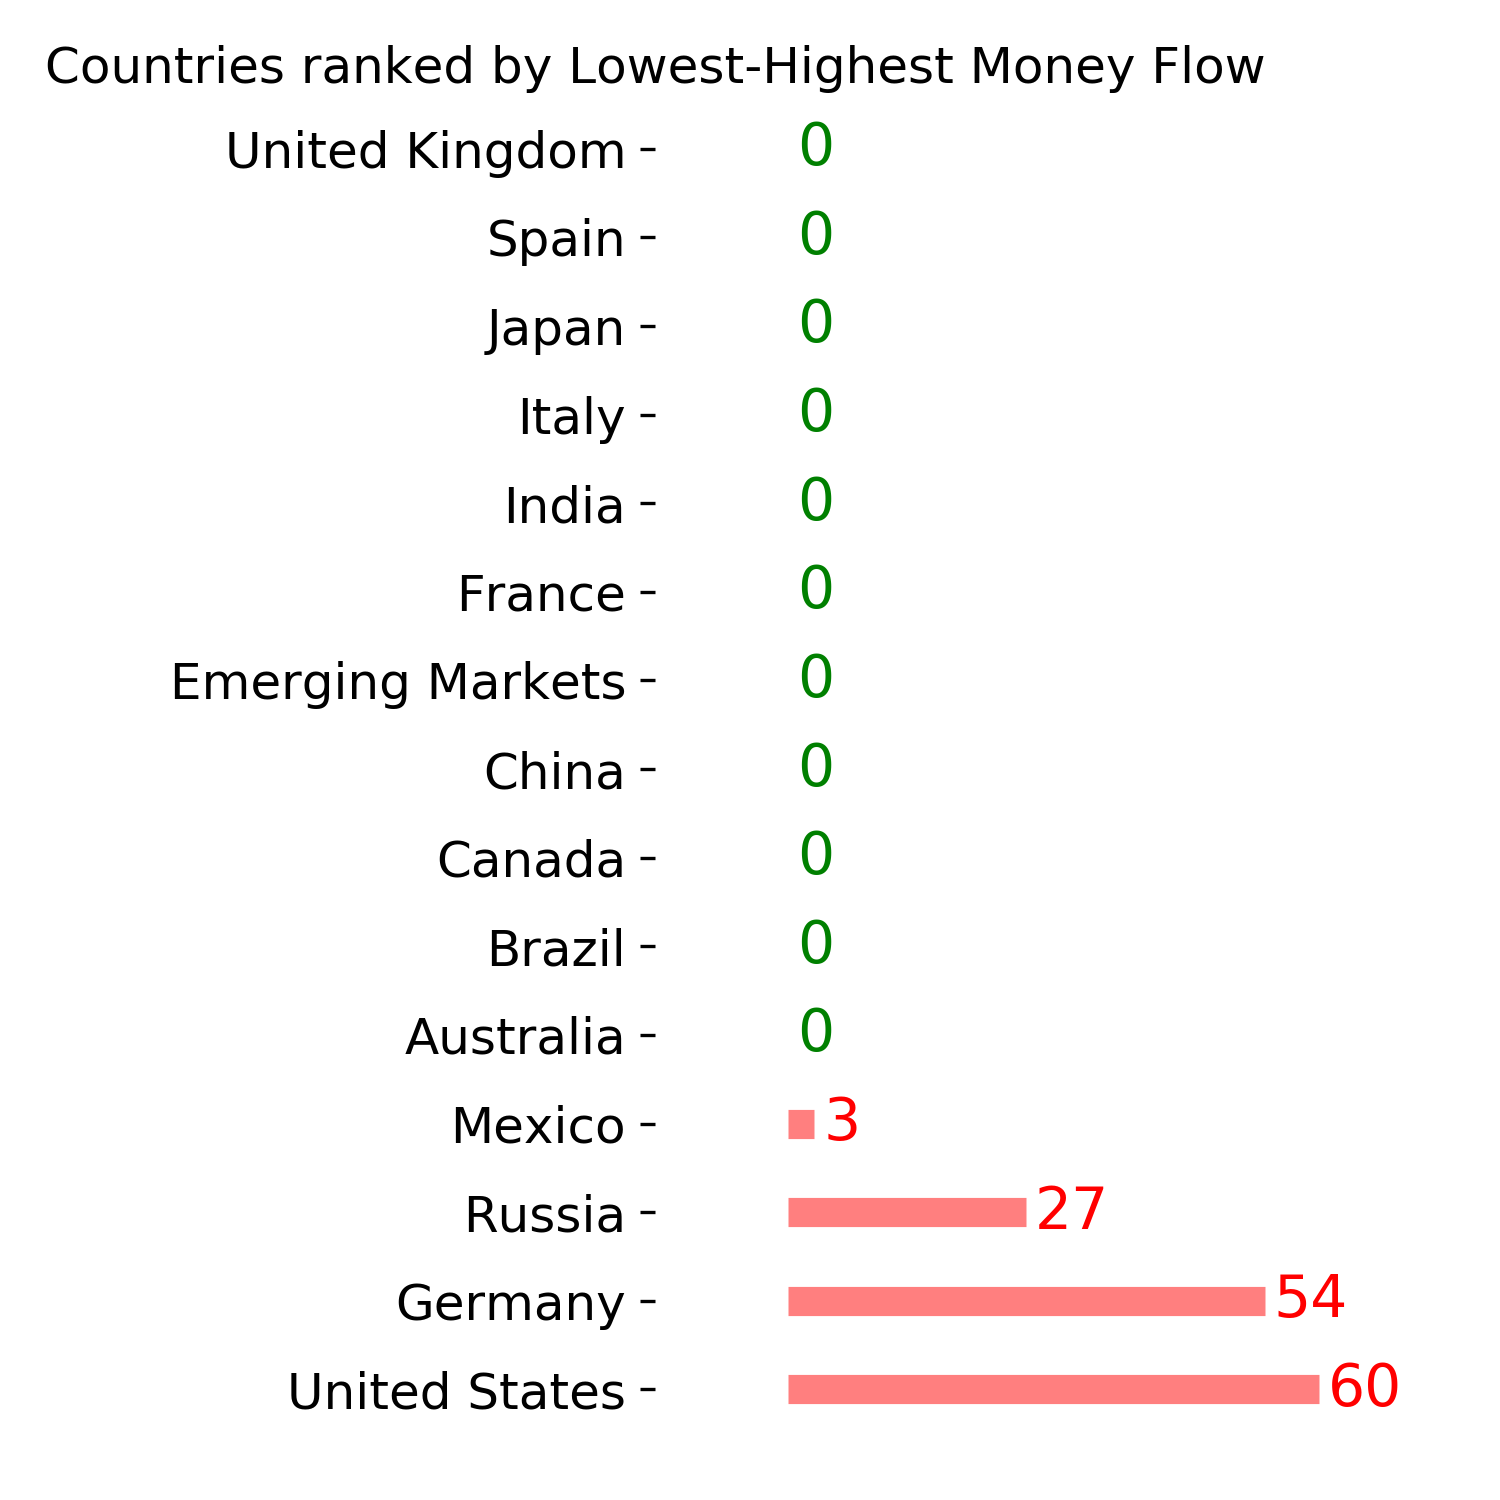
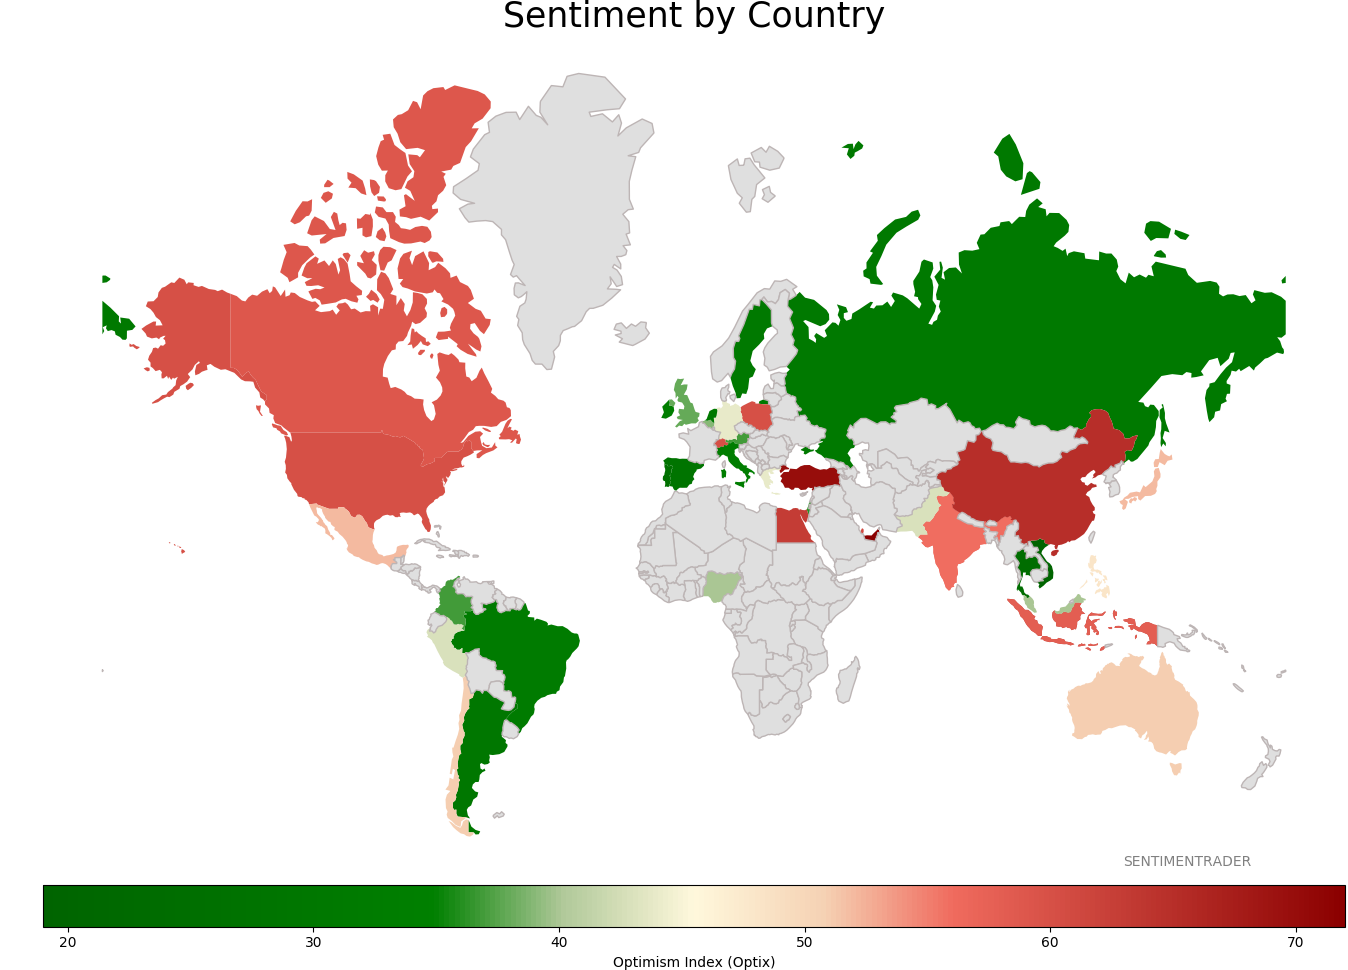
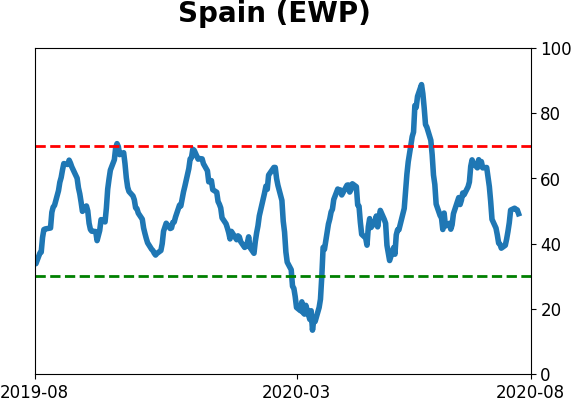
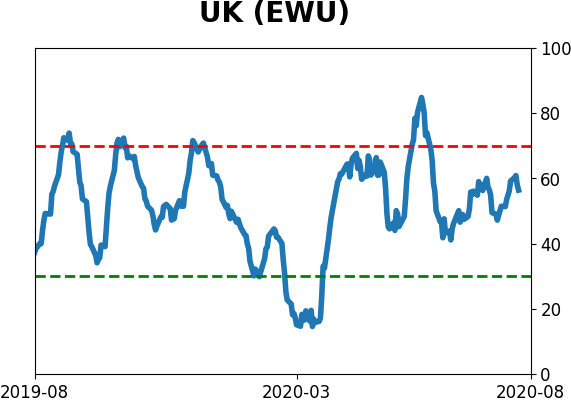
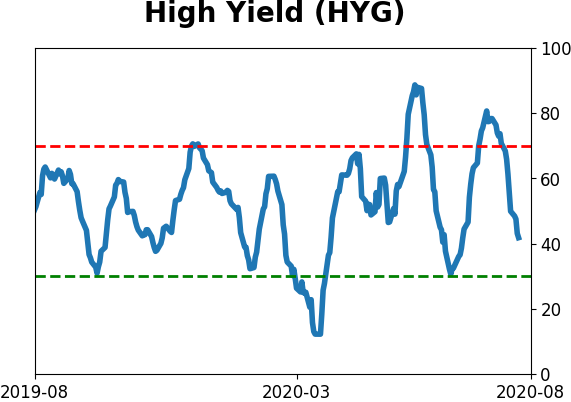
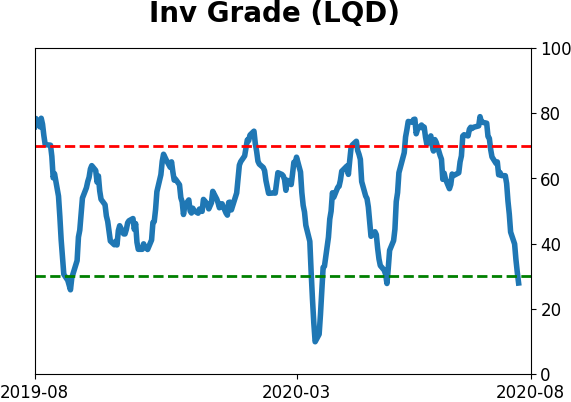
Sentiment Around The World
Optimism Index Thumbnails
|
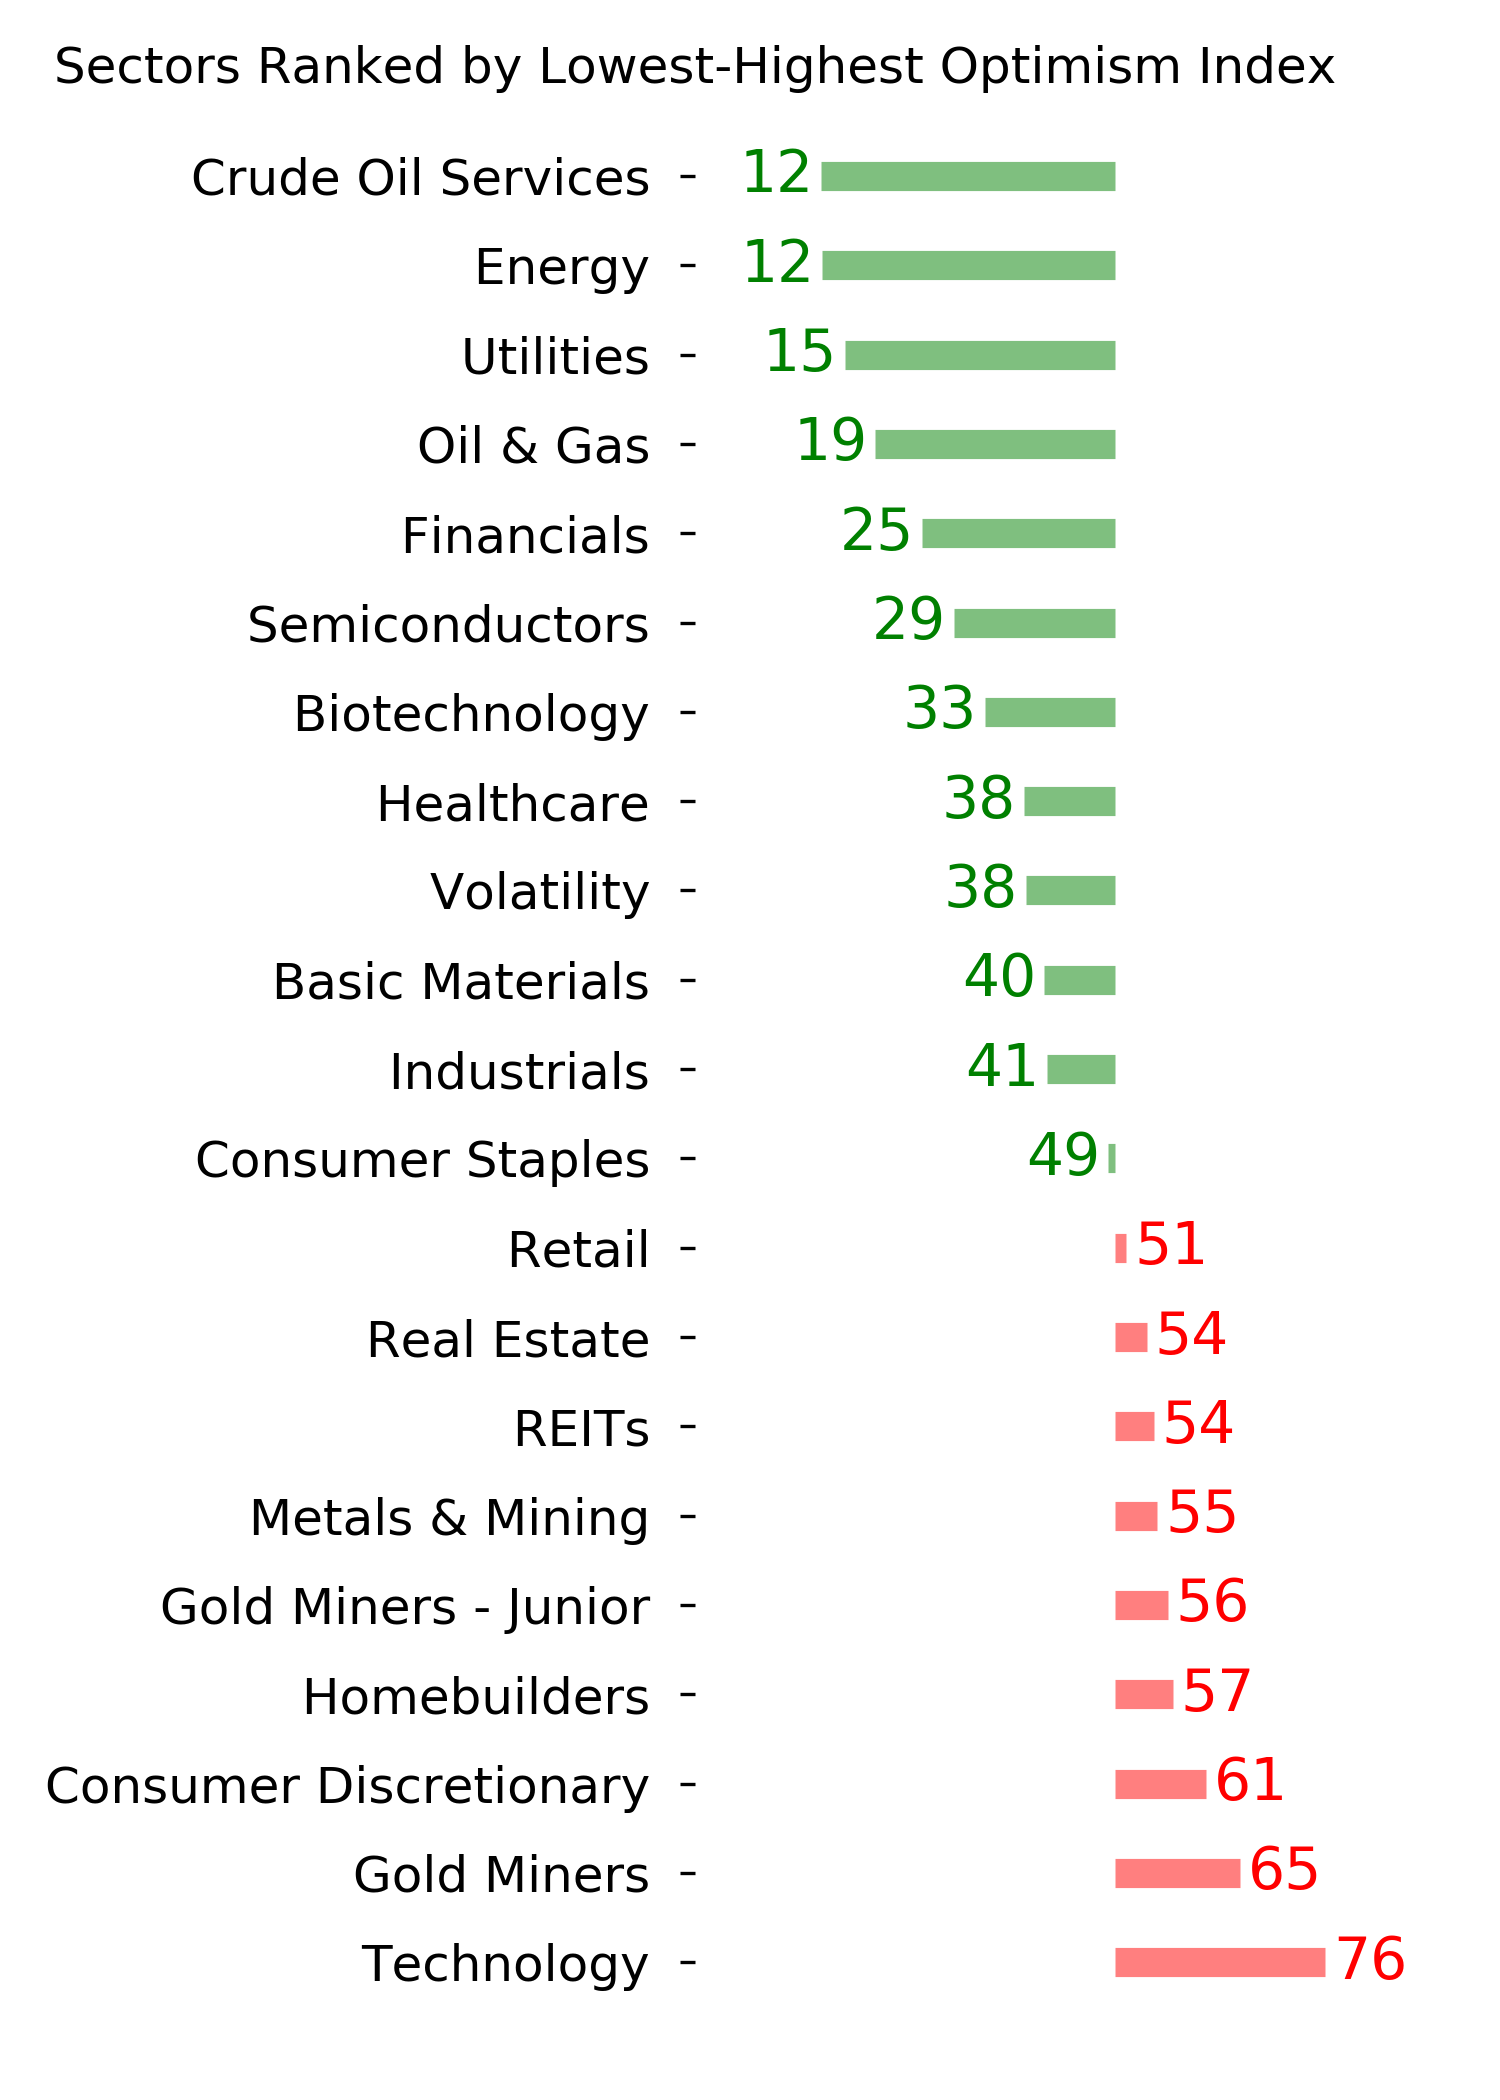
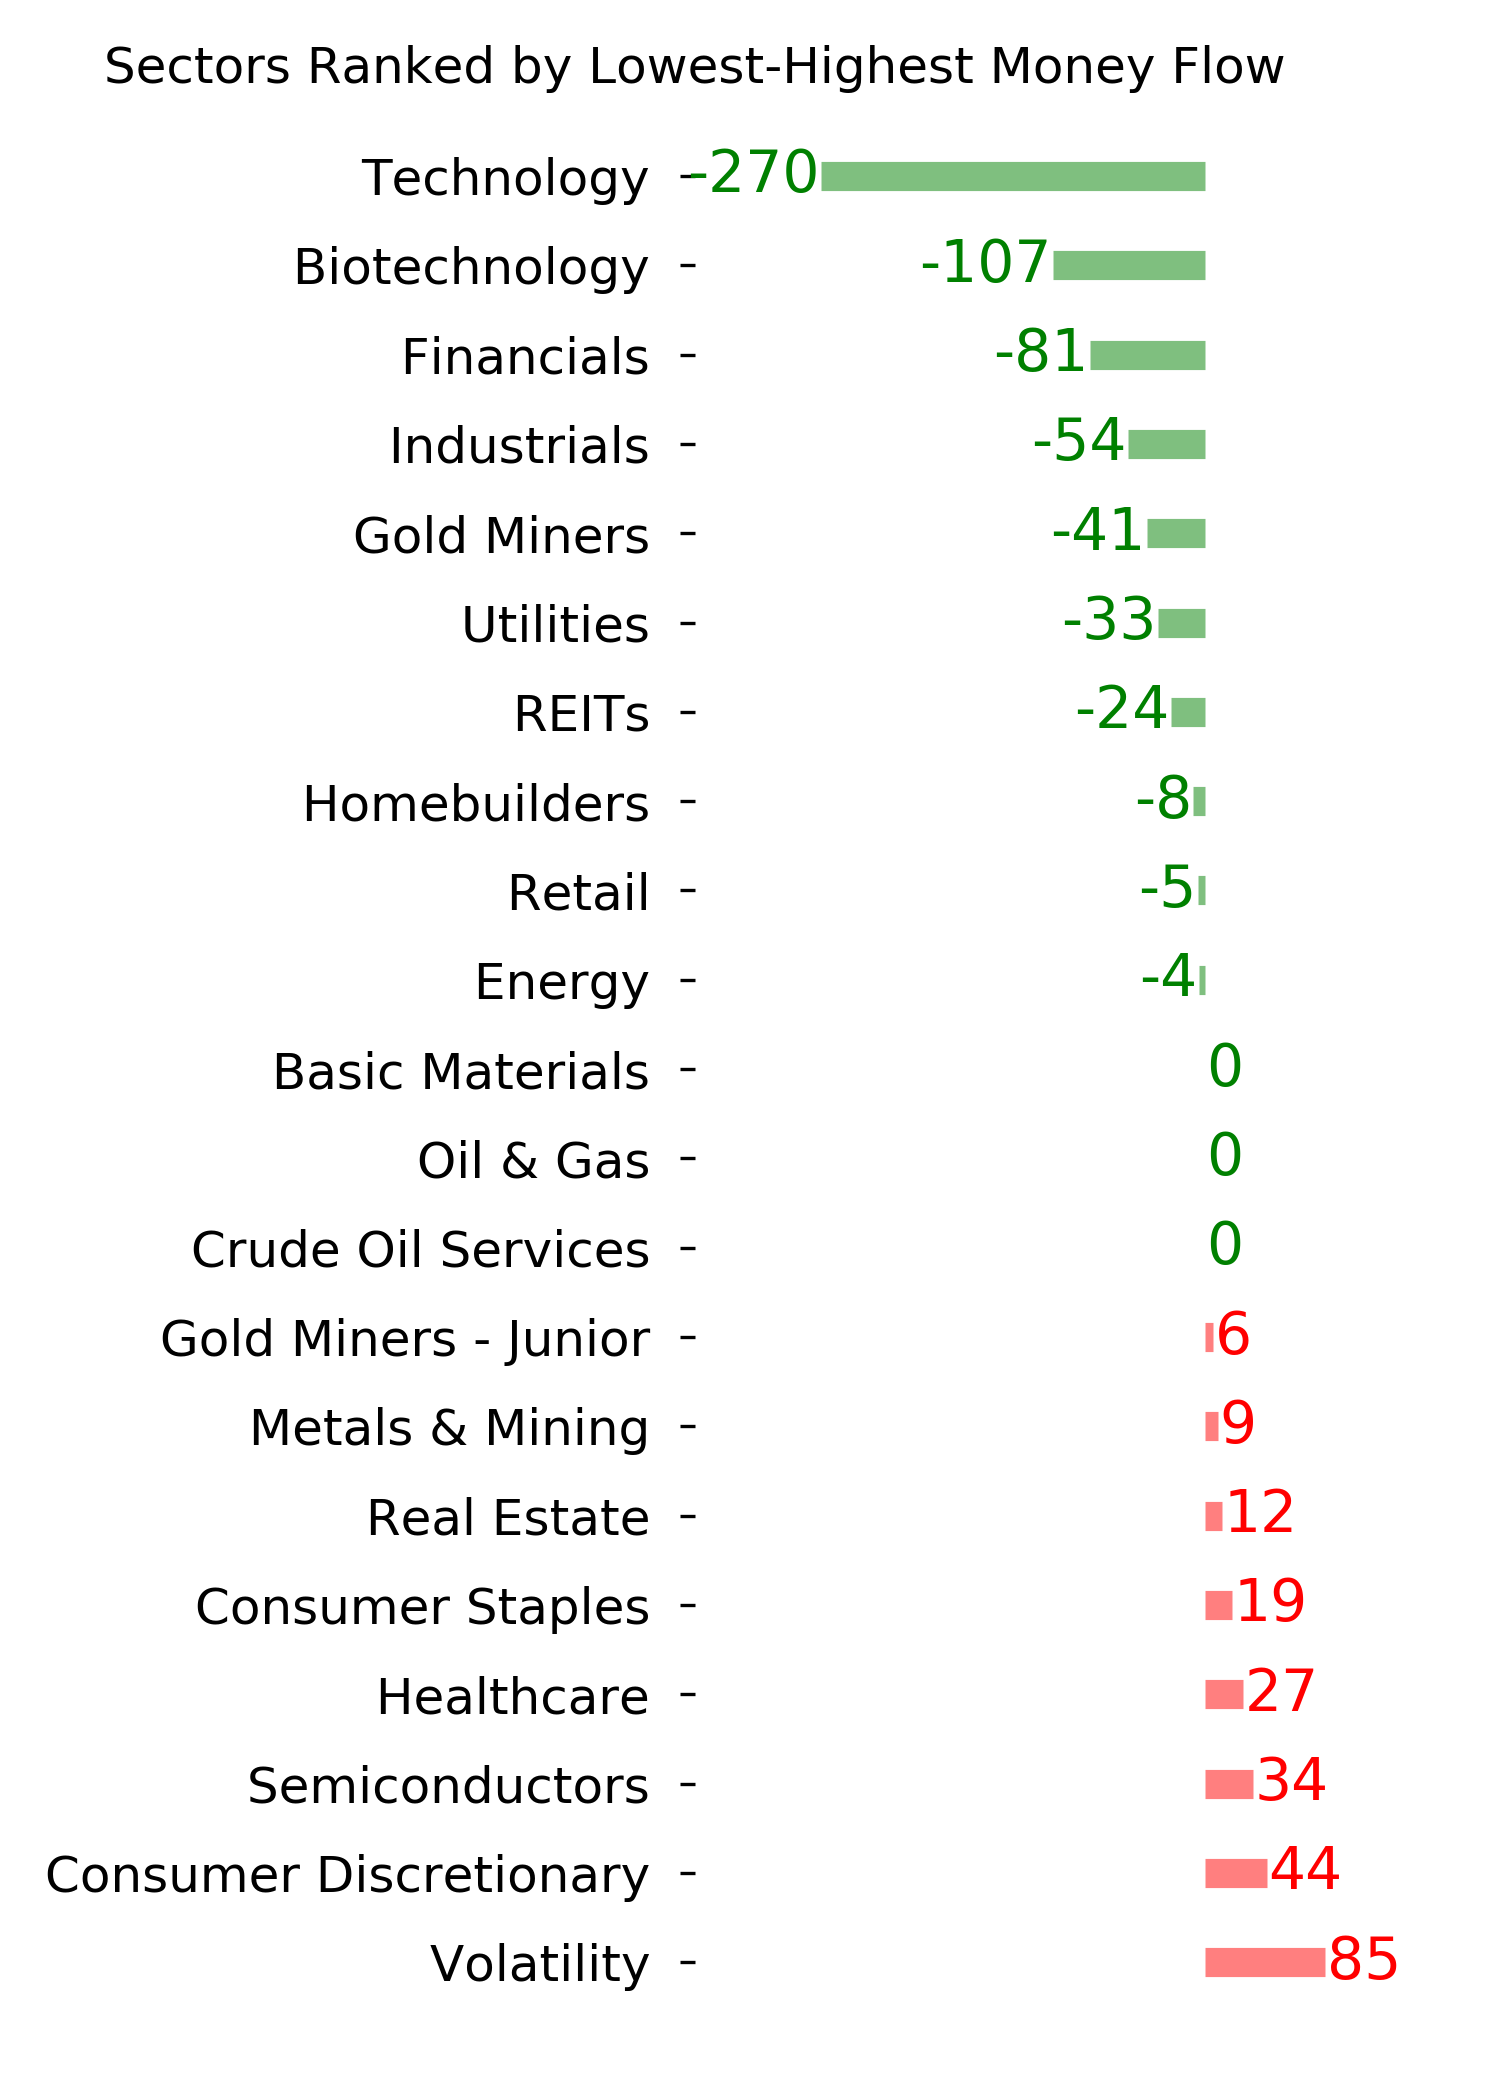
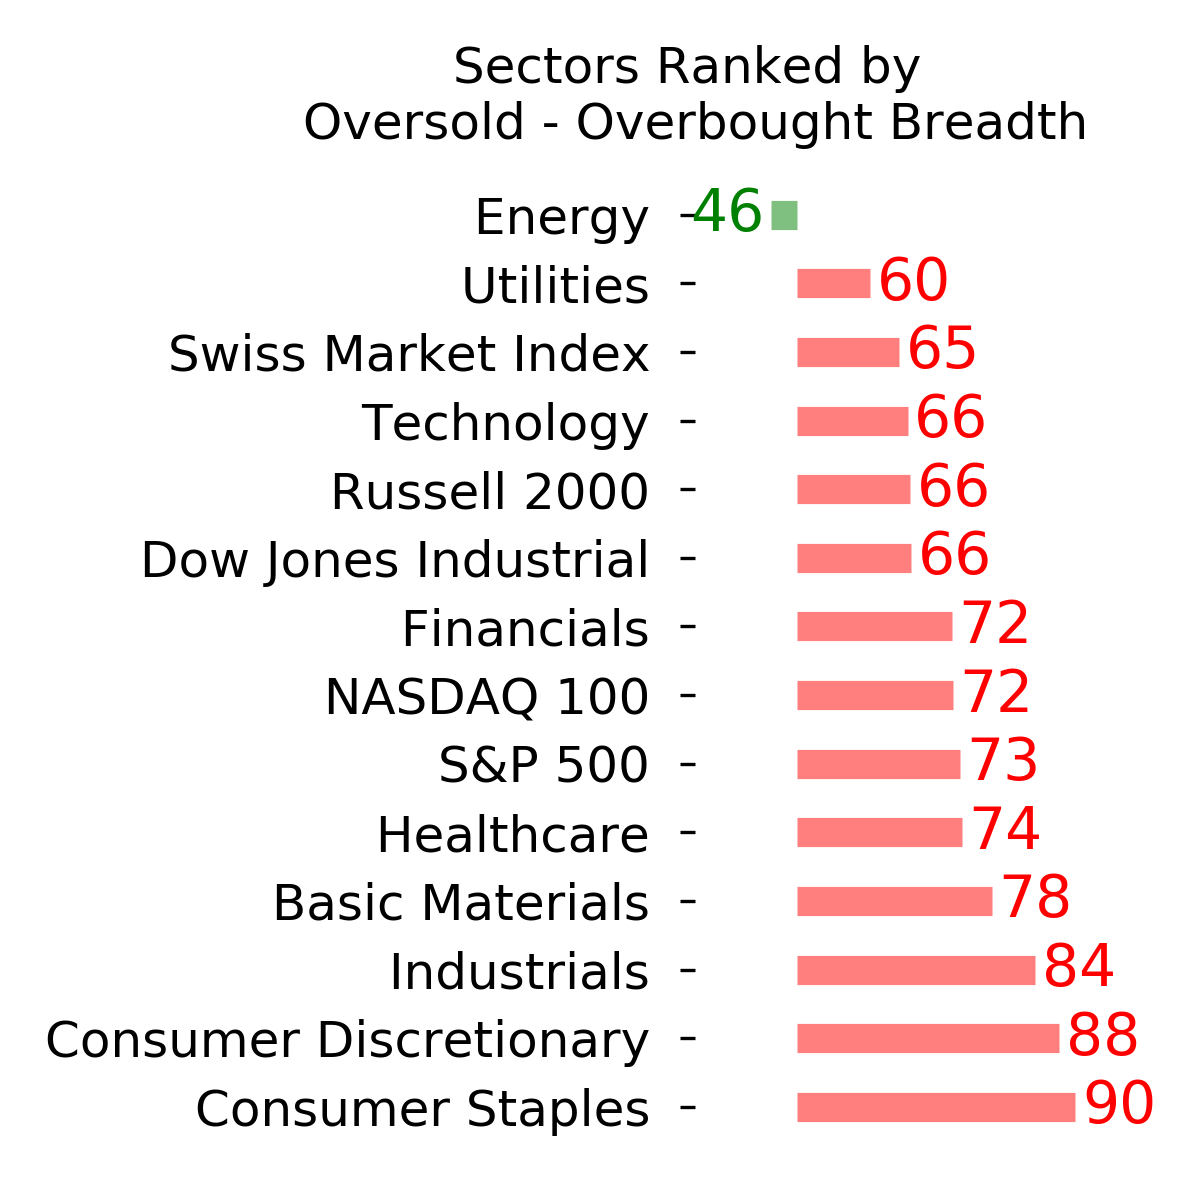
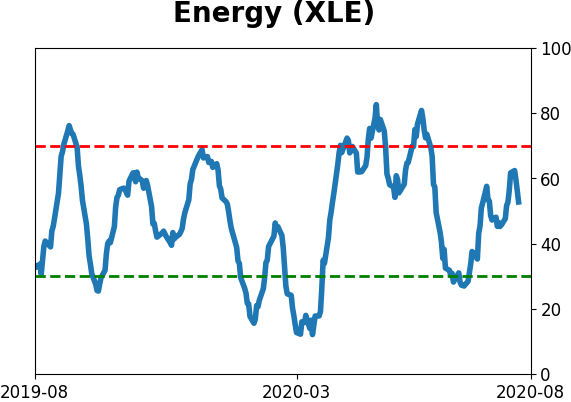
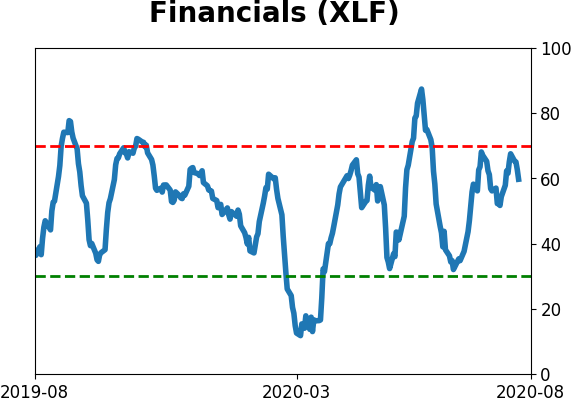
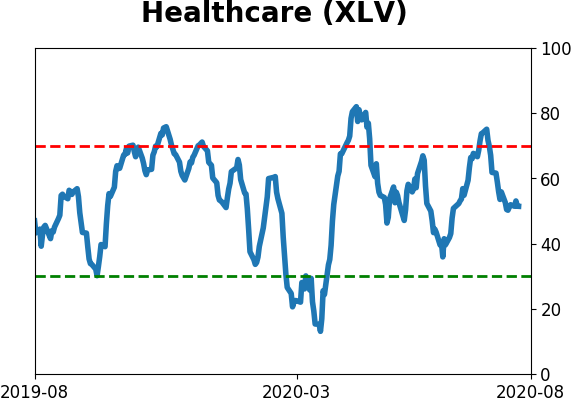
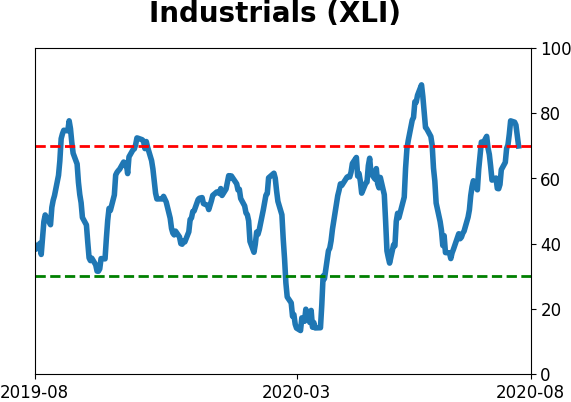
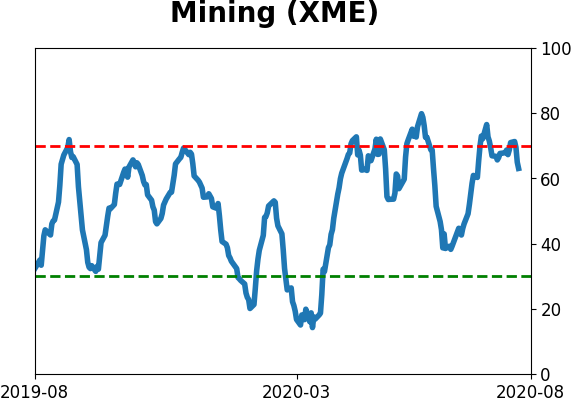
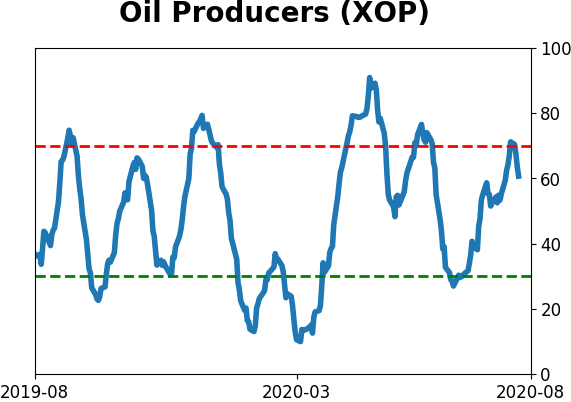
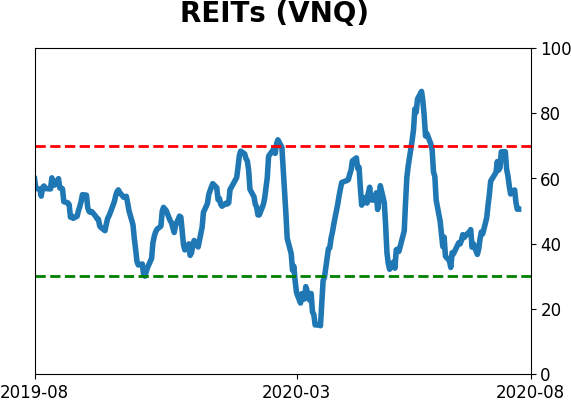
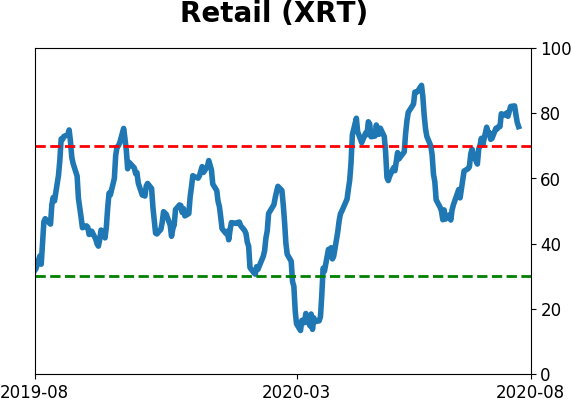
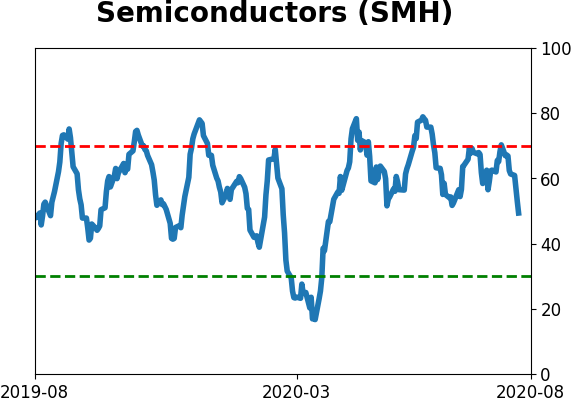
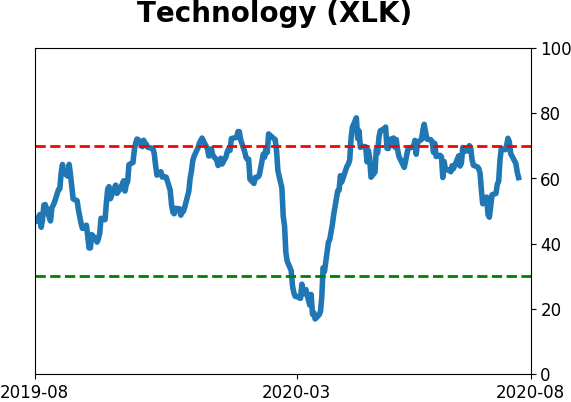
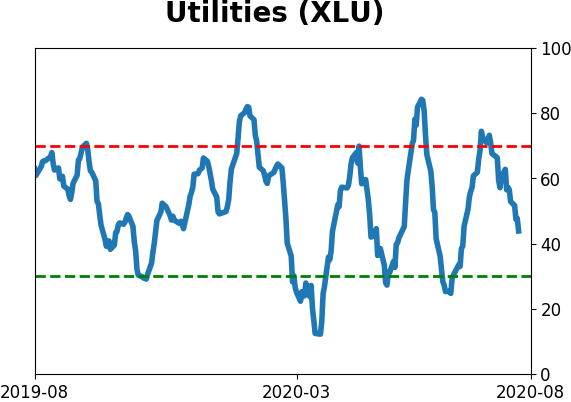
Sector ETF's - 10-Day Moving Average
|
|
|
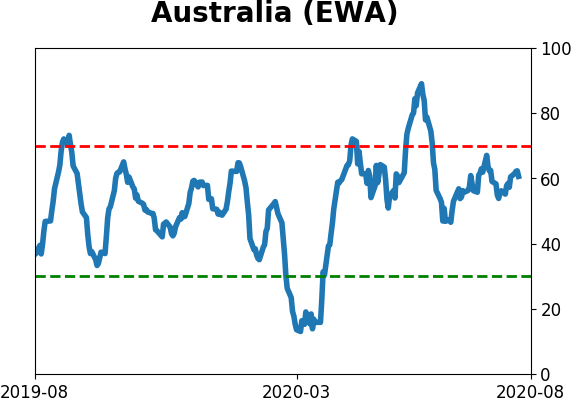
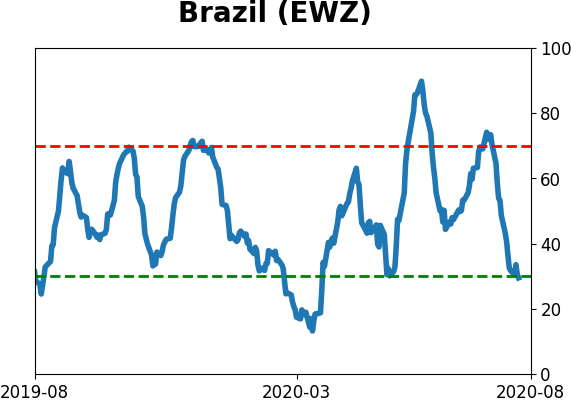
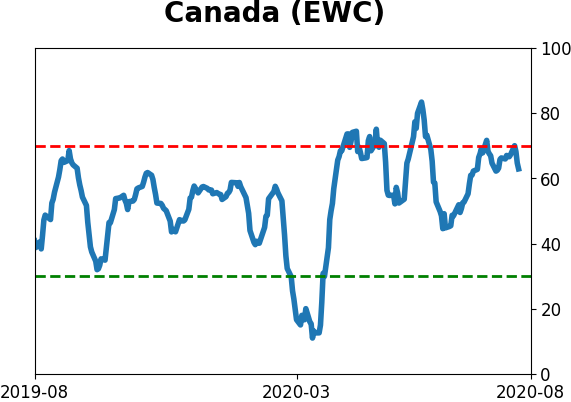
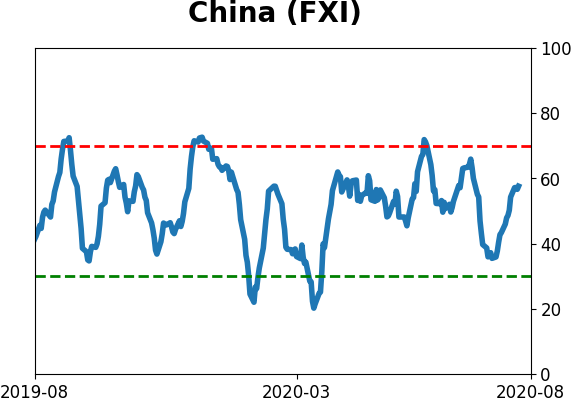
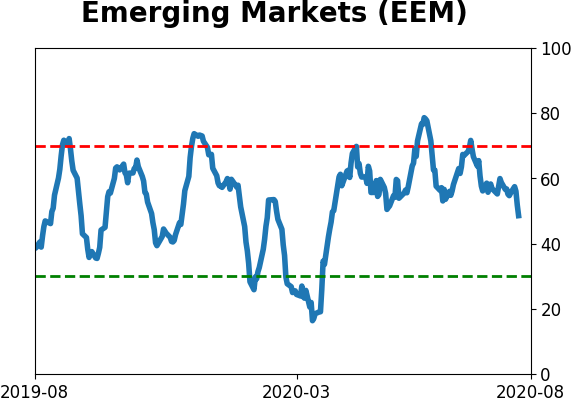
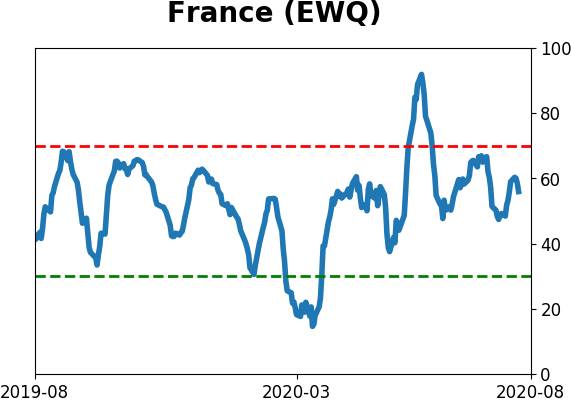
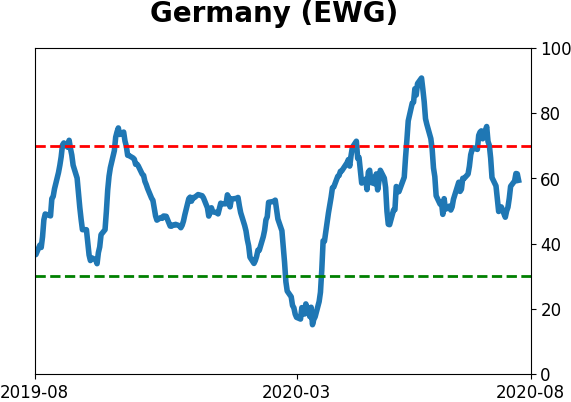
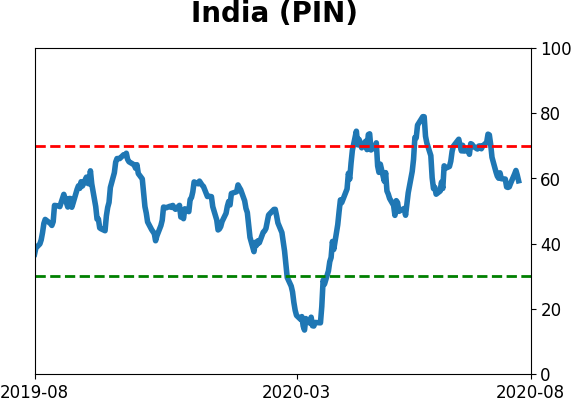
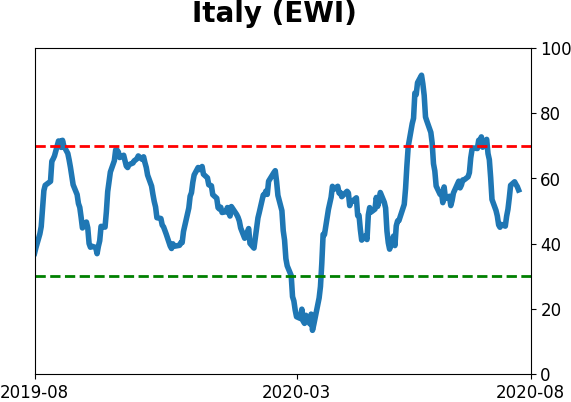
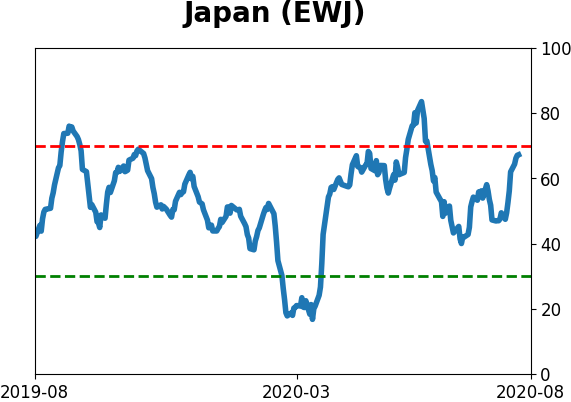
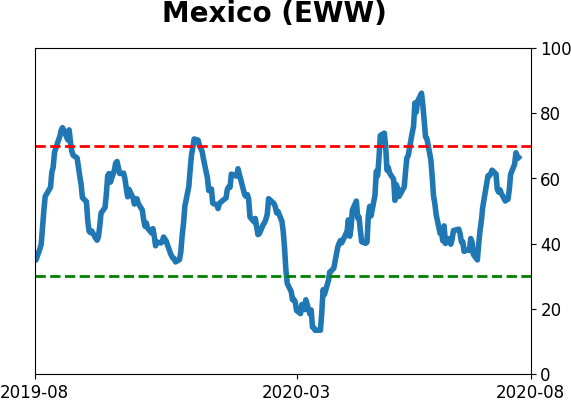
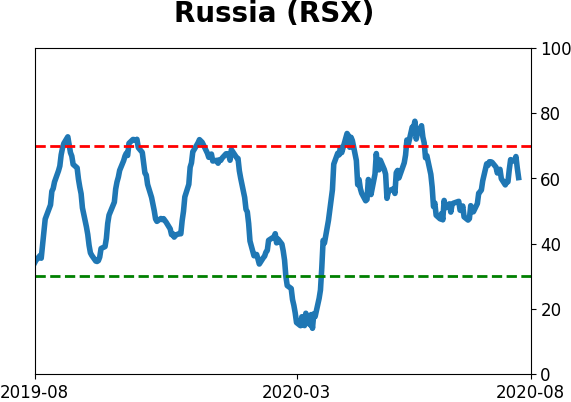
Country ETF's - 10-Day Moving Average
|
|
|
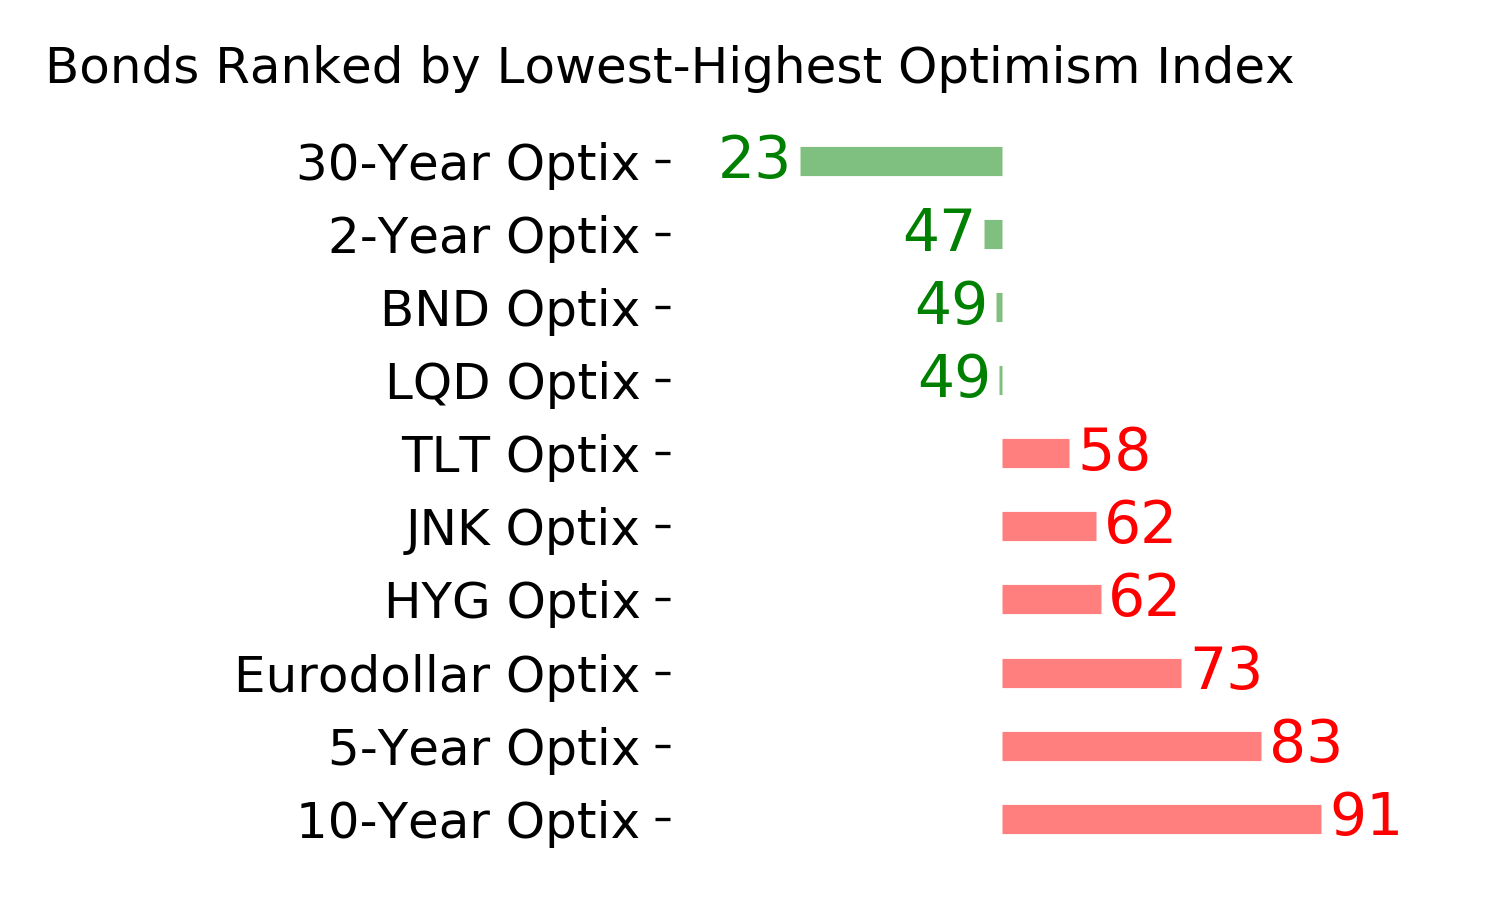
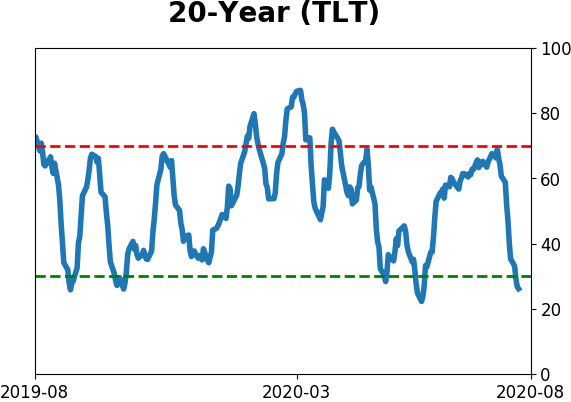
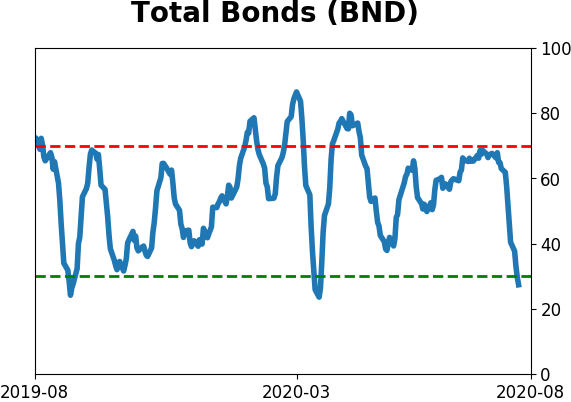
Bond ETF's - 10-Day Moving Average
|
|
|
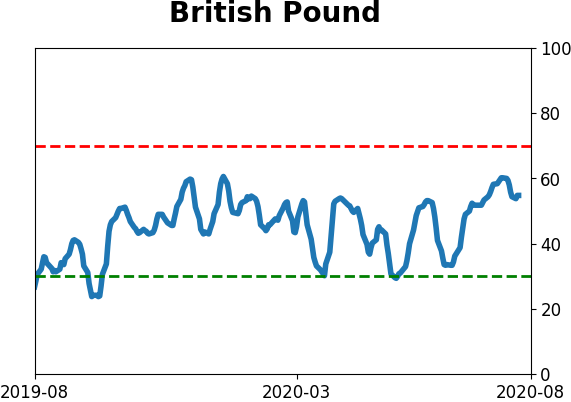
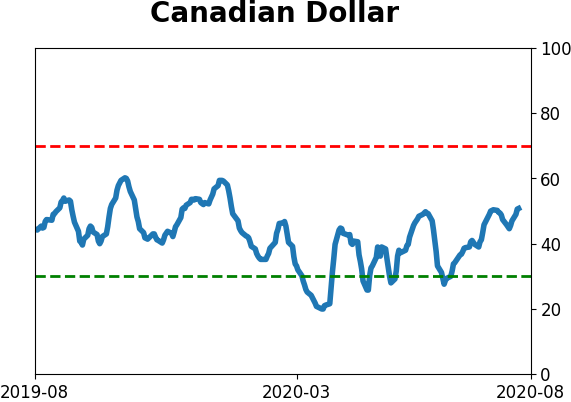
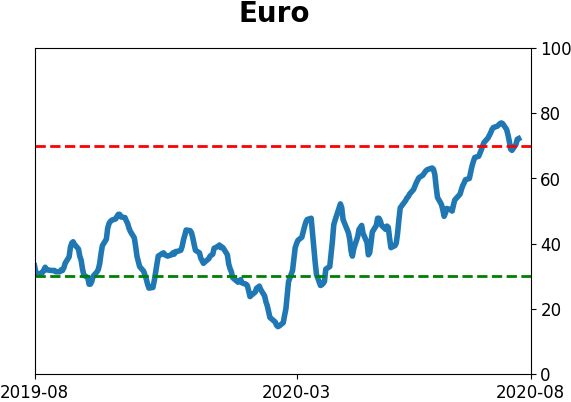
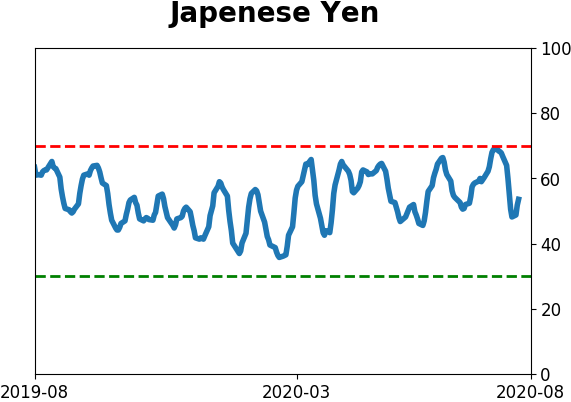
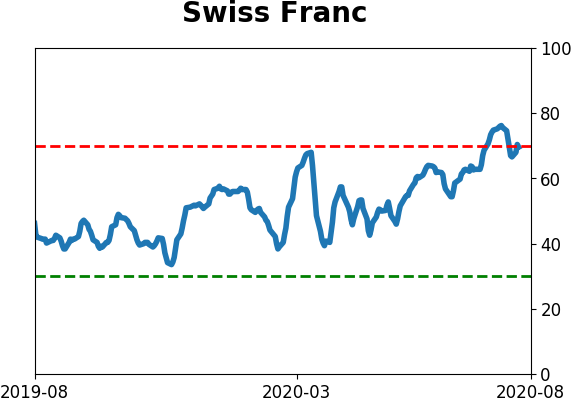
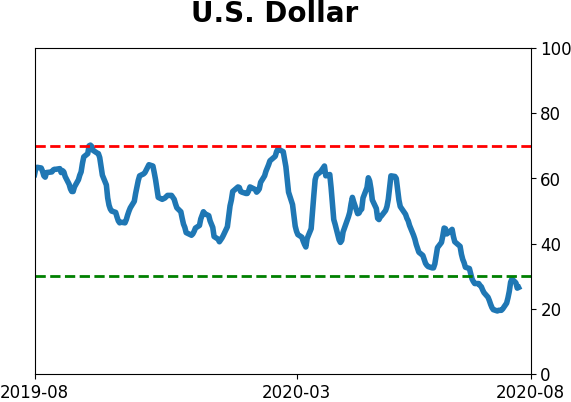
Currency ETF's - 5-Day Moving Average
|
|
|
Commodity ETF's - 5-Day Moving Average
|
|