Headlines
|
|
New highs - with asterisks:
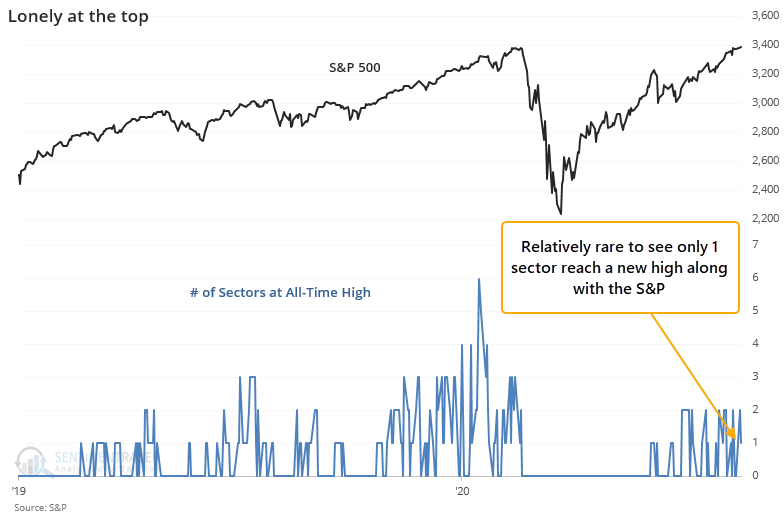
The most benchmarked index in the world finally set a new high, ending the shortest bear market in history. It did so with only a single sector following it to a new high, and with odd readings and divergences. Relatively few tech stocks are above their medium-term averages, and even fewer industries, sectors, and countries are in solid uptrends.
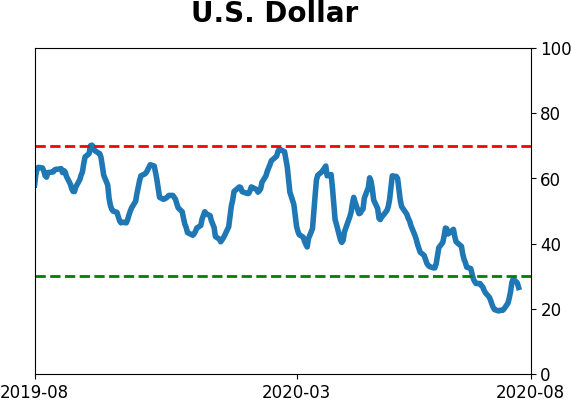
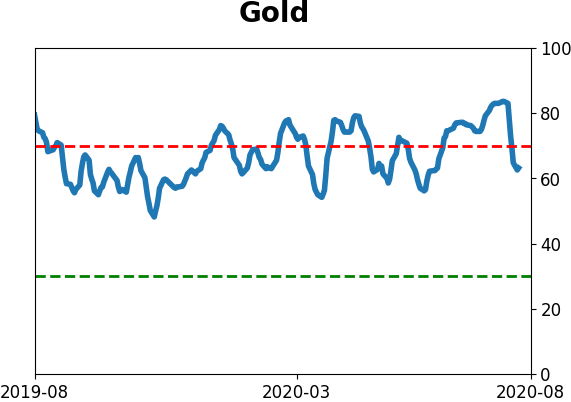
Dollar reversal: A lot of markets have keyed off of U.S. dollar. Real yields have tumbled, taking the dollar with it, helping to boost valuations of stocks and the attractiveness of gold and other commodities. On Wednesday, the dollar enjoyed a reversal. After falling more than 0.5% to a new low on Tuesday, it reversed enough to close above Tuesday high. This has often led to some quick weakness in the dollar, but 3 months later it had a good record of trading higher. This was not a good sign for gold.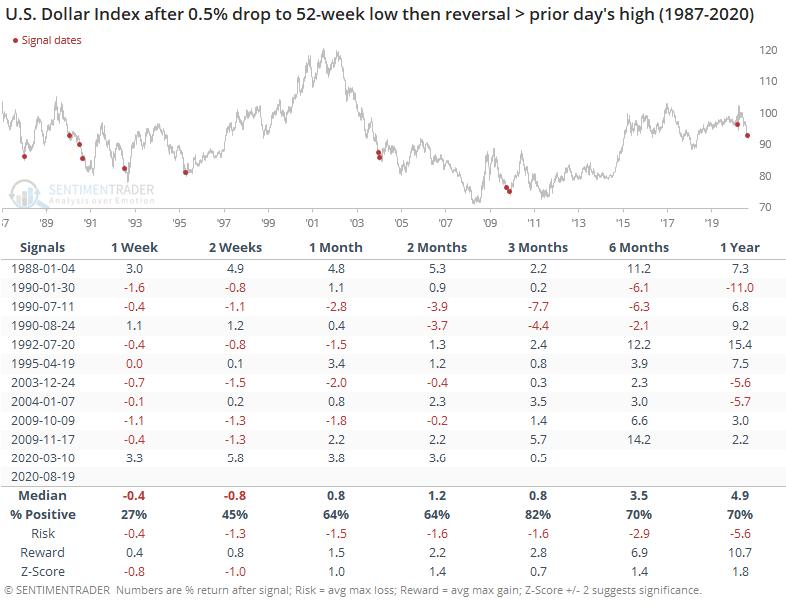 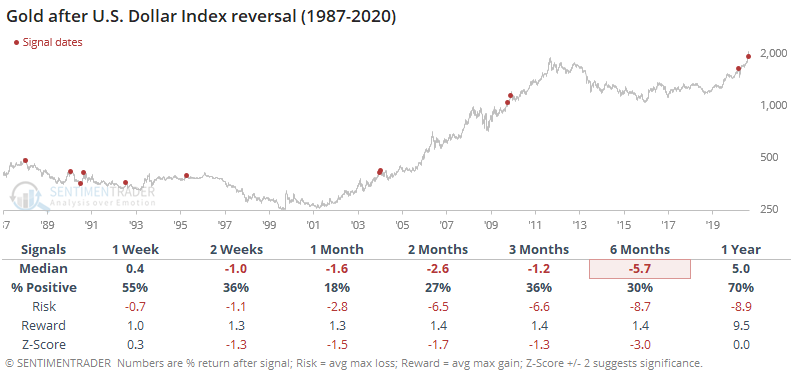
Bottom Line:
|
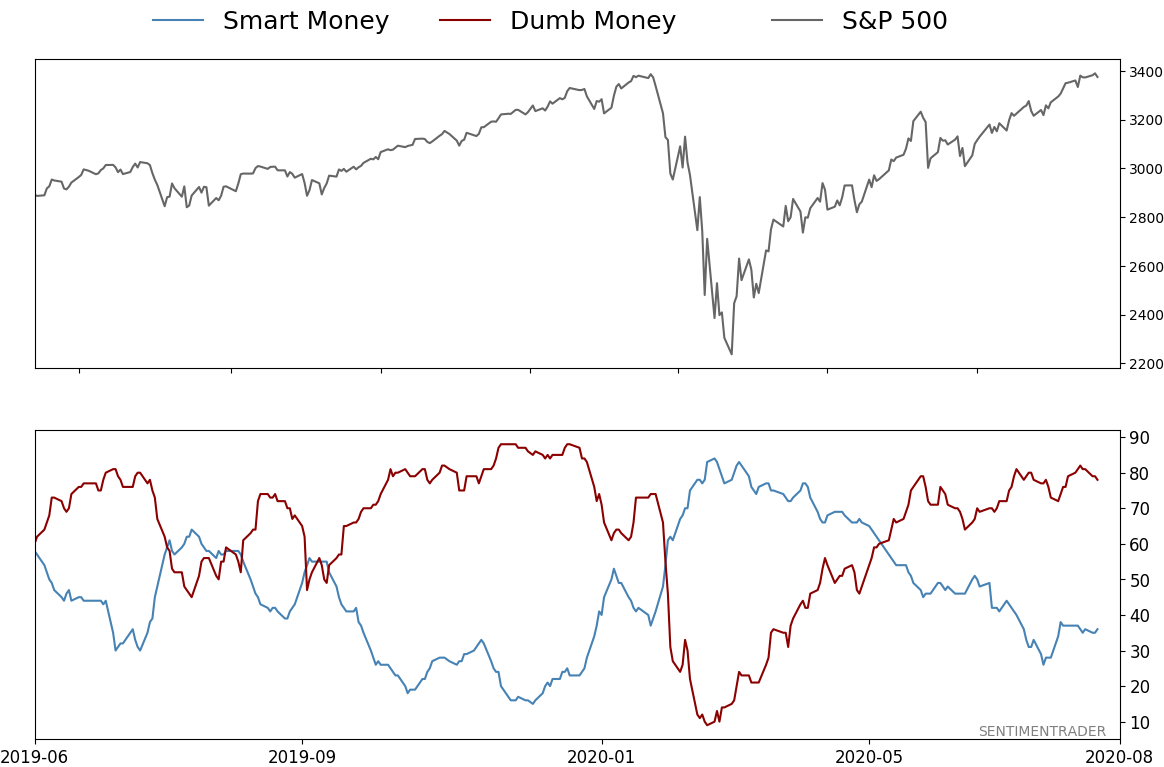
Smart / Dumb Money Confidence
|
Smart Money Confidence: 36%
Dumb Money Confidence: 78%
|
|
Risk Levels
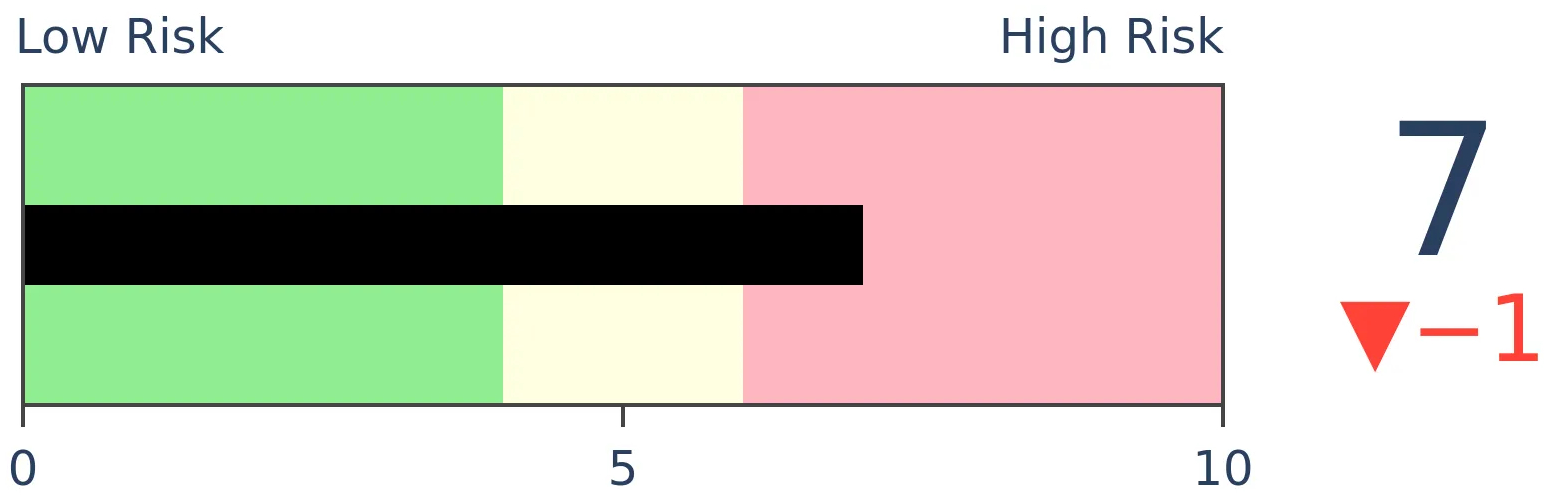
Stocks Short-Term
|
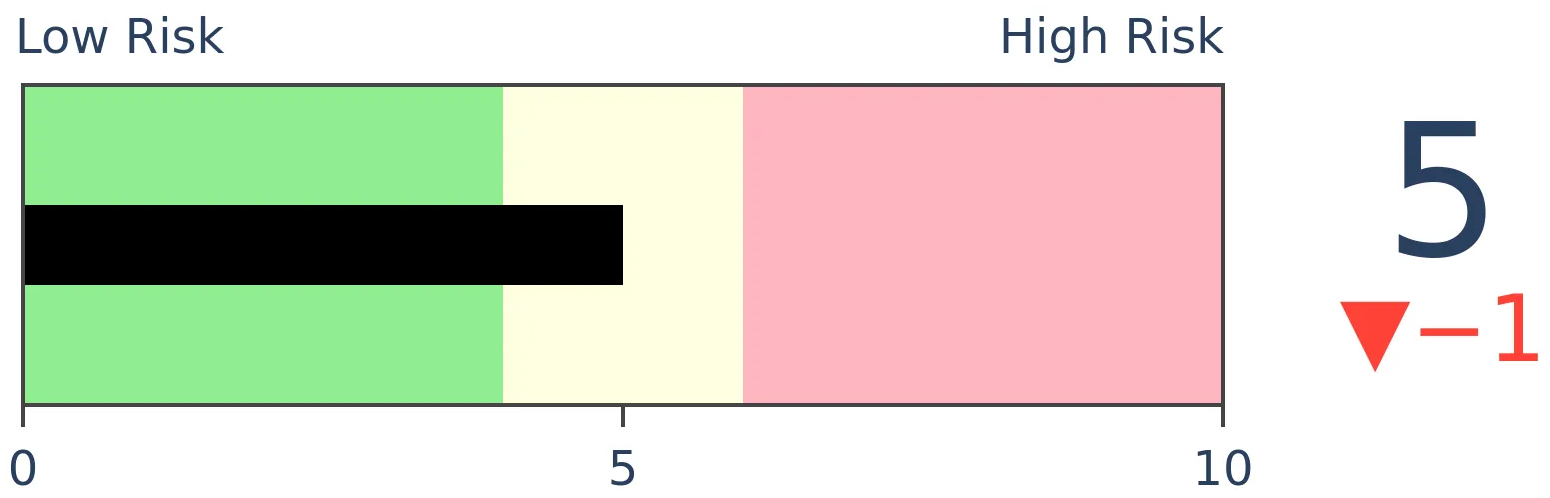
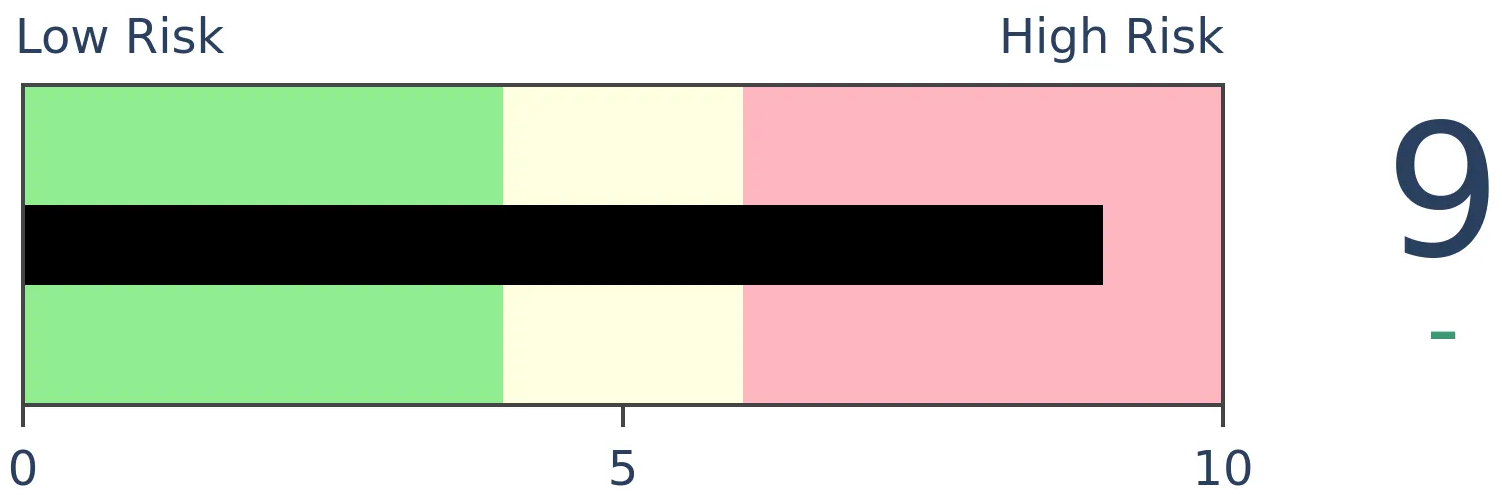
Stocks Medium-Term
|
|
Bonds
|
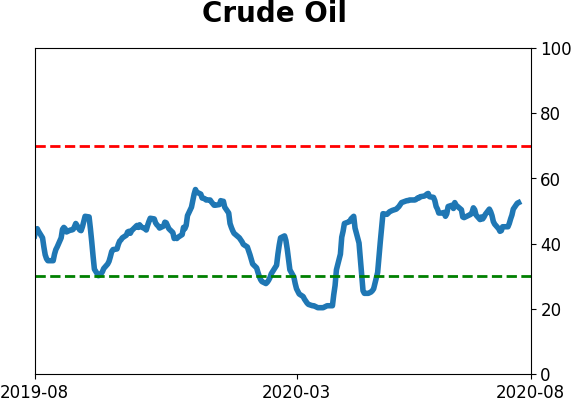
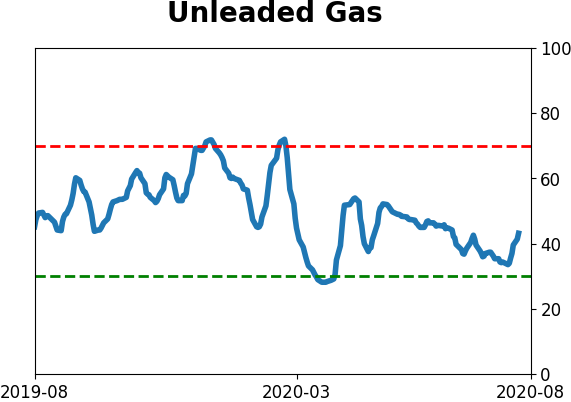
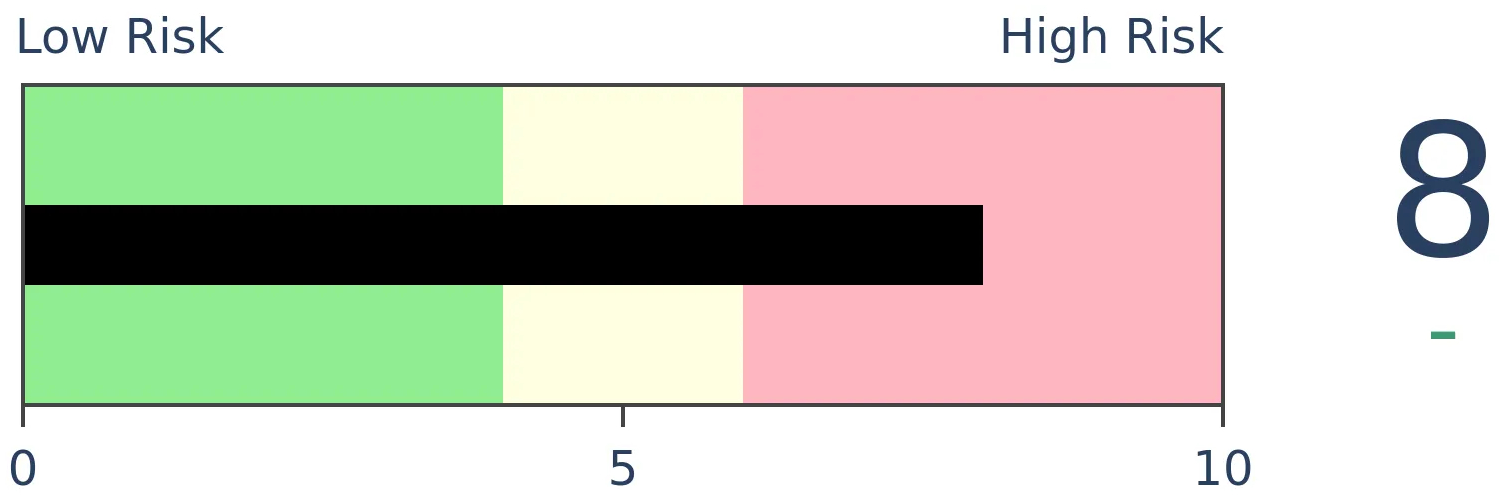
Crude Oil
|
|
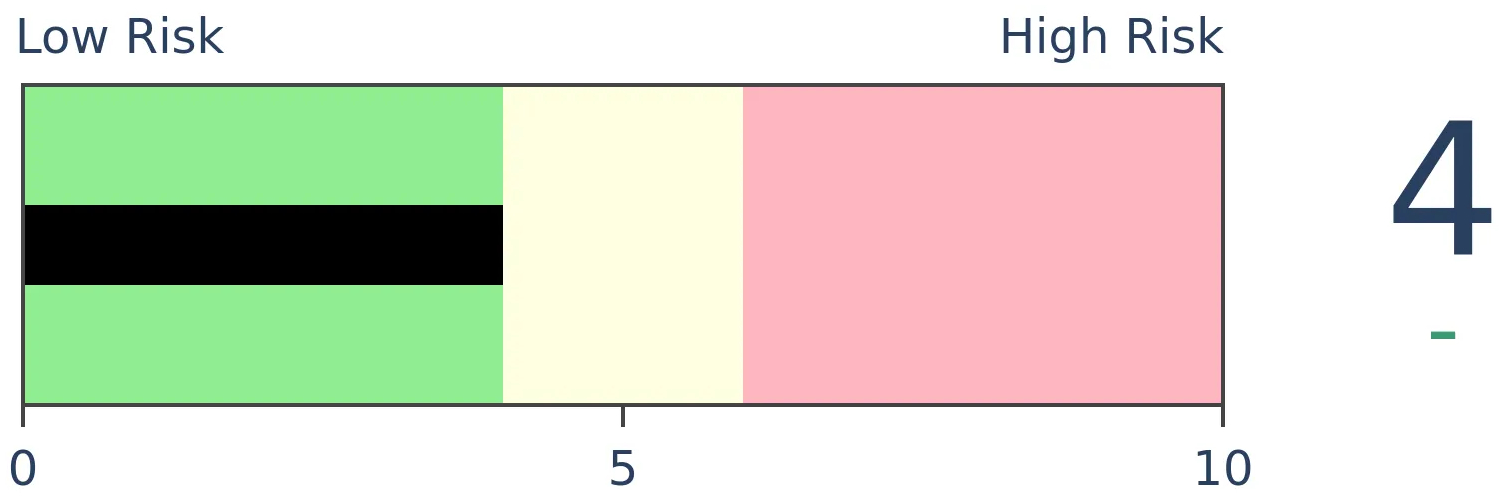
Gold

|
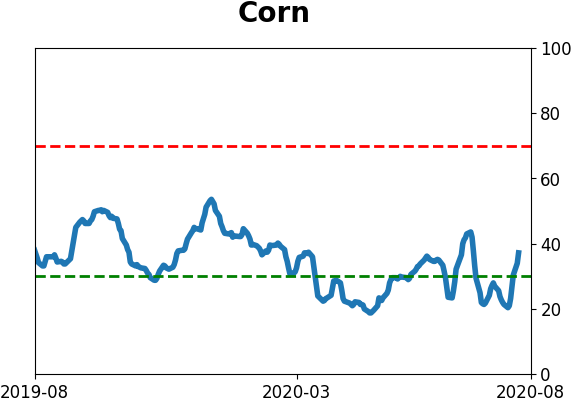
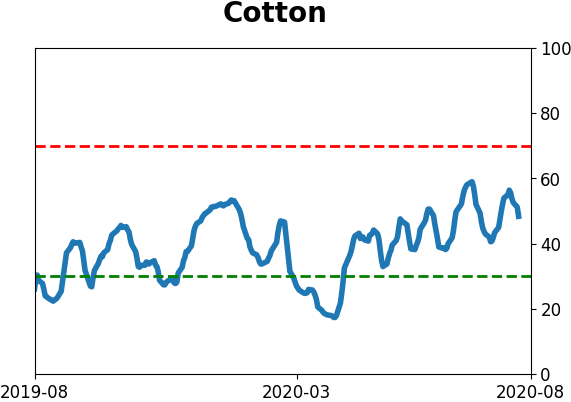
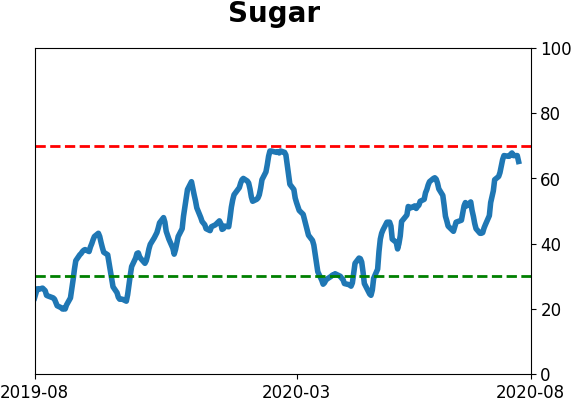
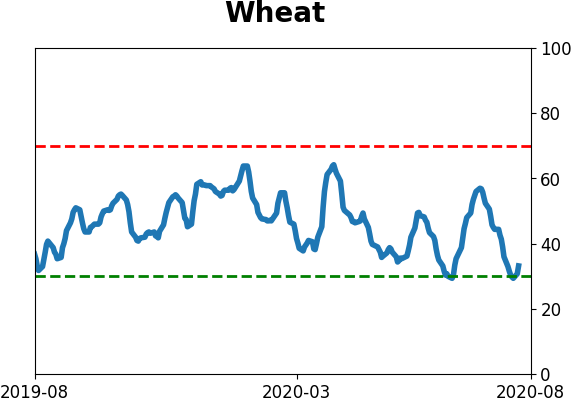
Agriculture
|
|
Research
BOTTOM LINE
The most benchmarked index in the world finally set a new high, ending the shortest bear market in history. It did so with only a single sector following it to a new high, and with odd readings and divergences. Relatively few tech stocks are above their medium-term averages, and even fewer industries, sectors, and countries are in solid uptrends.
FORECAST / TIMEFRAME
SPY -- Down, Medium-Term
|
The S&P 500 finally did what it's been trying to do for days now, and crept to a new high.
This ended its shortest bear market in history. Using the completely arbitrary definition of a 20% decline from a multi-year high, it has taken the index only 110 days to cycle to a fresh high. That's several months faster than the other fastest recoveries in 1967 and 1982. In the table below, the "# Days" column shows the number of trading days from the time the S&P fell 20% from a multi-year high to when it first hit a new high.
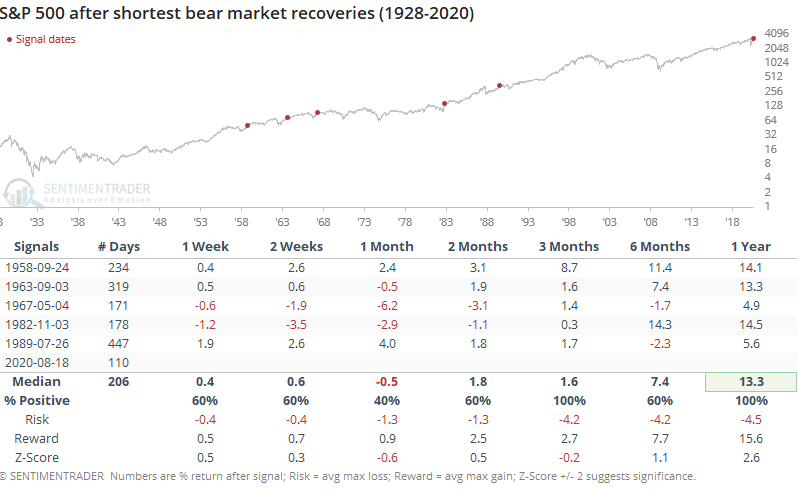
Returns were mixed over the short- to medium-term, but with limited downside, and all continued higher over the next year.
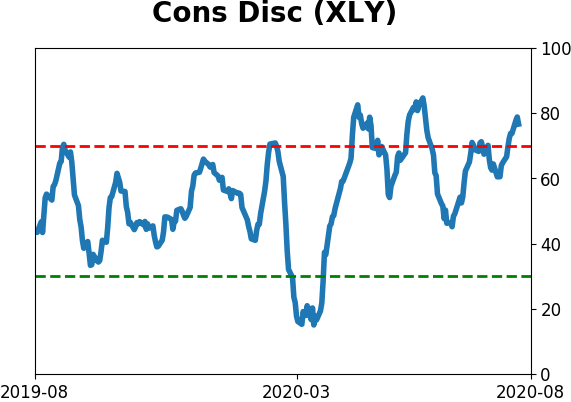
This is its first new all-time high in months, but the S&P's sectors are struggling somewhat to keep up. Only one of them, Consumer Discretionary, managed to close at an all-time high on Tuesday.
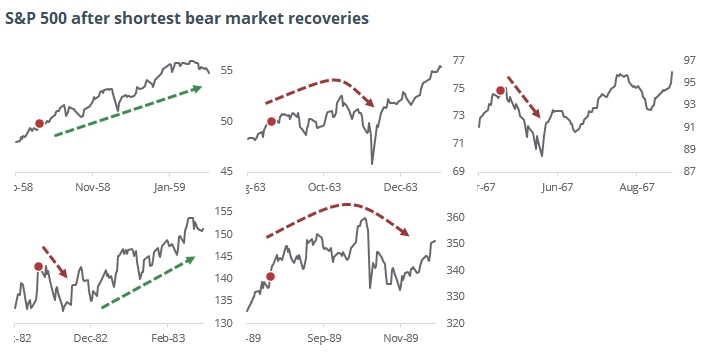
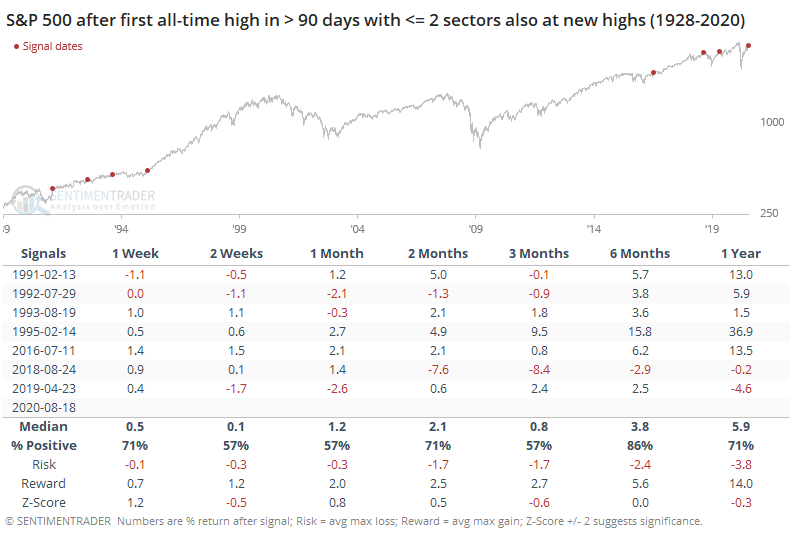
When the S&P reaches its first new high in months with only 1 or 2 sectors following suit, its future returns were mediocre with only one exception (1995).
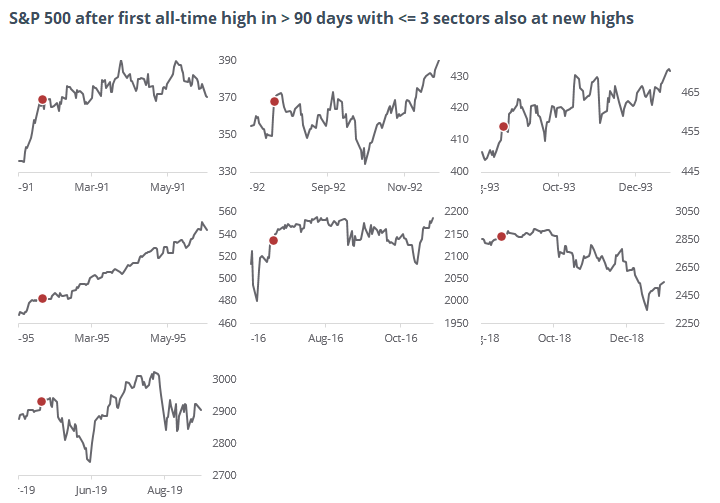
The thumbnail charts show how the S&P meandered after these signals. Again, this is excepting 1995 when it took off to the upside in one of the great "creeper" trends of all time that frustrated everyone but pure trend-followers.
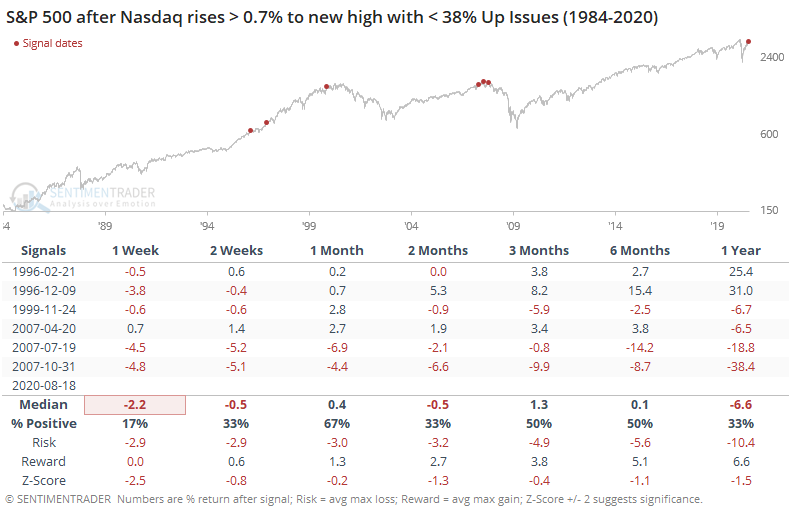
As noted yesterday, Tuesday was odd because the Nasdaq Composite rose more than 0.7%, and yet its Up Issues Ratio was only 38%, meaning that only 38% of stocks on that exchange closed higher than where they closed on Monday.
That's an exceptionally weak reading for a day like that for the Composite. It didn't lead to great returns for the broader market.
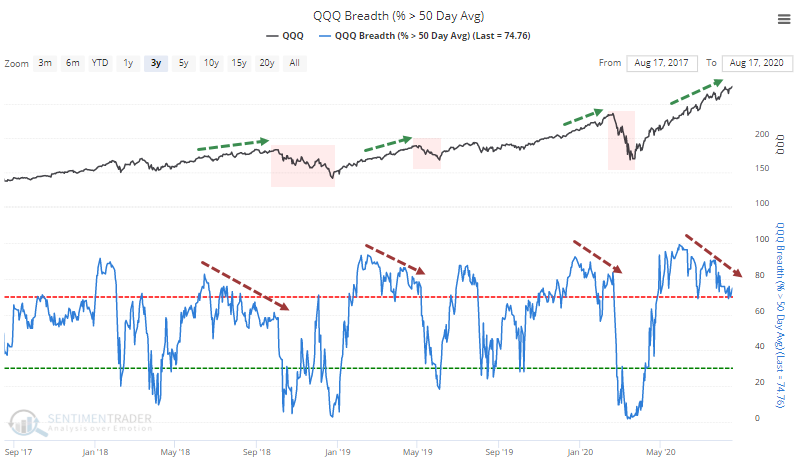
Even among the roaring tech stocks, there are some divergences popping up. We don't place much weight on these because they can persist for a long time before they matter (if they even do). Still, other times in recent years when the divergence has persisted list this, those shorter-term gains were erased during subsequent pullbacks.
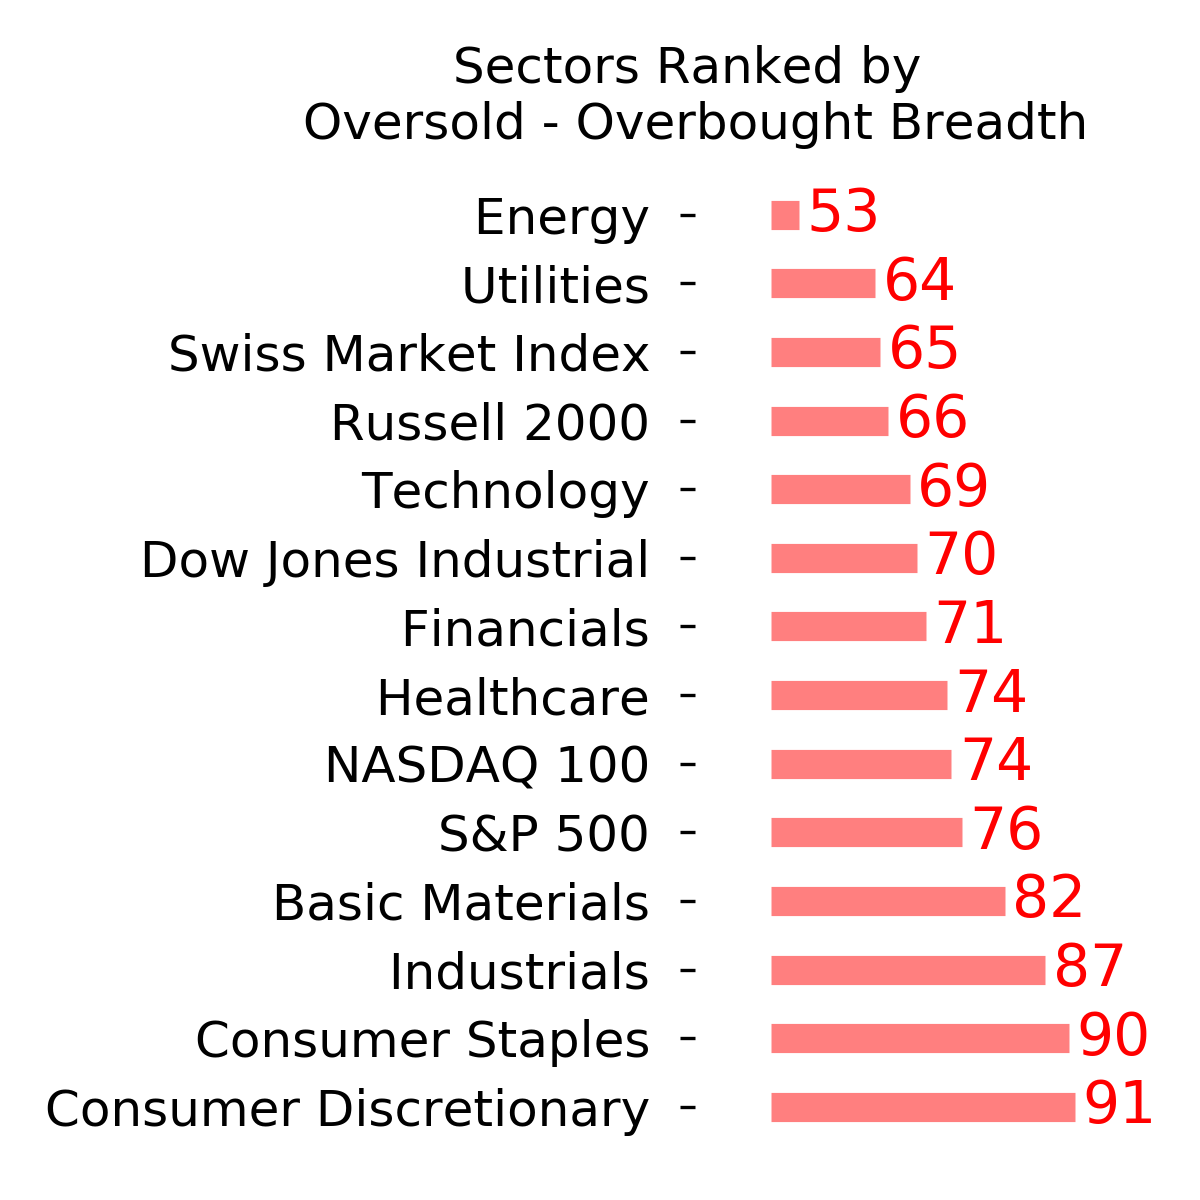
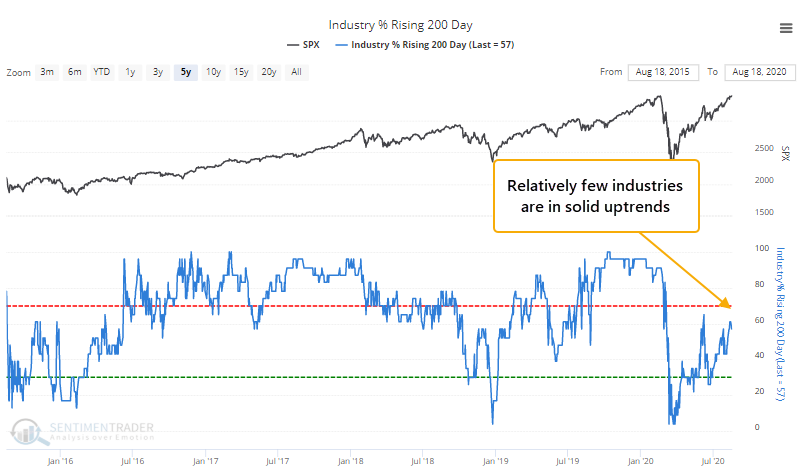
It's also odd to see a new high in an index like the S&P 500 with so few of its industries in solid uptrends. Only 57% of industries have a rising 200-day moving average.
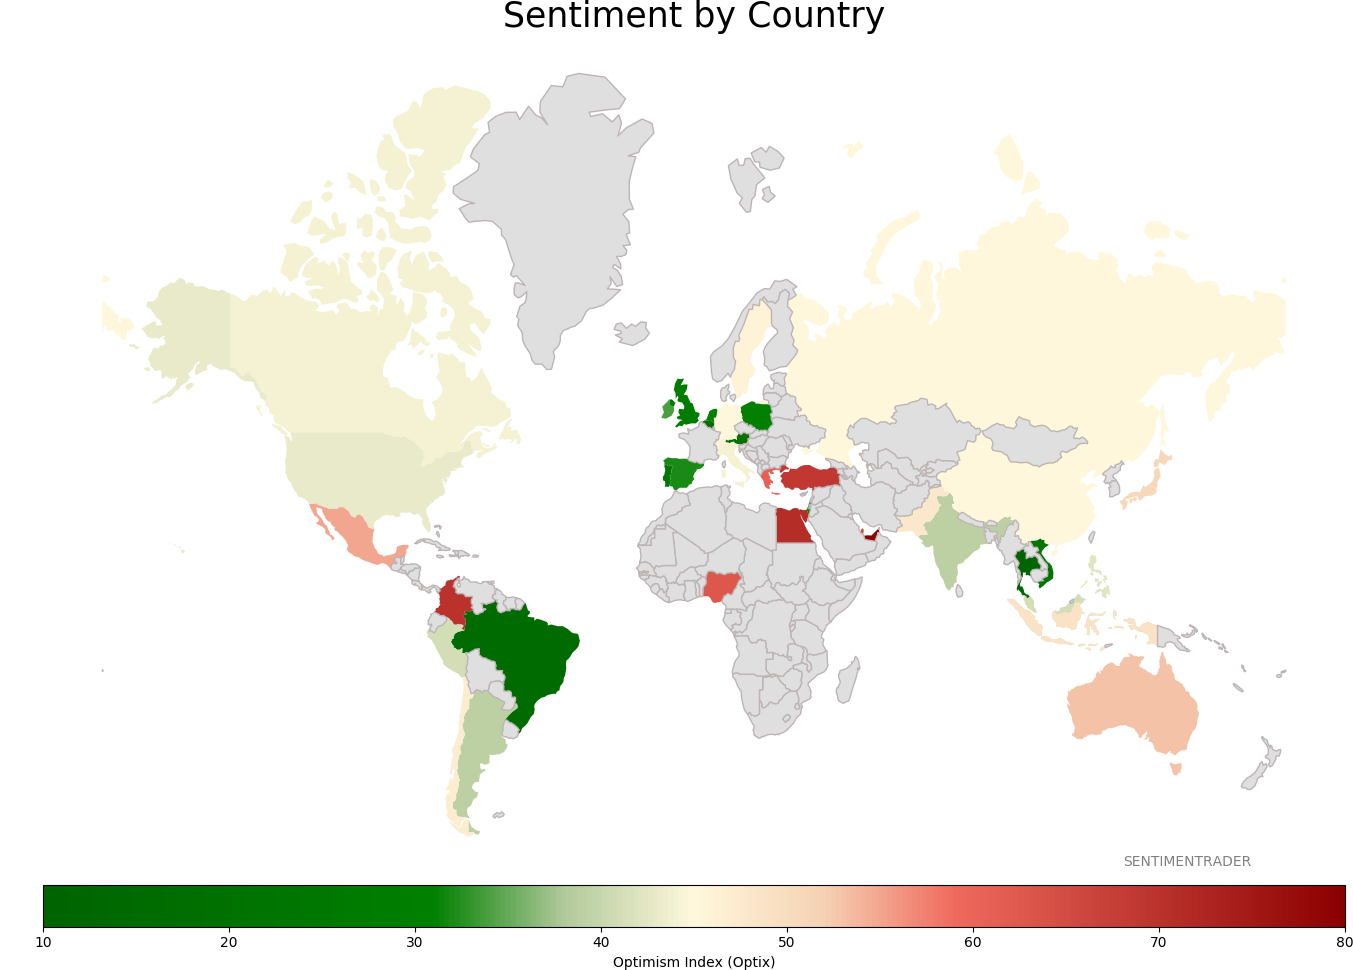
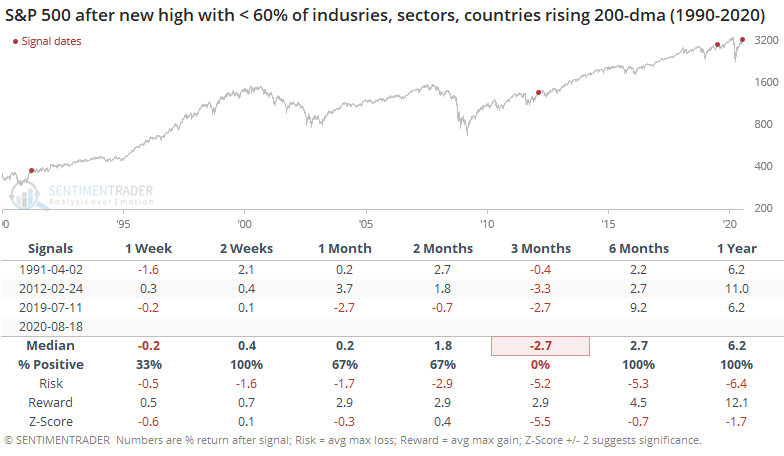
Even worse, only 55% of sectors have a rising average, and a pathetic 23% of countries do. There have only been three times in 30 years when the S&P hit a high and no more than 60% of industries, sectors, and countries were in solid uptrends.
We've seen a lot of these oddities over the last few weeks, and yet here we are talking about new all-time highs in the major indexes. Clearly, "odd" hasn't mattered.
It's possible that we've focused too much on minutiae (it's always possible to complain about something) and we're in the midst of another one of those nothing-matters markets like '95, '13 or '17 (and part of '19). So far, the signs are pointing that way because, well, we're sitting at new highs. We've seen factors like this (sketchy market environment, high optimism, odd breadth readings) enough times over the past 20 years to still put a lot of weight on them, acknowledging that sometimes they simply fail. Maybe this is one of those times, with the breadth thrusts, recoveries, and trend changes from the spring totally overwhelming everything else, not to mention, of course, the fiscal and monetary backstops. I don't know. The only thing I know is that I don't like betting on "this time is different" and that means believing that risk is still high, accepting the idea that it's wrong and the creeper trend will persist.
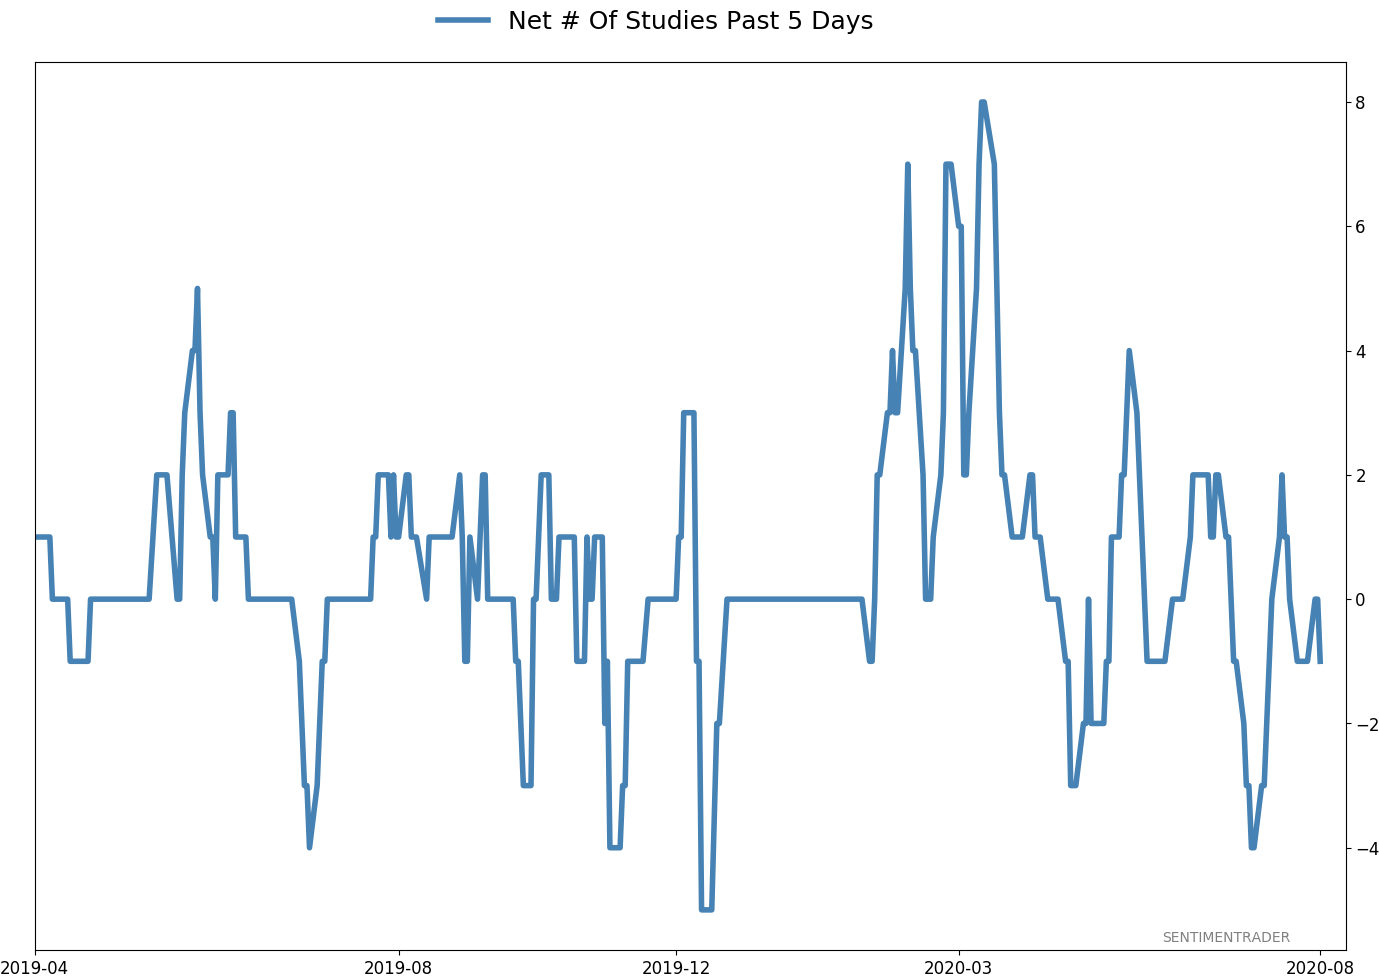
Active Studies
| Time Frame | Bullish | Bearish | | Short-Term | 0 | 1 | | Medium-Term | 8 | 13 | | Long-Term | 46 | 1 |
|
Indicators at Extremes
Portfolio
| Position | Weight % | Added / Reduced | Date | | Stocks | 29.8 | Reduced 9.1% | 2020-06-11 | | Bonds | 0.0 | Reduced 6.7% | 2020-02-28 | | Commodities | 5.2 | Added 2.4%
| 2020-02-28 | | Precious Metals | 0.0 | Reduced 3.6% | 2020-02-28 | | Special Situations | 0.0 | Reduced 31.9% | 2020-03-17 | | Cash | 65.0 | | |
|
Updates (Changes made today are underlined)
After stocks bottomed on March 23rd, they enjoyed a historic buying thrust and retraced a larger amount of the decline than "just a bear market rally" tends to. Through June, there were signs of breadth thrusts, recoveries, and trend changes that have an almost unblemished record at preceding higher prices over a 6-12 month time frame. On a shorter-term basis, our indicators have been showing high optimism, with Dumb Money Confidence recently above 80%, along with signs of reckless speculation during what appears to be an unhealthy market environment, historically a bad combination. While there are certainly some outlier indicators that are showing apathy or even outright pessimism, a weight-of-the-evidence approach suggests high risk over a multi-week to multi-month time frame. I've been carrying a low (too low) level of exposure to stocks, as well as bonds and gold. I don't see a good opportunity to add to any of those currently, with poor prospects pretty much all the way around. As worried as I am over the medium-term, I would only grudgingly reduce my exposure even further given the longer-term positives we spent so much time discussing in the spring. At this point, I would only look seriously at lowering exposure further if the S&P 500 drops below approximately 3220, an initial sign that its recent mini-breakout had failed.
RETURN YTD: -2.5% 2019: 12.6%, 2018: 0.6%, 2017: 3.8%, 2016: 17.1%, 2015: 9.2%, 2014: 14.5%, 2013: 2.2%, 2012: 10.8%, 2011: 16.5%, 2010: 15.3%, 2009: 23.9%, 2008: 16.2%, 2007: 7.8%
|
|
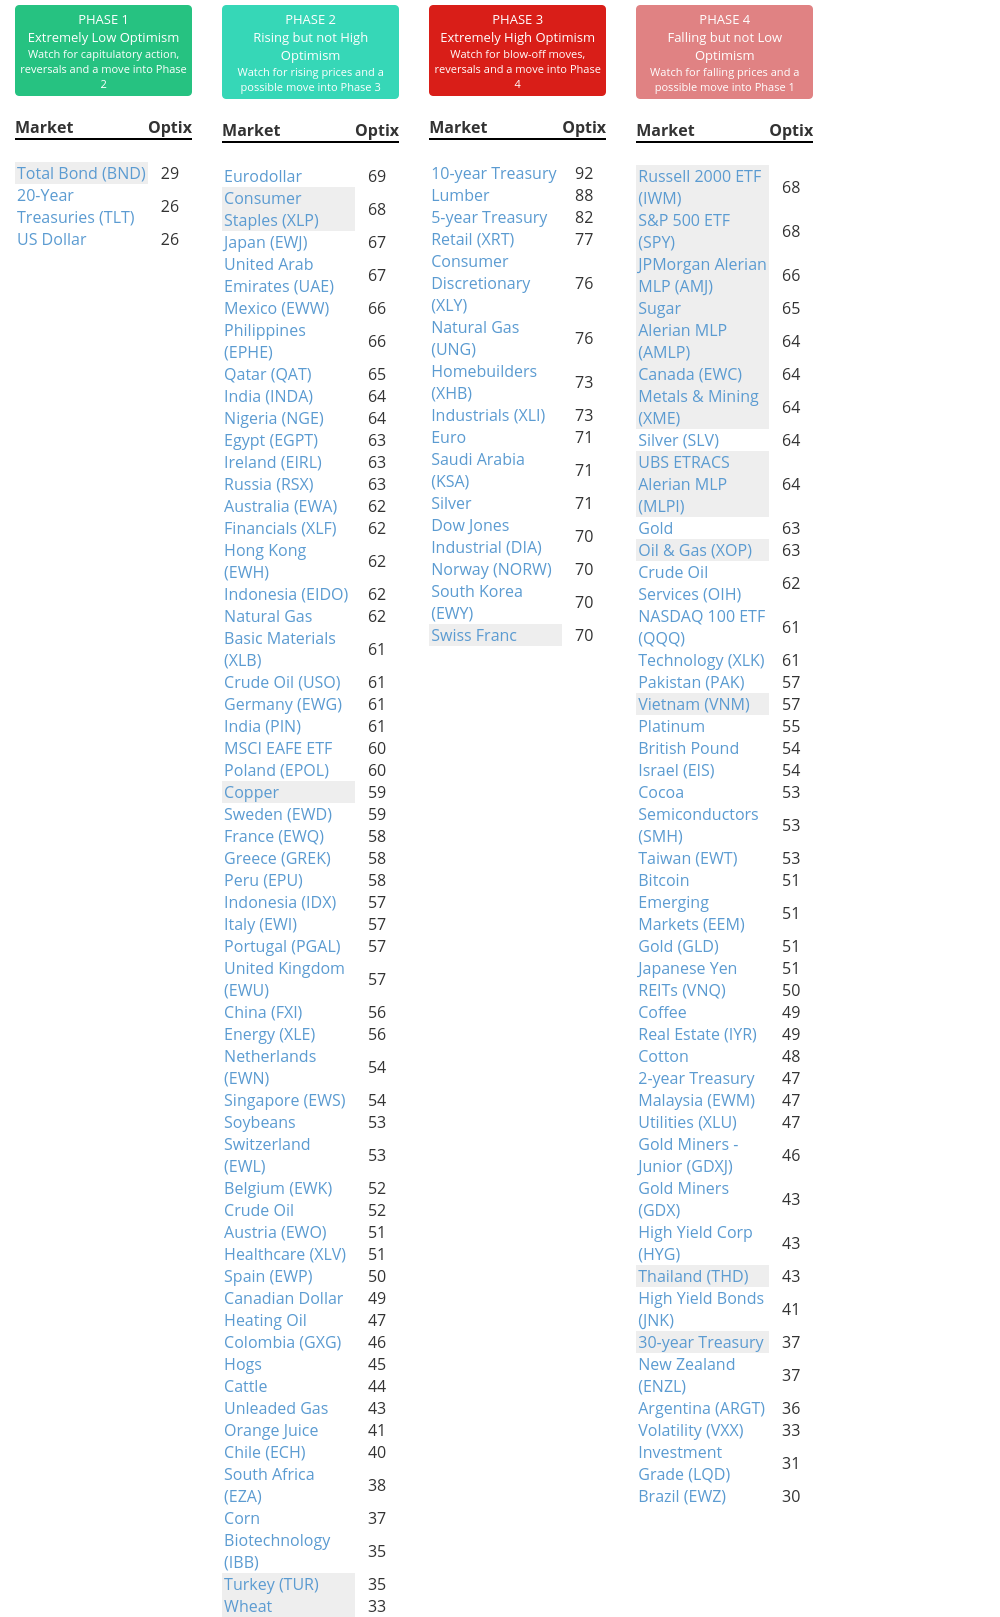
Phase Table
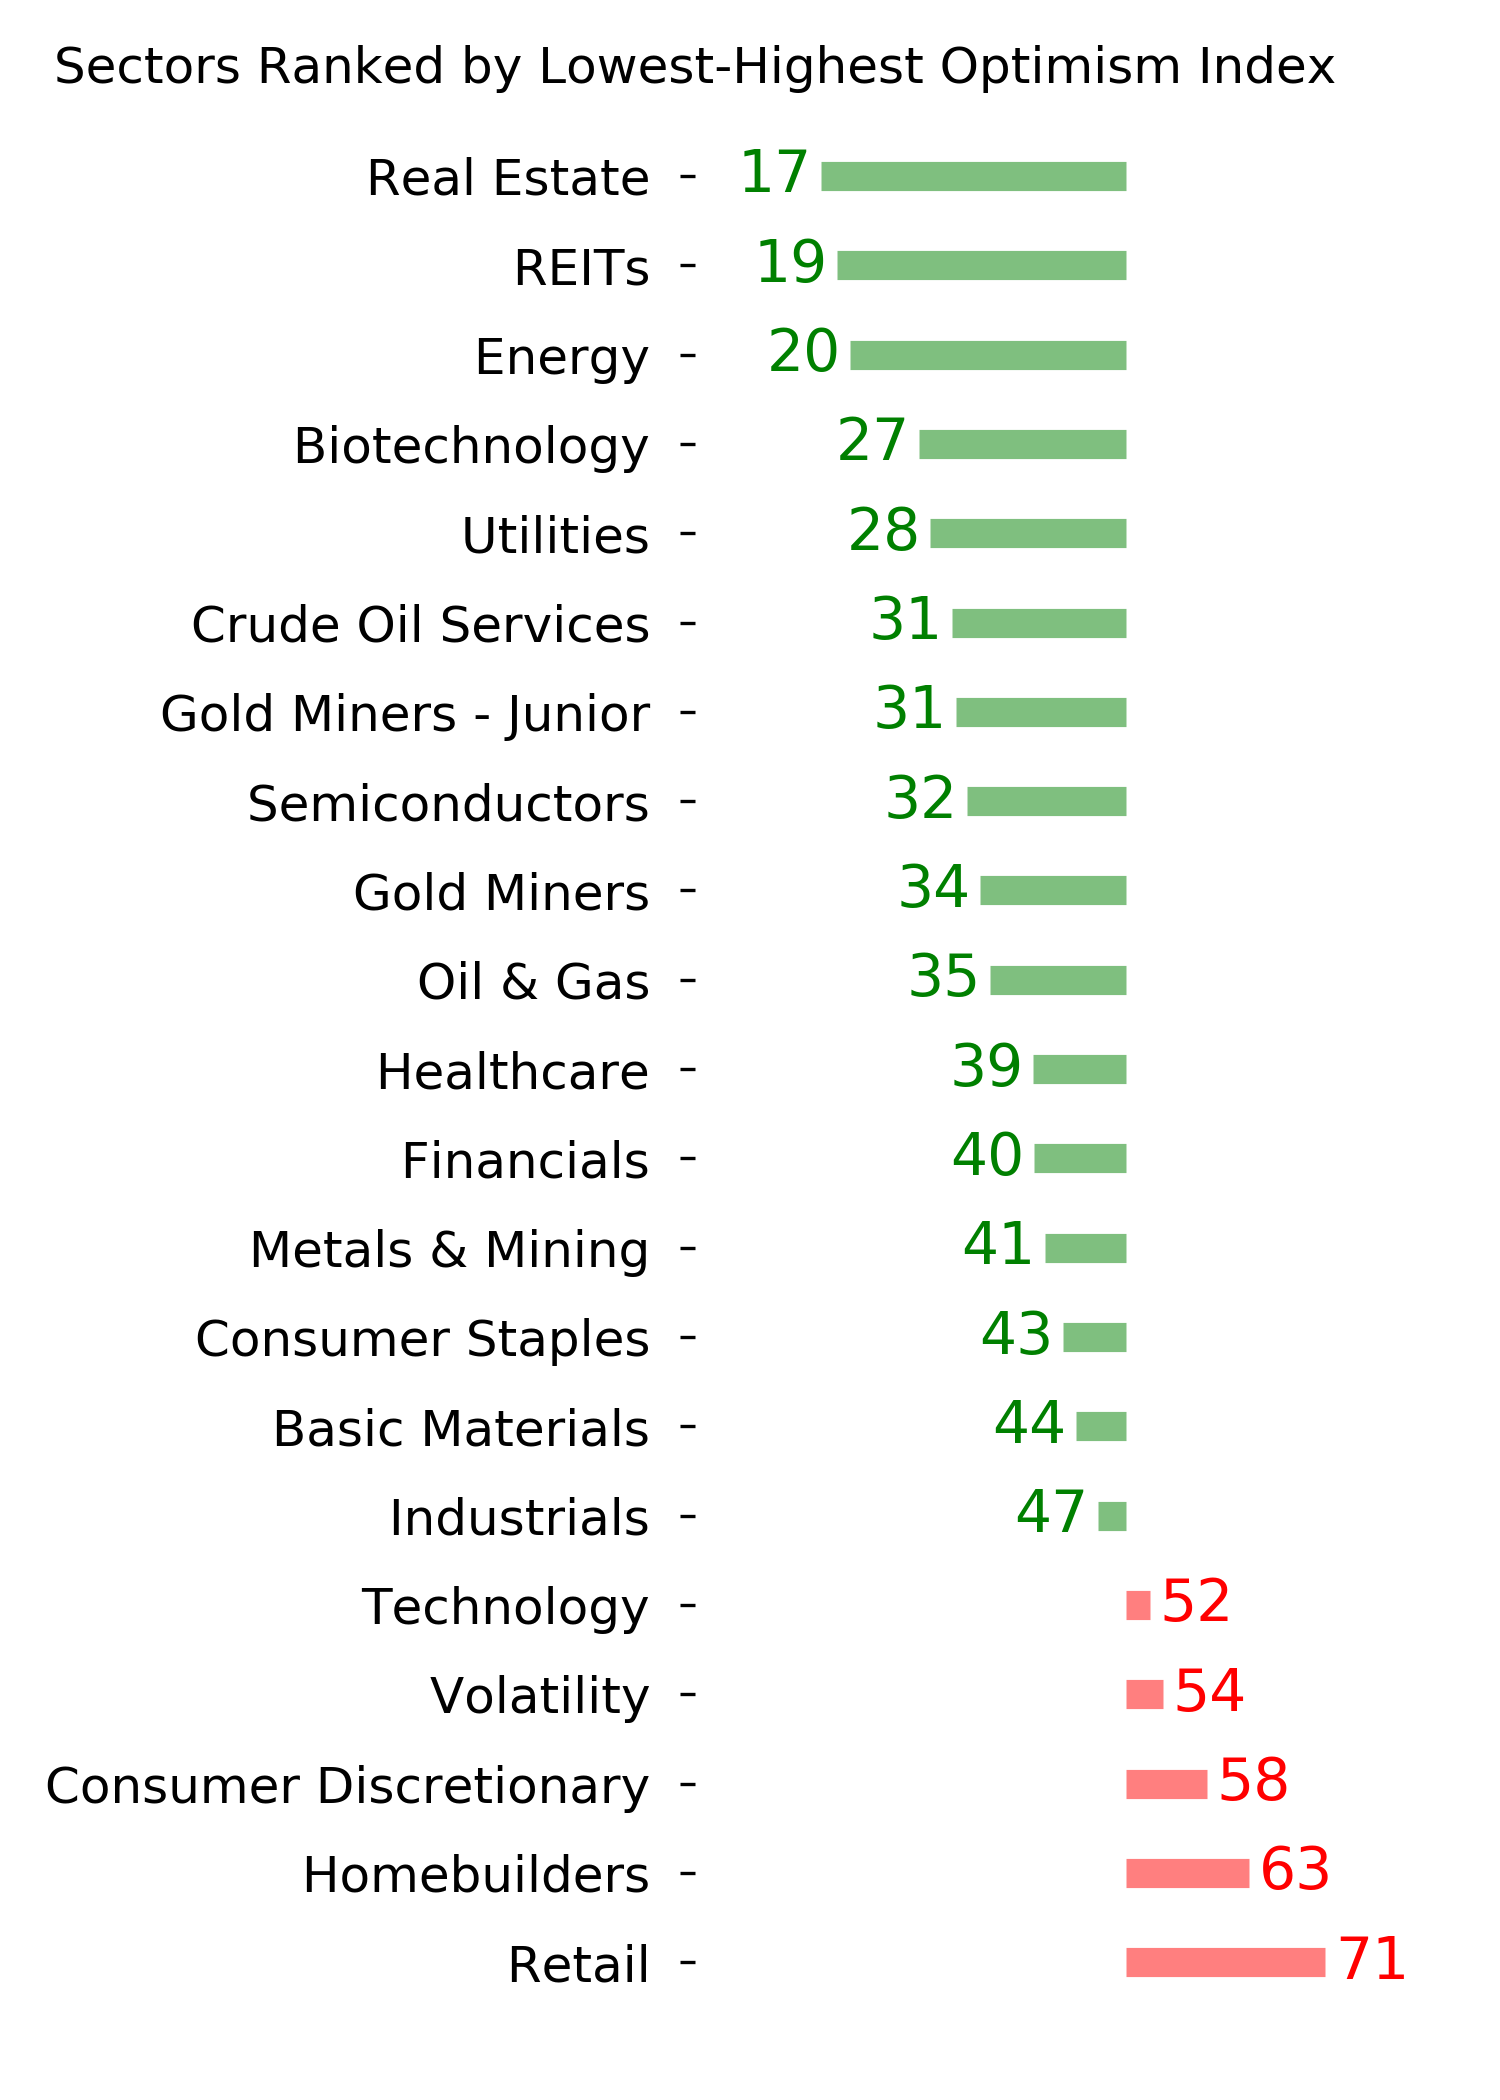
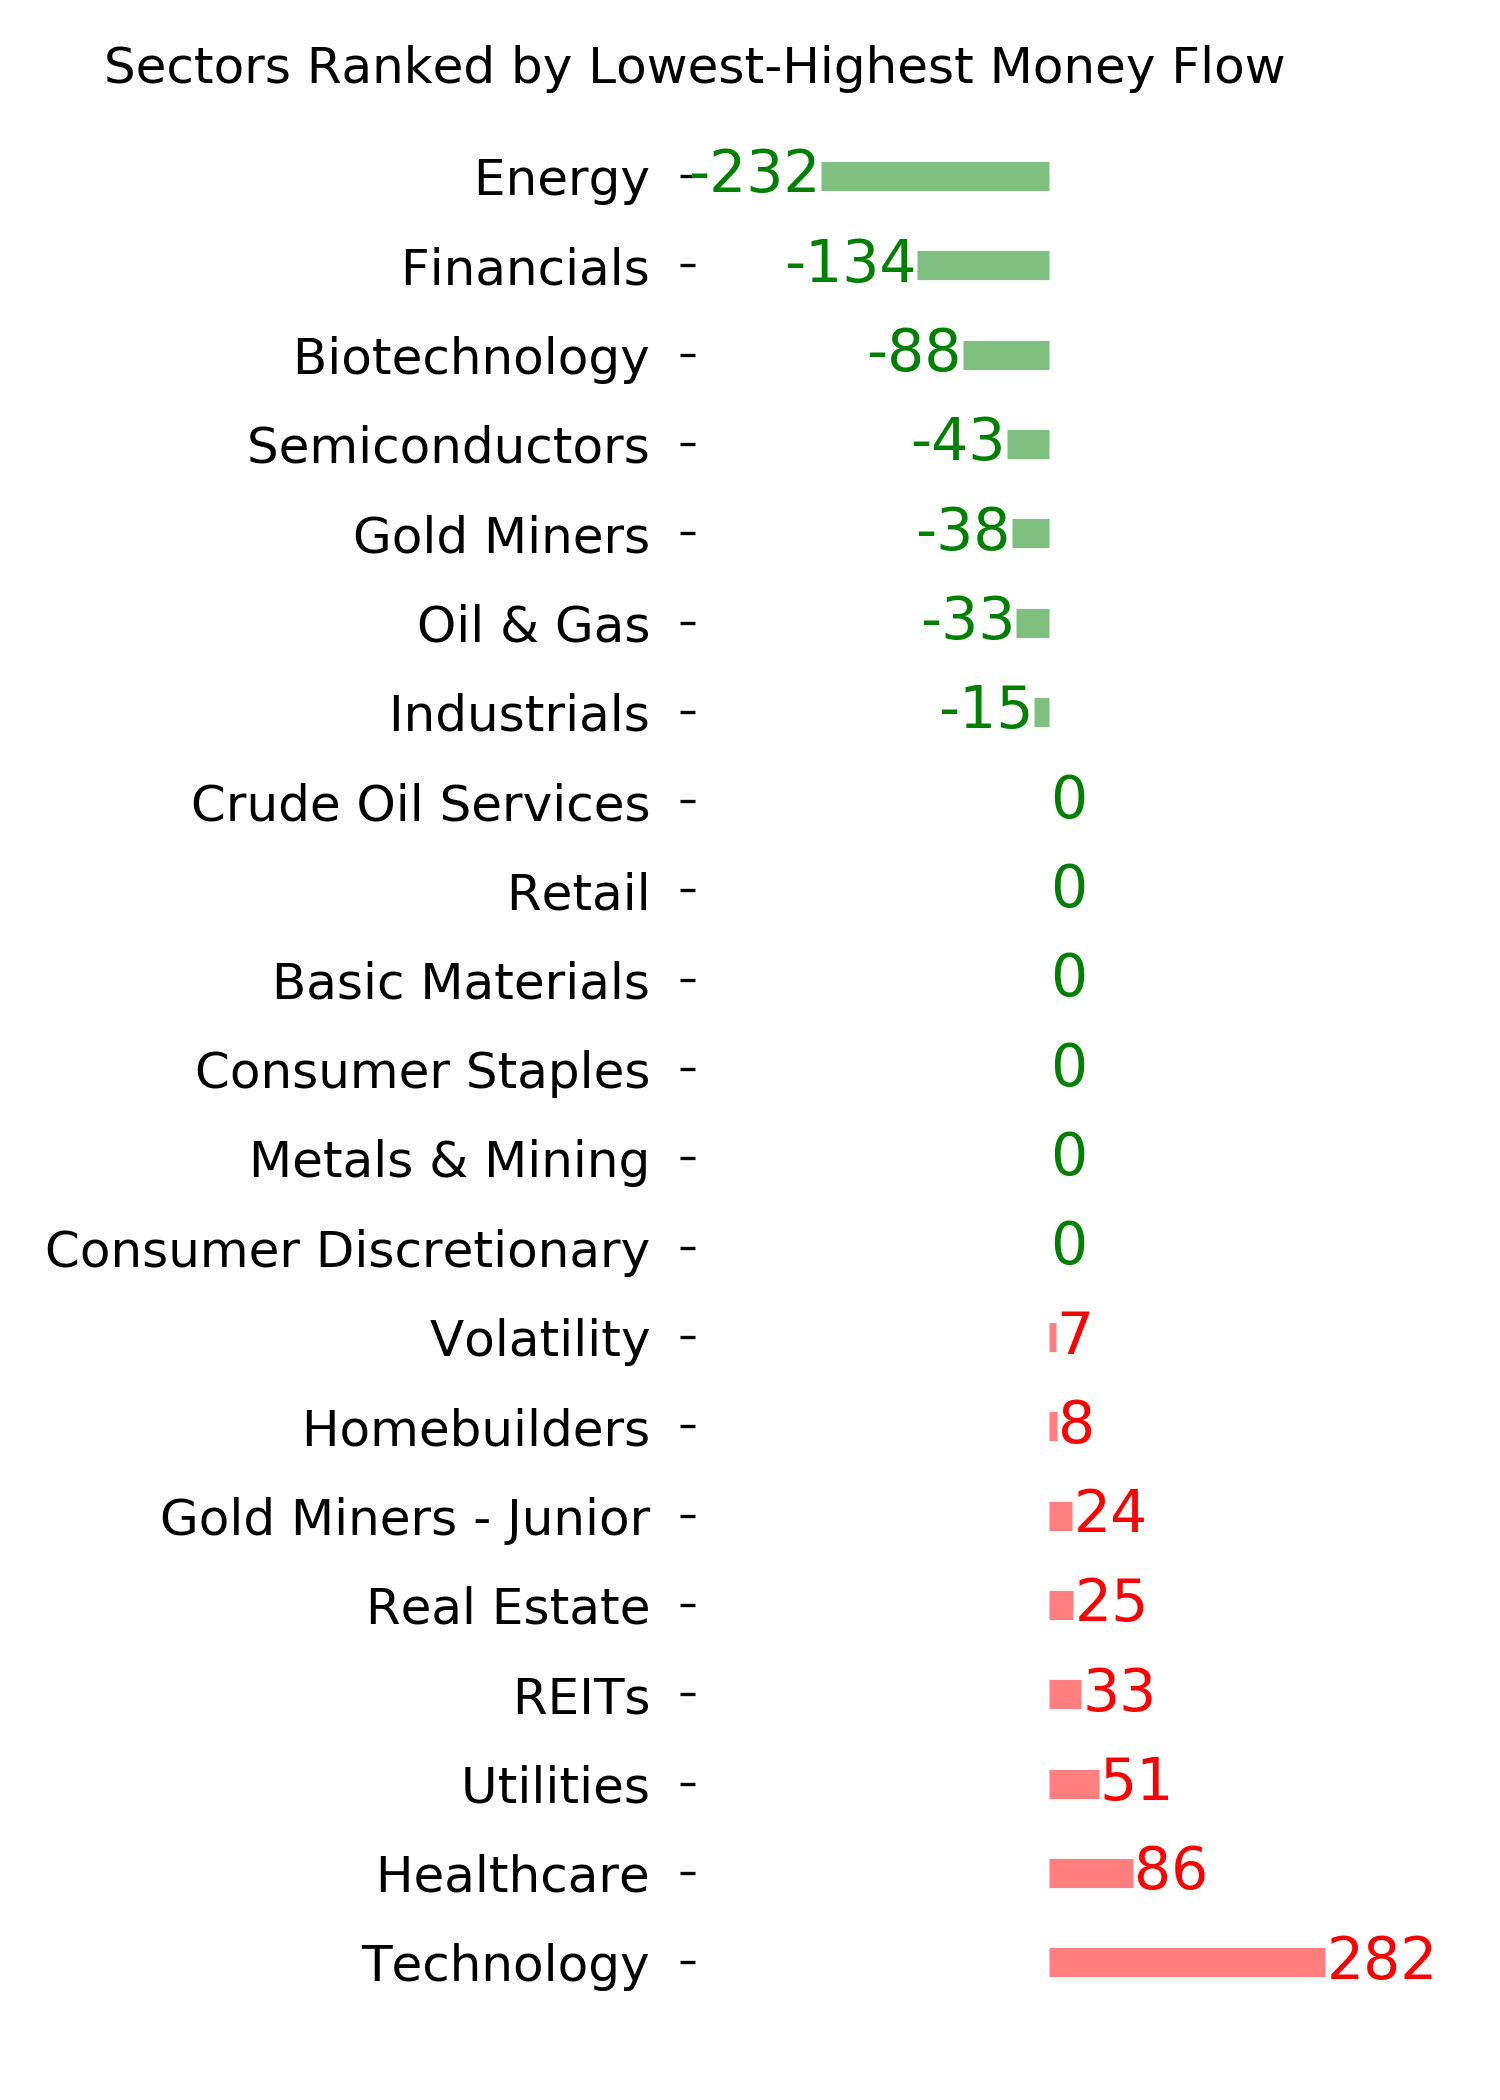
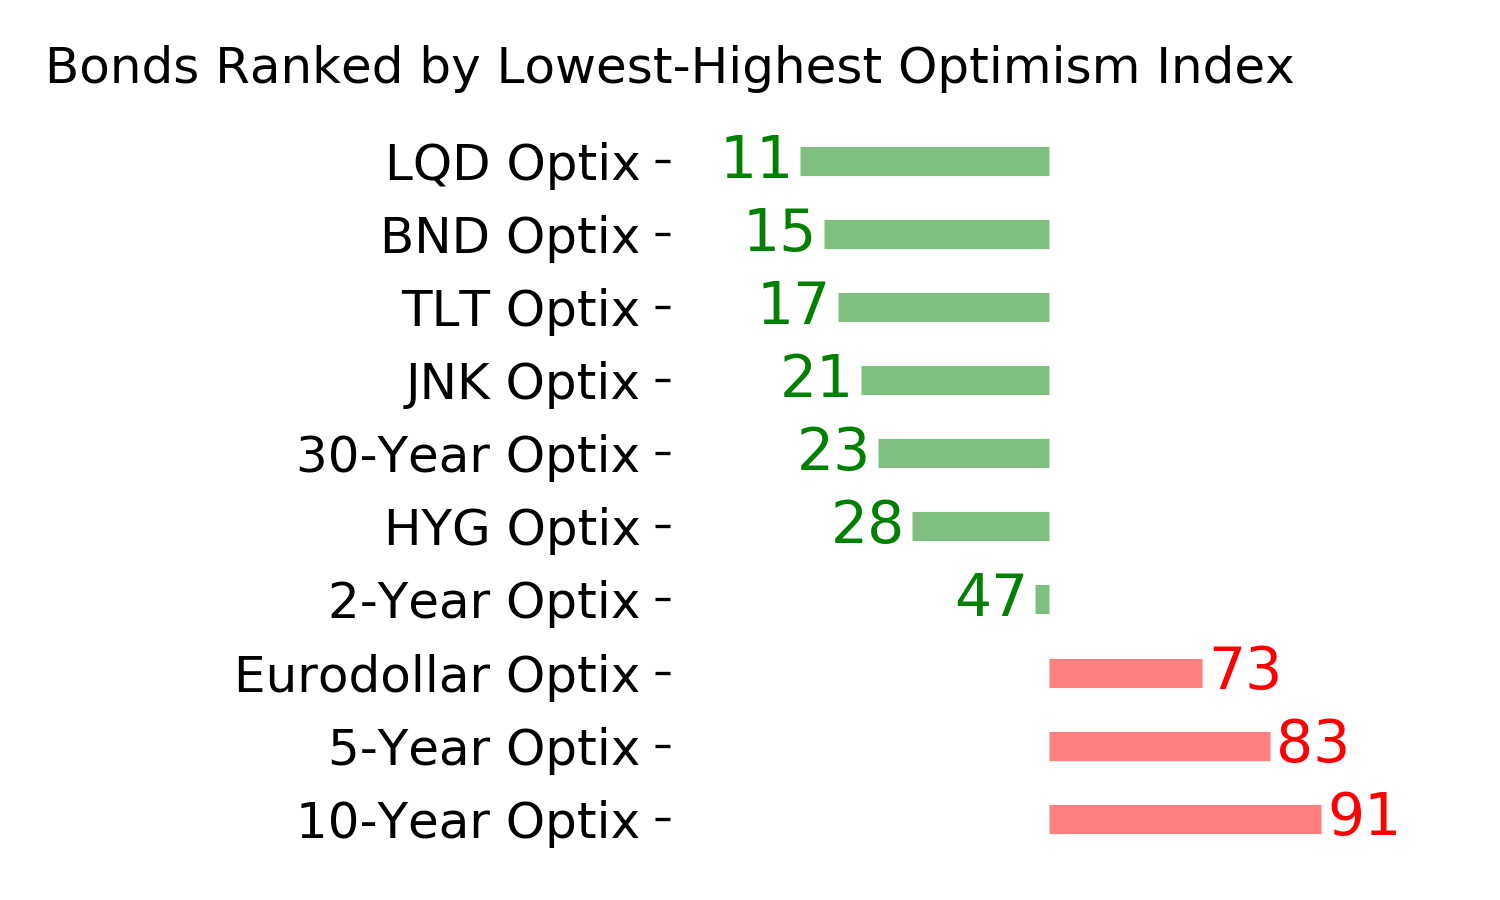
Ranks
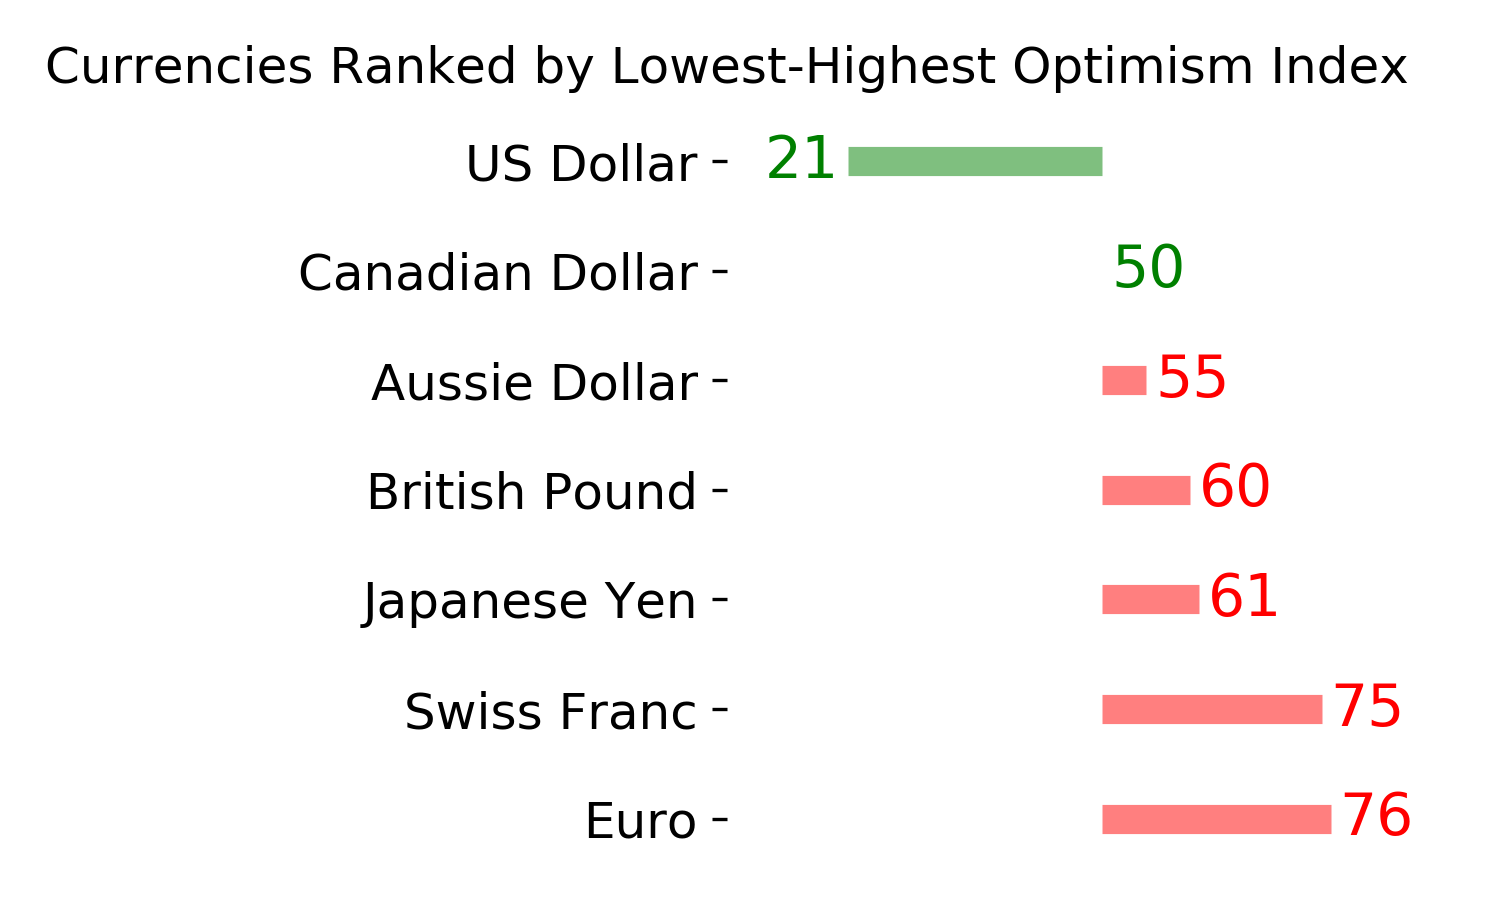
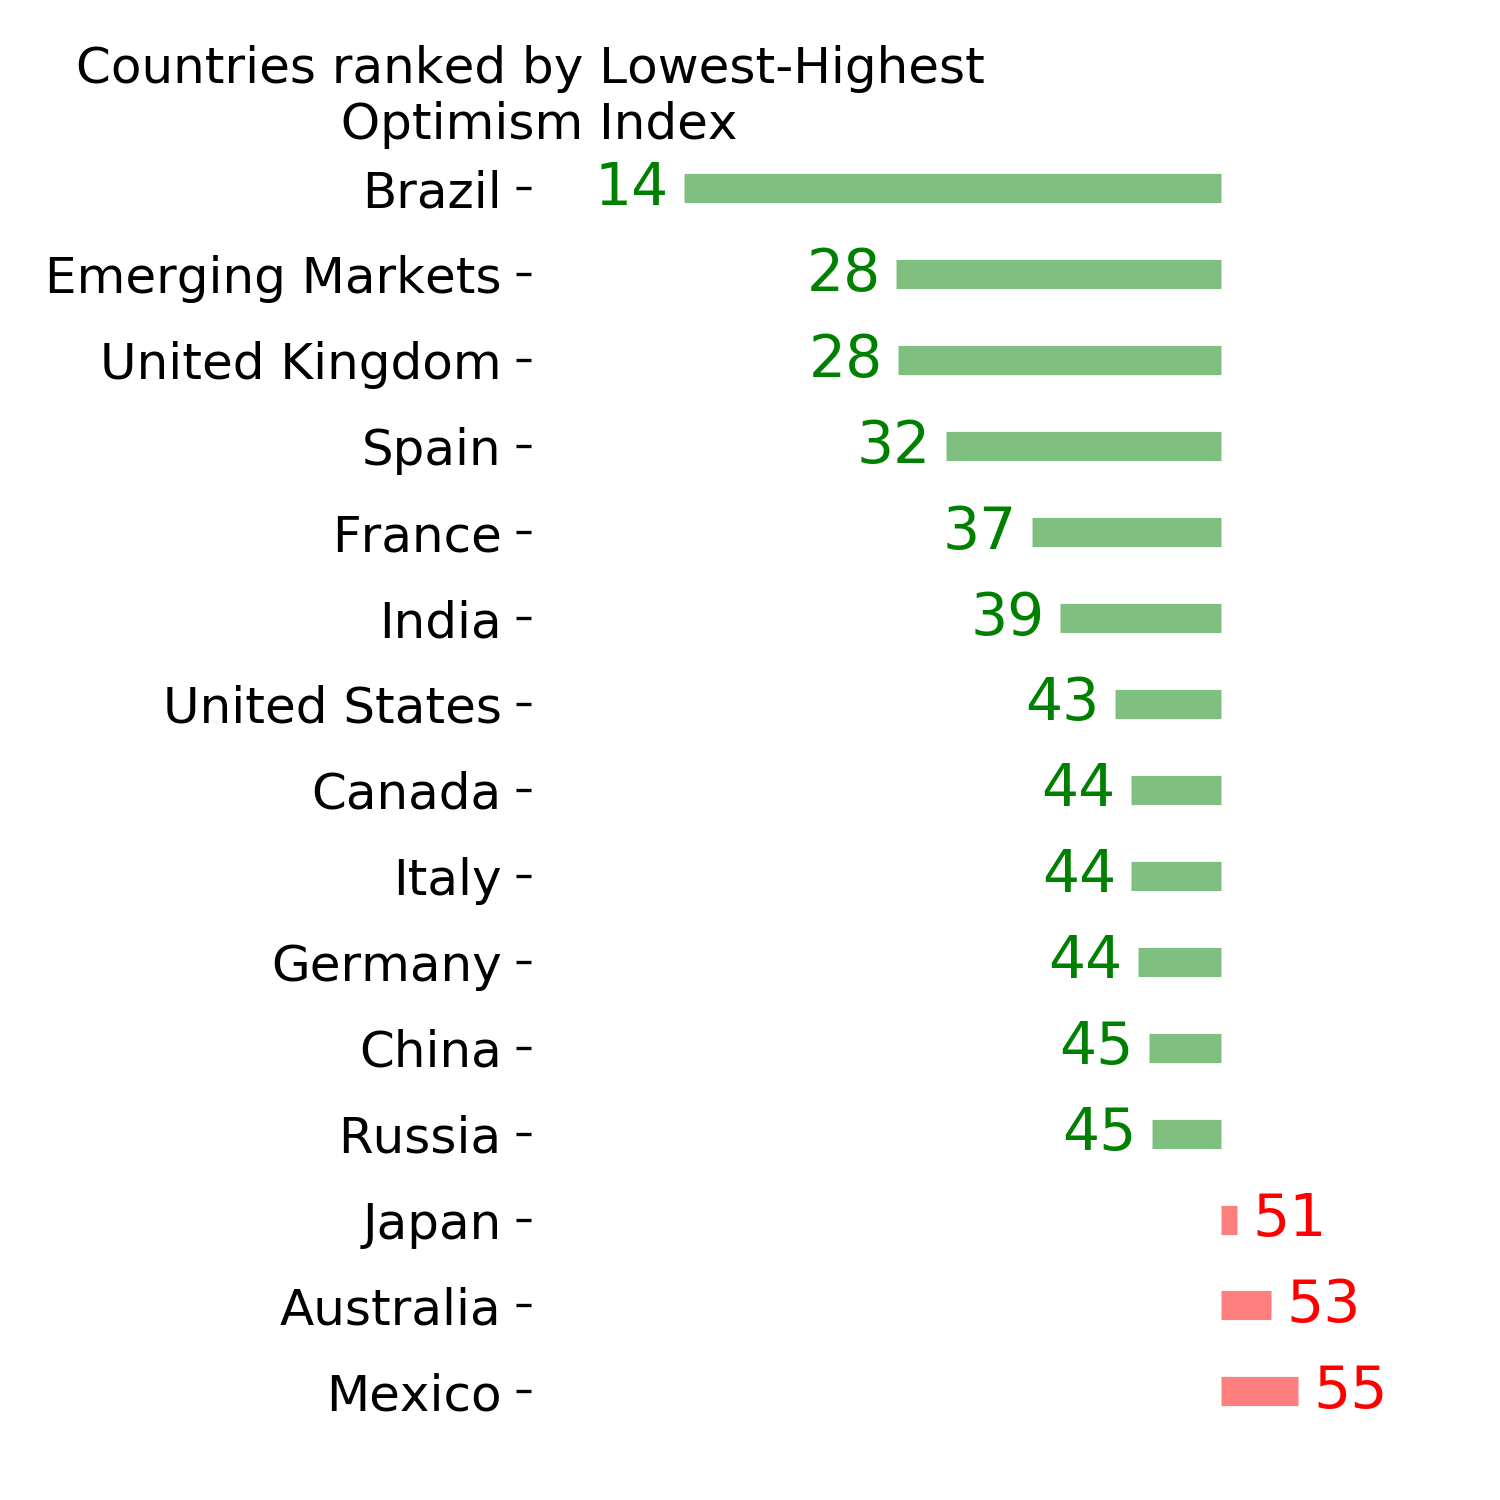
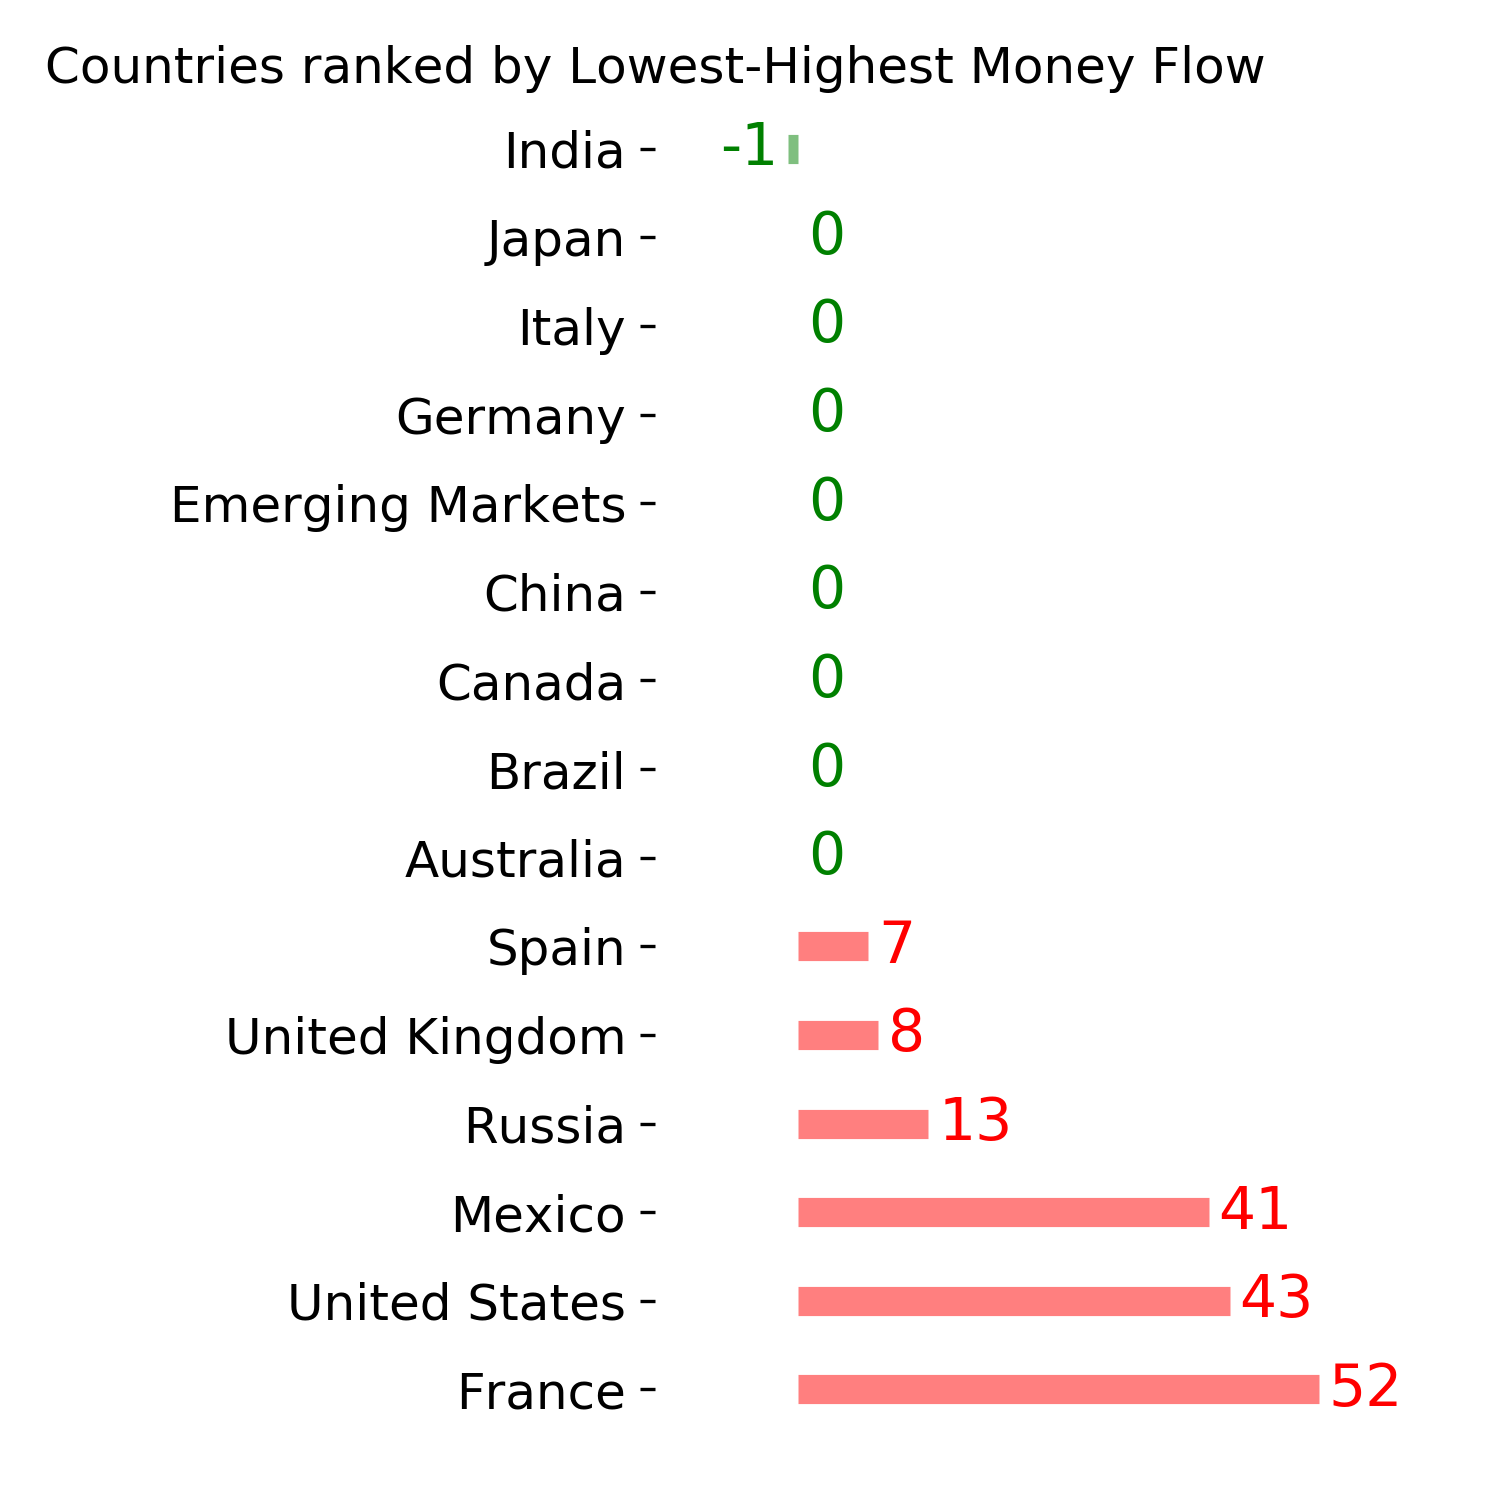
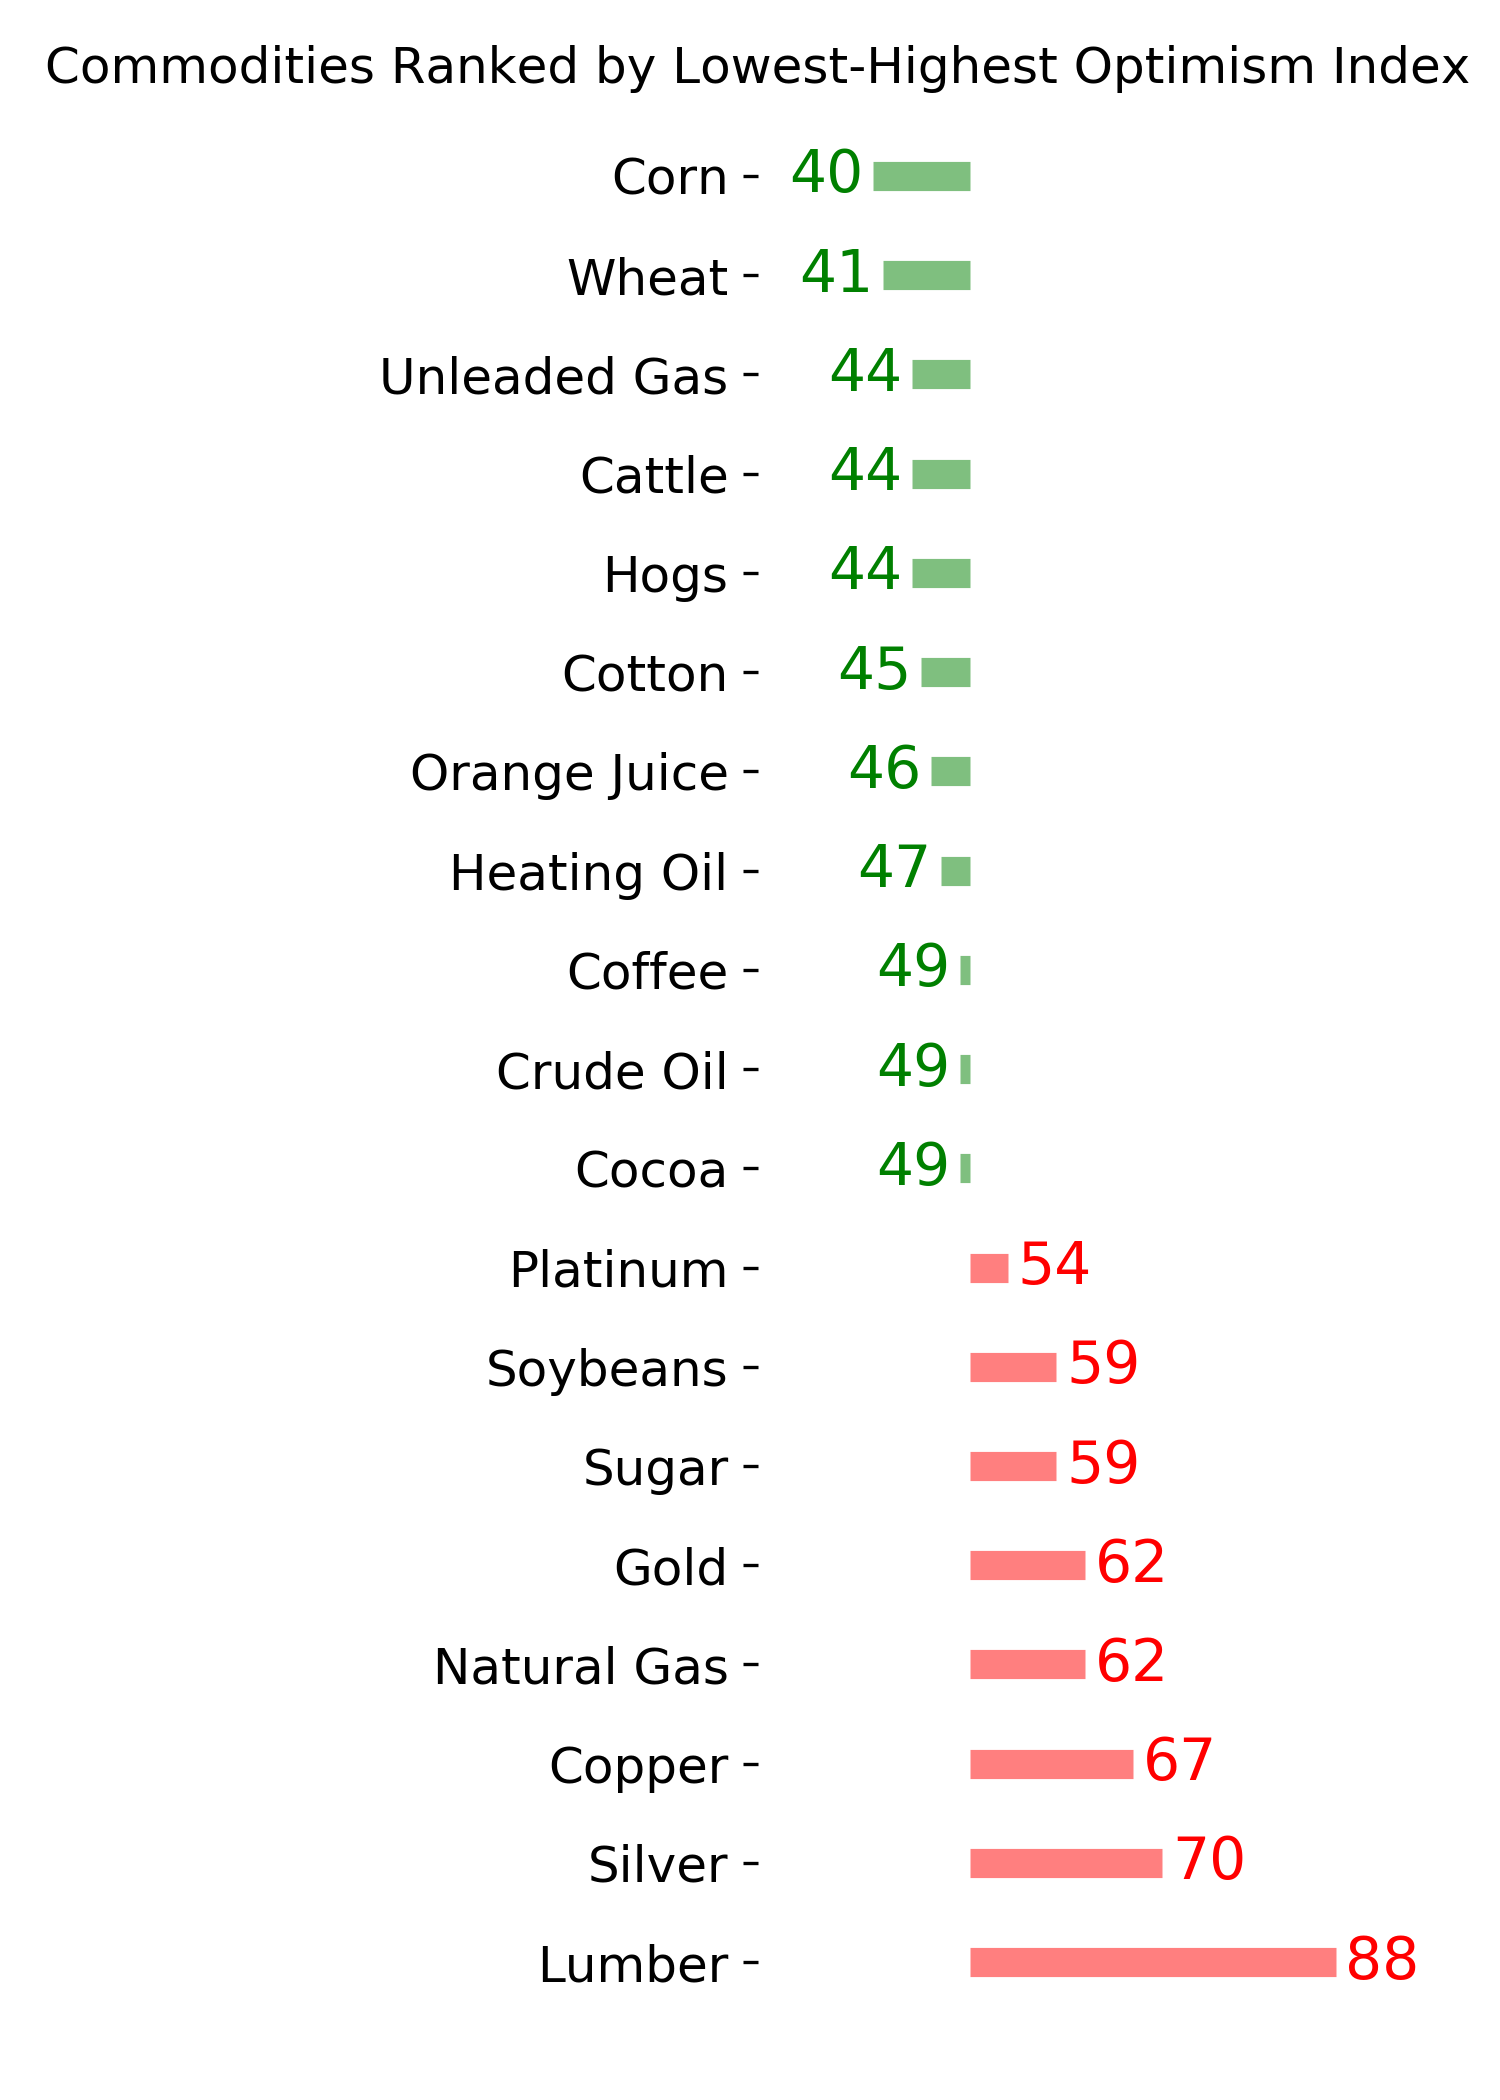
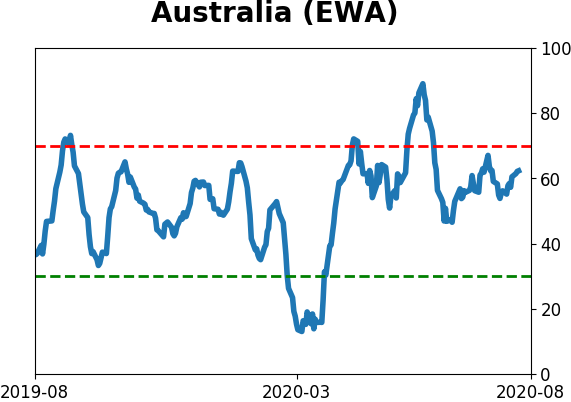
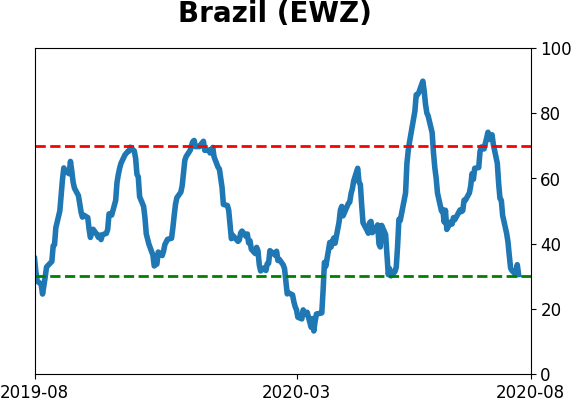
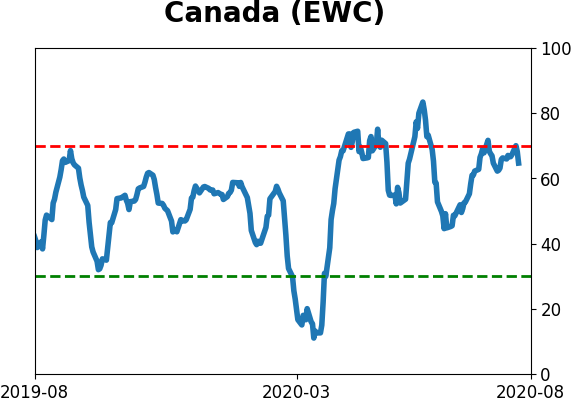
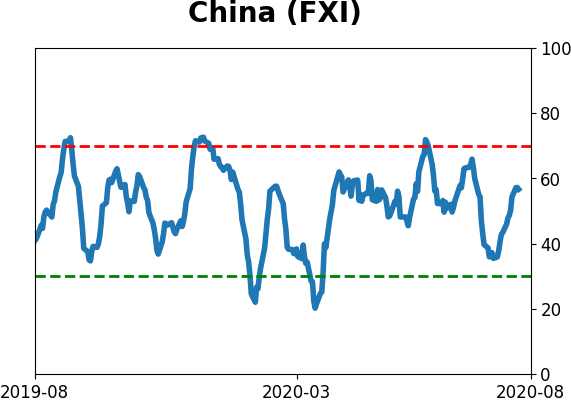
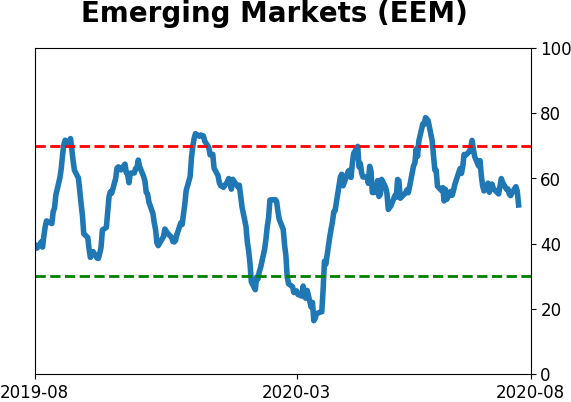
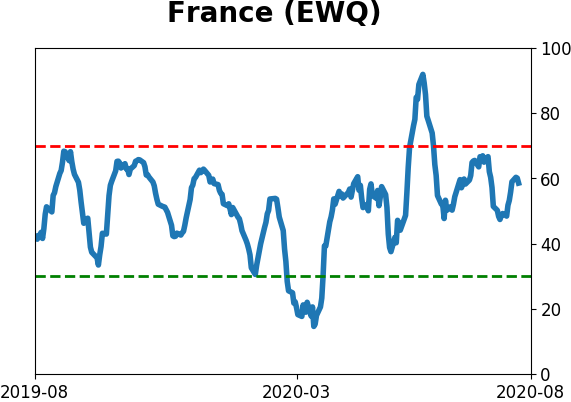
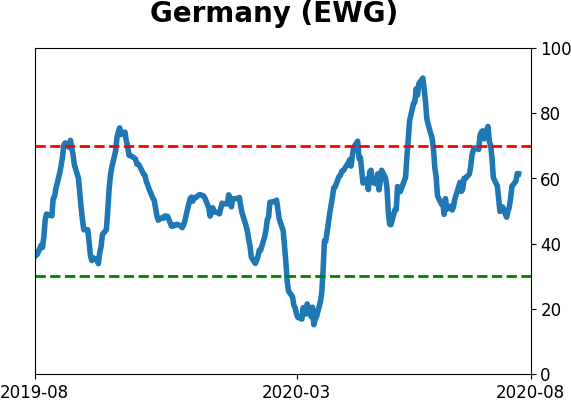
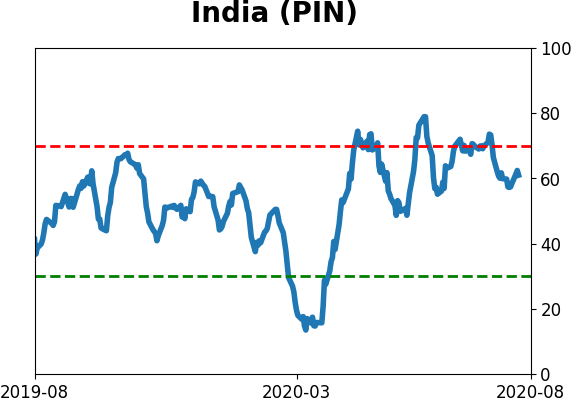
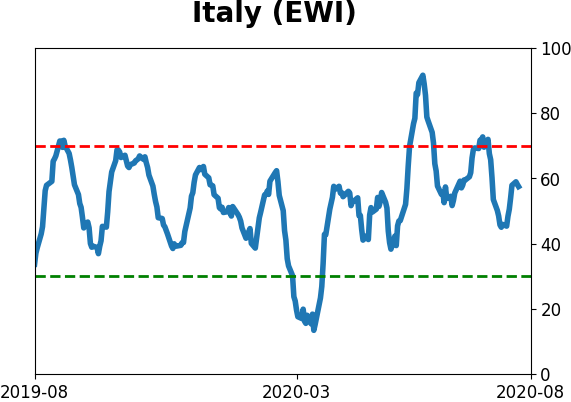
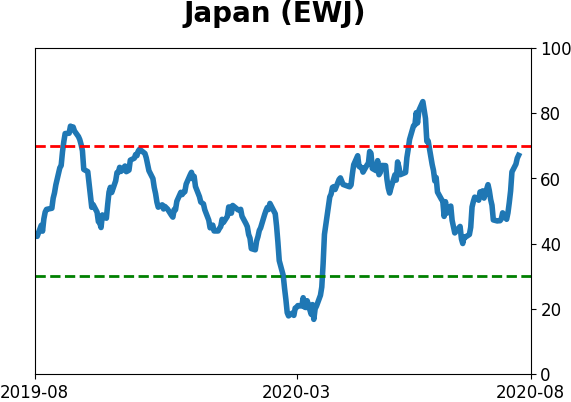
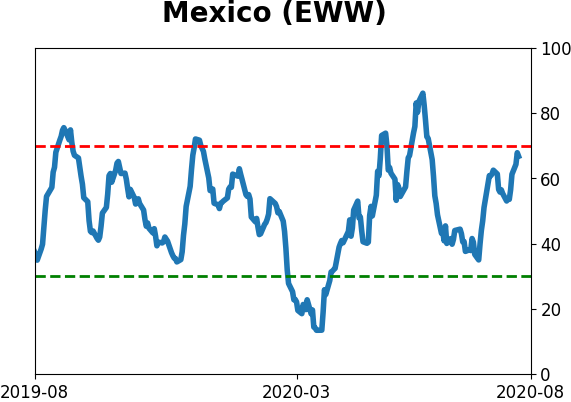
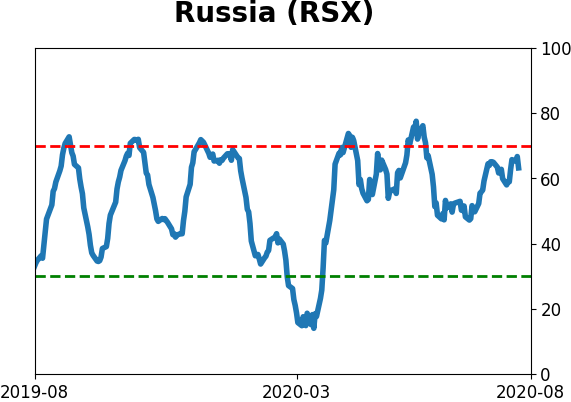
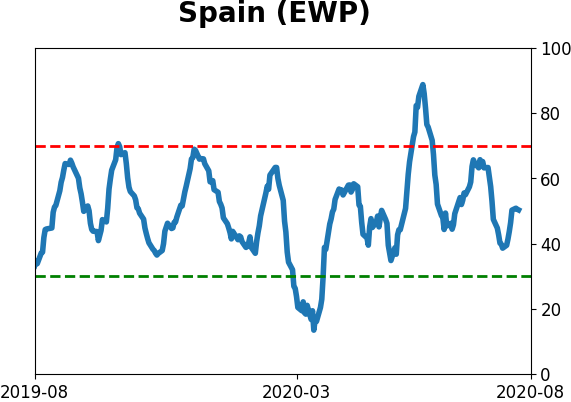
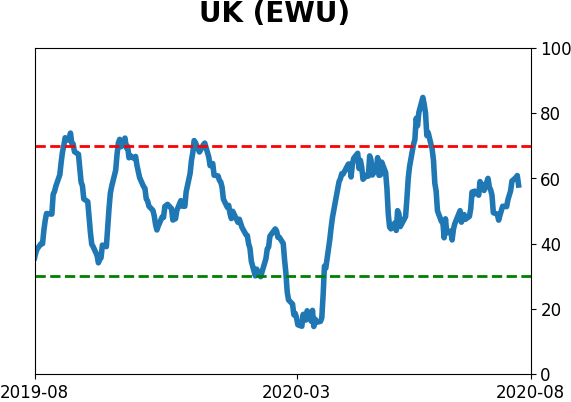
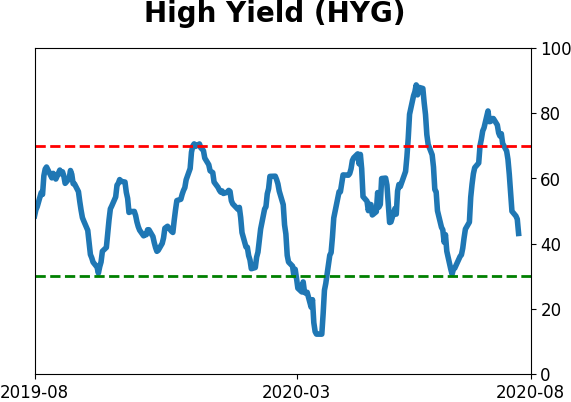
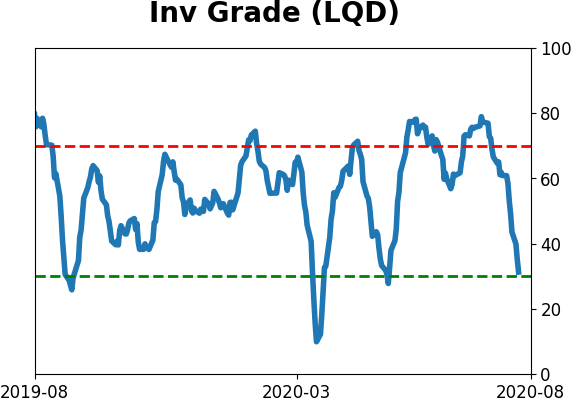
Sentiment Around The World
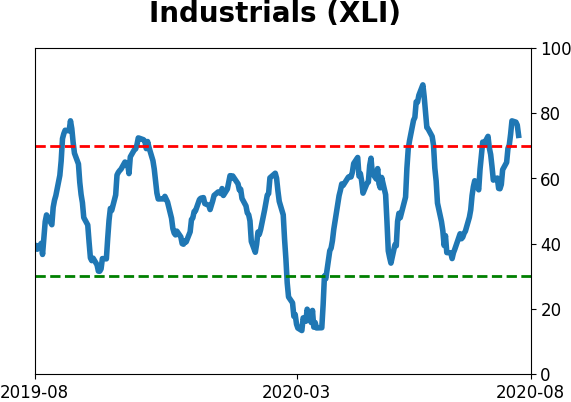
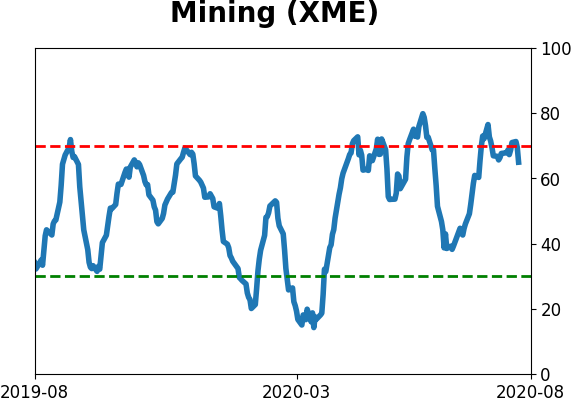
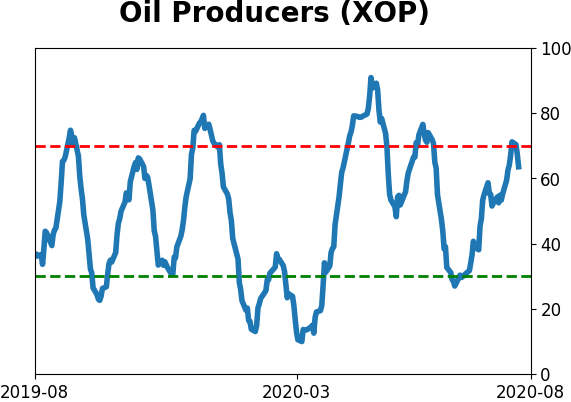
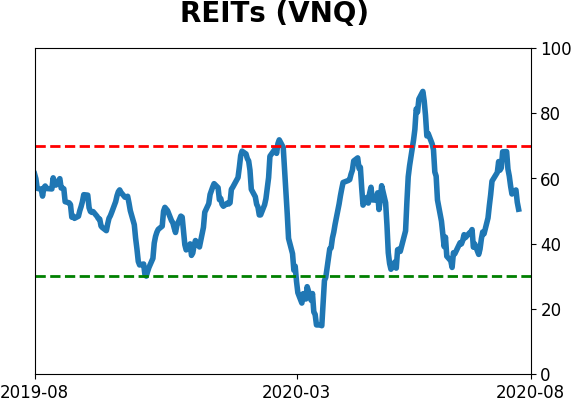
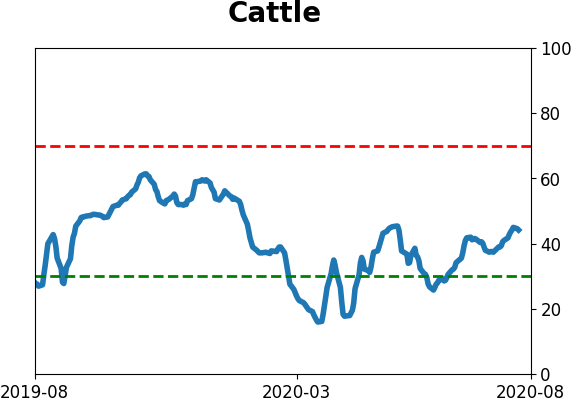
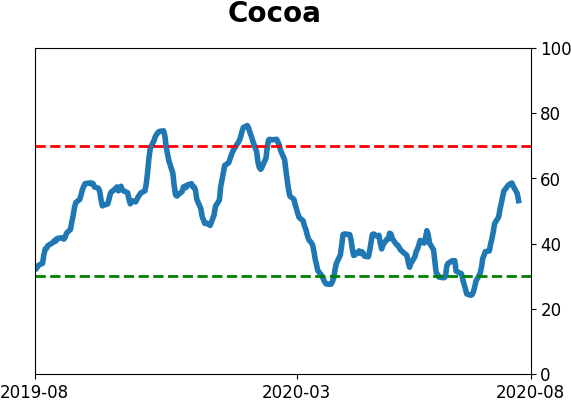
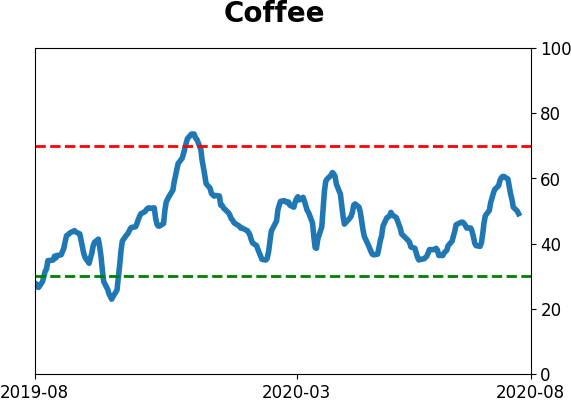
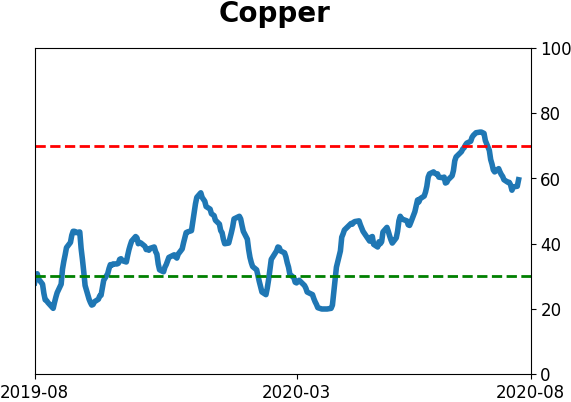
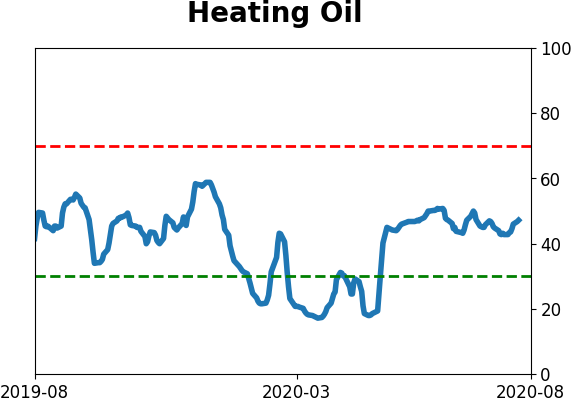
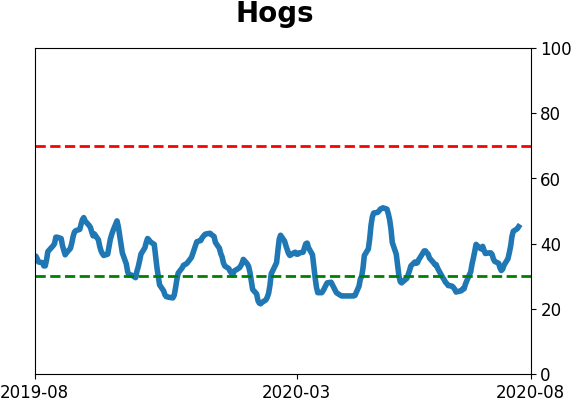
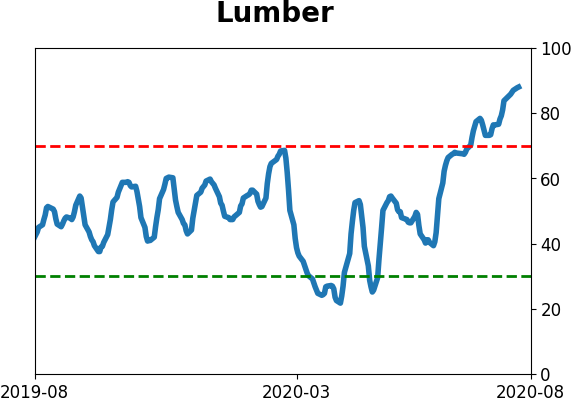
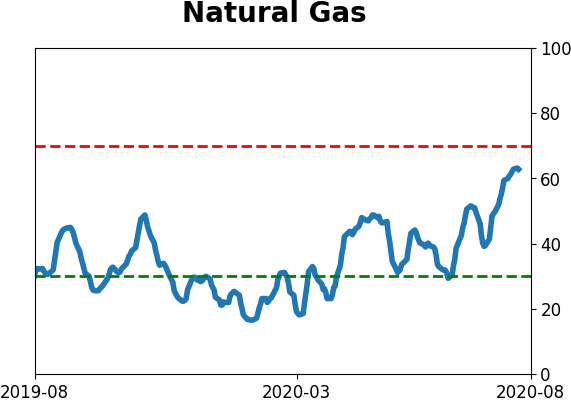
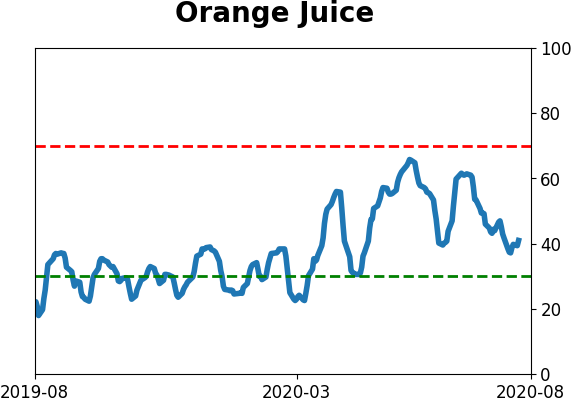
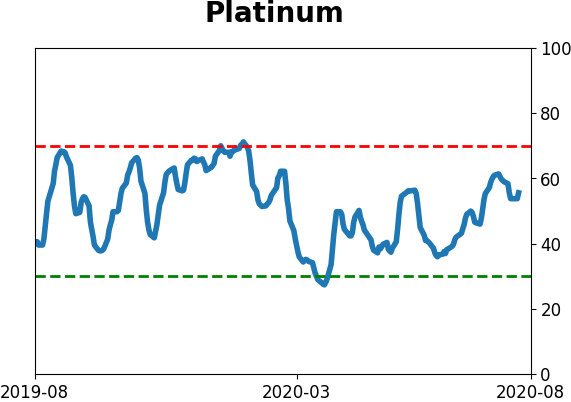
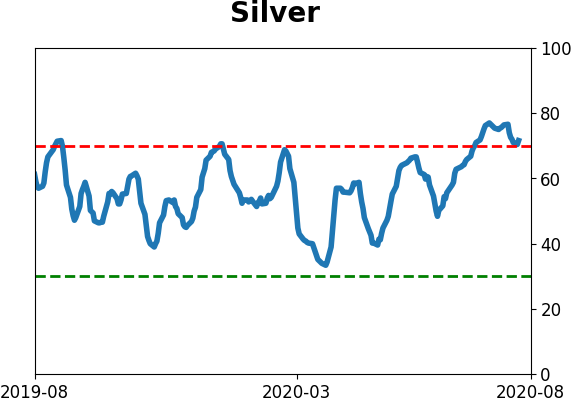
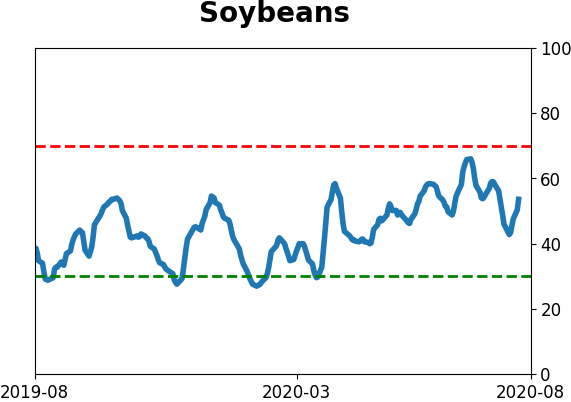
Optimism Index Thumbnails
|
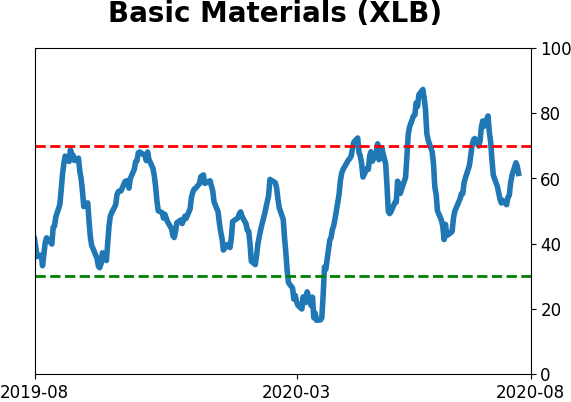
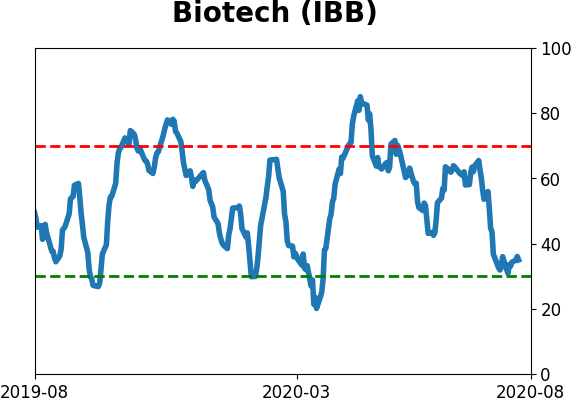
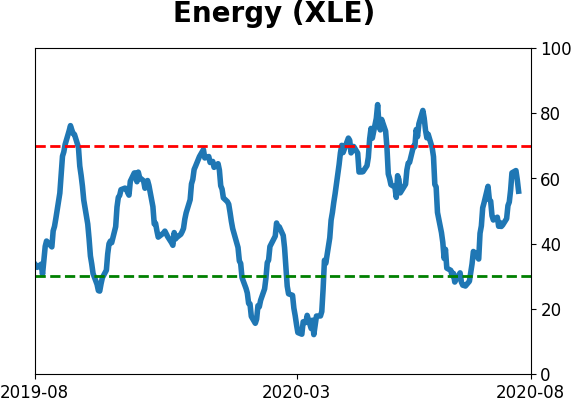
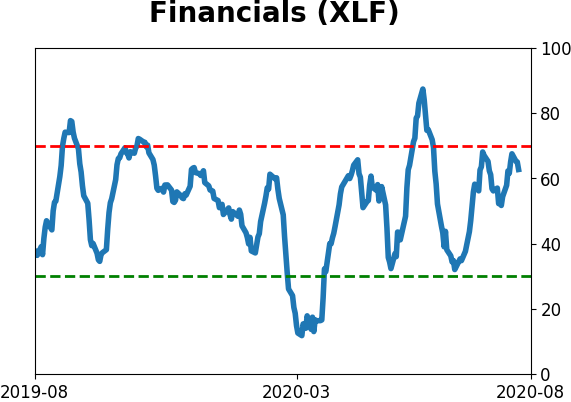
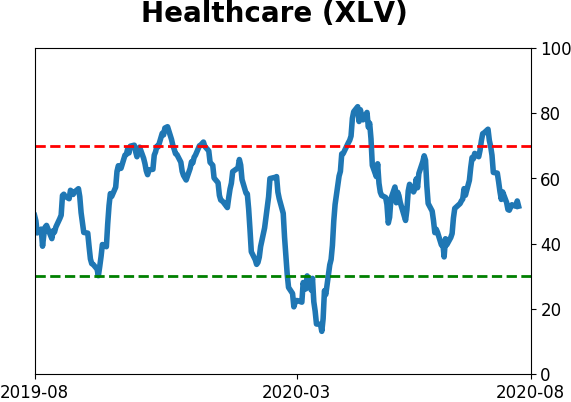
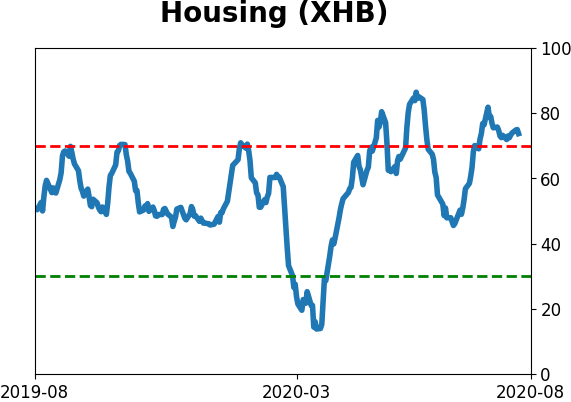
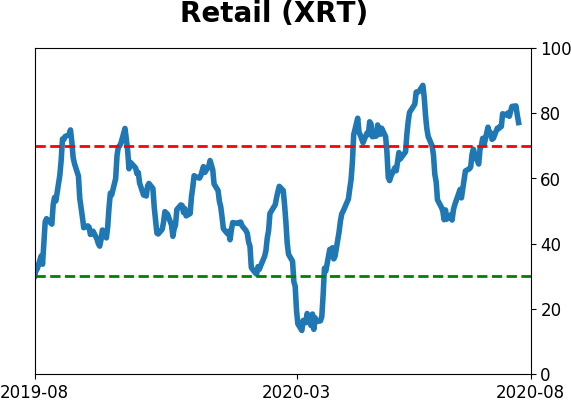
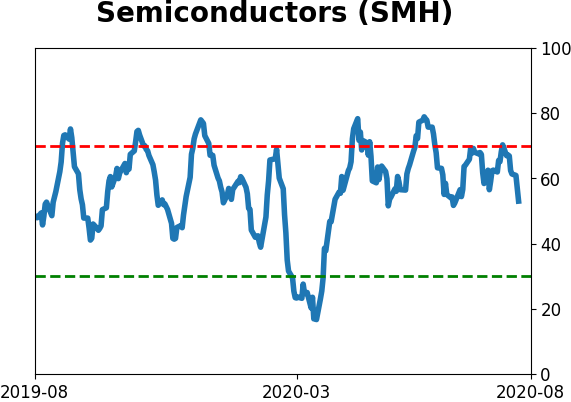
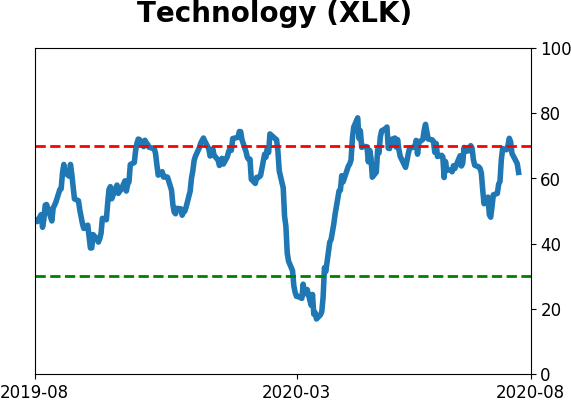
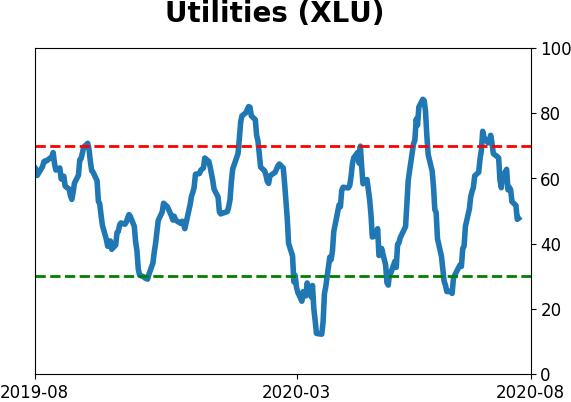
Sector ETF's - 10-Day Moving Average
|
|
|
Country ETF's - 10-Day Moving Average
|
|
|
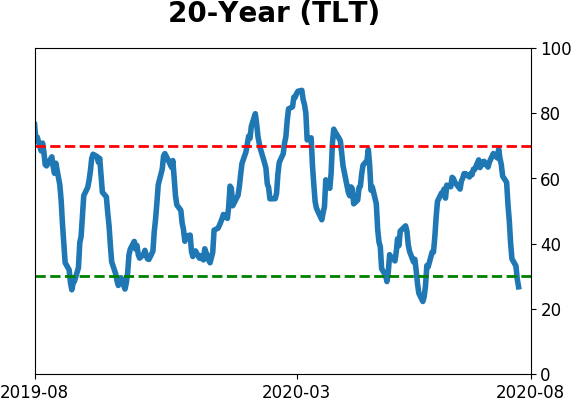
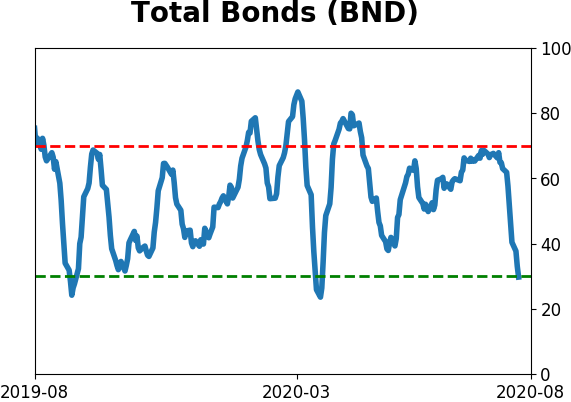
Bond ETF's - 10-Day Moving Average
|
|
|
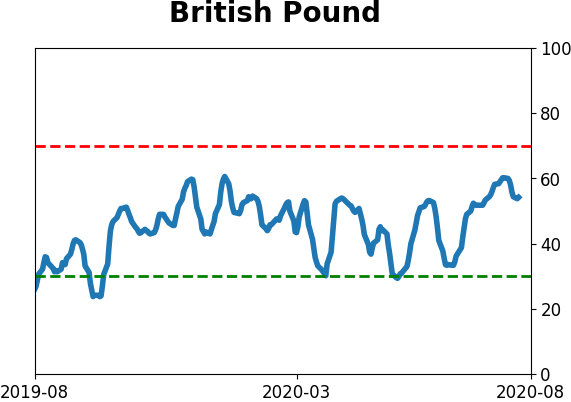
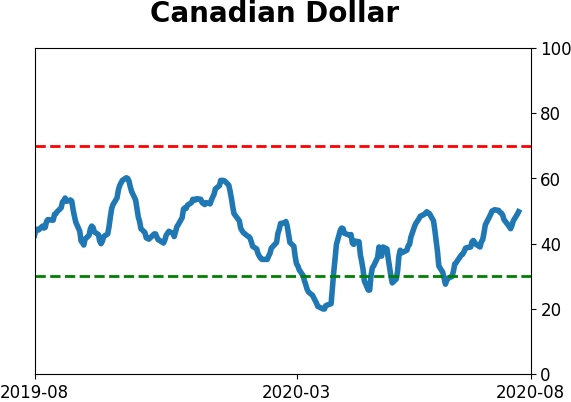
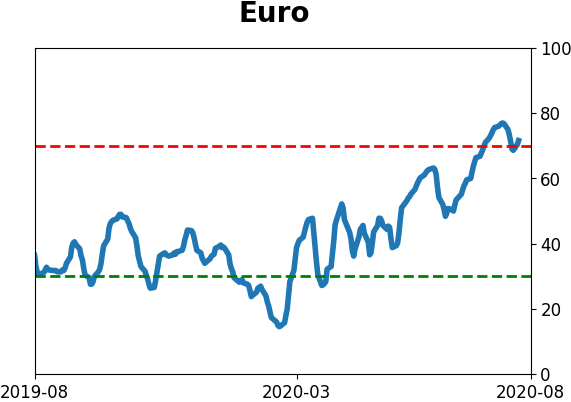
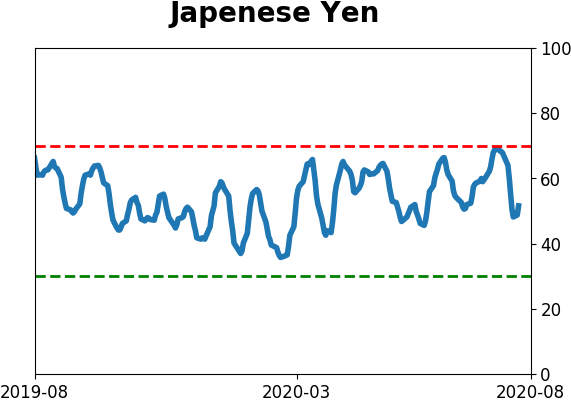
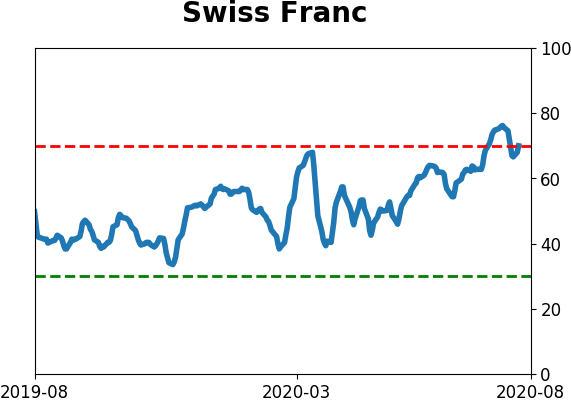
Currency ETF's - 5-Day Moving Average
|
|
|
Commodity ETF's - 5-Day Moving Average
|
|