Headlines
|
|
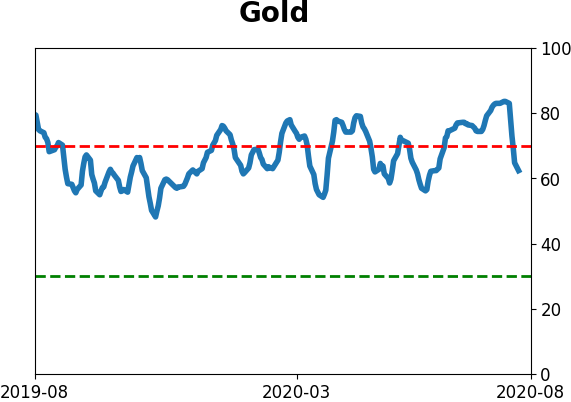
Gold's analogs and its tight correlation with tech stocks:
Gold has had a big run over the past 100 days, and while it seems unusual, there have been about a dozen time periods with a high positive correlation to the past 100 sessions. Those did not fare well for gold's future returns. Less concerning is its tight correlation to tech stocks, which has not been a consistent predictor in the past.
More new highs, more odd readings: The Nasdaq Composite gained more than 0.7% to close at a new high. And yet fewer than 38% of stocks on that exchange managed to gain on Tuesday. These kinds of very odd readings, with the indexes masking weak (even record low) participation have been building for several weeks. Since 1984, the Nasdaq has done something like this 6 other times, the last ones being in 1999 and 2007 (1996-02-21, 1996-12-09, 1999-11-24, 2007-04-20, 2007-07-19, and 2007-10-31). Similarly, the S&P 500 broke out to a new all-time high for the first time in more than 90 days, yet only one of its main sectors also did so, the first time it has done this in 25 years. We'll have more detail on that on Wednesday.
Bottom Line:
- Weight of the evidence has been suggesting flat/lower stock prices short- to medium-term again; still suggesting higher prices long-term
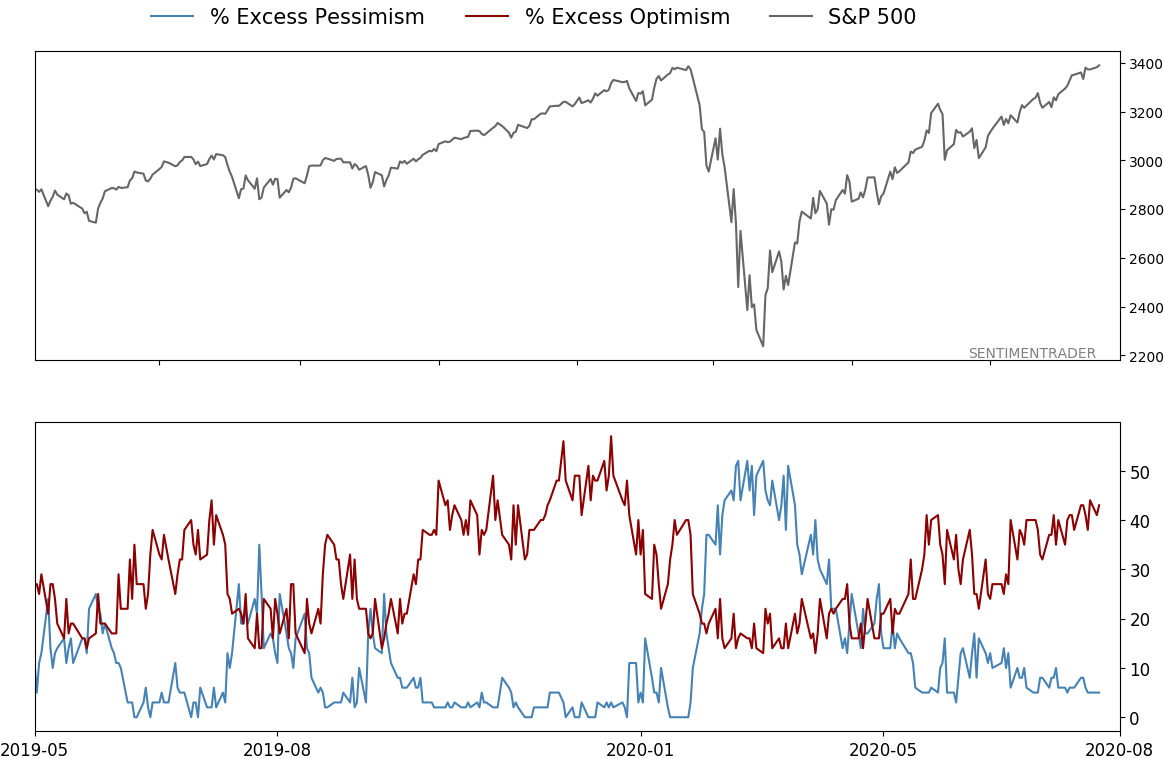
- Indicators show high optimism, with Dumb Money Confidence above 80% with signs of reckless speculation during what appears to be an unhealthy market environment, historically a bad combination, though it's easing somewhat
- Active Studies show a heavy positive skew over the medium- to long-term; breadth thrusts, recoveries, and trend changes have an almost unblemished record at preceding higher prices over a 6-12 month time frame
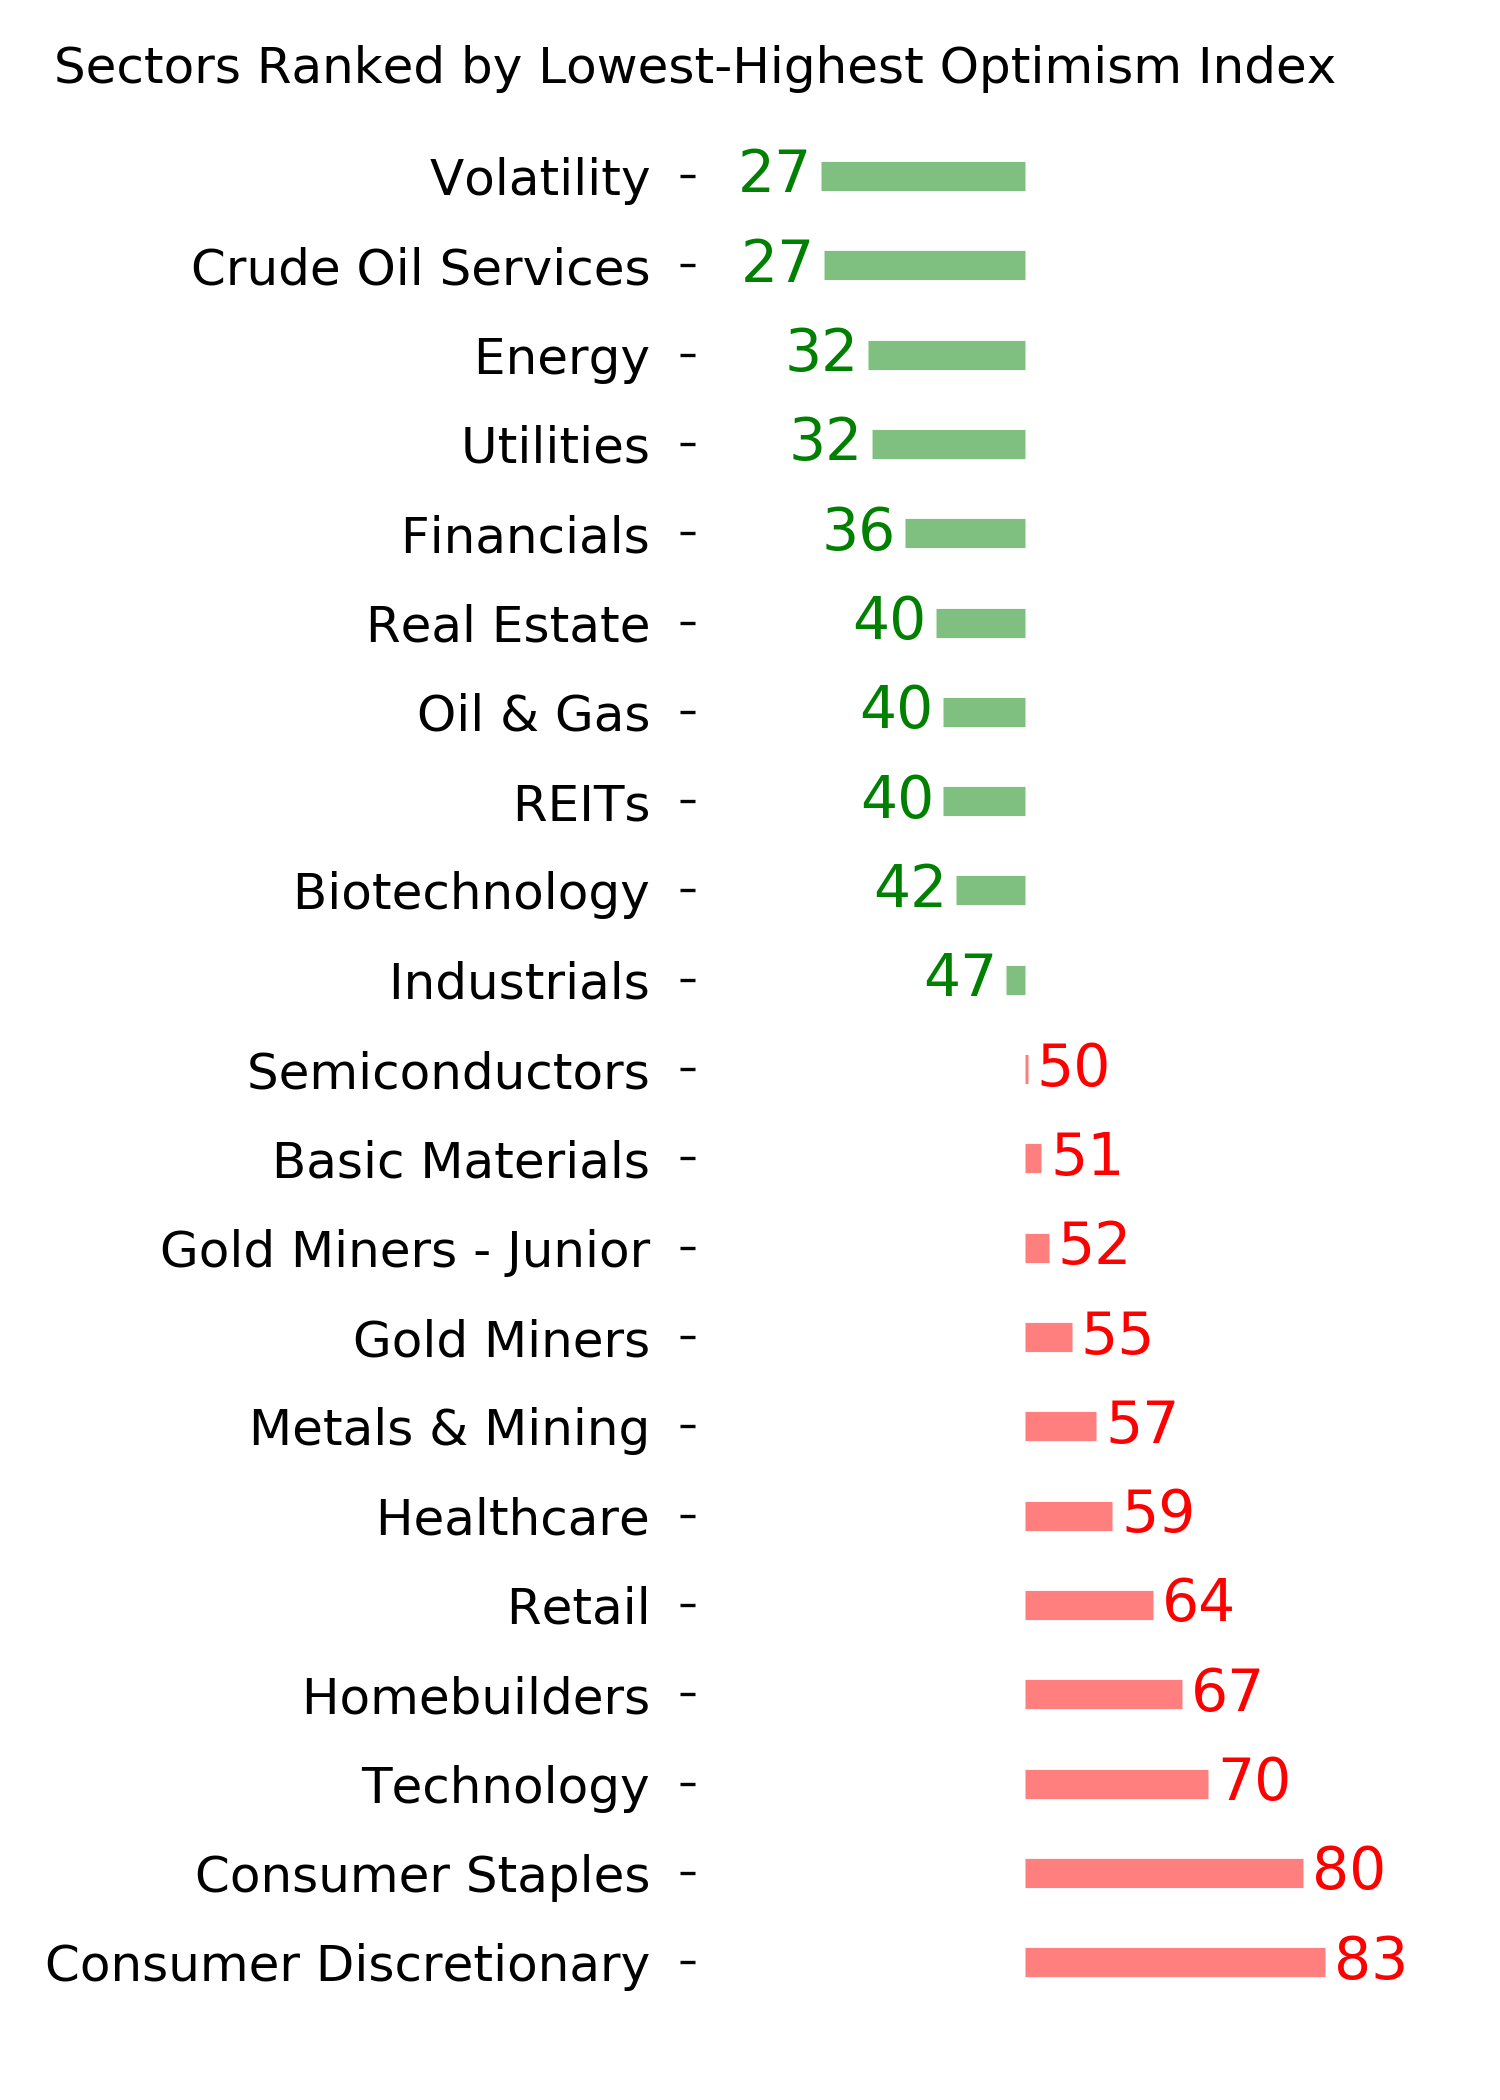
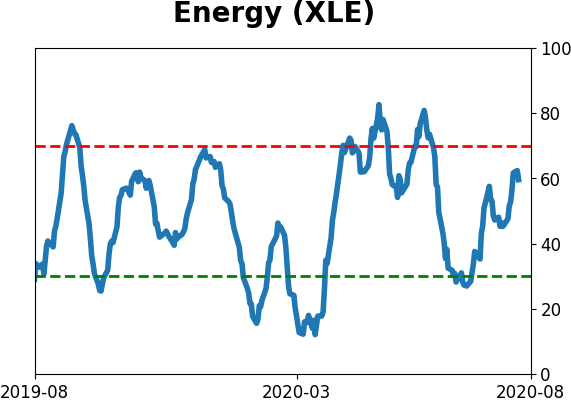
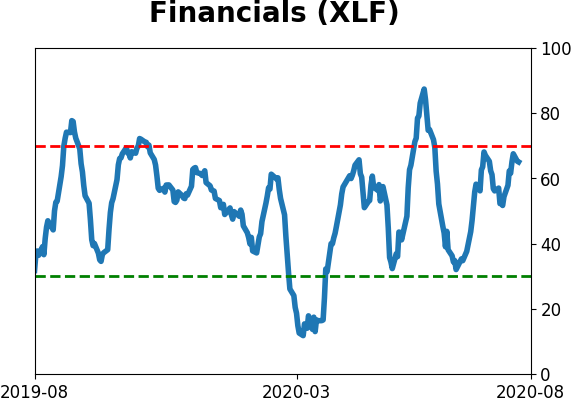
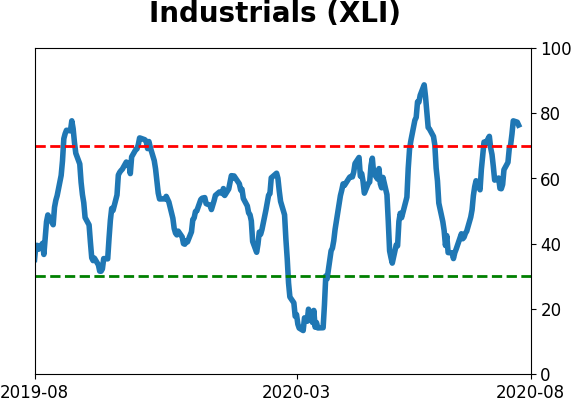
- Signs of extremely skewed preference for tech stocks neared exhaustion by late June, especially relative to industrials and financials (here and here)
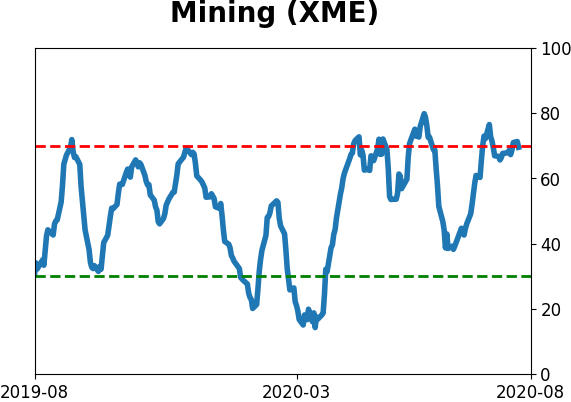
- Indicators and studies for other markets are showing less consistent forward results, though it's not a great sign for Treasuries that hedgers are net short and optimism on metals recently became extreme, with "perfect" breadth among miners recently dipping a bit...perhaps the Buffett disclosure on Friday is a game-changer for this sector
|
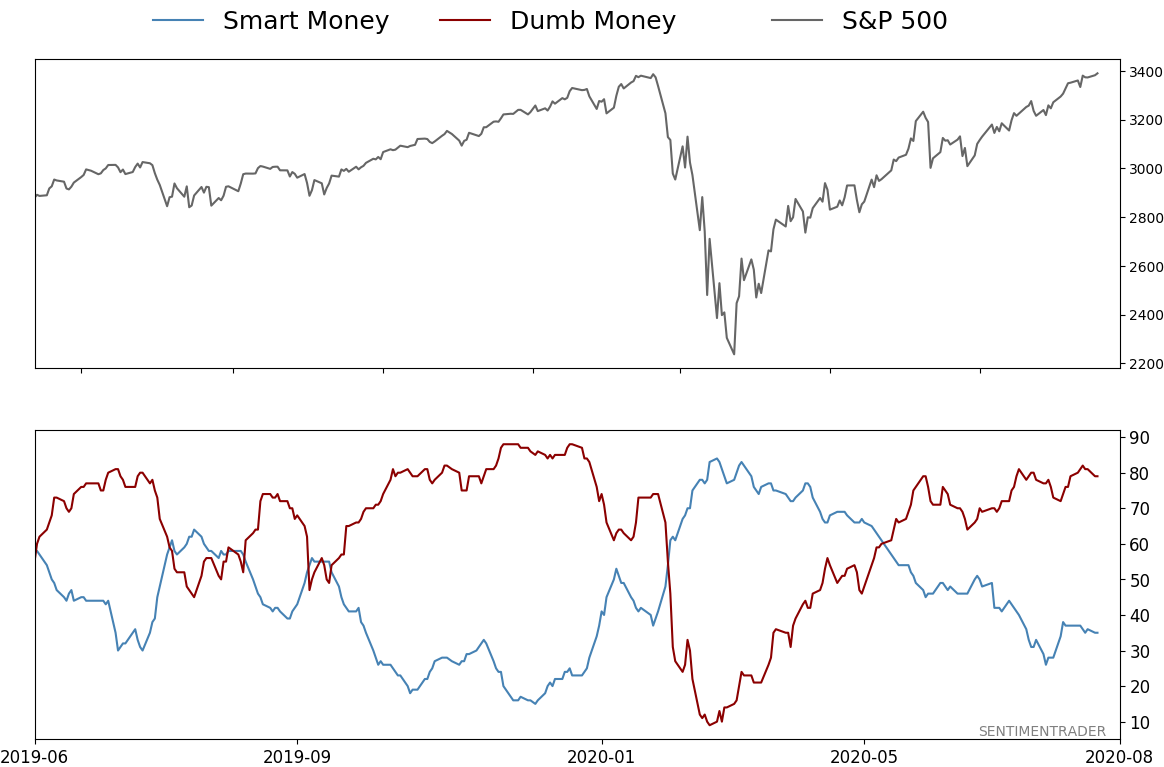
Smart / Dumb Money Confidence
|
Smart Money Confidence: 35%
Dumb Money Confidence: 79%
|
|
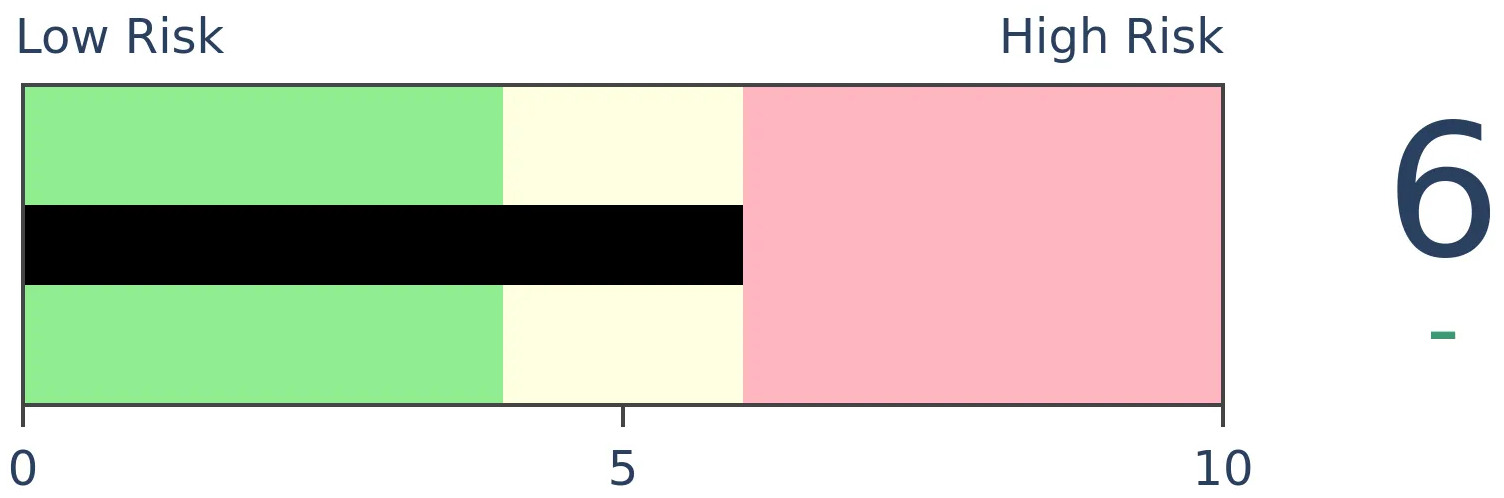
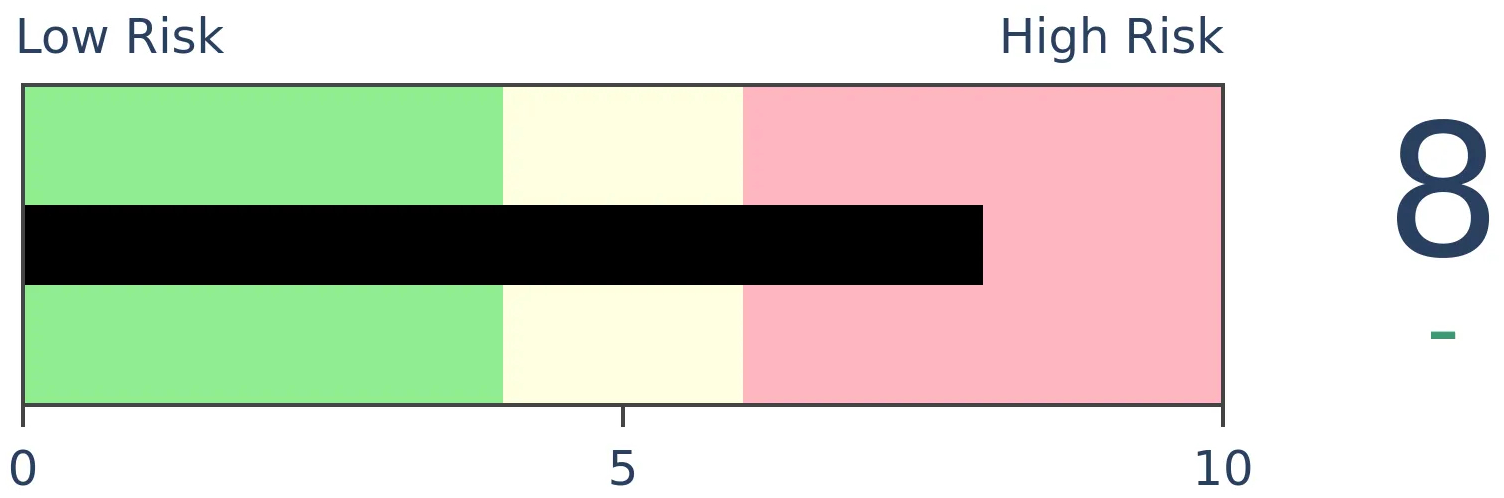
Risk Levels
Stocks Short-Term
|
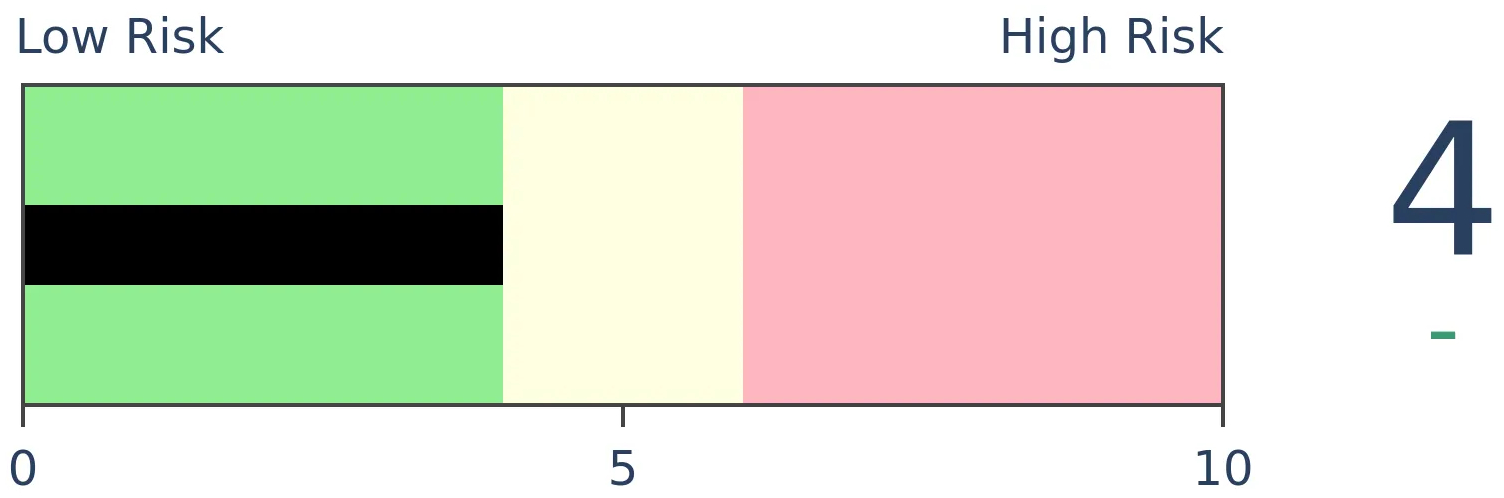
Stocks Medium-Term
|
|
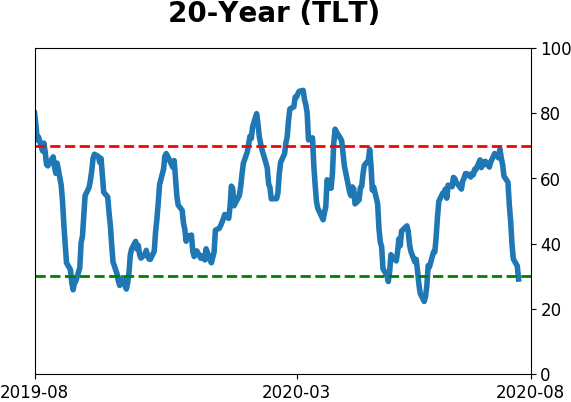
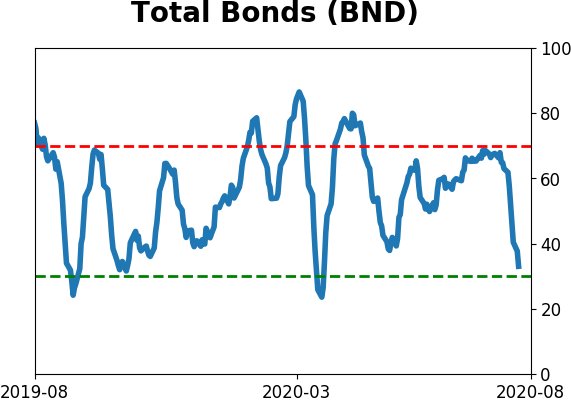
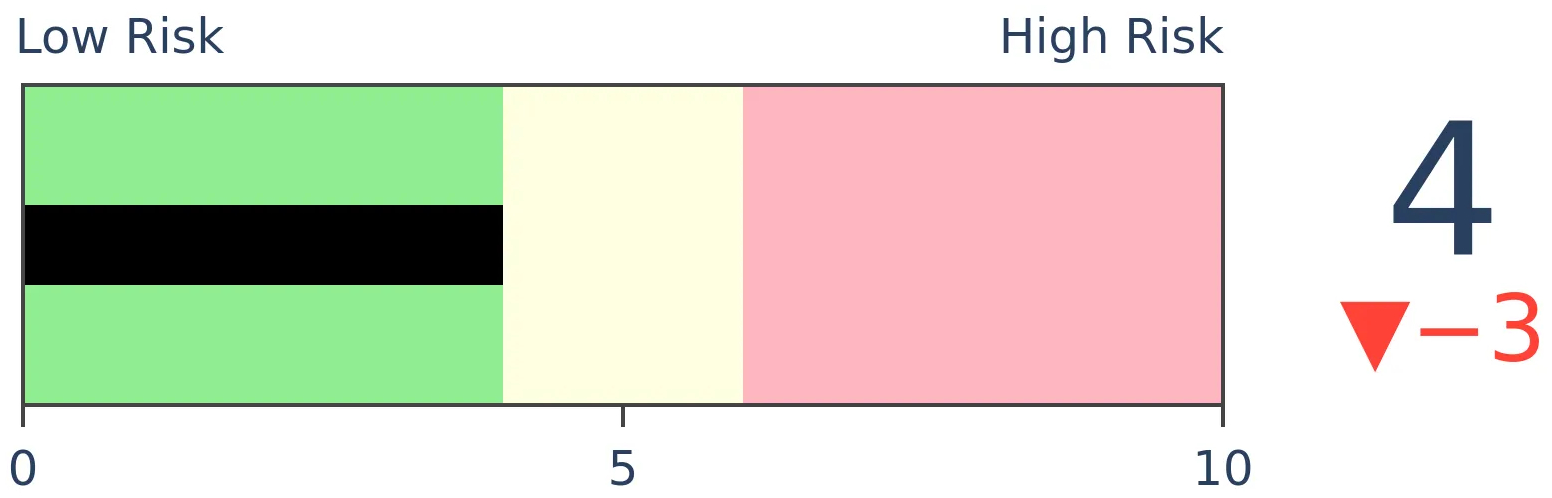
Bonds
|
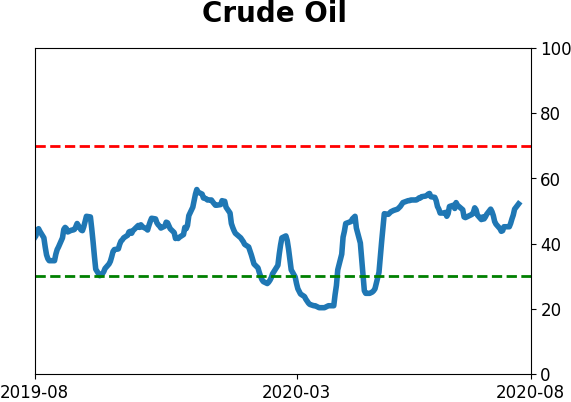
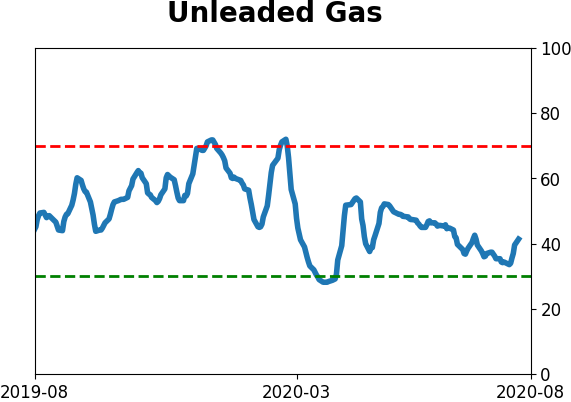
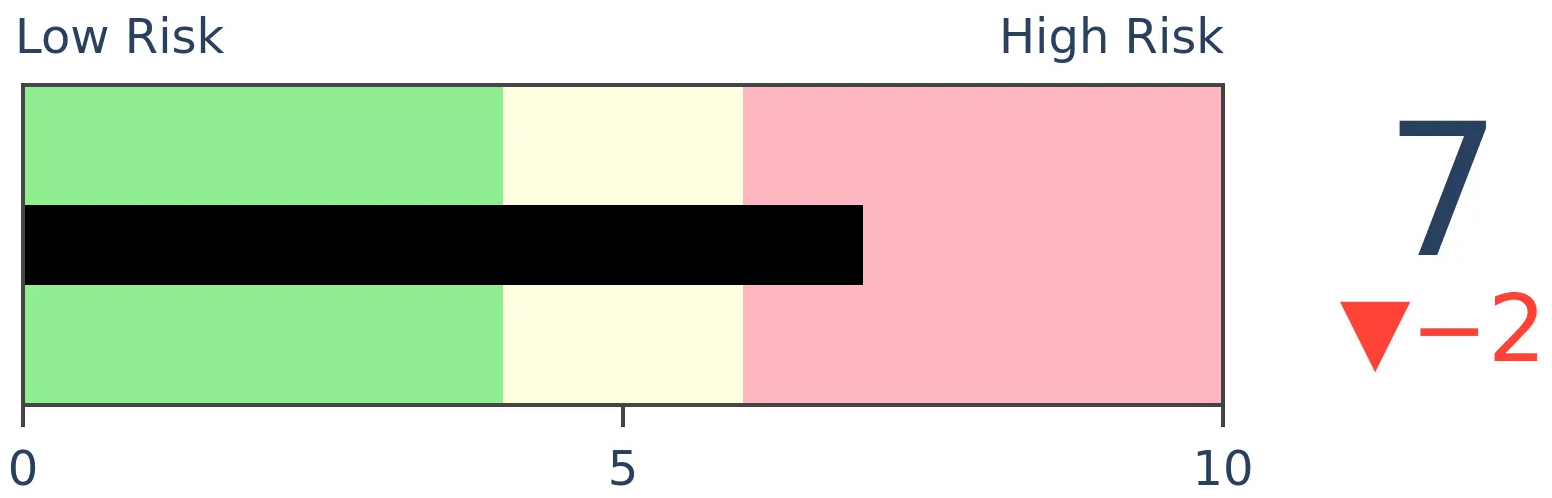
Crude Oil
|
|
Gold
|
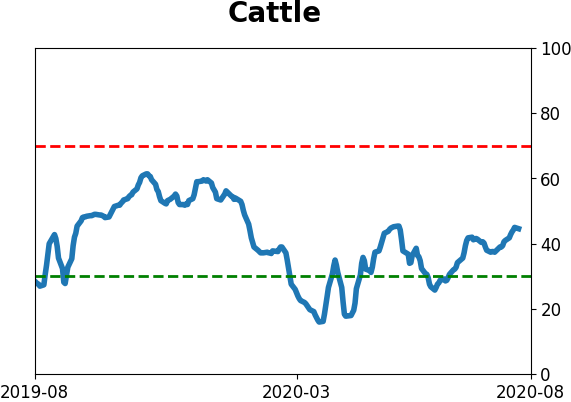
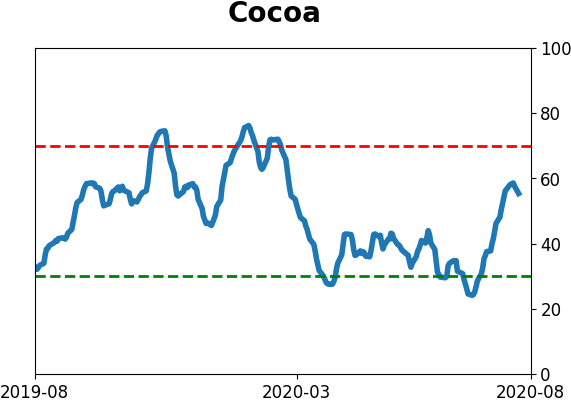
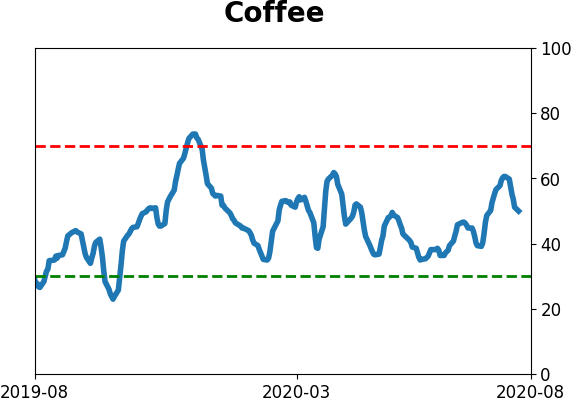
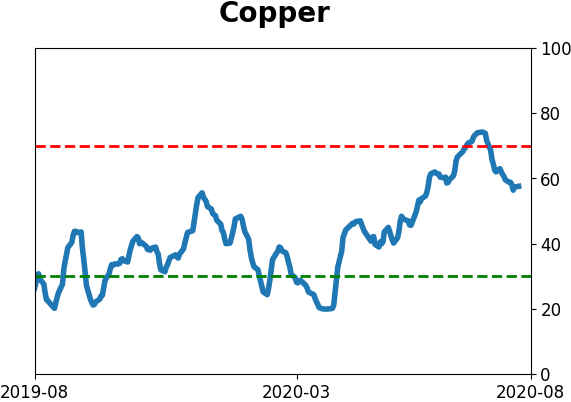
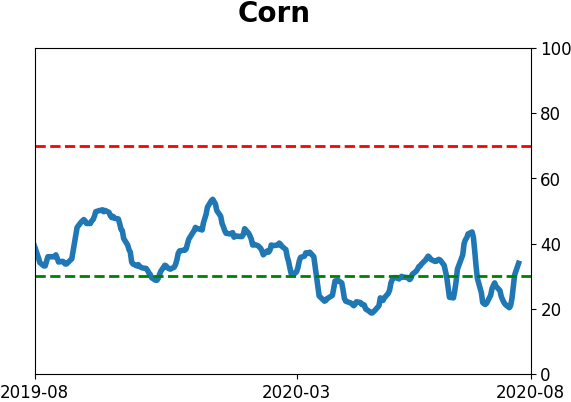
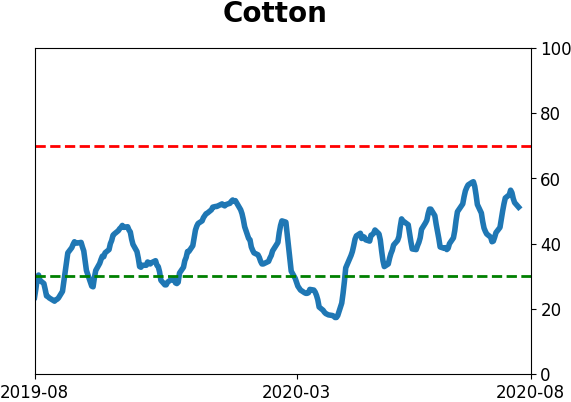
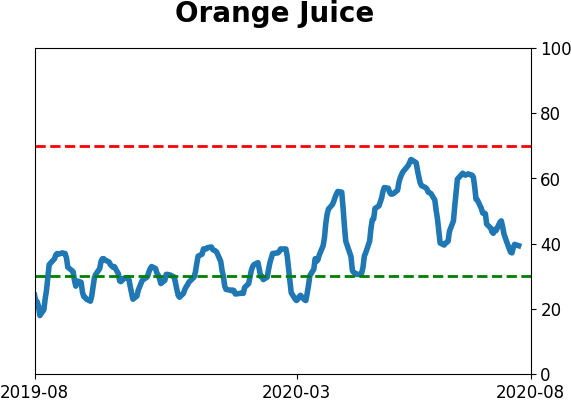
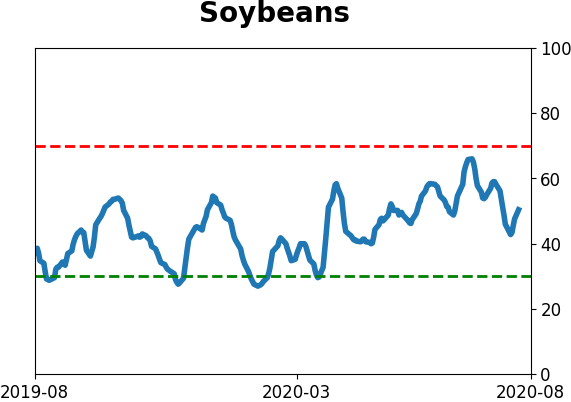
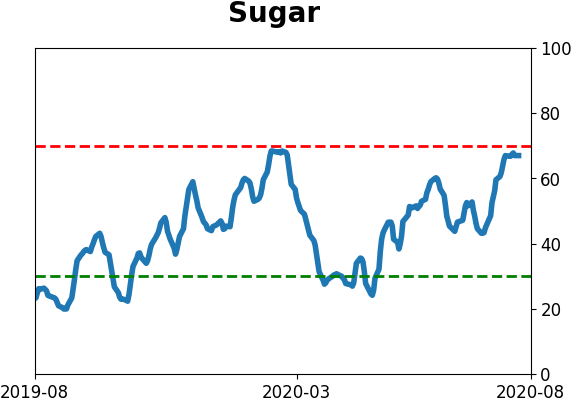
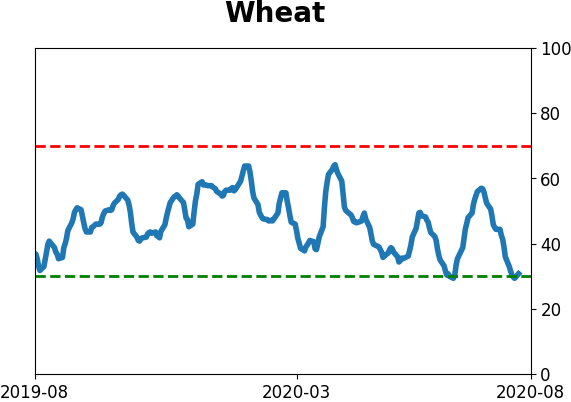
Agriculture

|
|
Research
BOTTOM LINE
Gold has had a big run over the past 100 days, and while it seems unusual, there have been about a dozen time periods with a high positive correlation to the past 100 sessions. Those did not fare well for gold's future returns. Less concerning is its tight correlation to tech stocks, which has not been a consistent predictor in the past.
FORECAST / TIMEFRAME
GLD -- Down, Medium-Term
|
On Monday, we saw that there have been a dozen or so time periods that have been highly correlated to the past 100 days in stocks. Despite what seems like an unprecedented move in other markets like gold, that market, too, has seen other stretches that look similar.
Just as we did with the S&P 500, we can go back to 1975 and look for the 100-day periods in gold that have the highest correlation to the past 100 sessions. When we do that, we get about a dozen stretches that have an extremely tight positive correlation to gold's path since March.
When we average them together, it looks like the following.
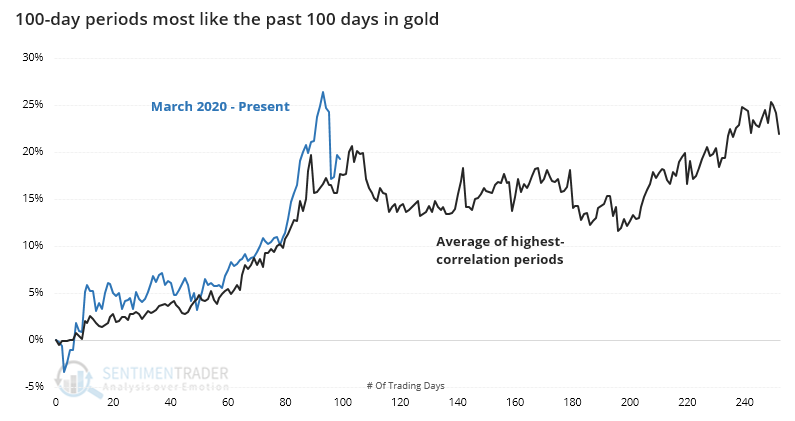
We can see just how tightly they tracked what we've seen so far in 2020. For what it's worth, the average peaked within the next couple of weeks.
Below are the most recent occurrences (the dates are from the start of the 100-day analogs).
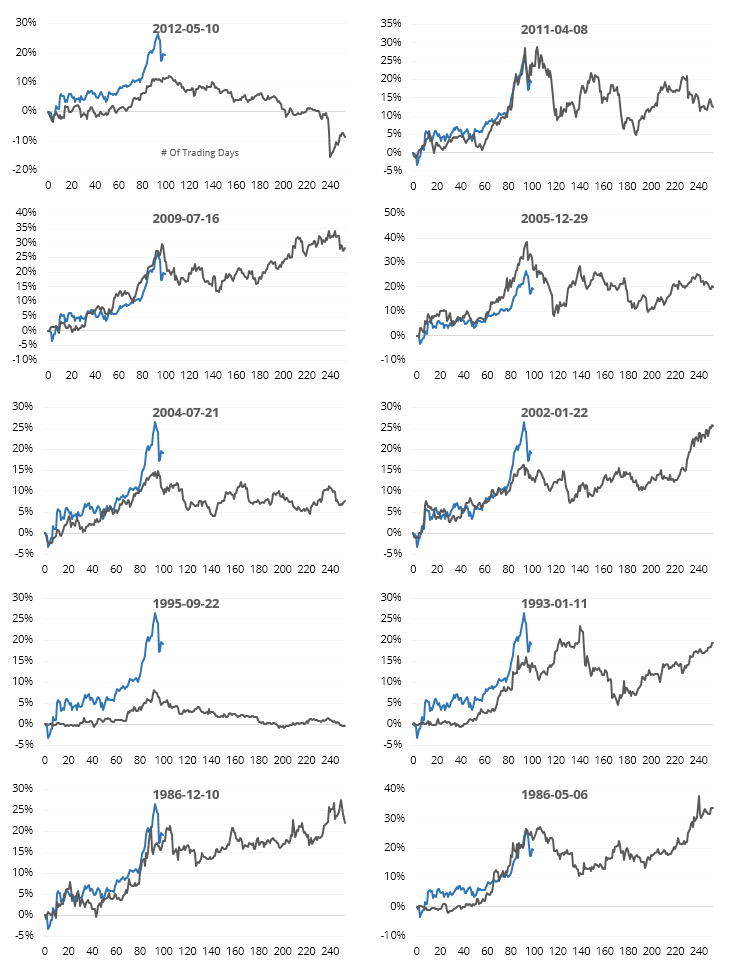
Not sure what it is about gold, but these 100-day stretches were about the longest it could go before correcting. Once the 100 days passed, gold did not perform well.
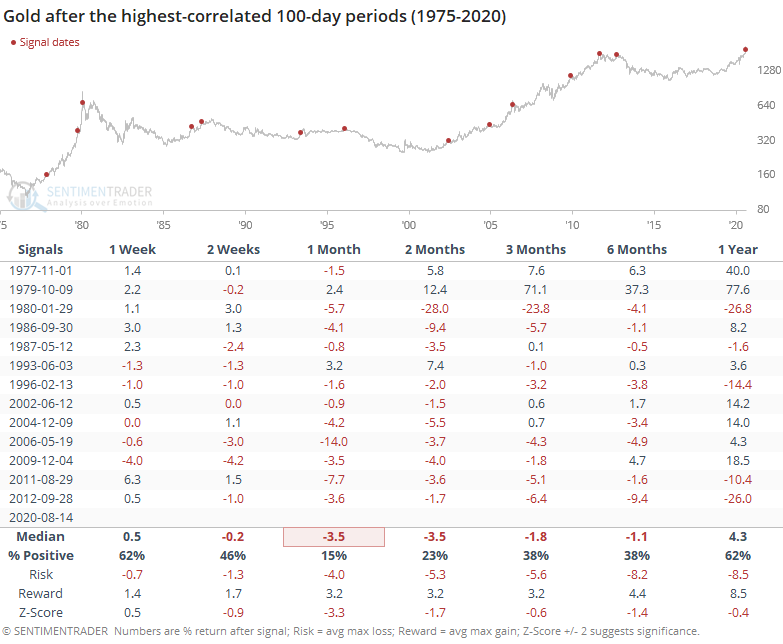
The next 1-6 months were wicked for the metal, with poor returns, poor consistency, and even worse risk/reward skew.
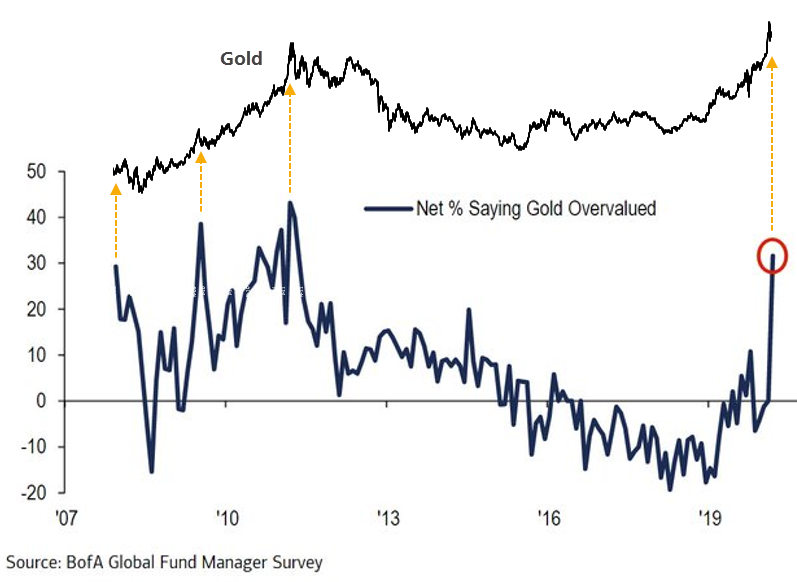
As the metal has perked up, some large institutional investors have become concerned that it's overvalued, as much as one can actually value a precious metal. The latest Bank of America Merrill Lynch survey of large fund managers shows that more than 30% of them think the metal has gone too far. While these managers have a mixed track record in other assets, their estimates of gold's value has been pretty good, which should be a worry here.
An interesting thing to watch among miners, given Berkshire's stake that was announced on Friday, is the broader reactions among them. While a few of them took off to the upside on Monday, there were significantly fewer of the stocks hitting new highs.
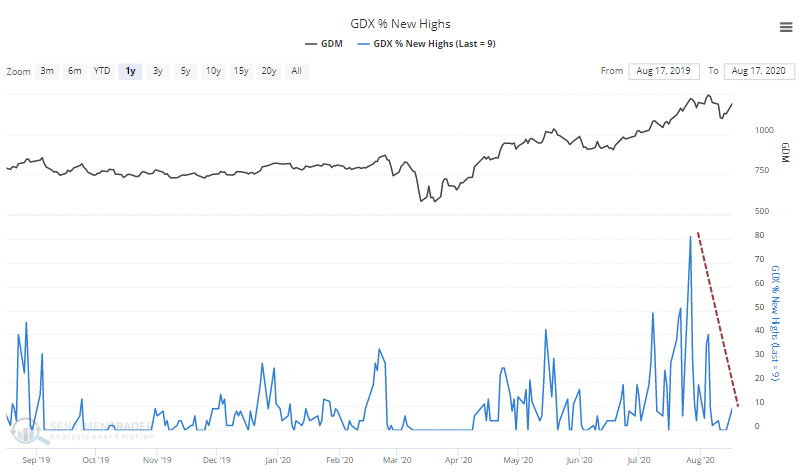
And more than 40% are still in a correction.
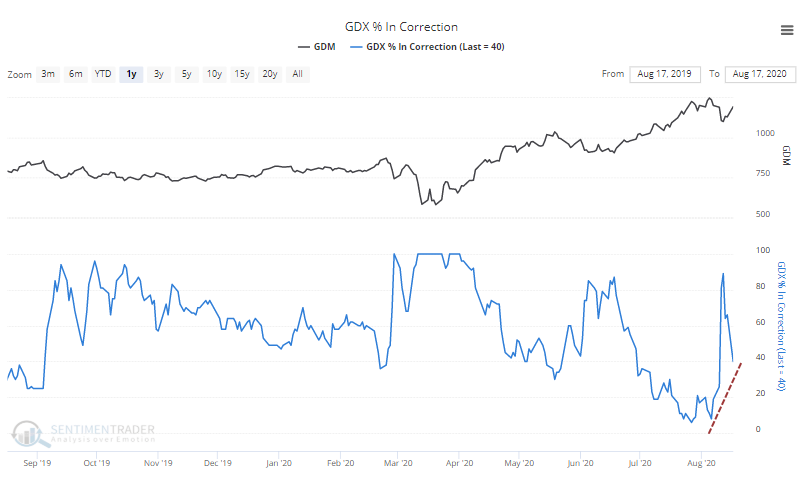
It's way too early to suggest that this is a negative divergence between GDX and its component stocks. It certainly bears watching in the days ahead if strength in only a few stocks like Barrick manage to mask some underlying weakness.
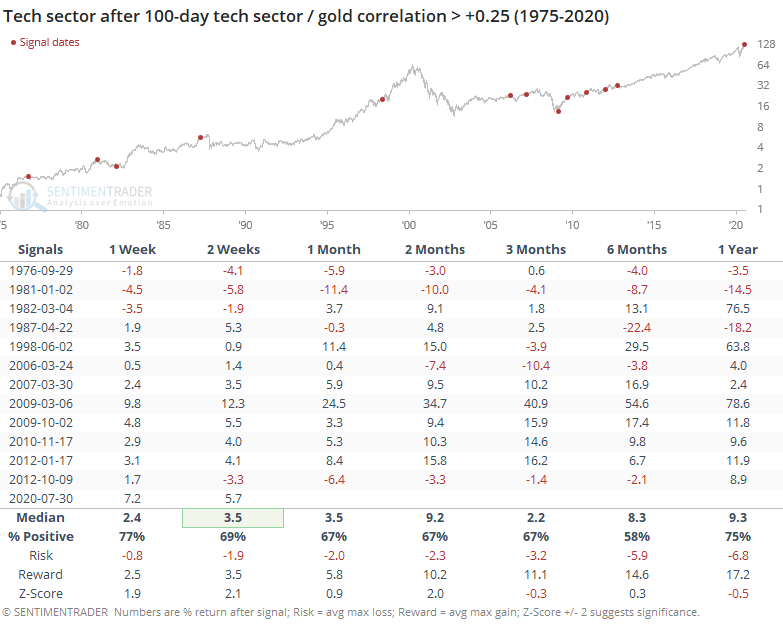
Along with gold, tech stocks have gone pretty much straight up since March.
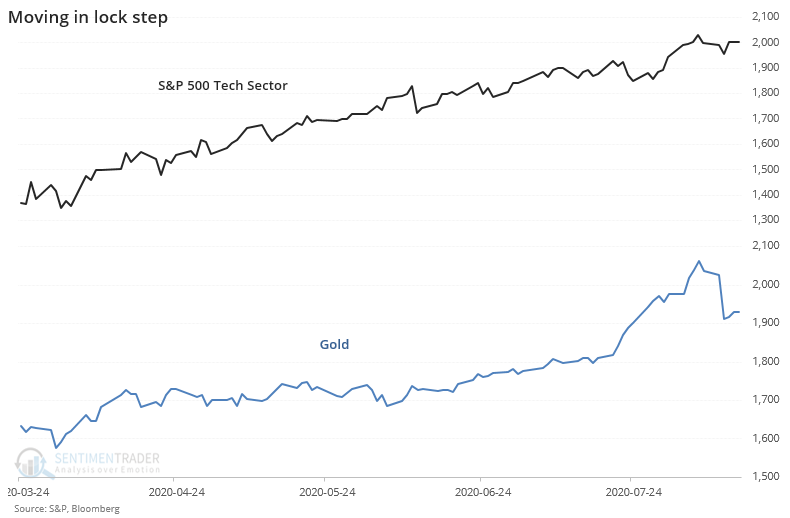
The 100-day correlation between their daily percentage changes has skyrocketed to among the highest levels in history.
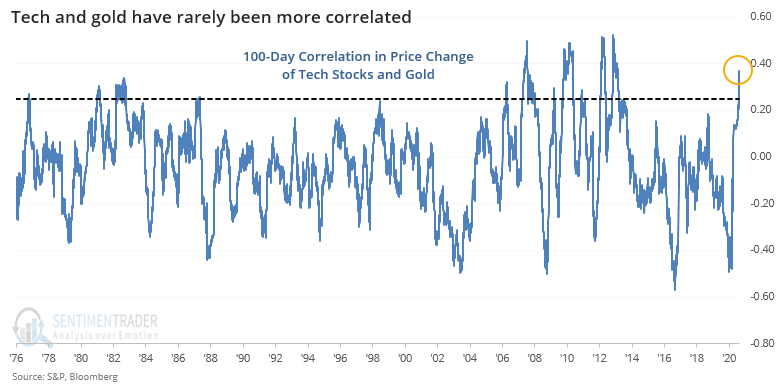
To see if it has meant anything consistent, the tables below show every time when their correlation exceeded +0.25 for the first time in about six months.
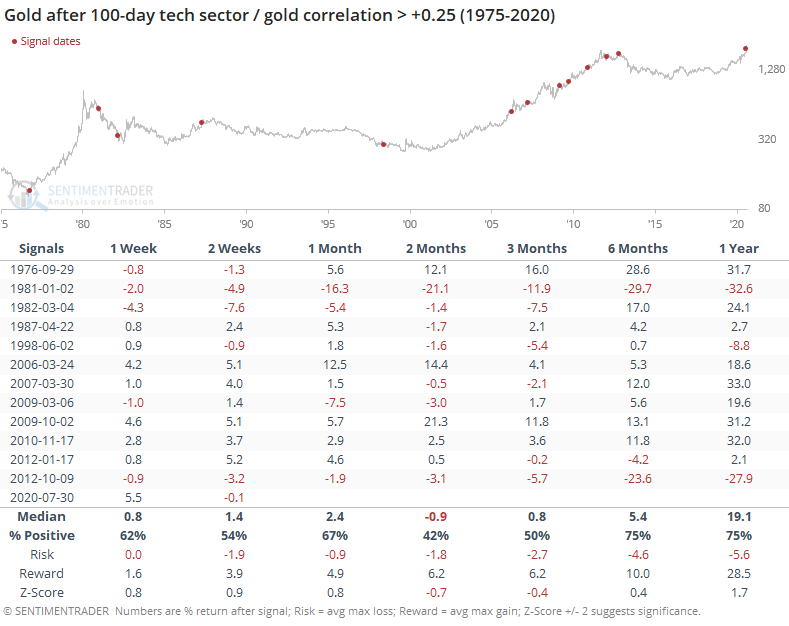
This was not a great sign for gold but was not a big edge. It tended to fall back over the next couple of months, with below-average returns. Thanks to many of the signals triggering during the 2000s bull market, the risk/reward was positive, so at least there's that.
Tech stocks mostly shrugged it off. There was no real edge there.
For the broader market, it was a mixed sign as well. The S&P 500's forward returns were about in line with random, with a couple of really bad returns and a few really good ones. There was no consistency.
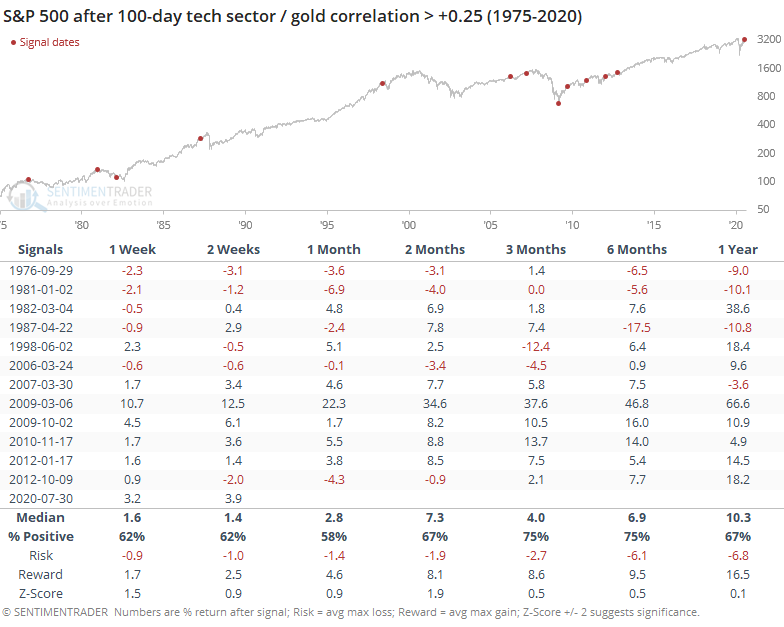
It's tempting to assign a narrative to the big runup in tech stocks and gold, with the Fed's policies that favorite scapegoat. It's probably true. But the two assets have traveled together before, even tighter than they are now, and it didn't mean anything consistent going forward.
More damning for gold is the fact that other times it enjoyed 100-day stretches like its current one, it almost invariably fell back in the month(s) ahead. We don't place a lot of weight on analogs though it does support the idea of a headwind when coupled with such high optimism as it's been seeing.
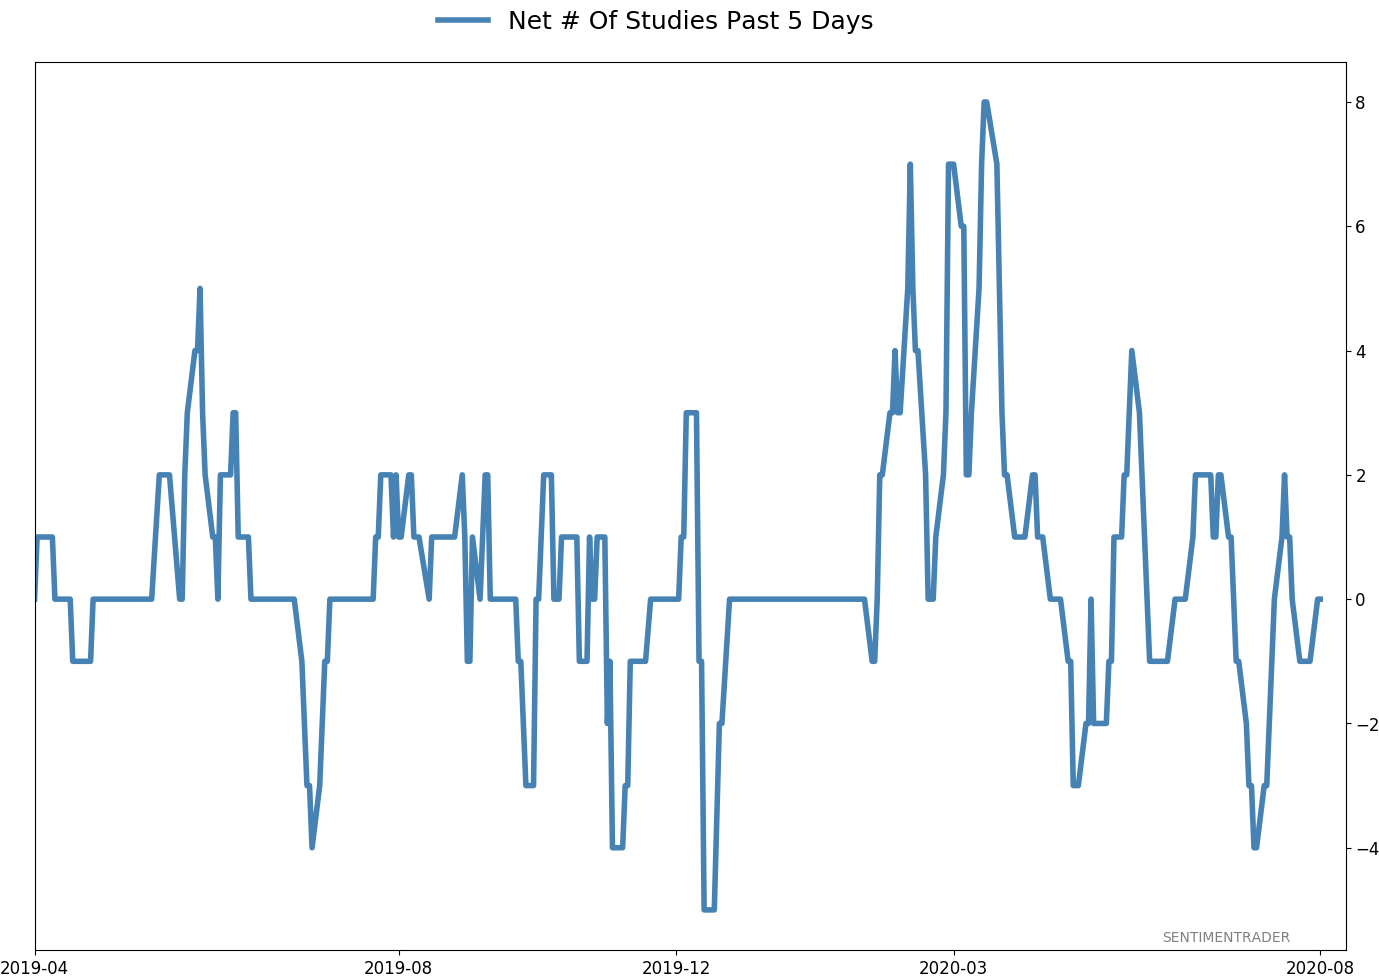
Active Studies
| Time Frame | Bullish | Bearish | | Short-Term | 0 | 1 | | Medium-Term | 8 | 12 | | Long-Term | 46 | 1 |
|
Indicators at Extremes
Portfolio
| Position | Weight % | Added / Reduced | Date | | Stocks | 29.8 | Reduced 9.1% | 2020-06-11 | | Bonds | 0.0 | Reduced 6.7% | 2020-02-28 | | Commodities | 5.2 | Added 2.4%
| 2020-02-28 | | Precious Metals | 0.0 | Reduced 3.6% | 2020-02-28 | | Special Situations | 0.0 | Reduced 31.9% | 2020-03-17 | | Cash | 65.0 | | |
|
Updates (Changes made today are underlined)
After stocks bottomed on March 23rd, they enjoyed a historic buying thrust and retraced a larger amount of the decline than "just a bear market rally" tends to. Through June, there were signs of breadth thrusts, recoveries, and trend changes that have an almost unblemished record at preceding higher prices over a 6-12 month time frame. On a shorter-term basis, our indicators have been showing high optimism, with Dumb Money Confidence recently above 80%, along with signs of reckless speculation during what appears to be an unhealthy market environment, historically a bad combination. While there are certainly some outlier indicators that are showing apathy or even outright pessimism, a weight-of-the-evidence approach suggests high risk over a multi-week to multi-month time frame. I've been carrying a low (too low) level of exposure to stocks, as well as bonds and gold. I don't see a good opportunity to add to any of those currently, with poor prospects pretty much all the way around. As worried as I am over the medium-term, I would only grudgingly reduce my exposure even further given the longer-term positives we spent so much time discussing in the spring. At this point, I would only look seriously at lowering exposure further if the S&P 500 drops below approximately 3220, an initial sign that its recent mini-breakout had failed.
RETURN YTD: -2.5% 2019: 12.6%, 2018: 0.6%, 2017: 3.8%, 2016: 17.1%, 2015: 9.2%, 2014: 14.5%, 2013: 2.2%, 2012: 10.8%, 2011: 16.5%, 2010: 15.3%, 2009: 23.9%, 2008: 16.2%, 2007: 7.8%
|
|
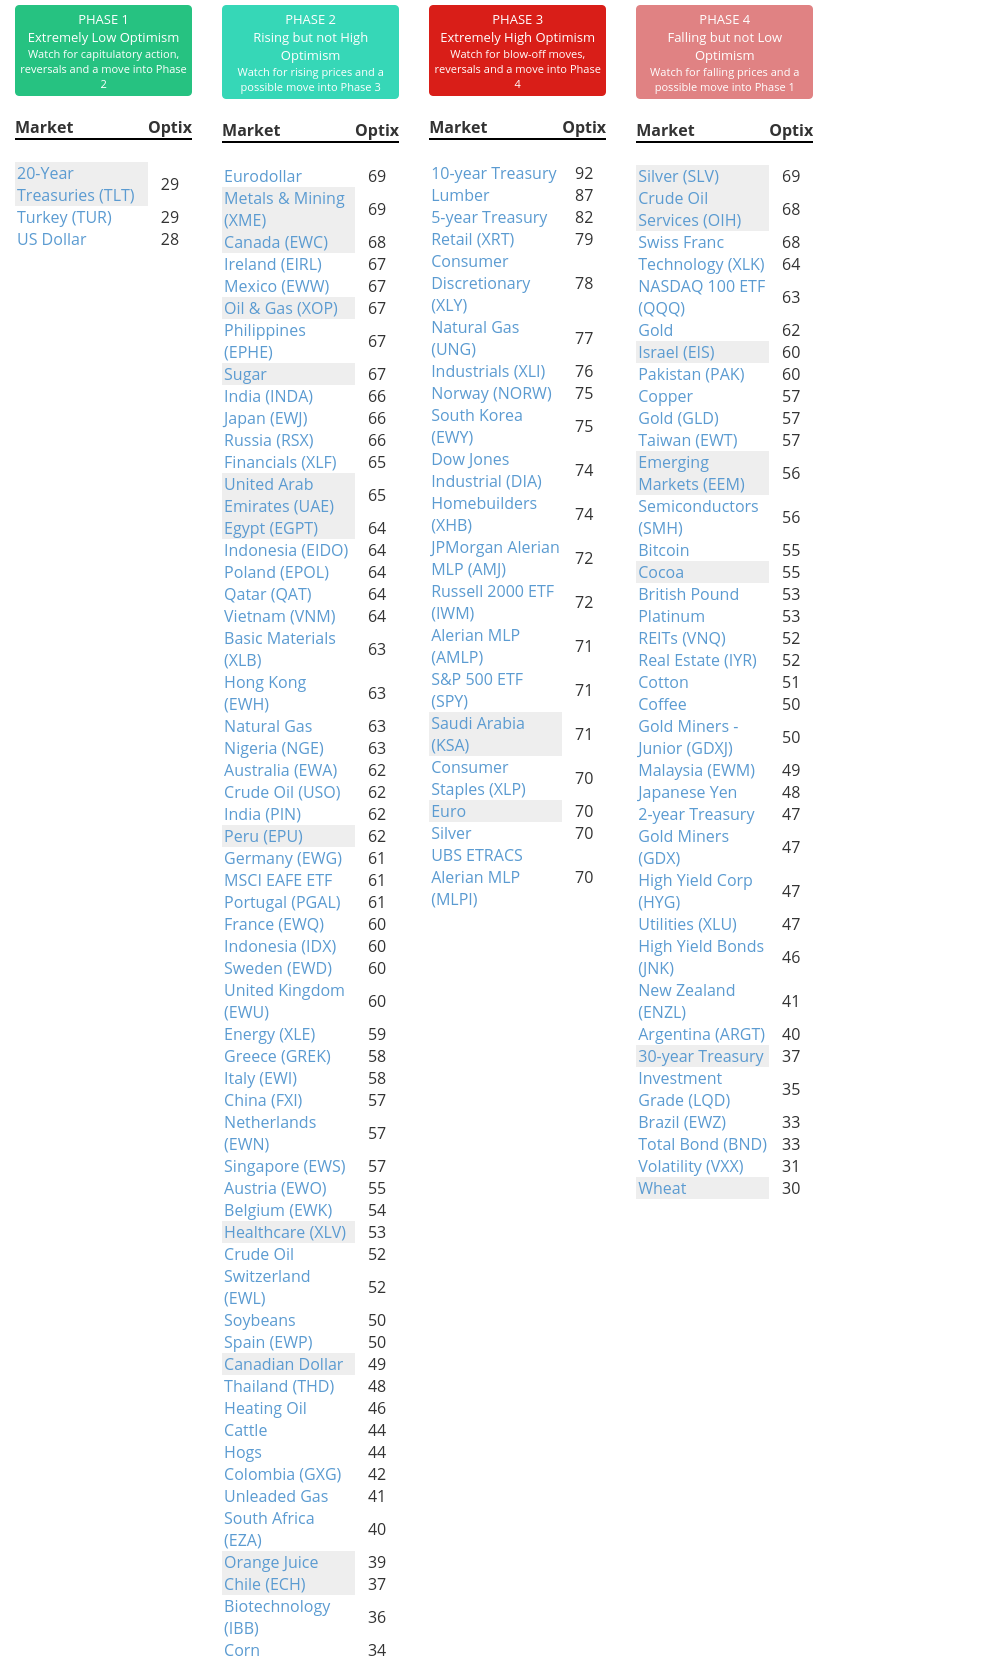
Phase Table
Ranks
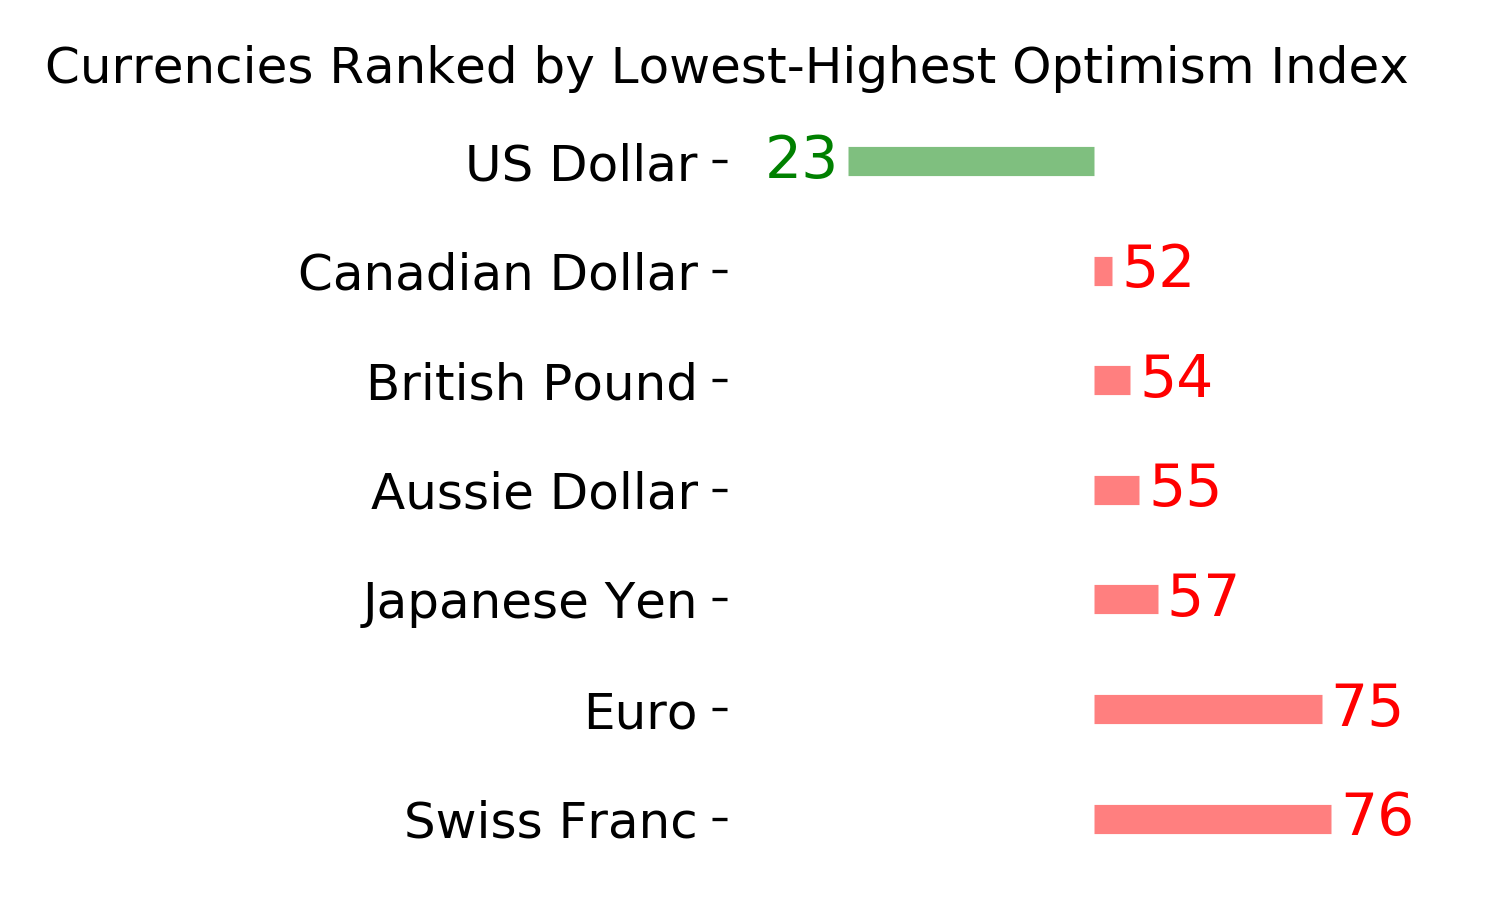
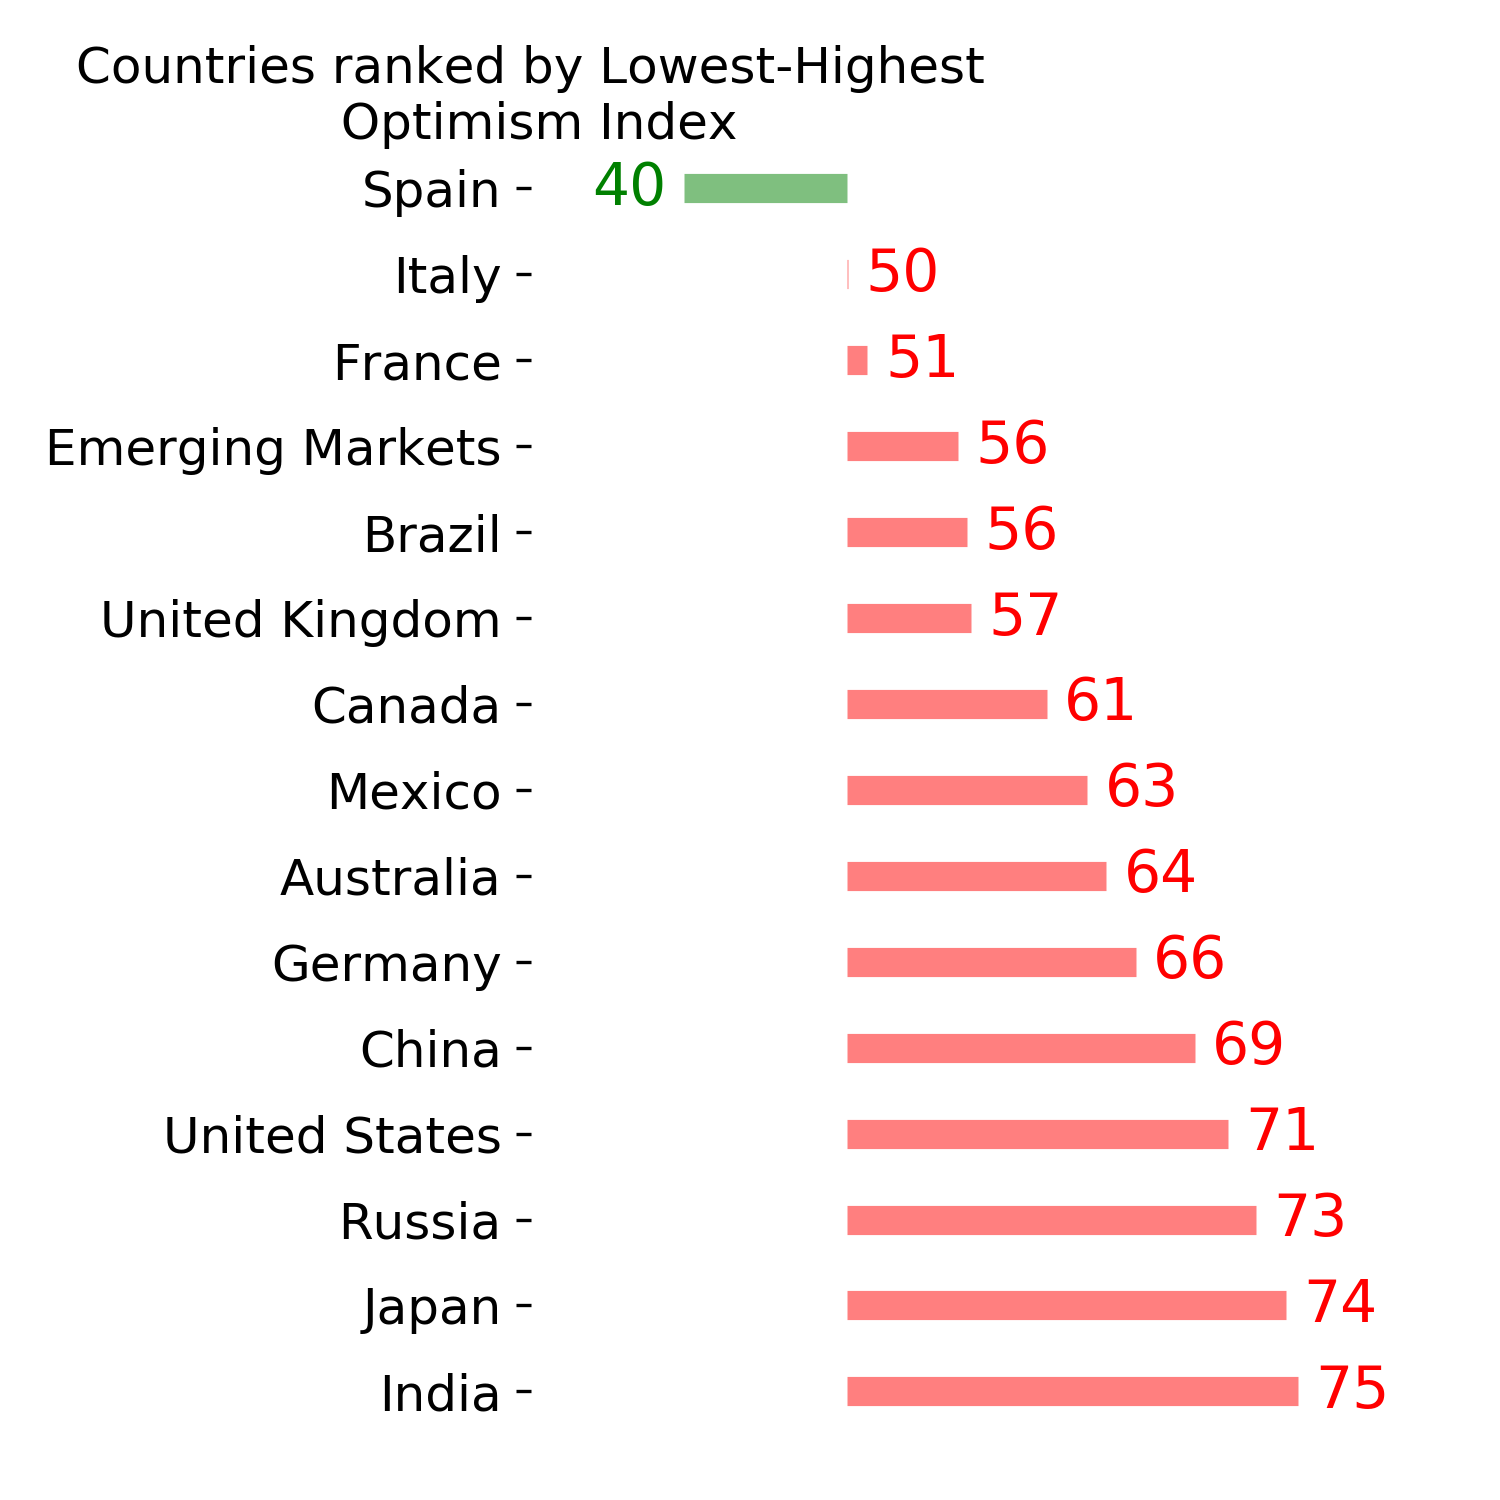
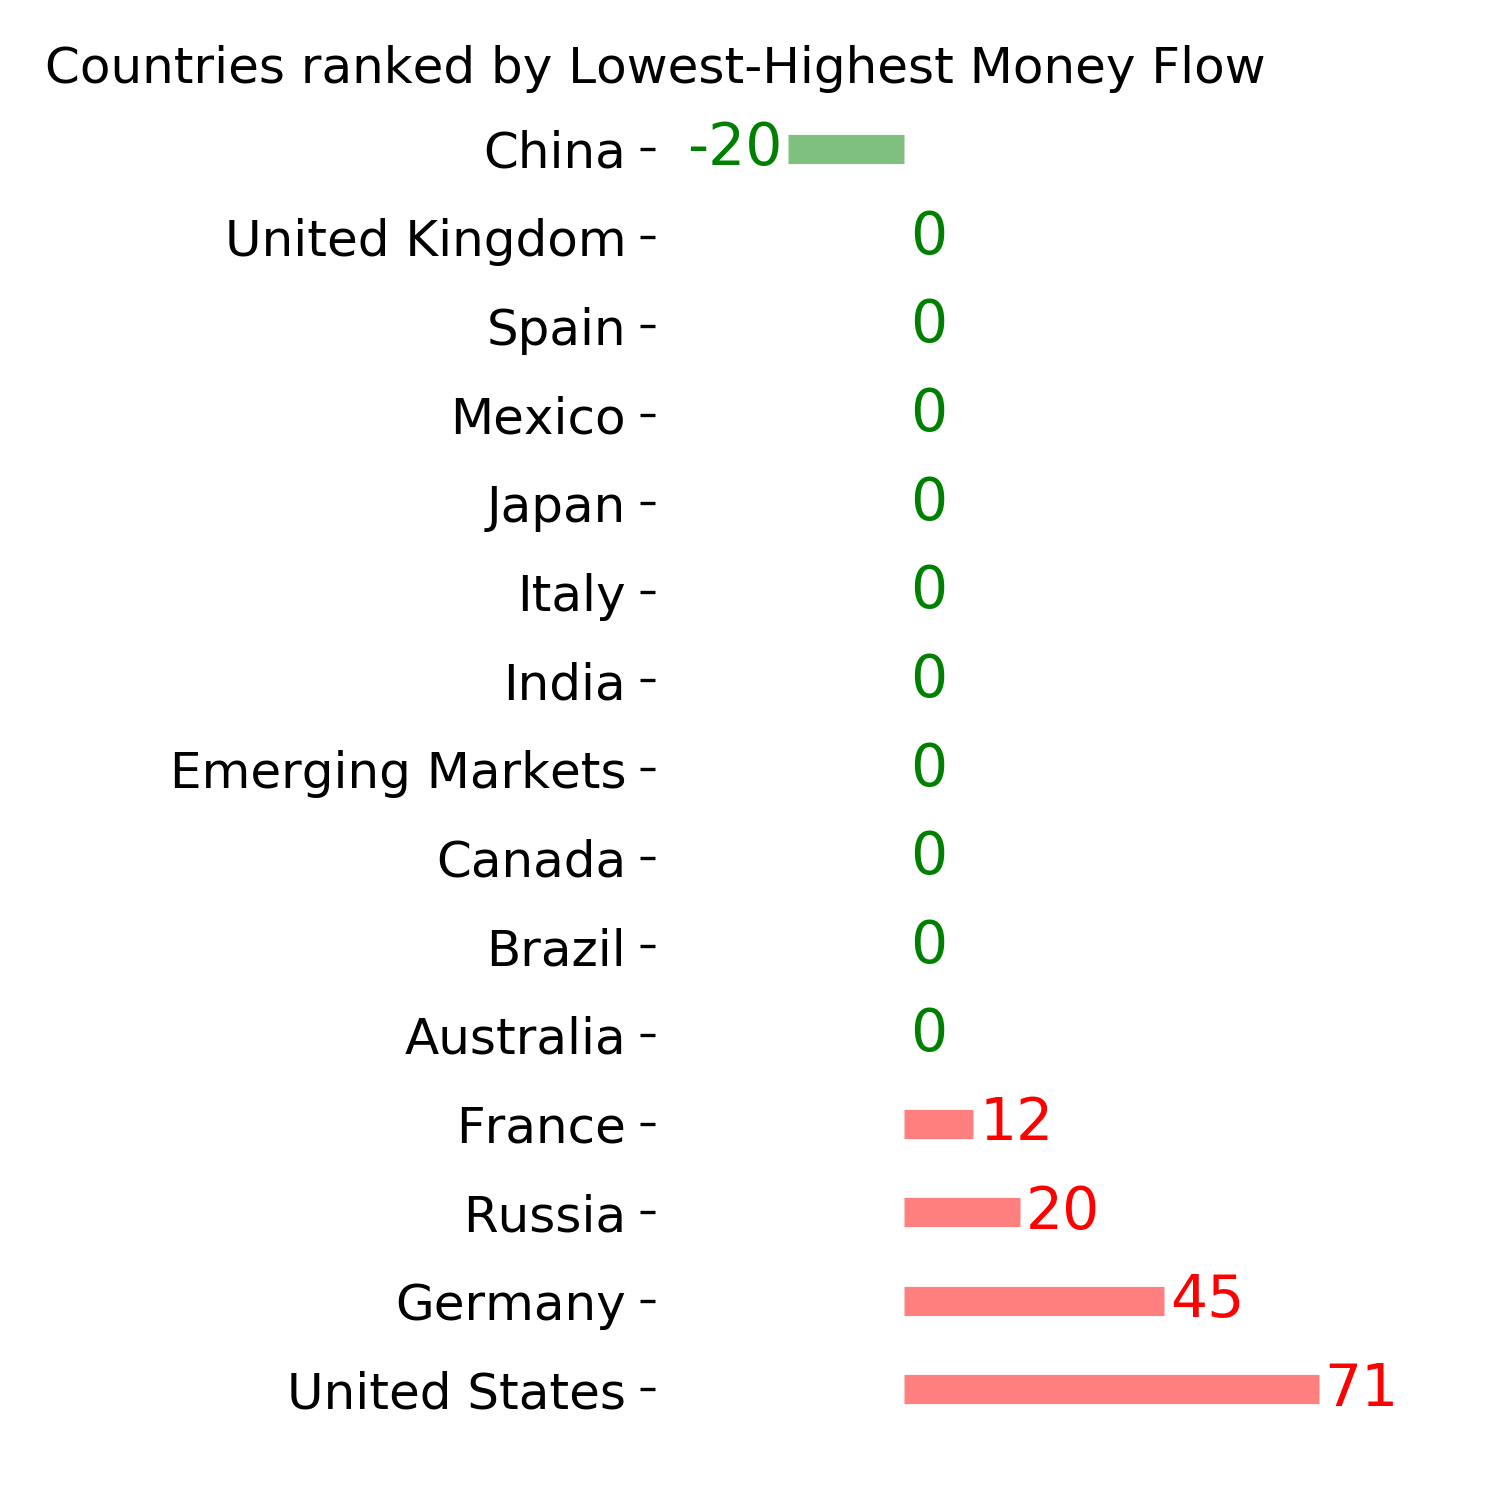
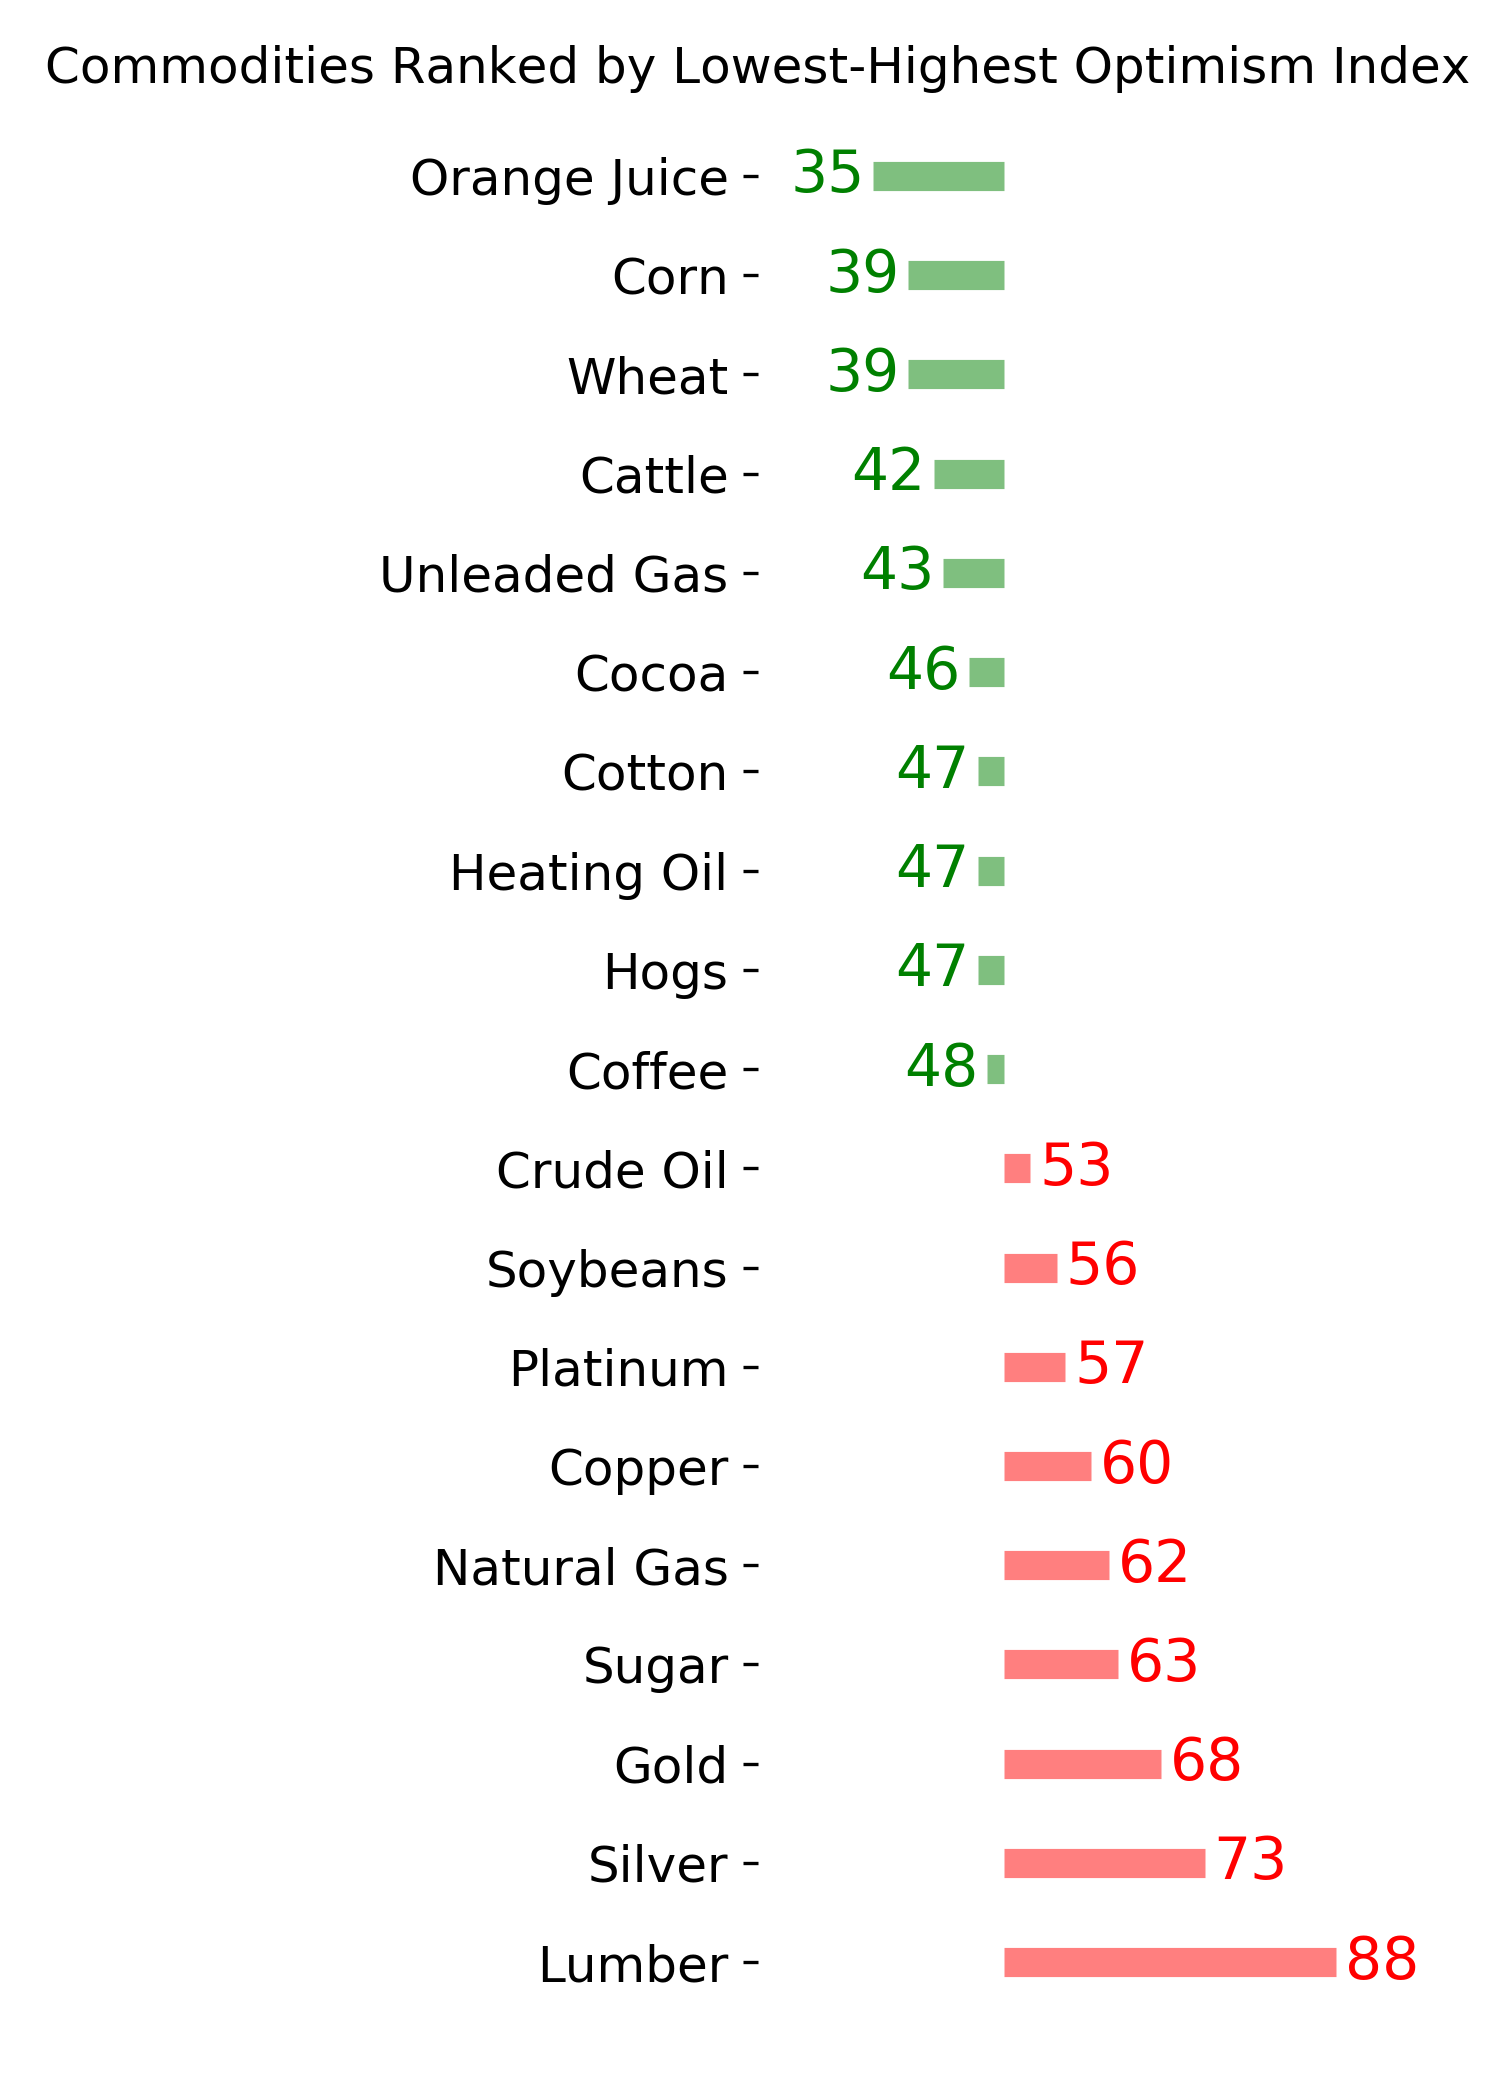
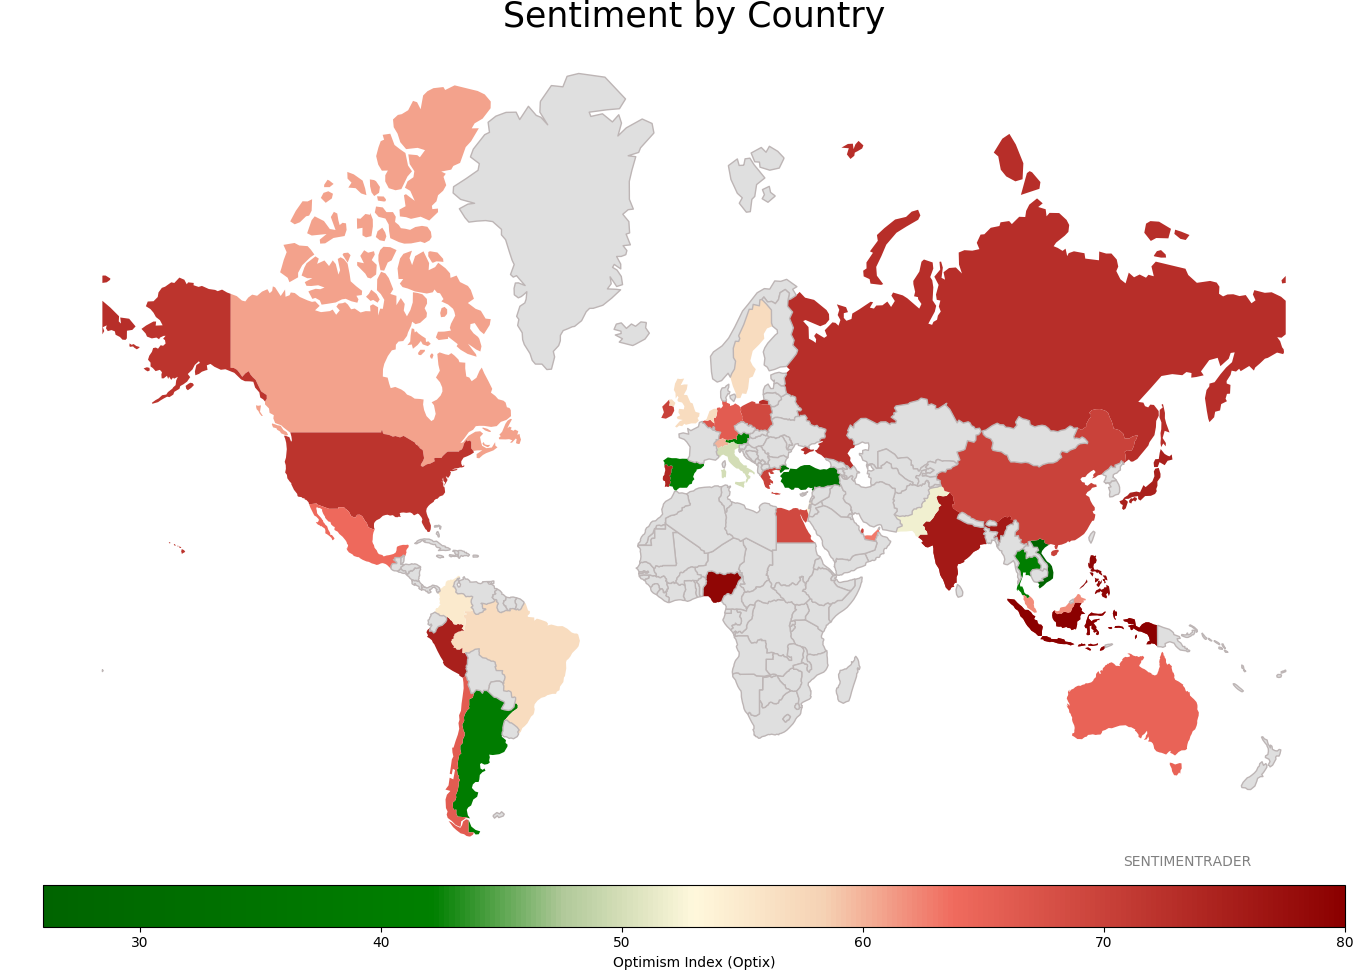
Sentiment Around The World
Optimism Index Thumbnails
|
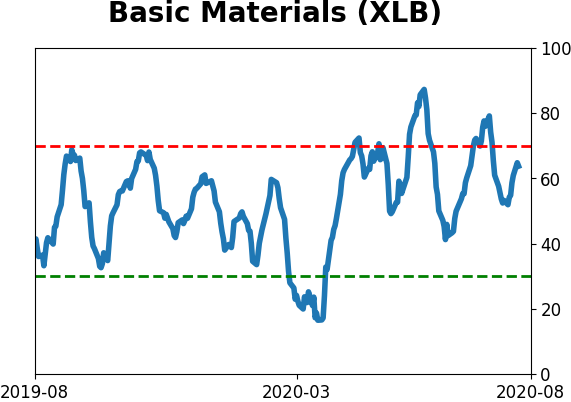
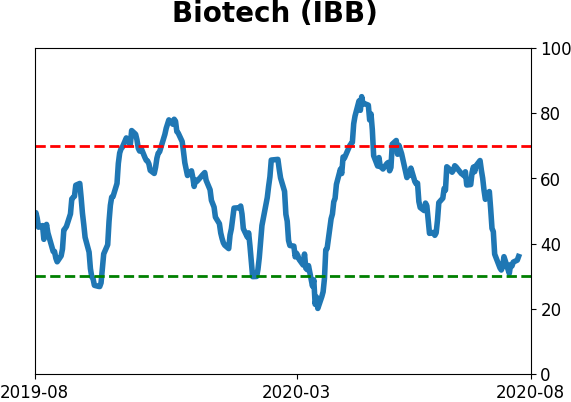
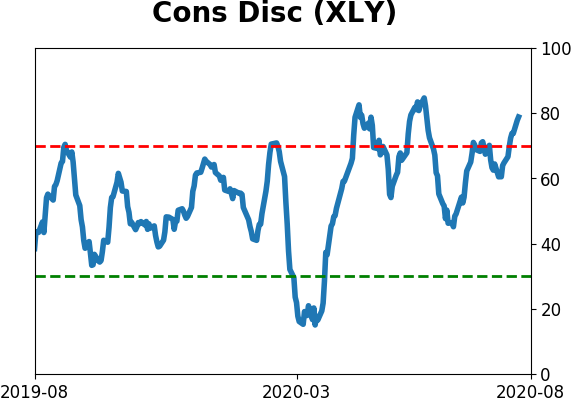
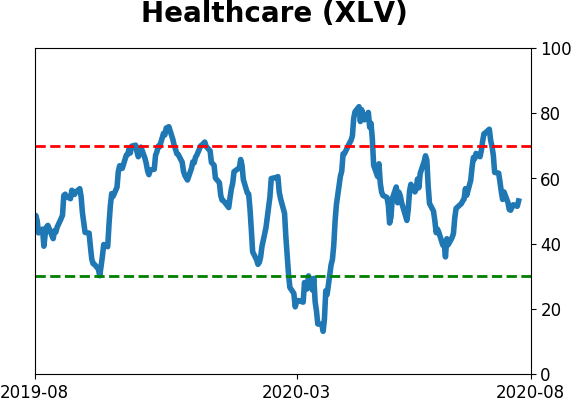
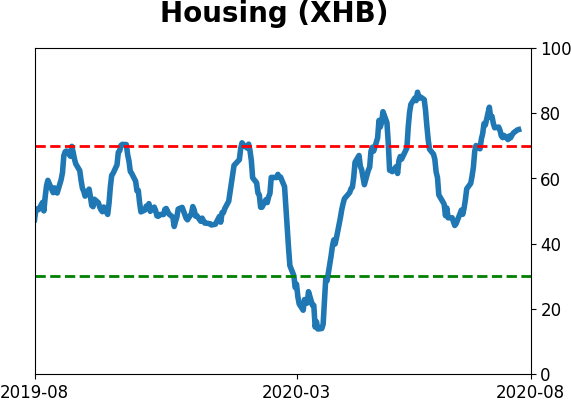
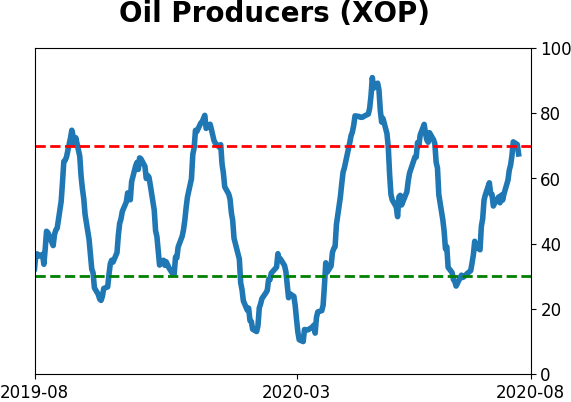
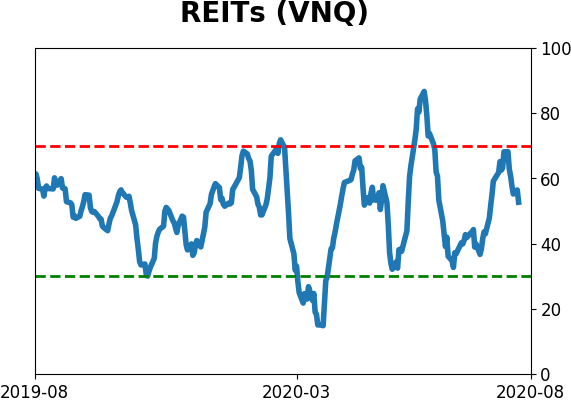
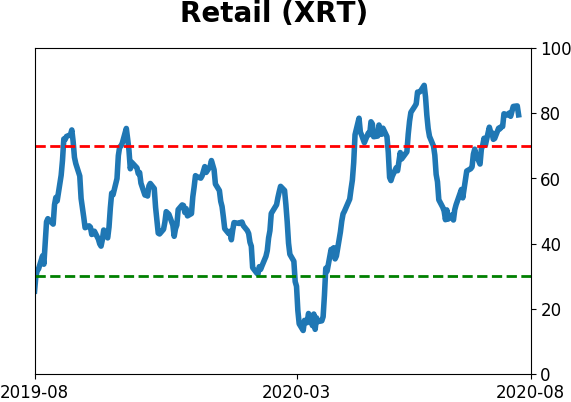
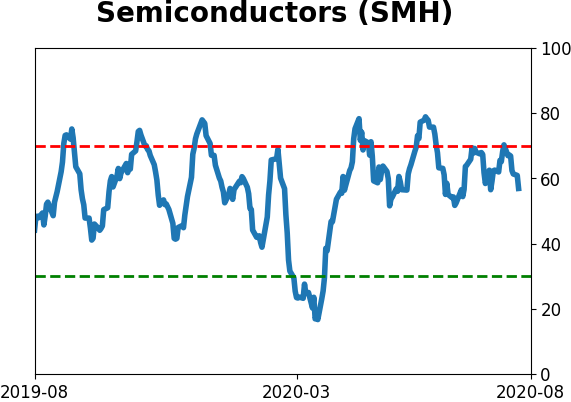
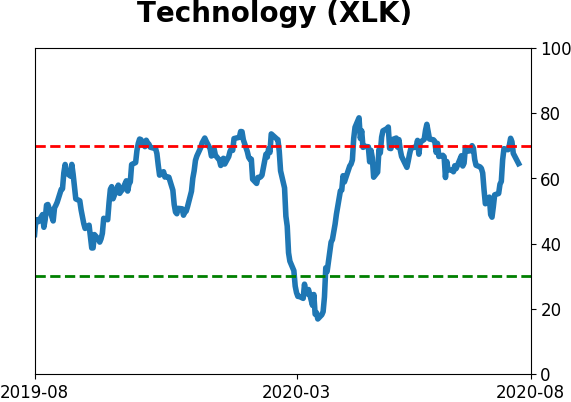
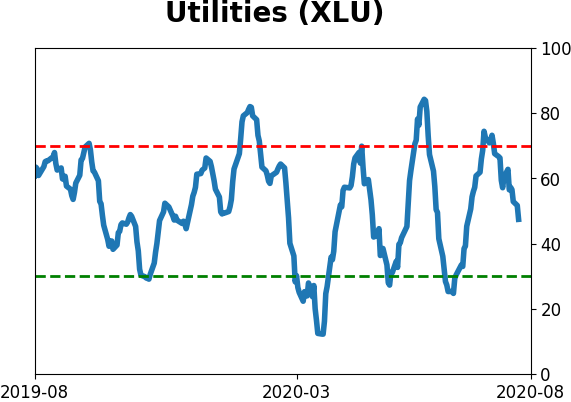
Sector ETF's - 10-Day Moving Average
|
|
|
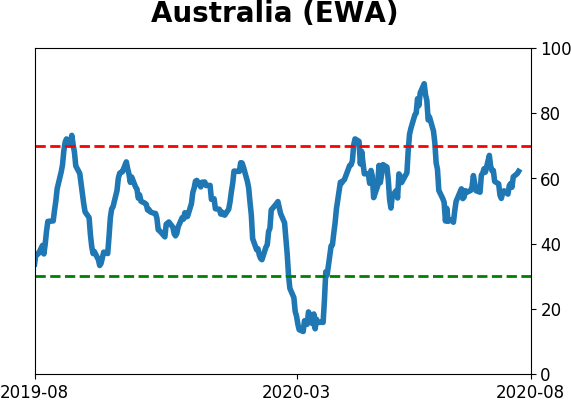
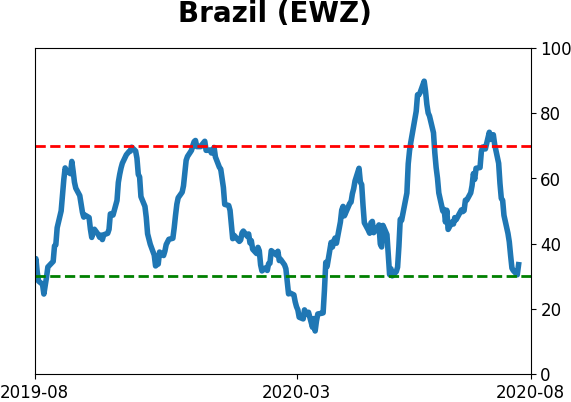
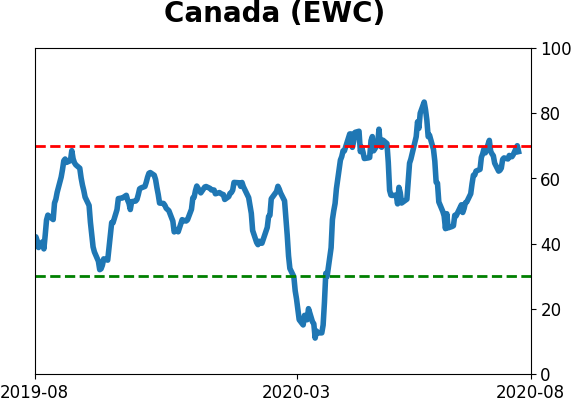
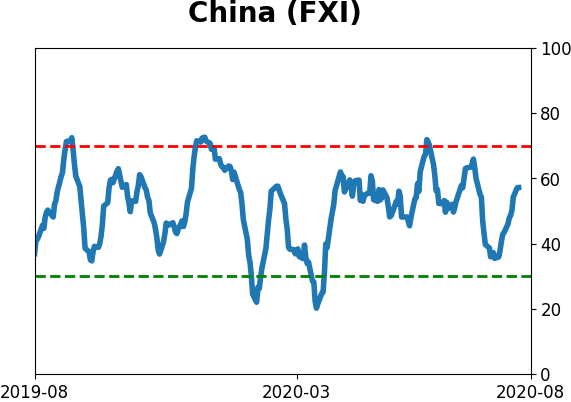
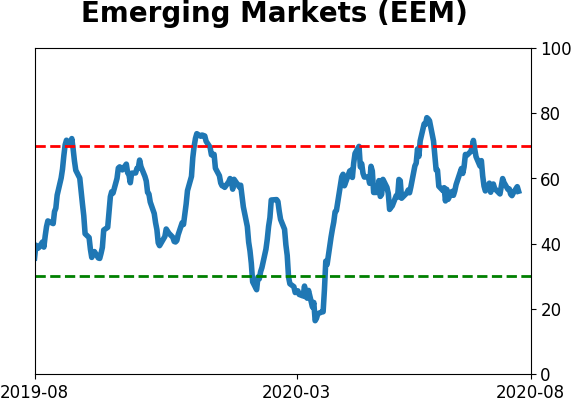
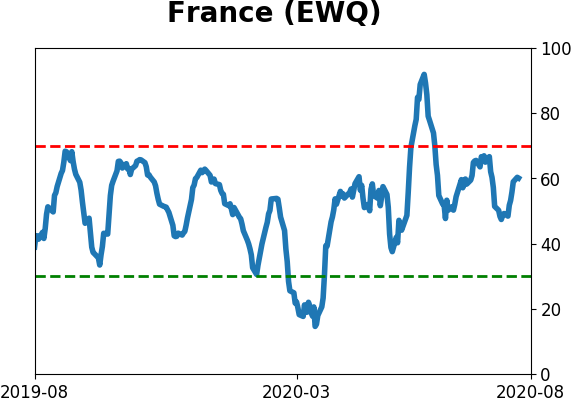
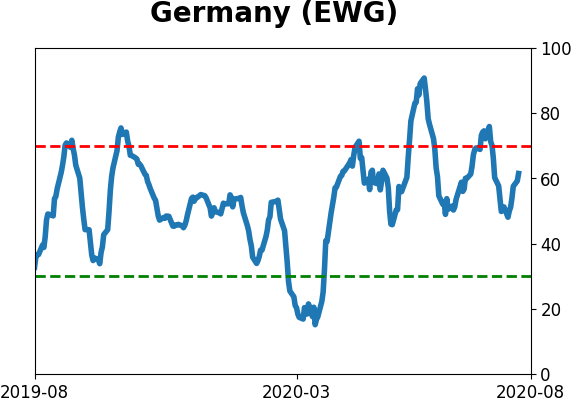
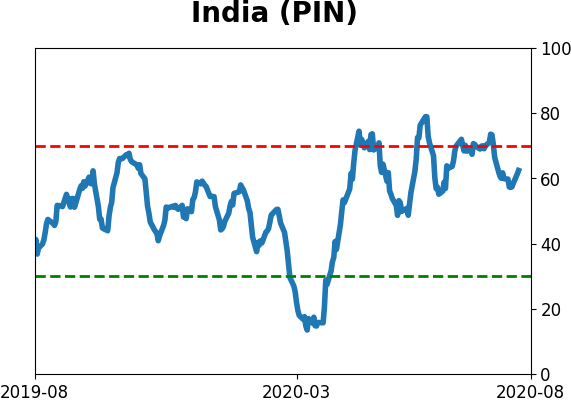
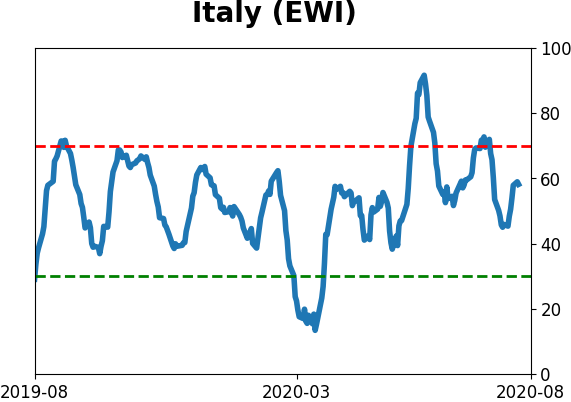
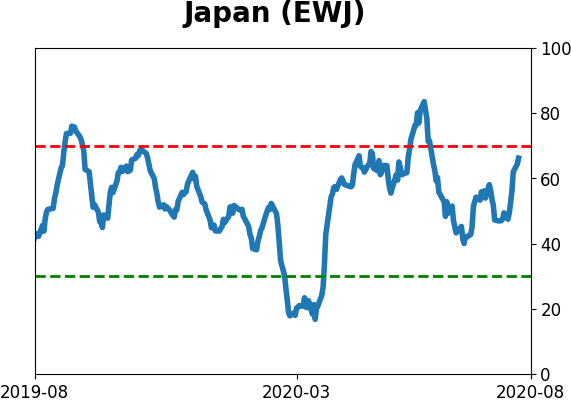
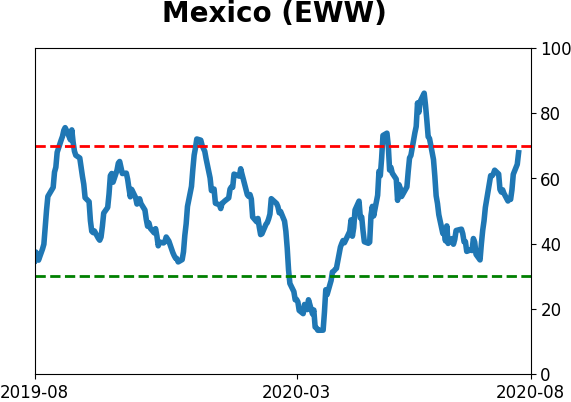
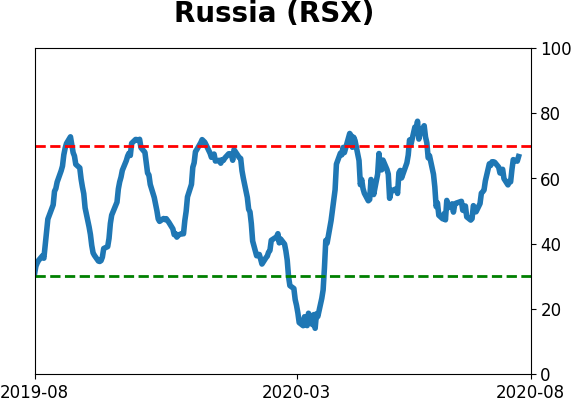
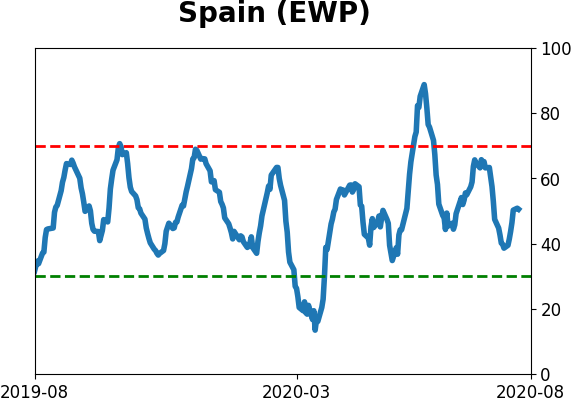
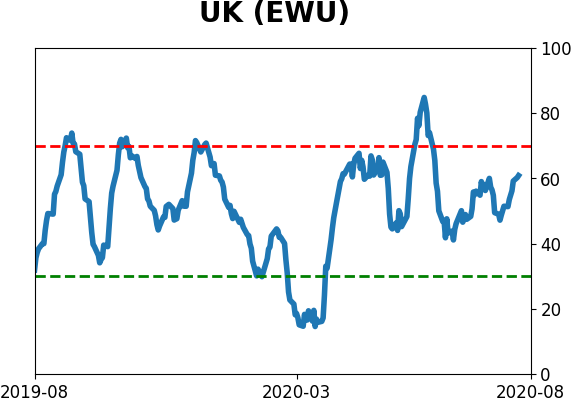
Country ETF's - 10-Day Moving Average
|
|
|
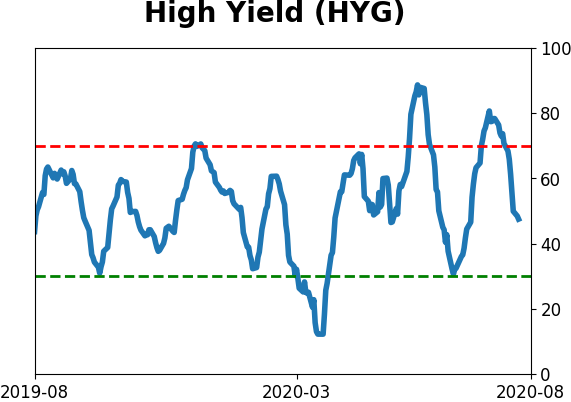
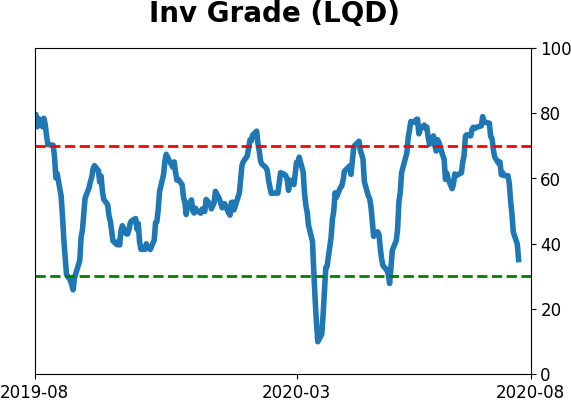
Bond ETF's - 10-Day Moving Average
|
|
|
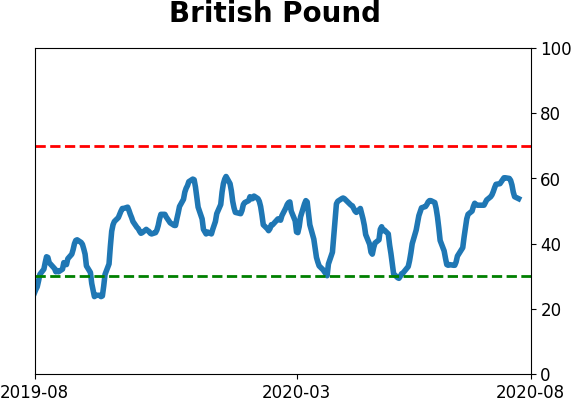
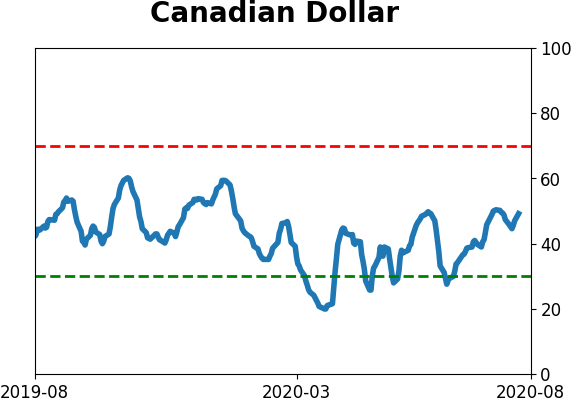
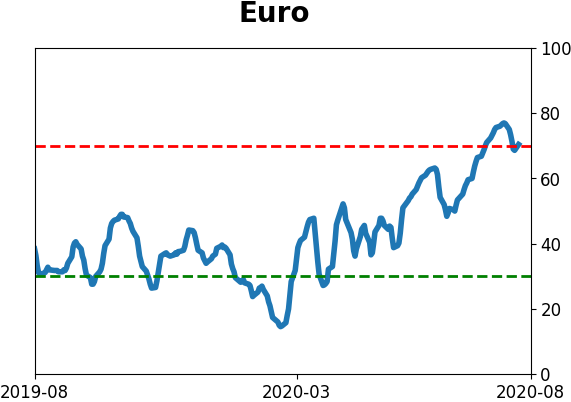
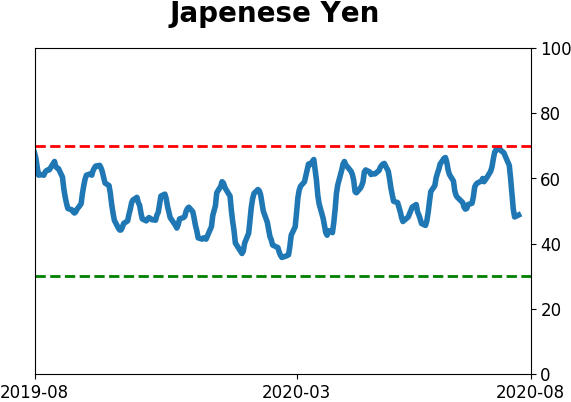
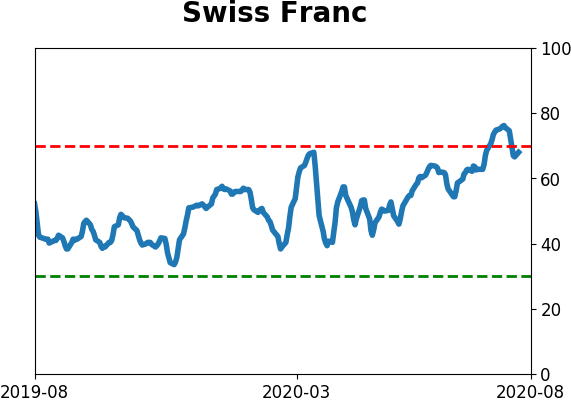
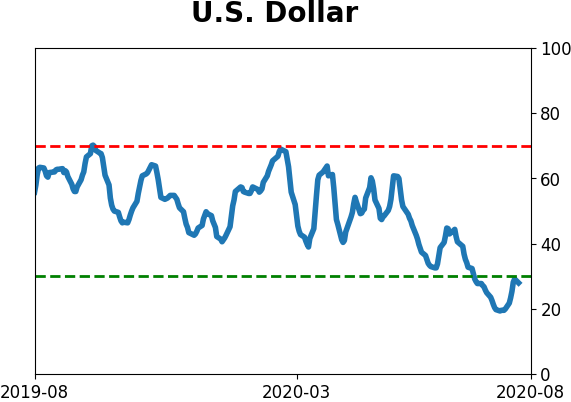
Currency ETF's - 5-Day Moving Average
|
|
|
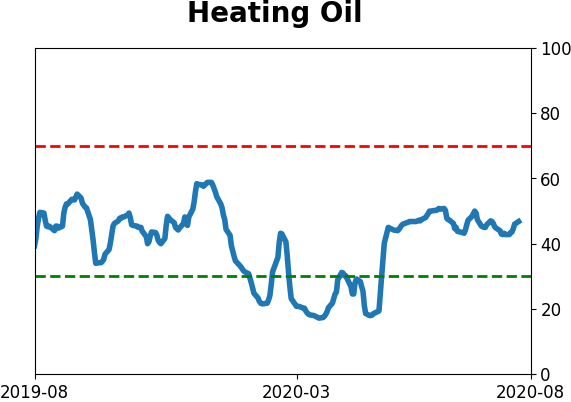
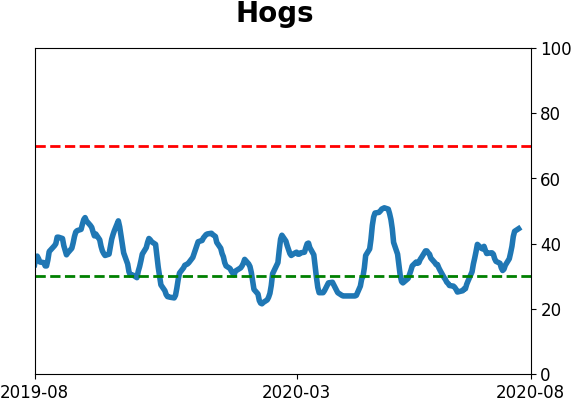
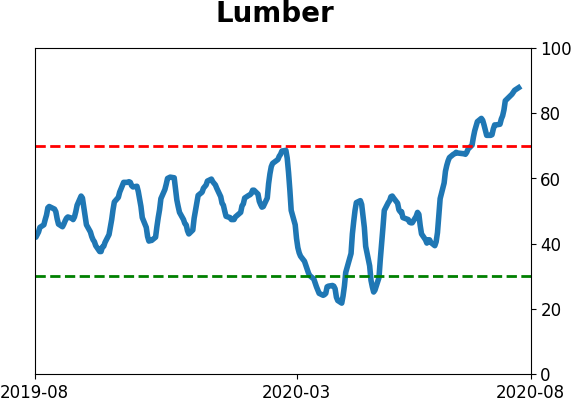
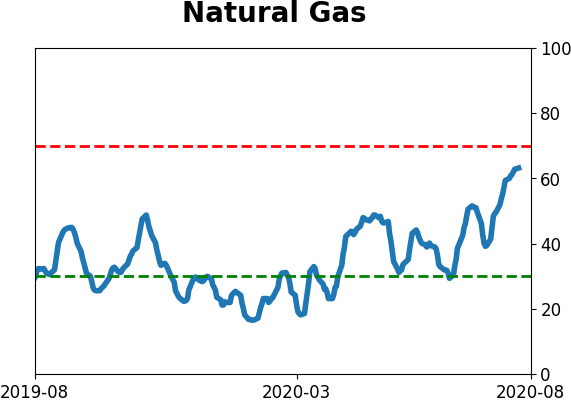
Commodity ETF's - 5-Day Moving Average
|
|