Headlines
|
|
Market environment and momentum vs sentiment:
The past week saw the market environment improve somewhat but it remains neutral at best. During neutral markets, bouts of high optimism, like we continue to see now, tend to lead to below-average returns. Other markets are also showing extreme momentum, but that took a hit with some intra-week reversals.
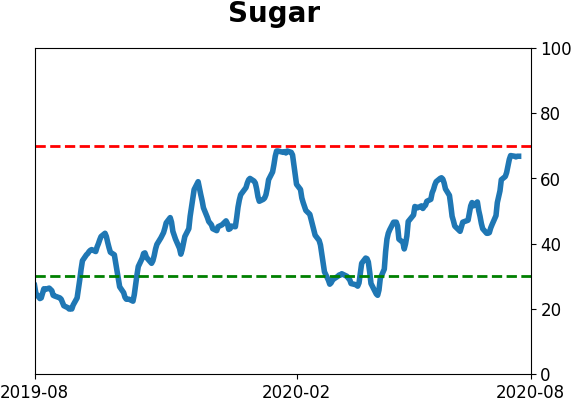
The latest Commitments of Traders report was released, covering positions through Tuesday: The 3-Year Min/Max Screen shows that "smart money" hedgers mostly maintained their recent positions, adding a bit more to their long dollar, short euro and franc exposures. They reversed a tiny bit of their large long position in corn, while selling sugar aggressively. They only just started covering a large short in 10-year Treasuries. Curiously, they continue to buy major index equity futures. They're back to a nearly $40 billion net long position. This should be a major positive for stocks, as it has been for the past decade. The biggest worry, as it has been for weeks on end, is that this behavior is so out of character, which makes it a bit more difficult to rely upon.
2nd best start to August, next to 2000: This has been the 2nd-best start to August in 30 years, only exceeded by the year 2000. The S&P 500 has rallied 7 out of the first 10 days, gaining more than 2% in the process. After the other "best starts to August" the S&P showed a negative return either 2 or 3 months later after 8 of the 9 signals.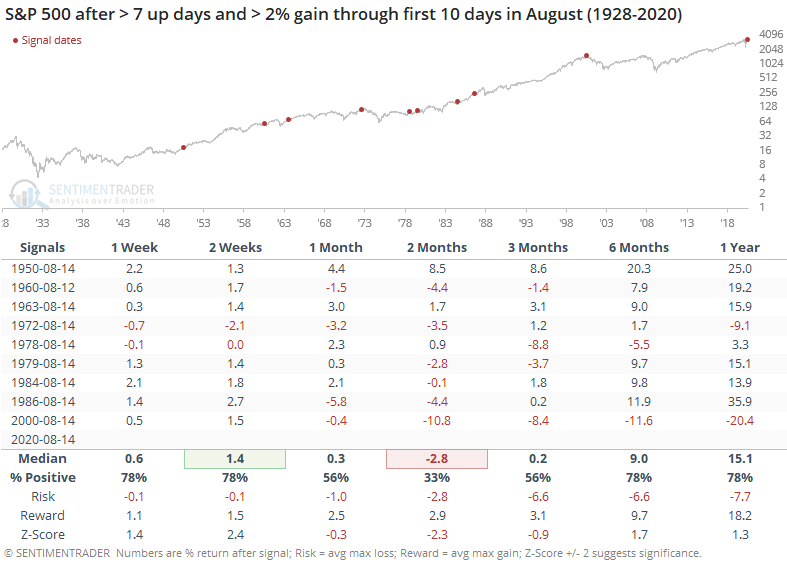
Bottom Line:
- Weight of the evidence has been suggesting flat/lower stock prices short- to medium-term again; still suggesting higher prices long-term
- Indicators show high optimism, with Dumb Money Confidence above 80% with signs of reckless speculation during what appears to be an unhealthy market environment, historically a bad combination, though it's easing somewhat
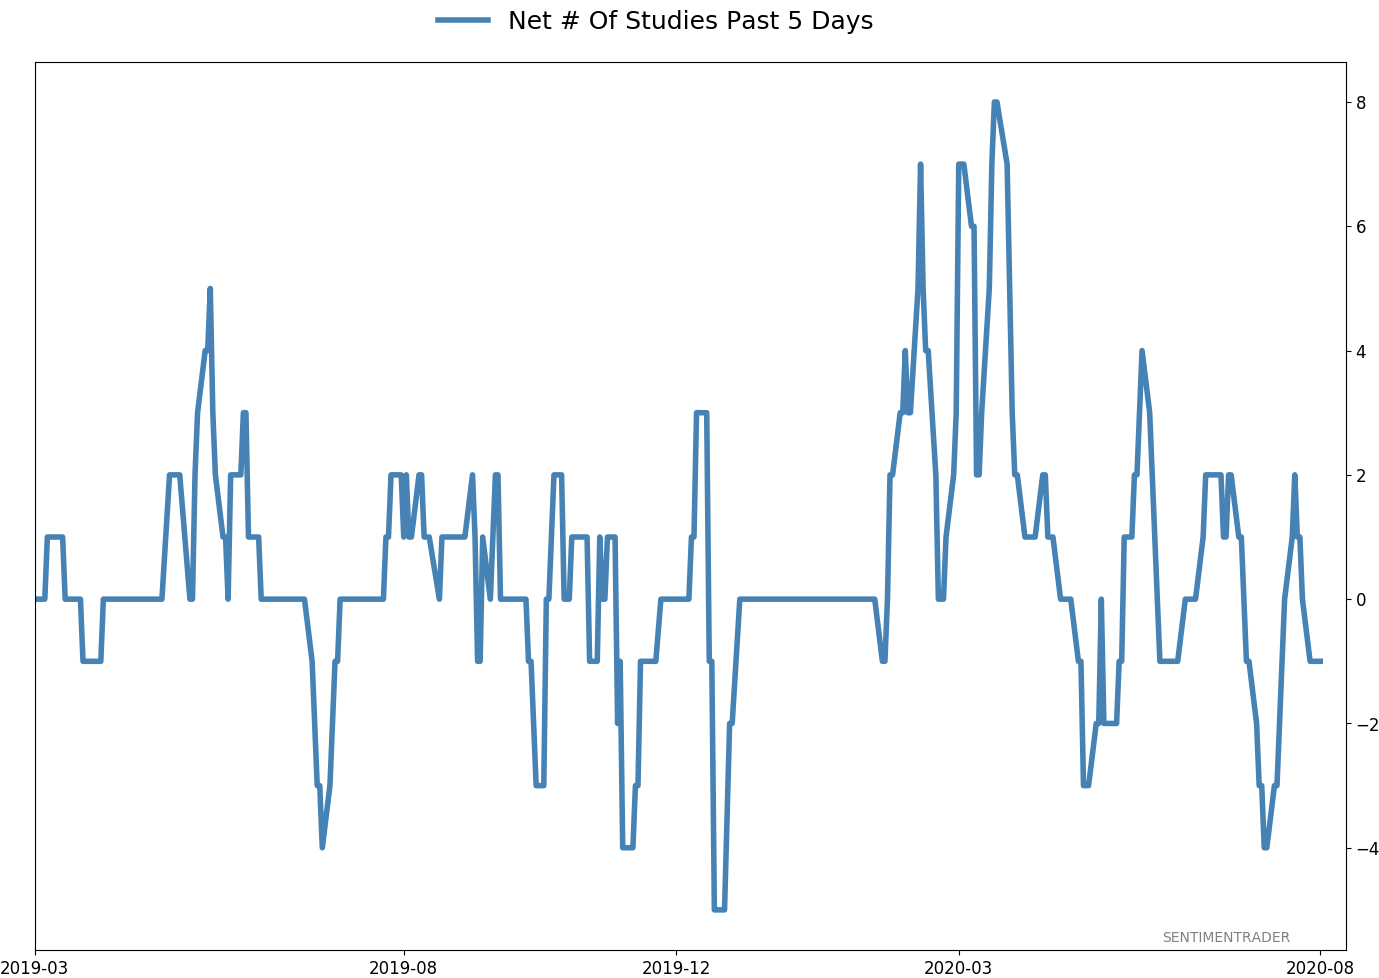
- Active Studies show a heavy positive skew over the medium- to long-term; breadth thrusts, recoveries, and trend changes have an almost unblemished record at preceding higher prices over a 6-12 month time frame
- Signs of extremely skewed preference for tech stocks neared exhaustion by late June, especially relative to industrials and financials (here and here)
- Indicators and studies for other markets are showing less consistent forward results, though it's not a great sign for Treasuries that hedgers are net short and optimism on metals recently became extreme, with "perfect" breadth among miners recently dipping a bit...perhaps the Buffett disclosure on Friday is a game-changer for this sector
|
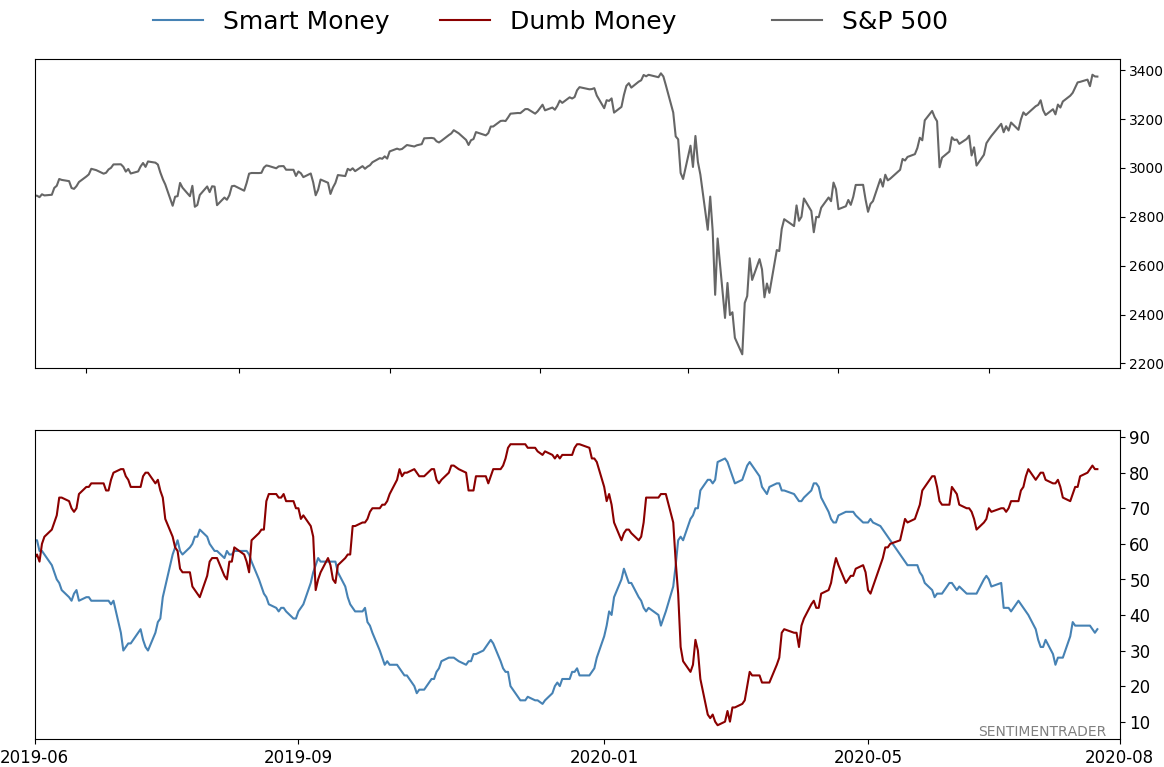
Smart / Dumb Money Confidence
|
Smart Money Confidence: 36%
Dumb Money Confidence: 81%
|
|
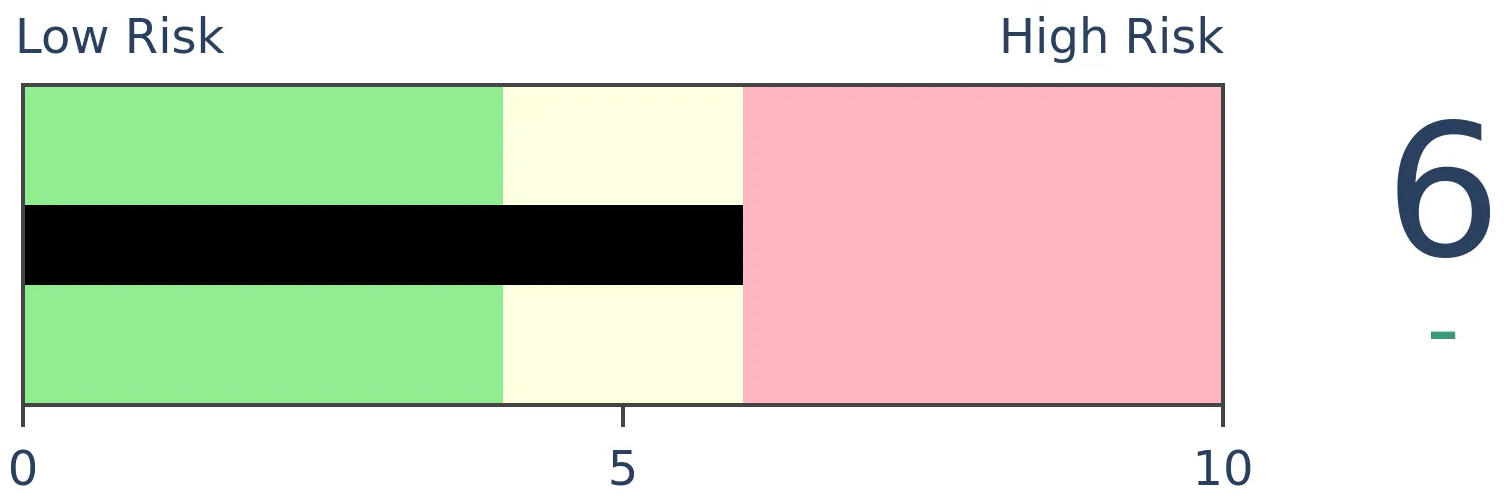
Risk Levels
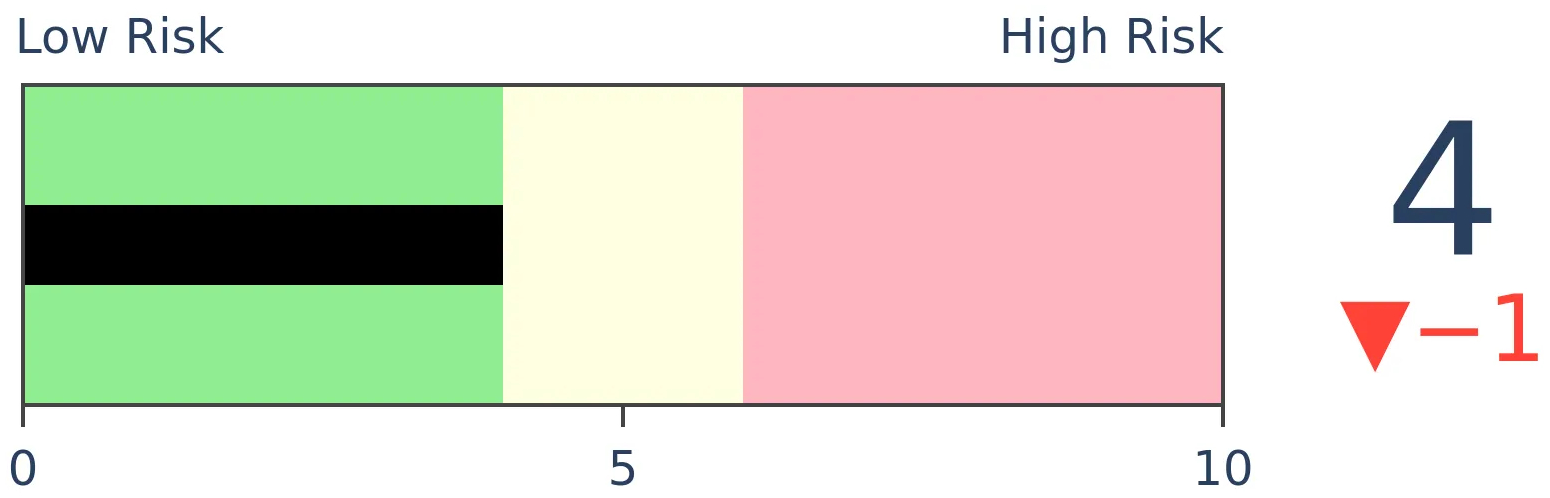
Stocks Short-Term
|
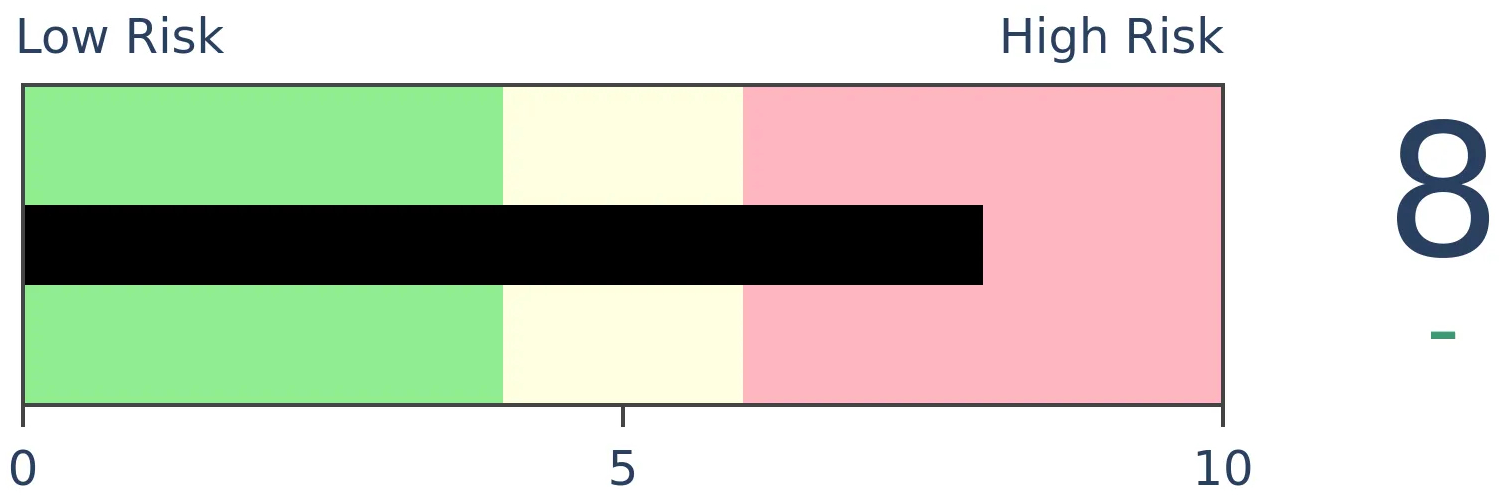
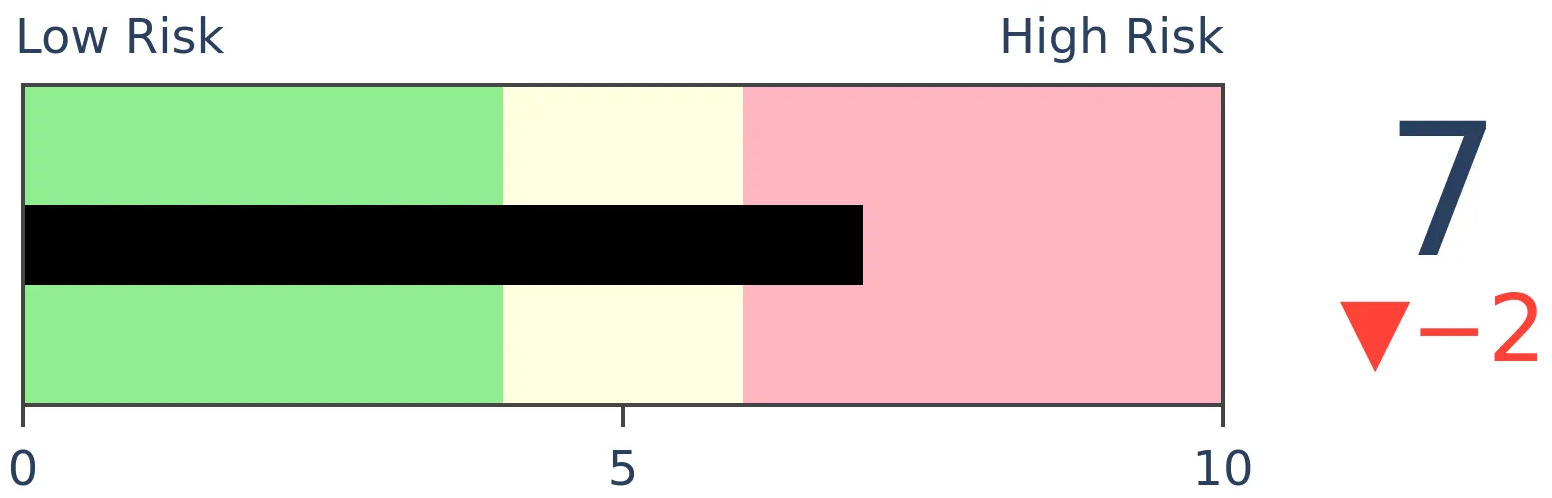
Stocks Medium-Term
|
|
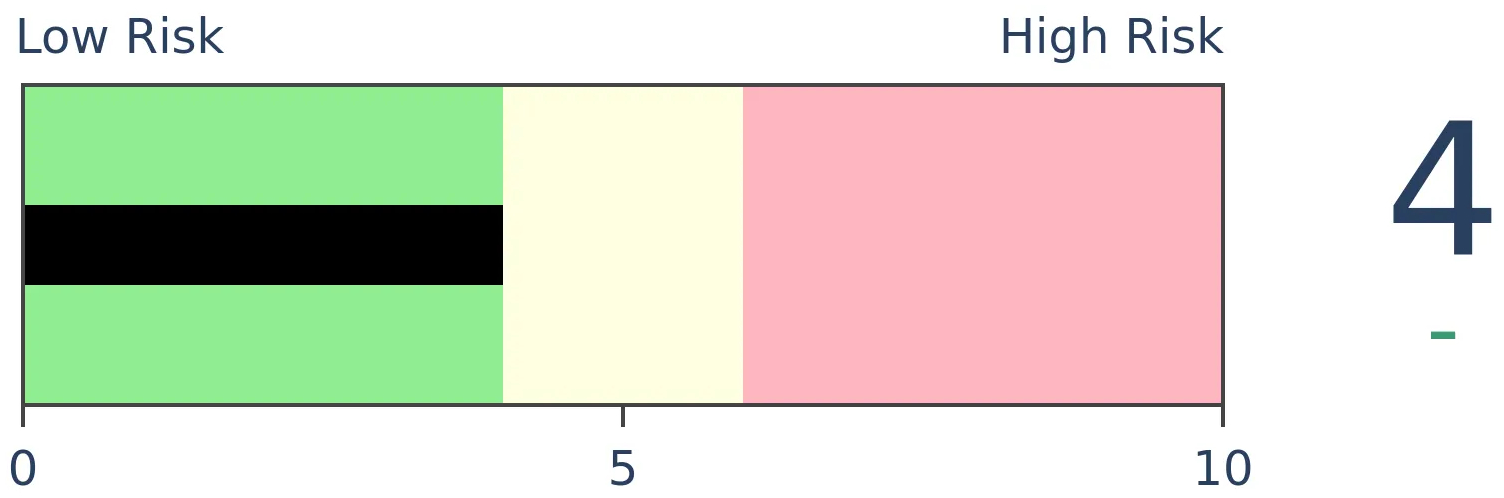
Bonds
|
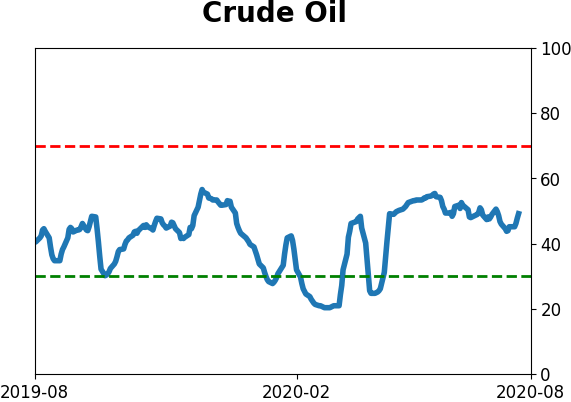
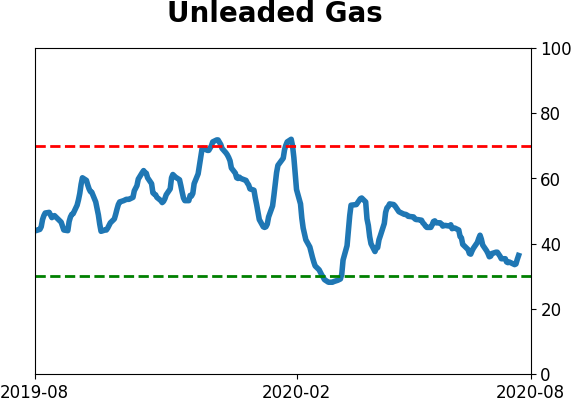
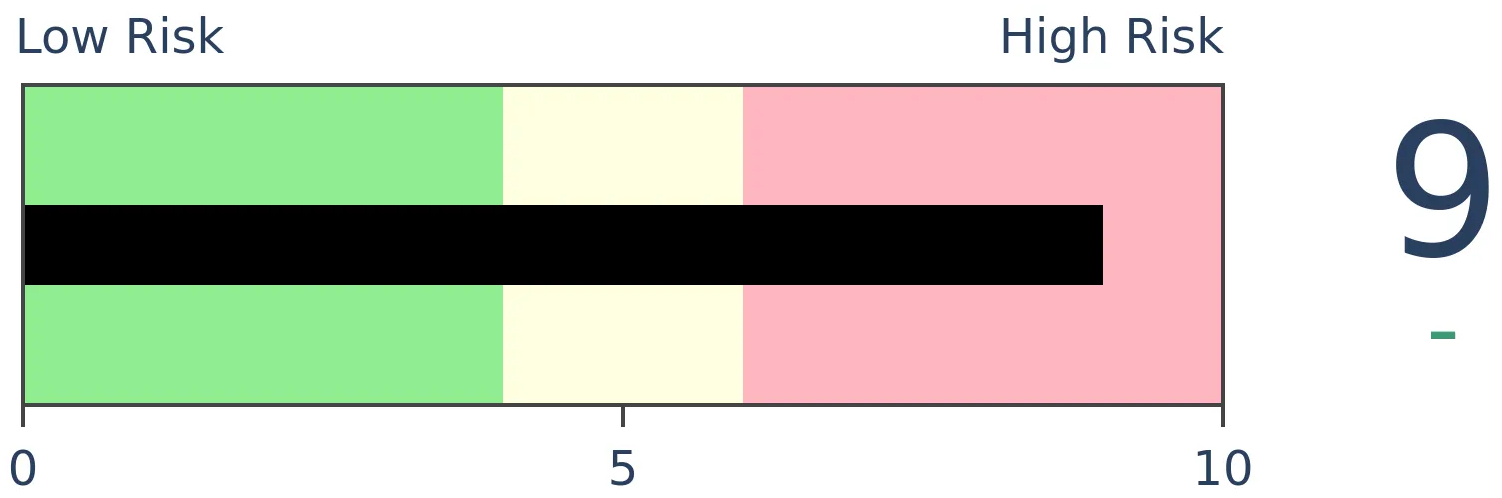
Crude Oil
|
|
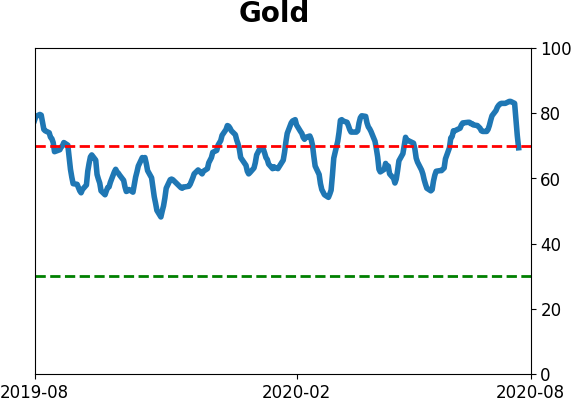
Gold
|
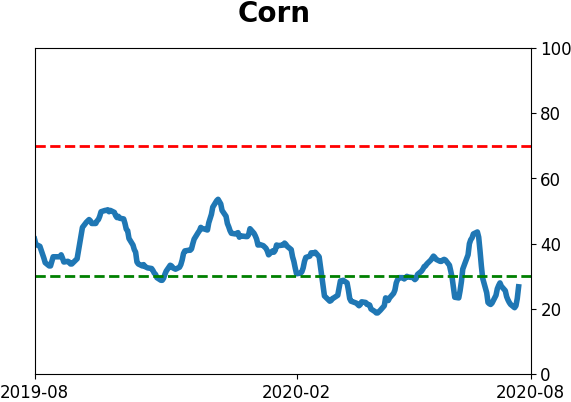
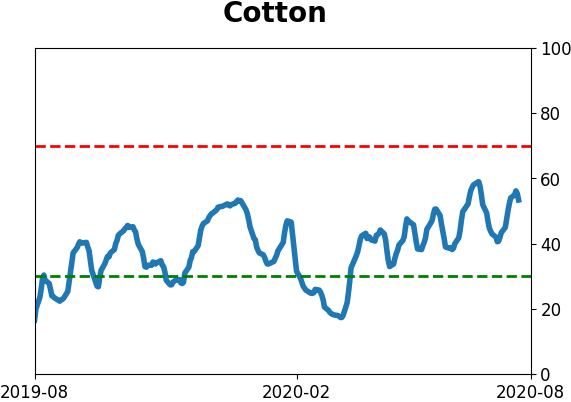
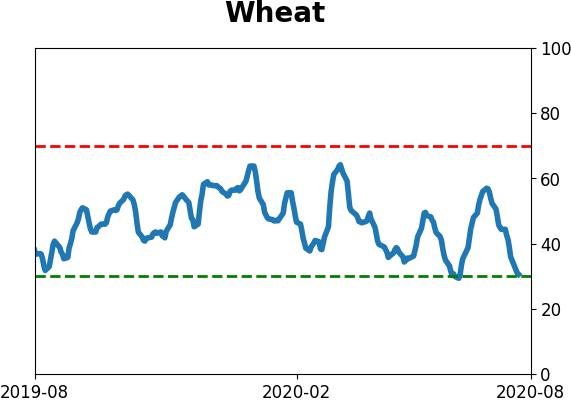
Agriculture
|
|
Research
BOTTOM LINE
The past week saw the market environment improve somewhat but it remains neutral at best. During neutral markets, bouts of high optimism, like we continue to see now, tend to lead to below-average returns. Other markets are also showing extreme momentum, but that took a hit with some intra-week reversals.
FORECAST / TIMEFRAME
None
|
The biggest knock against stocks is that we've been seeing high optimism during an unhealthy market environment. There are a few indicators showing exceptions to the former and a couple to the latter, but it started triggering during late July and hasn't changed much.
Momentum and market environment is mixed
For market environment, there are three key tests we use:
- Is it above a rising 200-day average?
- Is it setting higher highs and higher lows?
- Is there broad participation?
For the S&P 500, the answers are "yes", "not really", and "not really".
Opinions can differ on the last two. For point #2, the index still hasn't emphatically exceeded its February high, and its March low was lower than its 2019 low. At best, this is neutral. For #3, the advance/decline line has hit new highs, but the stocks-only version has not and we've seen a bunch of really odd readings on various days since July 21. The focus on the biggest stocks has masked quite a few issues in recent weeks.
When we see clusters of oddities like this, it has a good track record of preceding weakness. The biggest caveat is that they also triggered often during the spring and summer of 2017, and stocks transitioned to one of those creeper mo-mo trends that is so unfriendly to contrarian thinking. That type of behavior has been the exception more than the rule, however.
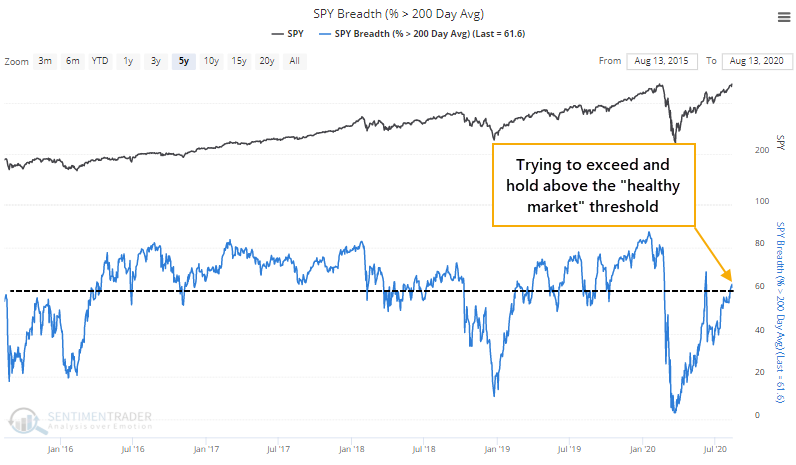
Still, we're now seeing more than 60% of S&P 500 stocks hold above their 200-day averages, if only barely. Healthy markets see this figure hold above 60% consistently. When it happened in June, sellers quickly stepped in. This will be important to watch in the coming weeks.
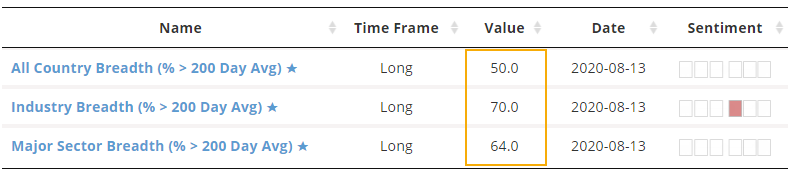
There has also been an improvement in the percentages of industries, sectors, and countries above their averages, but it's not decisive.
The argument that we're in an unhealthy environment has lost some of its persuasiveness over the past few weeks, but from the way we've looked at things over the years, the best we could say is that it has improved from poor to the weak side of neutral. In those kinds of environments, bouts of high optimism still tend to lead to below-average or outright negative returns over a multi-month time frame.
Sentiment is still (mostly) showing extreme optimism
Not much has changed on the sentiment side of the ledger. Dumb Money Confidence is again above 80%. IPOs are popping, the S&P is trading well above its average value and global economic output, and that has triggered another massive rise in speculative options trading.
One indicator getting some attention in recent days is the NAAIM survey of active investment managers. We've been following this since I consulted with former NAAIM president Will Hepburn on its construction back in 2008. It can be a useful indicator to follow, though like most surveys, it tends to be most useful from a contrarian point of view when managers quickly panic.
The most recent week shows not only a high average exposure to stocks, but also maximum exposure of 200%, the least bullish manager is 50% exposed, and there is a massive amount of group-think with a low standard deviation among responses. Taken all together, these managers are among the most confident they've ever been.
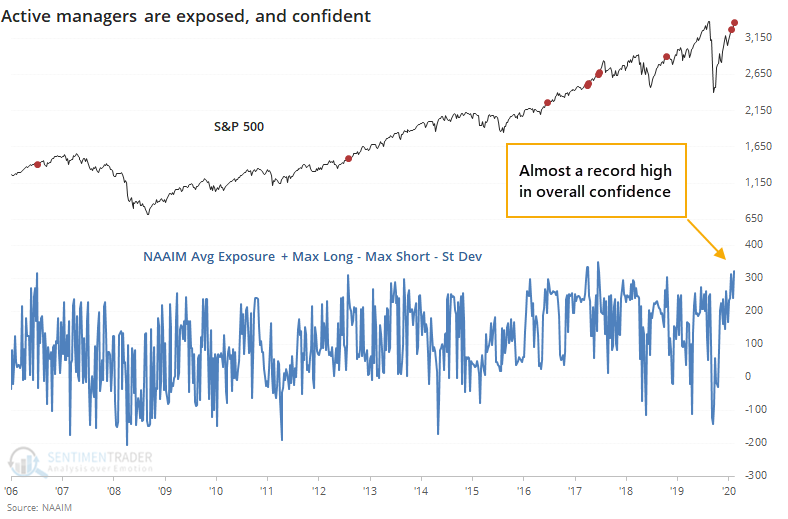
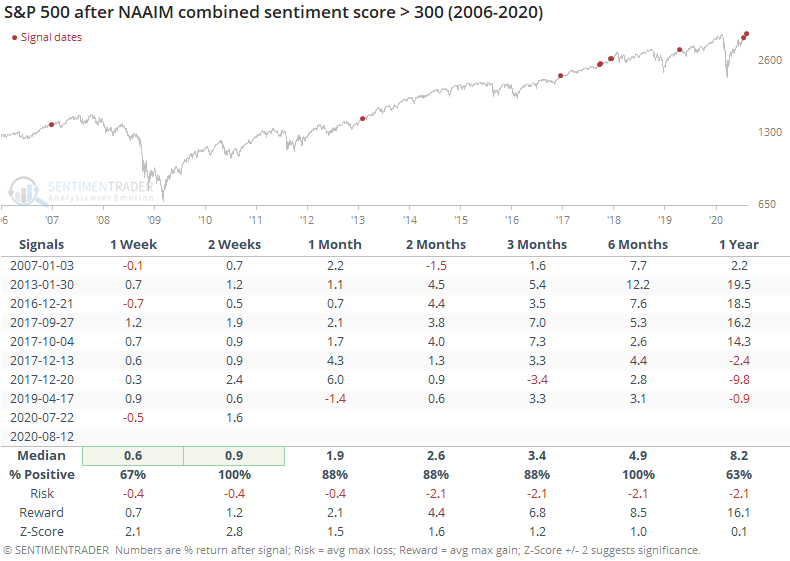
The problem with assuming that this is a contrary indicator is that it doesn't work. When these trend-following managers have become supremely confident, the S&P has tended to keep going.
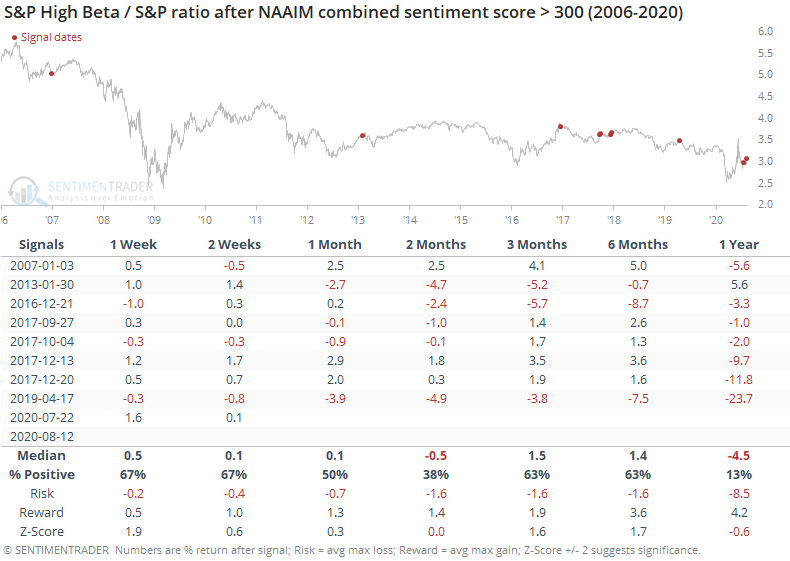
But...it has paid to become a bit more defensive on some of the higher-beta stocks after these jumps in optimism. The ratio of the S&P 500 High Beta index to the S&P 500 itself tended to decline, with a poor risk/reward ratio going forward.
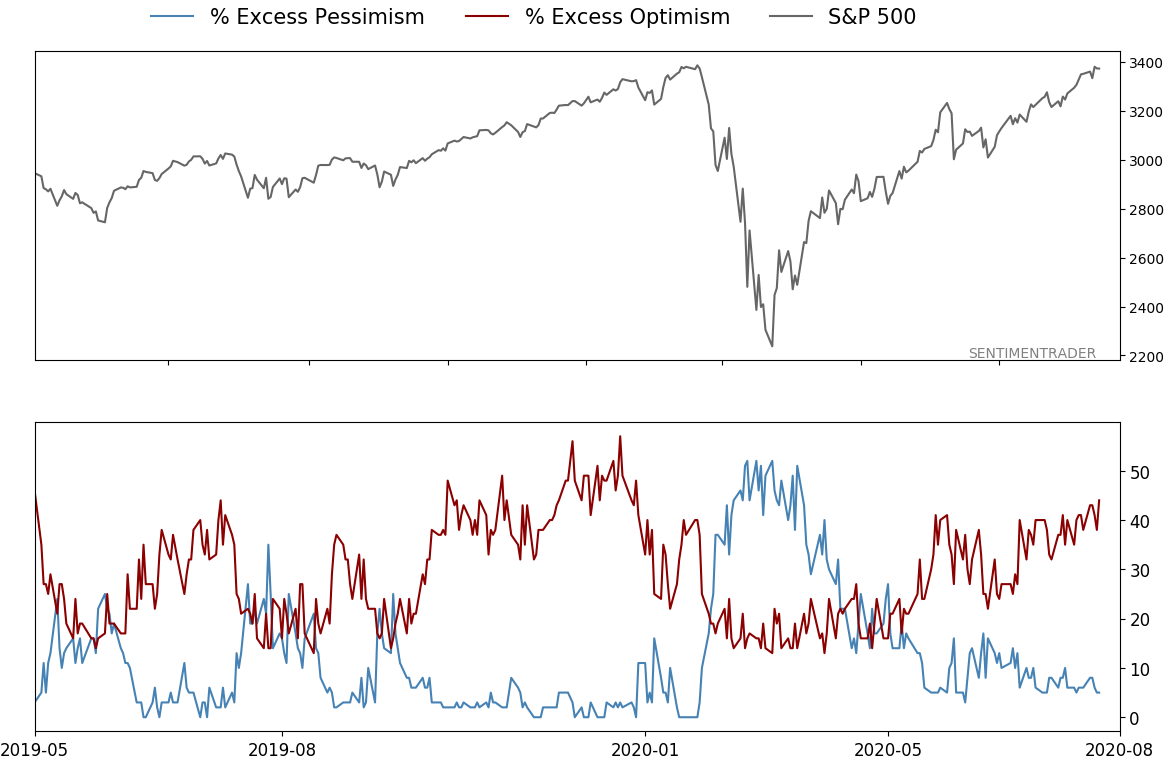
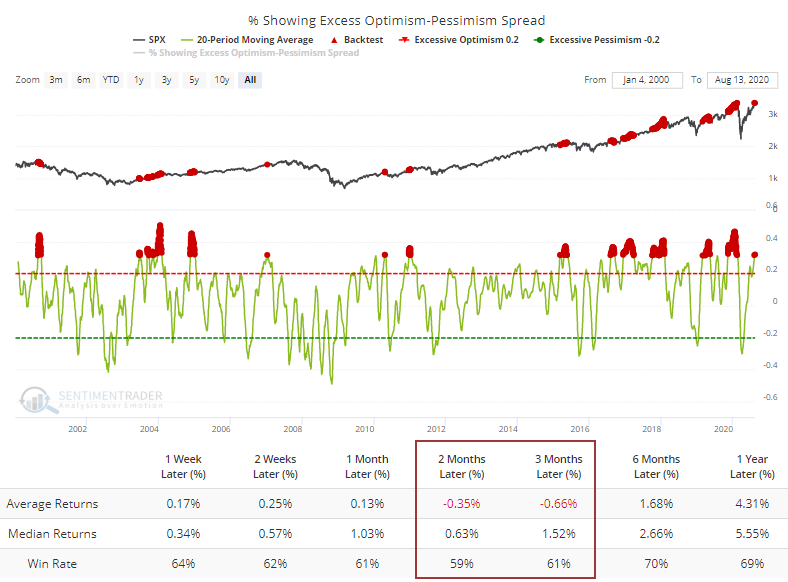
There are definitely a few indicators that don't support the idea that investors are overly optimistic (AAII survey, fund flows), but most of them do. The spread between the percentage of our core indicators showing optimism minus those showing pessimism has averaged 32% over the past month, one of the higher readings in 20 years. The Backtest Engine shows muted returns over the next 2-3 months when there has been this large and persistent of a spread.
Still, optimism has been high for weeks and it hasn't mattered. The extremes and high Risk Level has failed to lead to weakness. By the time it reaches this kind of levitation, and the catcalls get loud, is often about the time it starts working again. There is definitely the possibility we're in a "summer 2009" kind of situation, which the multitude of breadth thrusts, recoveries, and trend changes would support, but on a medium-term time frame that still looks iffy.
Other markets showed a sharp reversal from extreme momentum
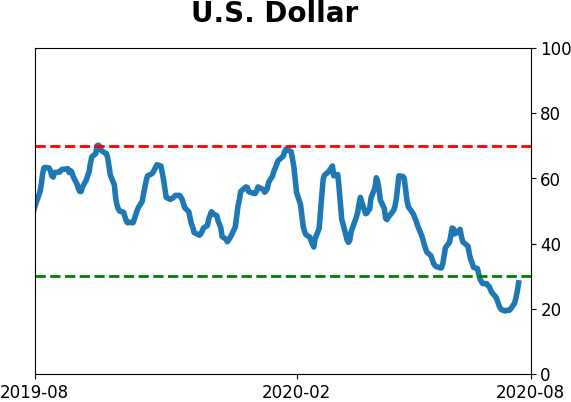
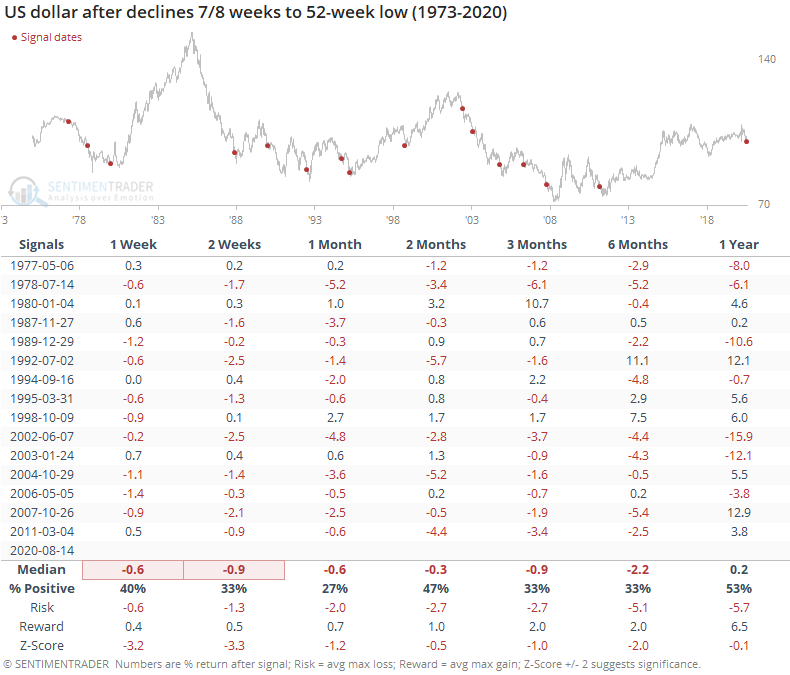
The dollar has been a driving force for moves in stocks, bonds, and precious metals, with consistent weakness helping to push other markets higher.
The U.S. dollar index has now declined for 7 out of 8 weeks, slipping to a 52-week low as a result. Strong downside momentum has usually preceded even more weakness in the buck.
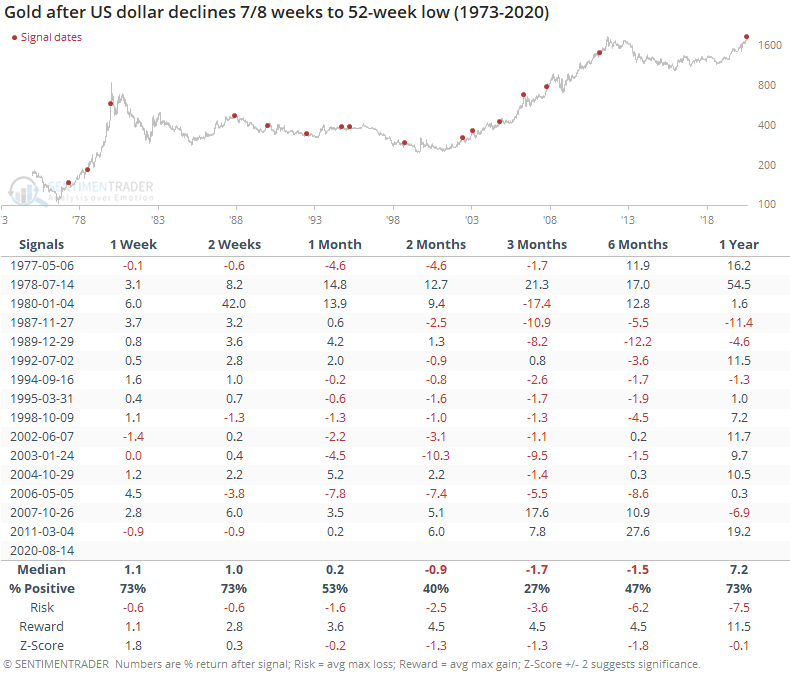
That hasn't helped gold, though.
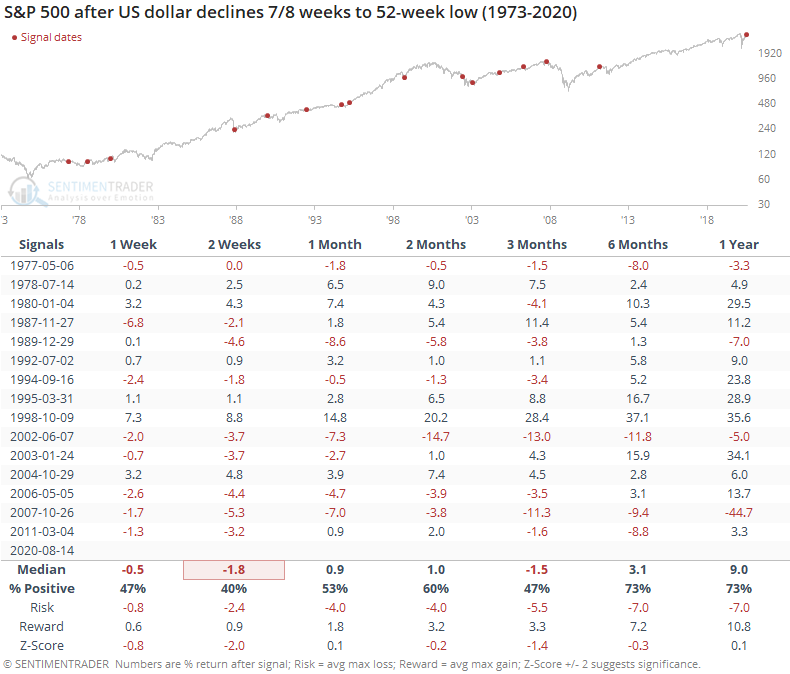
Or stocks.
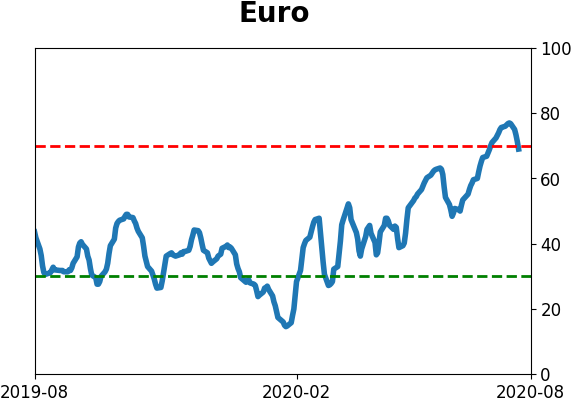
The biggest positive is that sentiment has become extremely pessimistic on the dollar. Troy notes that positioning is extreme and its Optimism Index has declined to a very low level before rebounding in recent days. That should help its short- to medium-term prospects, but the market is seeing a fight between momentum and sentiment. A "normal" market would see the dollar rebound in the weeks ahead based on such low sentiment readings. If it can't, then it's another sign that its terribly weak momentum should continue to win out. Just be careful in the assumption that that would be an automatic positive for gold and other metals, especially after seeing optimism on gold suffer such a sharp reversal as it did this week.
Active Studies
| Time Frame | Bullish | Bearish | | Short-Term | 0 | 1 | | Medium-Term | 8 | 12 | | Long-Term | 46 | 1 |
|
Indicators at Extremes
Portfolio
| Position | Weight % | Added / Reduced | Date | | Stocks | 29.8 | Reduced 9.1% | 2020-06-11 | | Bonds | 0.0 | Reduced 6.7% | 2020-02-28 | | Commodities | 5.2 | Added 2.4%
| 2020-02-28 | | Precious Metals | 0.0 | Reduced 3.6% | 2020-02-28 | | Special Situations | 0.0 | Reduced 31.9% | 2020-03-17 | | Cash | 65.0 | | |
|
Updates (Changes made today are underlined)
After stocks bottomed on March 23rd, they enjoyed a historic buying thrust and retraced a larger amount of the decline than "just a bear market rally" tends to. Through June, there were signs of breadth thrusts, recoveries, and trend changes that have an almost unblemished record at preceding higher prices over a 6-12 month time frame. On a shorter-term basis, our indicators have been showing high optimism, with Dumb Money Confidence recently above 80%, along with signs of reckless speculation during what appears to be an unhealthy market environment, historically a bad combination. While there are certainly some outlier indicators that are showing apathy or even outright pessimism, a weight-of-the-evidence approach suggests high risk over a multi-week to multi-month time frame. I've been carrying a low (too low) level of exposure to stocks, as well as bonds and gold. I don't see a good opportunity to add to any of those currently, with poor prospects pretty much all the way around. As worried as I am over the medium-term, I would only grudgingly reduce my exposure even further given the longer-term positives we spent so much time discussing in the spring. At this point, I would only look seriously at lowering exposure further if the S&P 500 drops below approximately 3220, an initial sign that its recent mini-breakout had failed.
RETURN YTD: -2.7% 2019: 12.6%, 2018: 0.6%, 2017: 3.8%, 2016: 17.1%, 2015: 9.2%, 2014: 14.5%, 2013: 2.2%, 2012: 10.8%, 2011: 16.5%, 2010: 15.3%, 2009: 23.9%, 2008: 16.2%, 2007: 7.8%
|
|
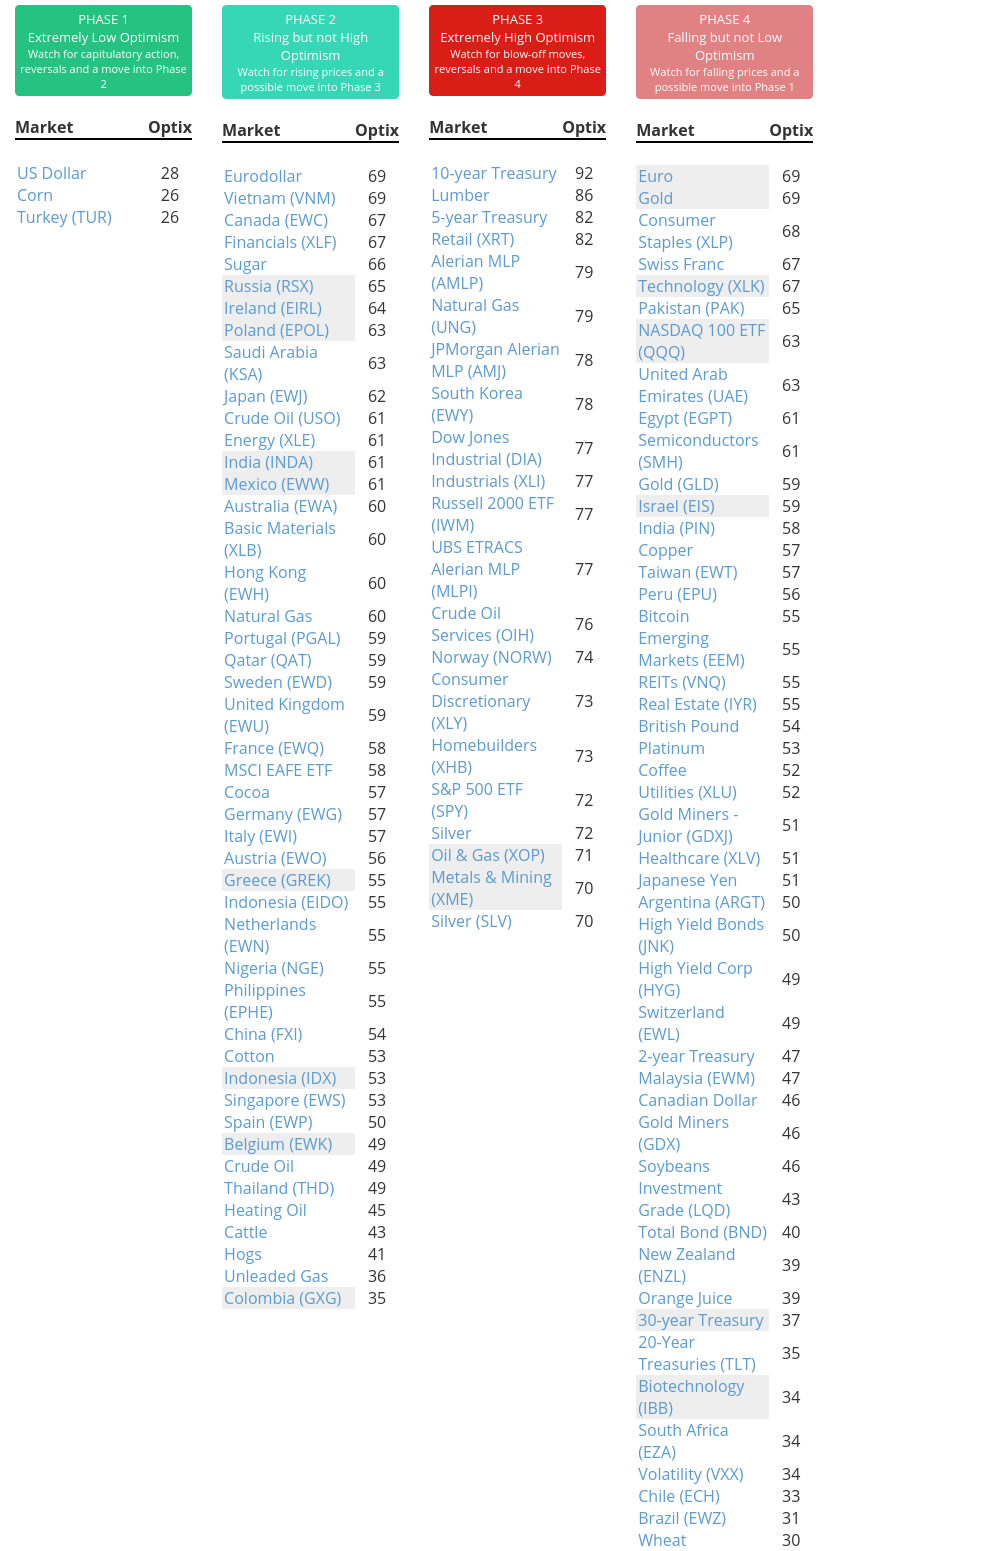
Phase Table
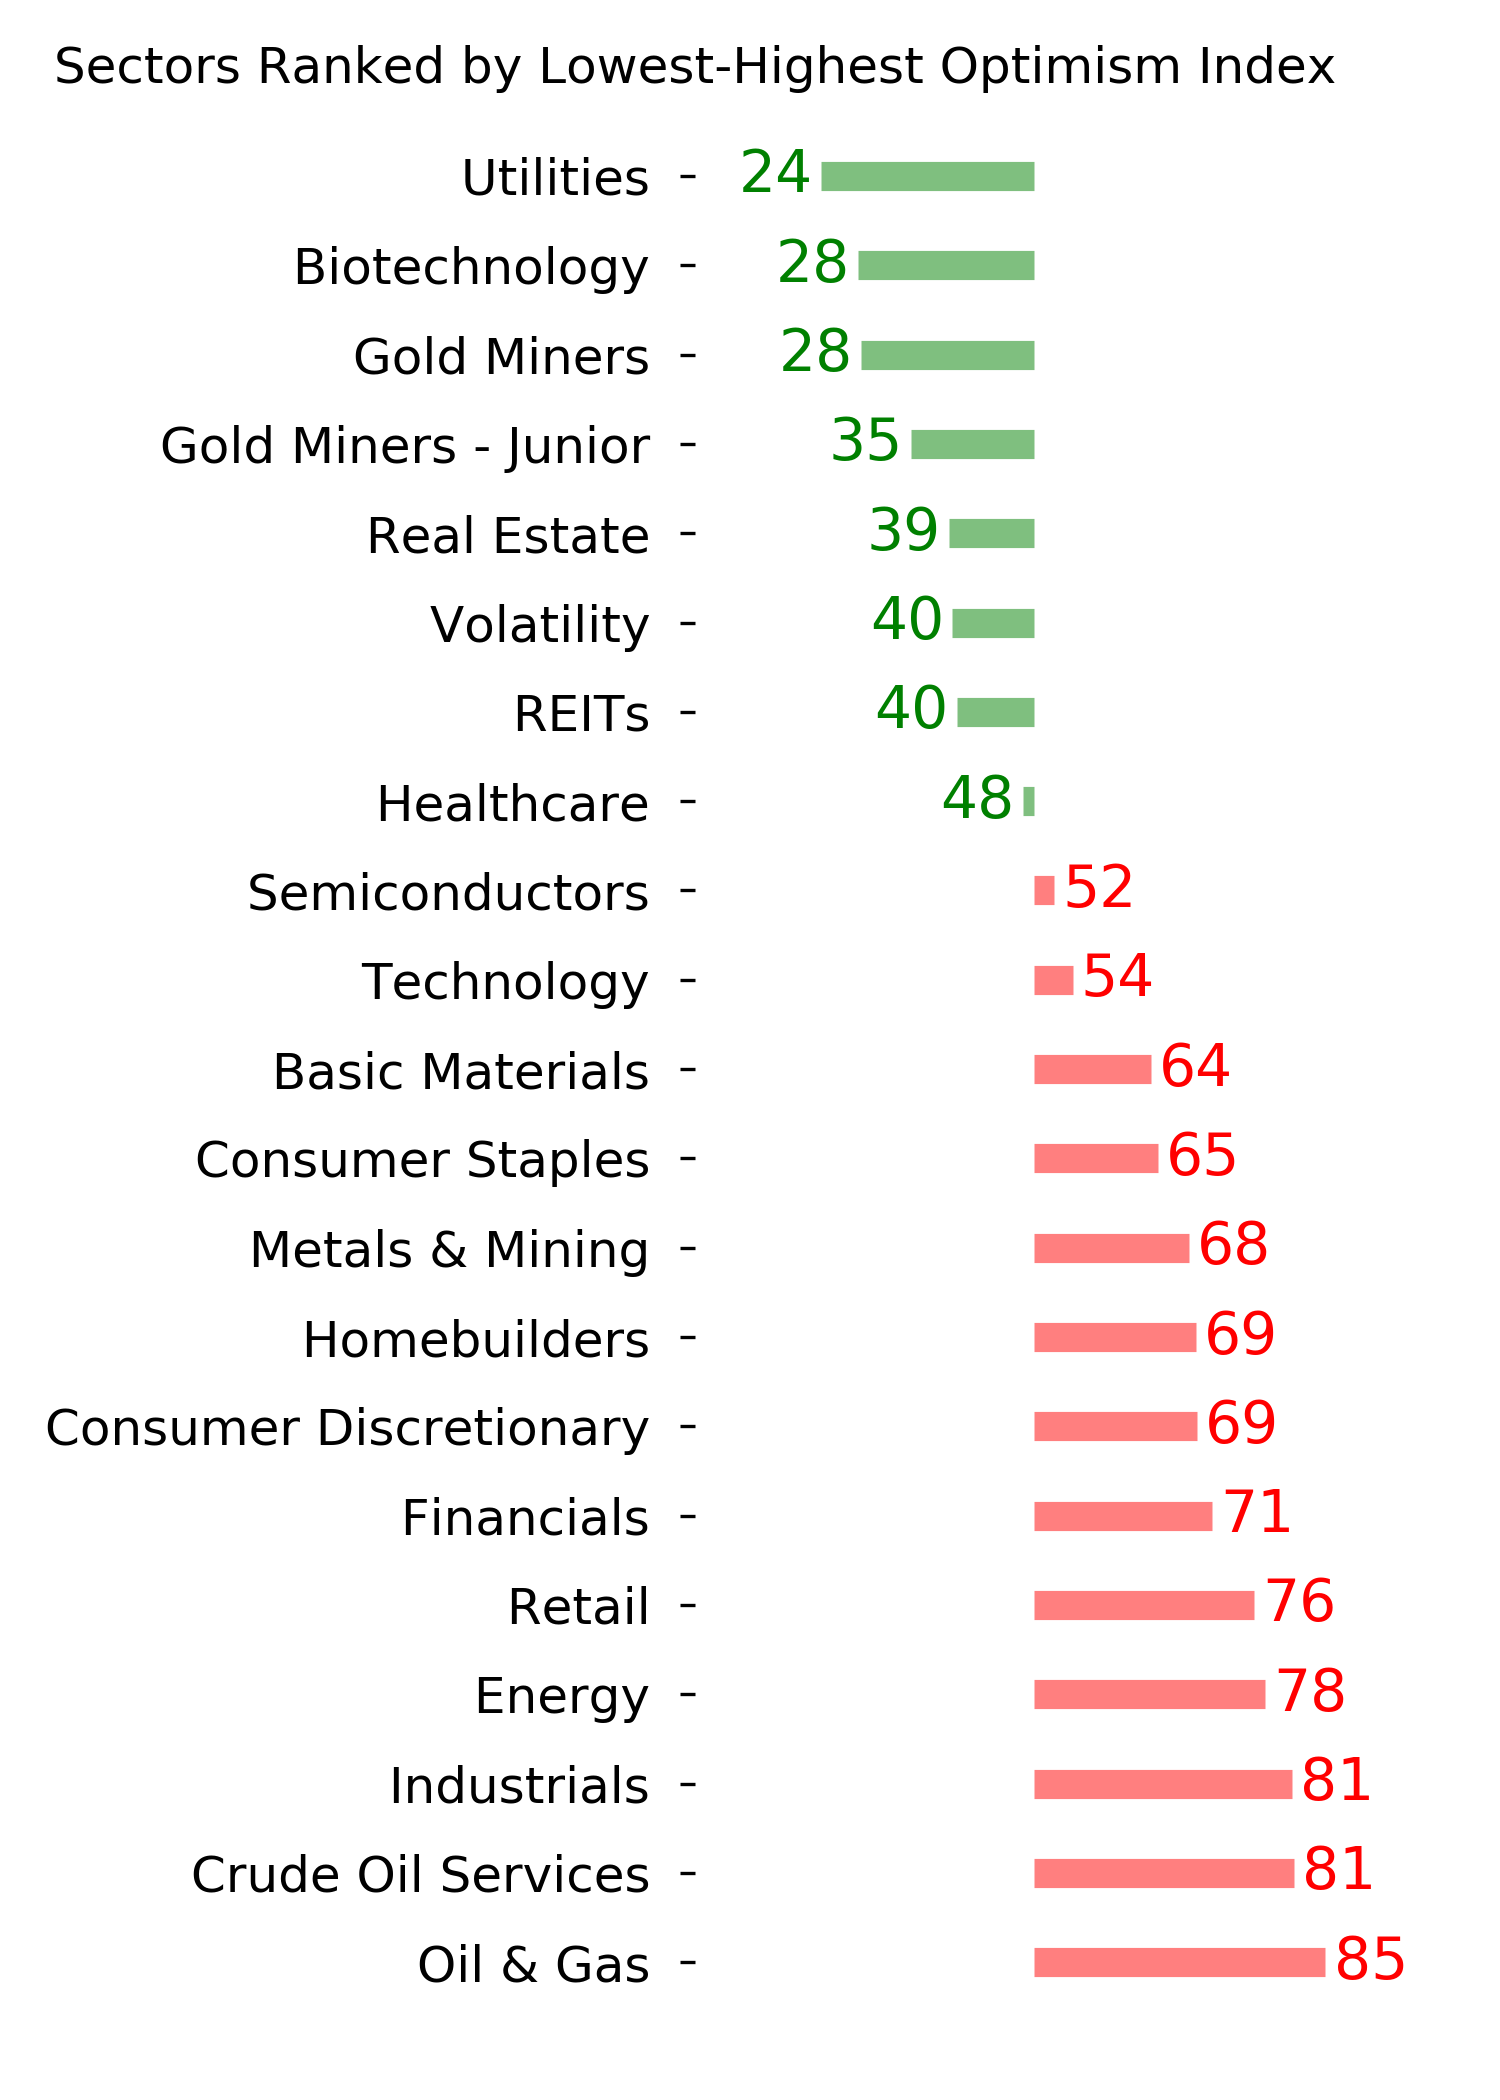
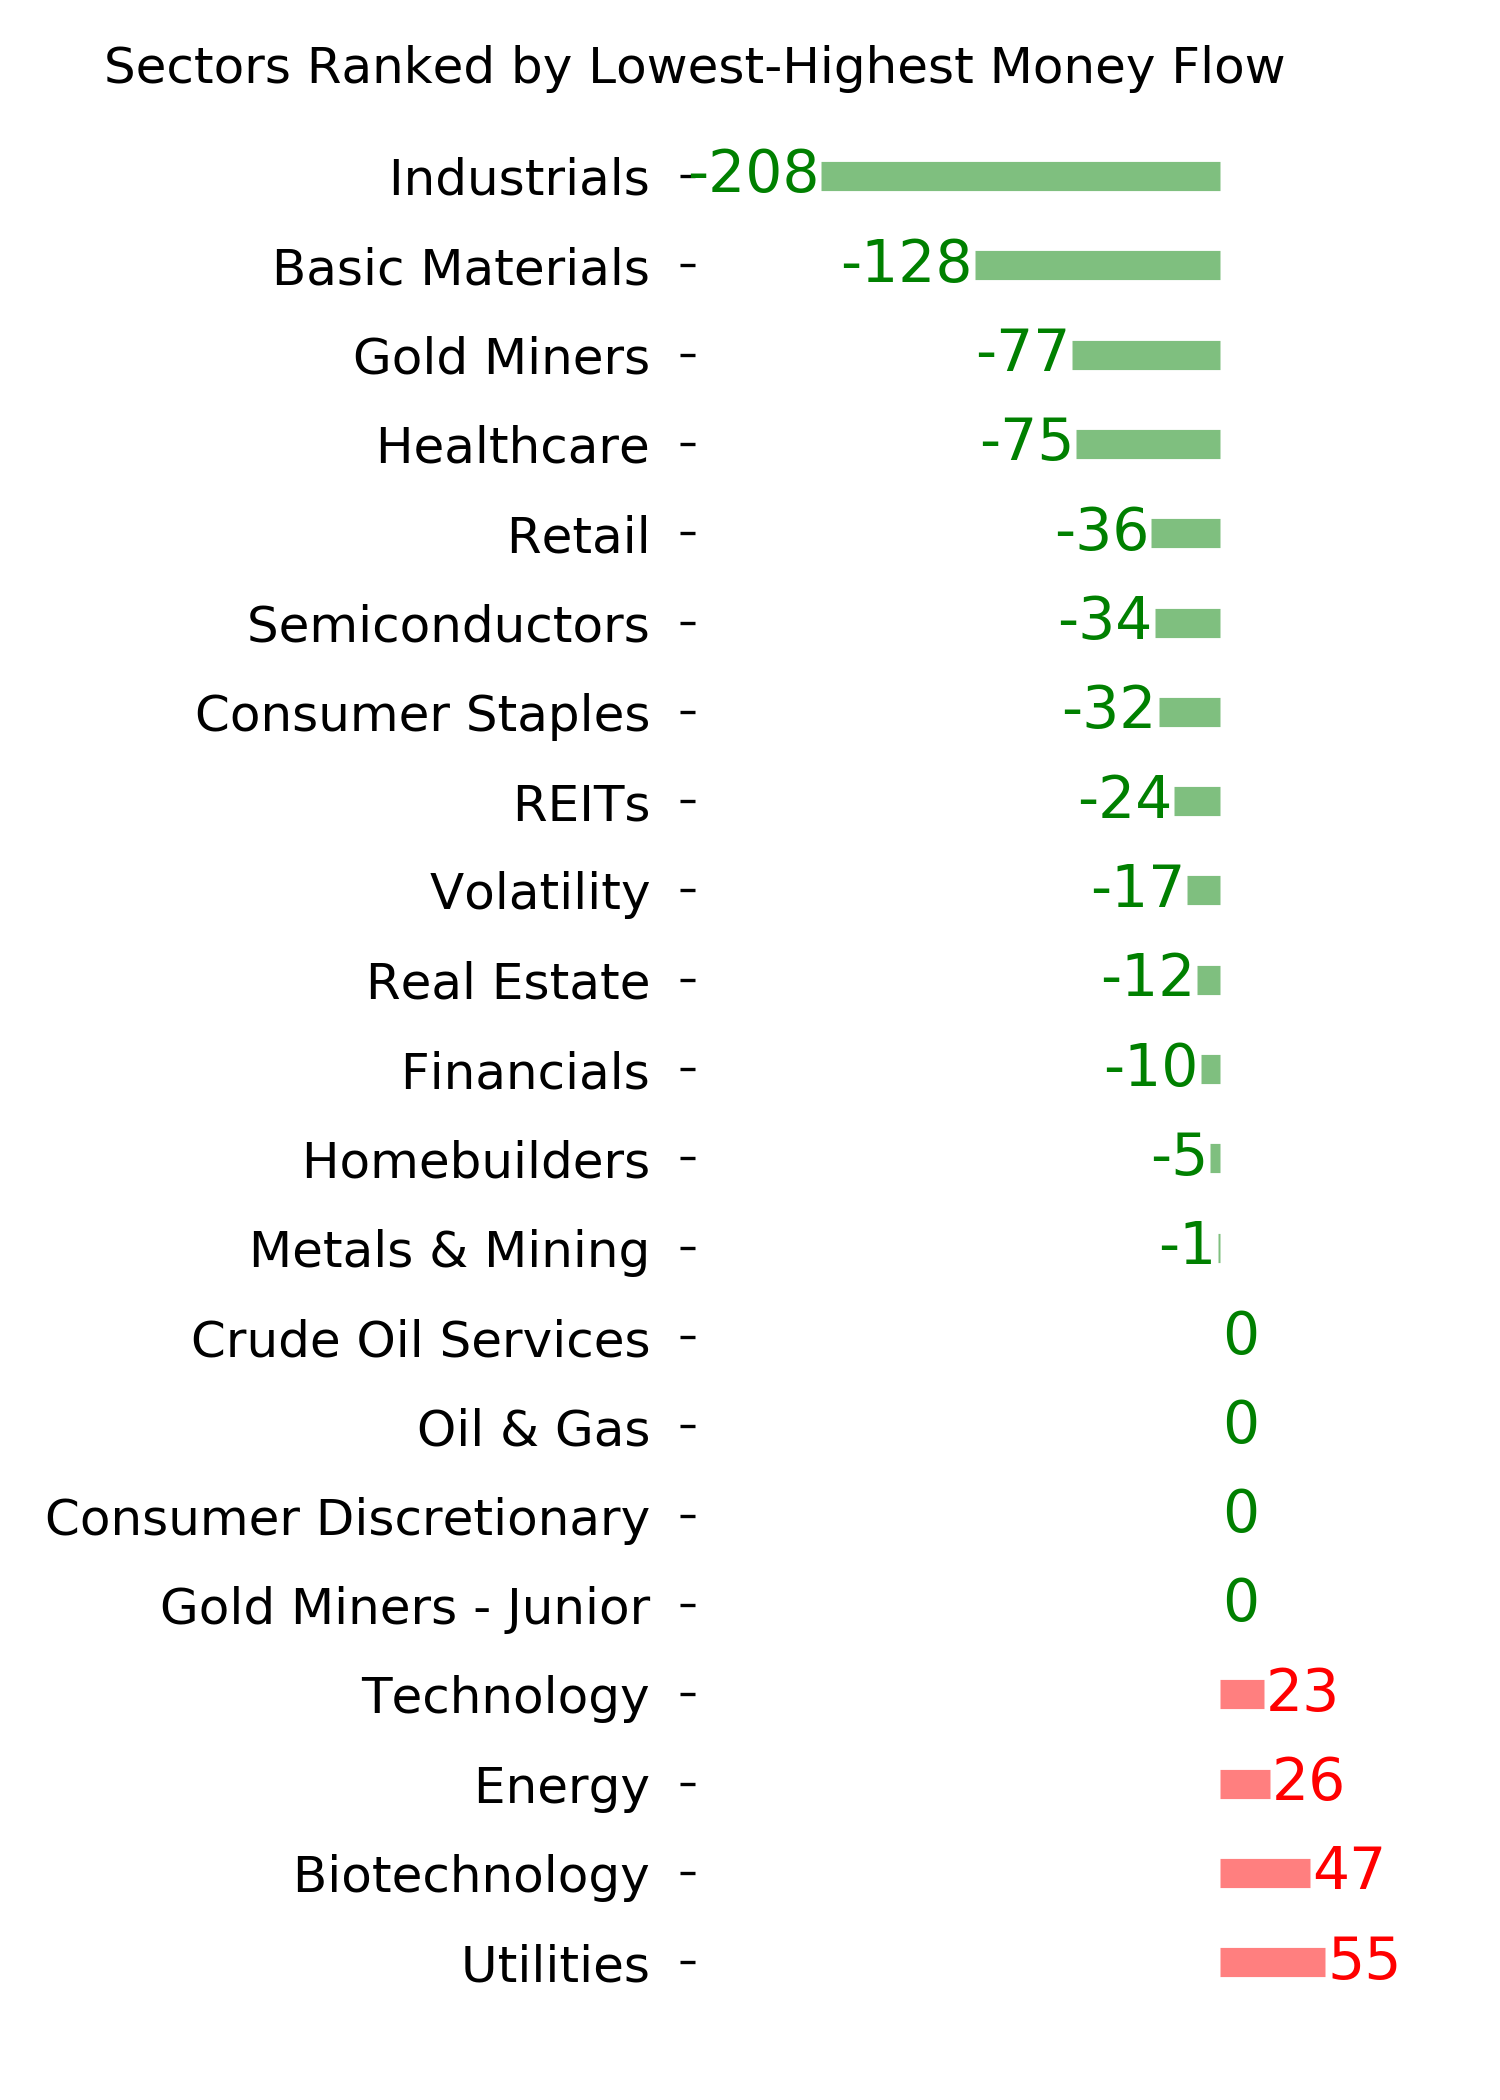
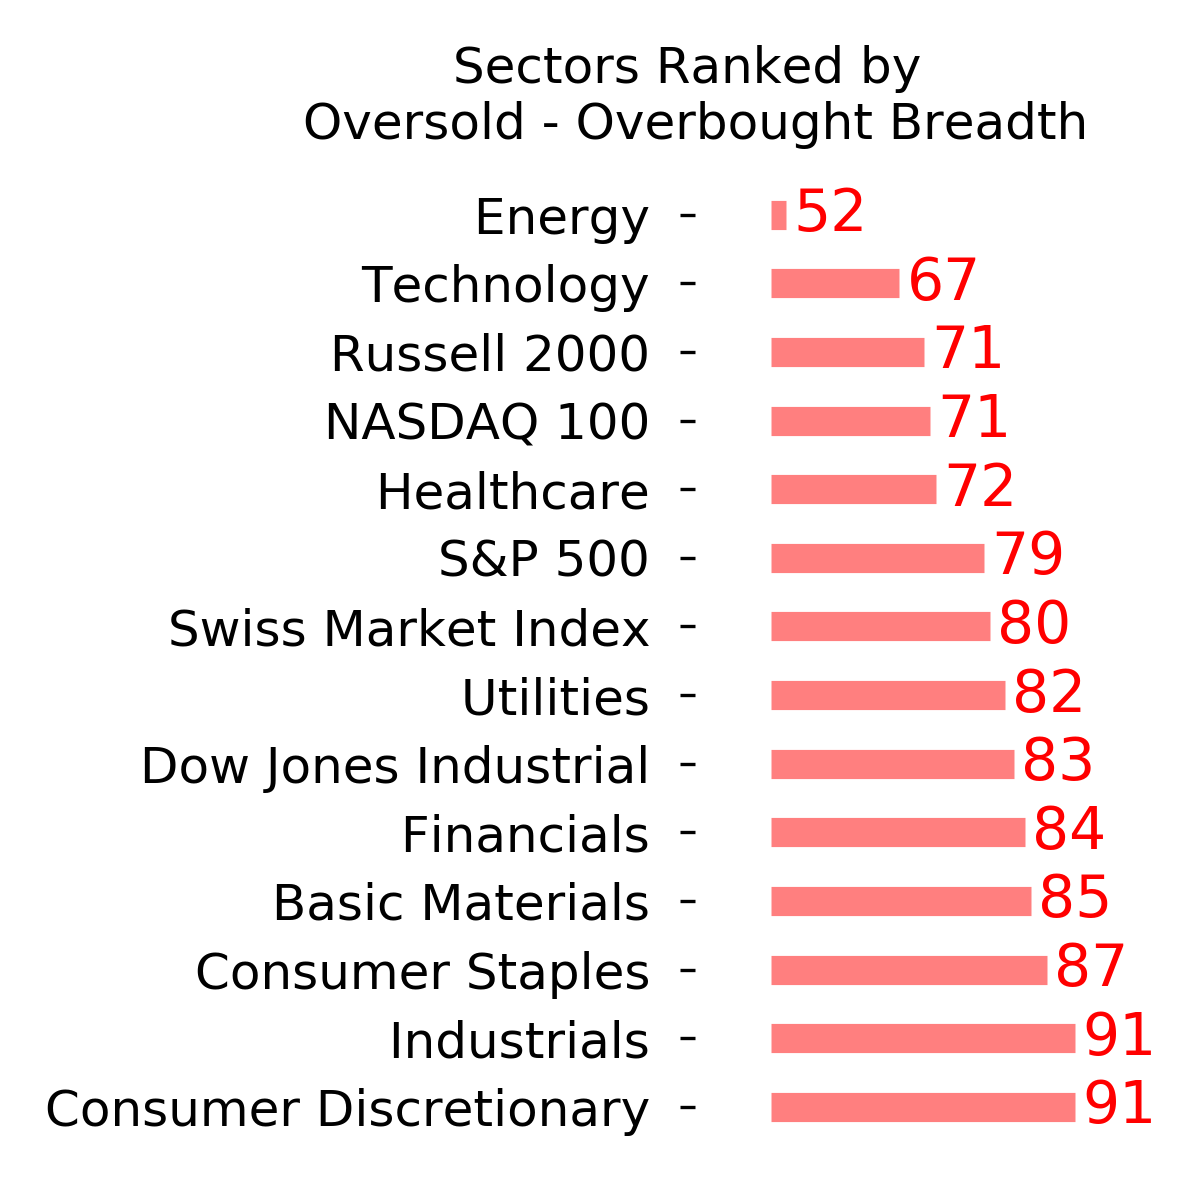
Ranks
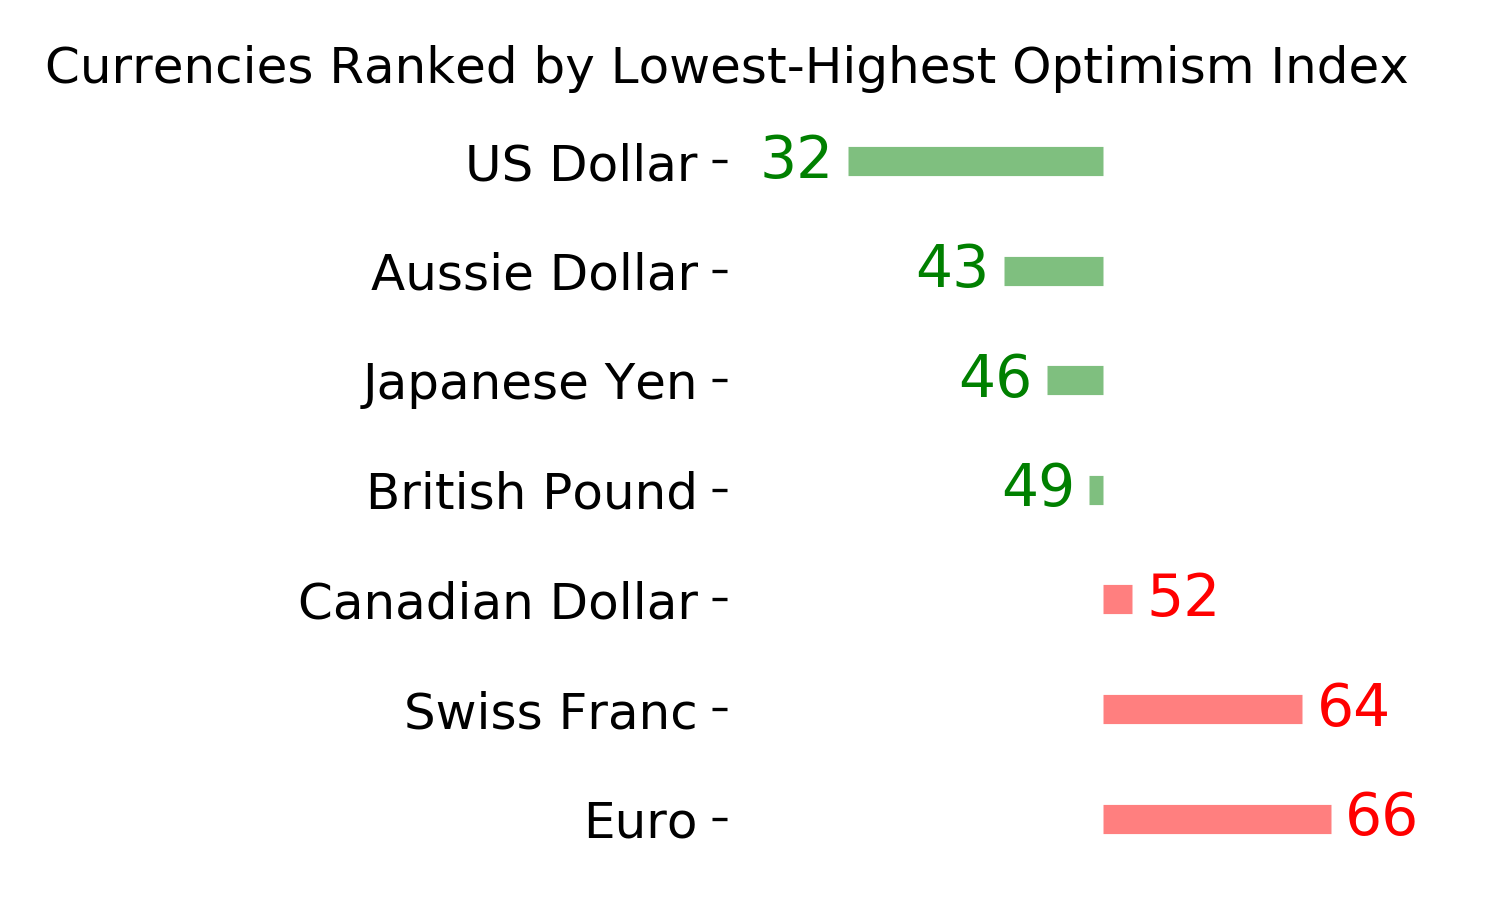
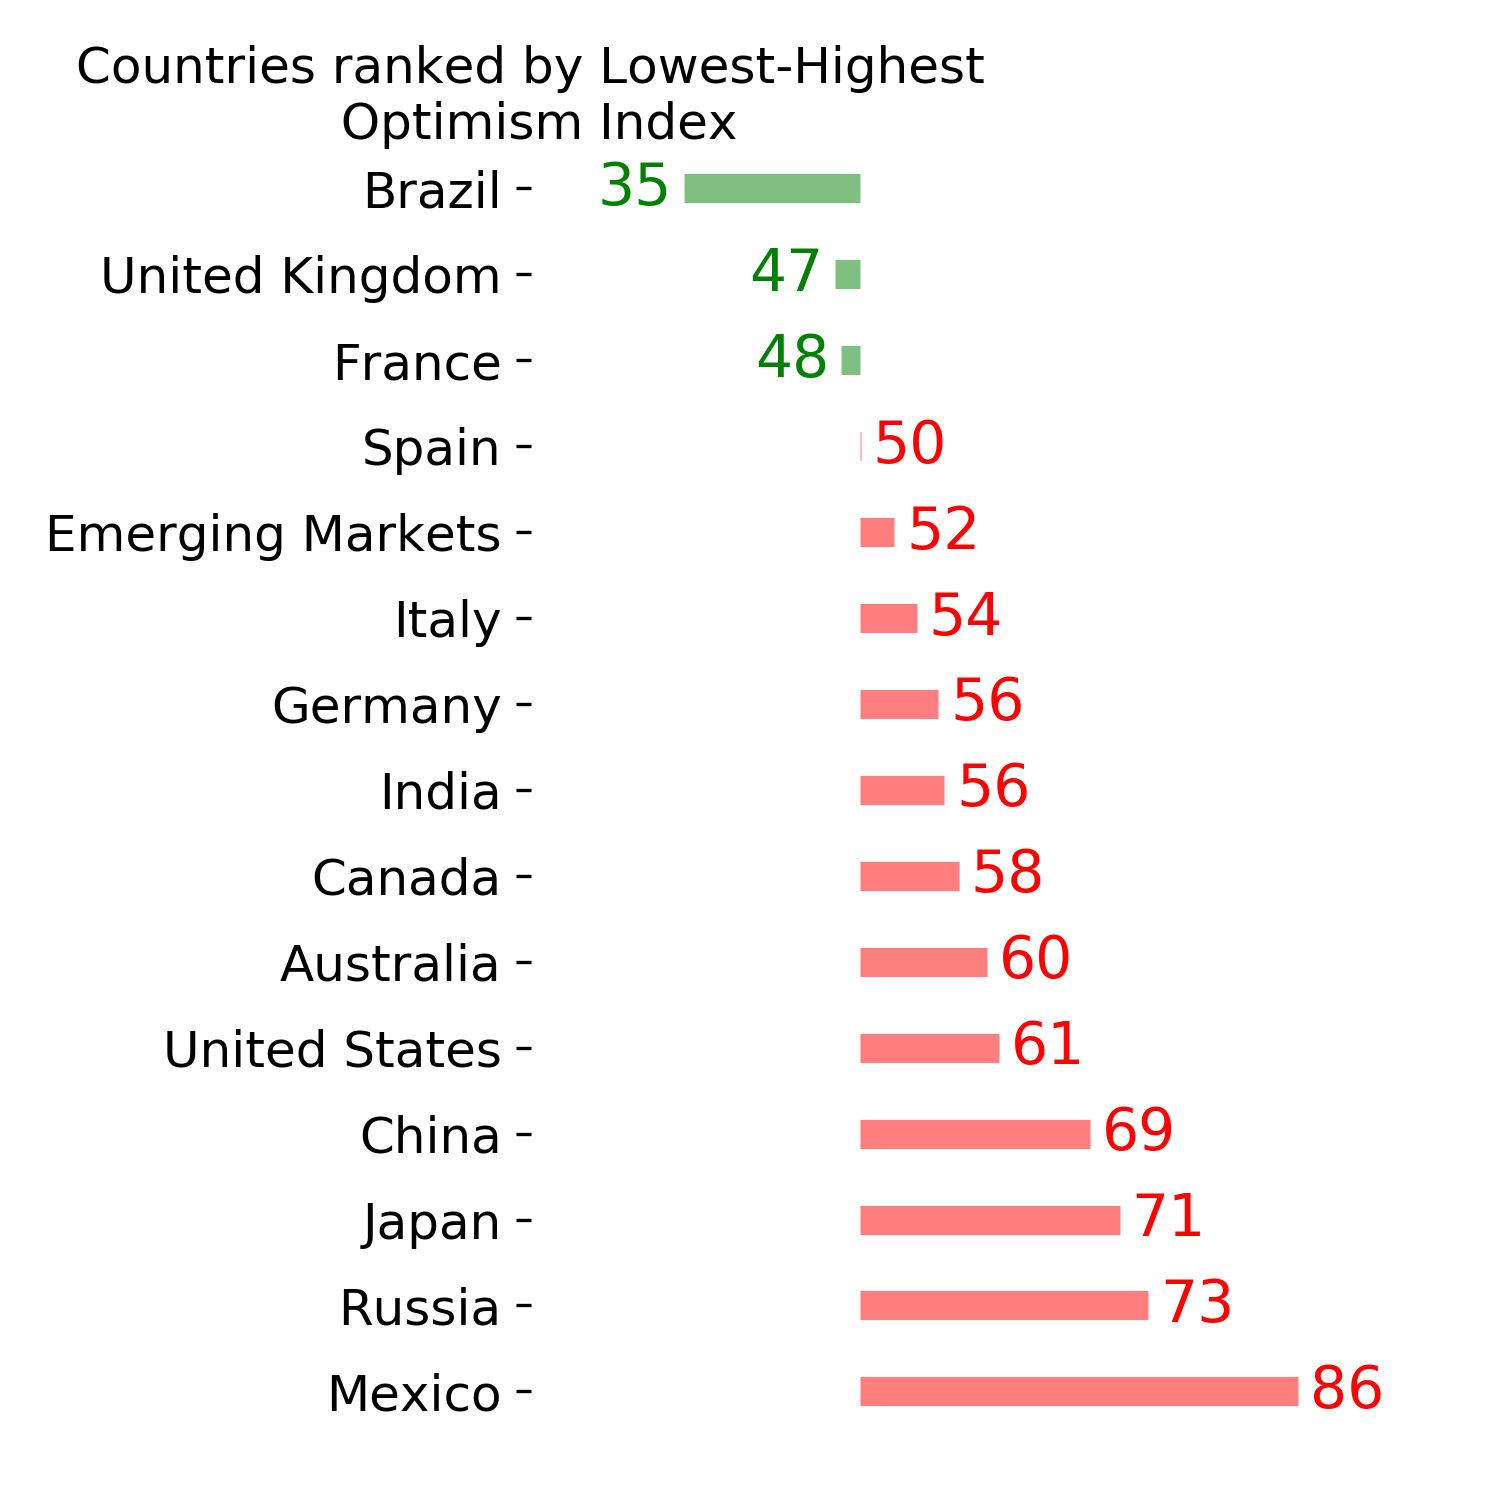
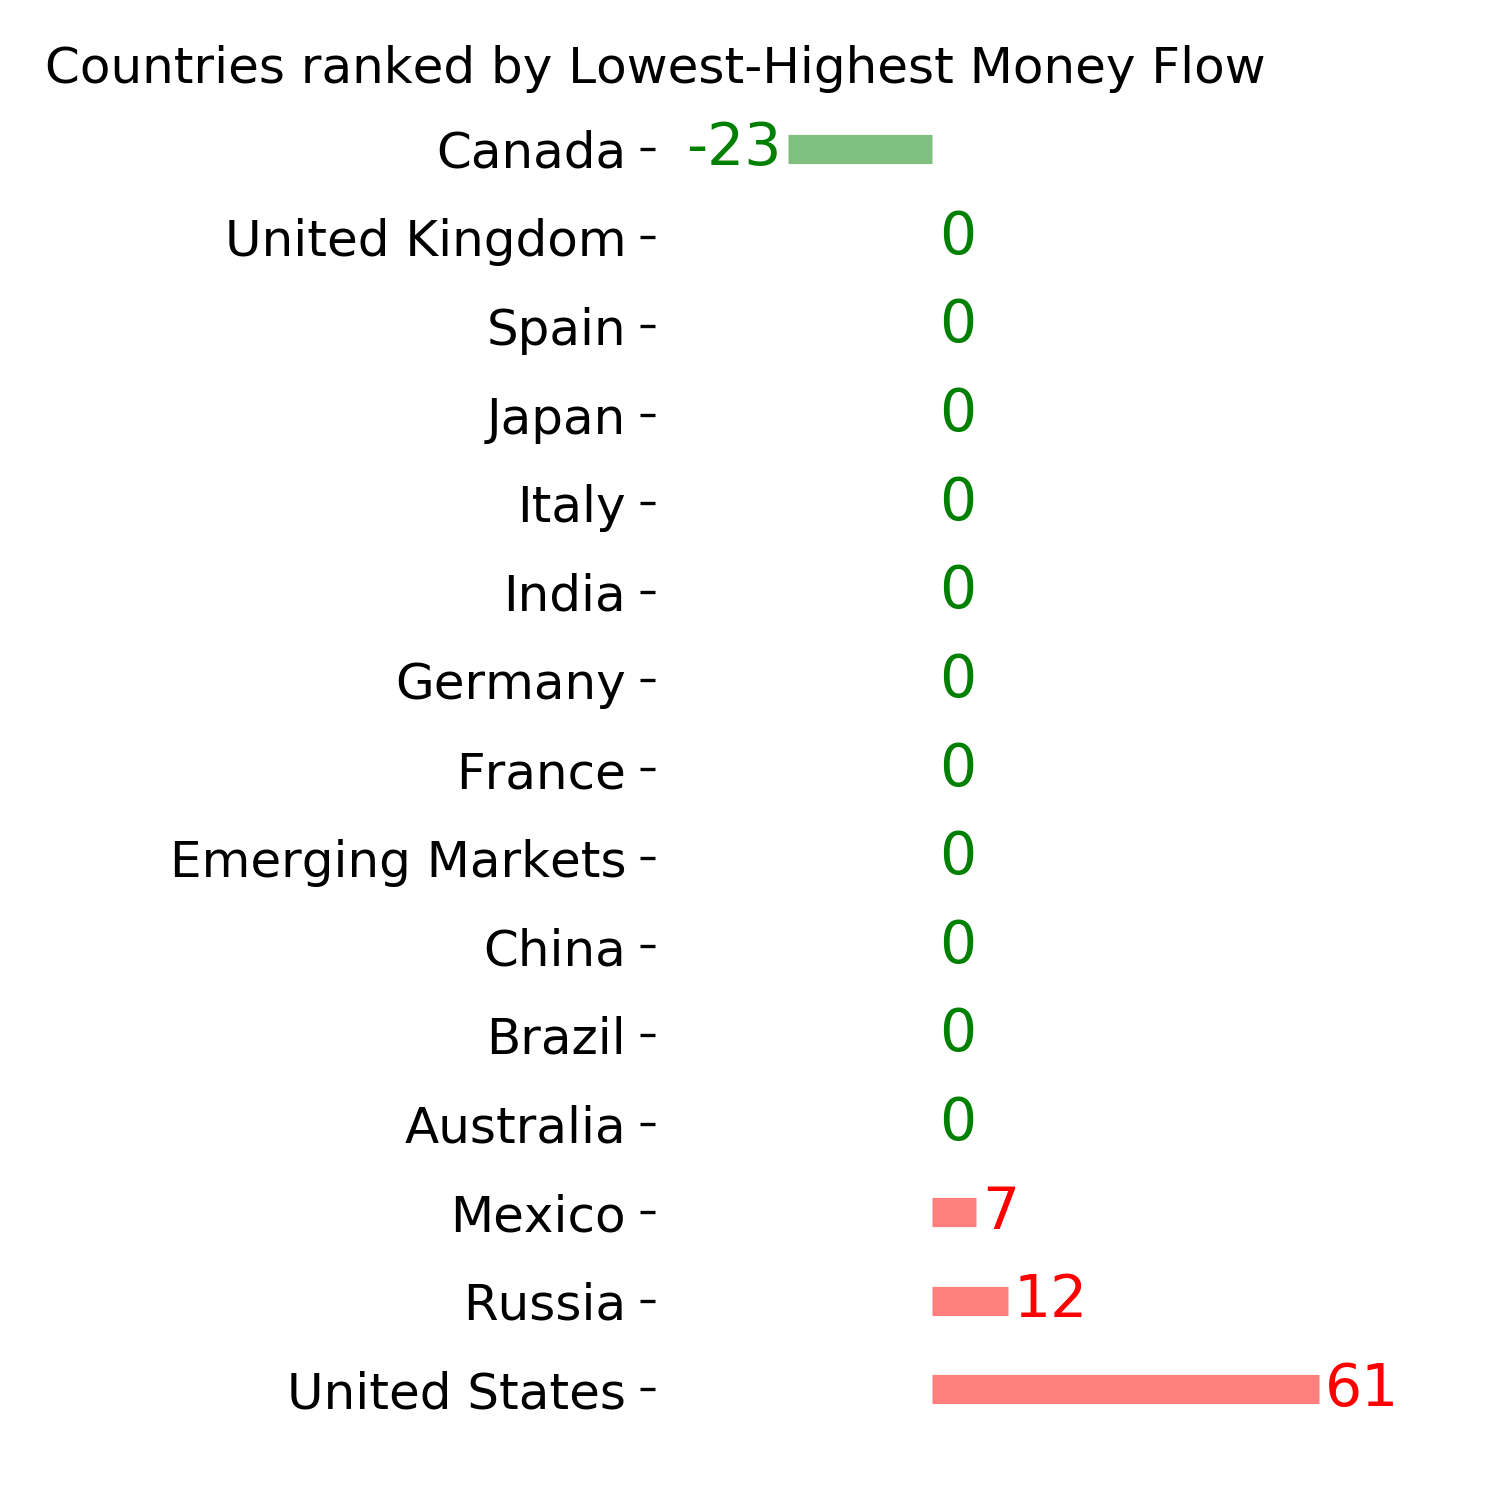
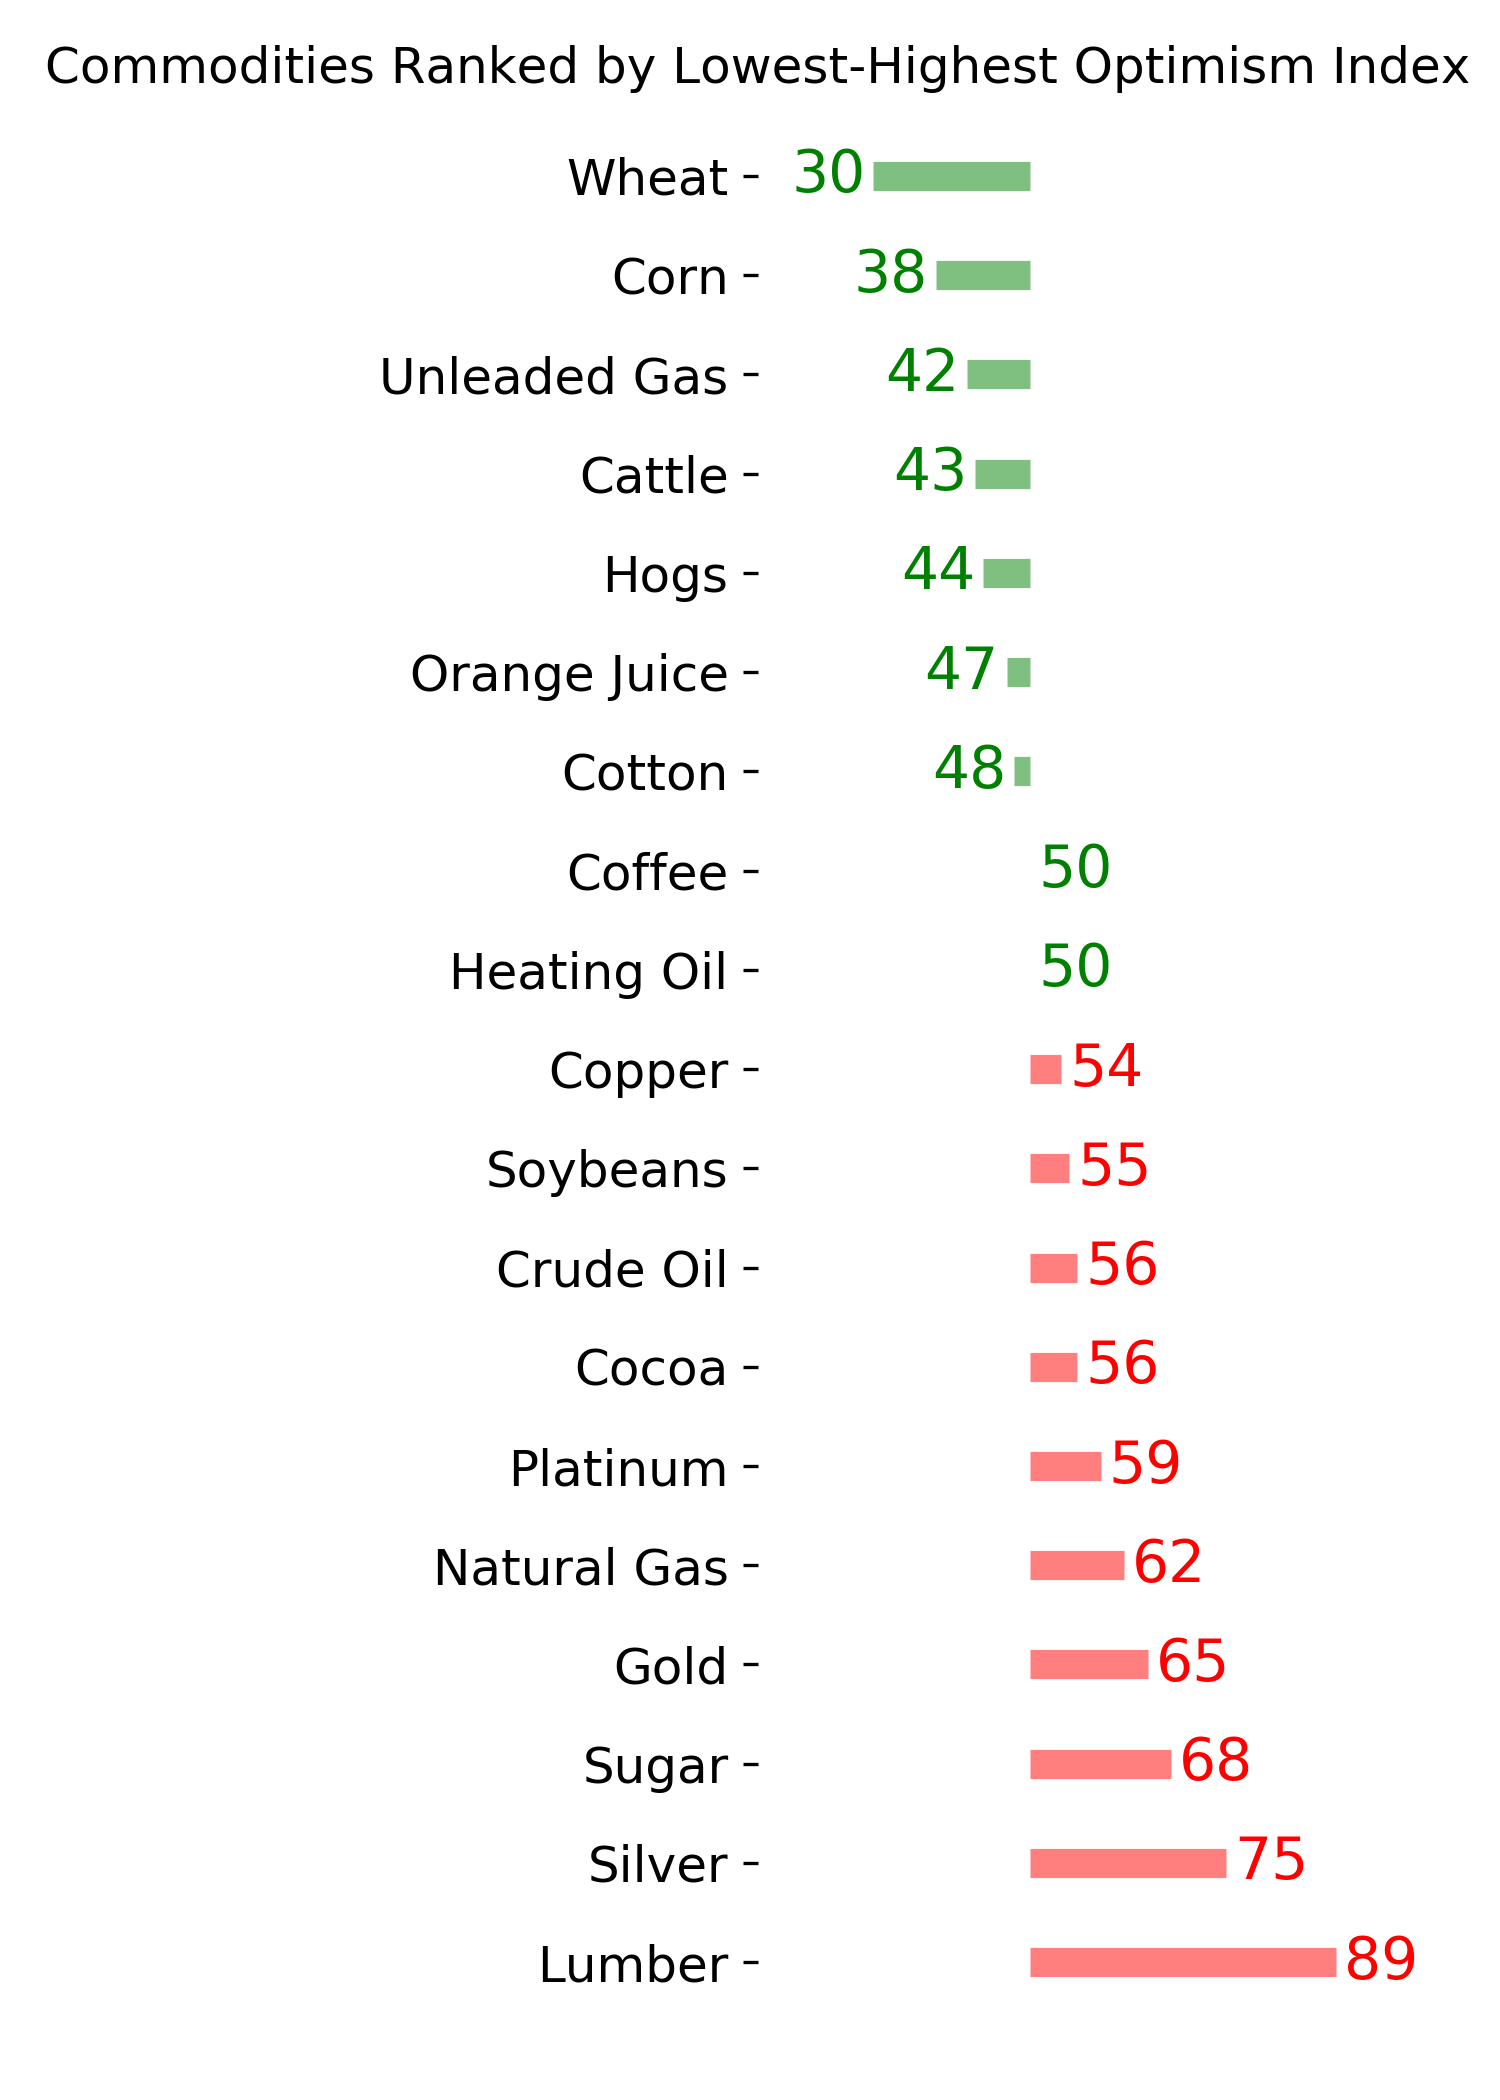
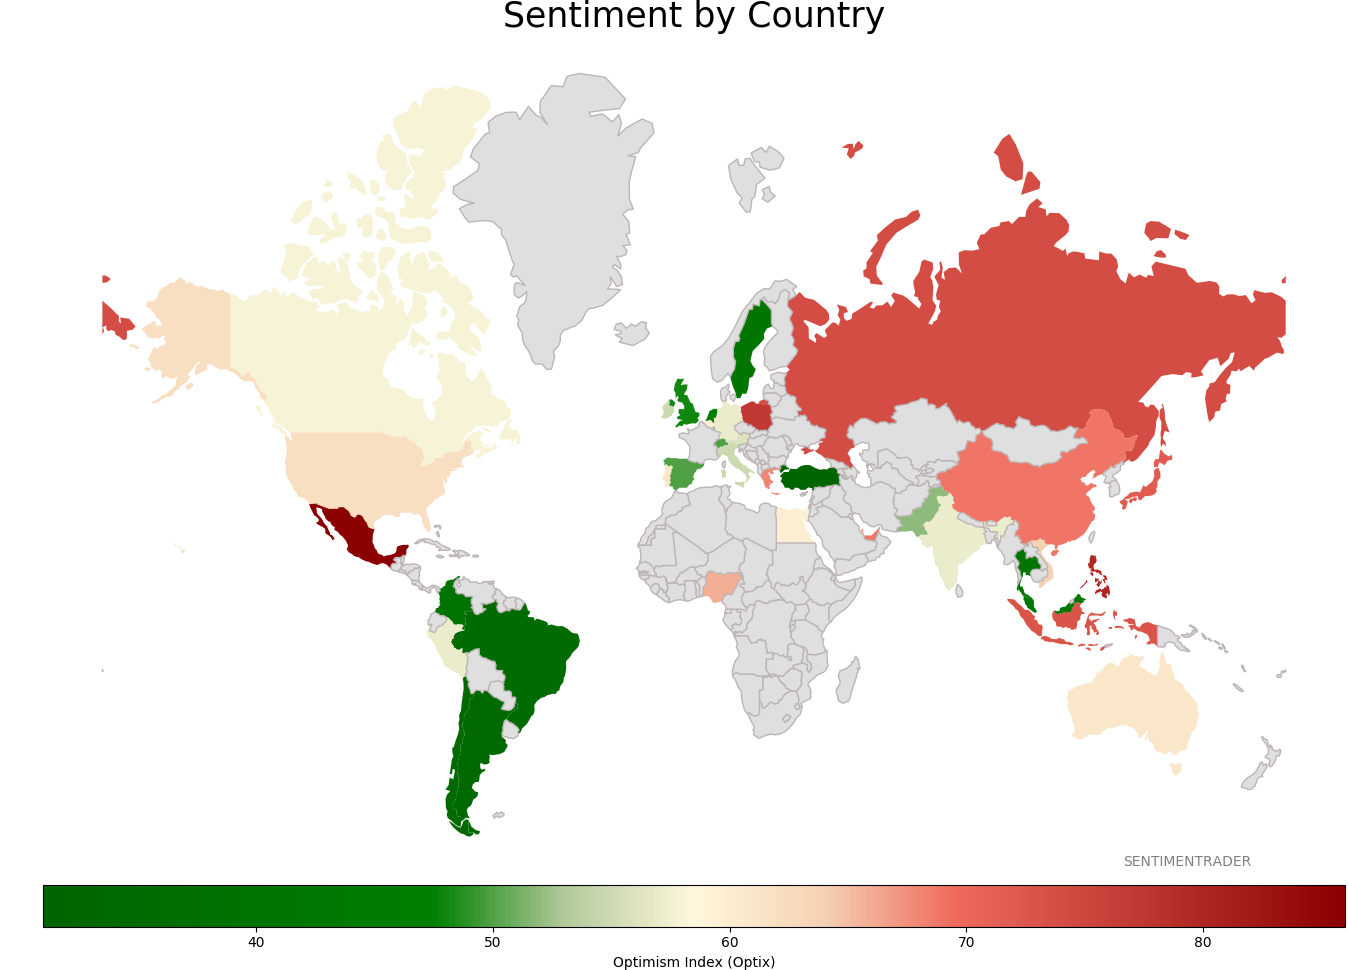
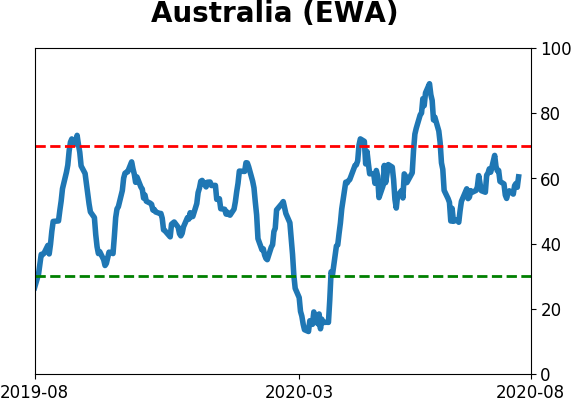
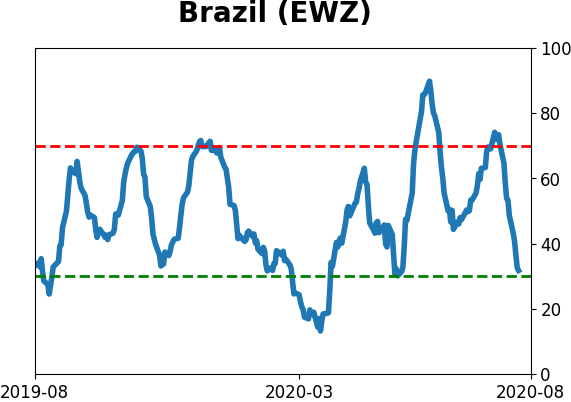
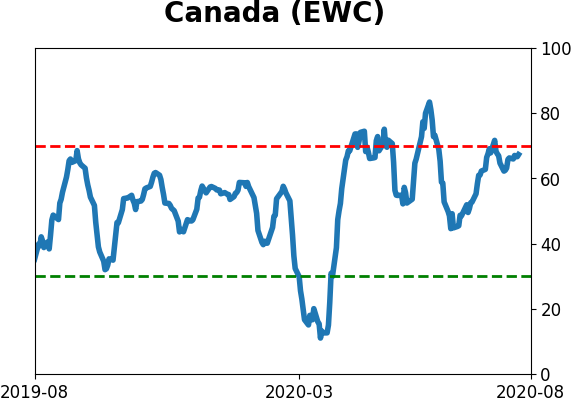
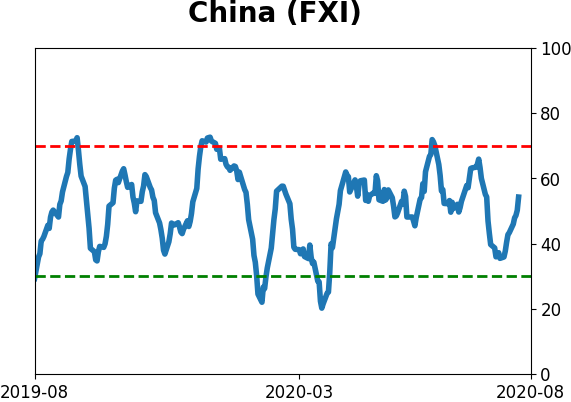
Sentiment Around The World
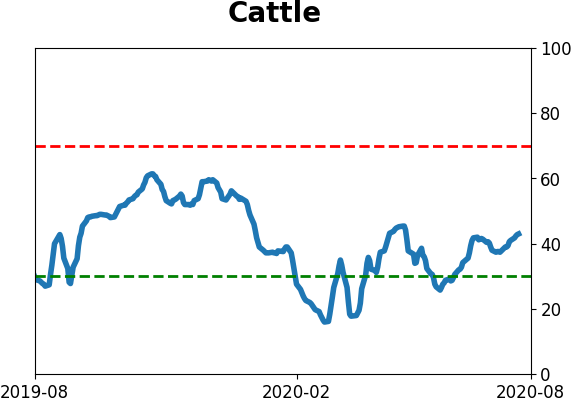
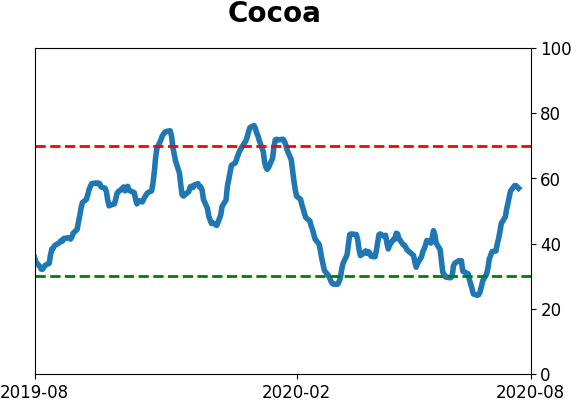
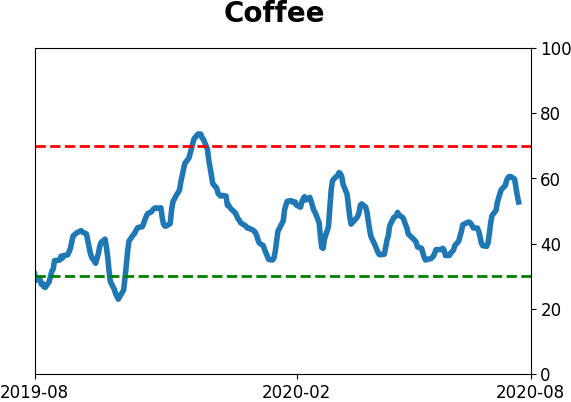
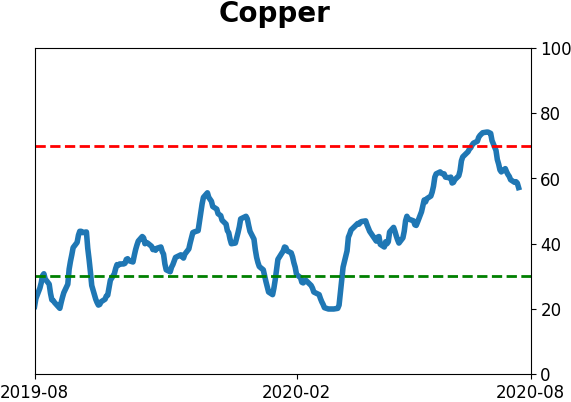
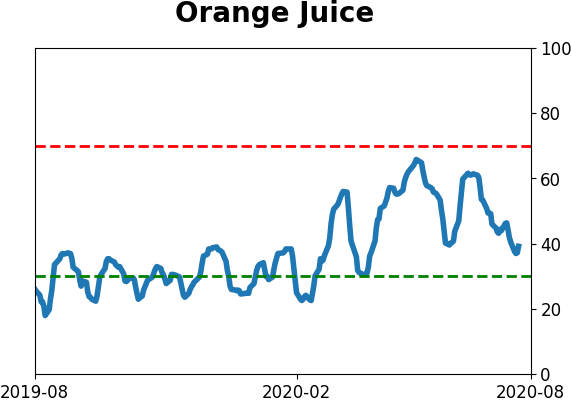
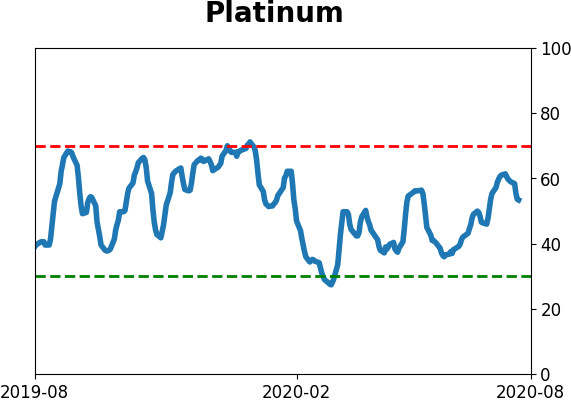
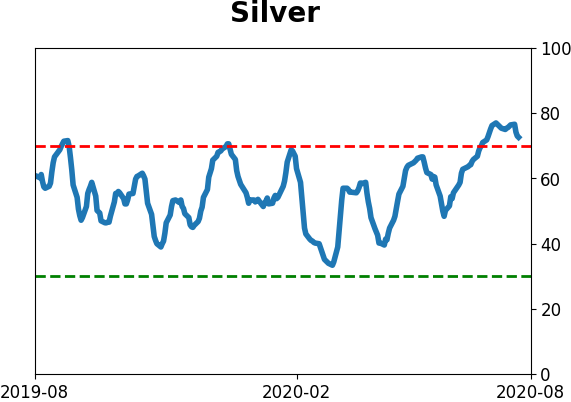
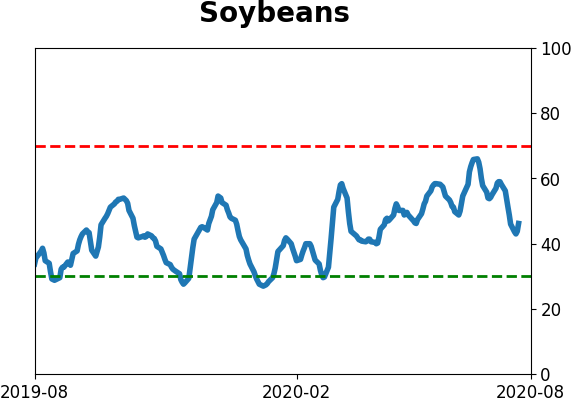
Optimism Index Thumbnails
|
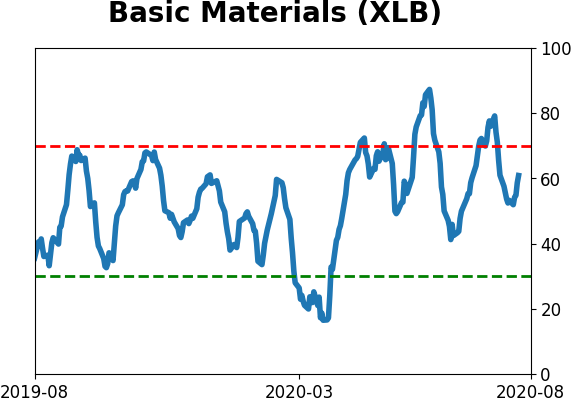
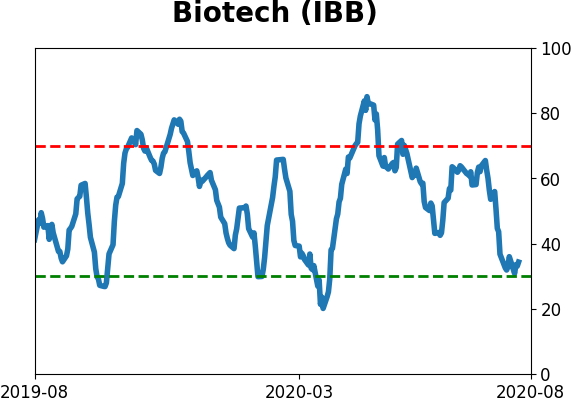
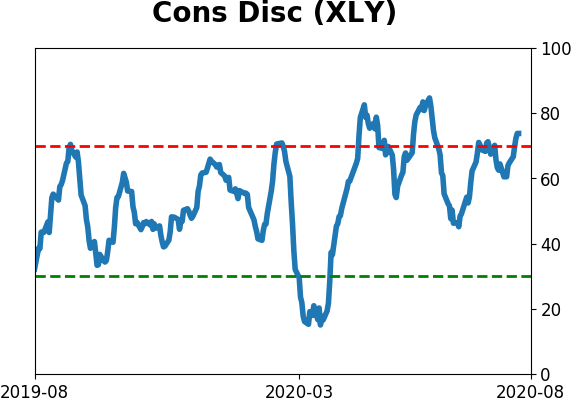
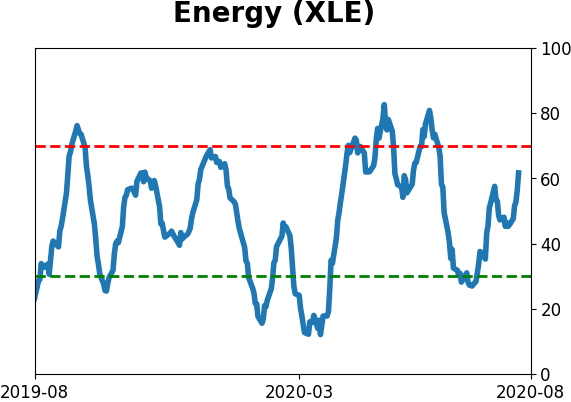
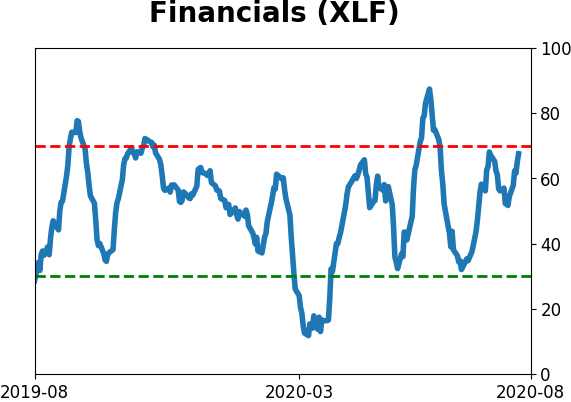
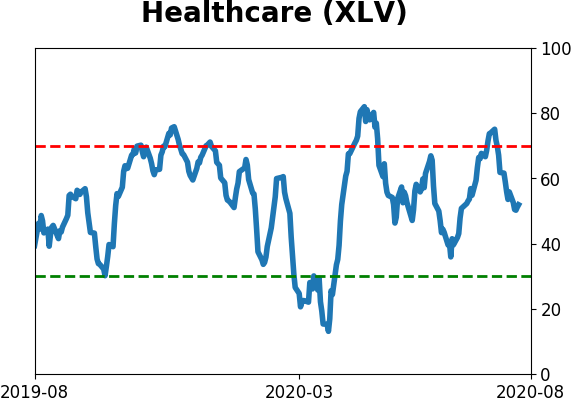
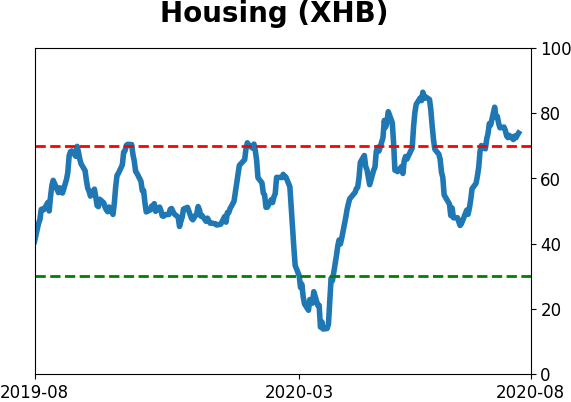
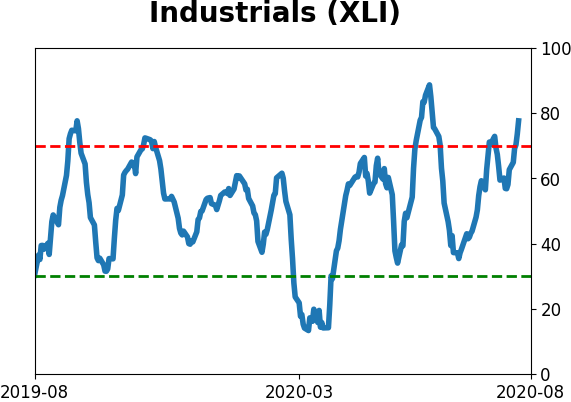
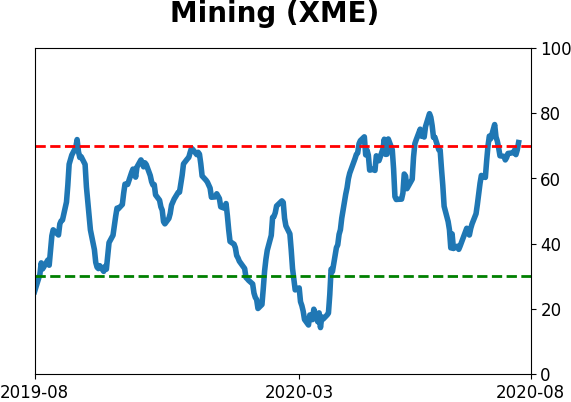
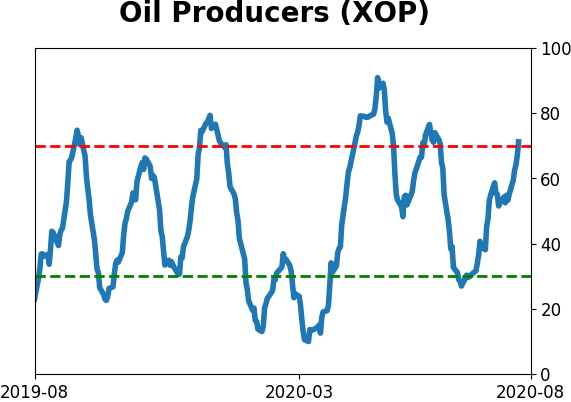
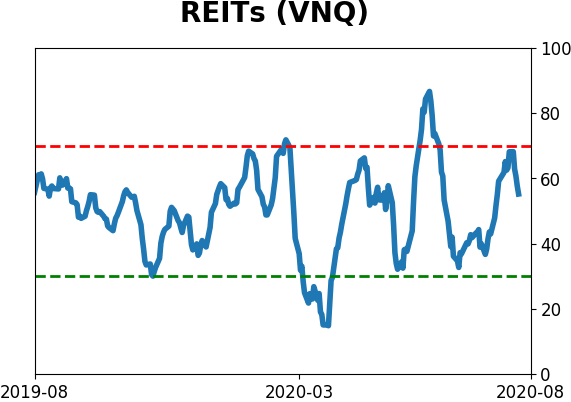
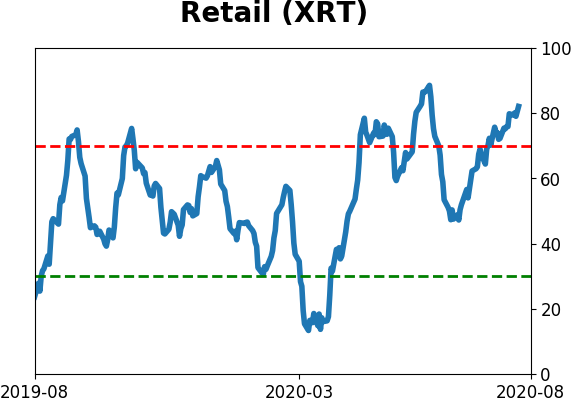
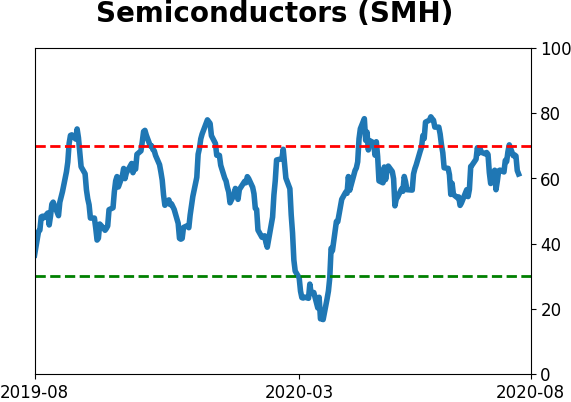
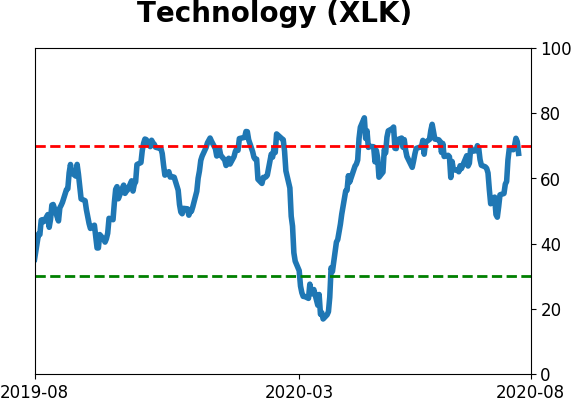
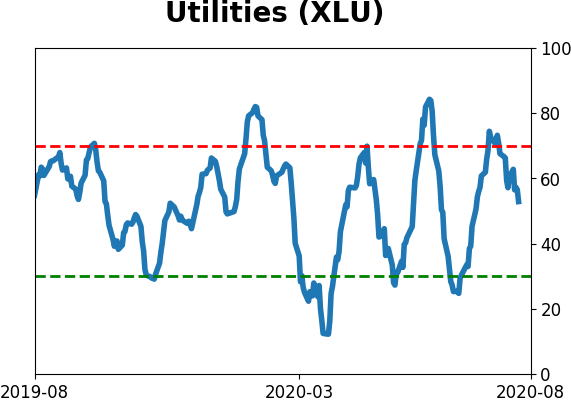
Sector ETF's - 10-Day Moving Average
|
|
|
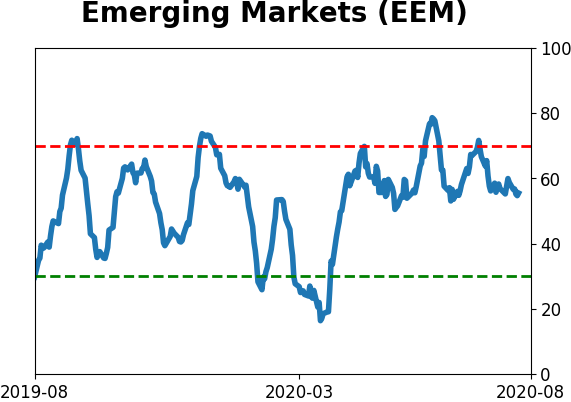
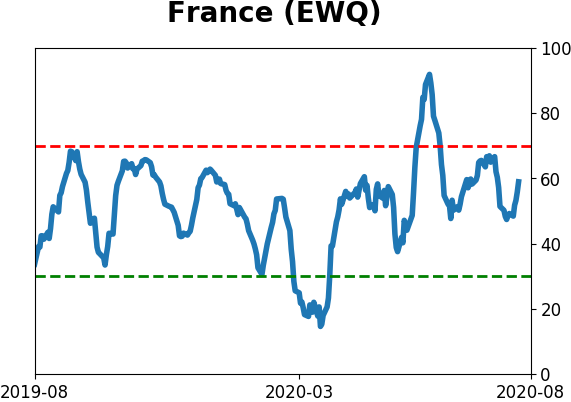
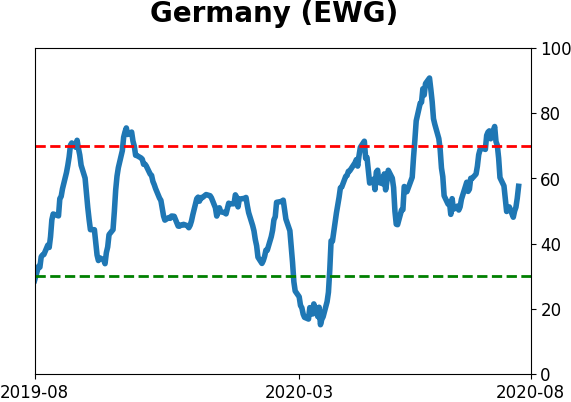
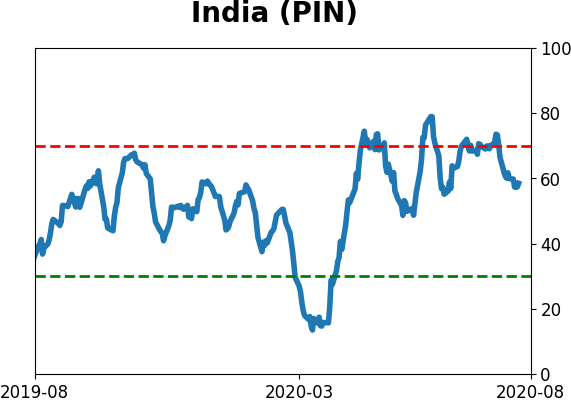
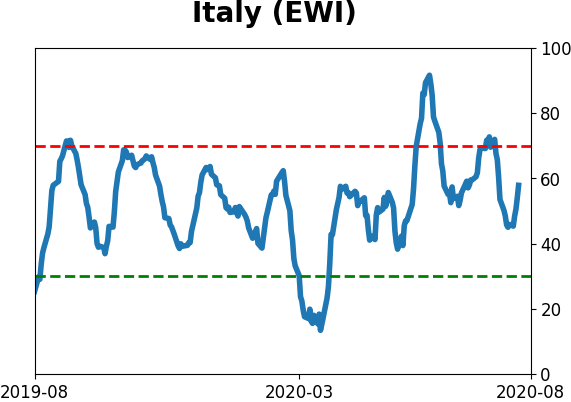
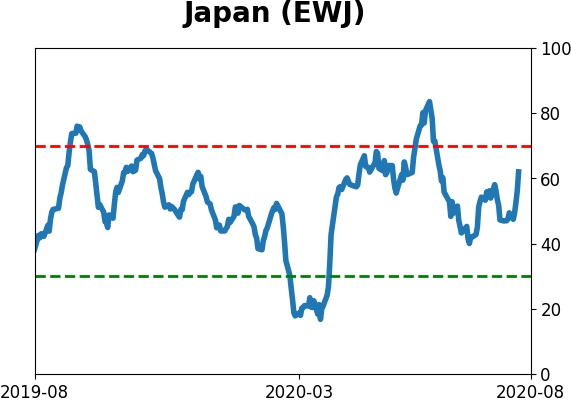
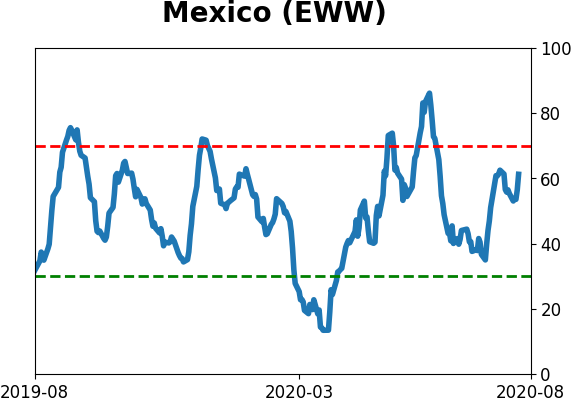
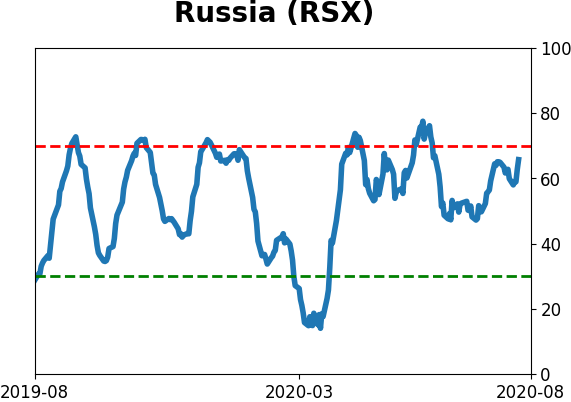
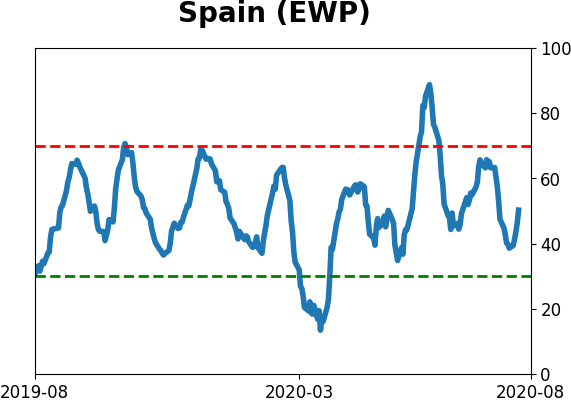
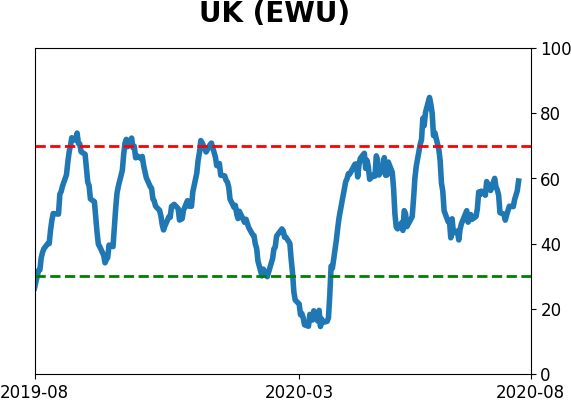
Country ETF's - 10-Day Moving Average
|
|
|
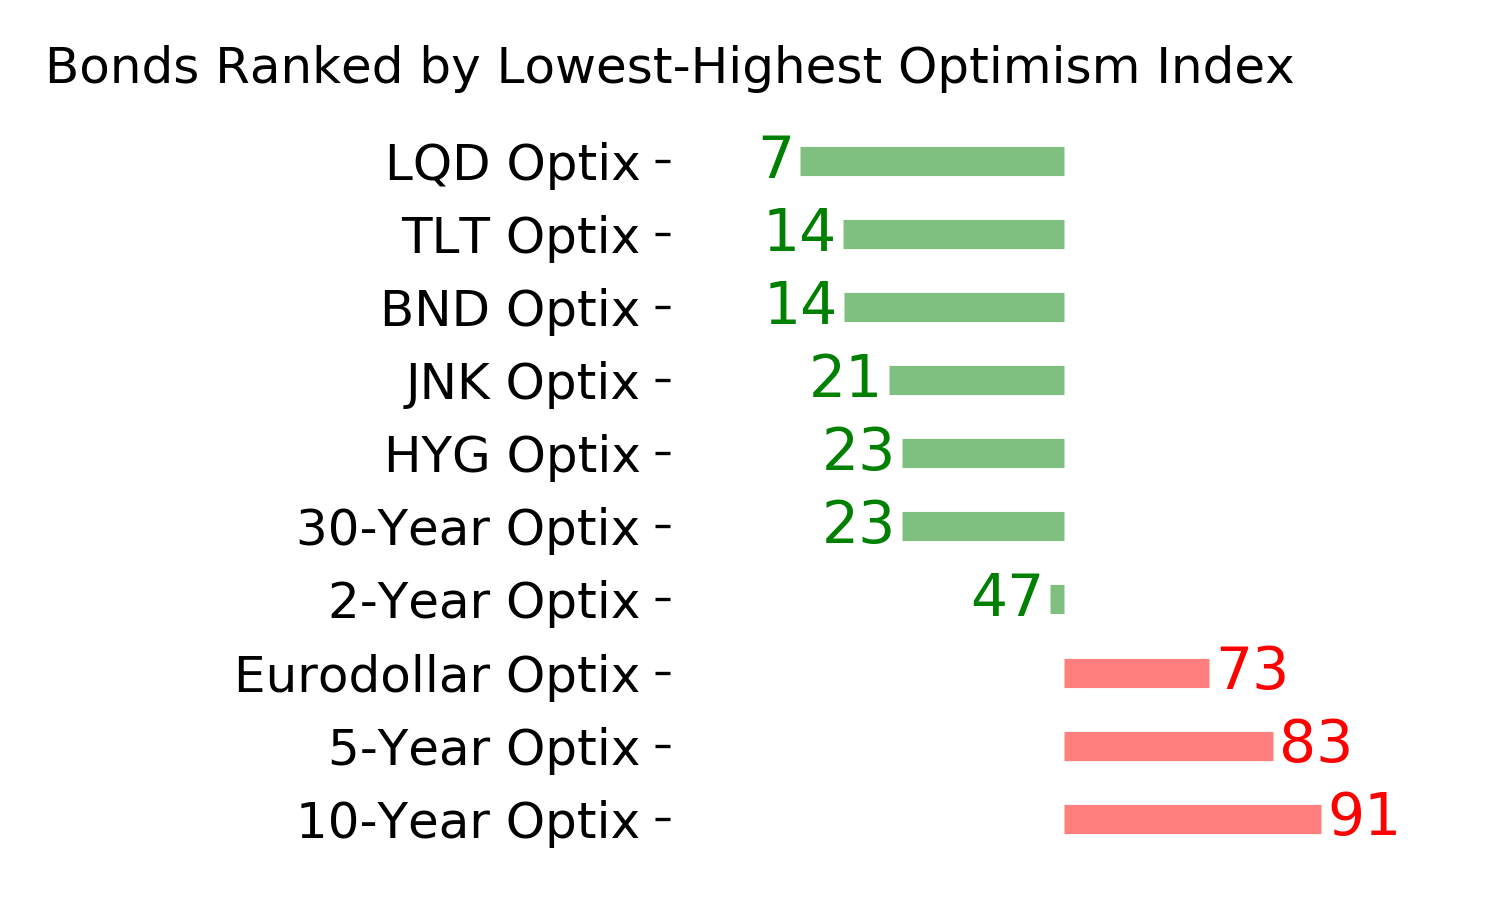
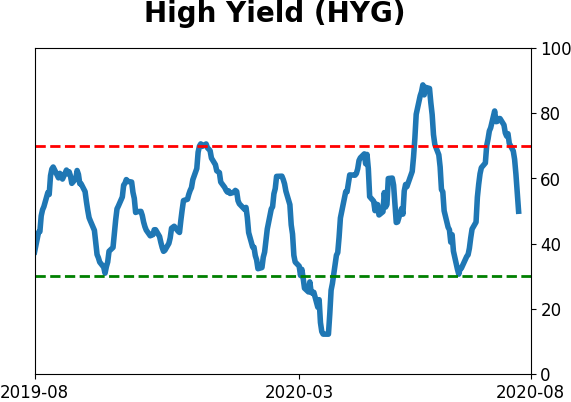
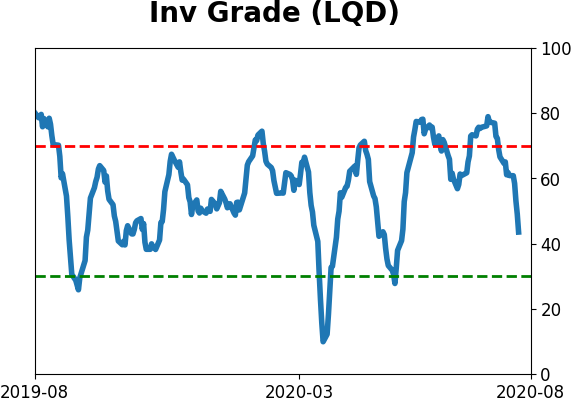
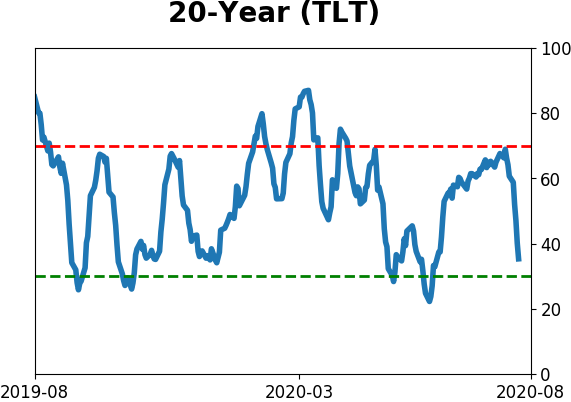
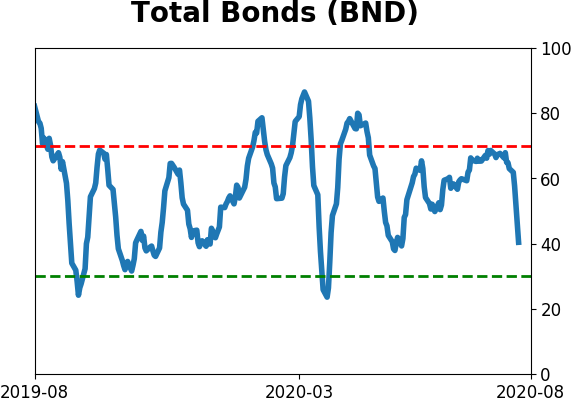
Bond ETF's - 10-Day Moving Average
|
|
|
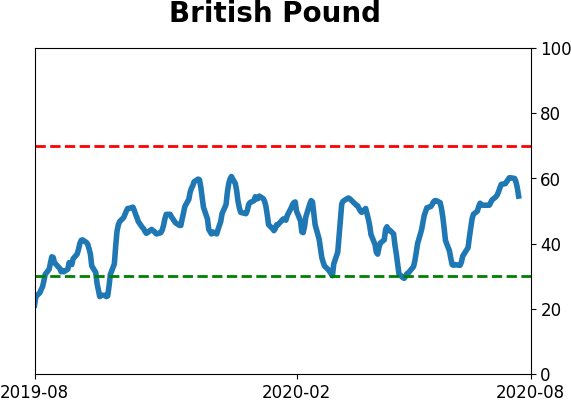
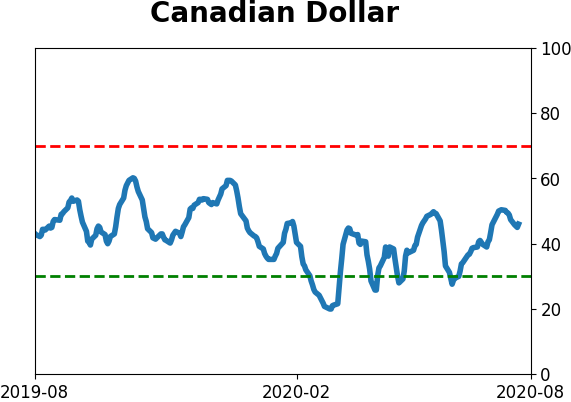
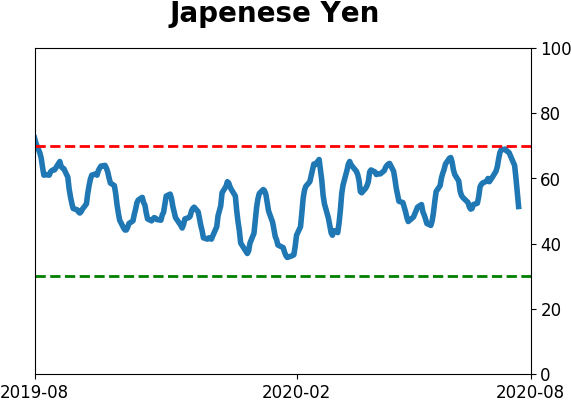
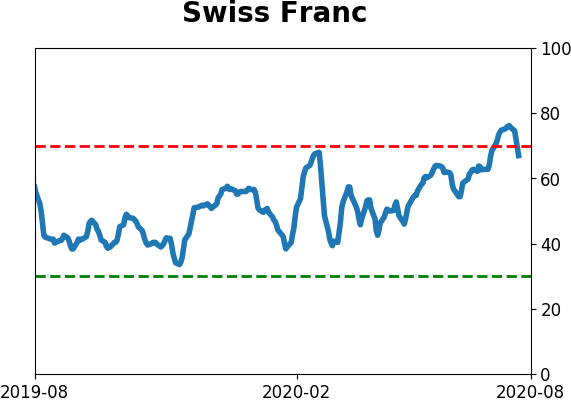
Currency ETF's - 5-Day Moving Average
|
|
|
Commodity ETF's - 5-Day Moving Average
|
|