Headlines
|
|
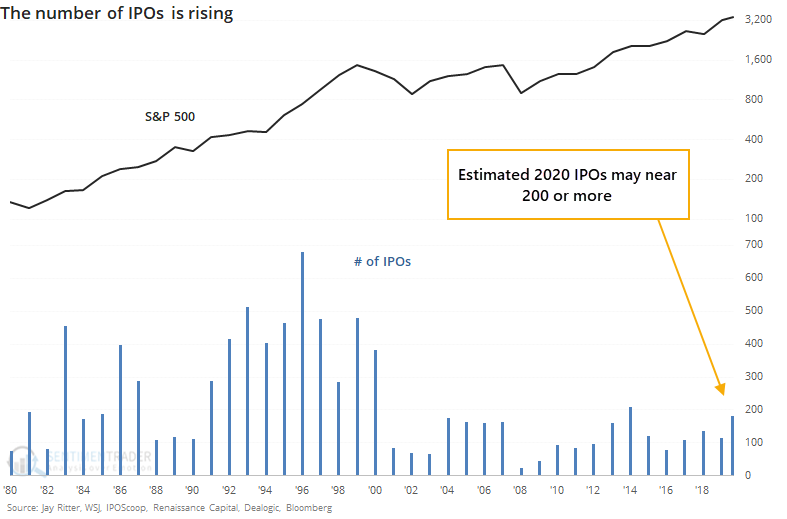
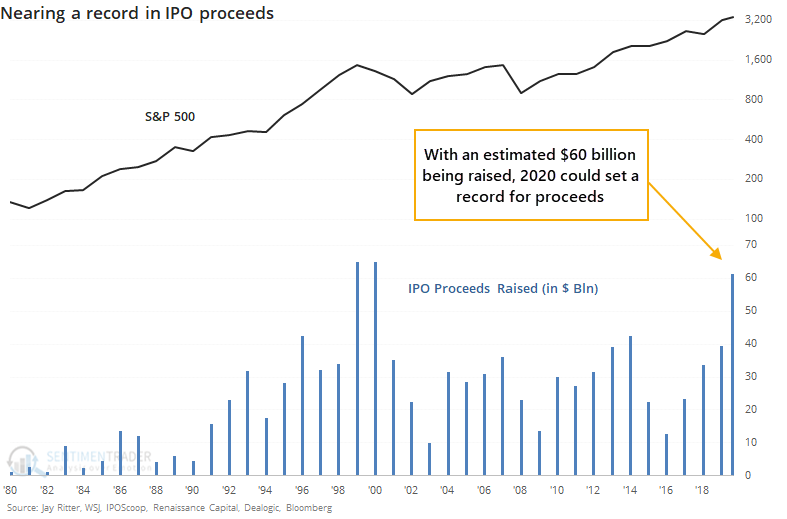
IPO market is nearing records:
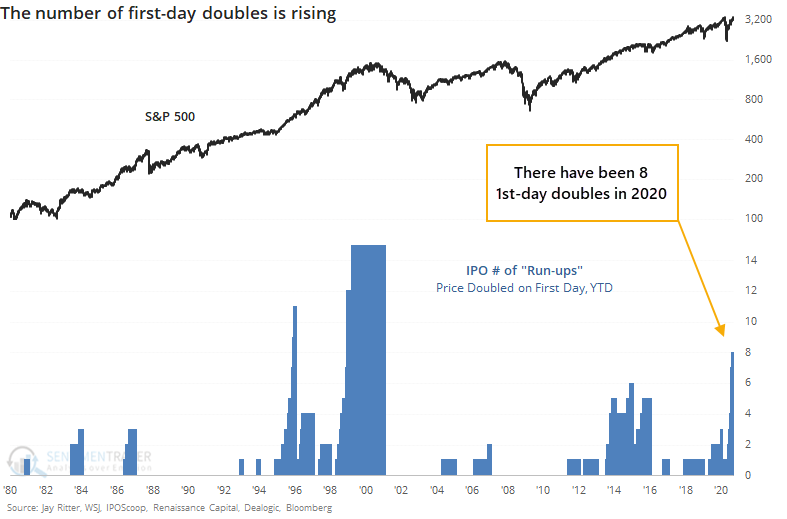
The IPO market is heating up again. The total amount raised in new issues might exceed prior records. The amount that stocks are popping on their first day of trading is on pace to exceed most other years, outside of the 1999-2000 bubble. There have been 8 "doubles" so far in 2020, and it's only August.
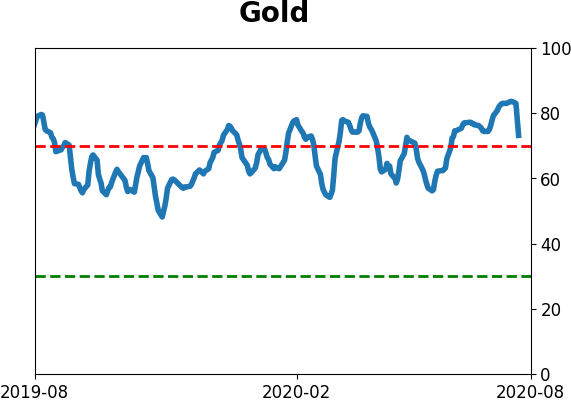
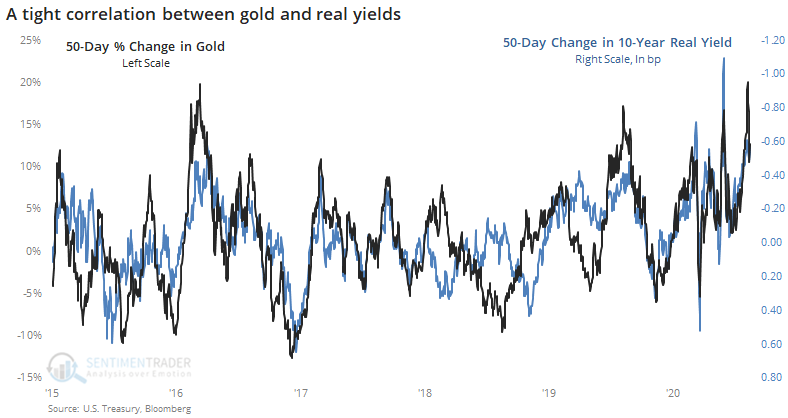
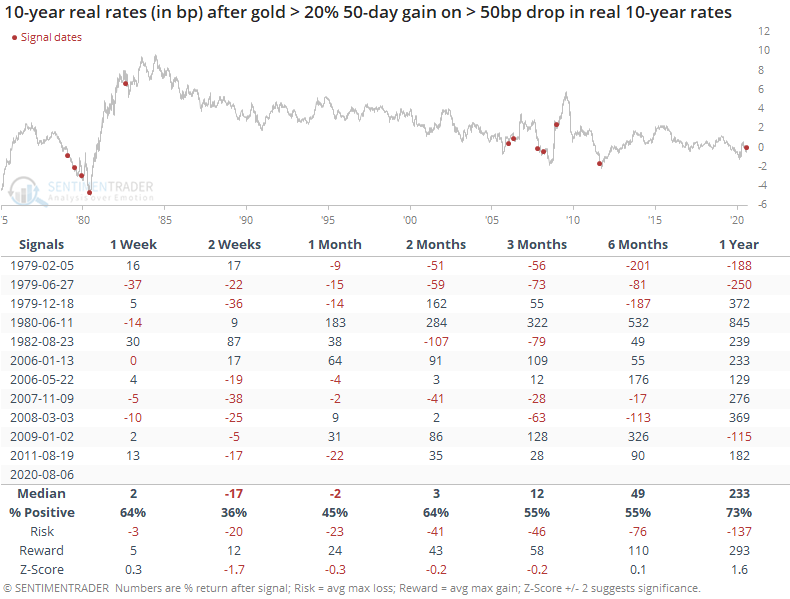
Leading up to its recent tumble, gold shot far ahead of fundamentals:
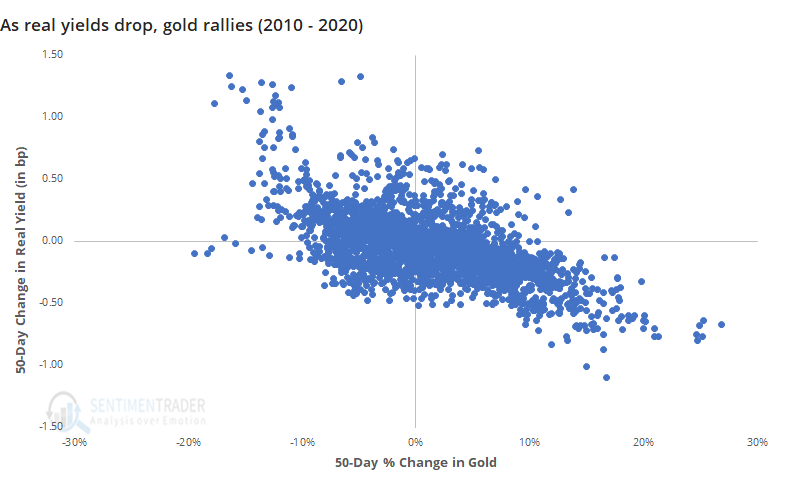
Over a 50-day span, gold rallied more than 20% while real 10-year interest rates tumbled. The two have a tight inverse relationship, but that was a very large rally for that level of decline in rates.
Bottom Line:
- Weight of the evidence has been suggesting flat/lower stock prices short- to medium-term again; still suggesting higher prices long-term
- Indicators show high optimism, with Dumb Money Confidence recently above 80% with signs of reckless speculation during what appears to be an unhealthy market environment, historically a bad combination
- Active Studies show a heavy positive skew over the medium- to long-term; breadth thrusts, recoveries, and trend changes have an almost unblemished record at preceding higher prices over a 6-12 month time frame
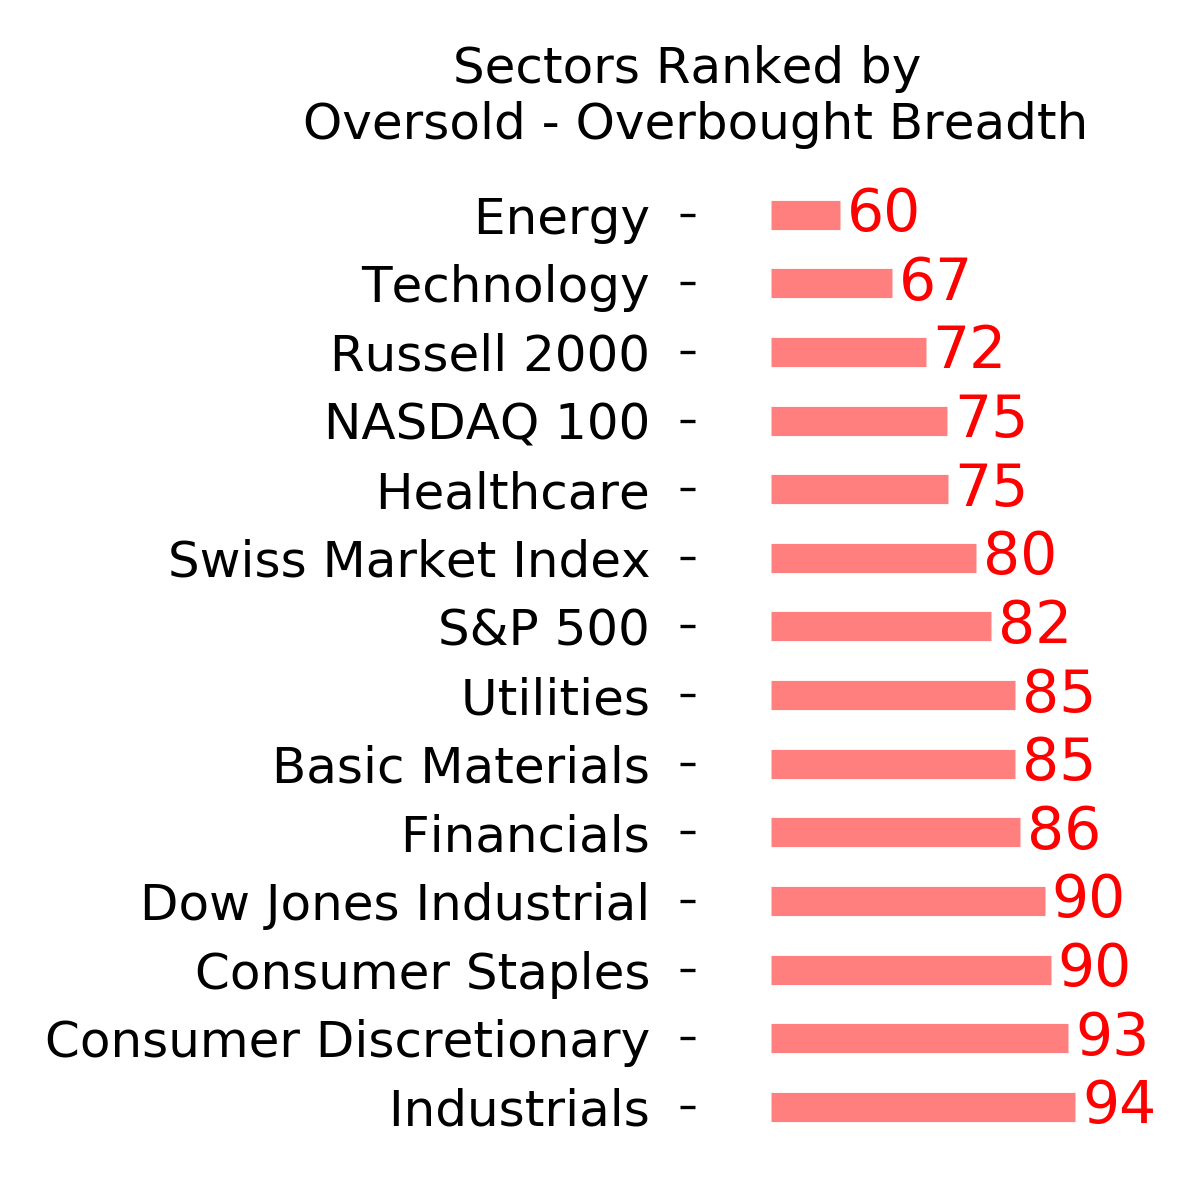
- Signs of extremely skewed preference for tech stocks neared exhaustion by late June, especially relative to industrials and financials (here and here)
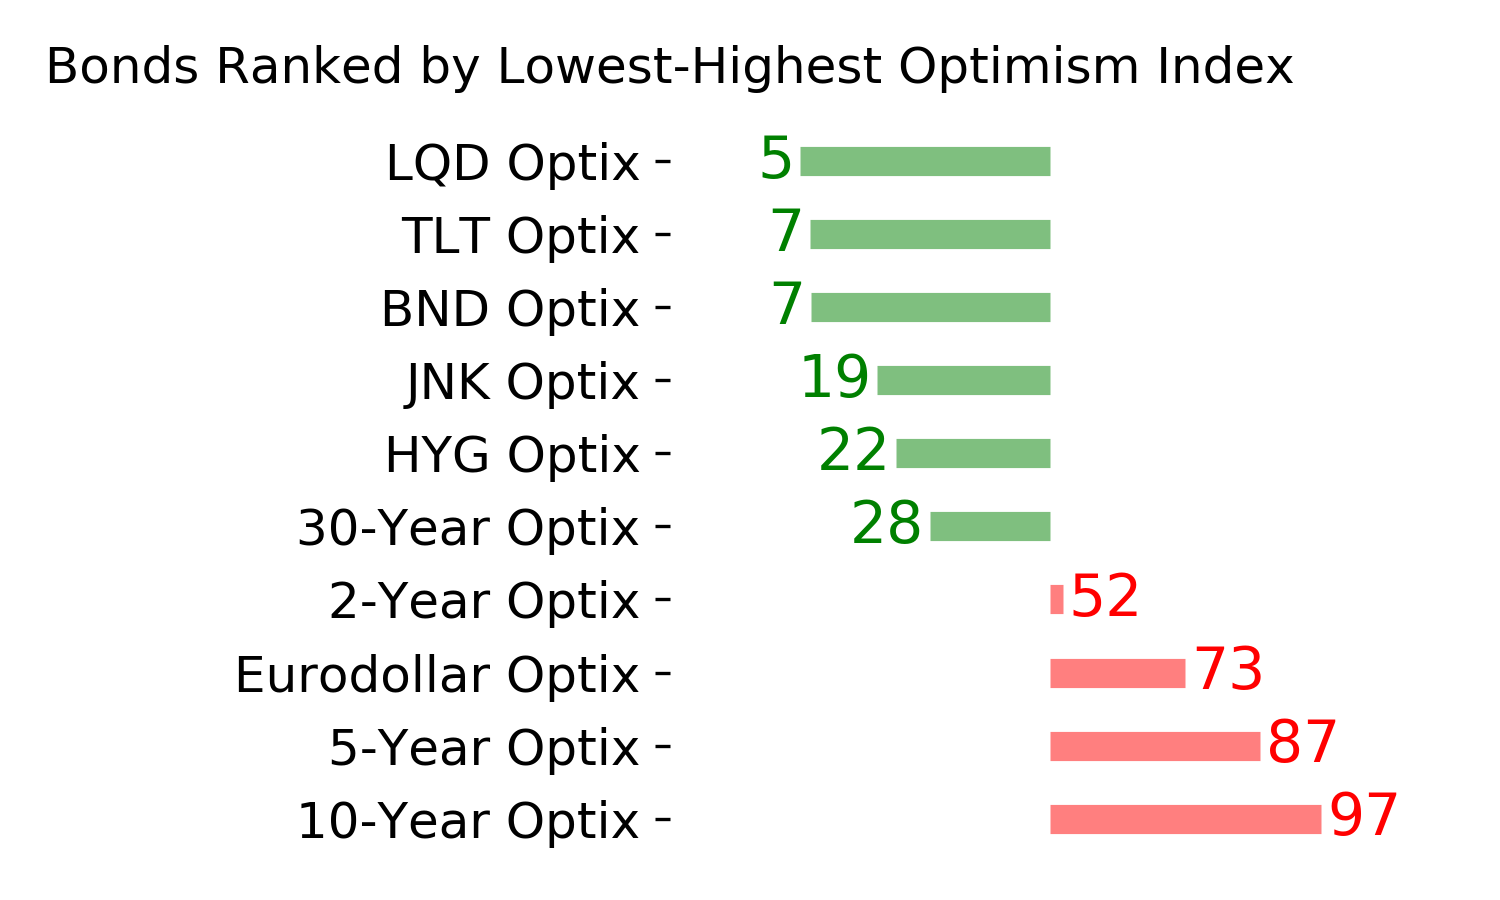
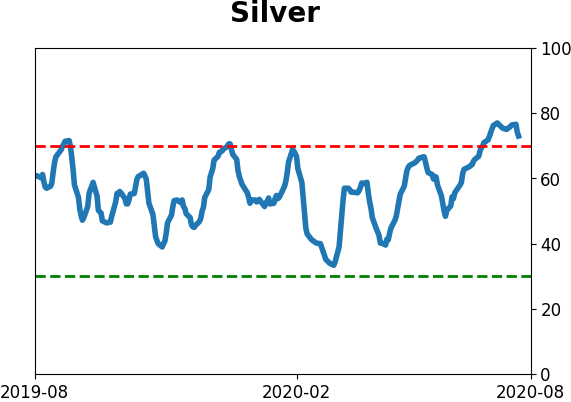
- Indicators and studies for other markets are showing less consistent forward results, though it's not a great sign for Treasuries that hedgers are net short and optimism on metals recently became extreme, with "perfect" breadth among miners
|
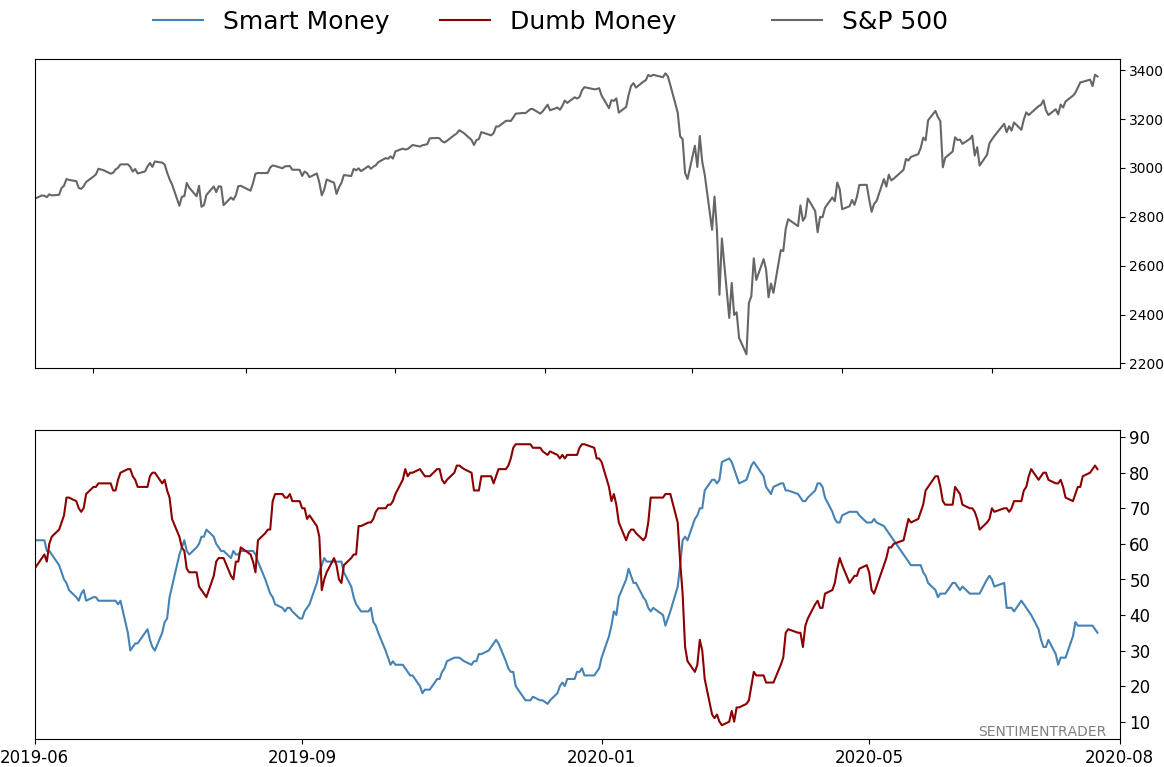
Smart / Dumb Money Confidence
|
Smart Money Confidence: 35%
Dumb Money Confidence: 81%
|
|
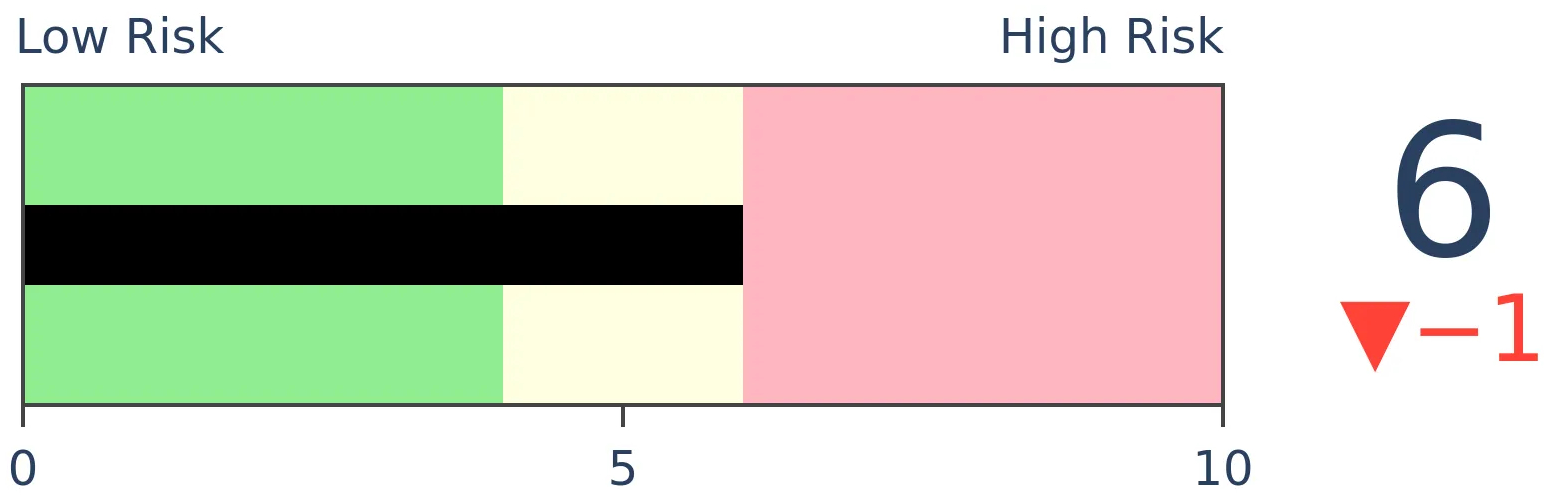
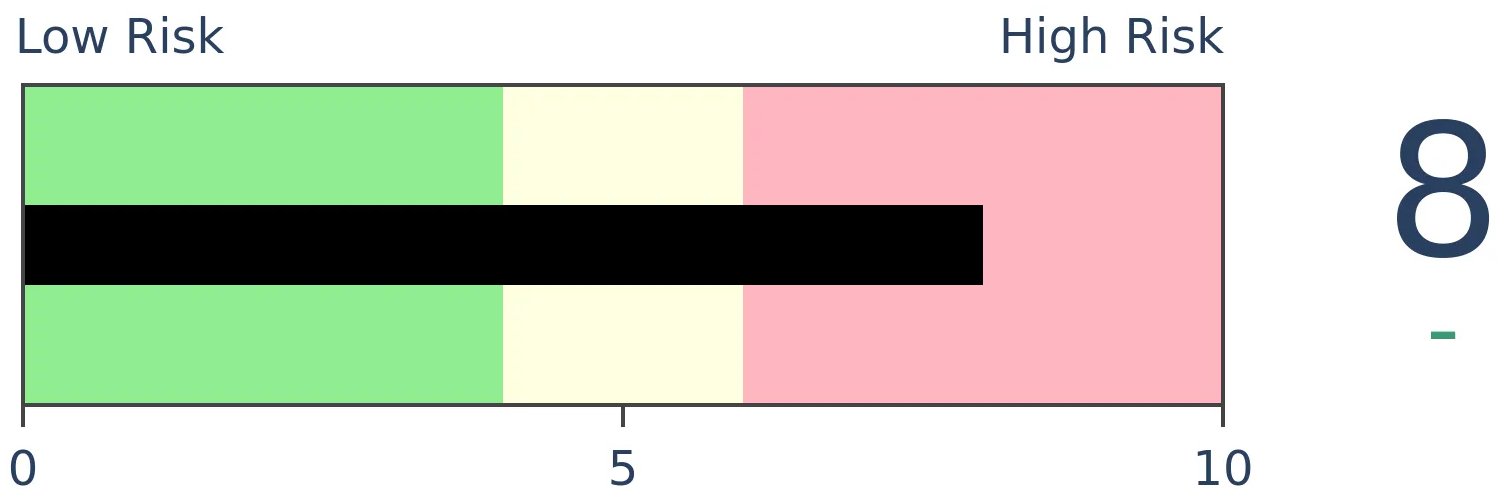
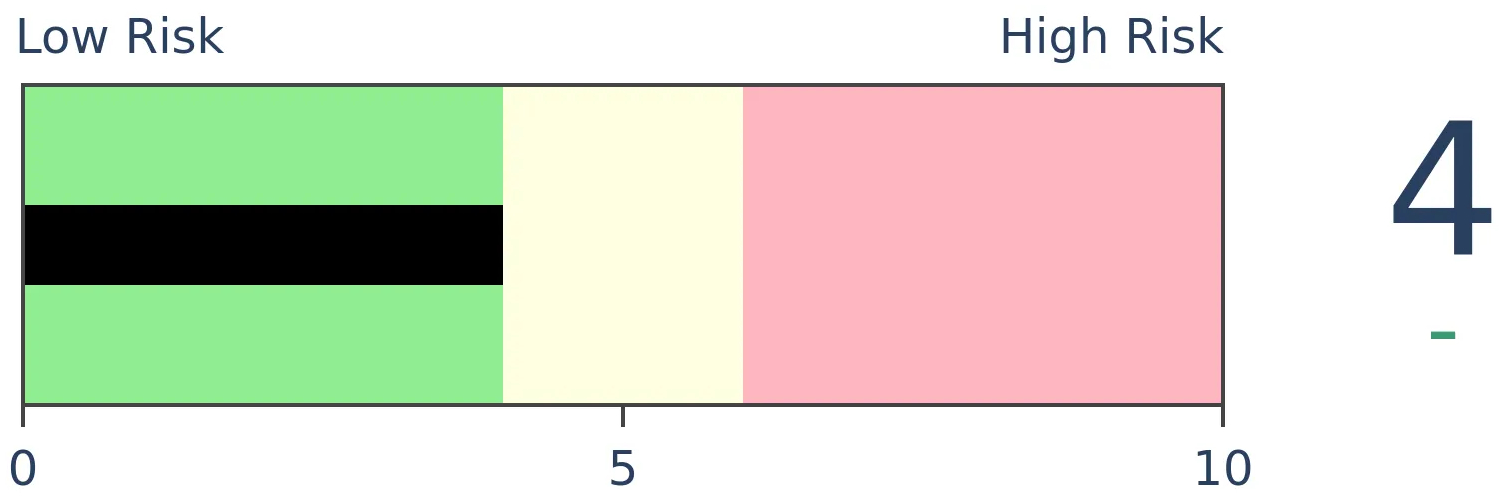
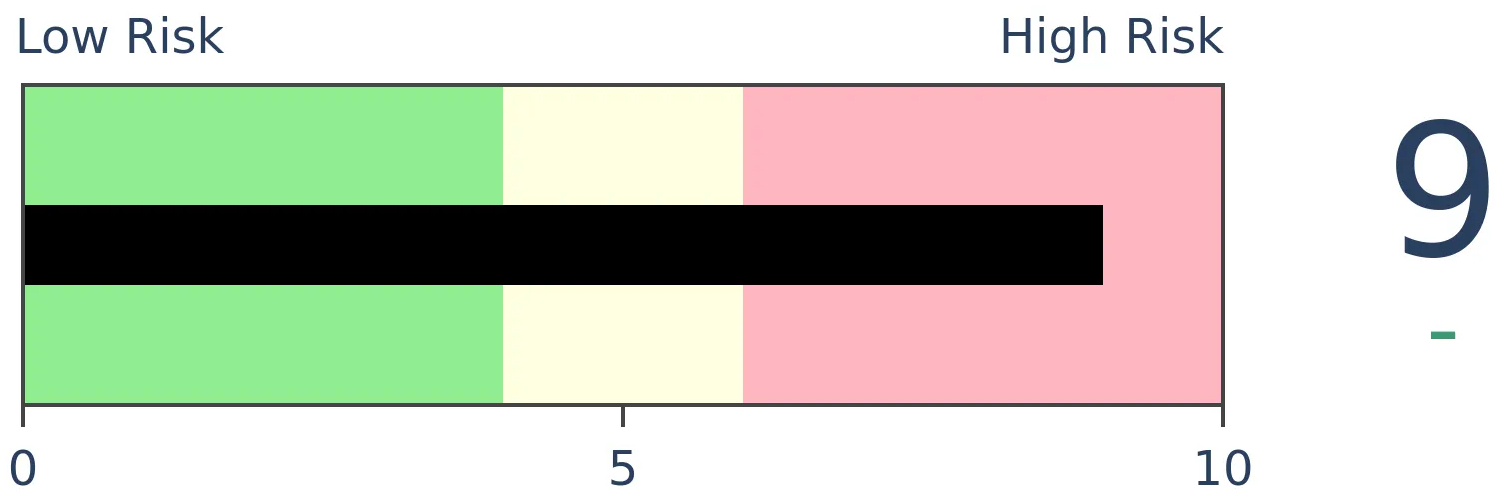
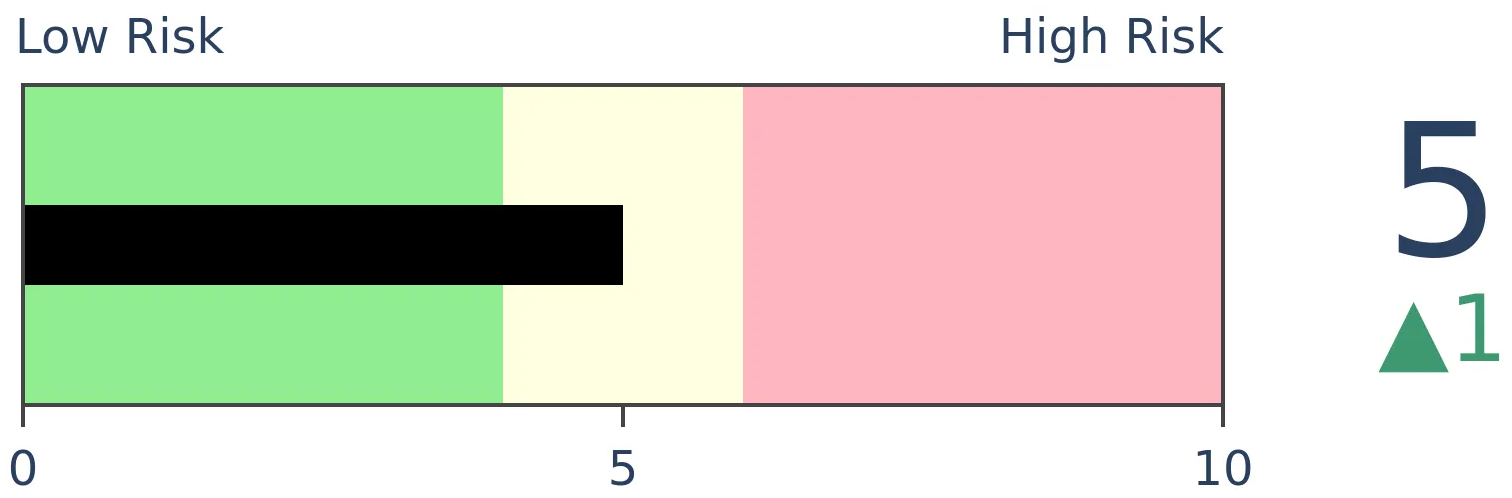
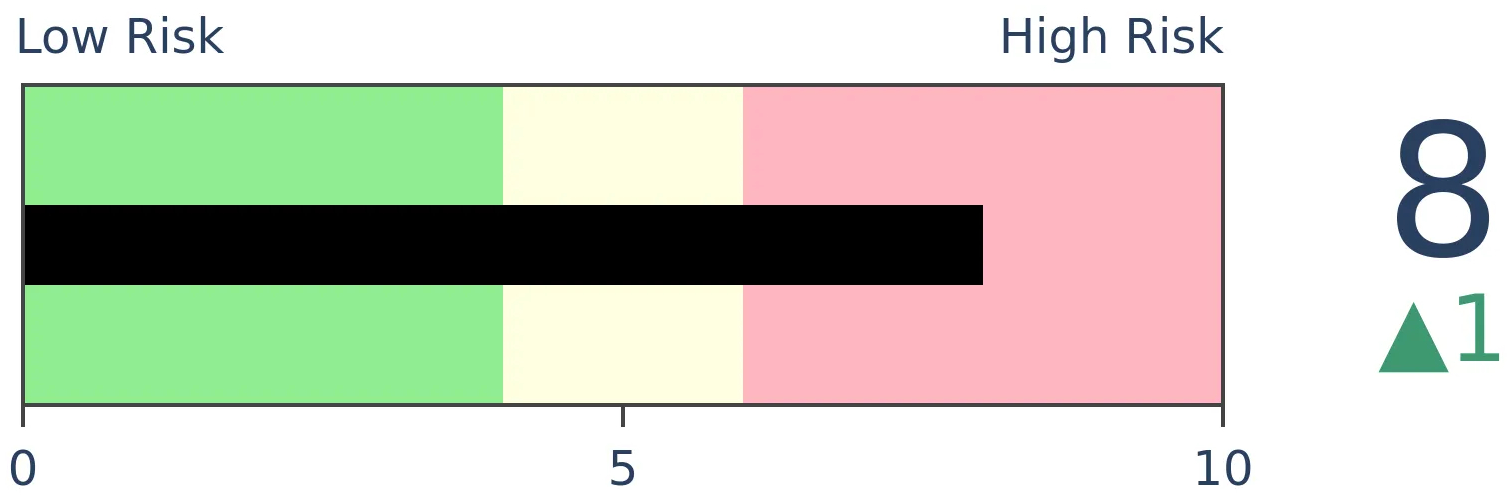
Risk Levels
Stocks Short-Term
|
Stocks Medium-Term
|
|
Bonds
|
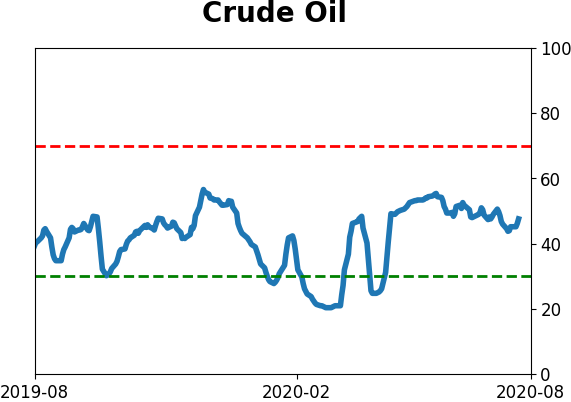
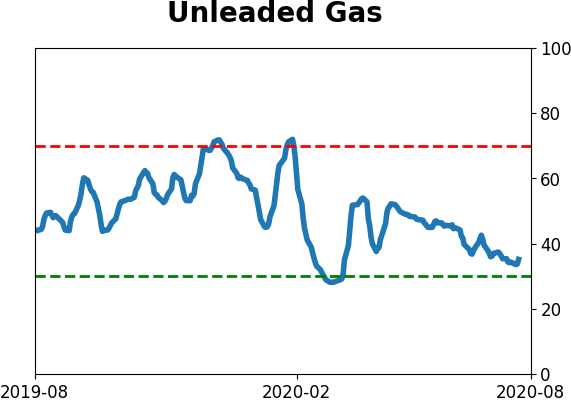
Crude Oil
|
|
Gold
|
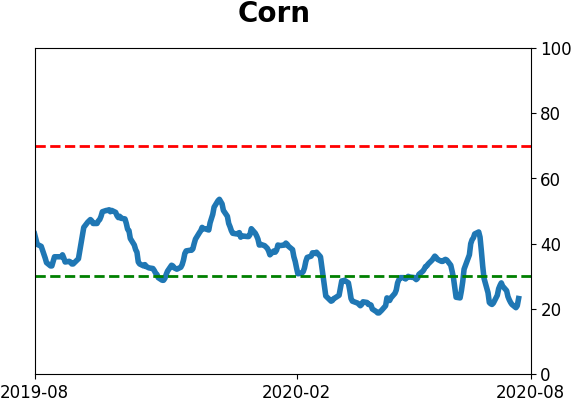
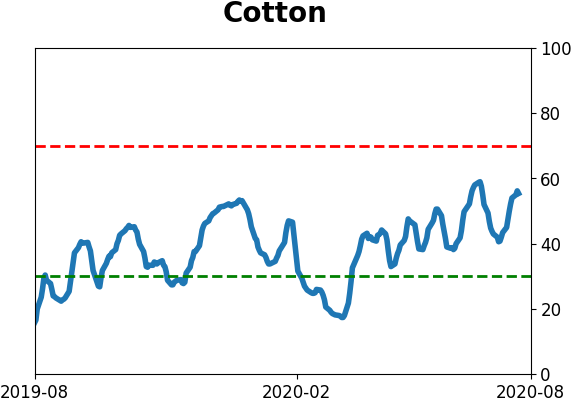
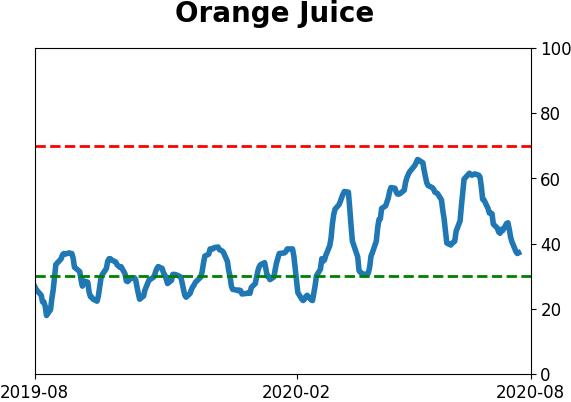
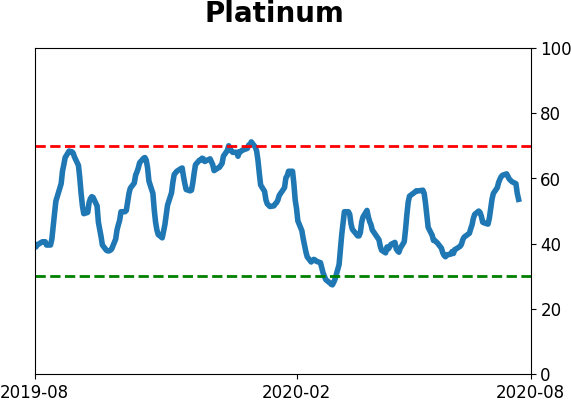
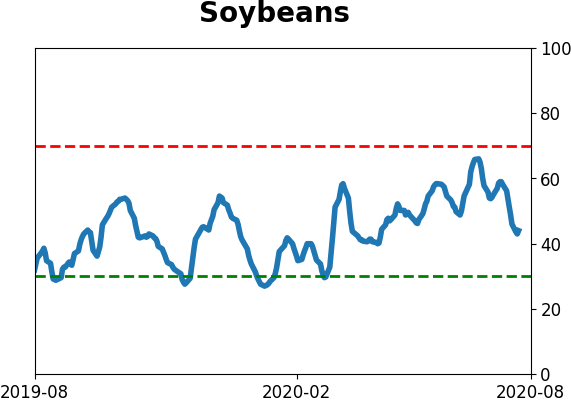
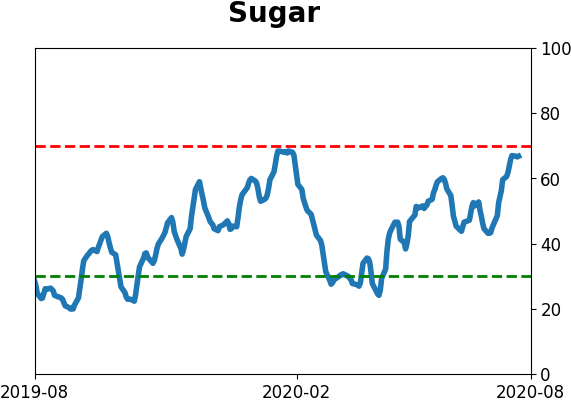
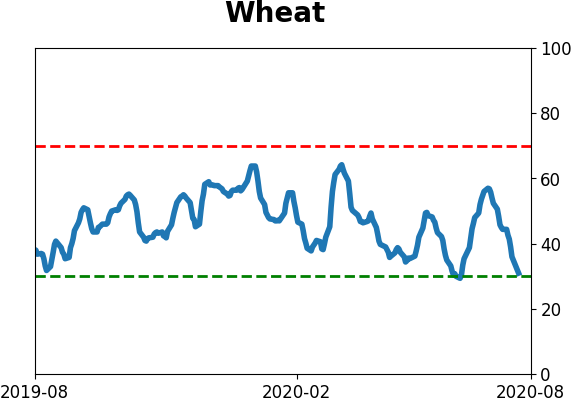
Agriculture
|
|
Research
BOTTOM LINE
The IPO market is heating up again. The total amount raised in new issues might exceed prior records. The amount that stocks are popping on their first day of trading is on pace to exceed most other years, outside of the 1999-2000 bubble. There have been 8 "doubles" so far in 2020, and it's only August.
FORECAST / TIMEFRAME
None
|
Stocks are popping, and companies are itching to take advantage. So are their bankers.
We've already seen that share issuance has spiked this year, and now Wall Street is seeing their opportunity to take full advantage as stocks continue to levitate. As the Wall Street Journal noted, we're on pace for a big uptick in IPOs brought to market, with a surge in the amount of money raised.
In terms of the raw number of new issues, it's still a far cry from the 1999-2000 heyday.
But when accounting for the total value of shares issued, we could set a new record.
The IPOs have been warmly received. While this could change dramatically before year-end, through early August, the average IPO has popped more than 23%. There haven't been too many years with such eager new buyers.
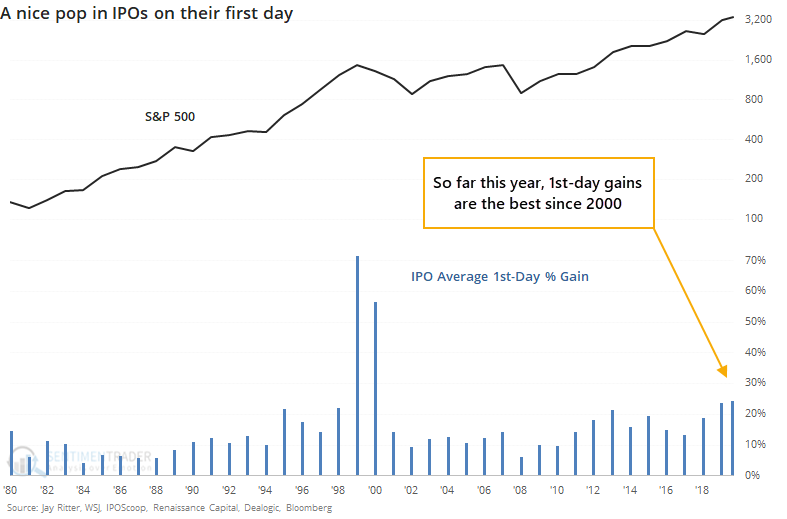
According to data from Jay Ritter, there have been 8 IPOs so far this year that doubled on their first day. If we look at the total number of "run-ups" year-to-date, this year is already in rare territory.
The chart looks a little off because of the 1999-2000 distortion. Anyone who lived through that craziness wouldn't be surprised by the full version of the chart.
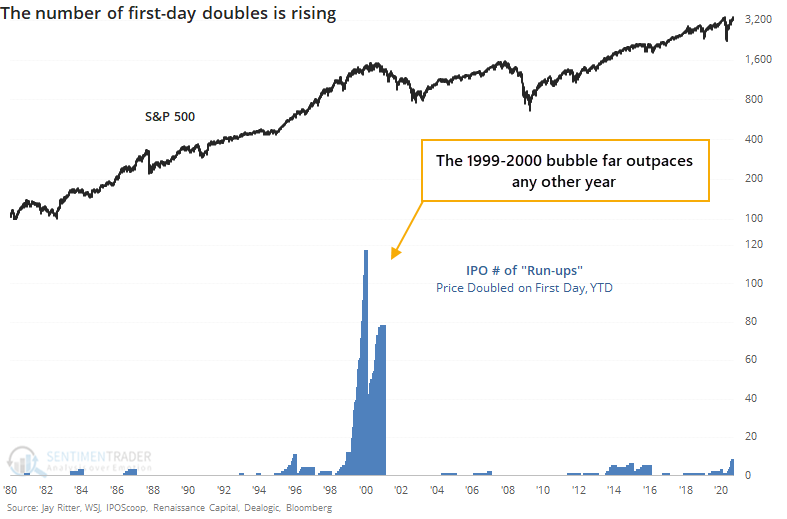
Looking at all the different metrics, we're nowhere near the absurdity of the bubble years. The sheer number of new companies selling shares to the public, and the amount those stocks popped on their first days, may be a unique time in history that will never be equaled.
It is curious, at least, that outside of those two years, 2020 is on pace to exceed just about any other year. Not in terms of the number of new issues, but certainly in the amount raised, and possibly in how eager investors are to receive them. There is a modest-to-strong contrary nature to this data, and it's at least a slight long-term warning sign.
BOTTOM LINE
Over a 50-day span, gold rallied more than 20% while real 10-year interest rates tumbled. The two have a tight inverse relationship, but that was a very large rally for that level of decline in rates.
FORECAST / TIMEFRAME
None
|
Gold had a heck of a run starting about a month ago. It not only generated a massive amount of optimism that the metal will keep rising, it was enough to partially de-couple from one of its main drivers.
As the Wall Street Journal notes, gold's gain over the past 10 weeks far outpaces the drop in real 10-year Treasury yields. There is a tight inverse correlation between the two, so as real rates dropped, gold should have rallied. It just rallied A LOT.
We always apply two questions when seeing a development like this:
- Is it true?
- So what?
As for the first, yes, it's accurate. Over a 50-day span, gold rallied more than 20% while real rates dropped about 50 basis points. That's normal over the past decade, but it's on the higher end of jumps in the price of gold given that level of decline in real yields. For a drop of 50 or more basis points in real yield, gold has rallied a median of 13%, so the 20%+ spike is quite a bit higher than average.
As for whether it matters, that's less certain. Below, we can see every time since 1975 when gold rallied at least 20% over a 50-day span while real yields declined 50 basis points or more.
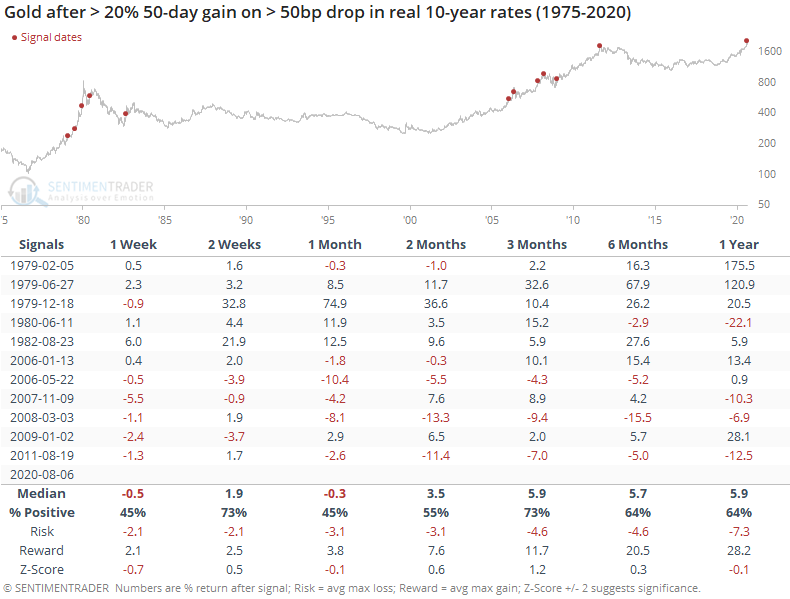
Over the next month, gold struggled a bit. It did not at all during the late 70s bull market, but during the protracted 2000s bull, gold did tend to rest over the medium-term after getting so far ahead of one of its main fundamental drivers.
As for rates, there was a modest tendency to see further weakness over the shorter-term but strength over the medium- to long-term. It was not a strong edge.
There was no strong edge in either the U.S. dollar or S&P 500, either.
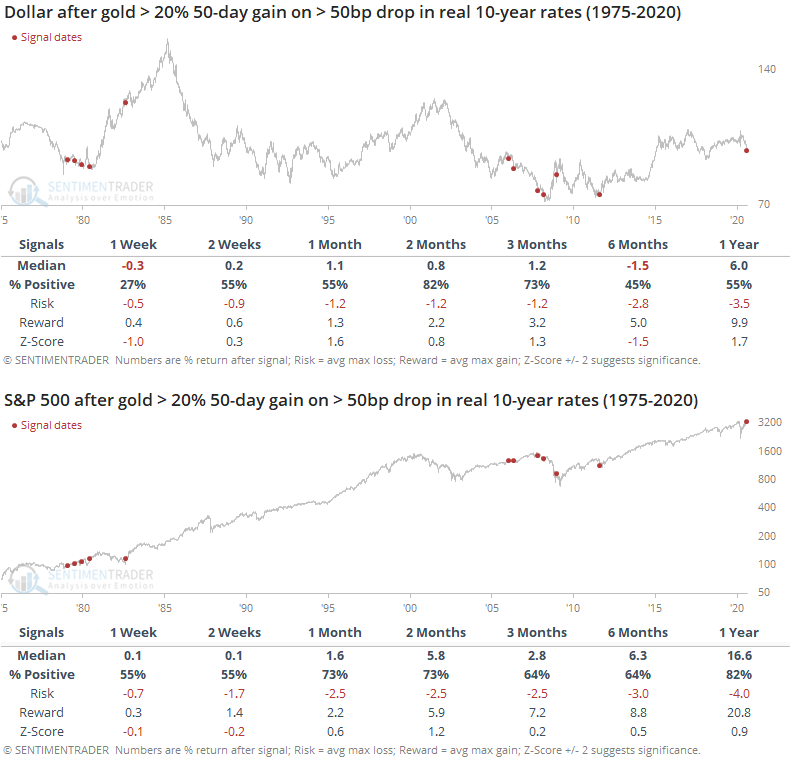
Bottom line, it's interesting that gold has moved so far ahead of one of its main reasons for rallying. The extreme optimism it generated makes sense, too. There is a tendency for the metal to drop after bouts of extremes like it saw in late July, with its more recent history of decoupling from real rates being minor support to that idea as well.
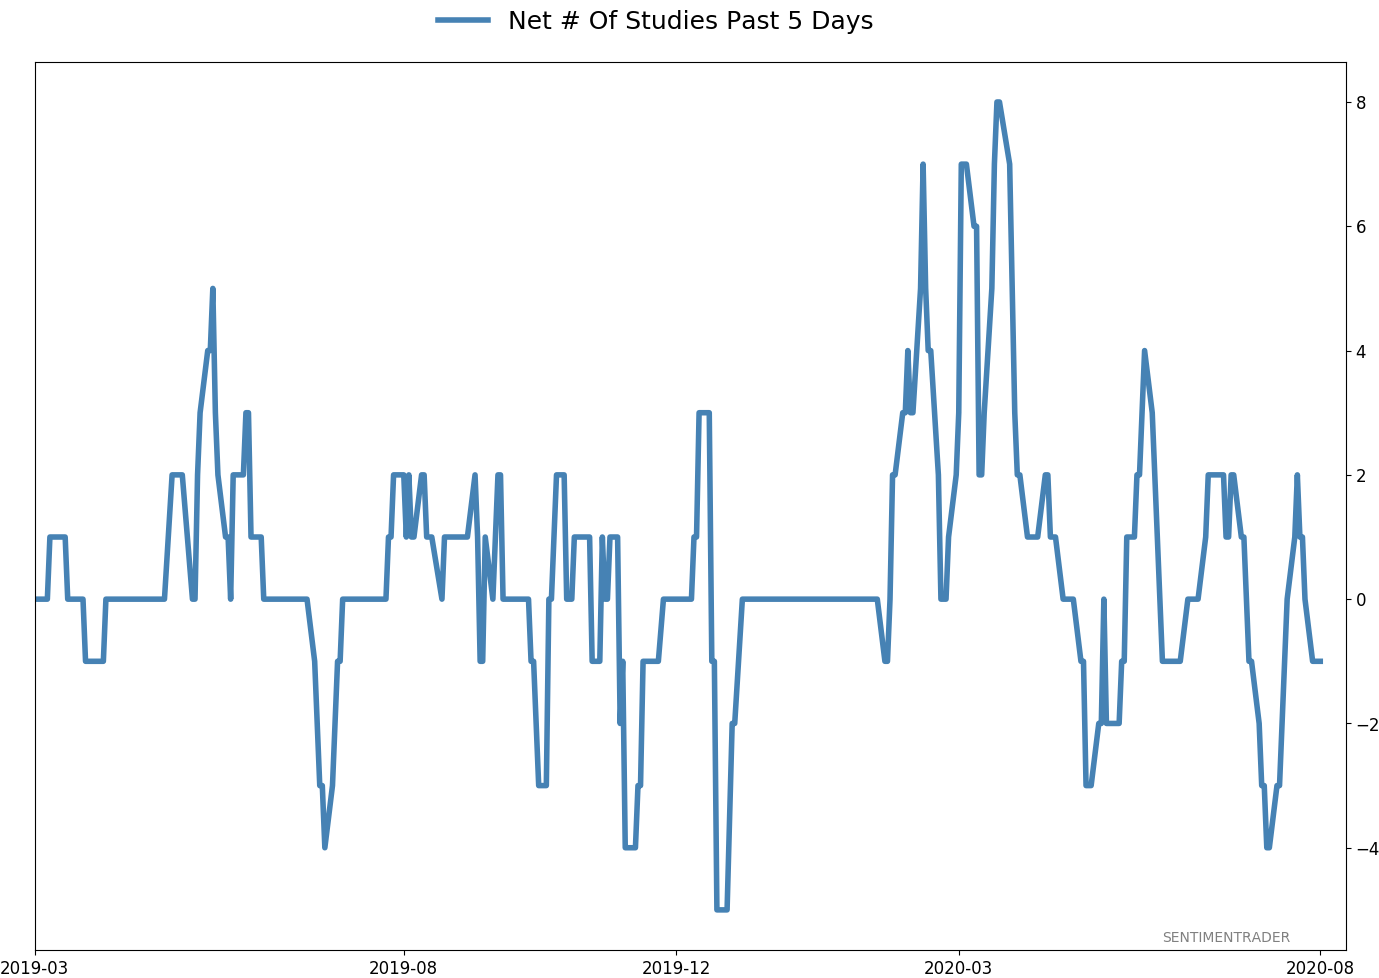
Active Studies
| Time Frame | Bullish | Bearish | | Short-Term | 0 | 1 | | Medium-Term | 8 | 12 | | Long-Term | 46 | 1 |
|
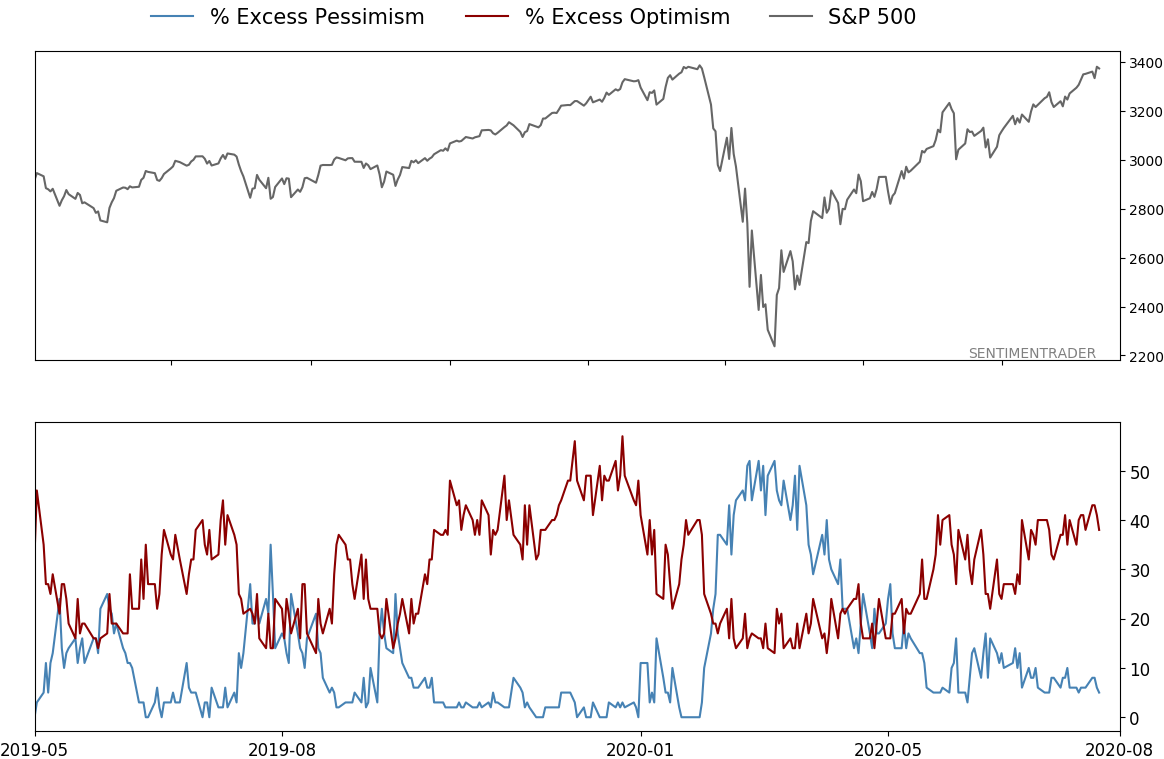
Indicators at Extremes
Portfolio
| Position | Weight % | Added / Reduced | Date | | Stocks | 29.8 | Reduced 9.1% | 2020-06-11 | | Bonds | 0.0 | Reduced 6.7% | 2020-02-28 | | Commodities | 5.2 | Added 2.4%
| 2020-02-28 | | Precious Metals | 0.0 | Reduced 3.6% | 2020-02-28 | | Special Situations | 0.0 | Reduced 31.9% | 2020-03-17 | | Cash | 65.0 | | |
|
Updates (Changes made today are underlined)
After stocks bottomed on March 23rd, they enjoyed a historic buying thrust and retraced a larger amount of the decline than "just a bear market rally" tends to. Through June, there were signs of breadth thrusts, recoveries, and trend changes that have an almost unblemished record at preceding higher prices over a 6-12 month time frame. On a shorter-term basis, our indicators have been showing high optimism, with Dumb Money Confidence recently above 80%, along with signs of reckless speculation during what appears to be an unhealthy market environment, historically a bad combination. While there are certainly some outlier indicators that are showing apathy or even outright pessimism, a weight-of-the-evidence approach suggests high risk over a multi-week to multi-month time frame. I've been carrying a low (too low) level of exposure to stocks, as well as bonds and gold. I don't see a good opportunity to add to any of those currently, with poor prospects pretty much all the way around. As worried as I am over the medium-term, I would only grudgingly reduce my exposure even further given the longer-term positives we spent so much time discussing in the spring. At this point, I would only look seriously at lowering exposure further if the S&P 500 drops below approximately 3220, an initial sign that its recent mini-breakout had failed.
RETURN YTD: -2.7% 2019: 12.6%, 2018: 0.6%, 2017: 3.8%, 2016: 17.1%, 2015: 9.2%, 2014: 14.5%, 2013: 2.2%, 2012: 10.8%, 2011: 16.5%, 2010: 15.3%, 2009: 23.9%, 2008: 16.2%, 2007: 7.8%
|
|
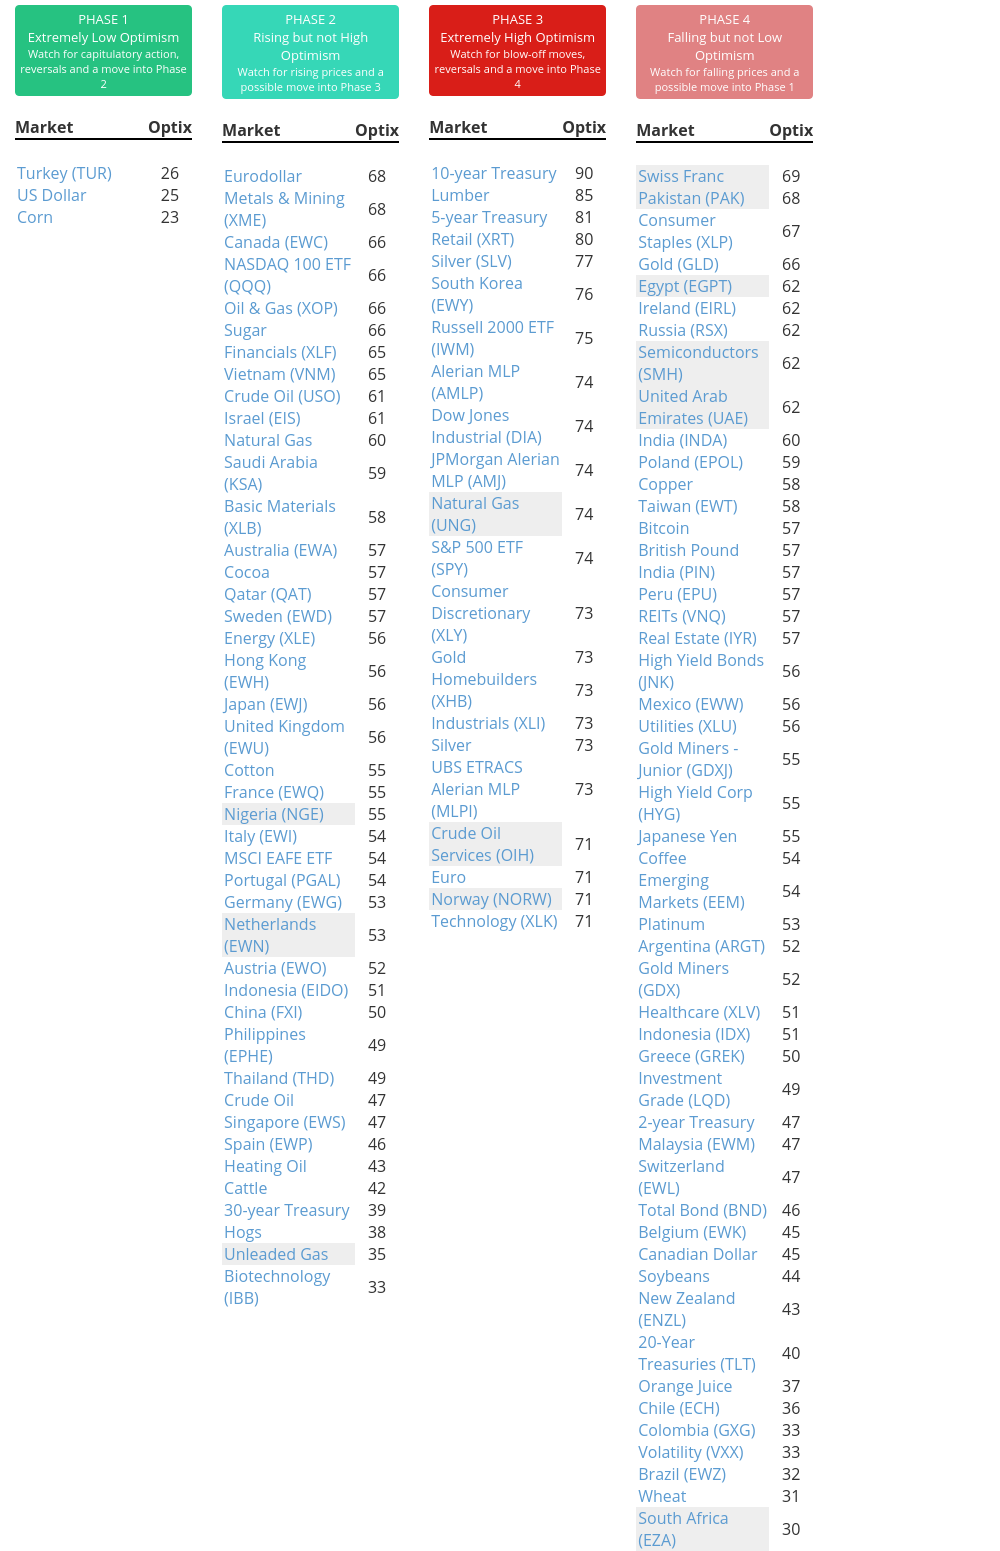
Phase Table
Ranks
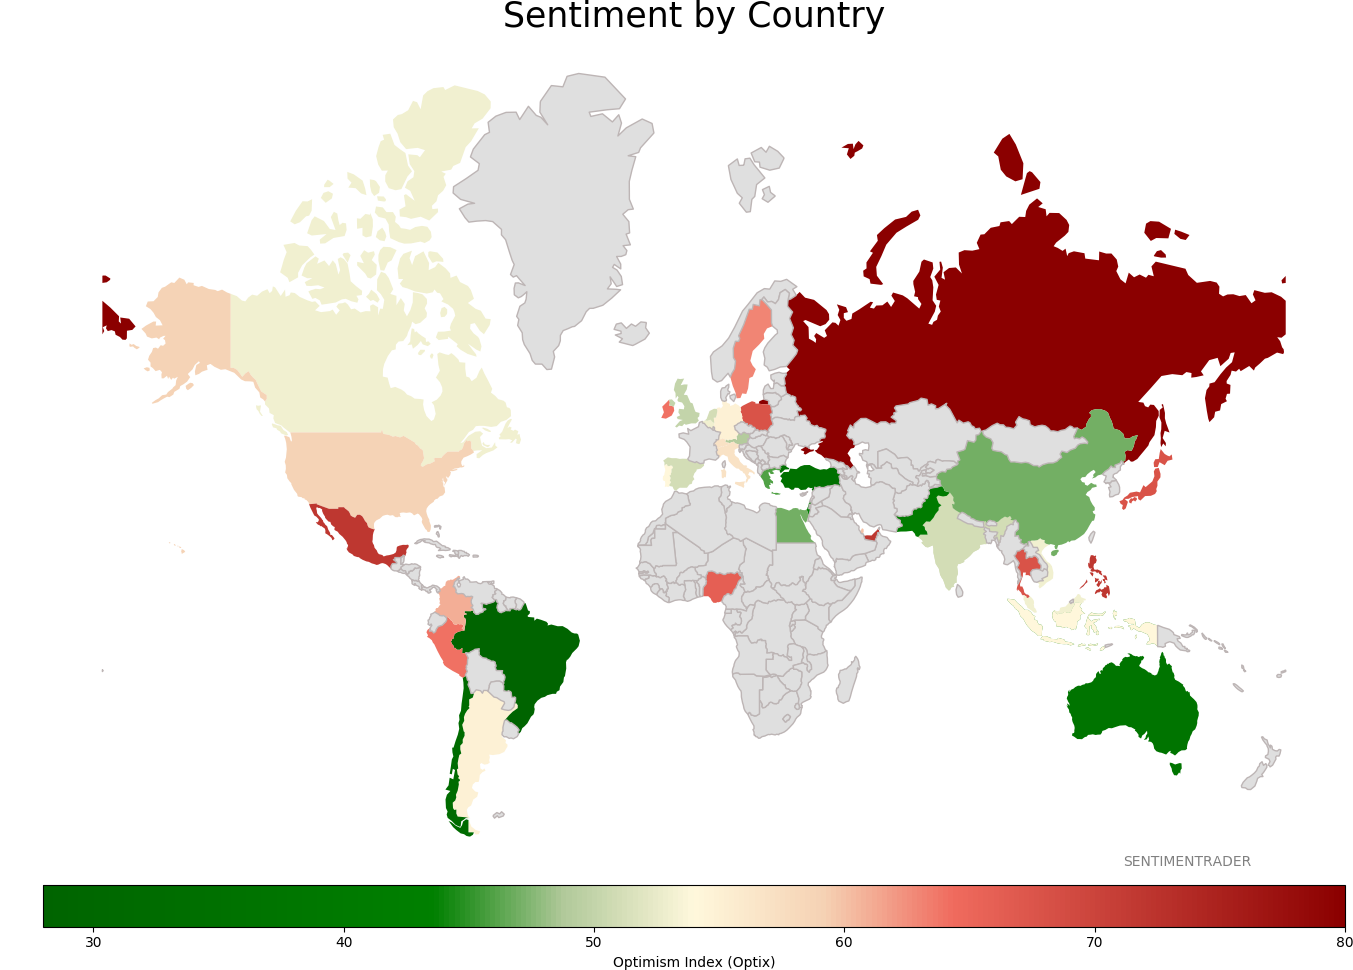
Sentiment Around The World
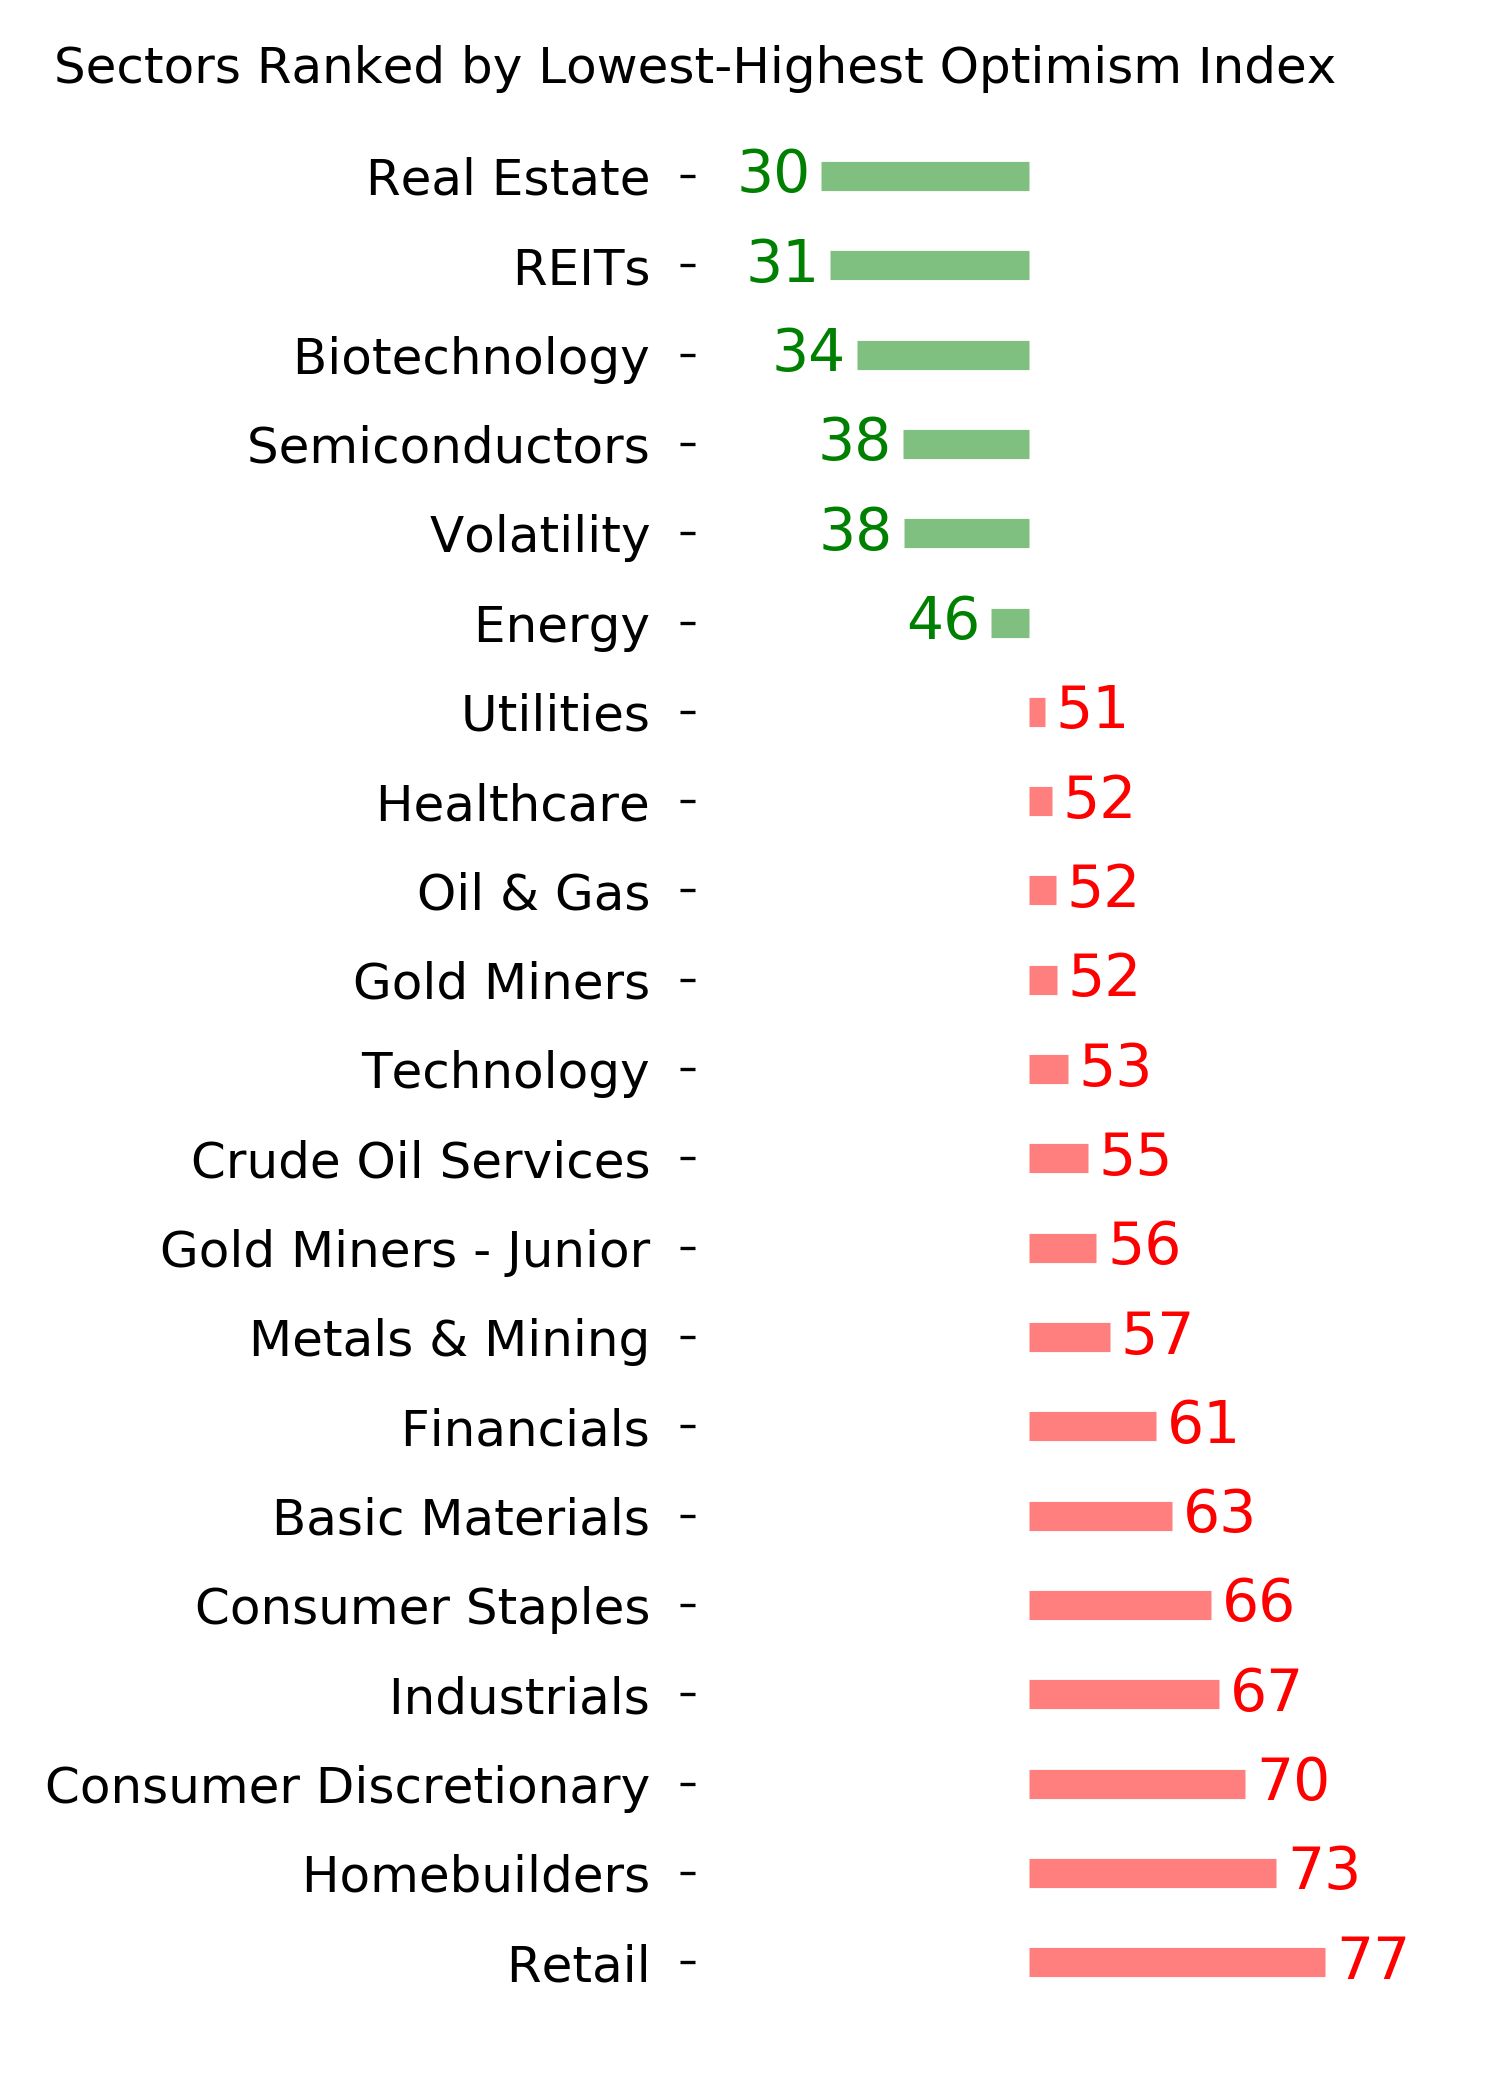
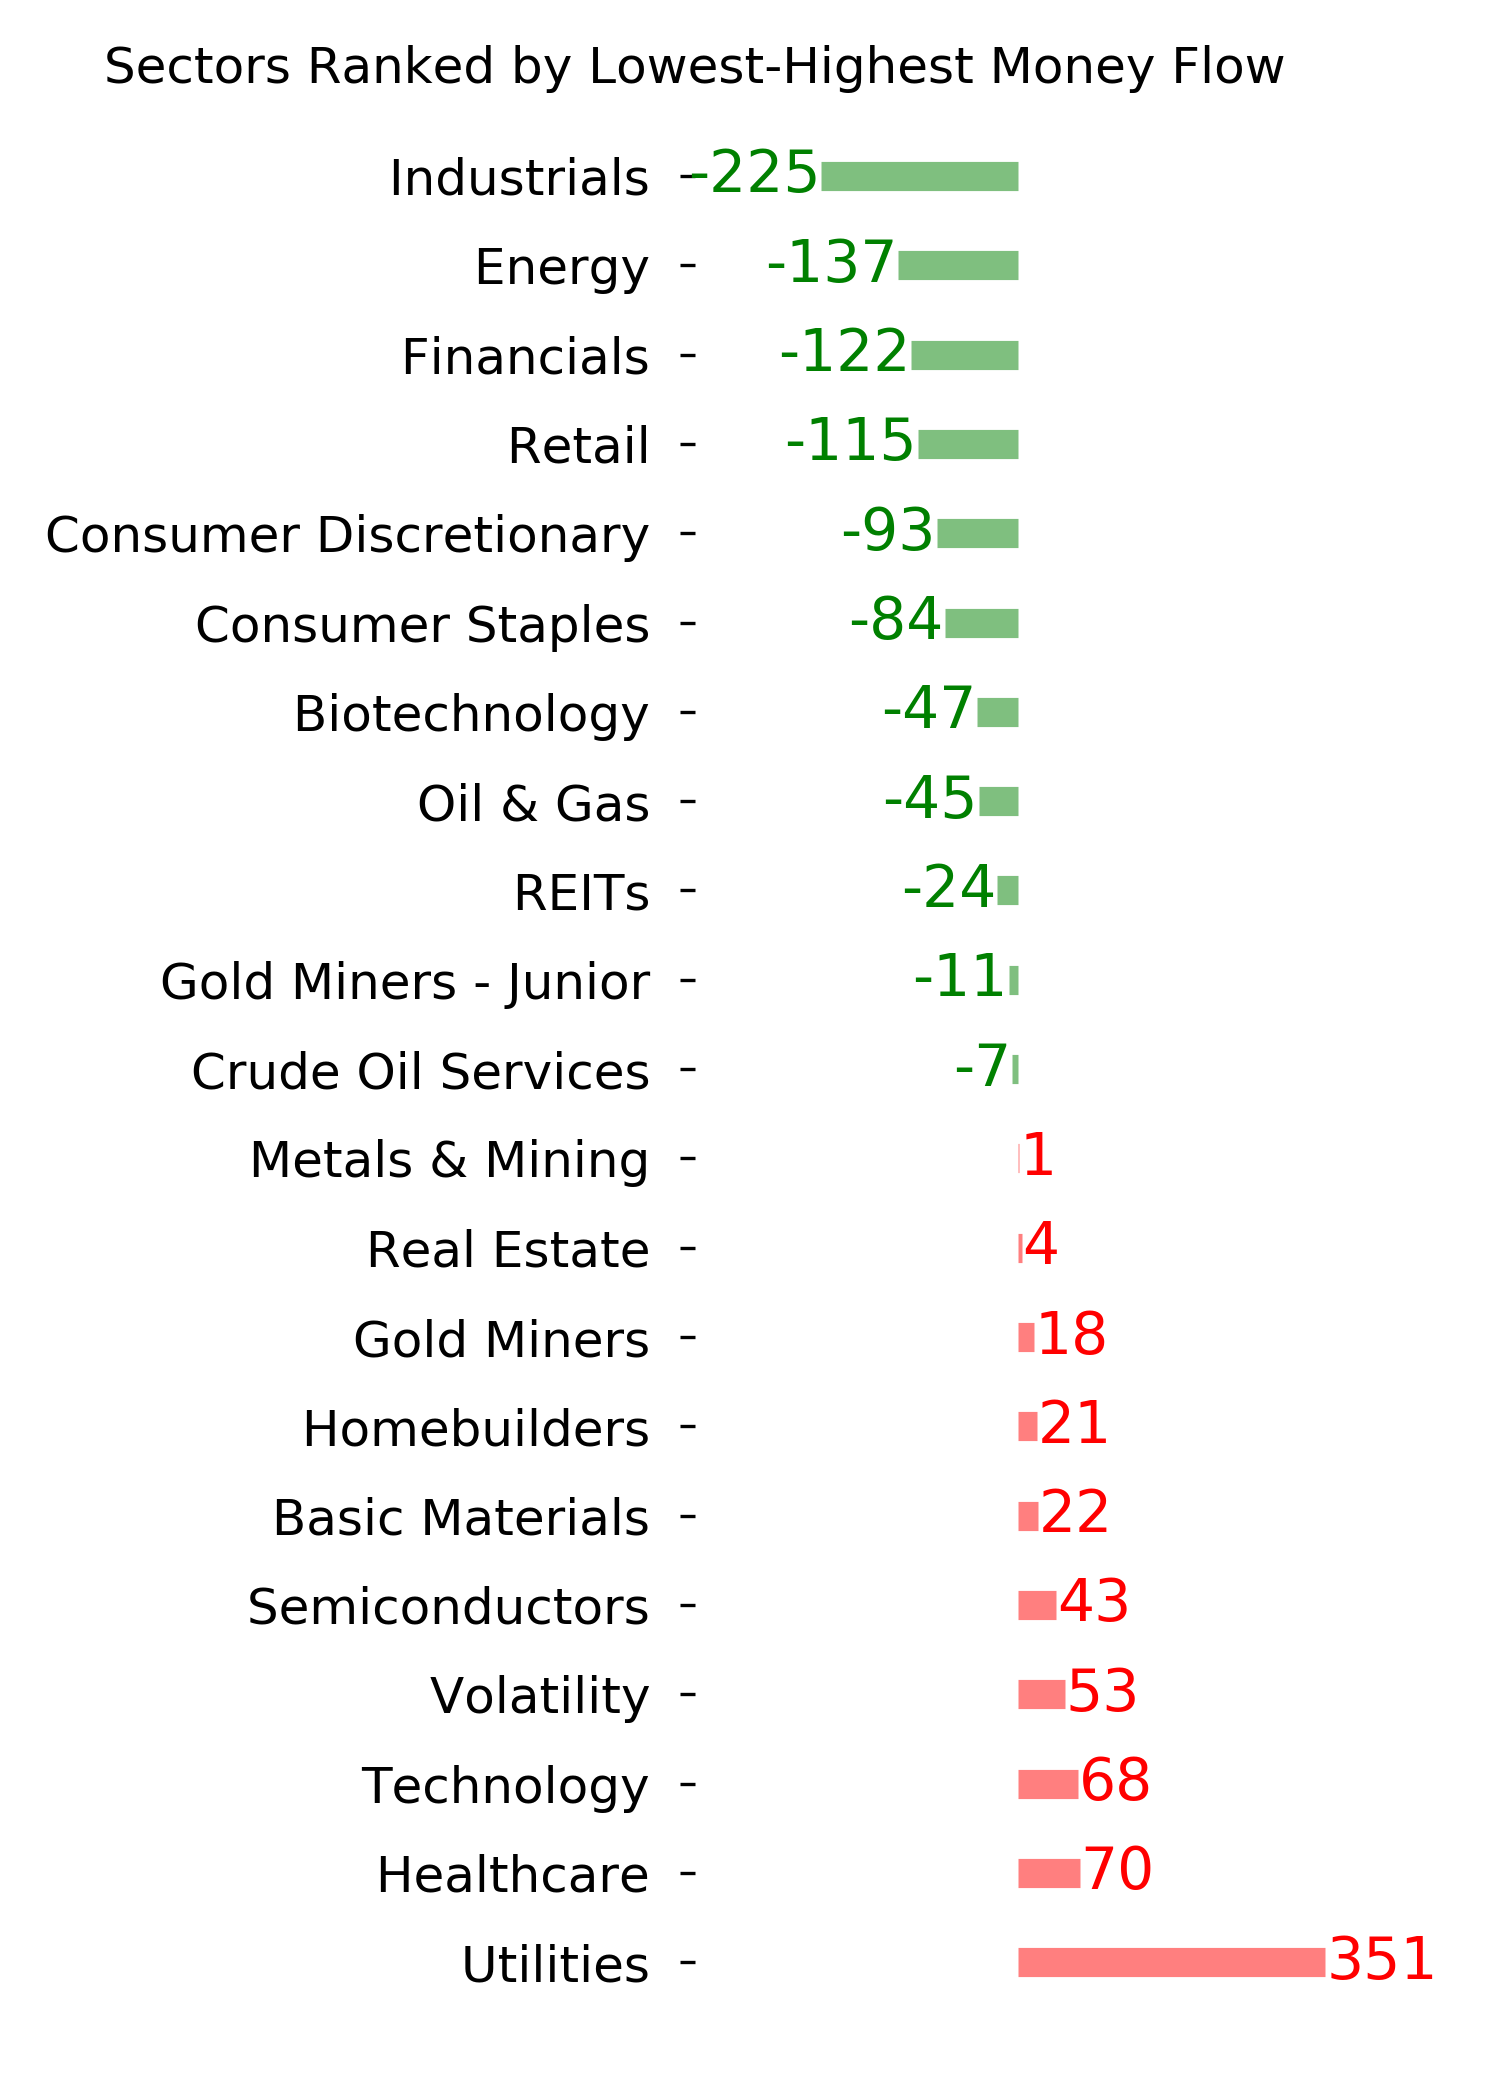
Optimism Index Thumbnails
|
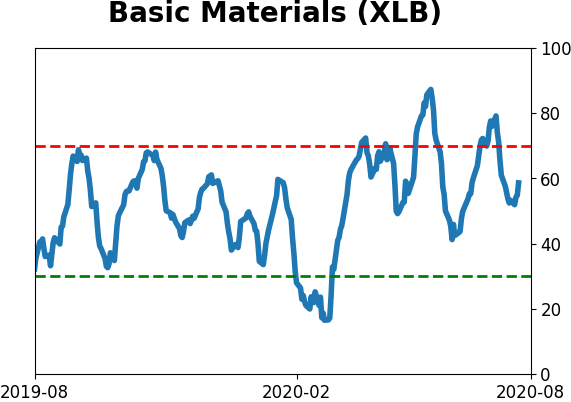
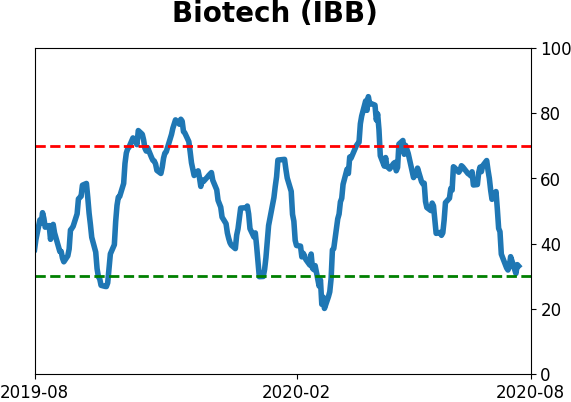
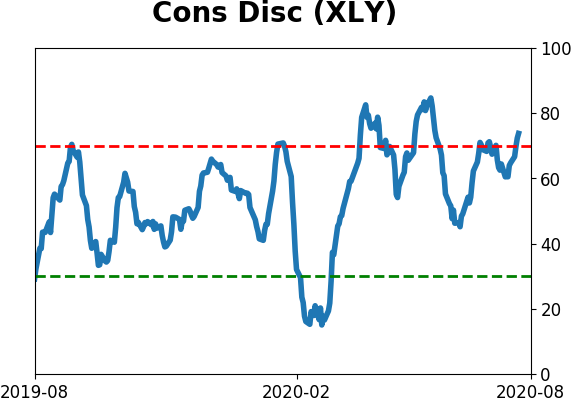
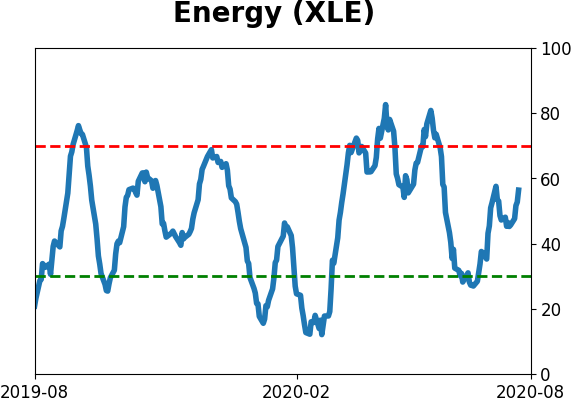
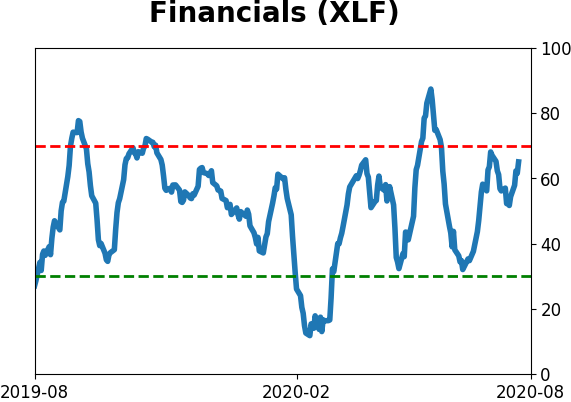
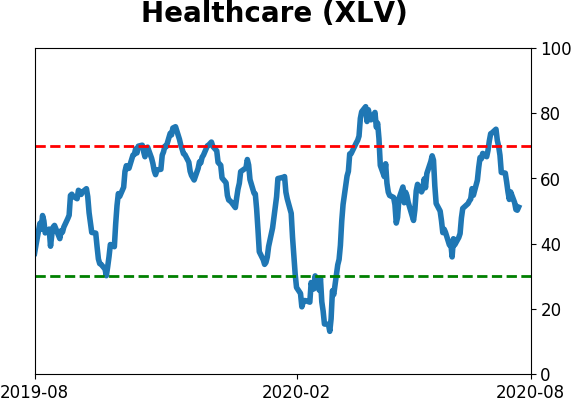
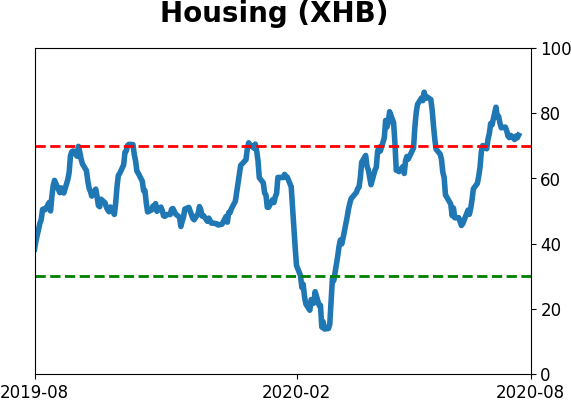
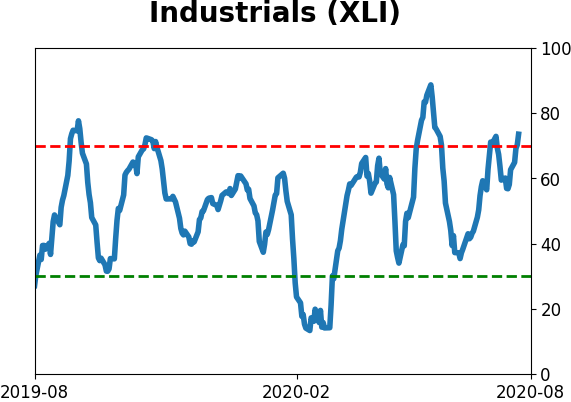
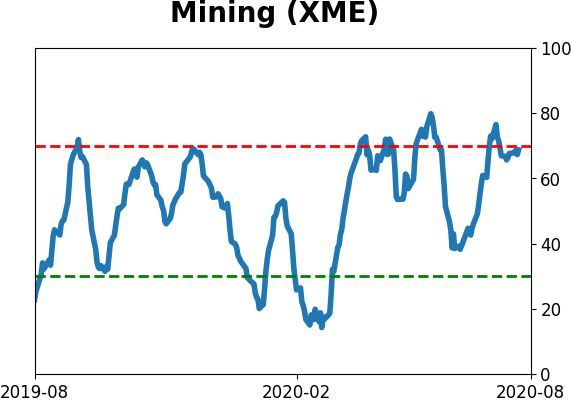
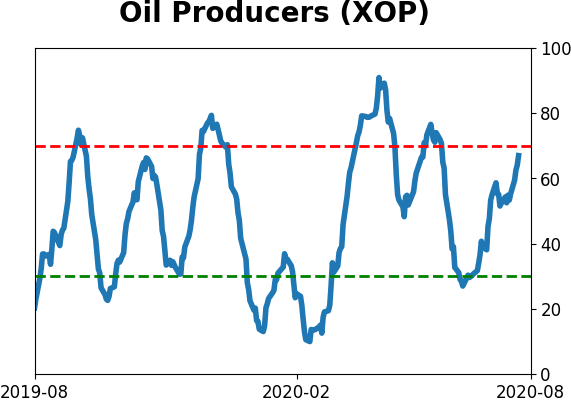
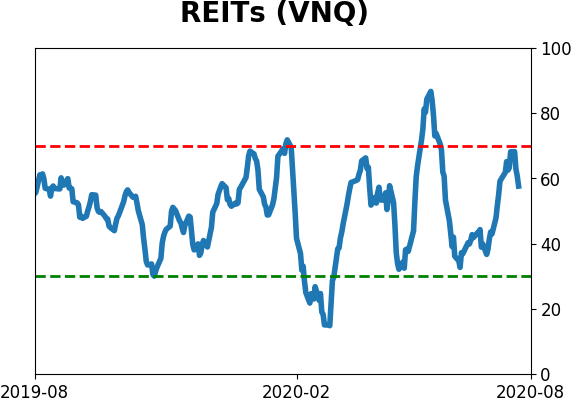
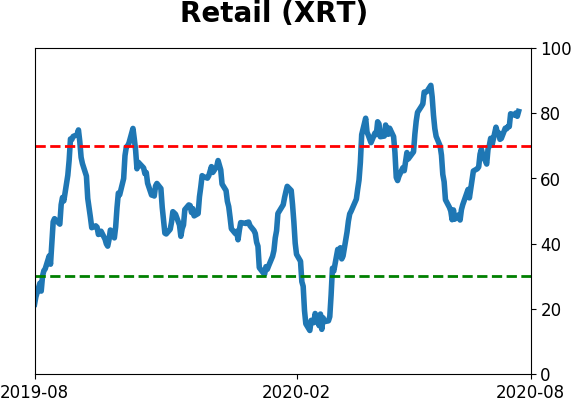
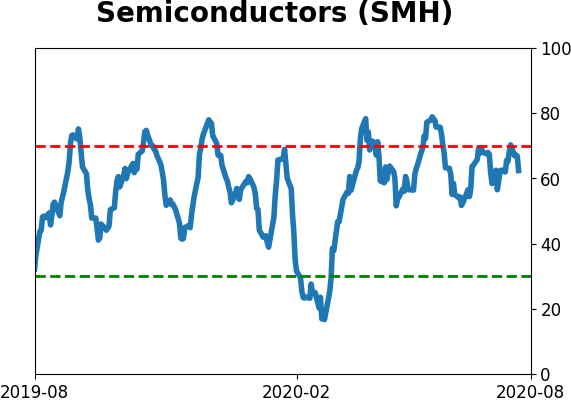
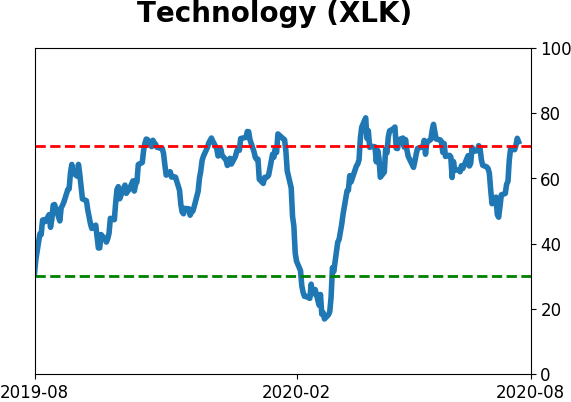
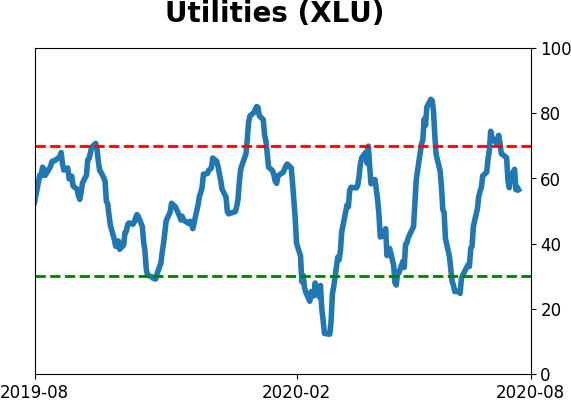
Sector ETF's - 10-Day Moving Average
|
|
|
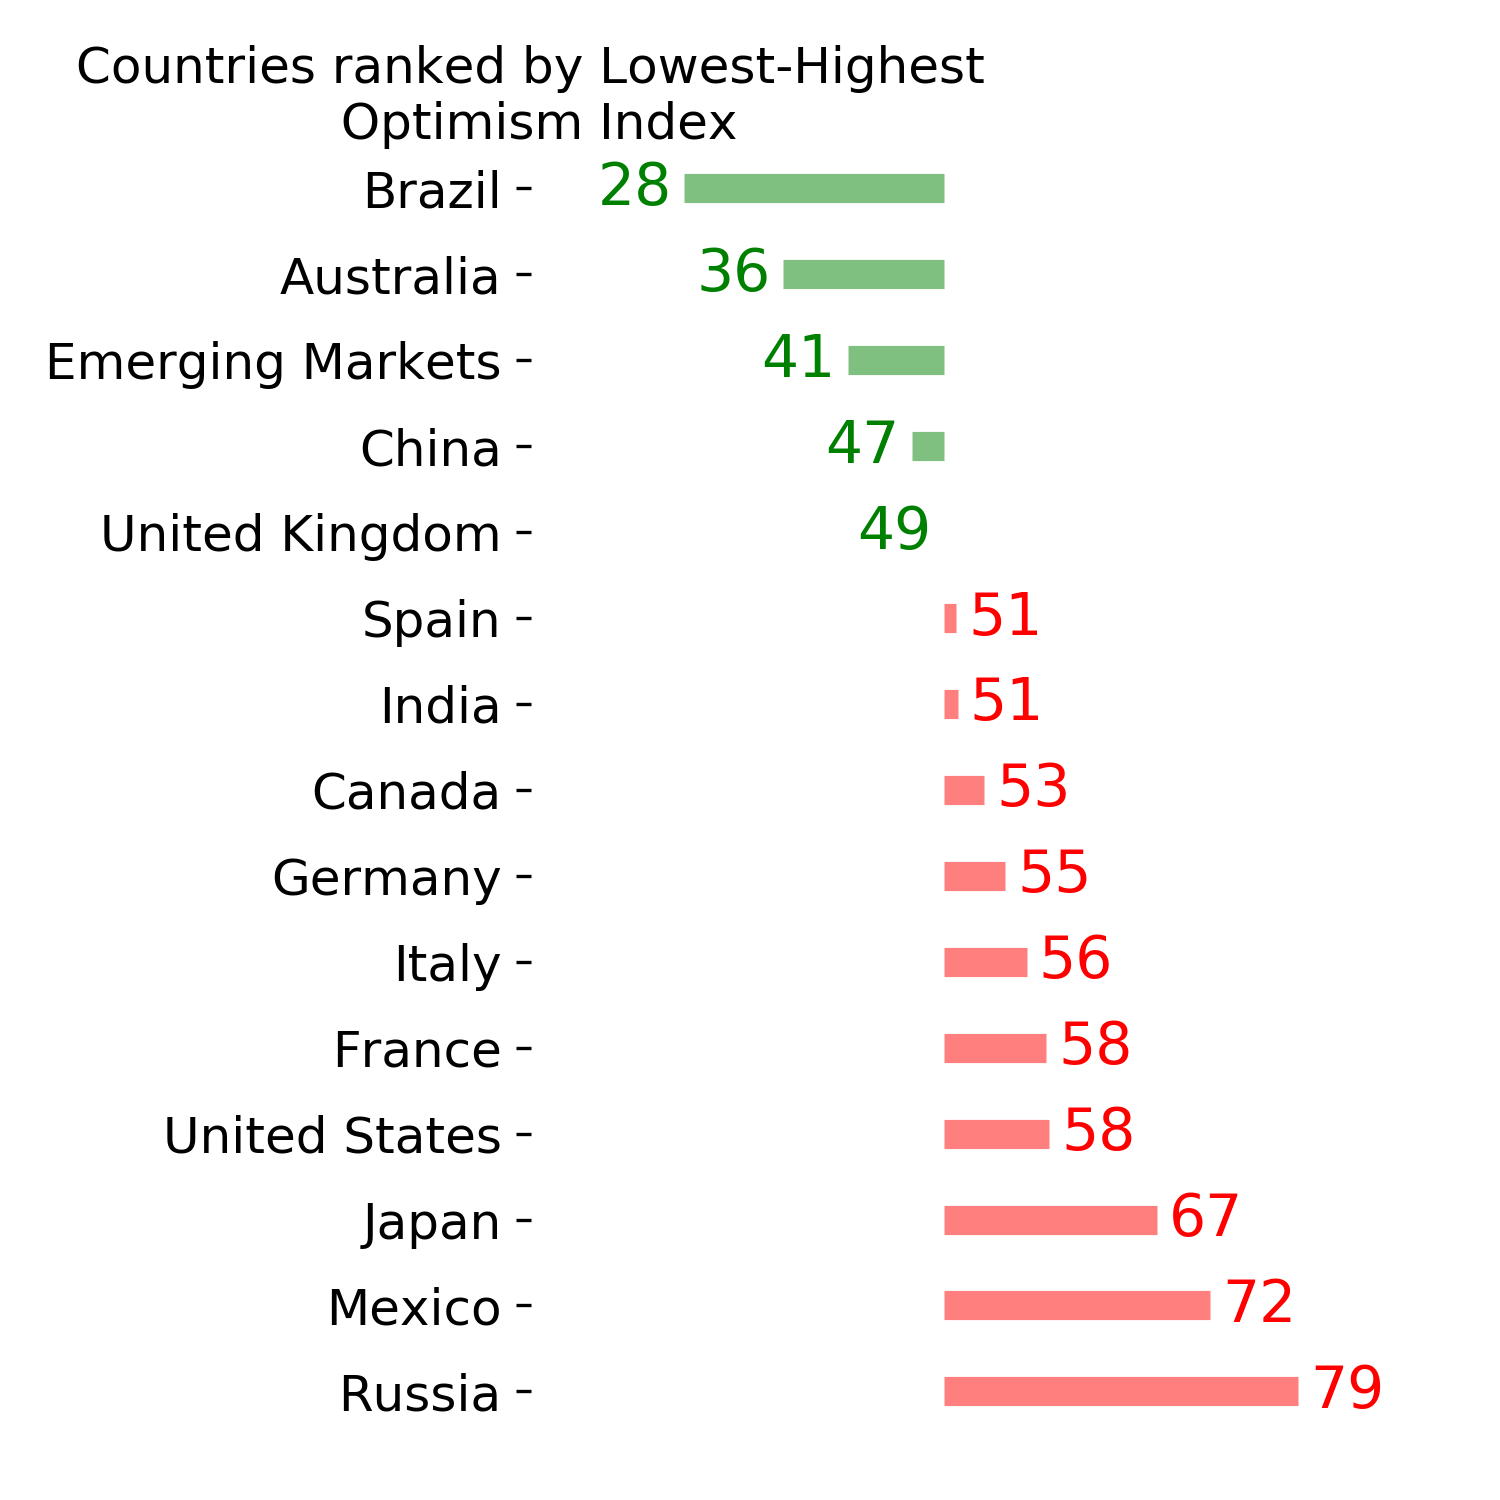
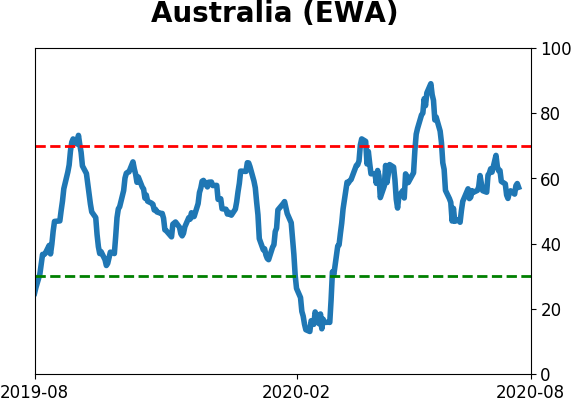
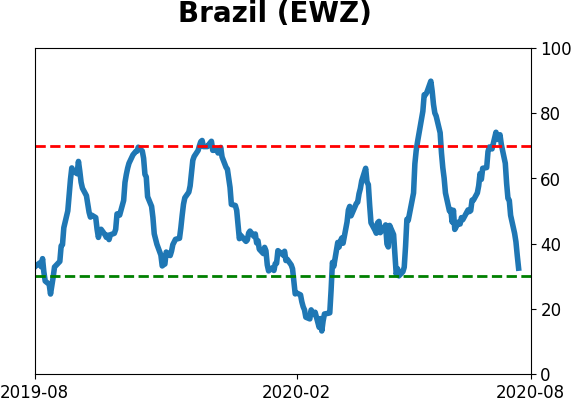
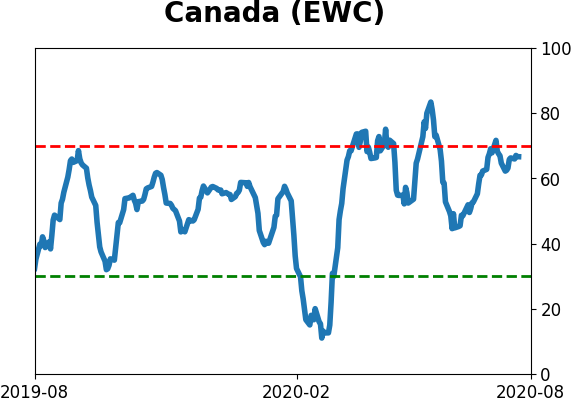
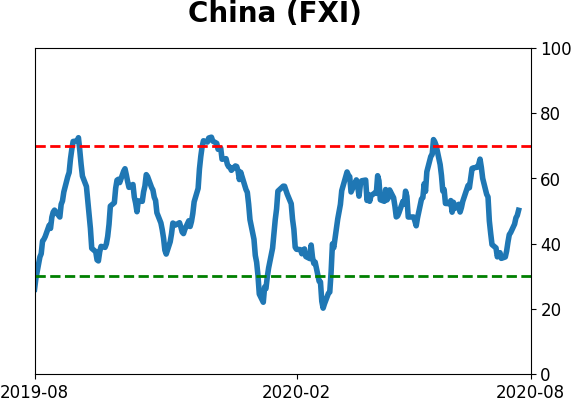
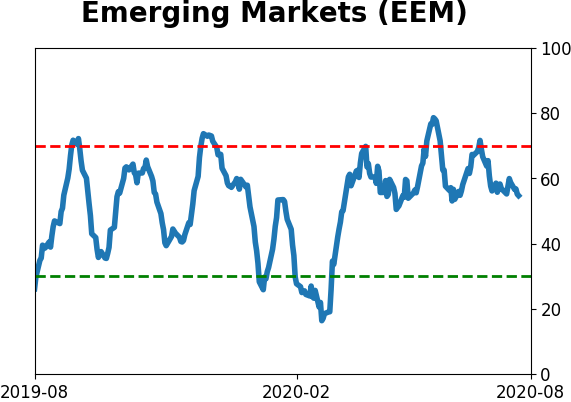
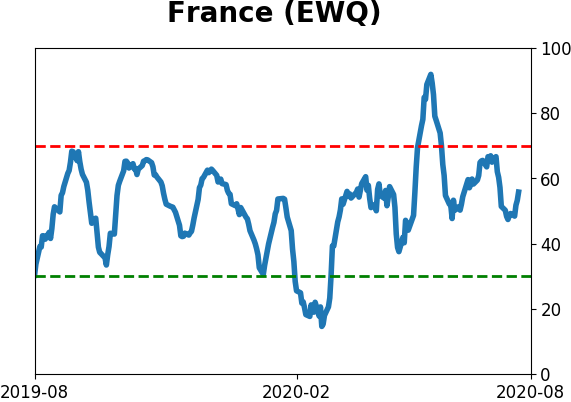
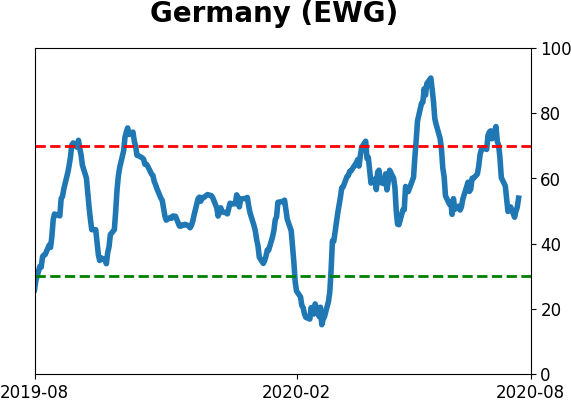
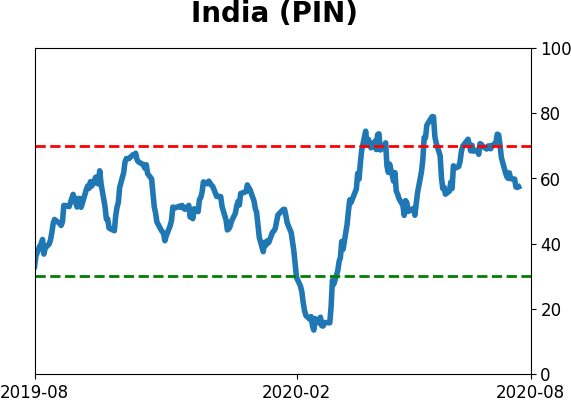
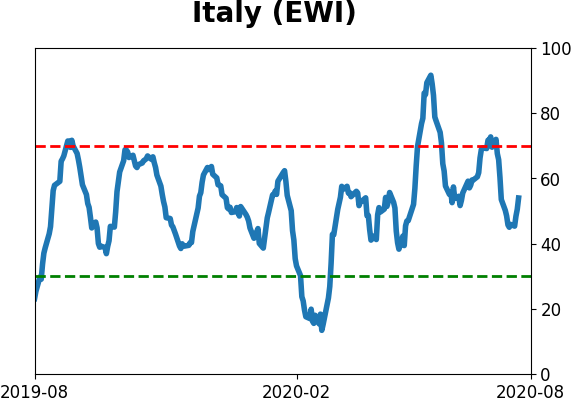
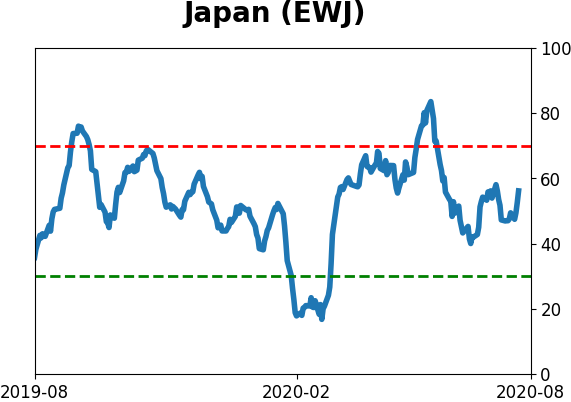
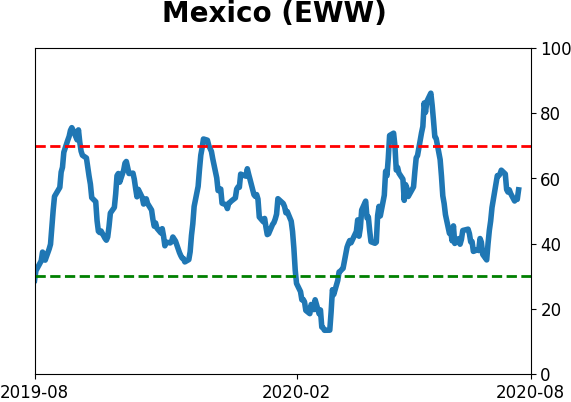
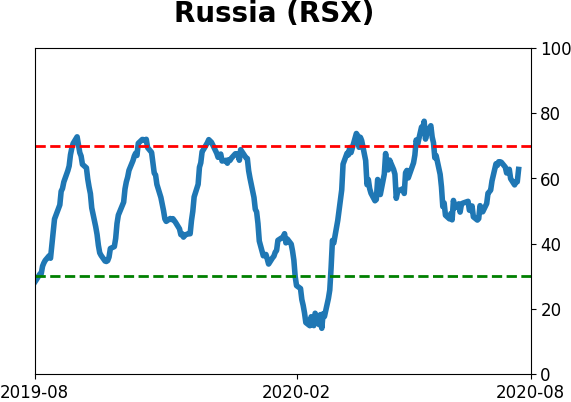
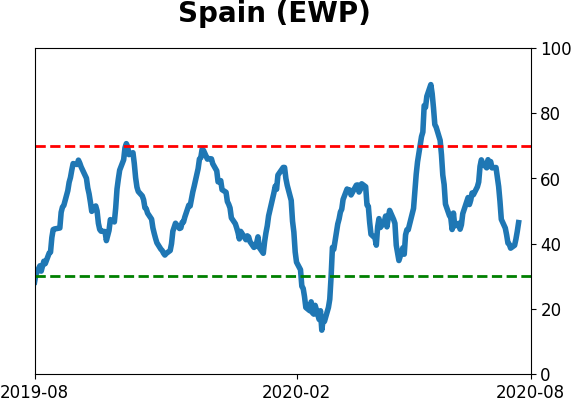
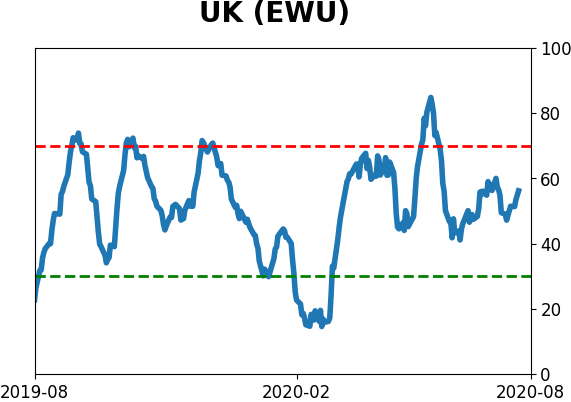
Country ETF's - 10-Day Moving Average
|
|
|
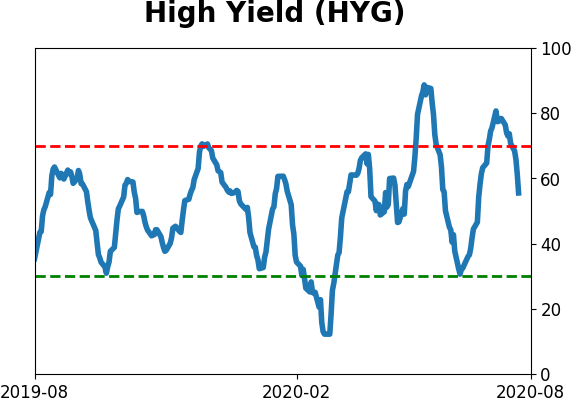
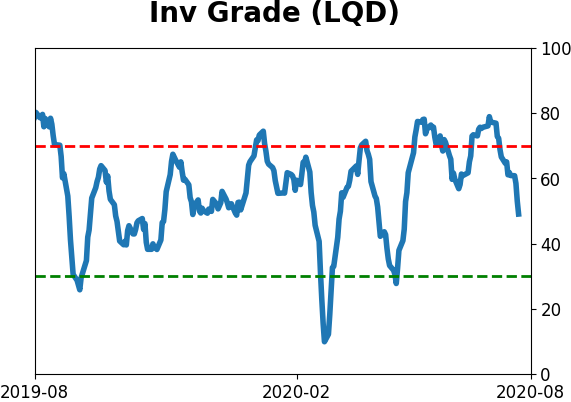
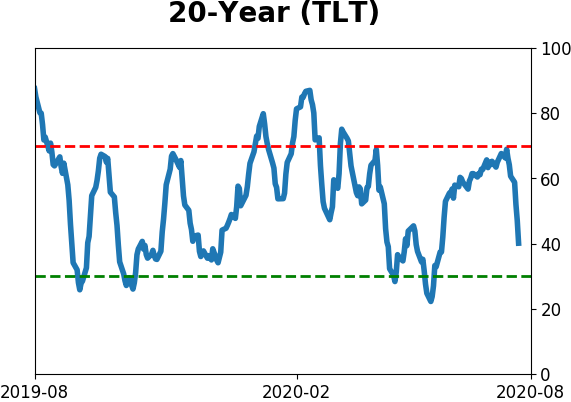
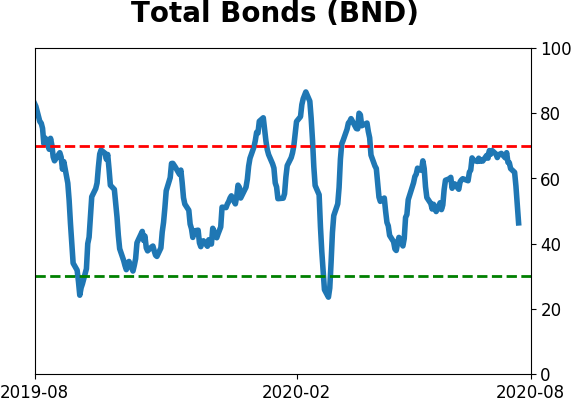
Bond ETF's - 10-Day Moving Average
|
|
|
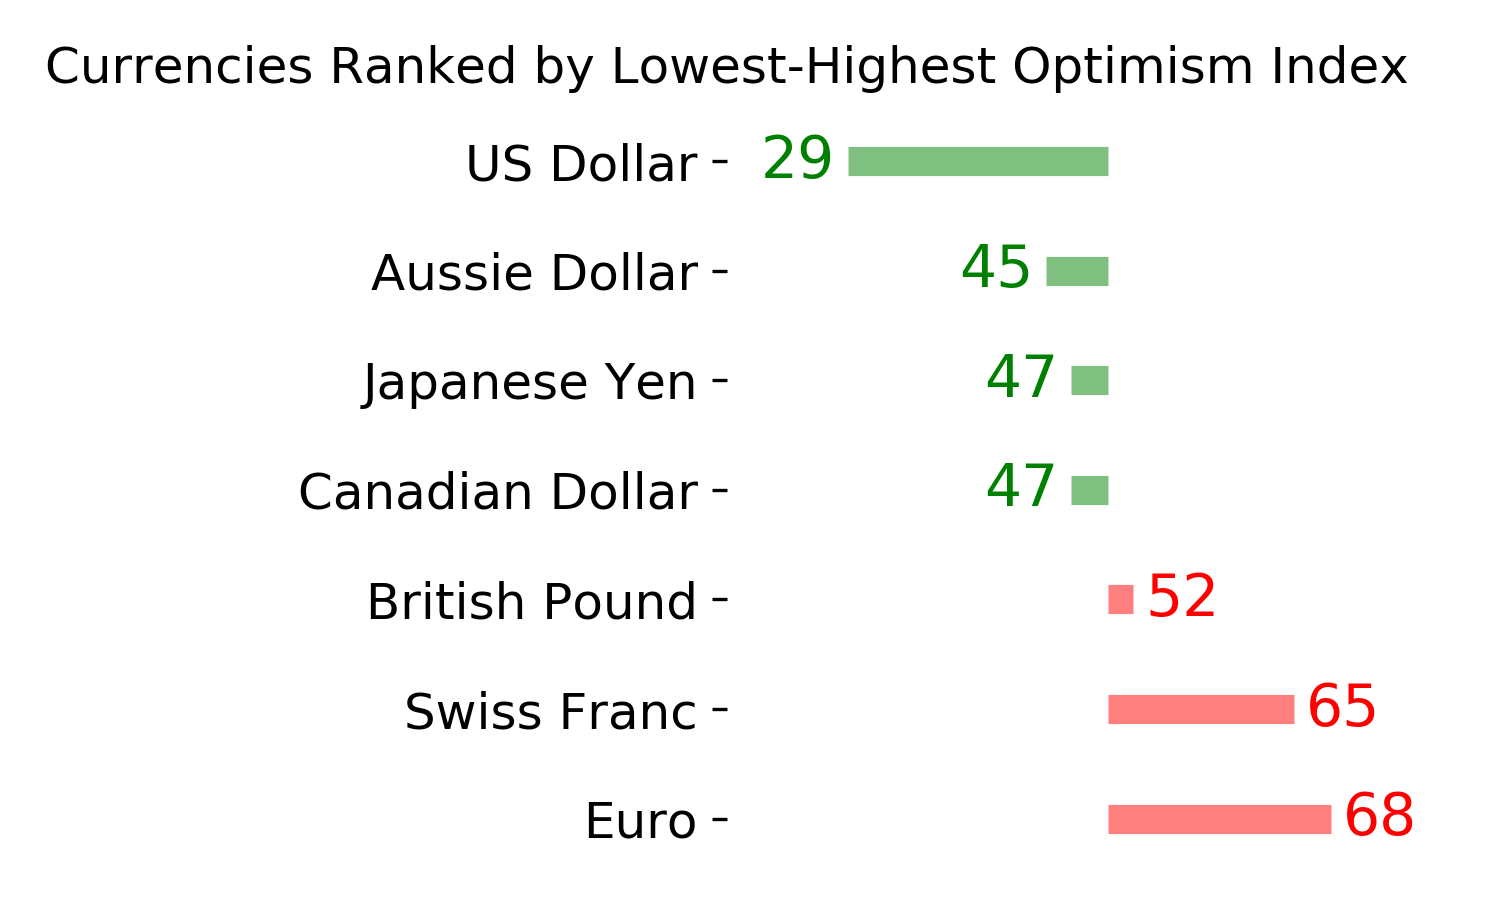
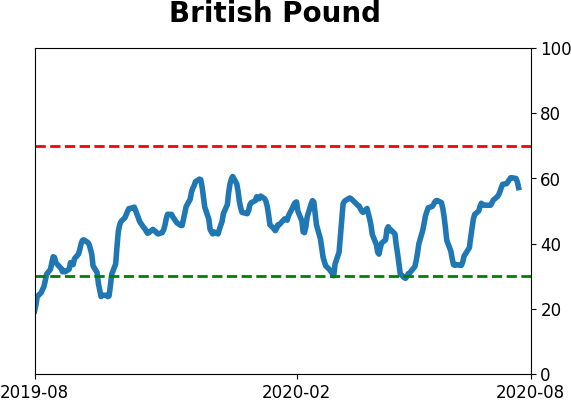
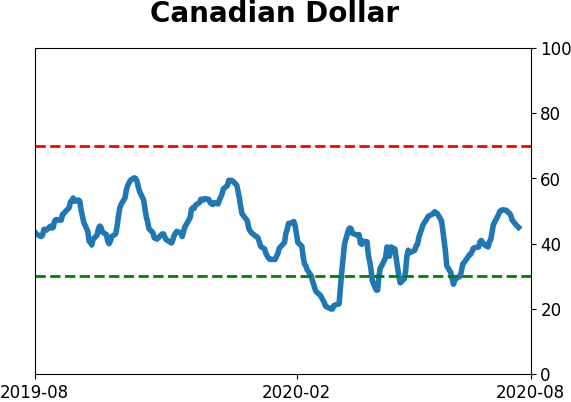
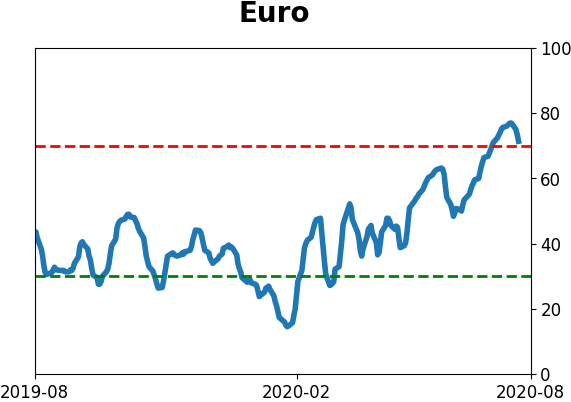
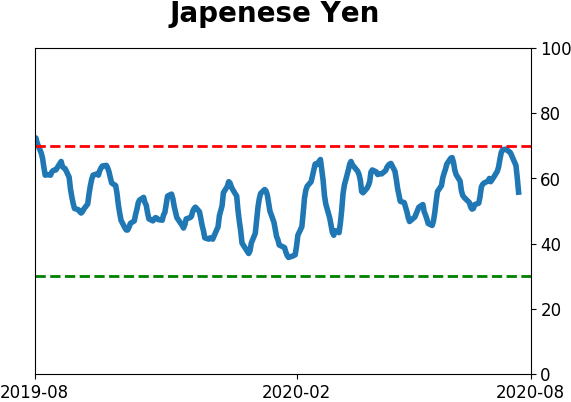
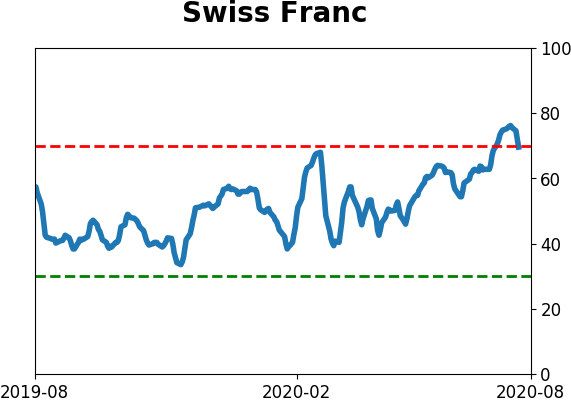
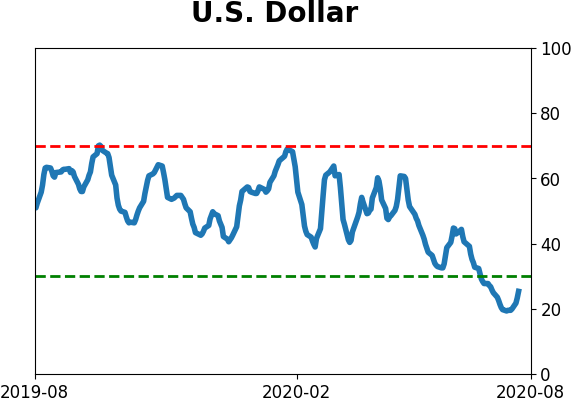
Currency ETF's - 5-Day Moving Average
|
|
|
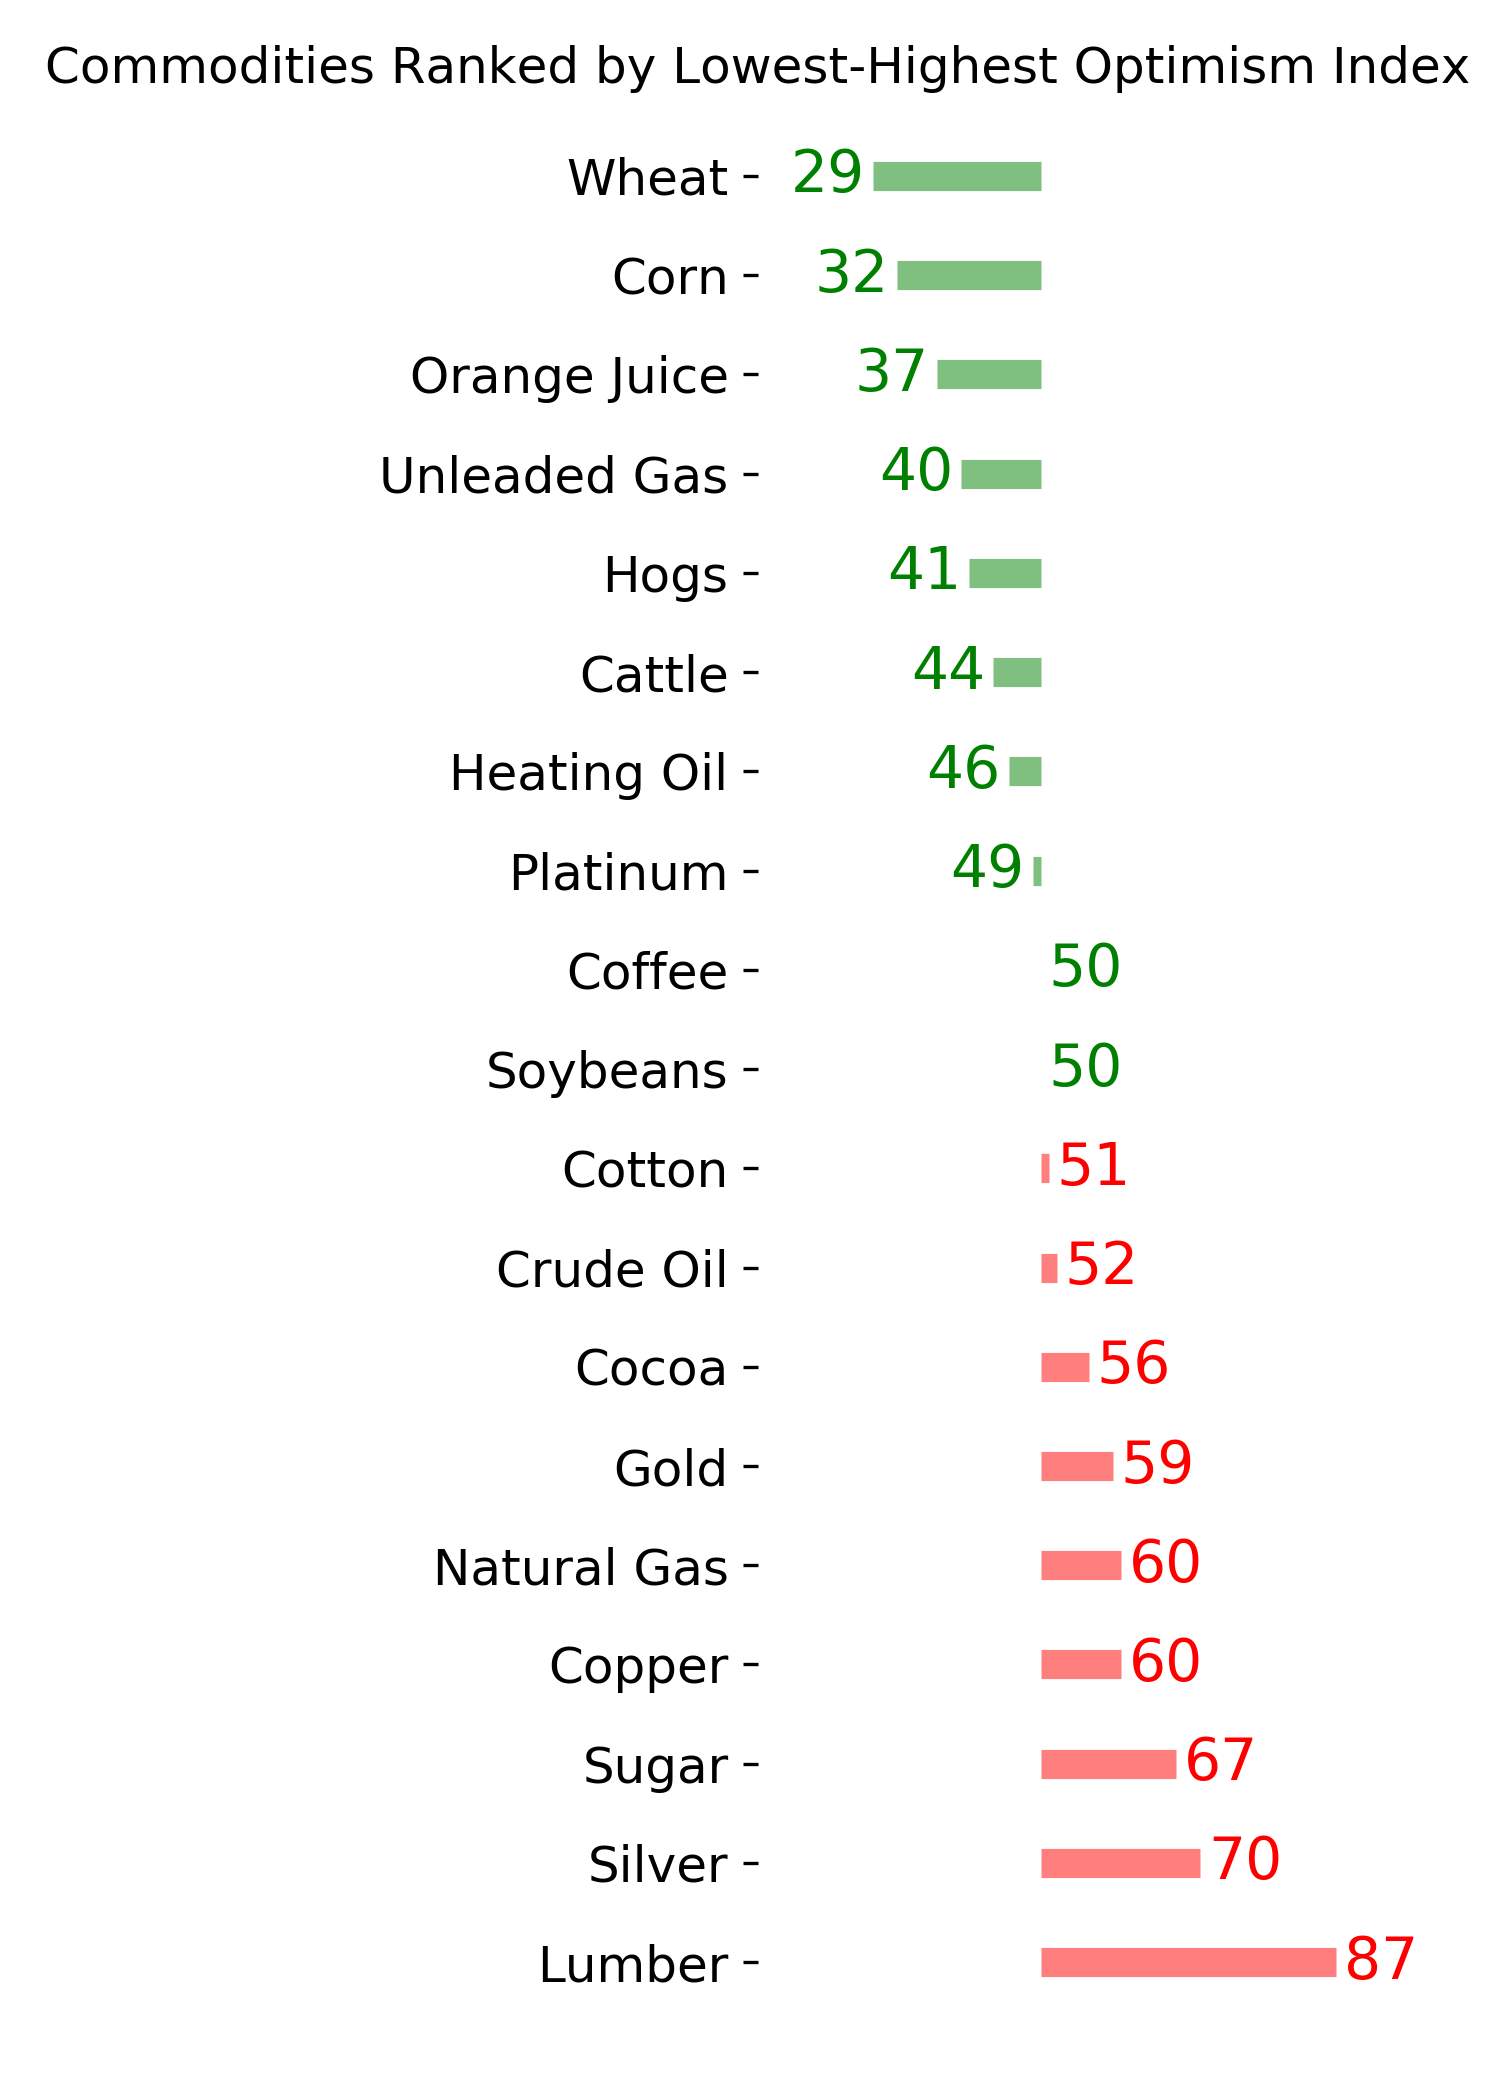
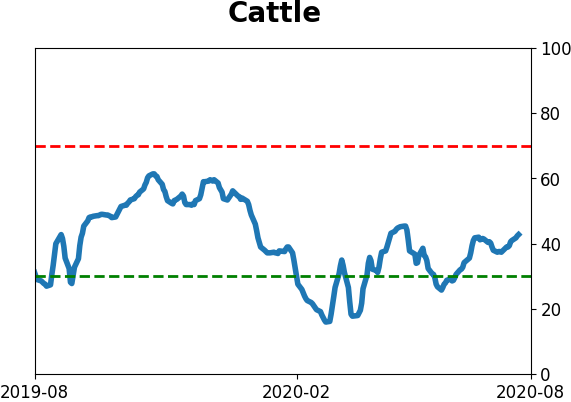
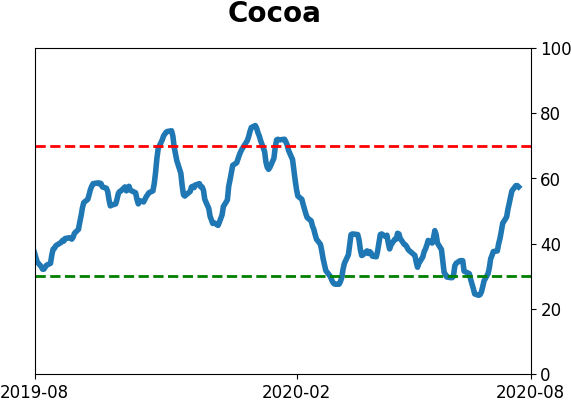
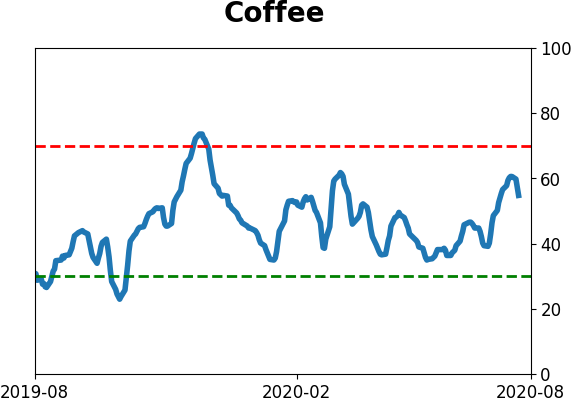
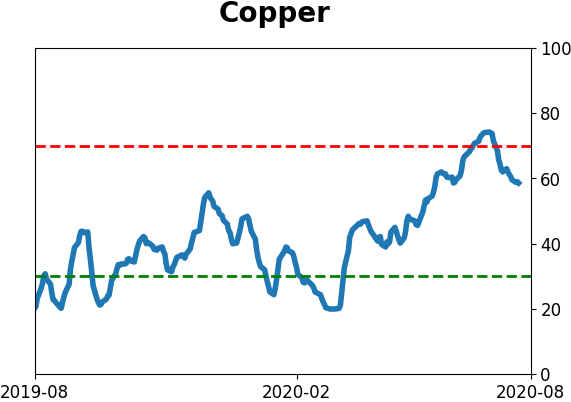
Commodity ETF's - 5-Day Moving Average
|
|