Headlines
|
|
Two sides of the S&P 500 - total return vs. equal weight:
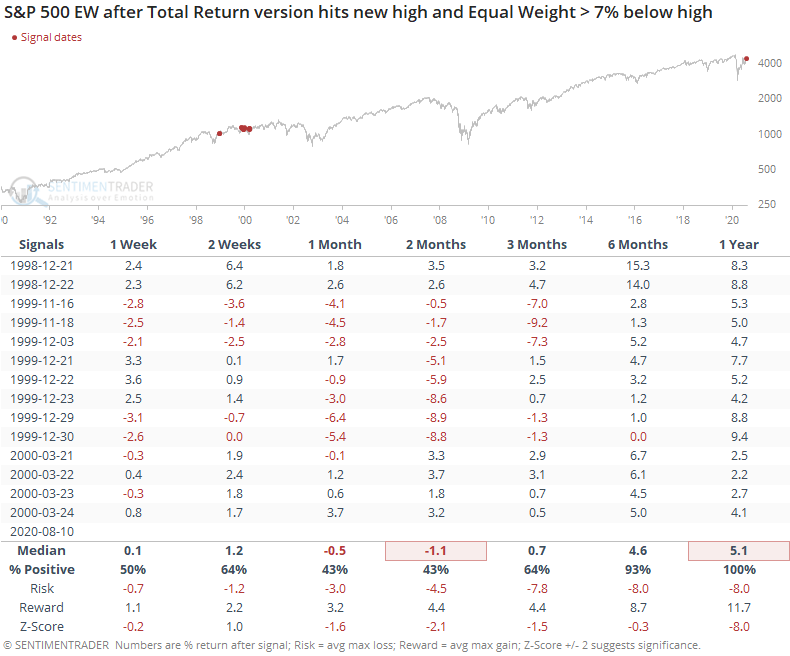
The S&P 500's total return index, which includes dividends, has hit a new all-time high. The equal-weight version of the index, which puts all of the stocks on equal footing, is still more than 7% below its own high. This has only happened on four other days in 30 years, in late 1999 and early 2000.
SPY stretches far above its average traded value:
The S&P 500 ETF, SPY, has stretched more than 11.5% above its Volume-Weighted Average Price (VWAP) over the past 250 sessions. This is a large deviation from its trend, one of the few times in 25 years it has rebounded from far below average to far above it.
Gap and crap: The S&P 500 fund, SPY, gapped up to a multi-year high then reversed to close below the prior day's low. This is typically considered a key reversal day, though we've seen in the past that "key" is much too strong of a word. Of the 21 other times that SPY has suffered a similar reversal, it managed to rebound over the next three days 43% of the time, averaging -0.2%, so some follow-through weakness in the very short-term. But by a week later, it was higher 76% of the time, with no consistent sign of lingering weakness despite the ugly-looking bar on the charts.
Bottom Line:
- Weight of the evidence has been suggesting flat/lower stock prices short- to medium-term again; still suggesting higher prices long-term
- Indicators show high optimism, with Dumb Money Confidence recently above 80% with signs of reckless speculation during what appears to be an unhealthy market environment, historically a bad combination
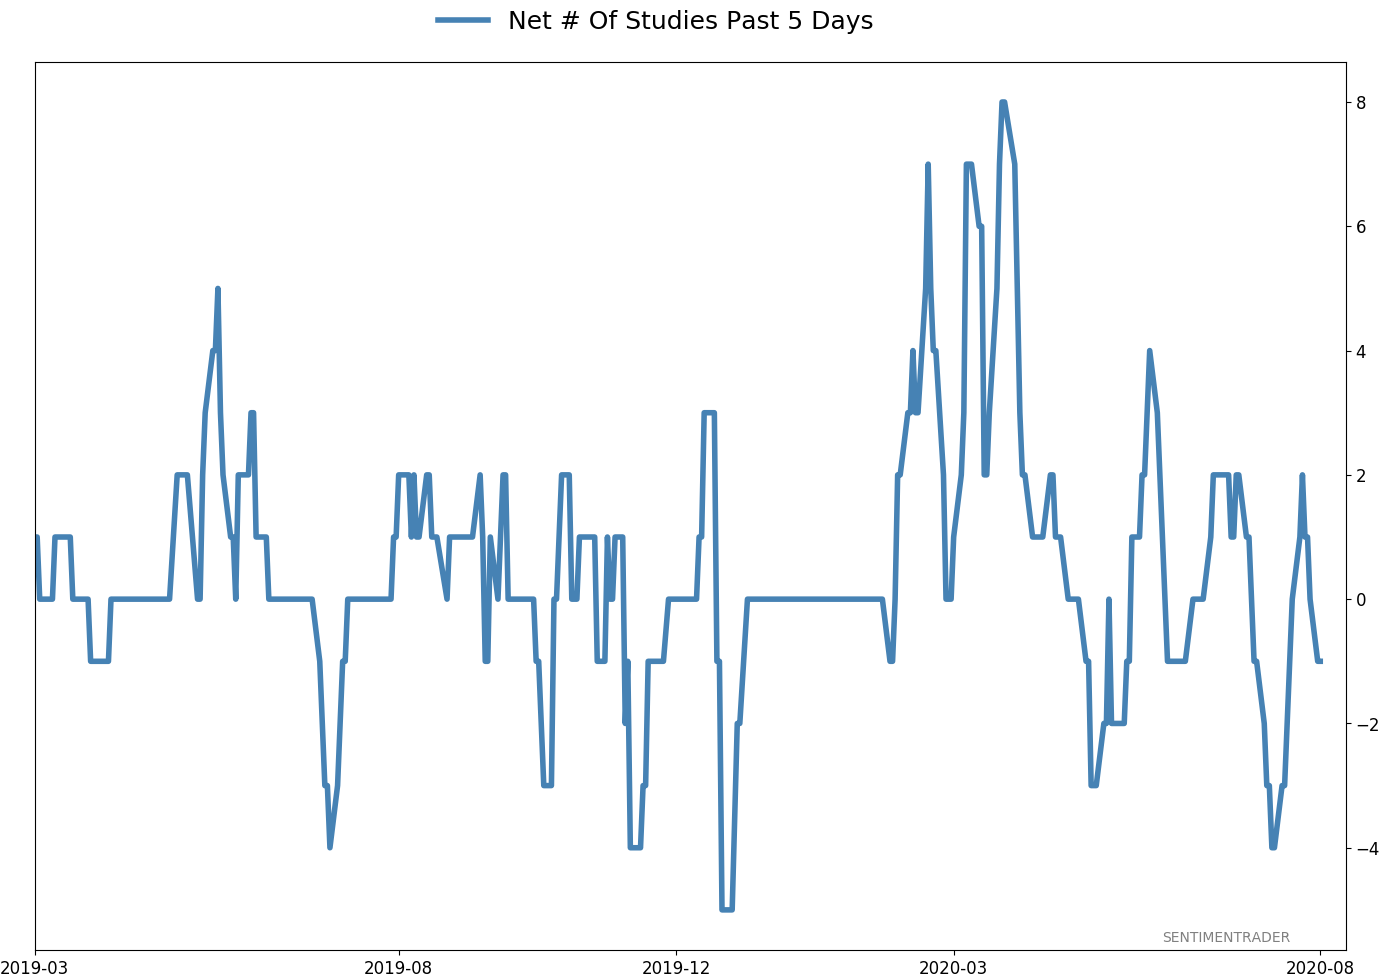
- Active Studies show a heavy positive skew over the medium- to long-term; breadth thrusts, recoveries, and trend changes have an almost unblemished record at preceding higher prices over a 6-12 month time frame
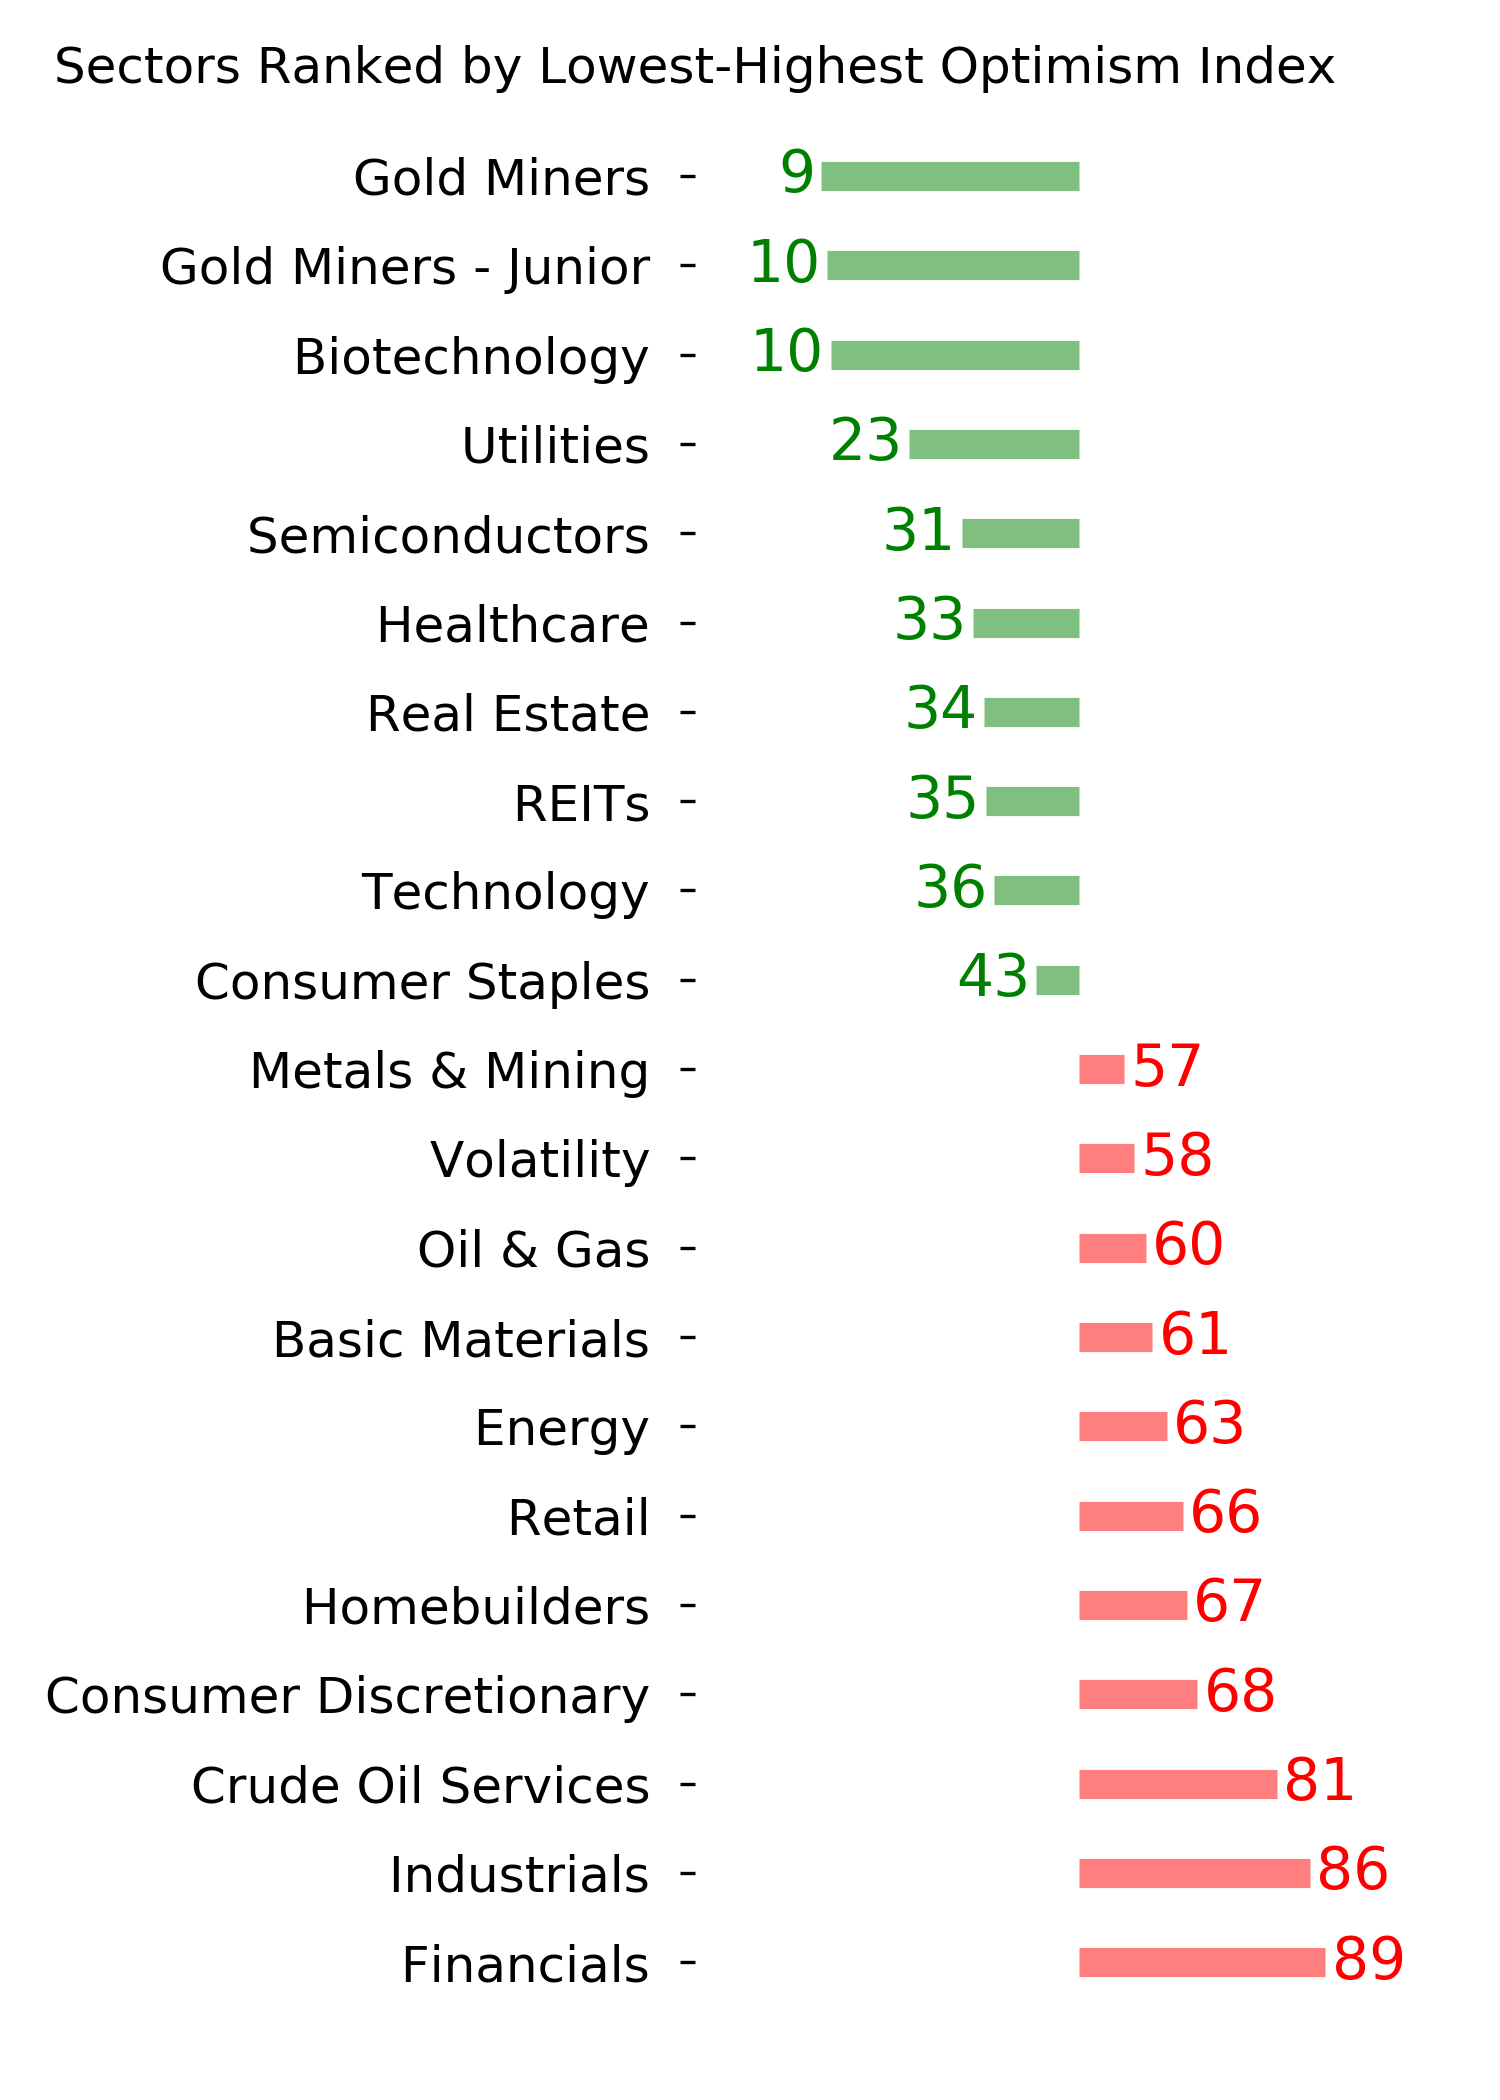
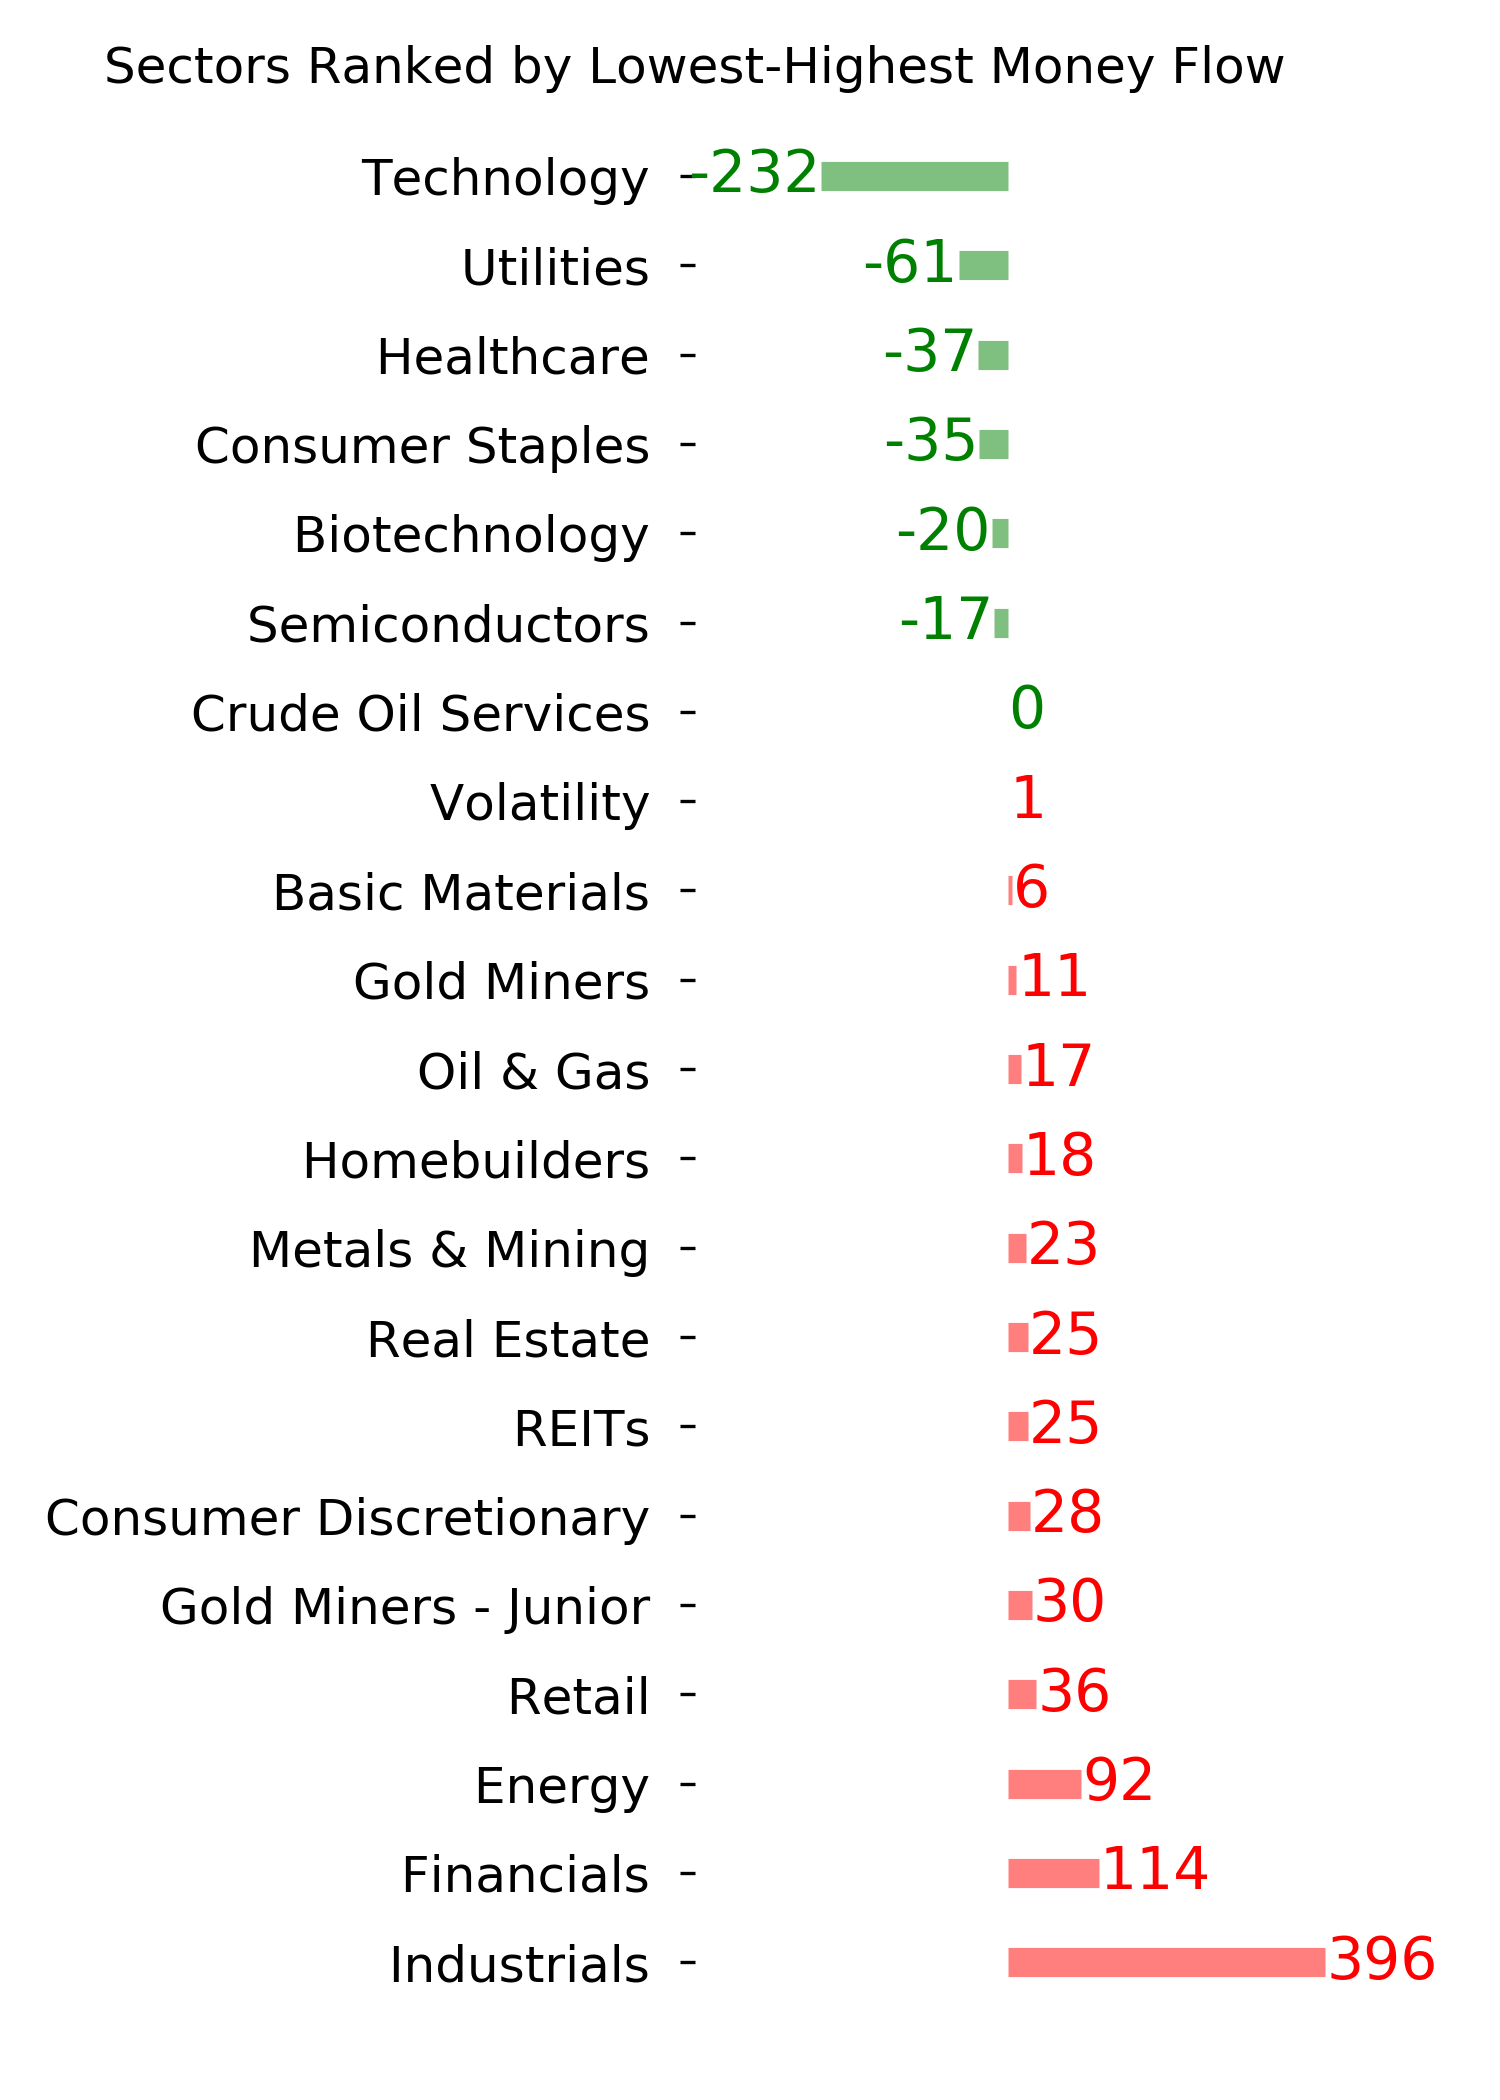
- Signs of extremely skewed preference for tech stocks neared exhaustion by late June, especially relative to industrials and financials (here and here)
- Indicators and studies for other markets are showing less consistent forward results, though it's not a great sign for Treasuries that hedgers are net short and optimism on metals recently became extreme, with "perfect" breadth among miners
|
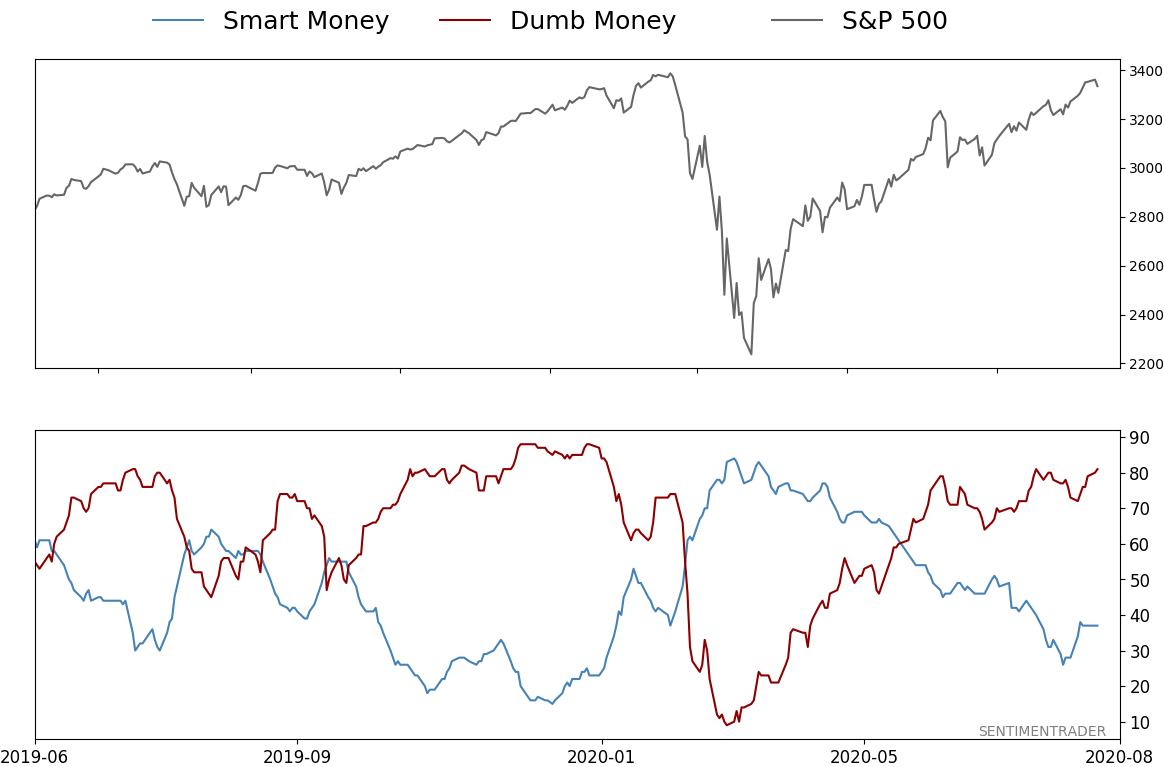
Smart / Dumb Money Confidence
|
Smart Money Confidence: 37%
Dumb Money Confidence: 81%
|
|
Risk Levels
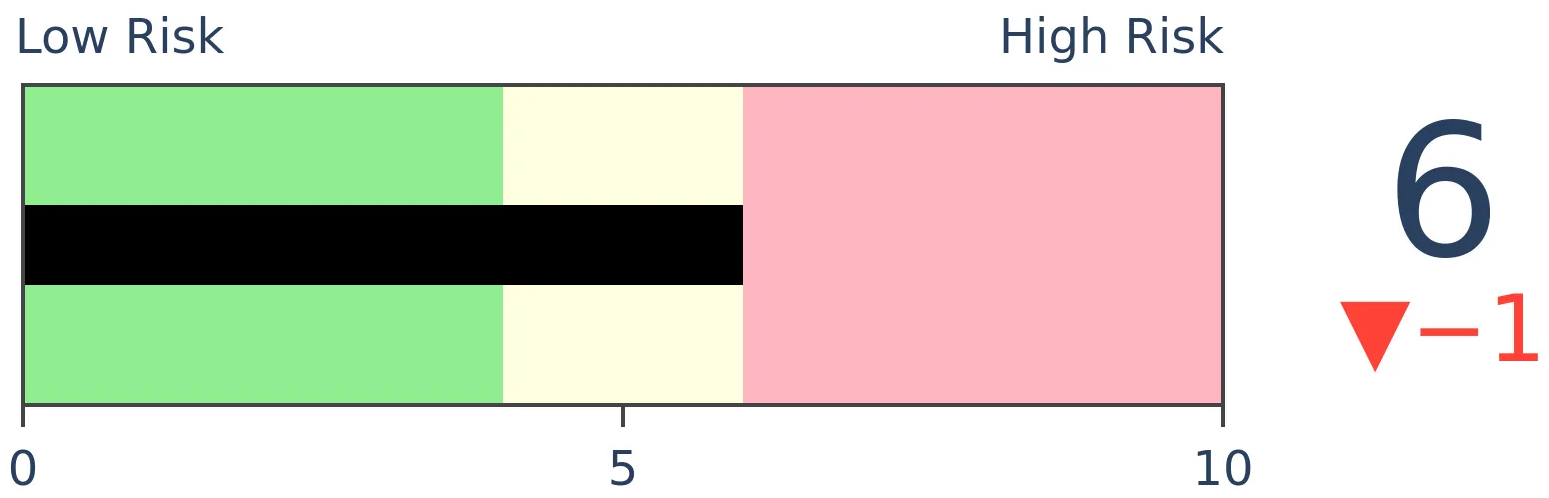
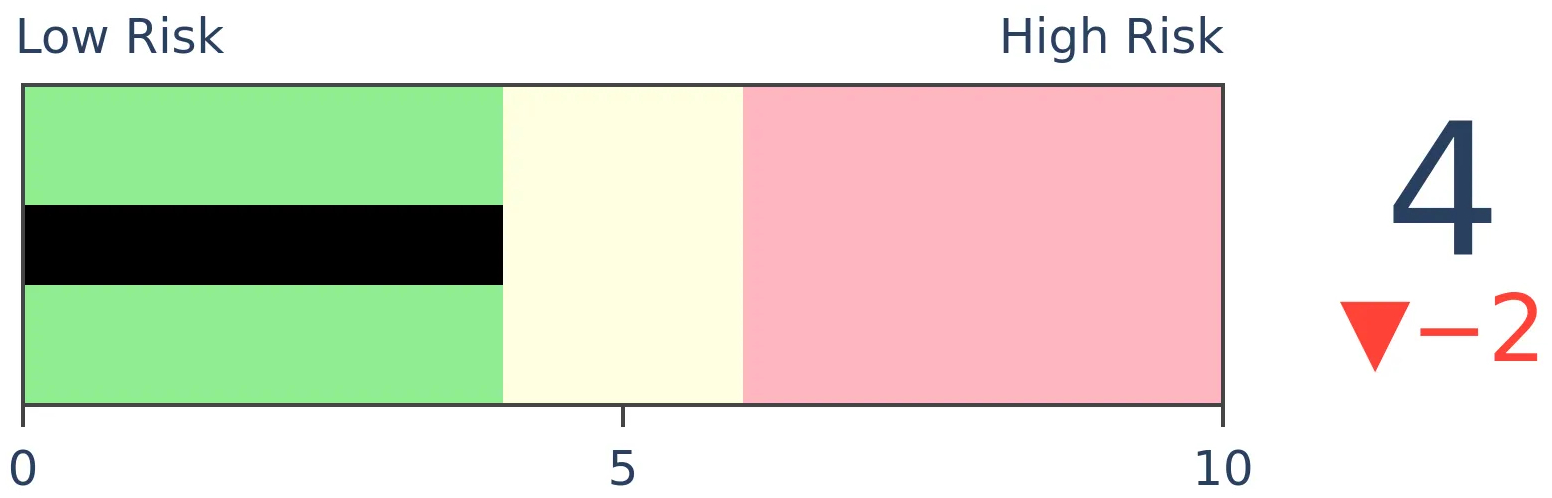
Stocks Short-Term
|
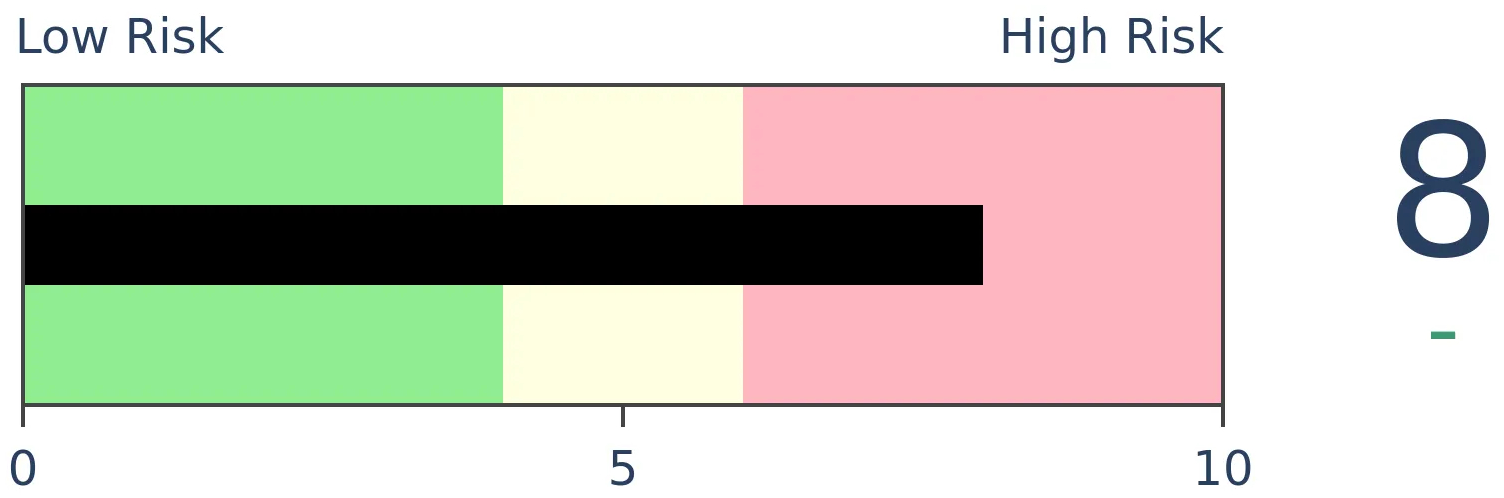
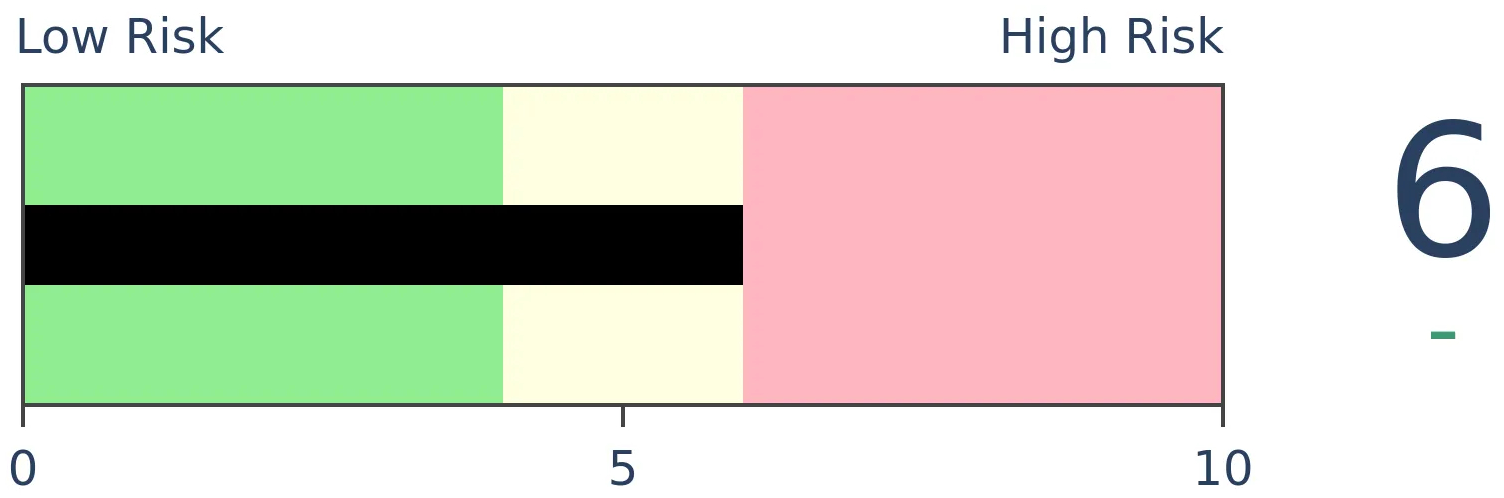
Stocks Medium-Term
|
|
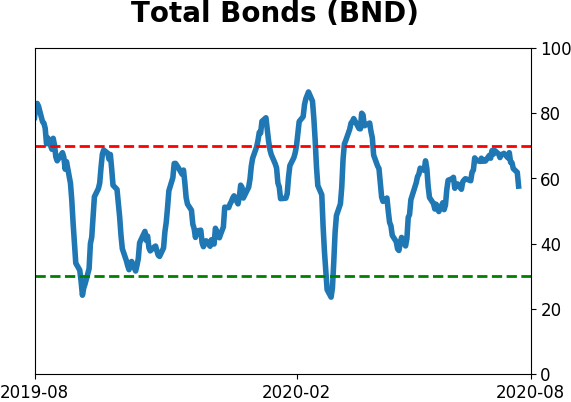
Bonds
|
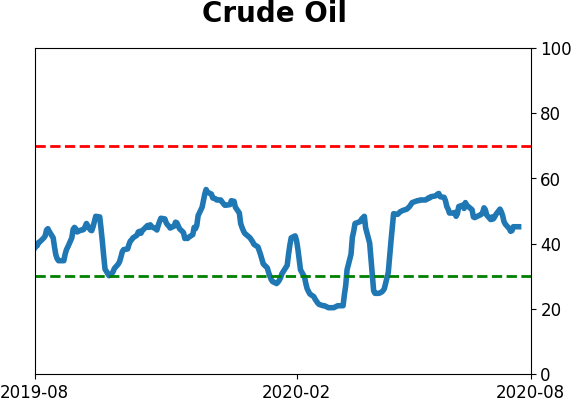
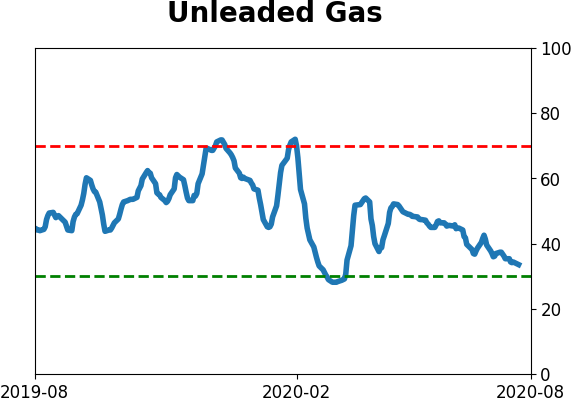
Crude Oil

|
|
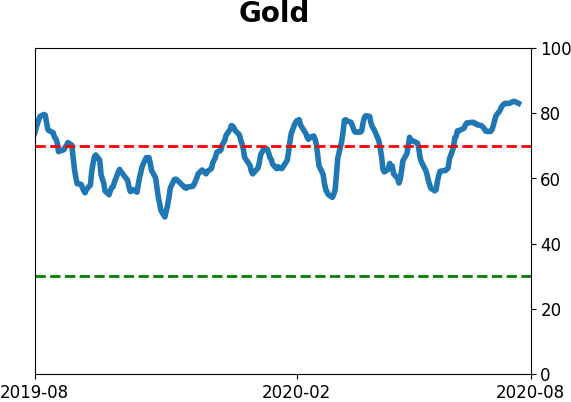
Gold

|
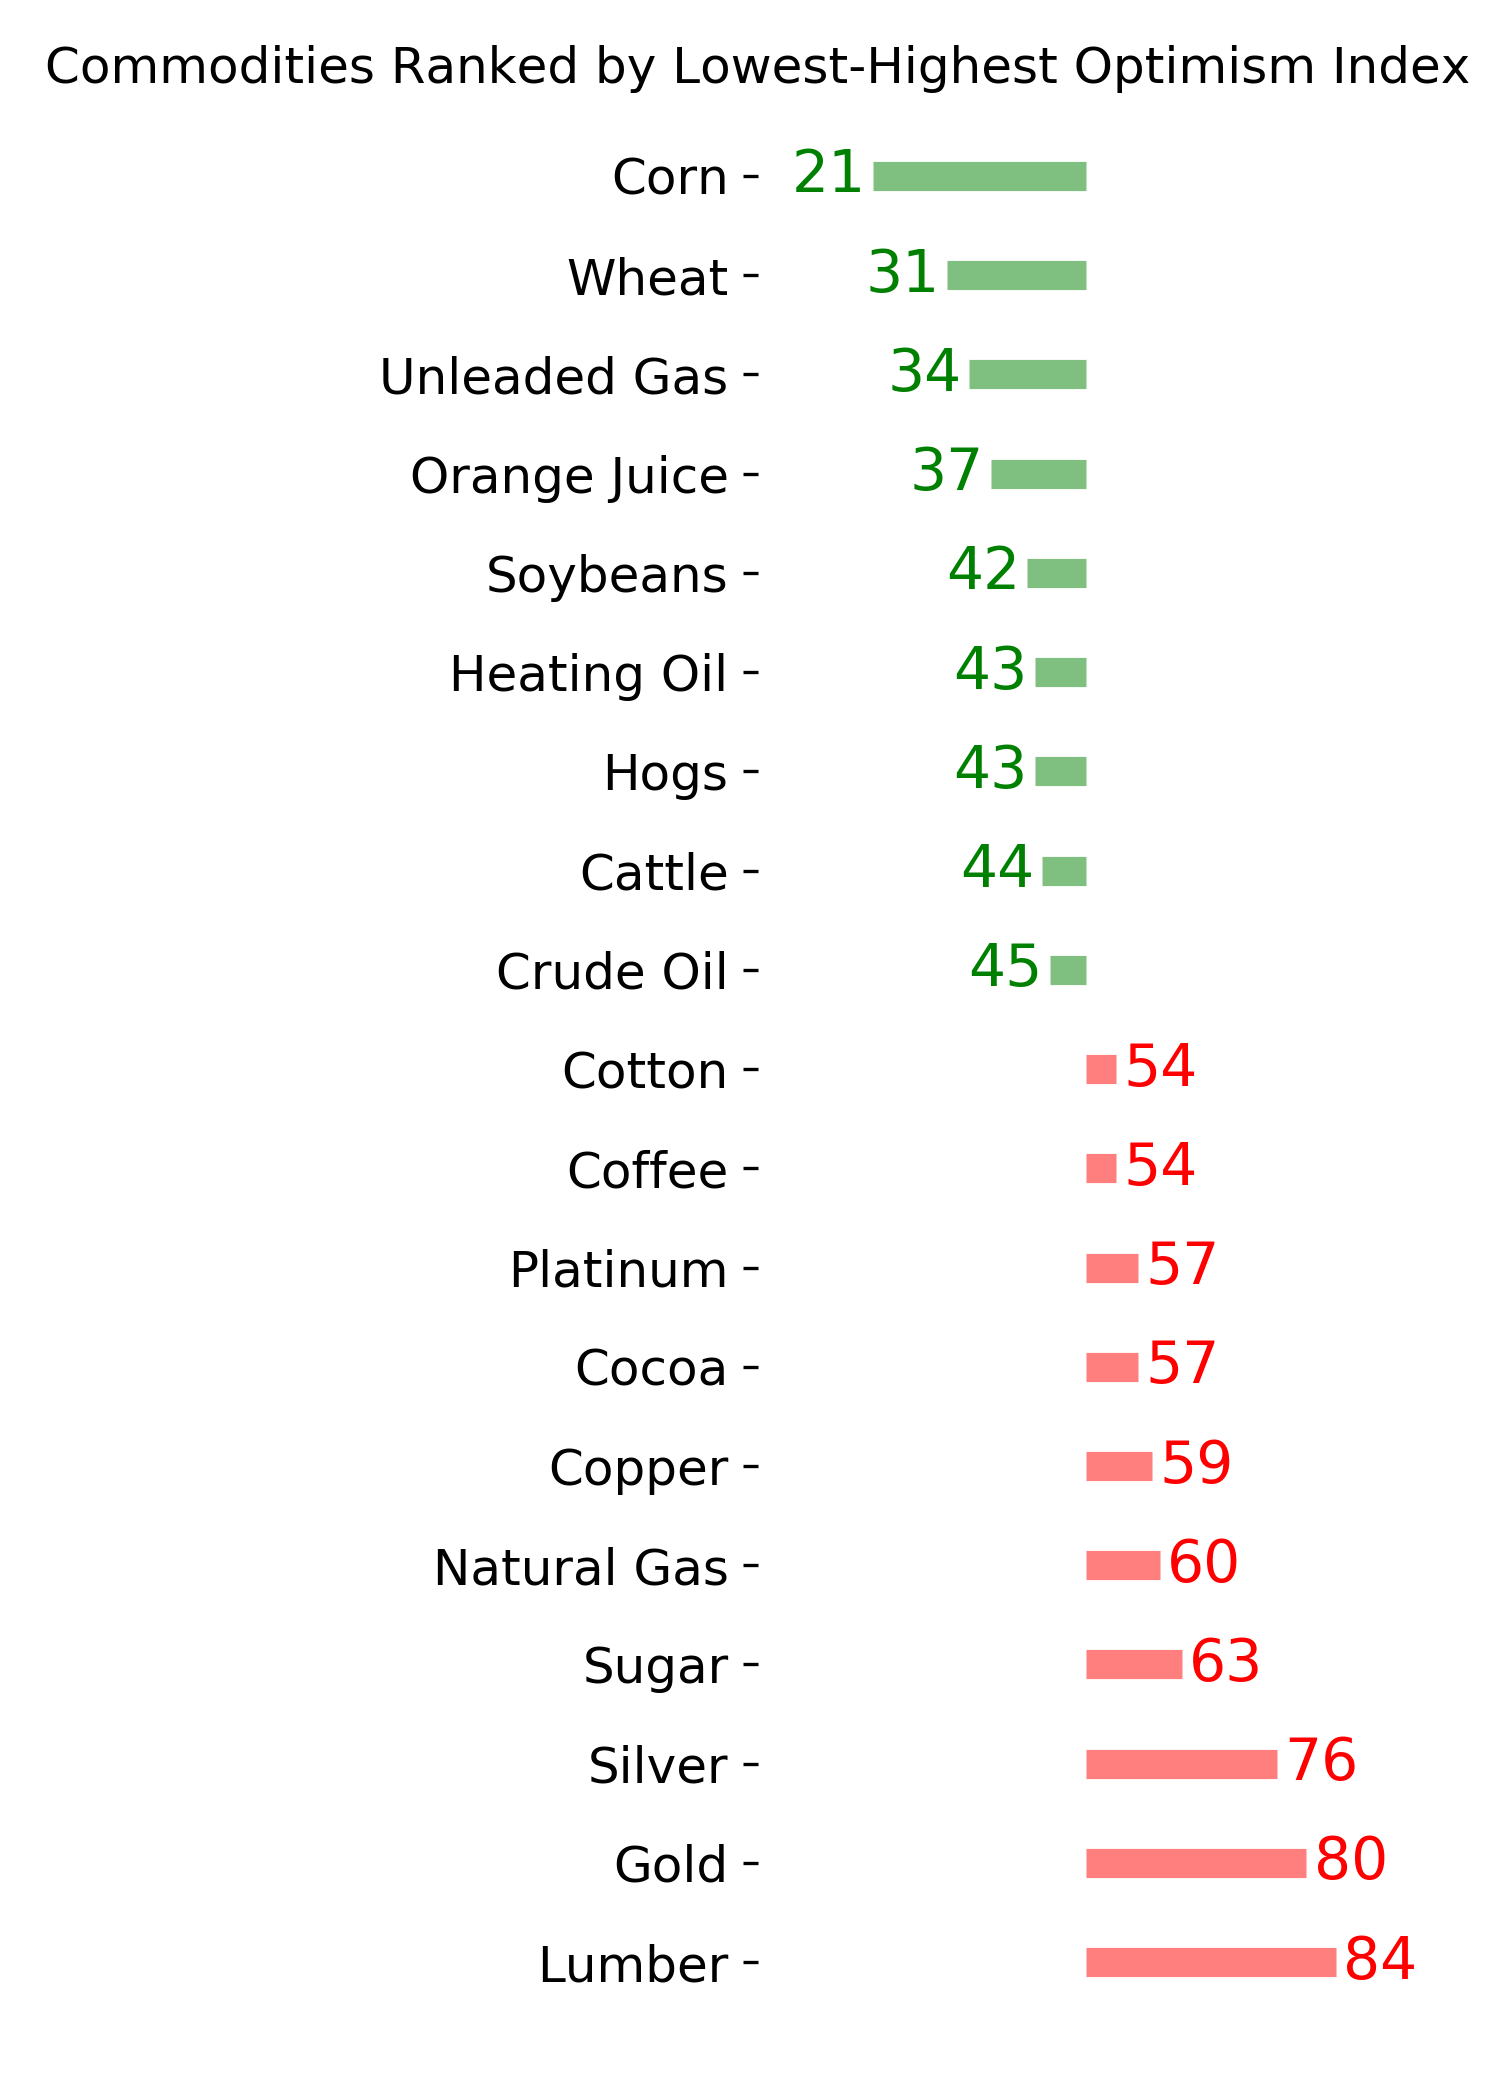
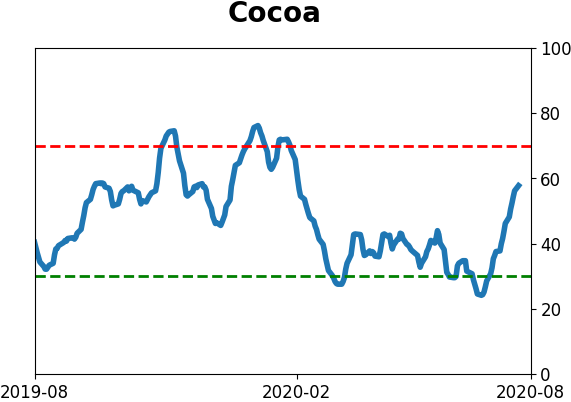
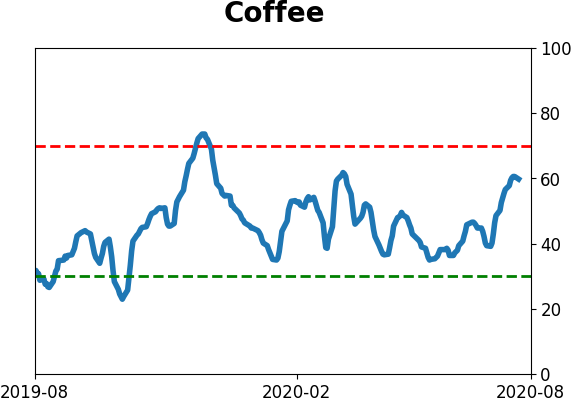
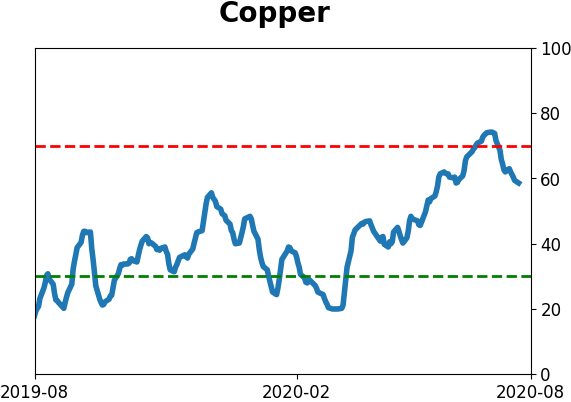
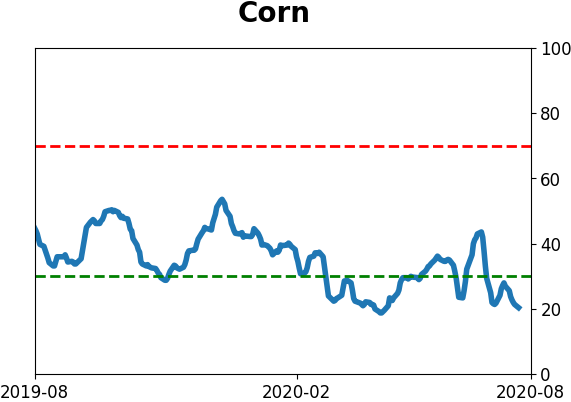
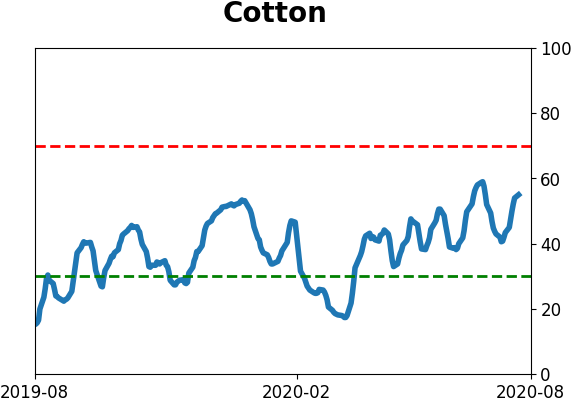
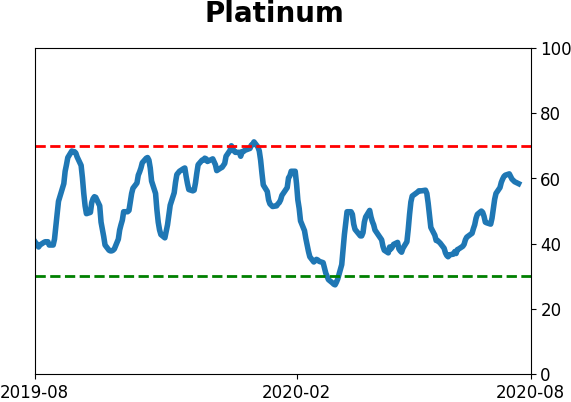
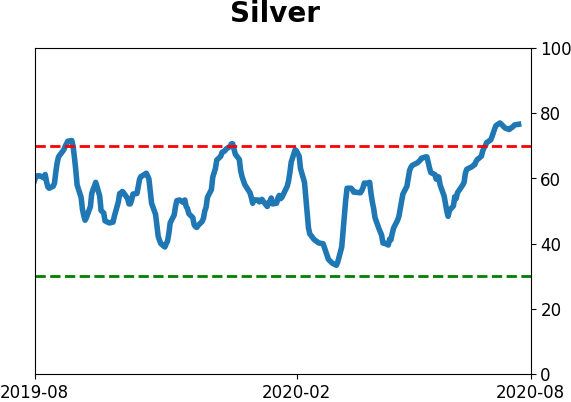
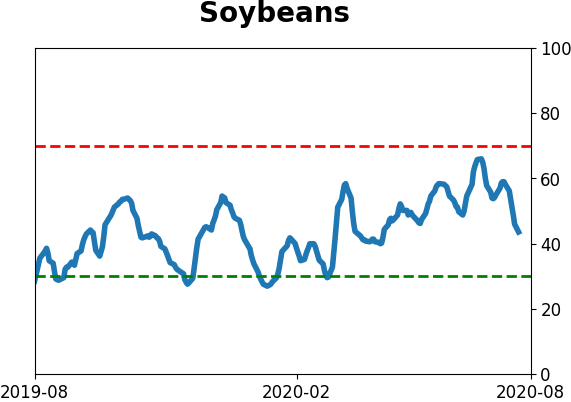
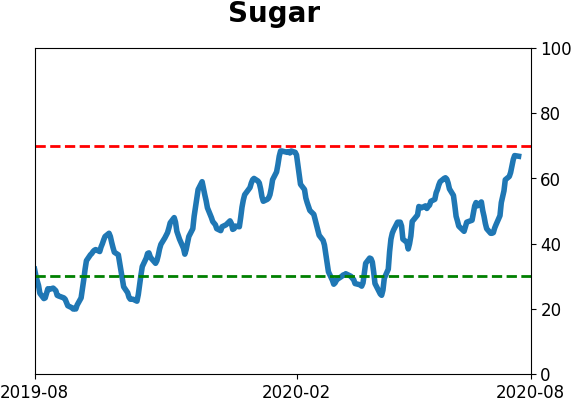
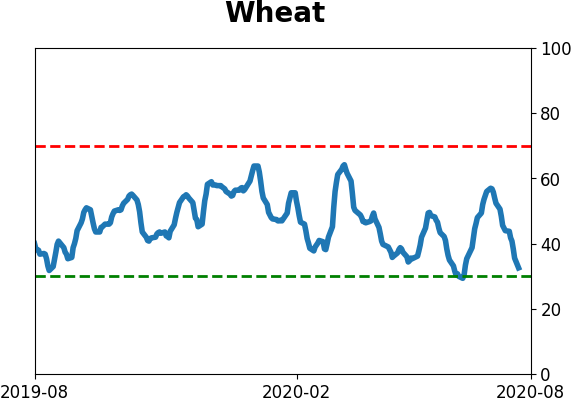
Agriculture
|
|
Research
BOTTOM LINE
The S&P 500's total return index, which includes dividends, has hit a new all-time high. The equal-weight version of the index, which puts all of the stocks on equal footing, is still more than 7% below its own high. This has only happened on four other days in 30 years, in late 1999 and early 2000.
FORECAST / TIMEFRAME
None
|
We've seen how a few stocks have been taking over the market (here and here) which has masked some underlying weakness (here and here). While the Advance/Decline Line has broken out to a new high, that doesn't mean the gains are evenly spread, not even remotely. The stocks-only A/D Line still remains below its prior high.
These quirks have allowed the S&P 500's Total Return index to close at a new all-time high. This is the version of the index that takes dividends into account, which is what a "real" investor would receive. Yet the Equal Weight version of the index, which puts all 500+ stocks on equal footing, is still more than 7% below its own high, even though its relative performance has picked up in recent days.
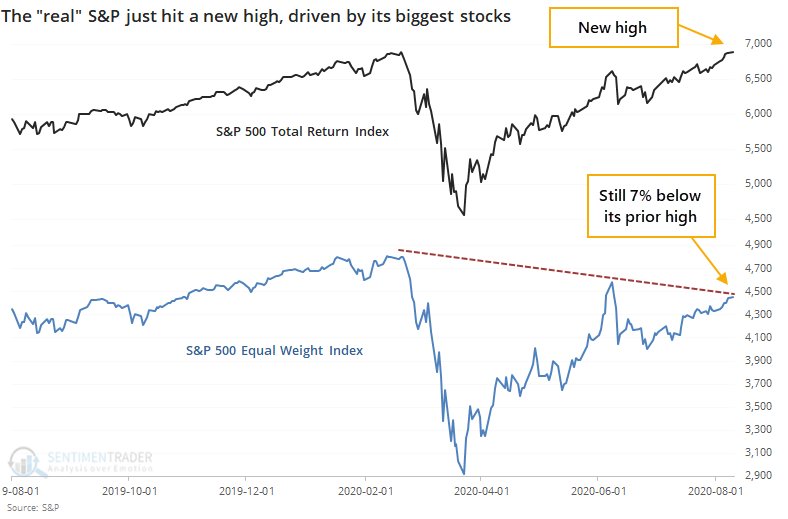
Over the past 30 years, there have only been four other days when this kind of quirk triggered - two days in late December 1999, and two in mid-March 2000. Even when relaxing the parameters to look for a 5% divergence, only a handful more days showed up, mostly around the same time frames.
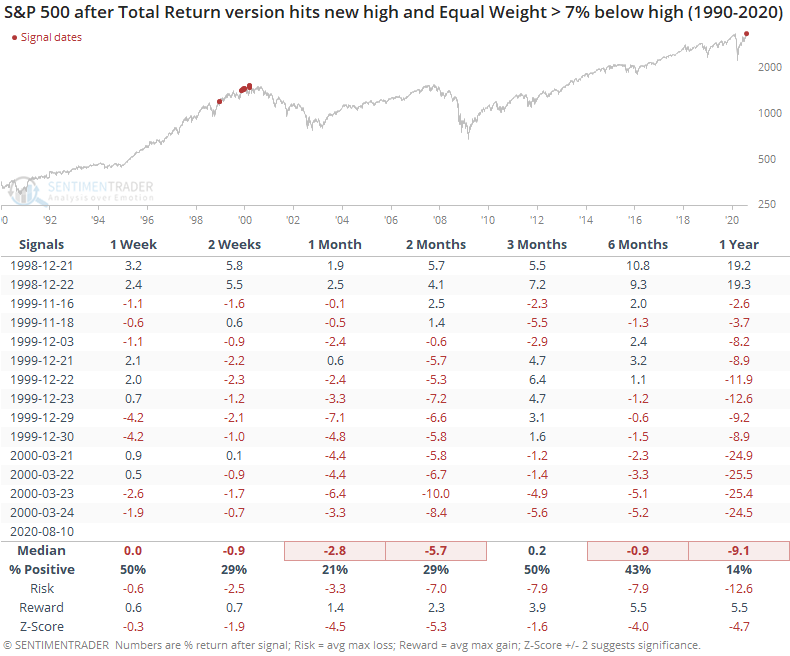
In late 1998, the S&P still managed to show some gains going forward, but the others were disastrous. The Total Return version of the index showed only slightly better returns since dividends weren't much of a factor around that time.
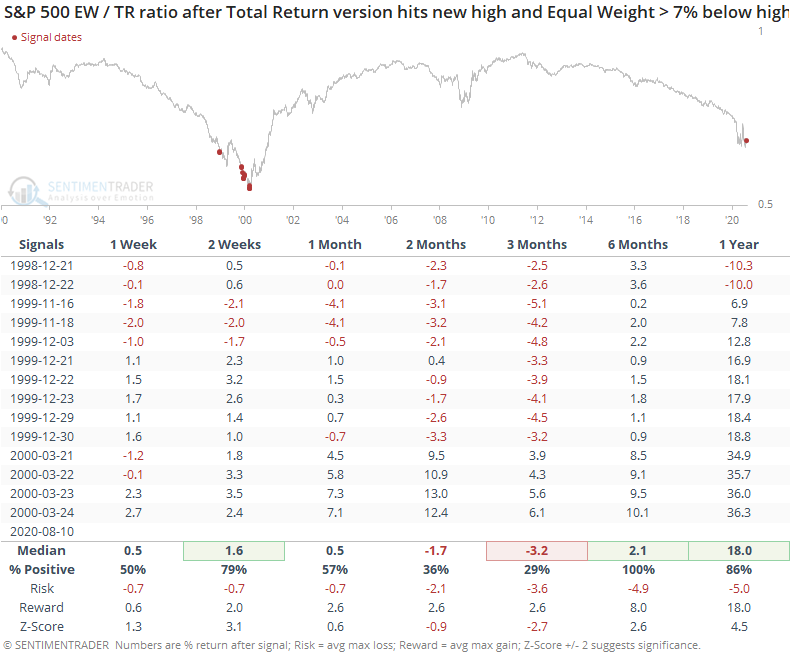
The Equal Weight version of the S&P held up much better.
If we look at the ratio of the Equal Weight to Total Return versions of the S&P, it clearly favored the former over the next six months.
With the attention focused on the handful of dramatic winners in recent months, and investors extrapolating those wins far into the future, the risk is high that those extrapolations won't come to fruition. Whether due to competition, new regulations, or simple gravity, the U.S. economy is not set up to reward a near-monopoly for long. Those investors relying on the capitalization-weighted version of the index are at the mercy of that history being rewritten now.
BOTTOM LINE
The S&P 500 ETF, SPY, has stretched more than 11.5% above its Volume-Weighted Average Price (VWAP) over the past 250 sessions. This is a large deviation from its trend, one of the few times in 25 years it has rebounded from far below average to far above it.
FORECAST / TIMEFRAME
None
|
Stocks are getting stretched above their average traded price.
As noted by The Daily Shot, the largest ETF in the world is more than 11.5% above its Volume-Weighted Average Price (VWAP) over the past 250 trading days.
Per Investopedia:
"The volume-weighted average price (VWAP) is a trading benchmark used by traders that gives the average price a security has traded at throughout the day, based on both volume and price. It is important because it provides traders with insight into both the trend and value of a security.
VWAP is calculated by adding up the dollars traded for every transaction (price multiplied by the number of shares traded) and then dividing by the total shares traded.
Large institutional buyers and mutual funds use the VWAP ratio to help move into or out of stocks with as small of a market impact as possible. Therefore, when possible, institutions will try to buy below the VWAP, or sell above it. This way their actions push the price back toward the average, instead of away from it."
This is SPY's largest deviation from its rolling 250-day average VWAP since February.
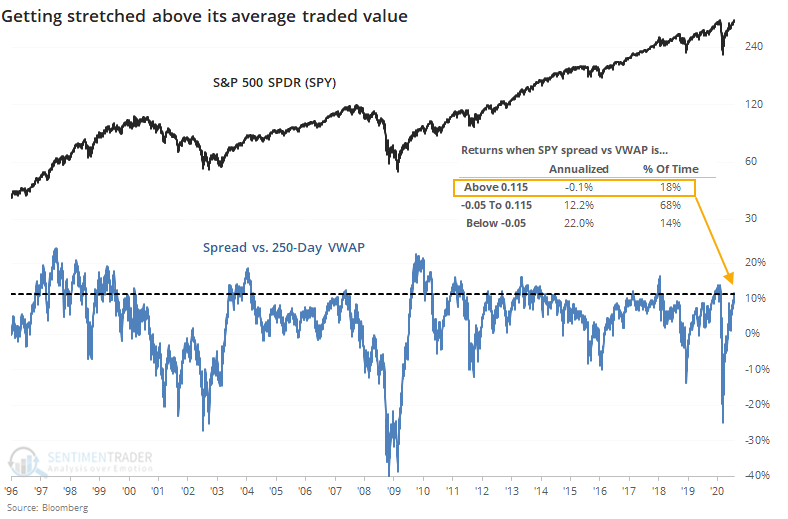
We can see from the chart that SPY's annualized return when this far above its one-year VWAP is -0.1%.
Taking a signal-based approach, the table below shows each time it has been stretched this far for the first time in at least three months.

SPY's returns going forward weren't terrible, but not great, either. It was below random on most time frames, with a relatively weak risk/reward ratio, especially over the short- to medium-term. On the plus side, it was positive most of the time, even if average returns weren't notable, and six months later showed only two losses.
To add additional context, the table below shows times when SPY has cycled from more than 10% below its average VWAP to more than 10% above.
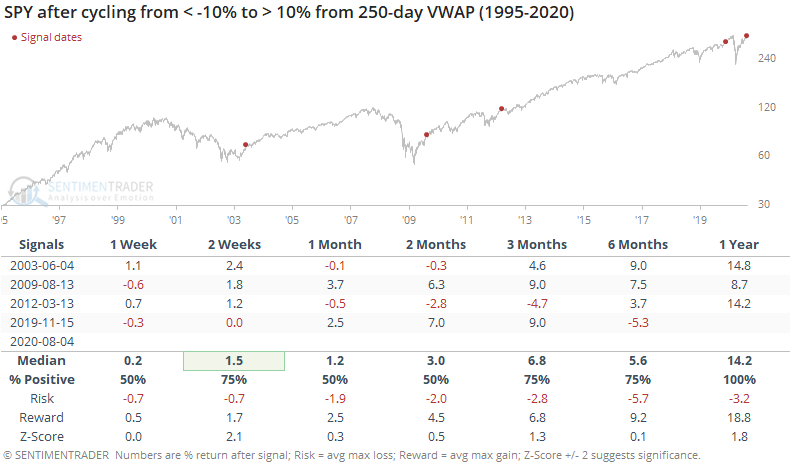
The sample size is tiny, so any conclusions are suspect. About the best thing we can say is that only one of the signals actually failed (though it took a while). The worst we can say is that SPY showed weakness or moderating gains on some time frame - either immediately in the aftermath of the recoveries in 2003 and 2012, or eventually after the recoveries in 2009 (shorter-term gains were erased) and 2019.
Since May, we've seen quite a few comparisons in price patterns and breadth thrusts to the summer of 2009, and this is another. There are also stark differences, so trying to overlay an analog to that one time period is highly questionable. Mostly, a stretch above average traded value like we're seeing now doesn't suggest an immediate correction, but it does at least warrant a bit of reduced enthusiasm given the poor annualized returns when it's this extreme.
Active Studies
| Time Frame | Bullish | Bearish | | Short-Term | 0 | 1 | | Medium-Term | 8 | 12 | | Long-Term | 46 | 1 |
|
Indicators at Extremes
Portfolio
| Position | Weight % | Added / Reduced | Date | | Stocks | 29.8 | Reduced 9.1% | 2020-06-11 | | Bonds | 0.0 | Reduced 6.7% | 2020-02-28 | | Commodities | 5.2 | Added 2.4%
| 2020-02-28 | | Precious Metals | 0.0 | Reduced 3.6% | 2020-02-28 | | Special Situations | 0.0 | Reduced 31.9% | 2020-03-17 | | Cash | 65.0 | | |
|
Updates (Changes made today are underlined)
After stocks bottomed on March 23rd, they enjoyed a historic buying thrust and retraced a larger amount of the decline than "just a bear market rally" tends to. Through June, there were signs of breadth thrusts, recoveries, and trend changes that have an almost unblemished record at preceding higher prices over a 6-12 month time frame. On a shorter-term basis, our indicators have been showing high optimism, with Dumb Money Confidence recently above 80%, along with signs of reckless speculation during what appears to be an unhealthy market environment, historically a bad combination. While there are certainly some outlier indicators that are showing apathy or even outright pessimism, a weight-of-the-evidence approach suggests high risk over a multi-week to multi-month time frame. I've been carrying a low (too low) level of exposure to stocks, as well as bonds and gold. I don't see a good opportunity to add to any of those currently, with poor prospects pretty much all the way around. As worried as I am over the medium-term, I would only grudgingly reduce my exposure even further given the longer-term positives we spent so much time discussing in the spring. At this point, I would only look seriously at lowering exposure further if the S&P 500 drops below approximately 3220, an initial sign that its recent mini-breakout had failed.
RETURN YTD: -3.1% 2019: 12.6%, 2018: 0.6%, 2017: 3.8%, 2016: 17.1%, 2015: 9.2%, 2014: 14.5%, 2013: 2.2%, 2012: 10.8%, 2011: 16.5%, 2010: 15.3%, 2009: 23.9%, 2008: 16.2%, 2007: 7.8%
|
|
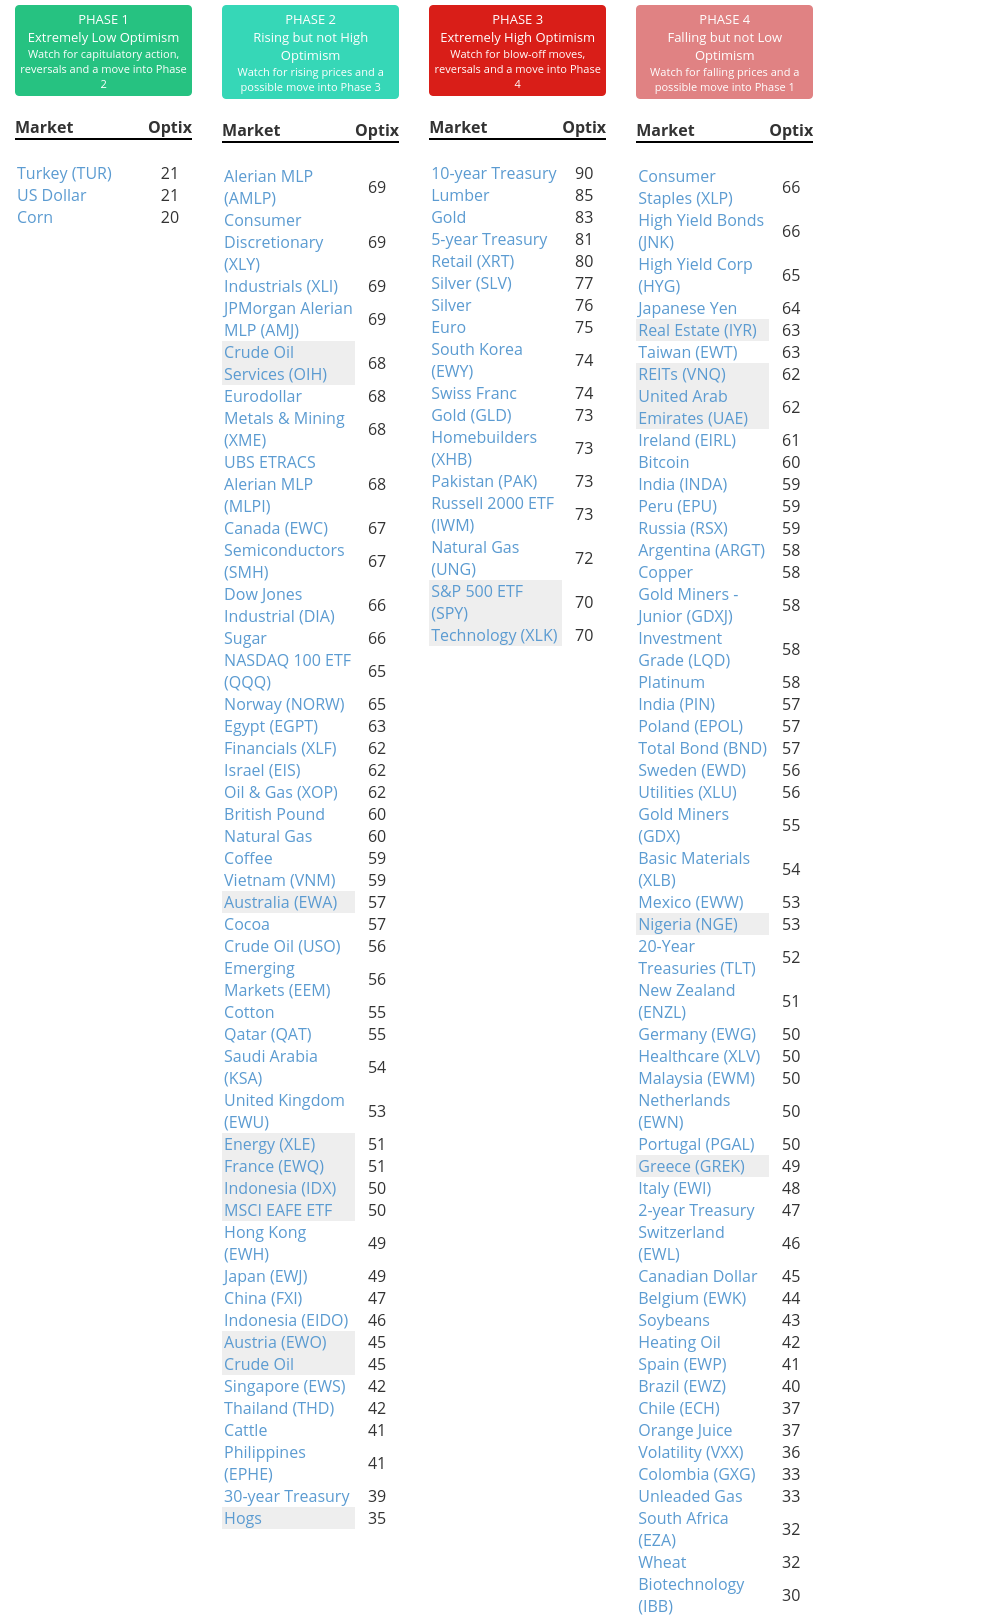
Phase Table
Ranks
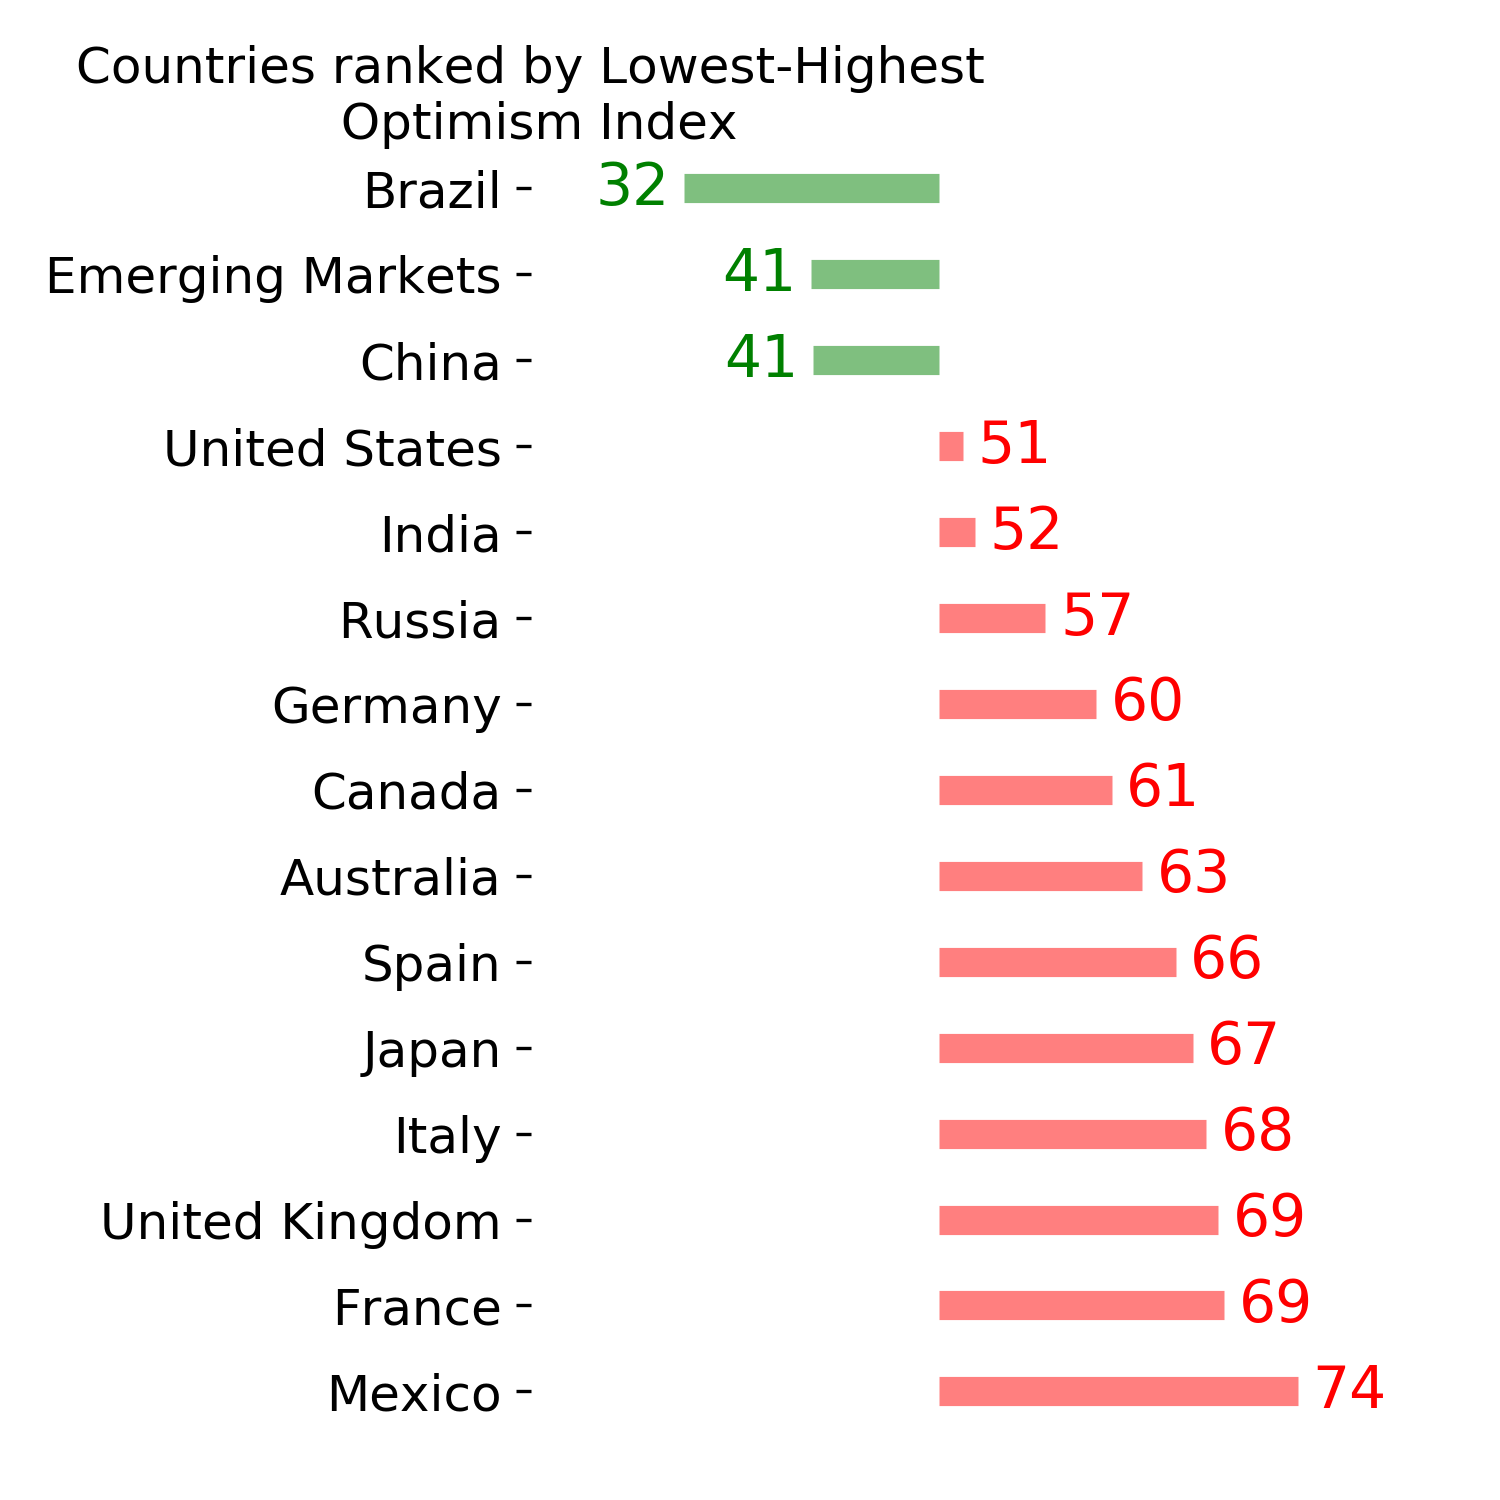
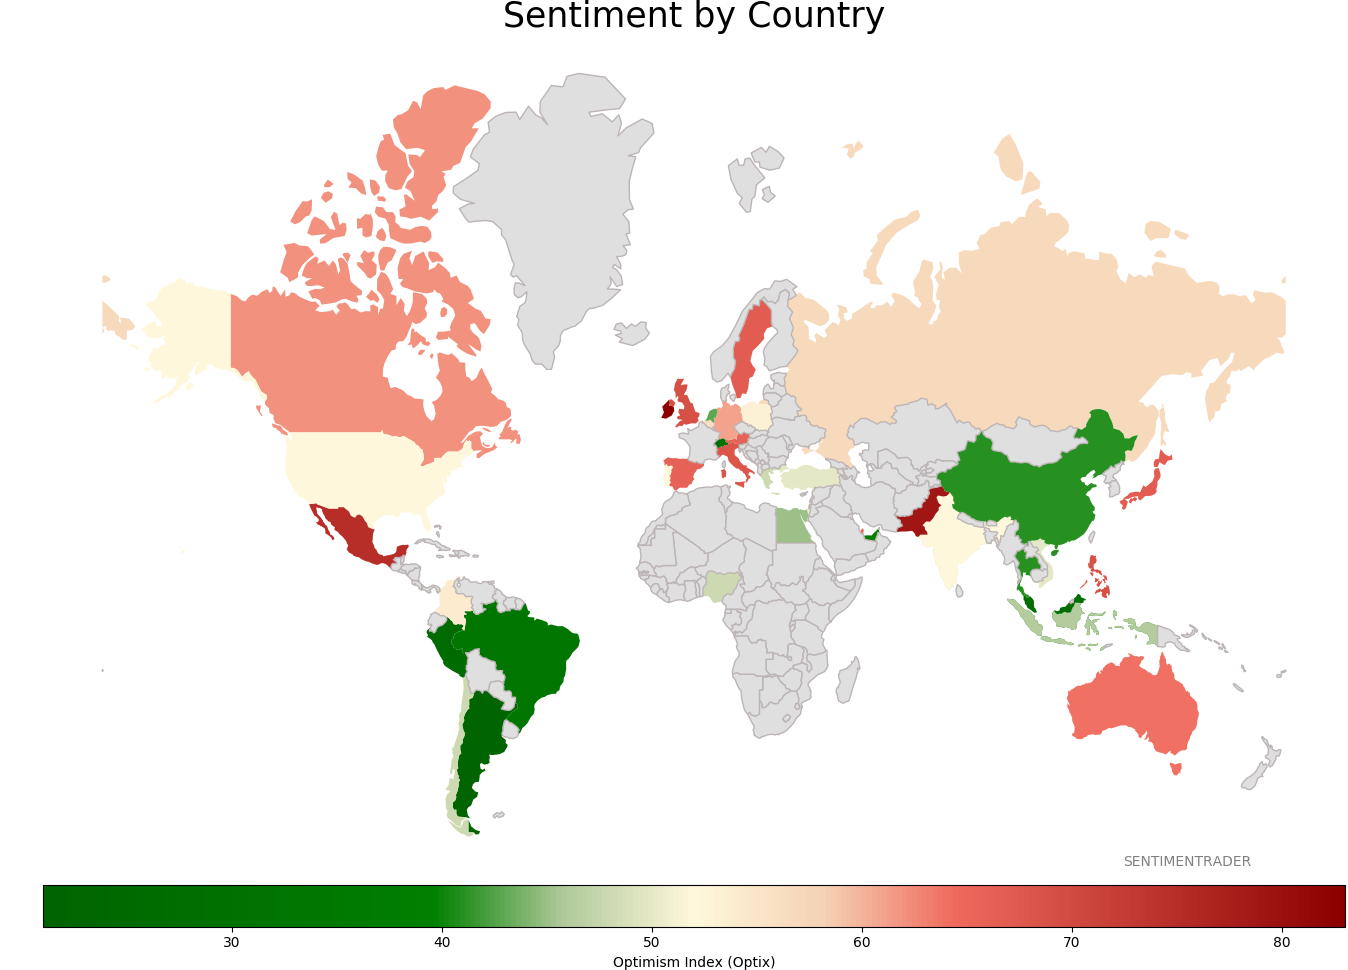
Sentiment Around The World
Optimism Index Thumbnails
|
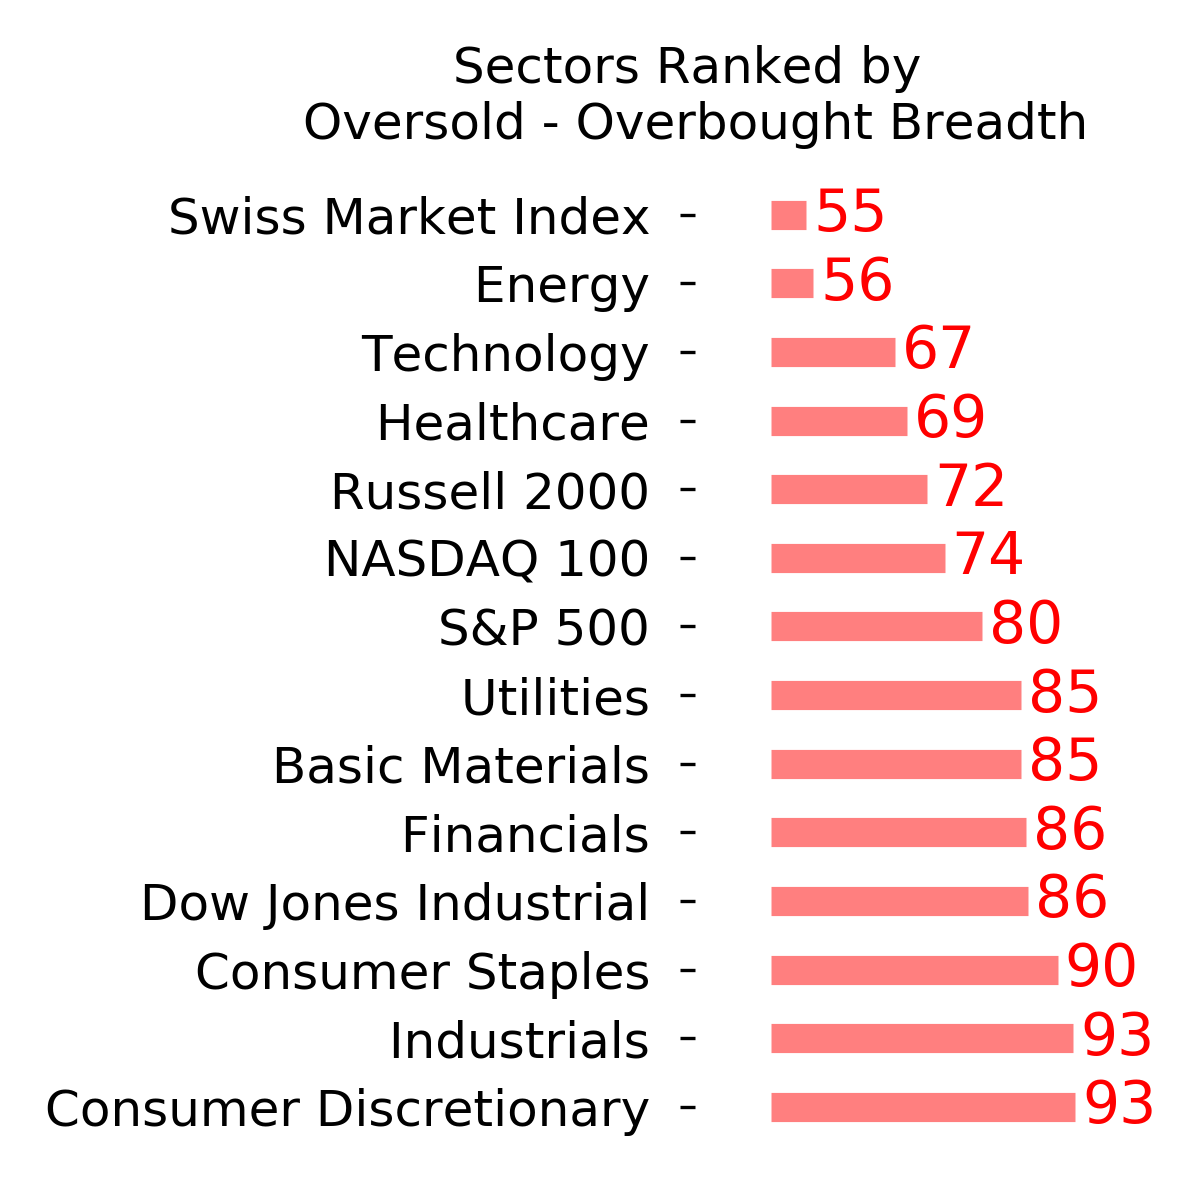
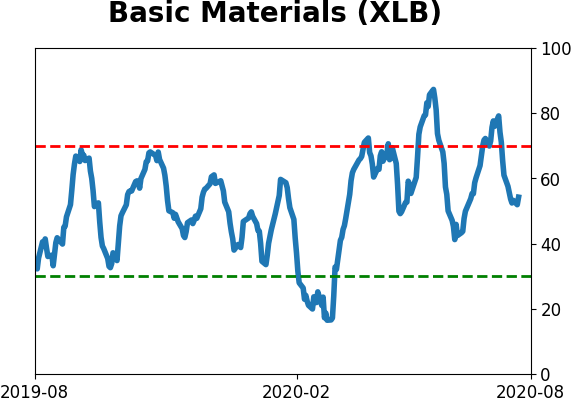
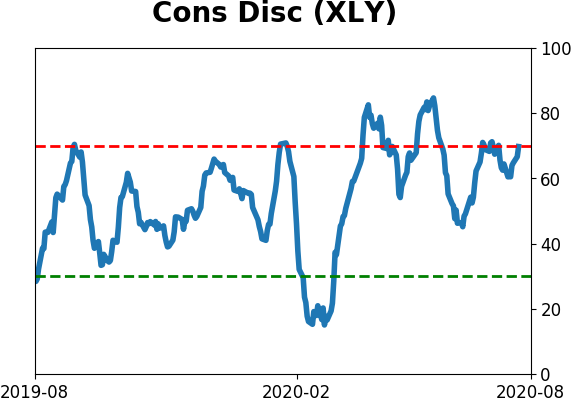
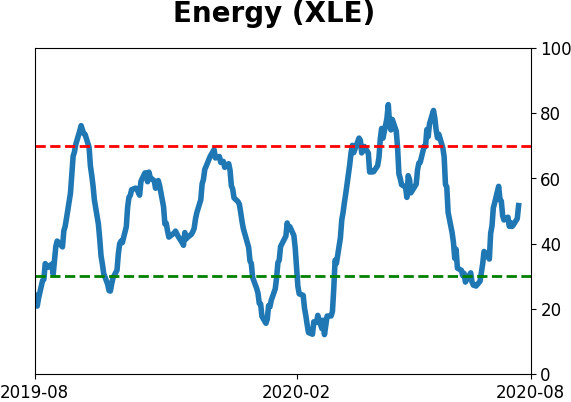
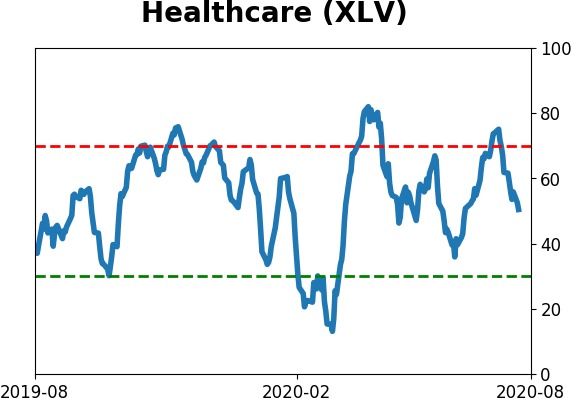
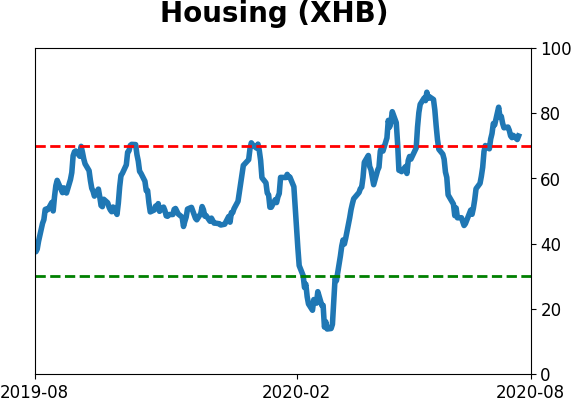
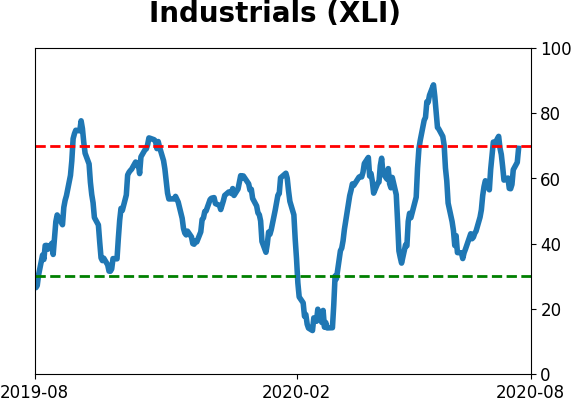
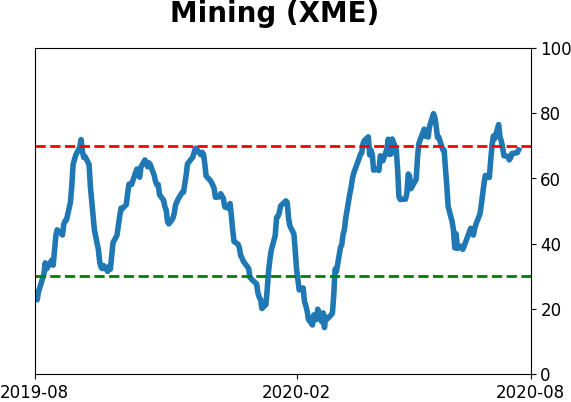
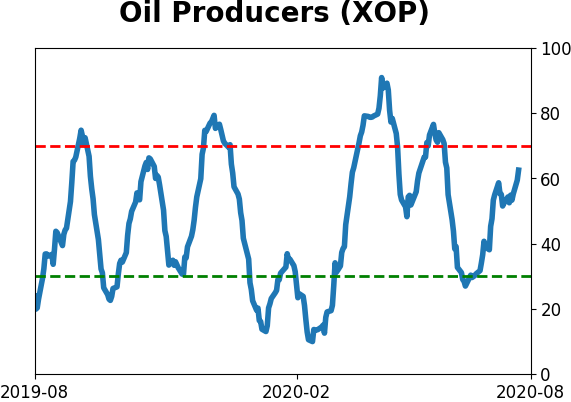
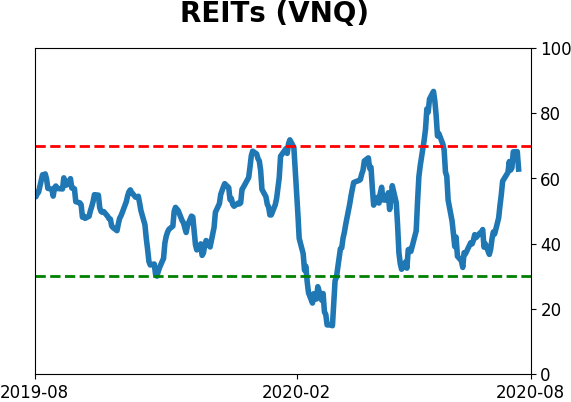
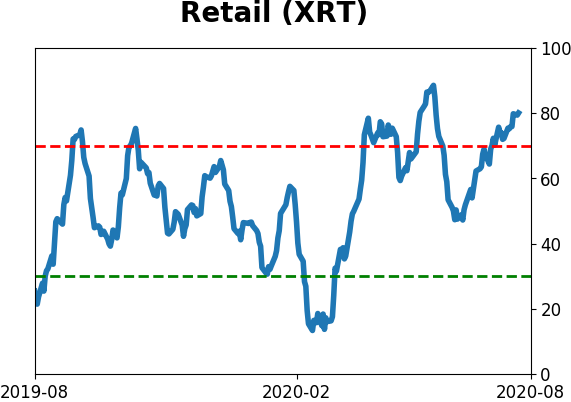
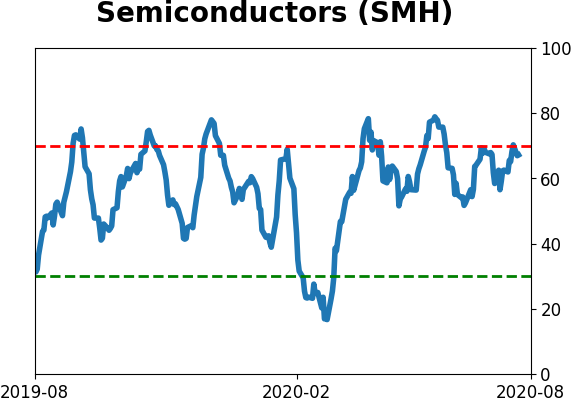
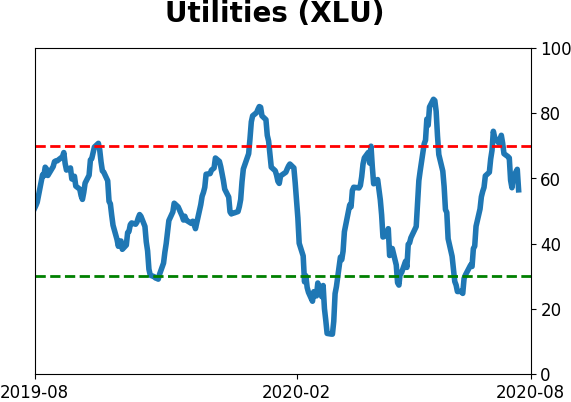
Sector ETF's - 10-Day Moving Average
|
|
|
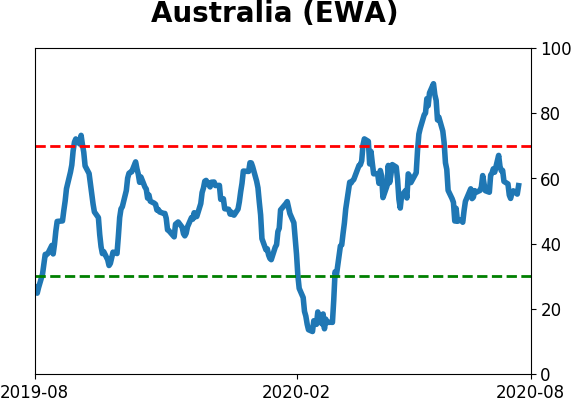
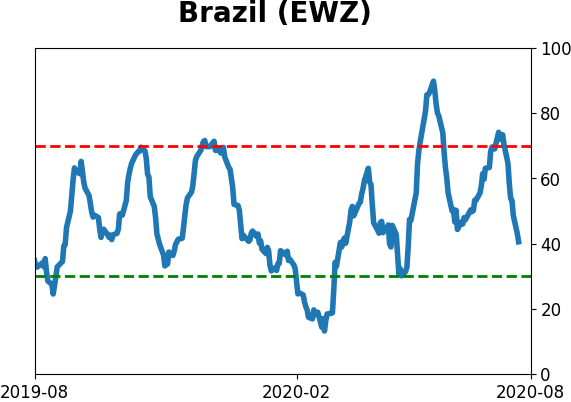
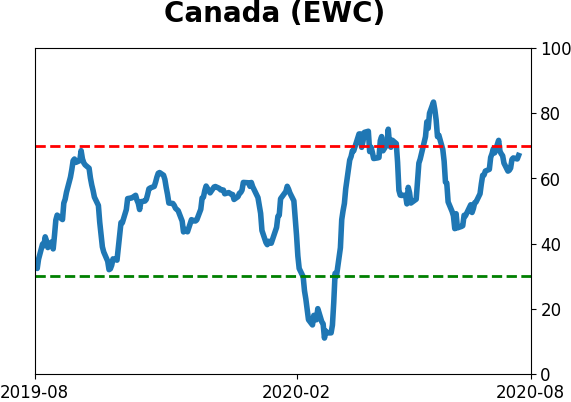
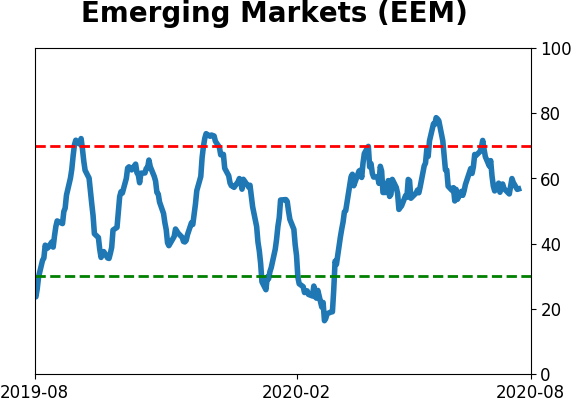
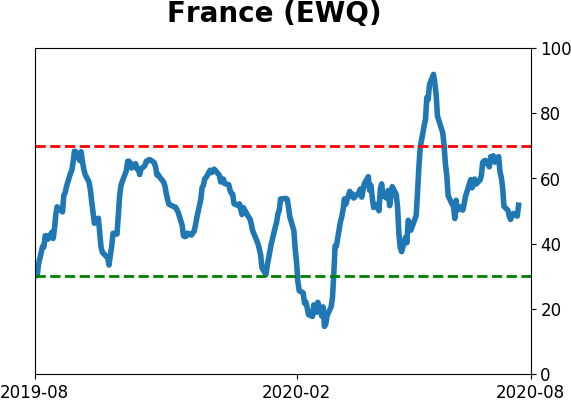
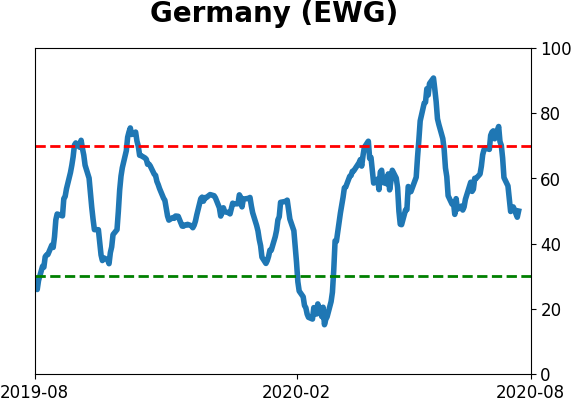
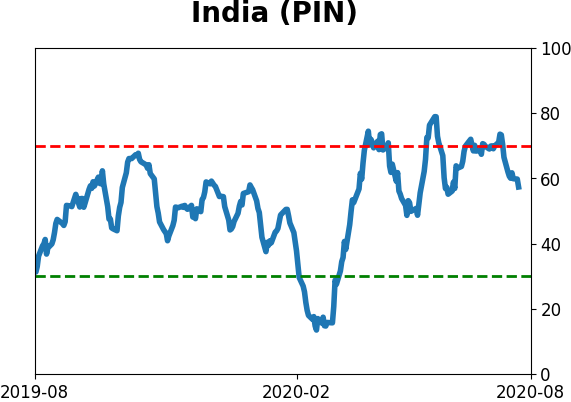
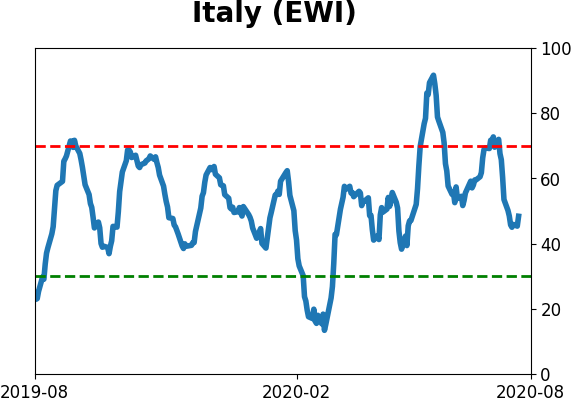
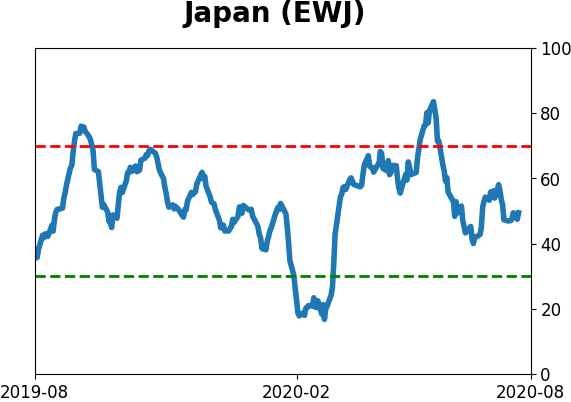
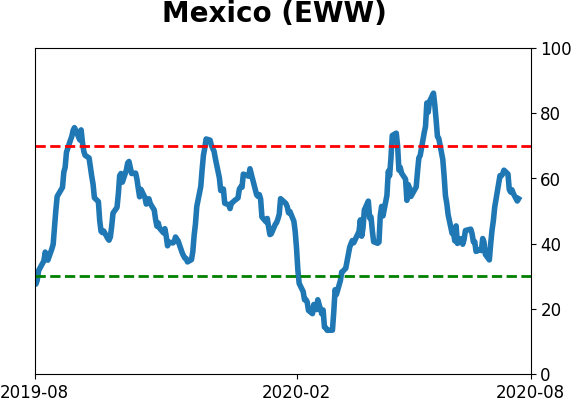
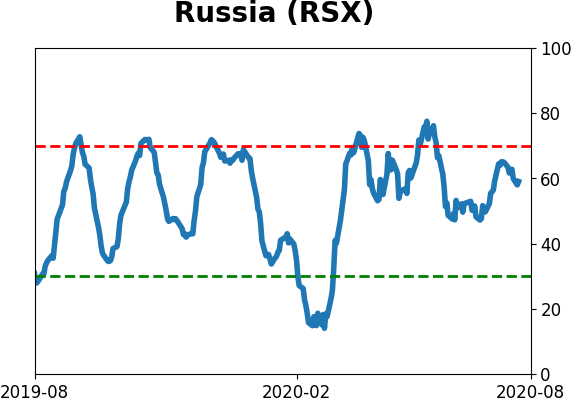
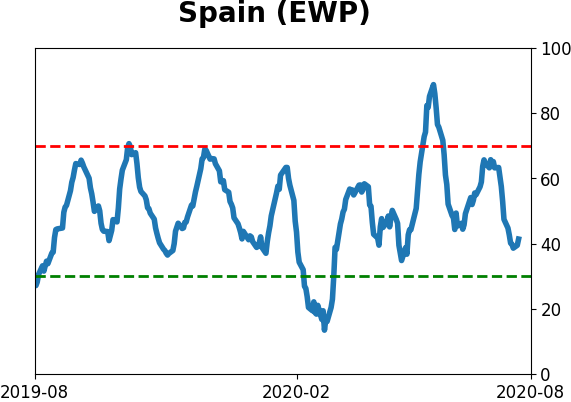
Country ETF's - 10-Day Moving Average
|
|
|
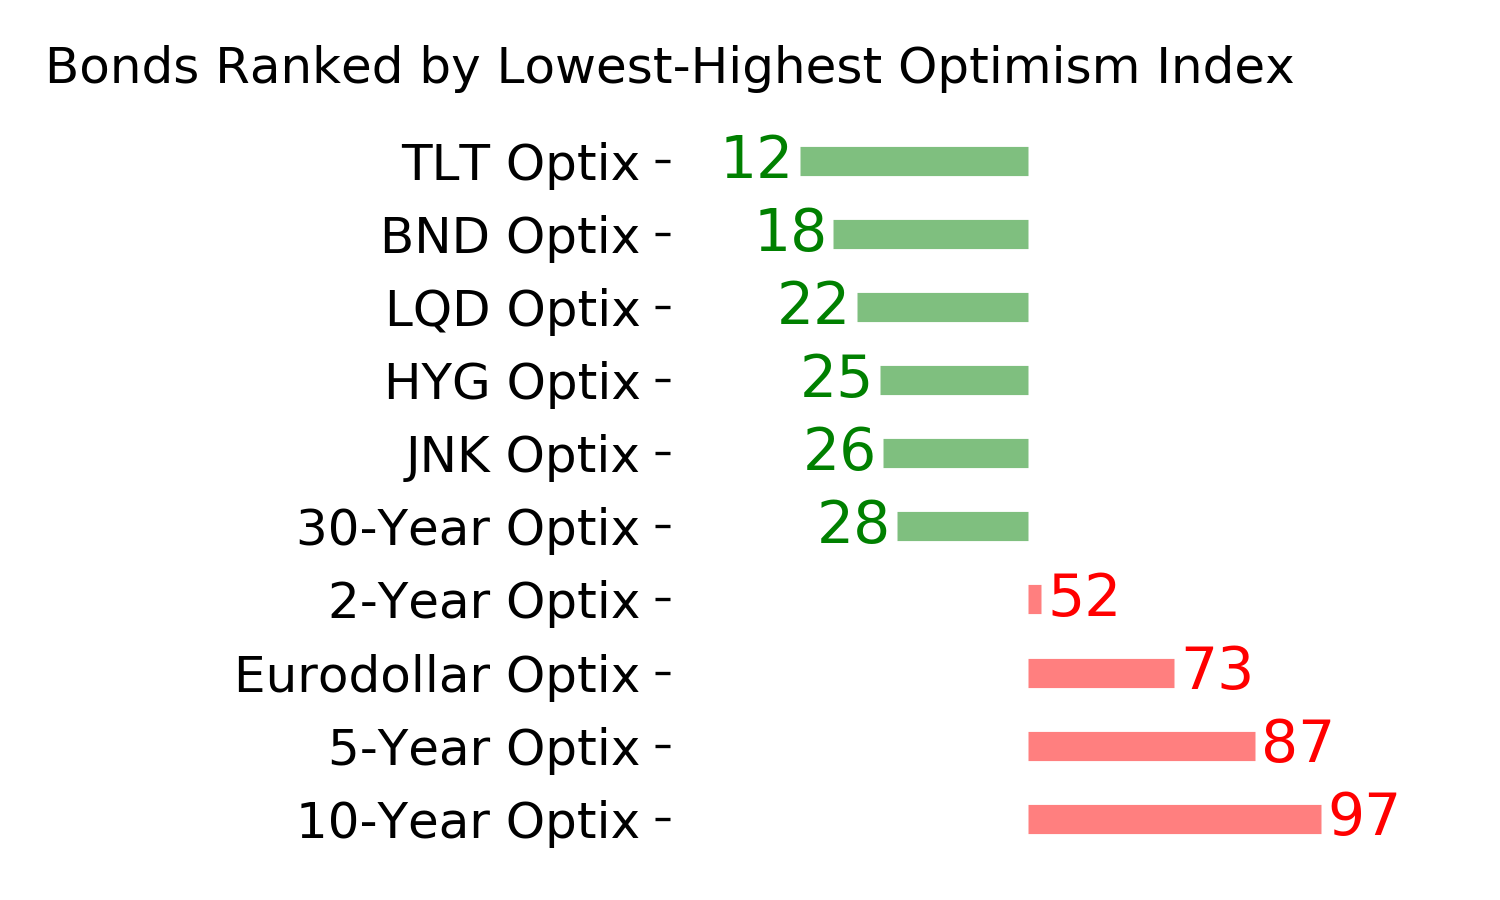
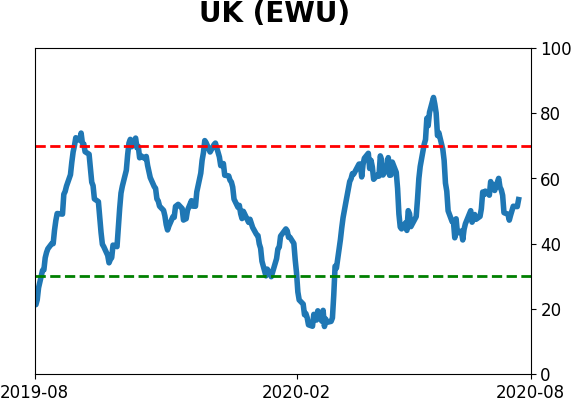
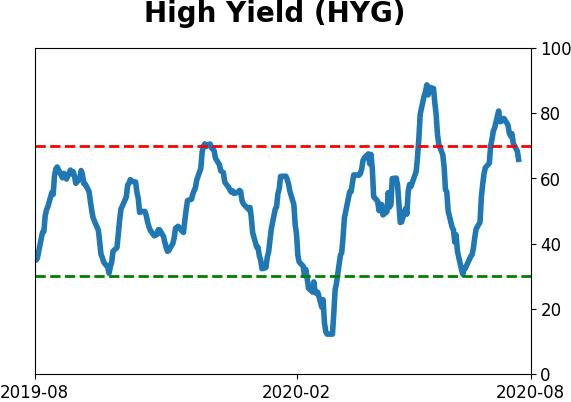
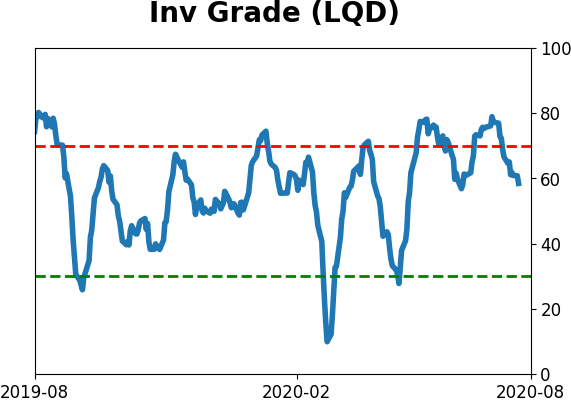
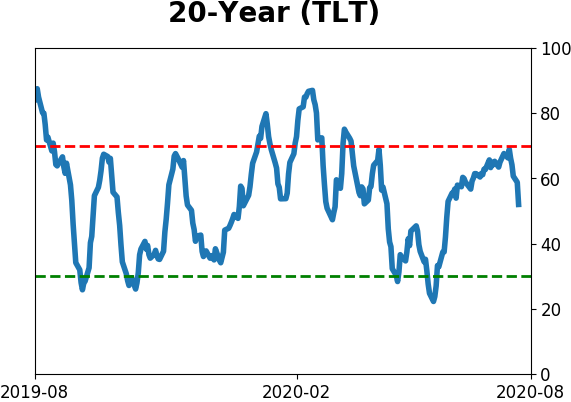
Bond ETF's - 10-Day Moving Average
|
|
|
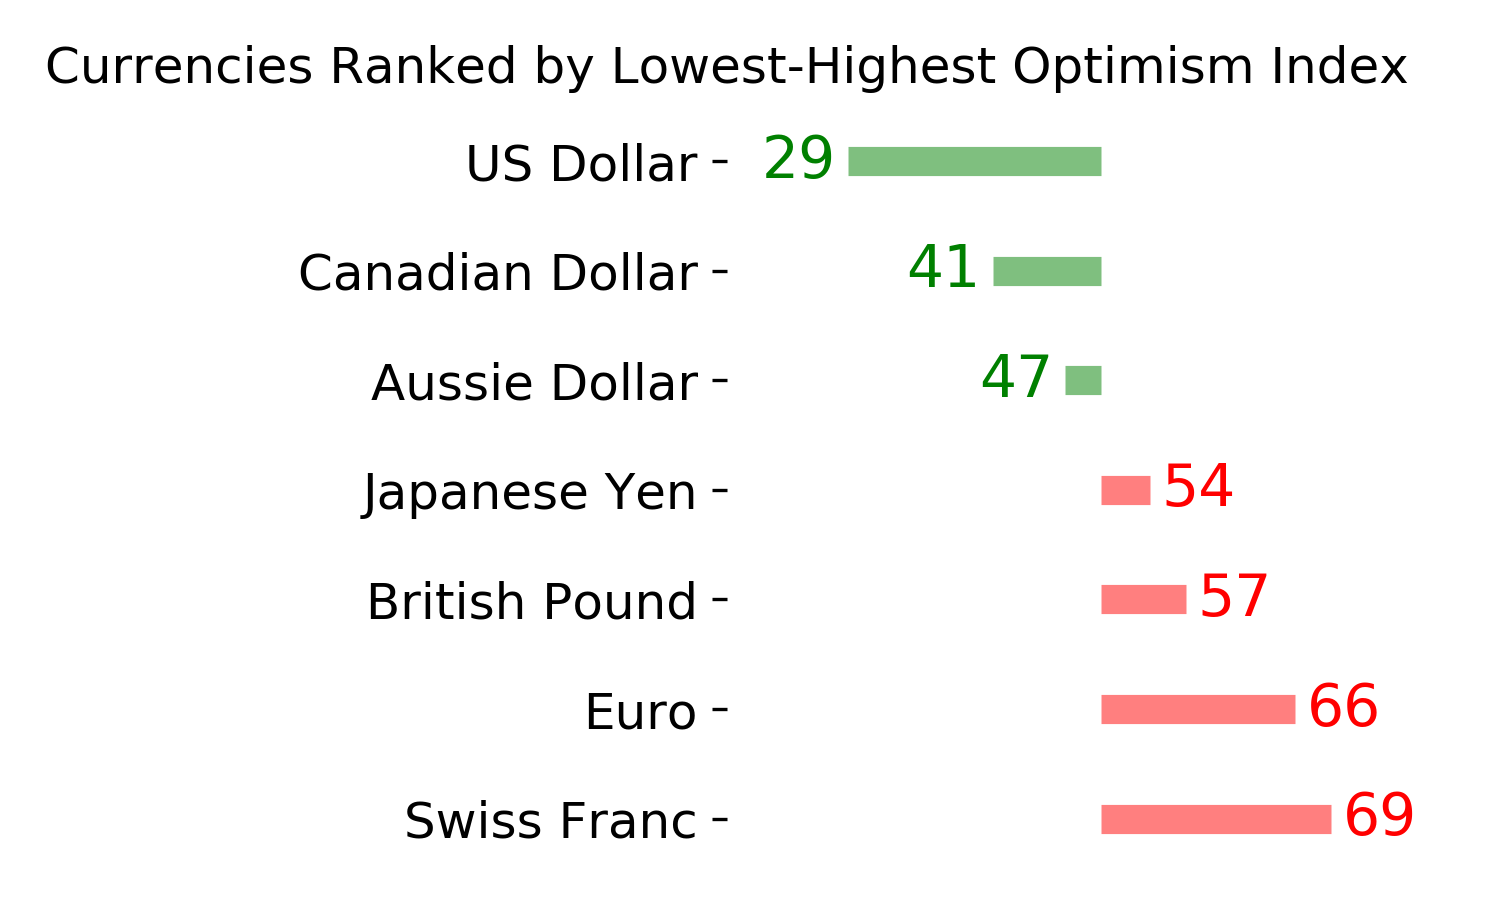
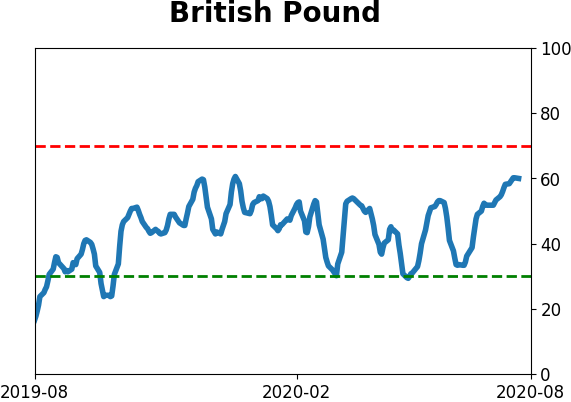
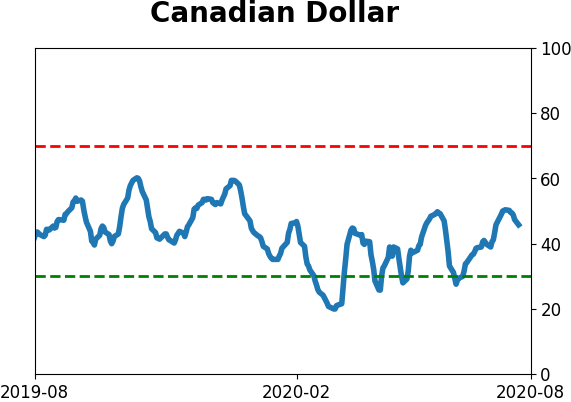
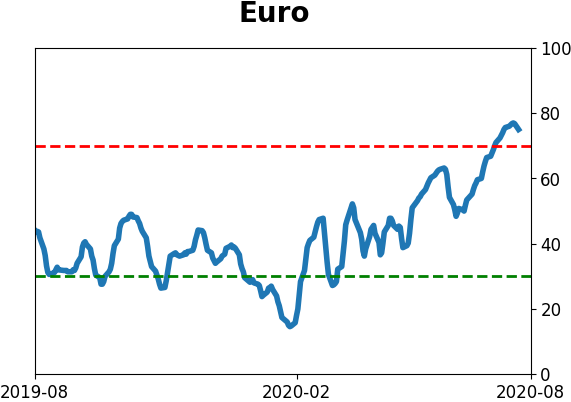
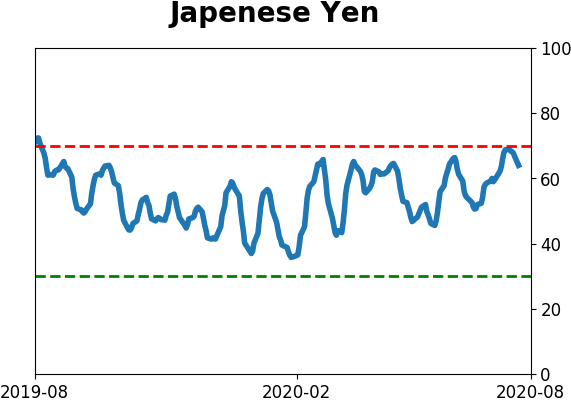
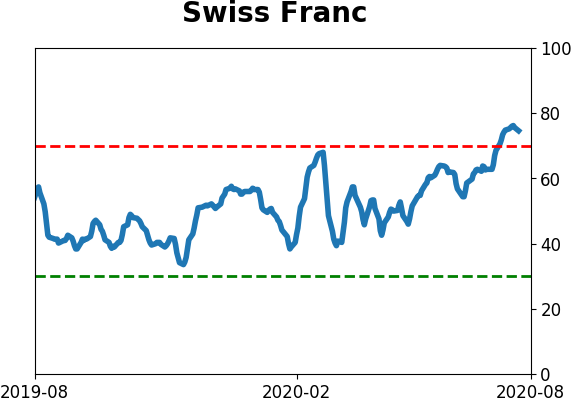
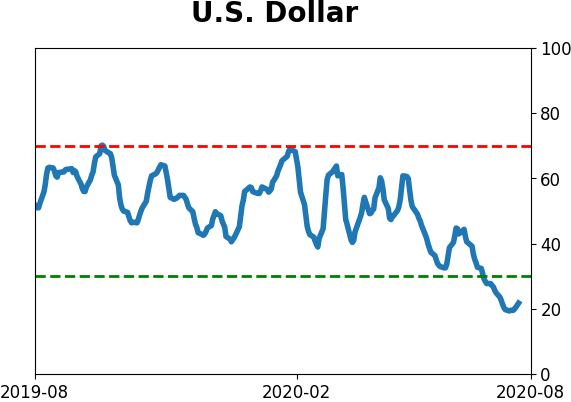
Currency ETF's - 5-Day Moving Average
|
|
|
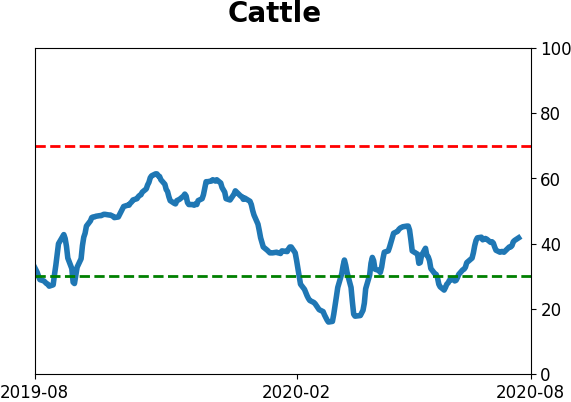
Commodity ETF's - 5-Day Moving Average
|
|