Headlines
|
|
Investors keep shifting money from stocks to bonds:
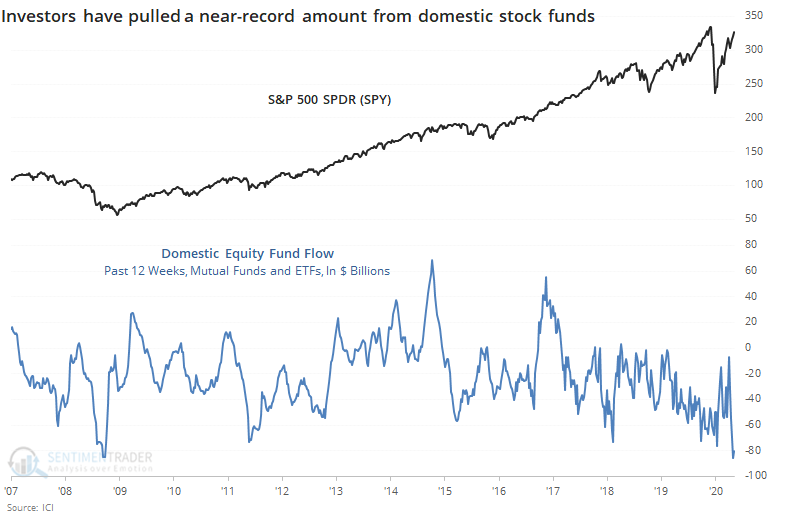
Over the past three months, investors have pulled record or near-record assets from domestic and overseas equity funds. At the same time, they've shoveled a record amount into bond funds.
One of the most consistently positive years for the Nasdaq:
The Nasdaq Composite has been positive on more than 62% of the sessions so far in 2020. That ranks among the most consistently positive years in its history. Forward returns after other largely positive years tended to flatten out when looking over the next few months.
Still crabby: In the past, we've looked at the implied demographics of the AAII sentiment survey, with the conclusion that it's basically a reflection of "crabby old people." The massive rally over the past 20 weeks hasn't changed their attitude at all. Maybe big tech earnings beats will finally get them off the fence (doubtful). The percentage of investors with a bullish outlook this week dropped to 20%, the lowest - by far - of any period when there had been a 20-week rally of more than 20%. The only other week that qualified was July 15, 2009, when these investors weren't really buying into the post-financial-crisis rally, either.
Bottom Line:
- Weight of the evidence has been suggesting flat/lower stock prices short- to medium-term again; still suggesting higher prices long-term
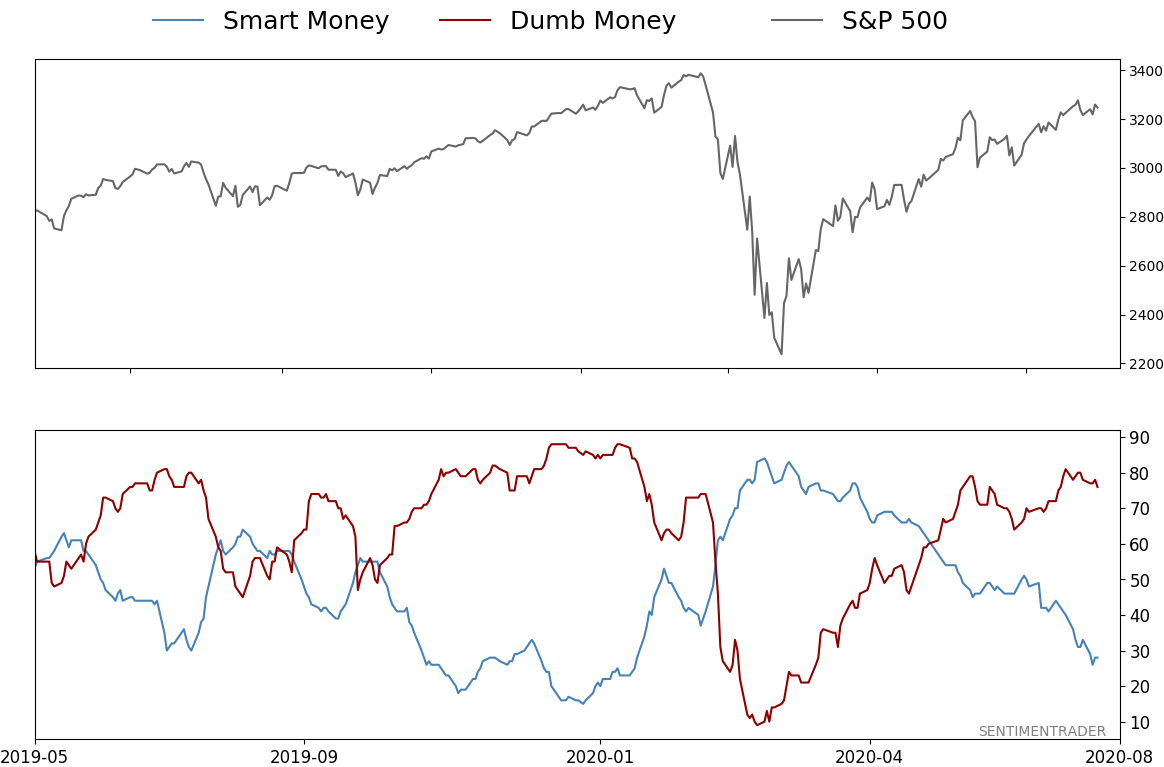
- Indicators show high optimism, with Dumb Money Confidence recently above 80% with signs of reckless speculation during what appears to be an unhealthy market environment, historically a bad combination
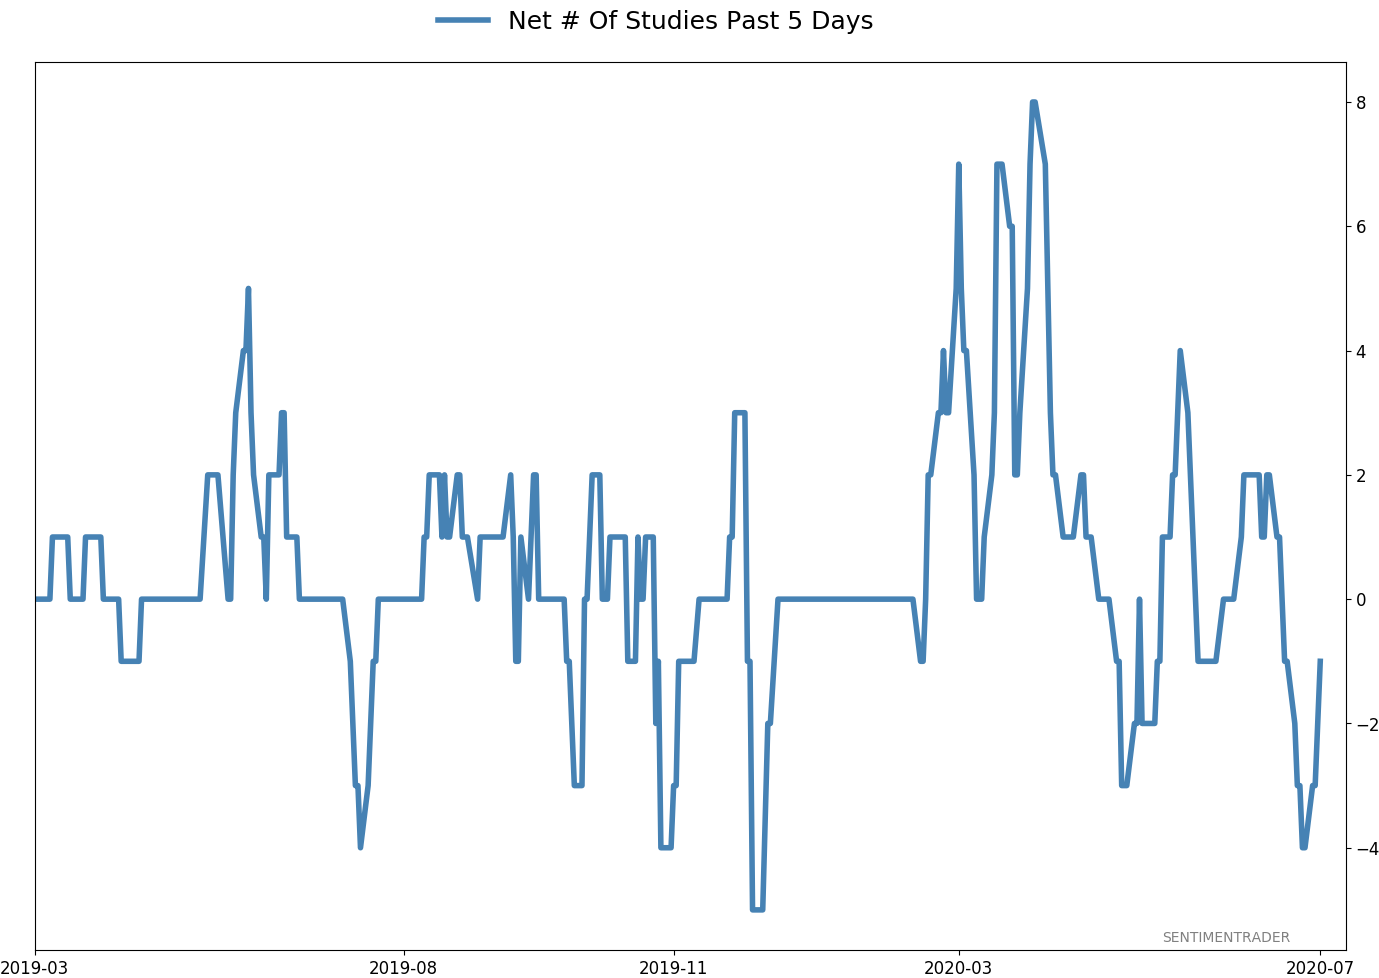
- Active Studies show a heavy positive skew over the medium- to long-term; breadth thrusts, recoveries, and trend changes have an almost unblemished record at preceding higher prices over a 6-12 month time frame
- Signs of extremely skewed preference for tech stocks neared exhaustion by late June, especially relative to industrials and financials (here and here)
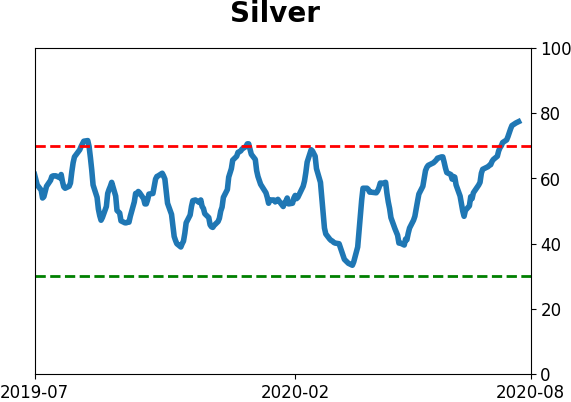
- Indicators and studies for other markets are showing less consistent forward results, though it's not a great sign for Treasuries that hedgers are net short and optimism on metals has become extreme, with "perfect" breadth among miners
|
Smart / Dumb Money Confidence
|
Smart Money Confidence: 28%
Dumb Money Confidence: 76%
|
|
Risk Levels
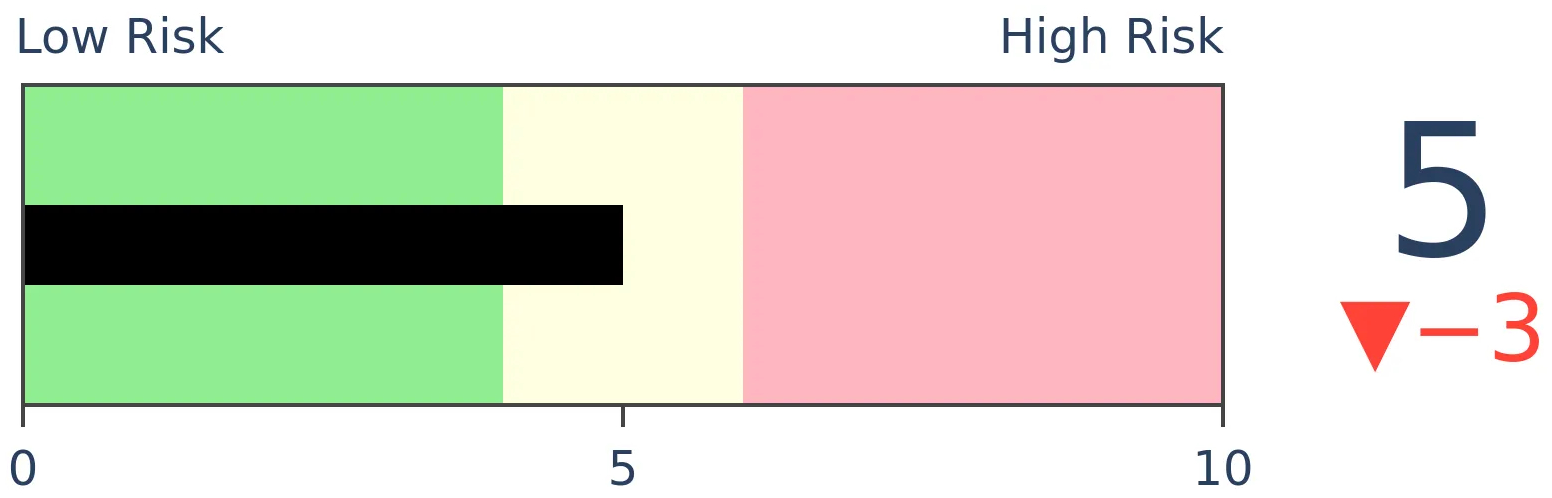
Stocks Short-Term
|
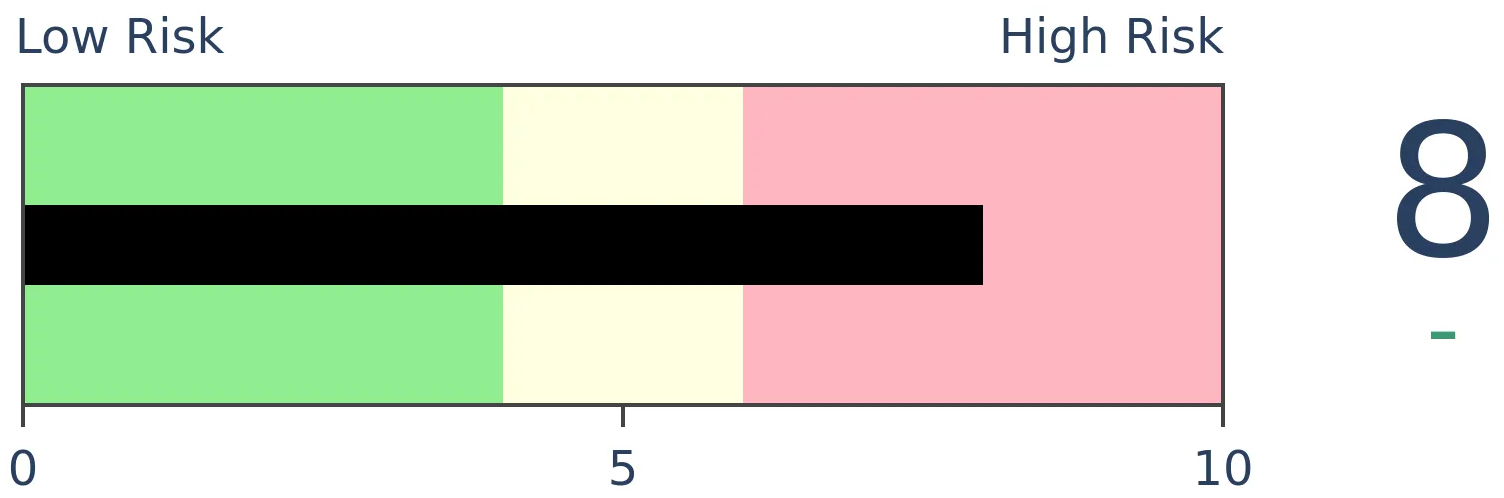
Stocks Medium-Term
|
|
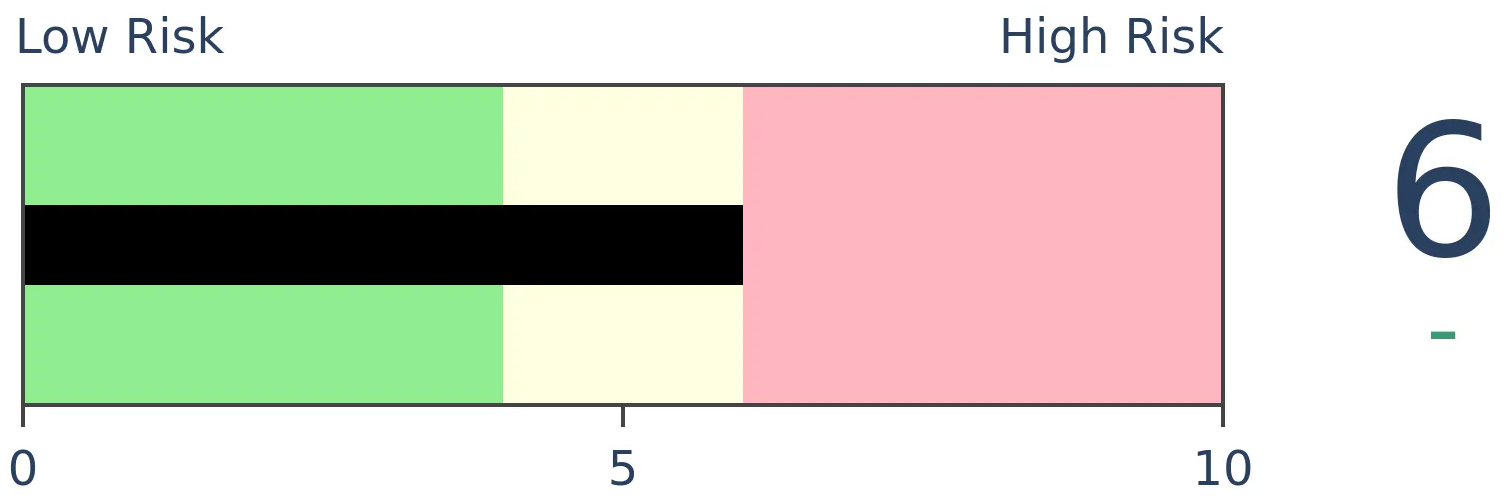
Bonds

|
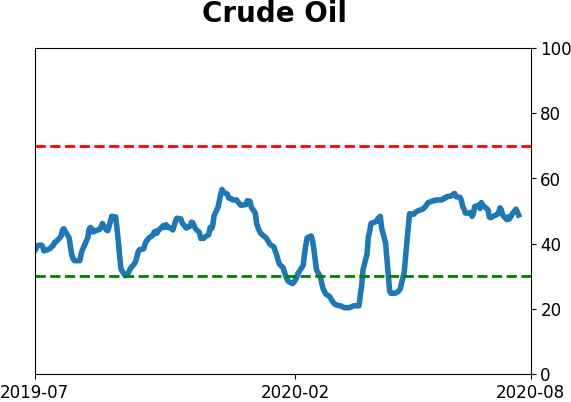
Crude Oil

|
|
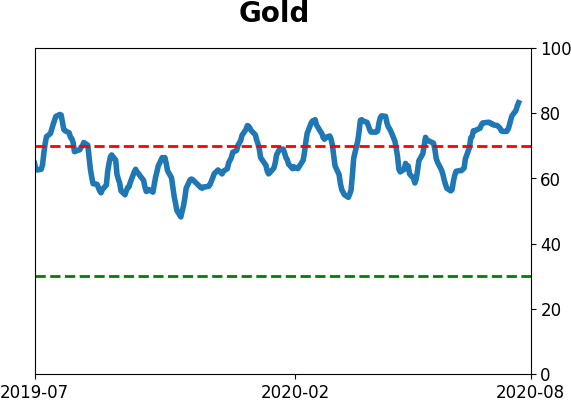
Gold

|
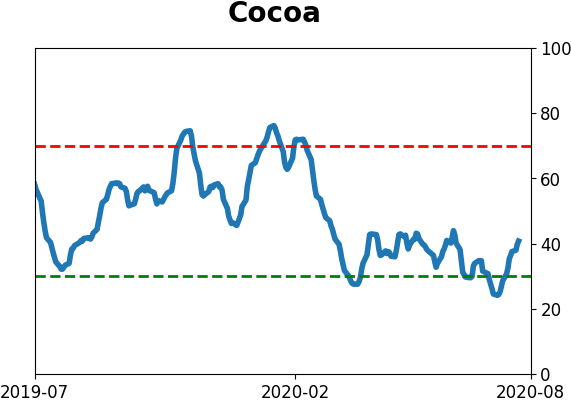
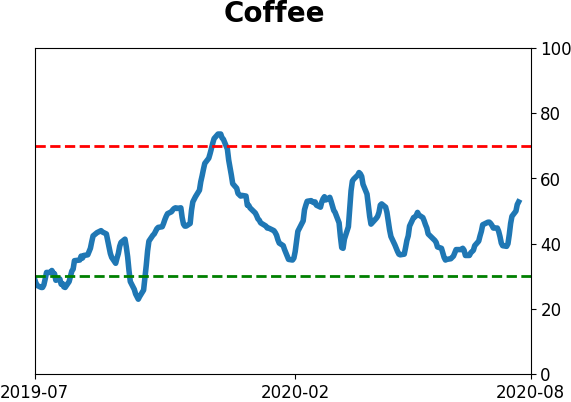
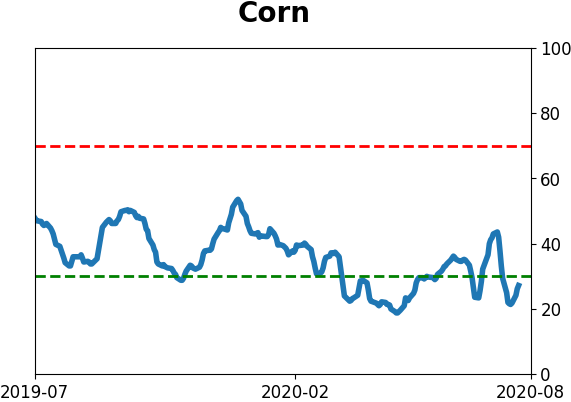
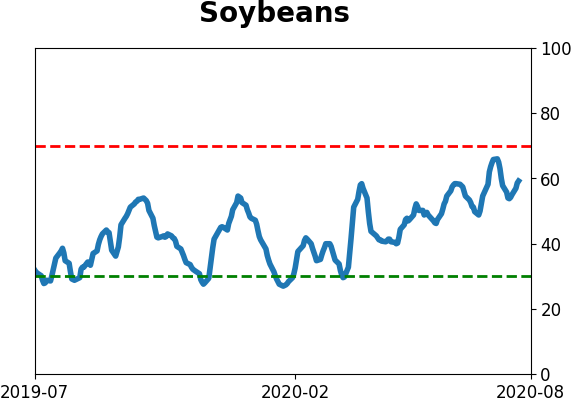
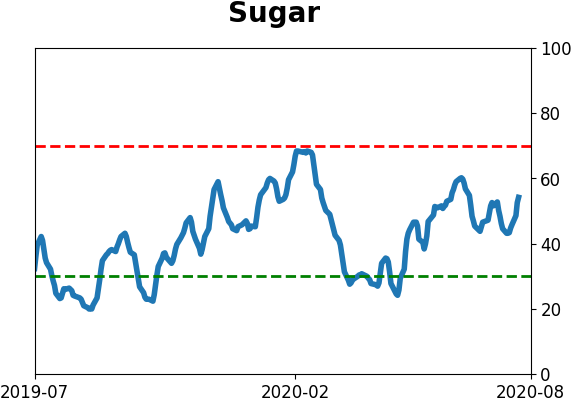
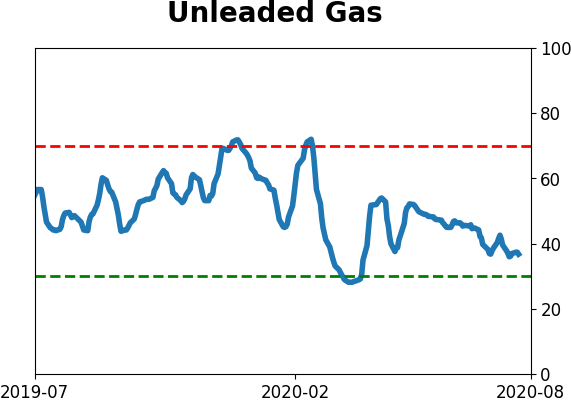
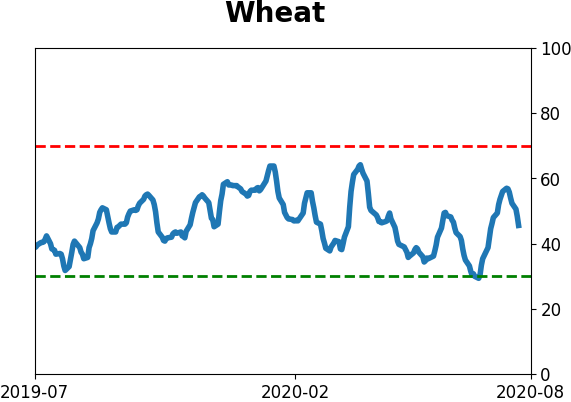
Agriculture
|
|
Research
BOTTOM LINE
Over the past three months, investors have pulled record or near-record assets from domestic and overseas equity funds. At the same time, they've shoveled a record amount into bond funds.
FORECAST / TIMEFRAME
None
|
There are enough signs of optimism and speculative activity that Dumb Money Confidence is tickling one of its highest levels in 20 years.
That doesn't mean everything agrees, as we saw on Wednesday. As noted, another outlier among indicators is fund flows, which have been suppressed for months on end.
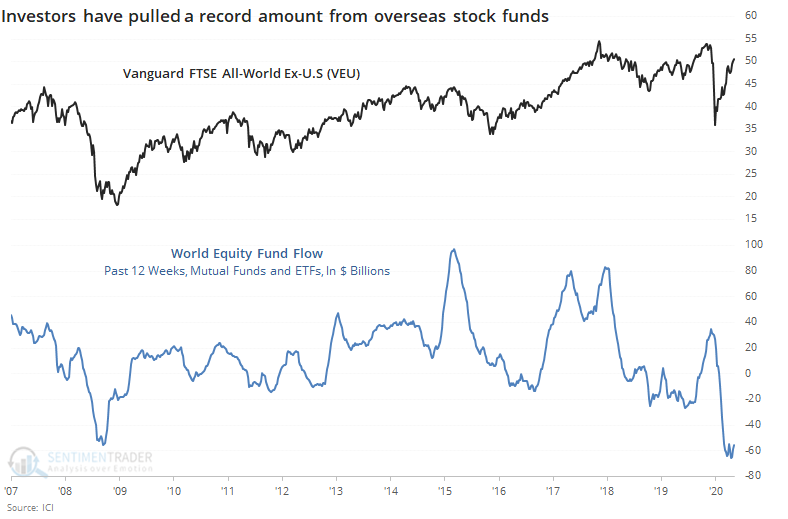
Over the past 12 weeks, investors have yanked more than $80 billion from domestic equity mutual funds and ETFs, a bout of pessimism that was only (barely) eclipsed in 2008.
Among overseas funds, the outflow has never been greater over such a compressed time frame. Fund flows have worked as a contrary indicator with these stocks better than other assets or geographies, as we discussed in May. It's curious that despite the gains in these stocks, outflows have been even more consistent than in domestic funds.
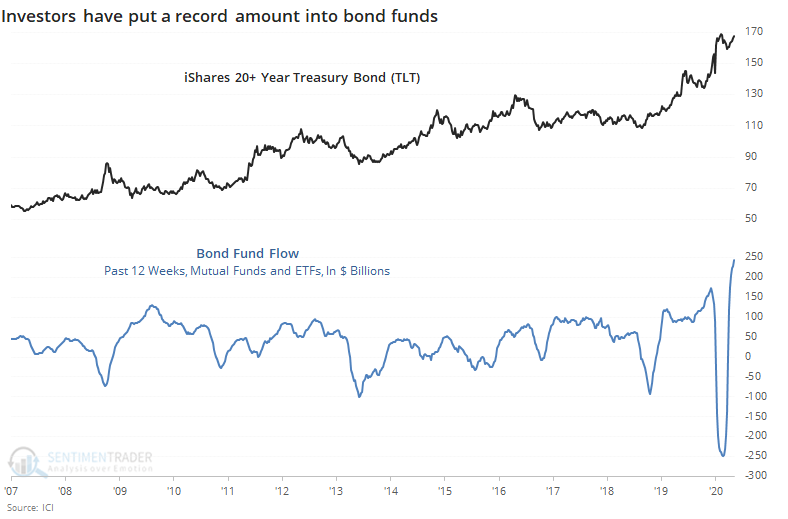
Where did all the money go? Bonds, partially. They've sucked in nearly $250 billion in assets in just three months. That has erased the pandemic-fueled outflow.
Typically, a rush of funds out of stocks and into bonds would be a reliable contrary indicator, suggesting stocks should outperform bonds going forward. It pretty much was, until the last year.
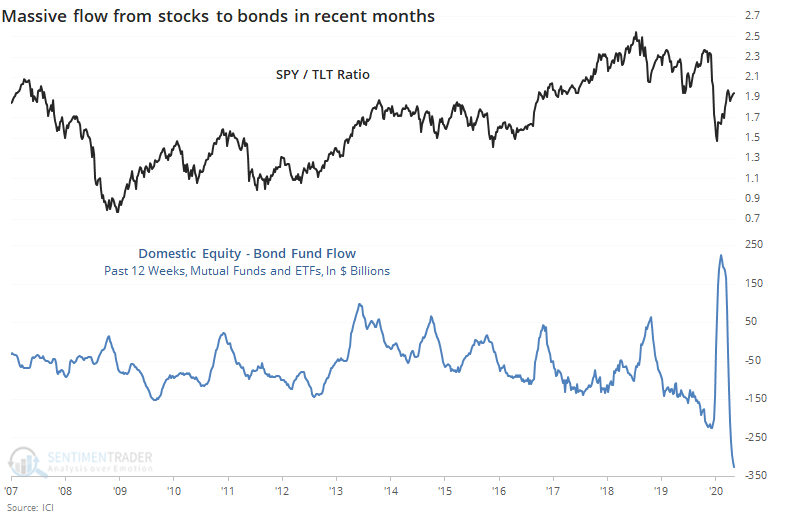
Fund flows have become very wonky since 2019, for unclear reasons. They've mostly decoupled from historical behavior, and that makes it harder to rely on them as a measure of sentiment. As much as we can rely on them, flows would suggest a modest positive for stocks (especially overseas) and negative for bonds in the months ahead.
BOTTOM LINE
The Nasdaq Composite has been positive on more than 62% of the sessions so far in 2020. That ranks among the most consistently positive years in its history. Forward returns after other largely positive years tended to flatten out when looking over the next few months.
FORECAST / TIMEFRAME
None
|
This has been a heck of a year for, well, pretty much everyone. Investors haven't been left out of the drama.
After the fastest-ever bear market and biggest-ever rebound, most of the broad equity indexes are back near their former highs. Those with a healthy smattering of tech stocks have done even better, of course.
Bloomberg reporter Sarah Ponczek noted that more than 62% of all trading days in 2020 have seen a gain, per JonesTrading. Through this many days in the year, this is the 2nd-largest percentage of positive sessions in 25 years.
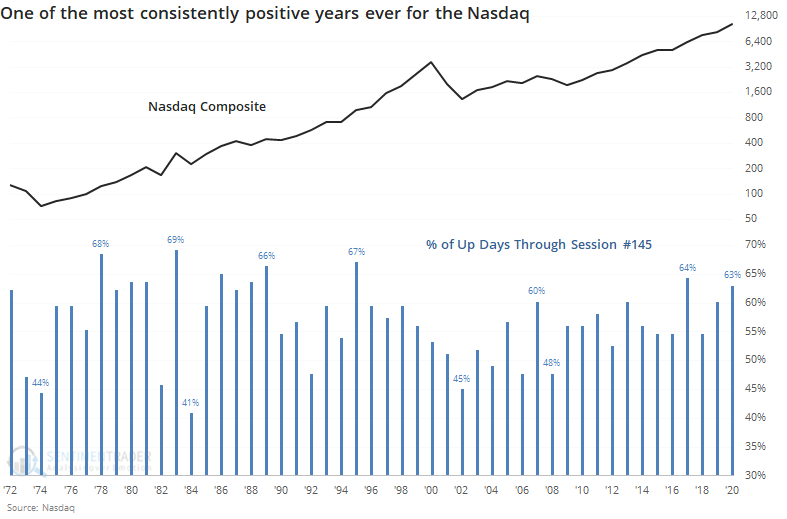
The biggest question is, "so what?" and the answer is "not much." Below, we can see the Nasdaq's forward returns after the largest percentages of up sessions through this point of the year.
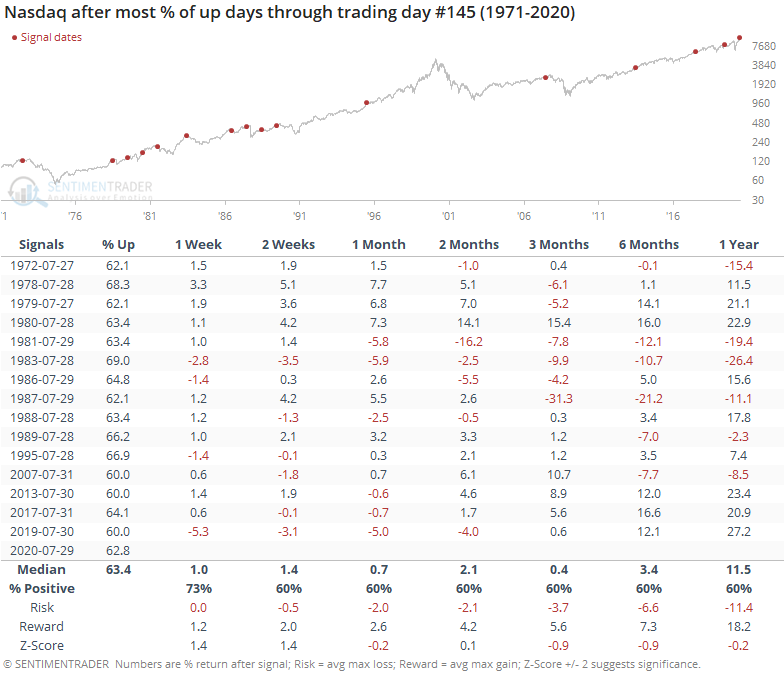
Short-term returns were decent as the Nasdaq continued to drive higher into early August. After that, it petered out and by three months later, barely showed a positive median return. Its return was below average from three months and beyond, with a poor risk/reward ratio.
We can contrast that to its returns during the years with the smallest percentages of up sessions.
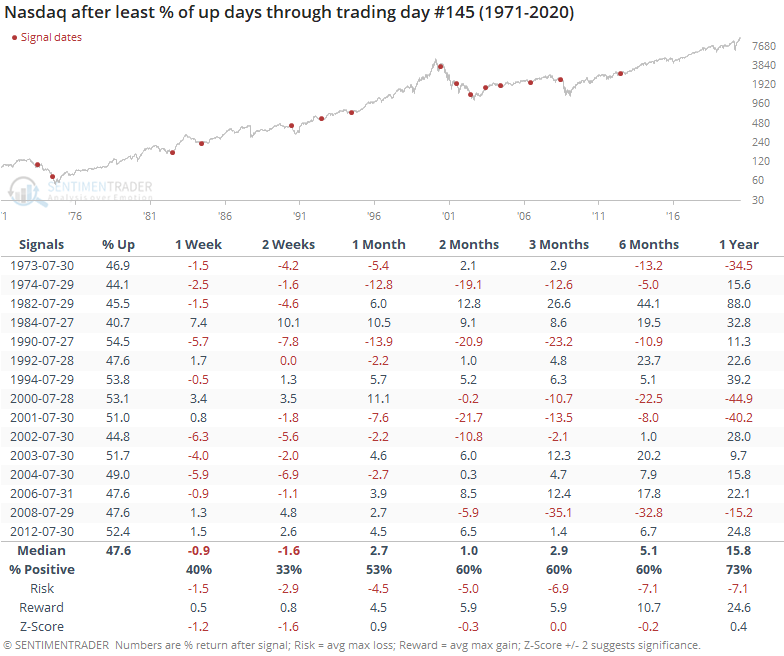
During these years, the Nasdaq's short-term returns were significantly worse than during the good years, but its medium- to long-term returns were a bit better.
Momentum is a tricky thing, which is why we look at it from so many angles. Nothing can defeat sentiment extremes like momentum. While the Nasdaq is certainly showing a good amount of it, when we combine it with seasonality, it's not necessarily a reason to think that it can roll right over displays of excessive optimism at this point.
Active Studies
| Time Frame | Bullish | Bearish | | Short-Term | 0 | 1 | | Medium-Term | 8 | 11 | | Long-Term | 45 | 1 |
|
Indicators at Extremes
Portfolio
| Position | Weight % | Added / Reduced | Date | | Stocks | 29.8 | Reduced 9.1% | 2020-06-11 | | Bonds | 0.0 | Reduced 6.7% | 2020-02-28 | | Commodities | 5.2 | Added 2.4%
| 2020-02-28 | | Precious Metals | 0.0 | Reduced 3.6% | 2020-02-28 | | Special Situations | 0.0 | Reduced 31.9% | 2020-03-17 | | Cash | 65.0 | | |
|
Updates (Changes made today are underlined)
After stocks bottomed on March 23rd, they enjoyed a historic buying thrust and retraced a larger amount of the decline than "just a bear market rally" tends to. Through June, there were signs of breadth thrusts, recoveries, and trend changes that have an almost unblemished record at preceding higher prices over a 6-12 month time frame. On a shorter-term basis, our indicators have been showing high optimism, with Dumb Money Confidence recently above 80%, along with signs of reckless speculation during what appears to be an unhealthy market environment, historically a bad combination. While there are certainly some outlier indicators that are showing apathy or even outright pessimism, a weight-of-the-evidence approach suggests high risk over a multi-week to multi-month time frame. I've been carrying a low (too low) level of exposure to stocks, as well as bonds and gold. I don't see a good opportunity to add to any of those currently, with poor prospects pretty much all the way around. As worried as I am over the medium-term, I would only grudgingly reduce my exposure even further, given the longer-term positives we spent so much time discussing in the spring.
RETURN YTD: -3.8% 2019: 12.6%, 2018: 0.6%, 2017: 3.8%, 2016: 17.1%, 2015: 9.2%, 2014: 14.5%, 2013: 2.2%, 2012: 10.8%, 2011: 16.5%, 2010: 15.3%, 2009: 23.9%, 2008: 16.2%, 2007: 7.8%
|
|
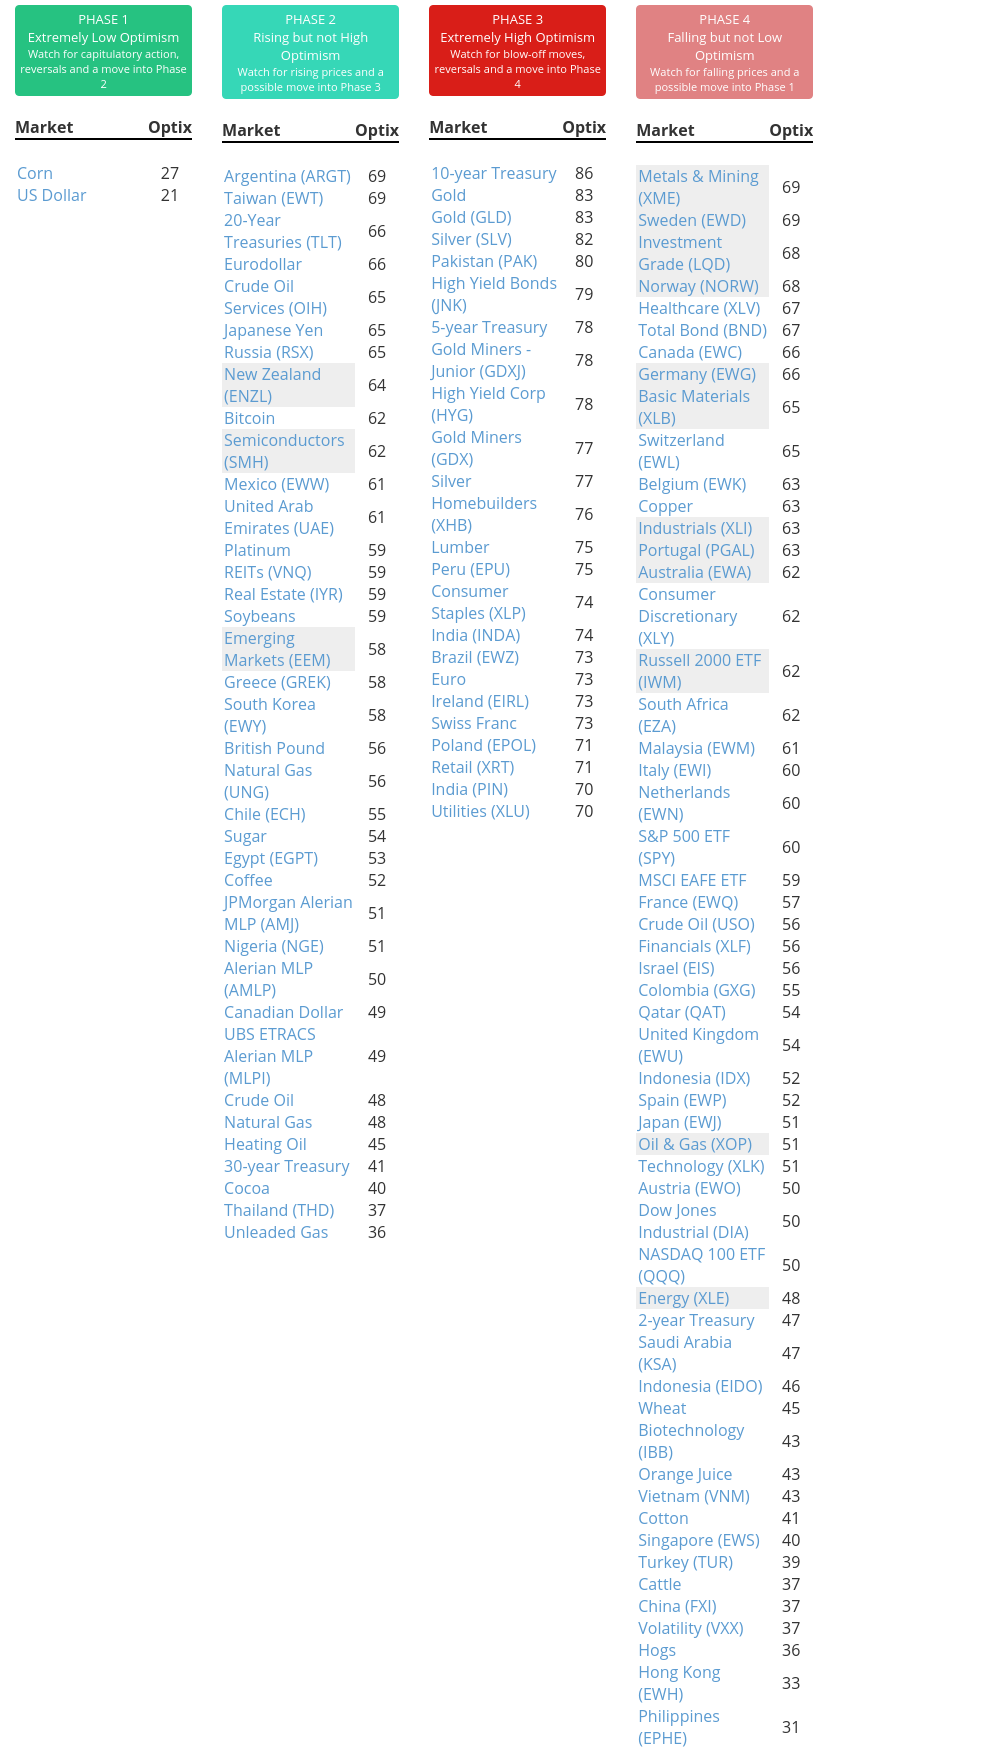
Phase Table
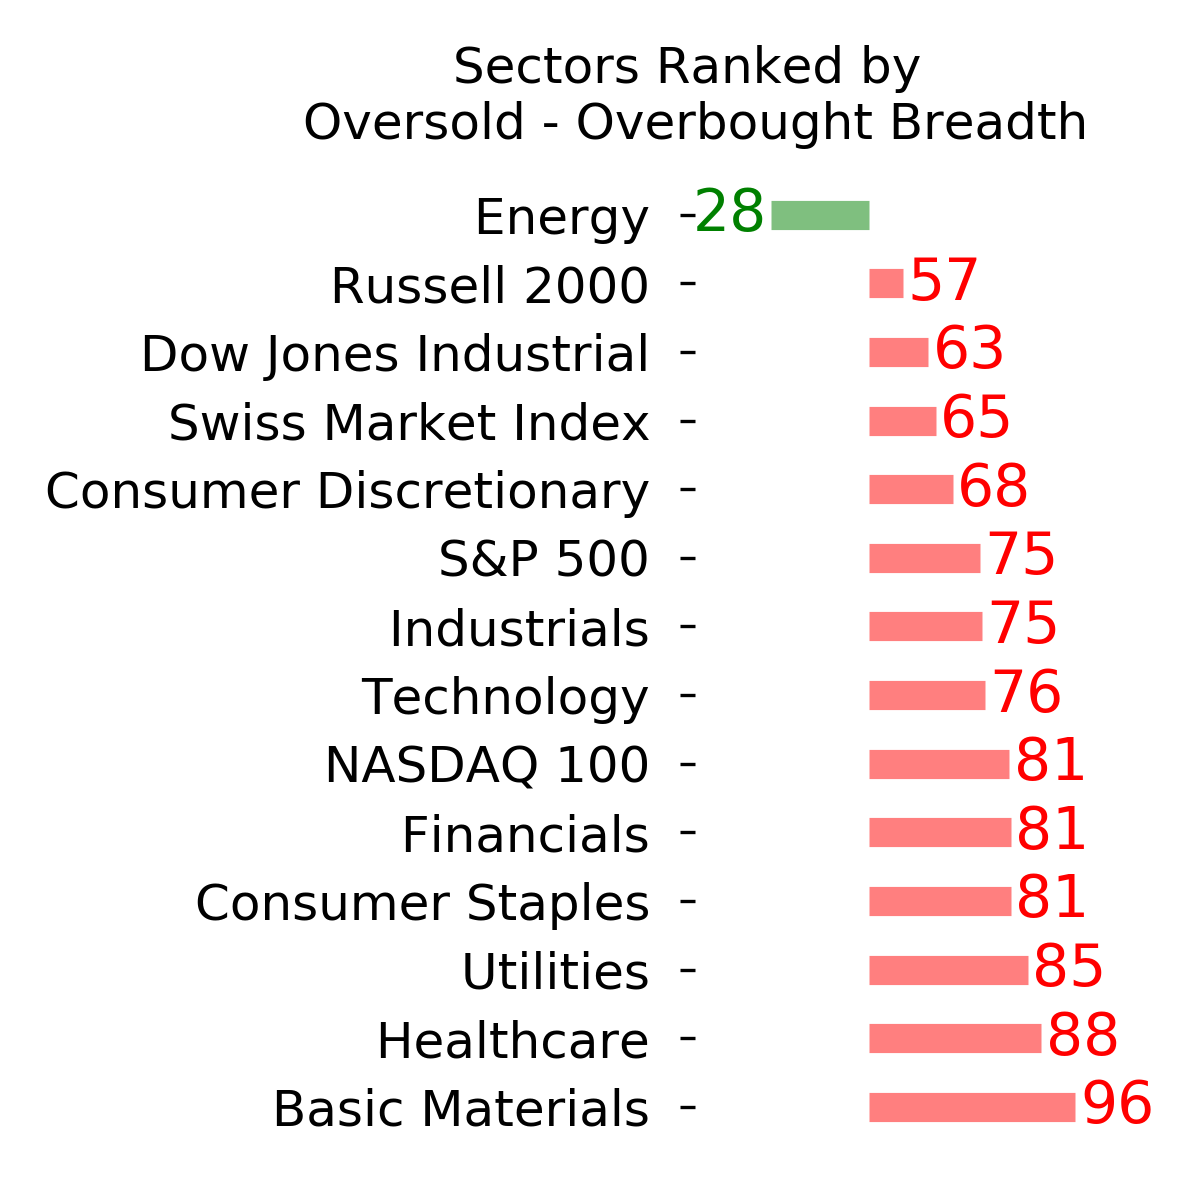
Ranks
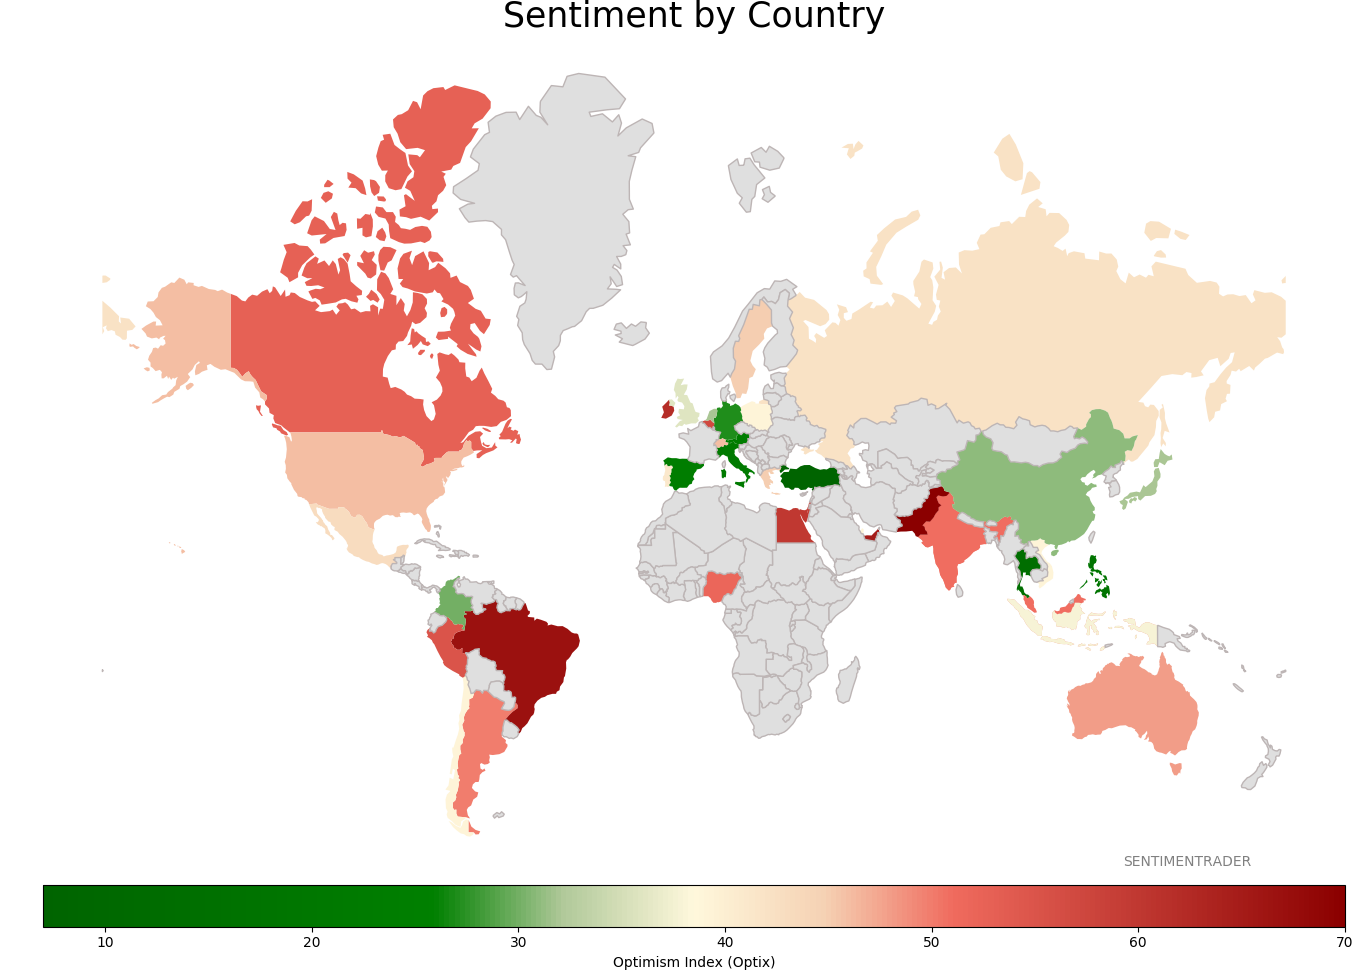
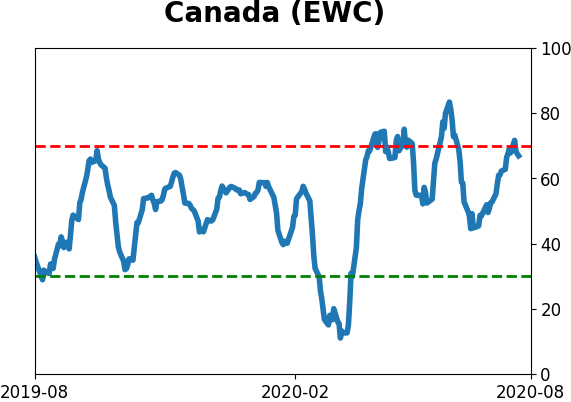
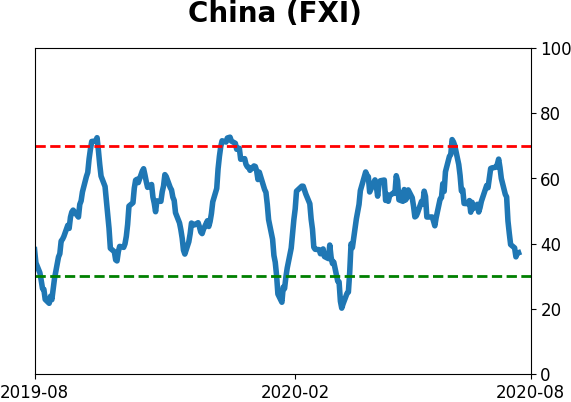
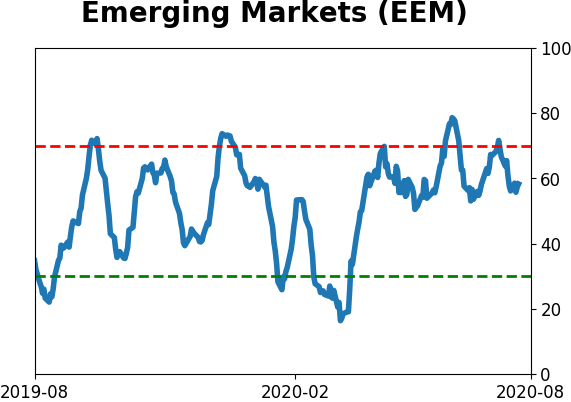
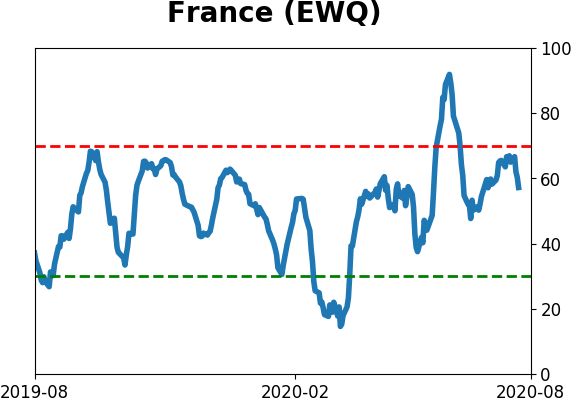
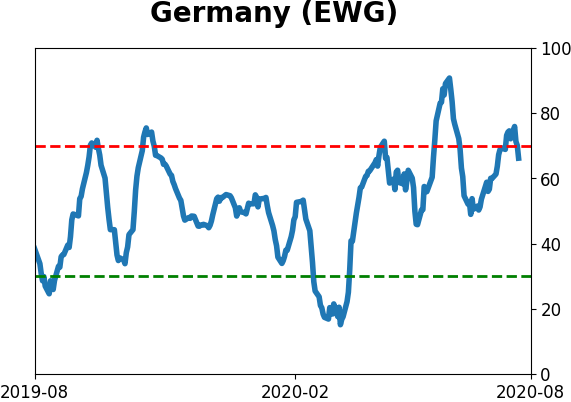
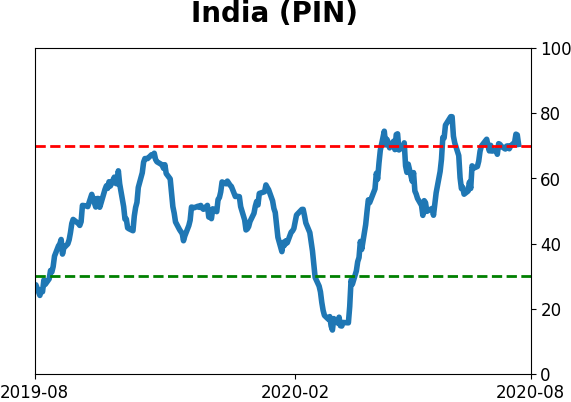
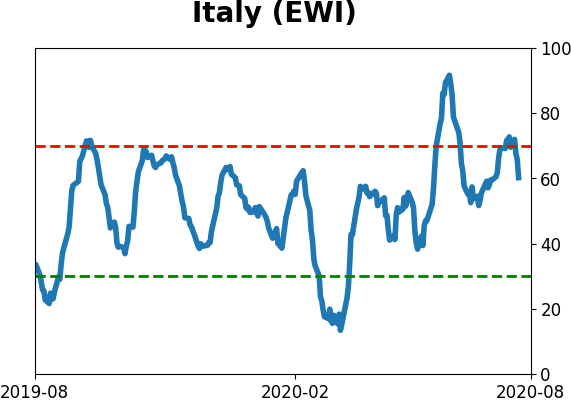
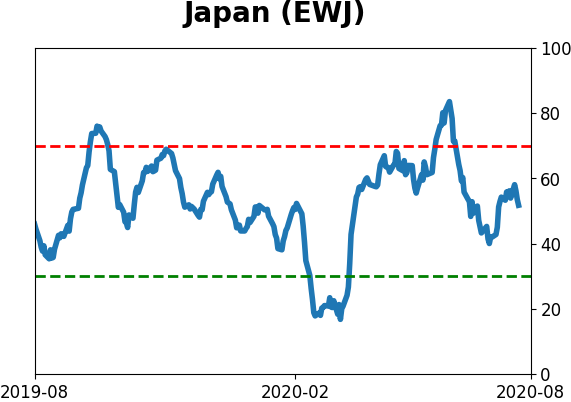
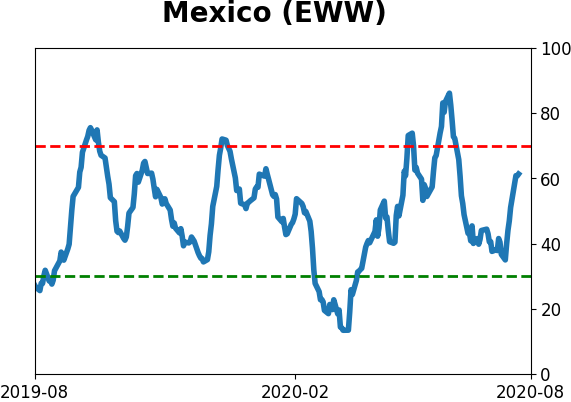
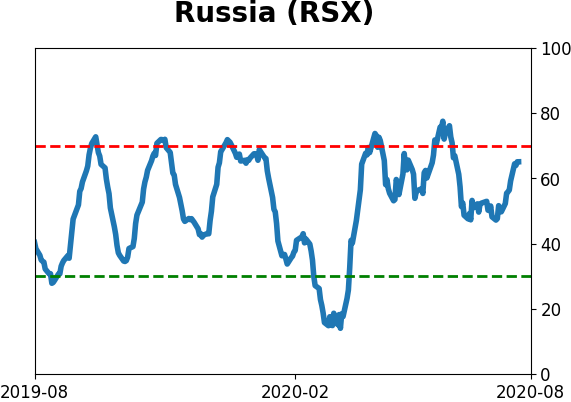
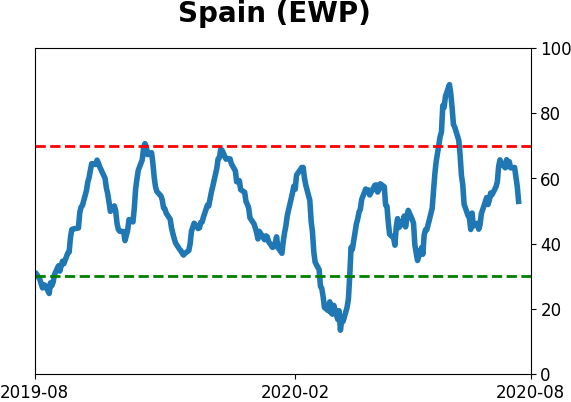
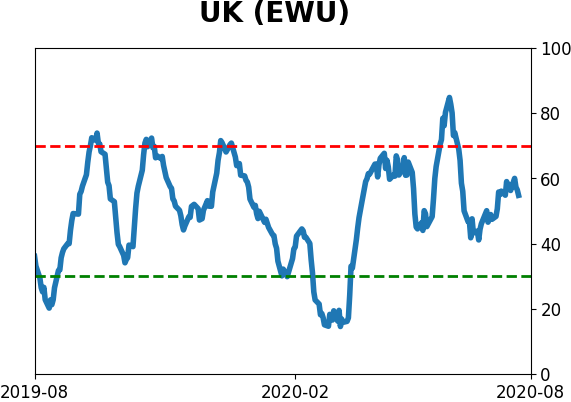
Sentiment Around The World
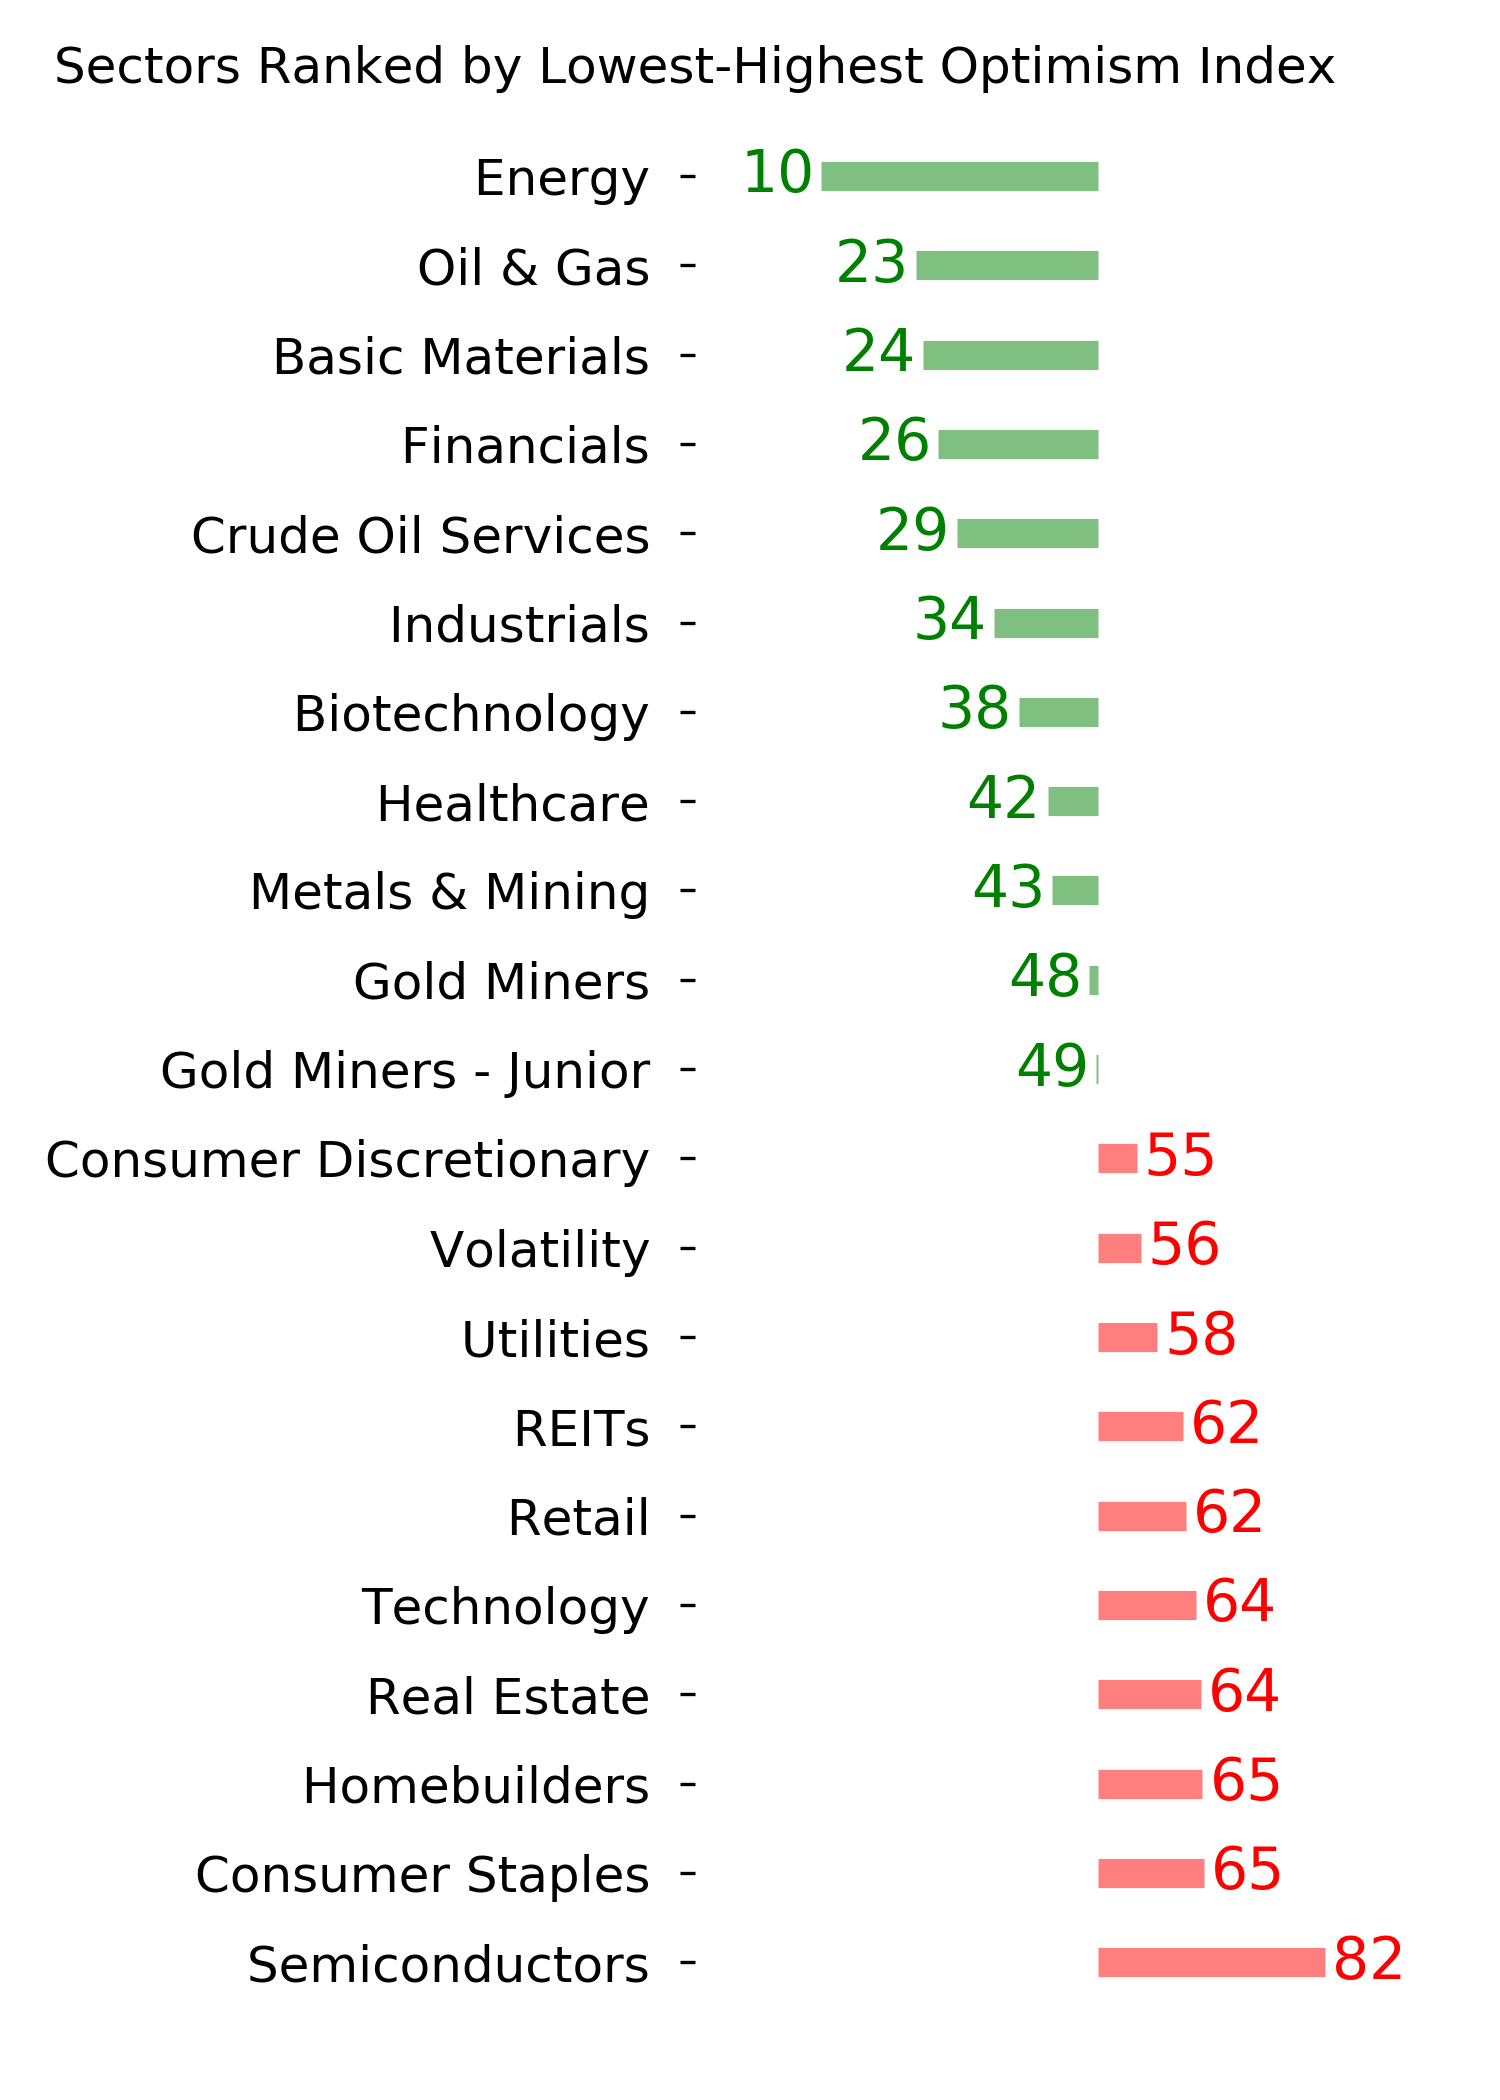
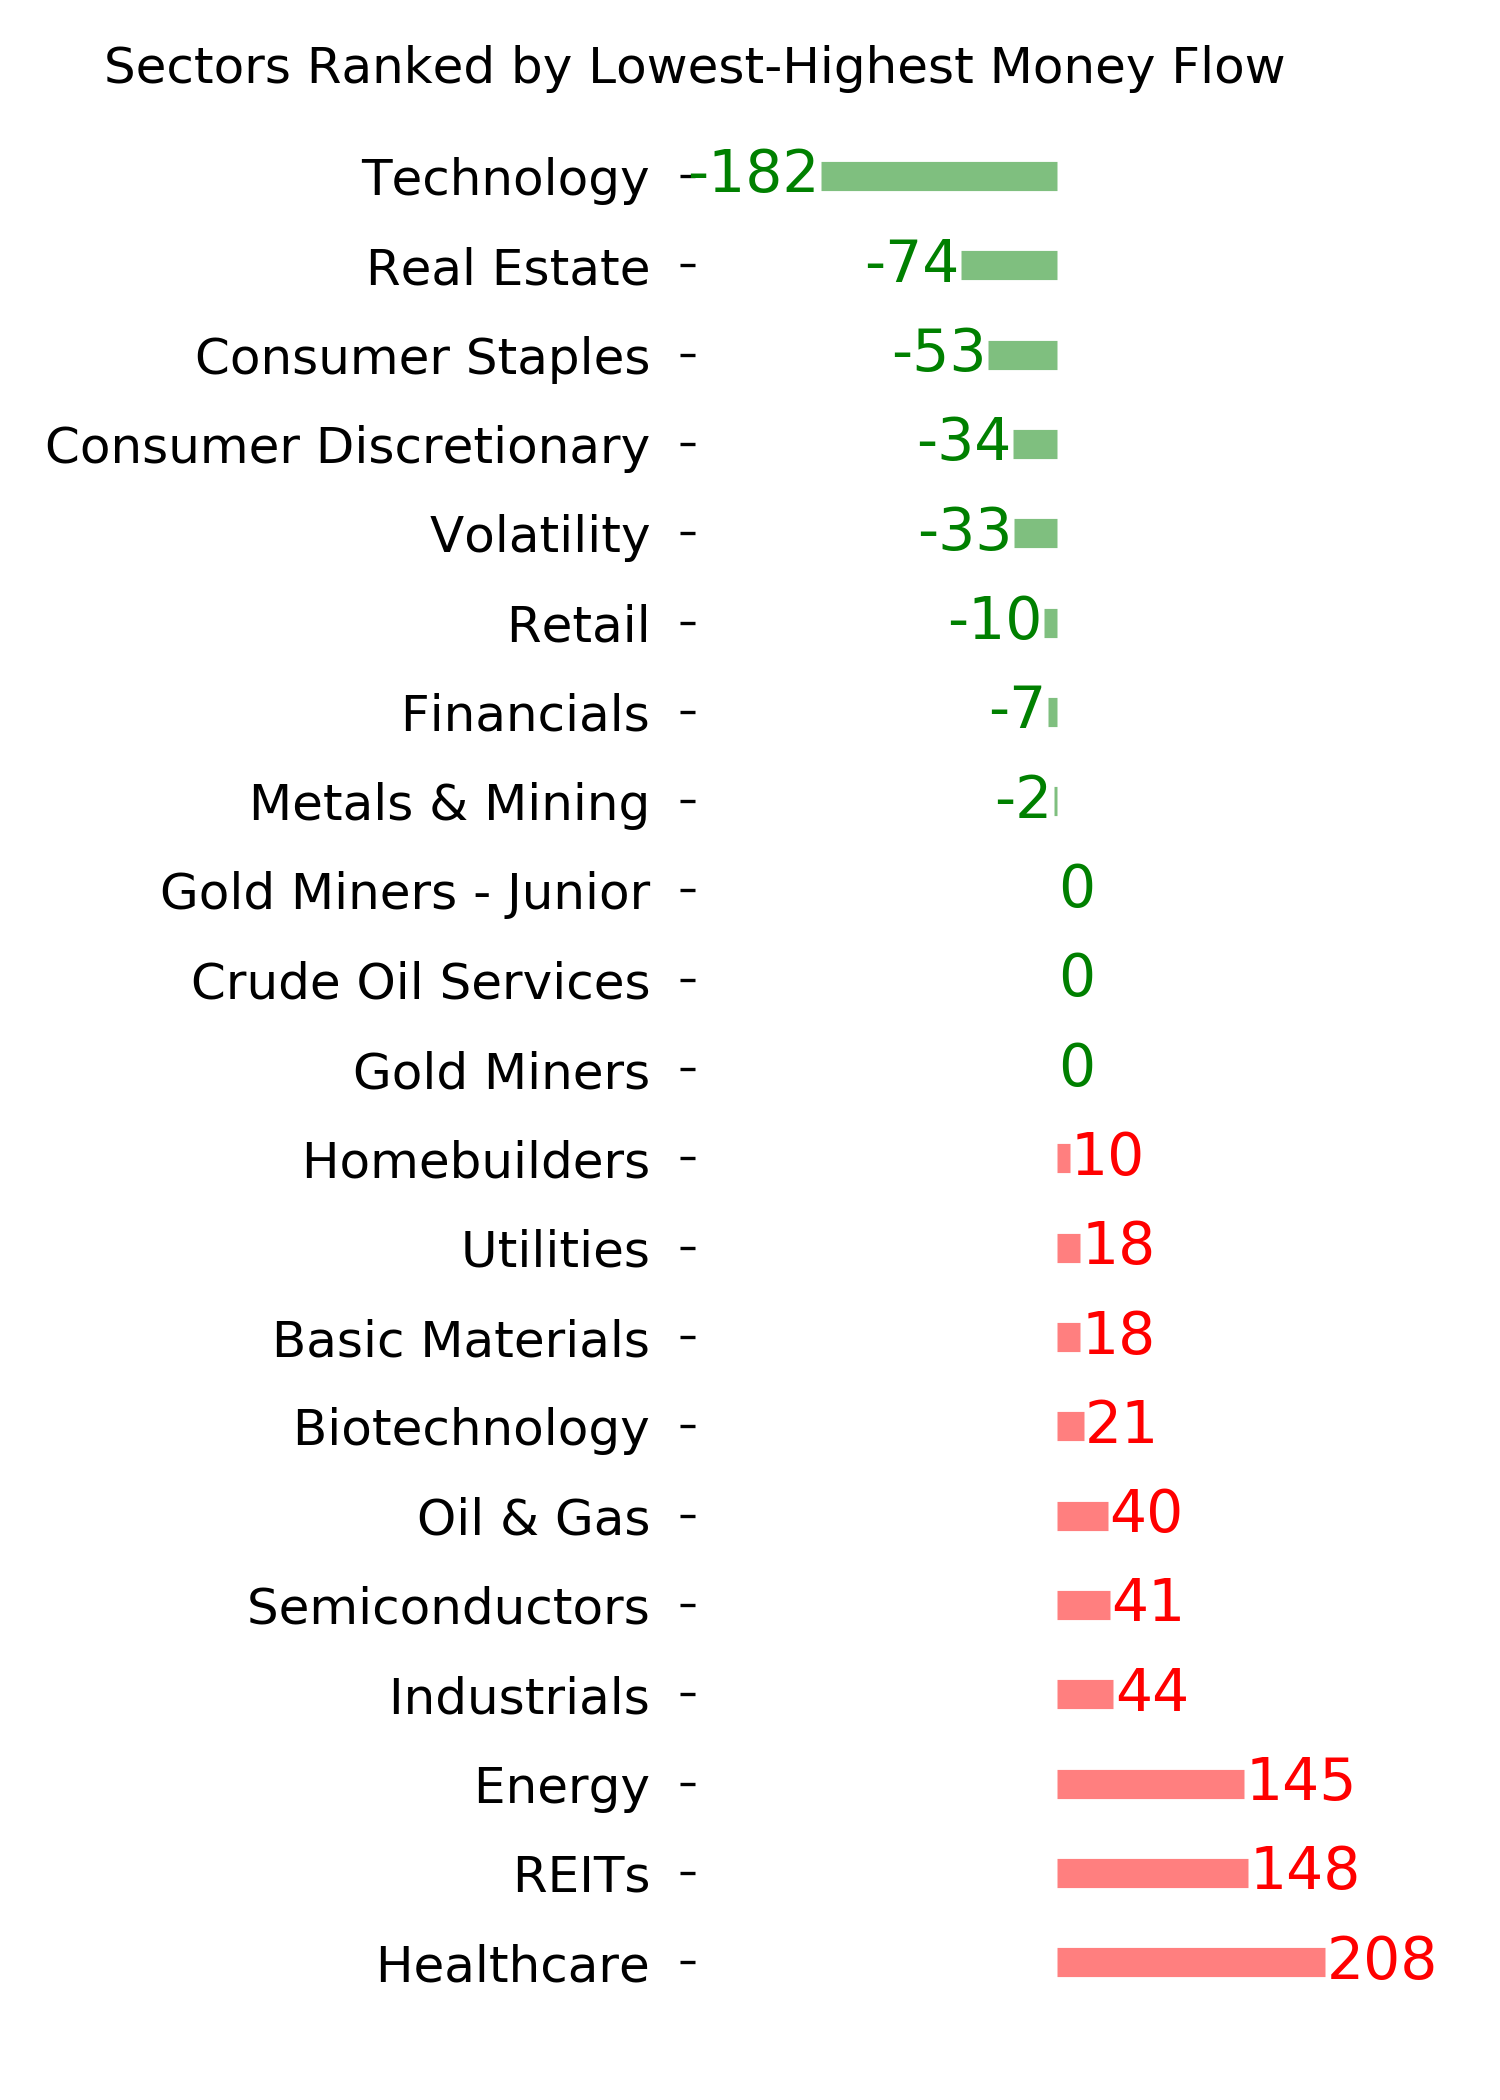
Optimism Index Thumbnails
|
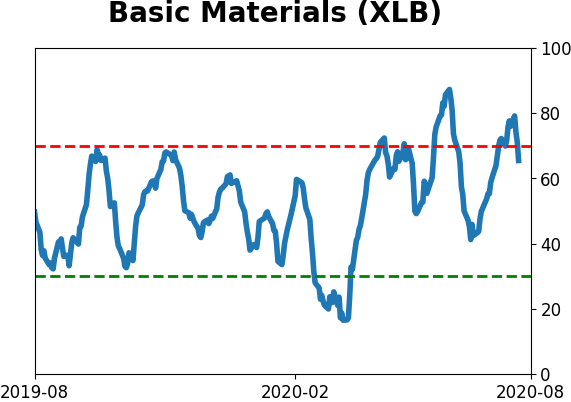
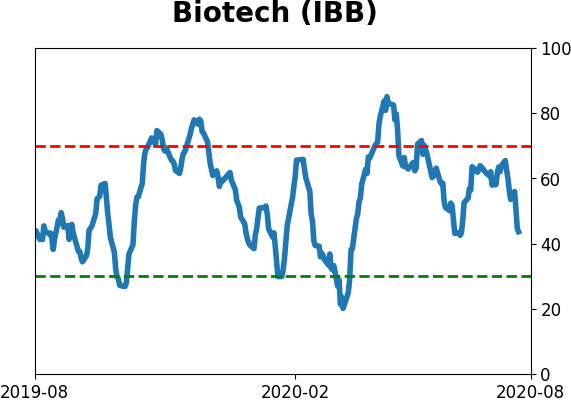
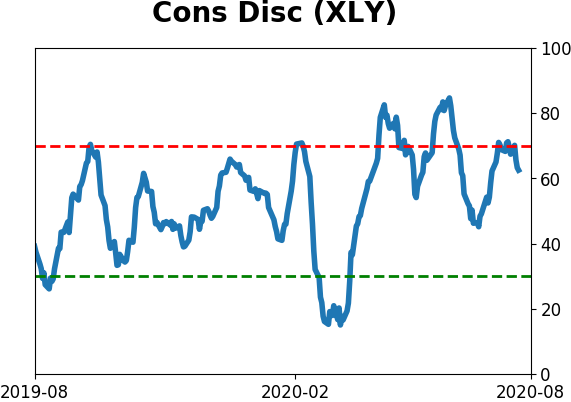
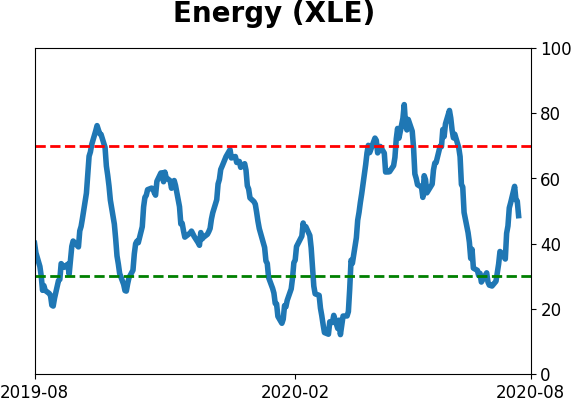
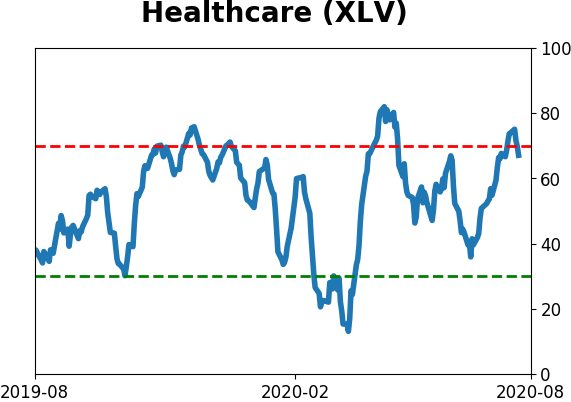
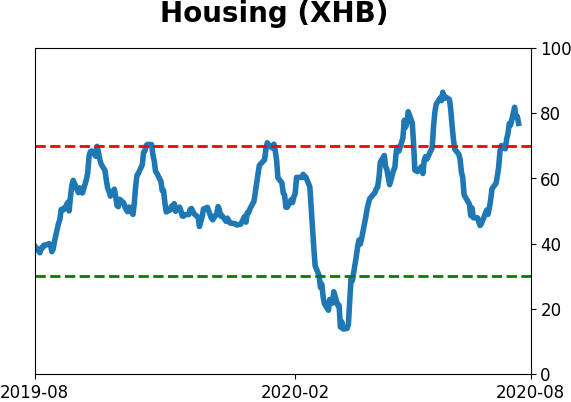
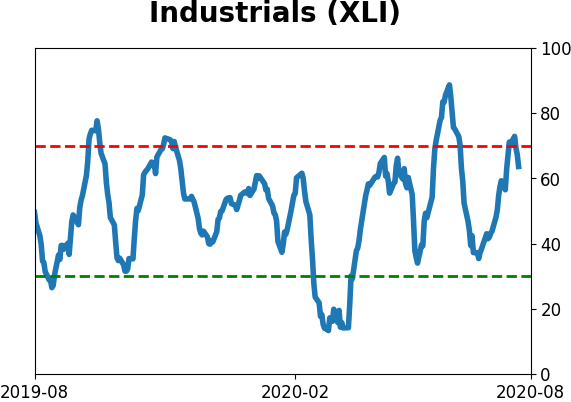
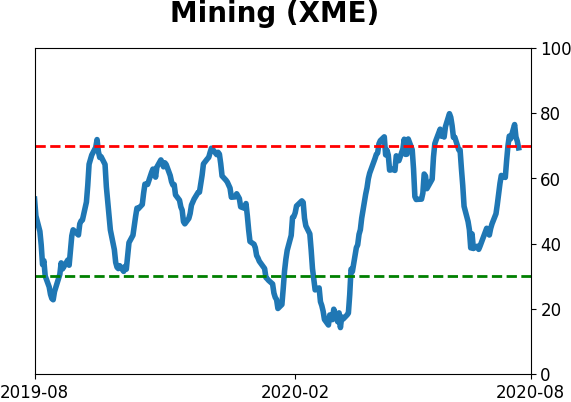
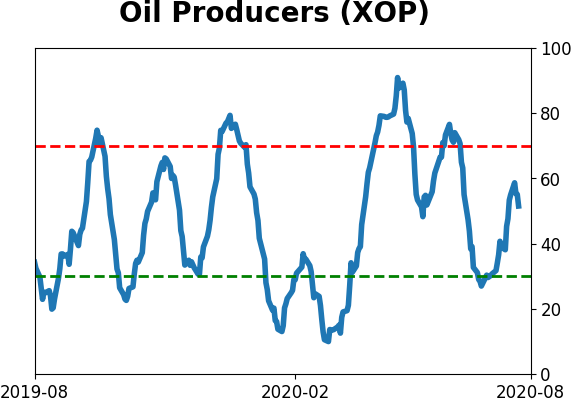
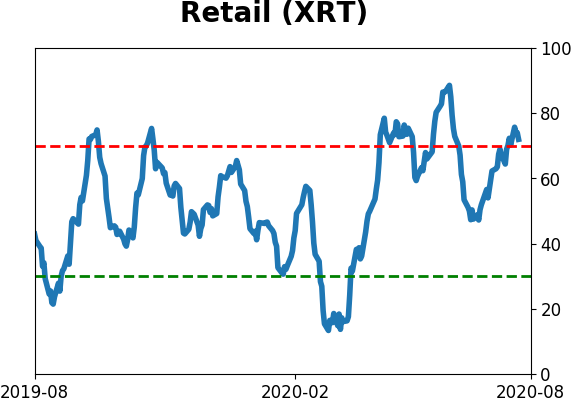
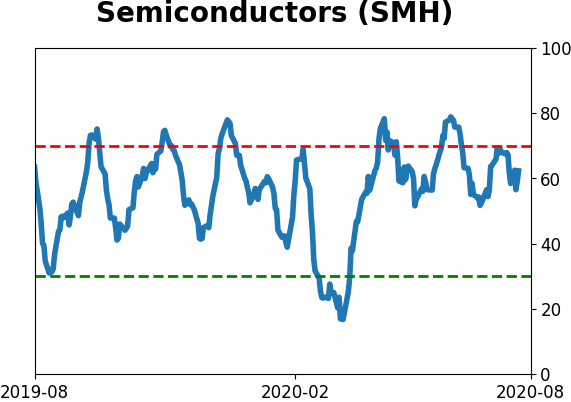
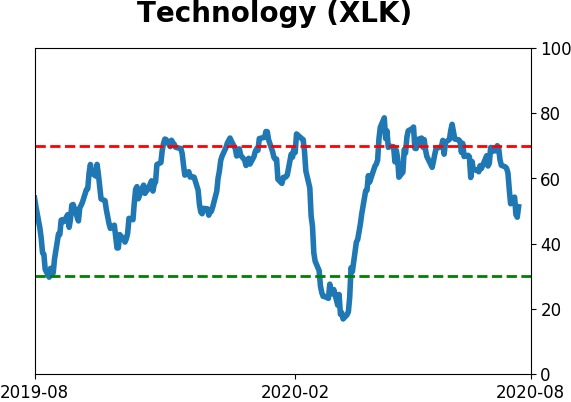
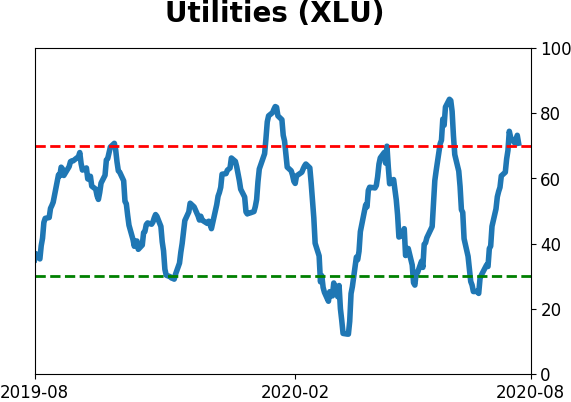
Sector ETF's - 10-Day Moving Average
|
|
|
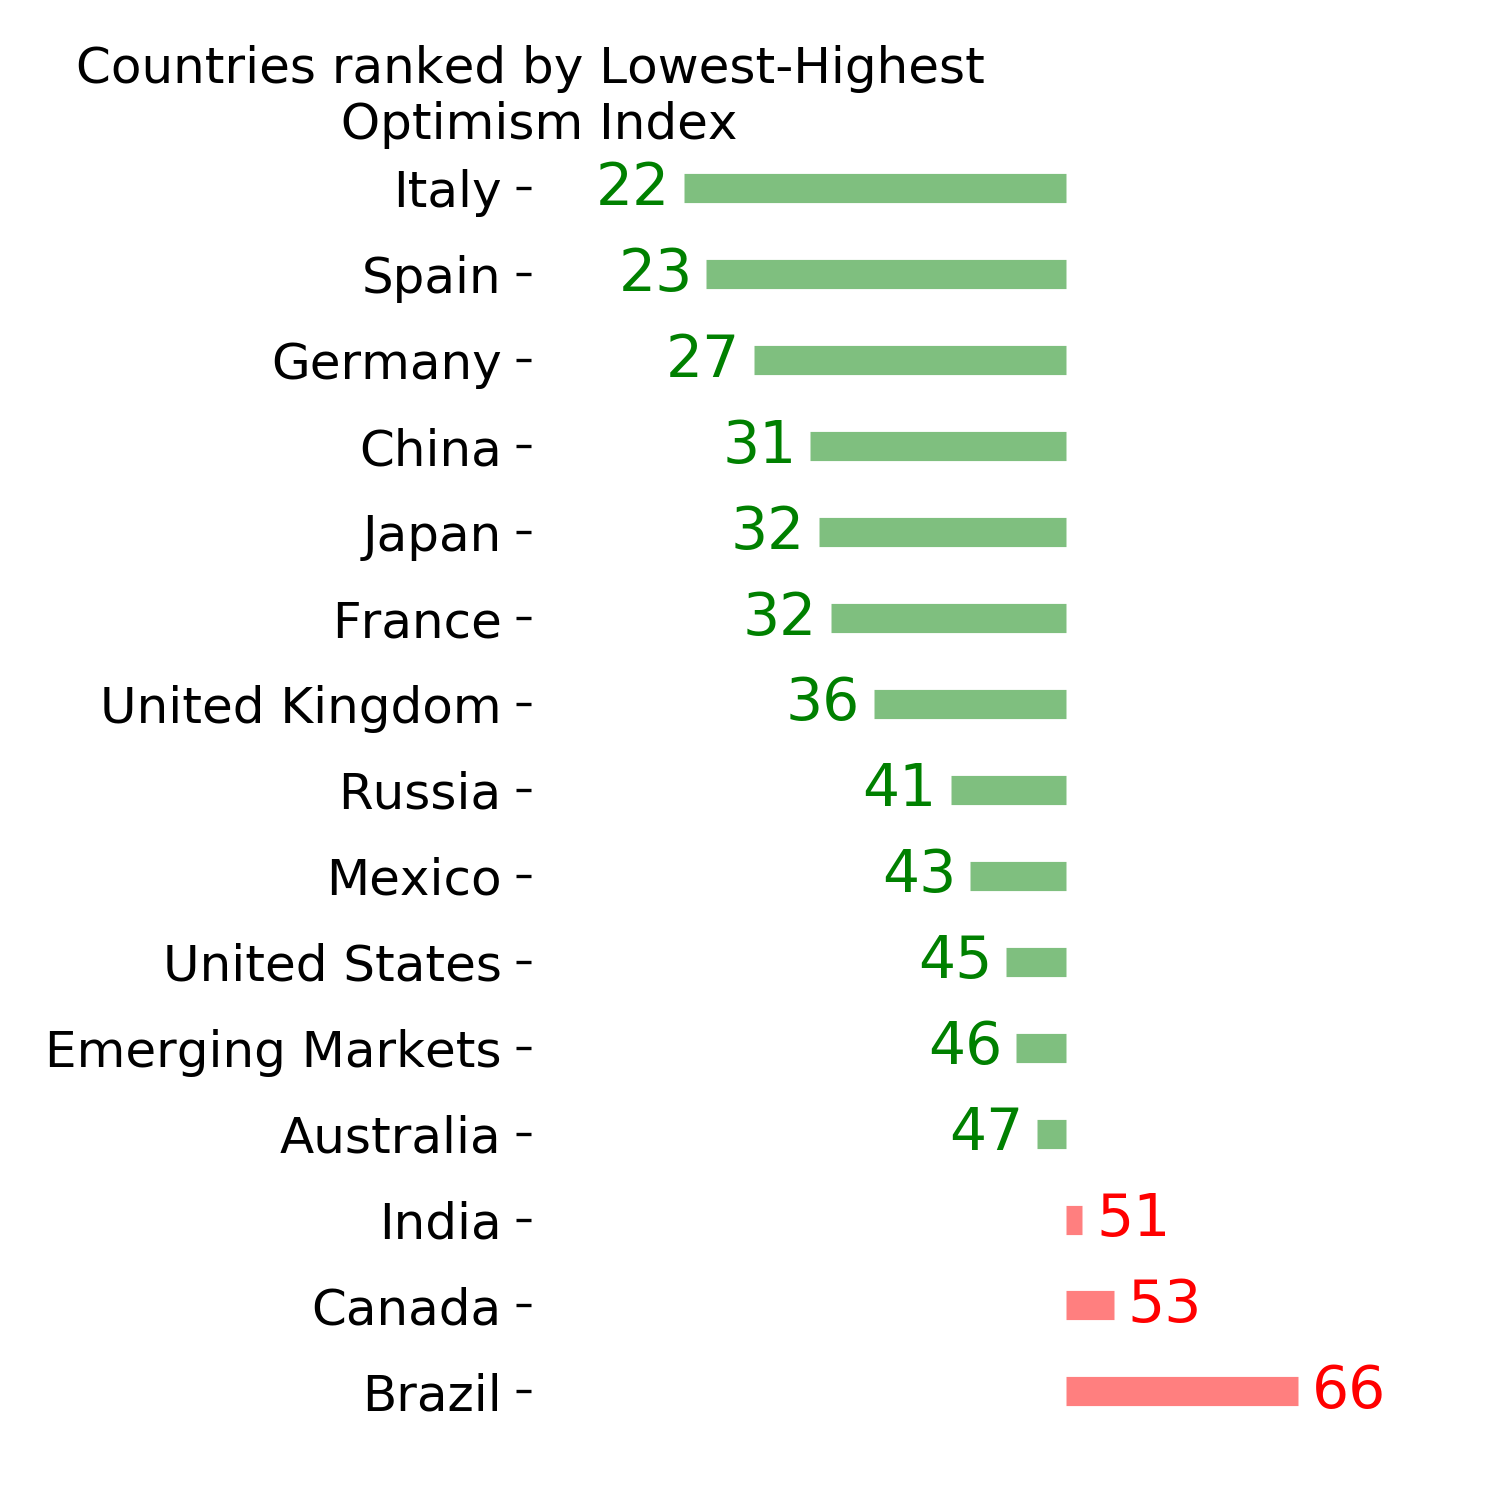
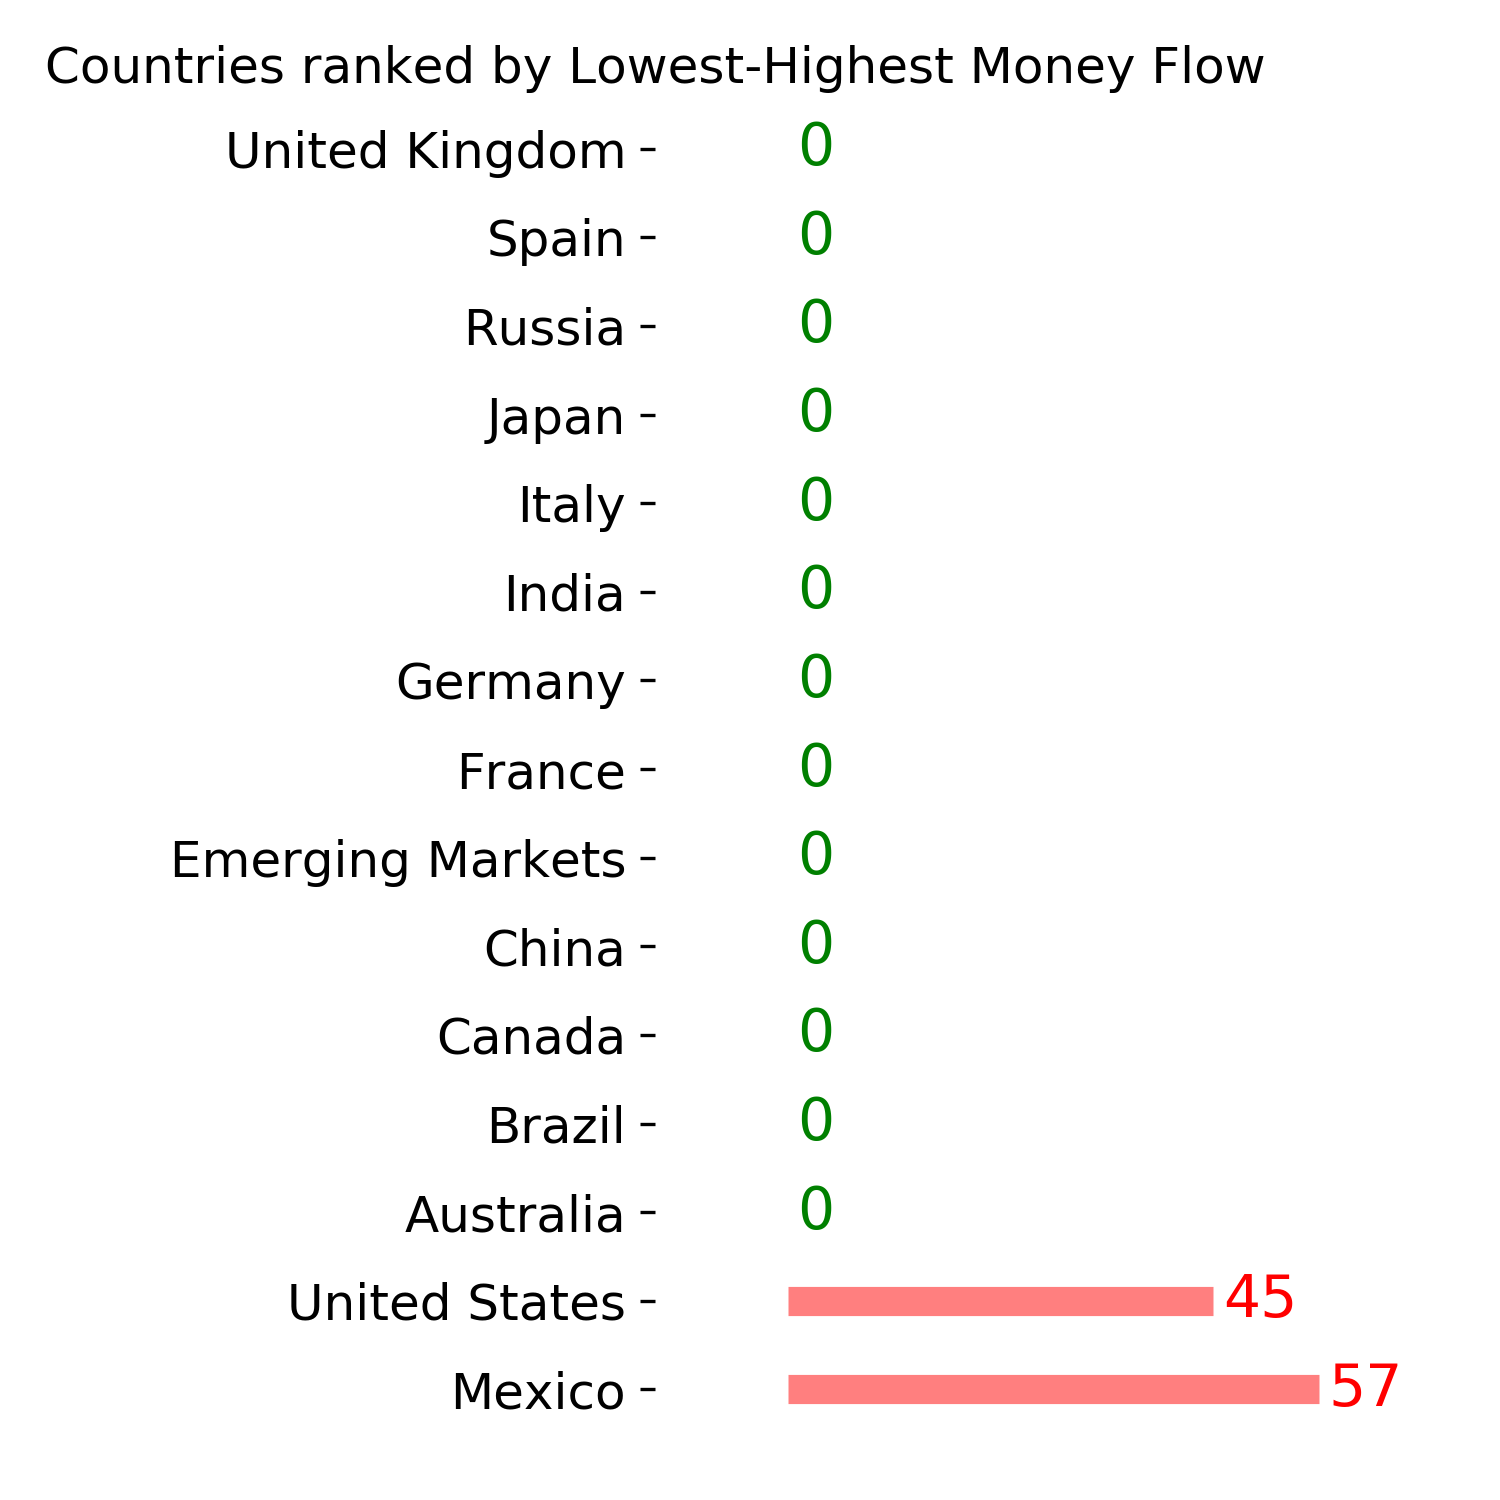
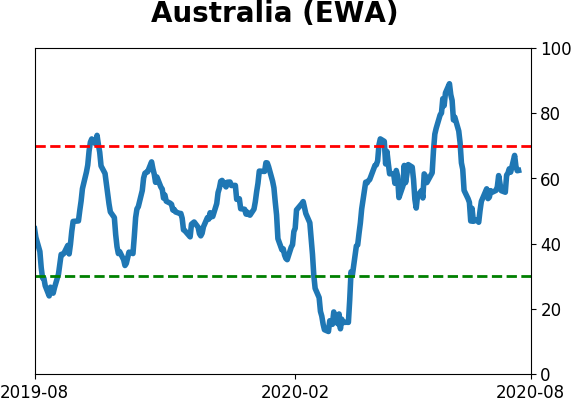
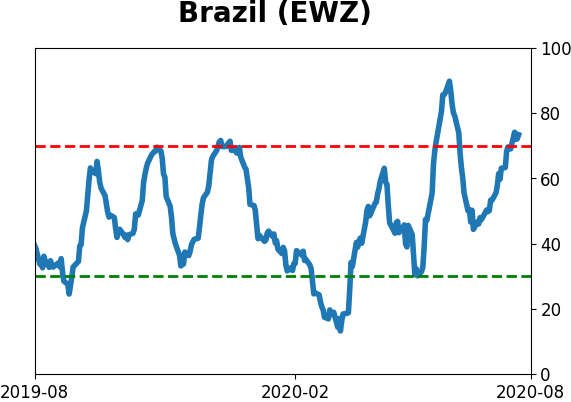
Country ETF's - 10-Day Moving Average
|
|
|
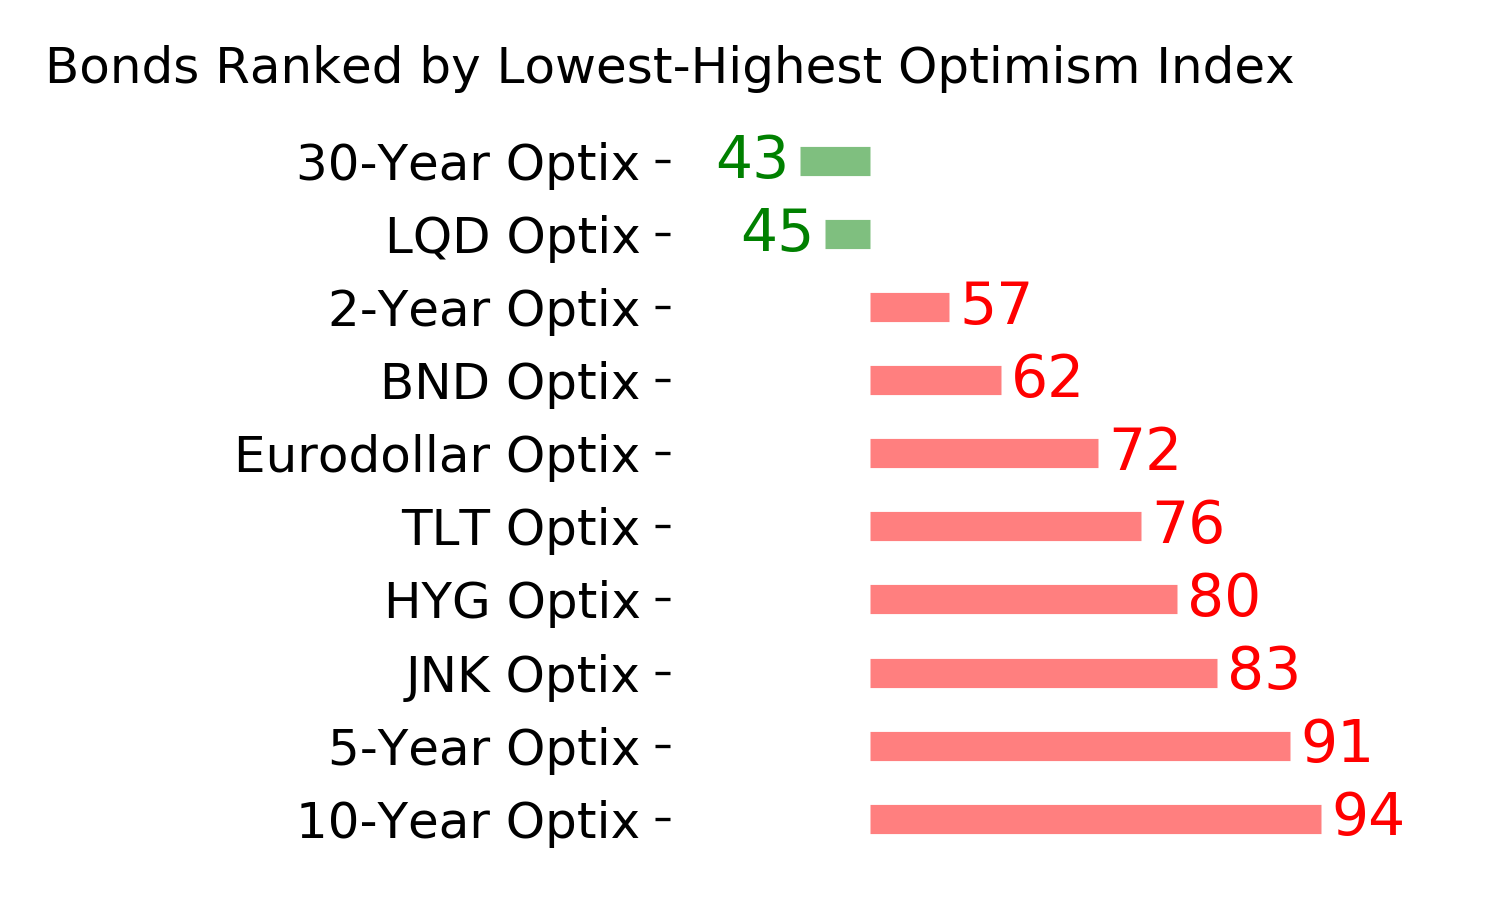
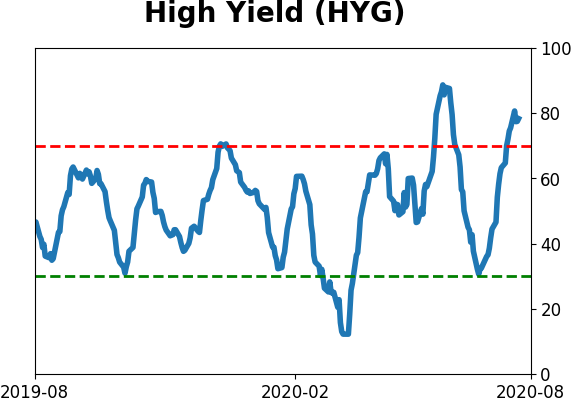
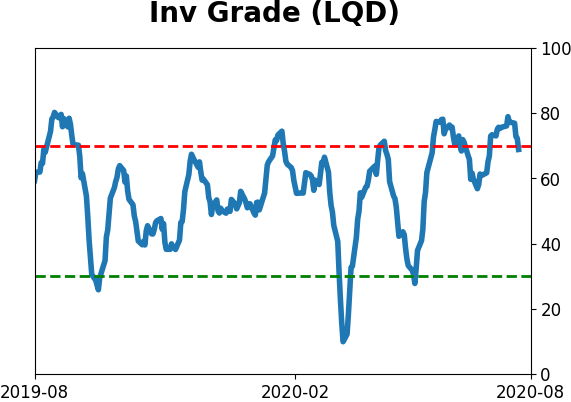
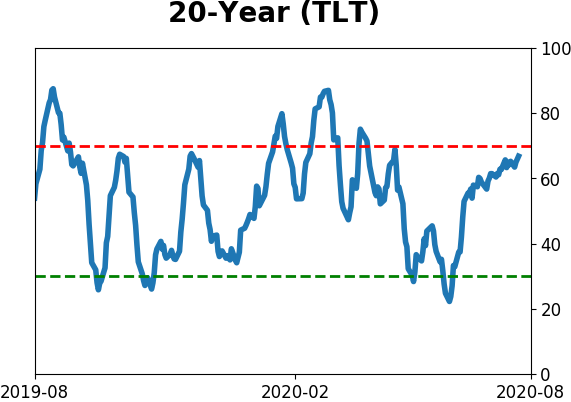
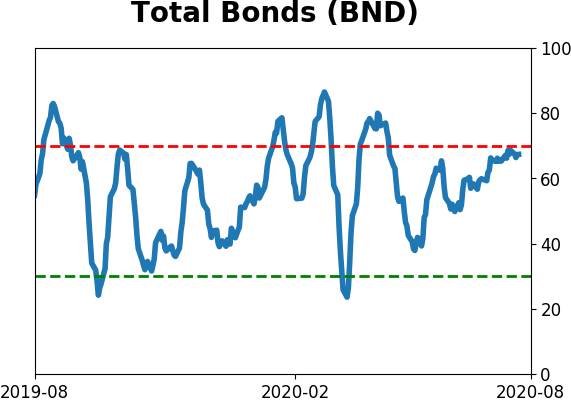
Bond ETF's - 10-Day Moving Average
|
|
|
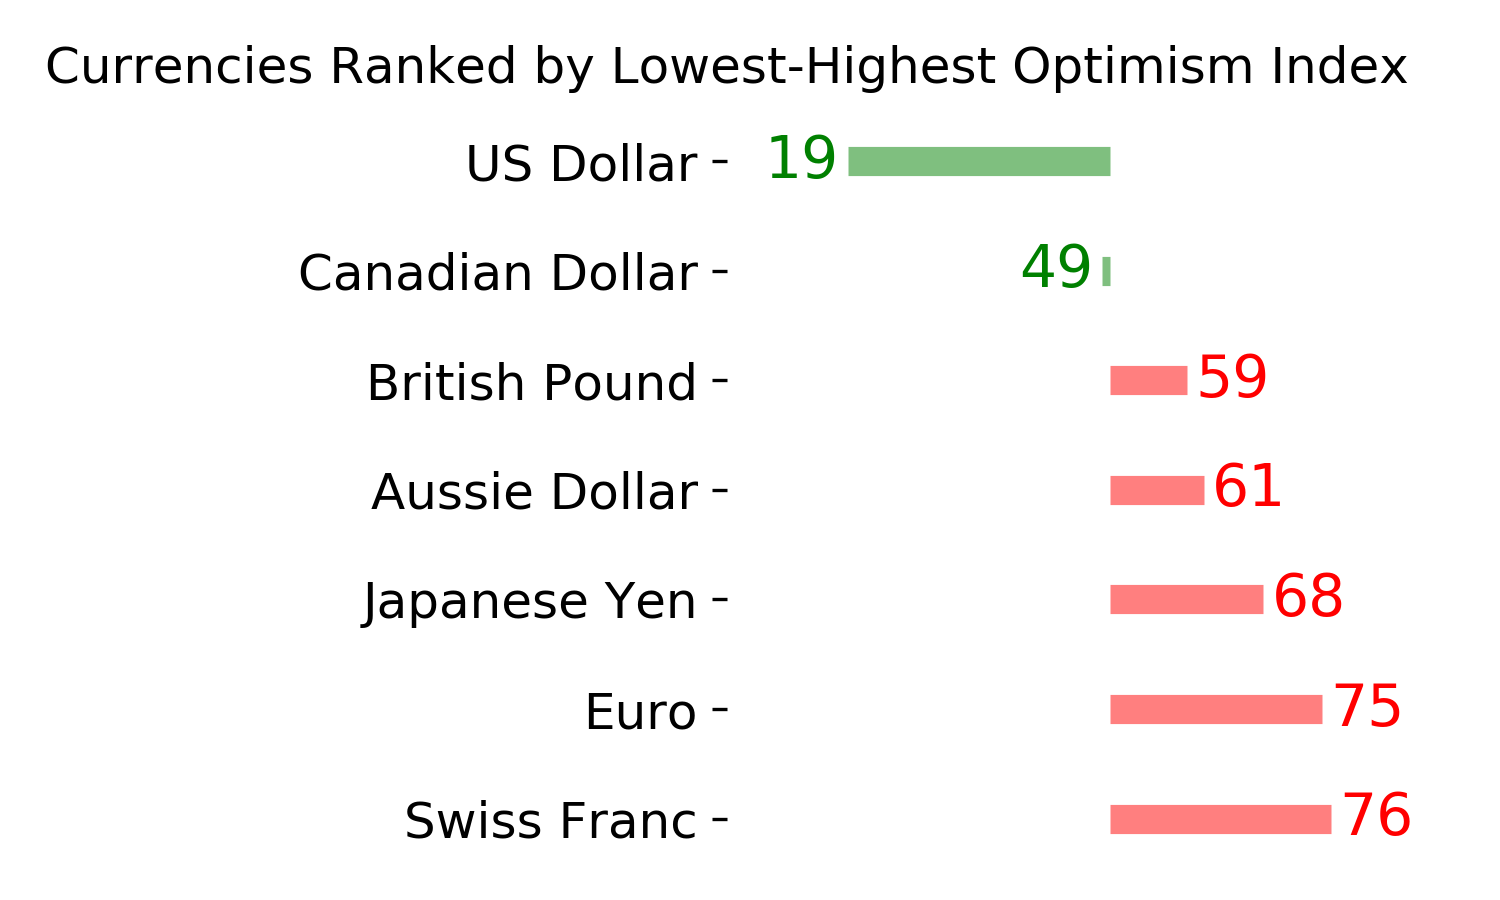
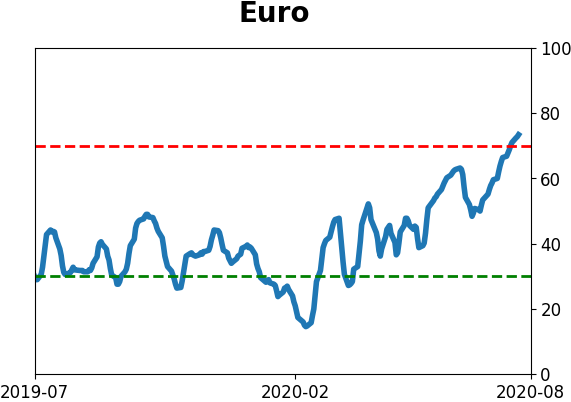
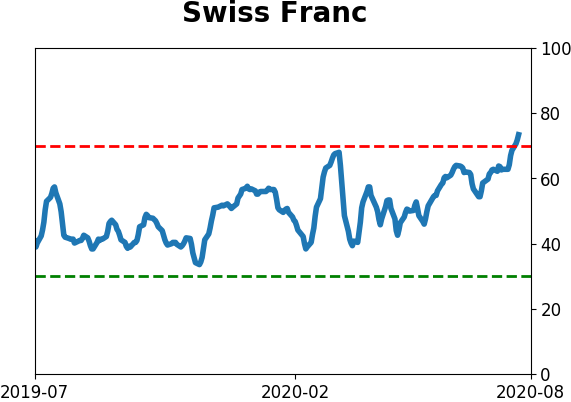
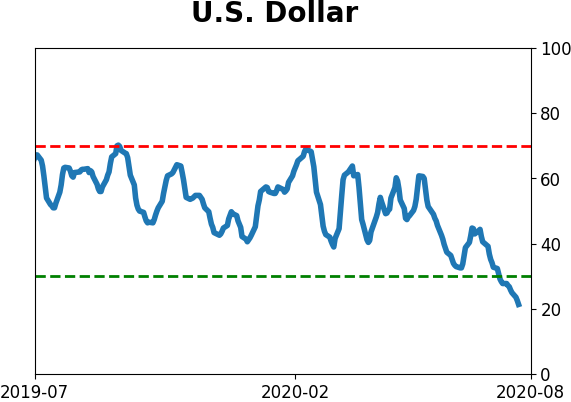
Currency ETF's - 5-Day Moving Average
|
|
|
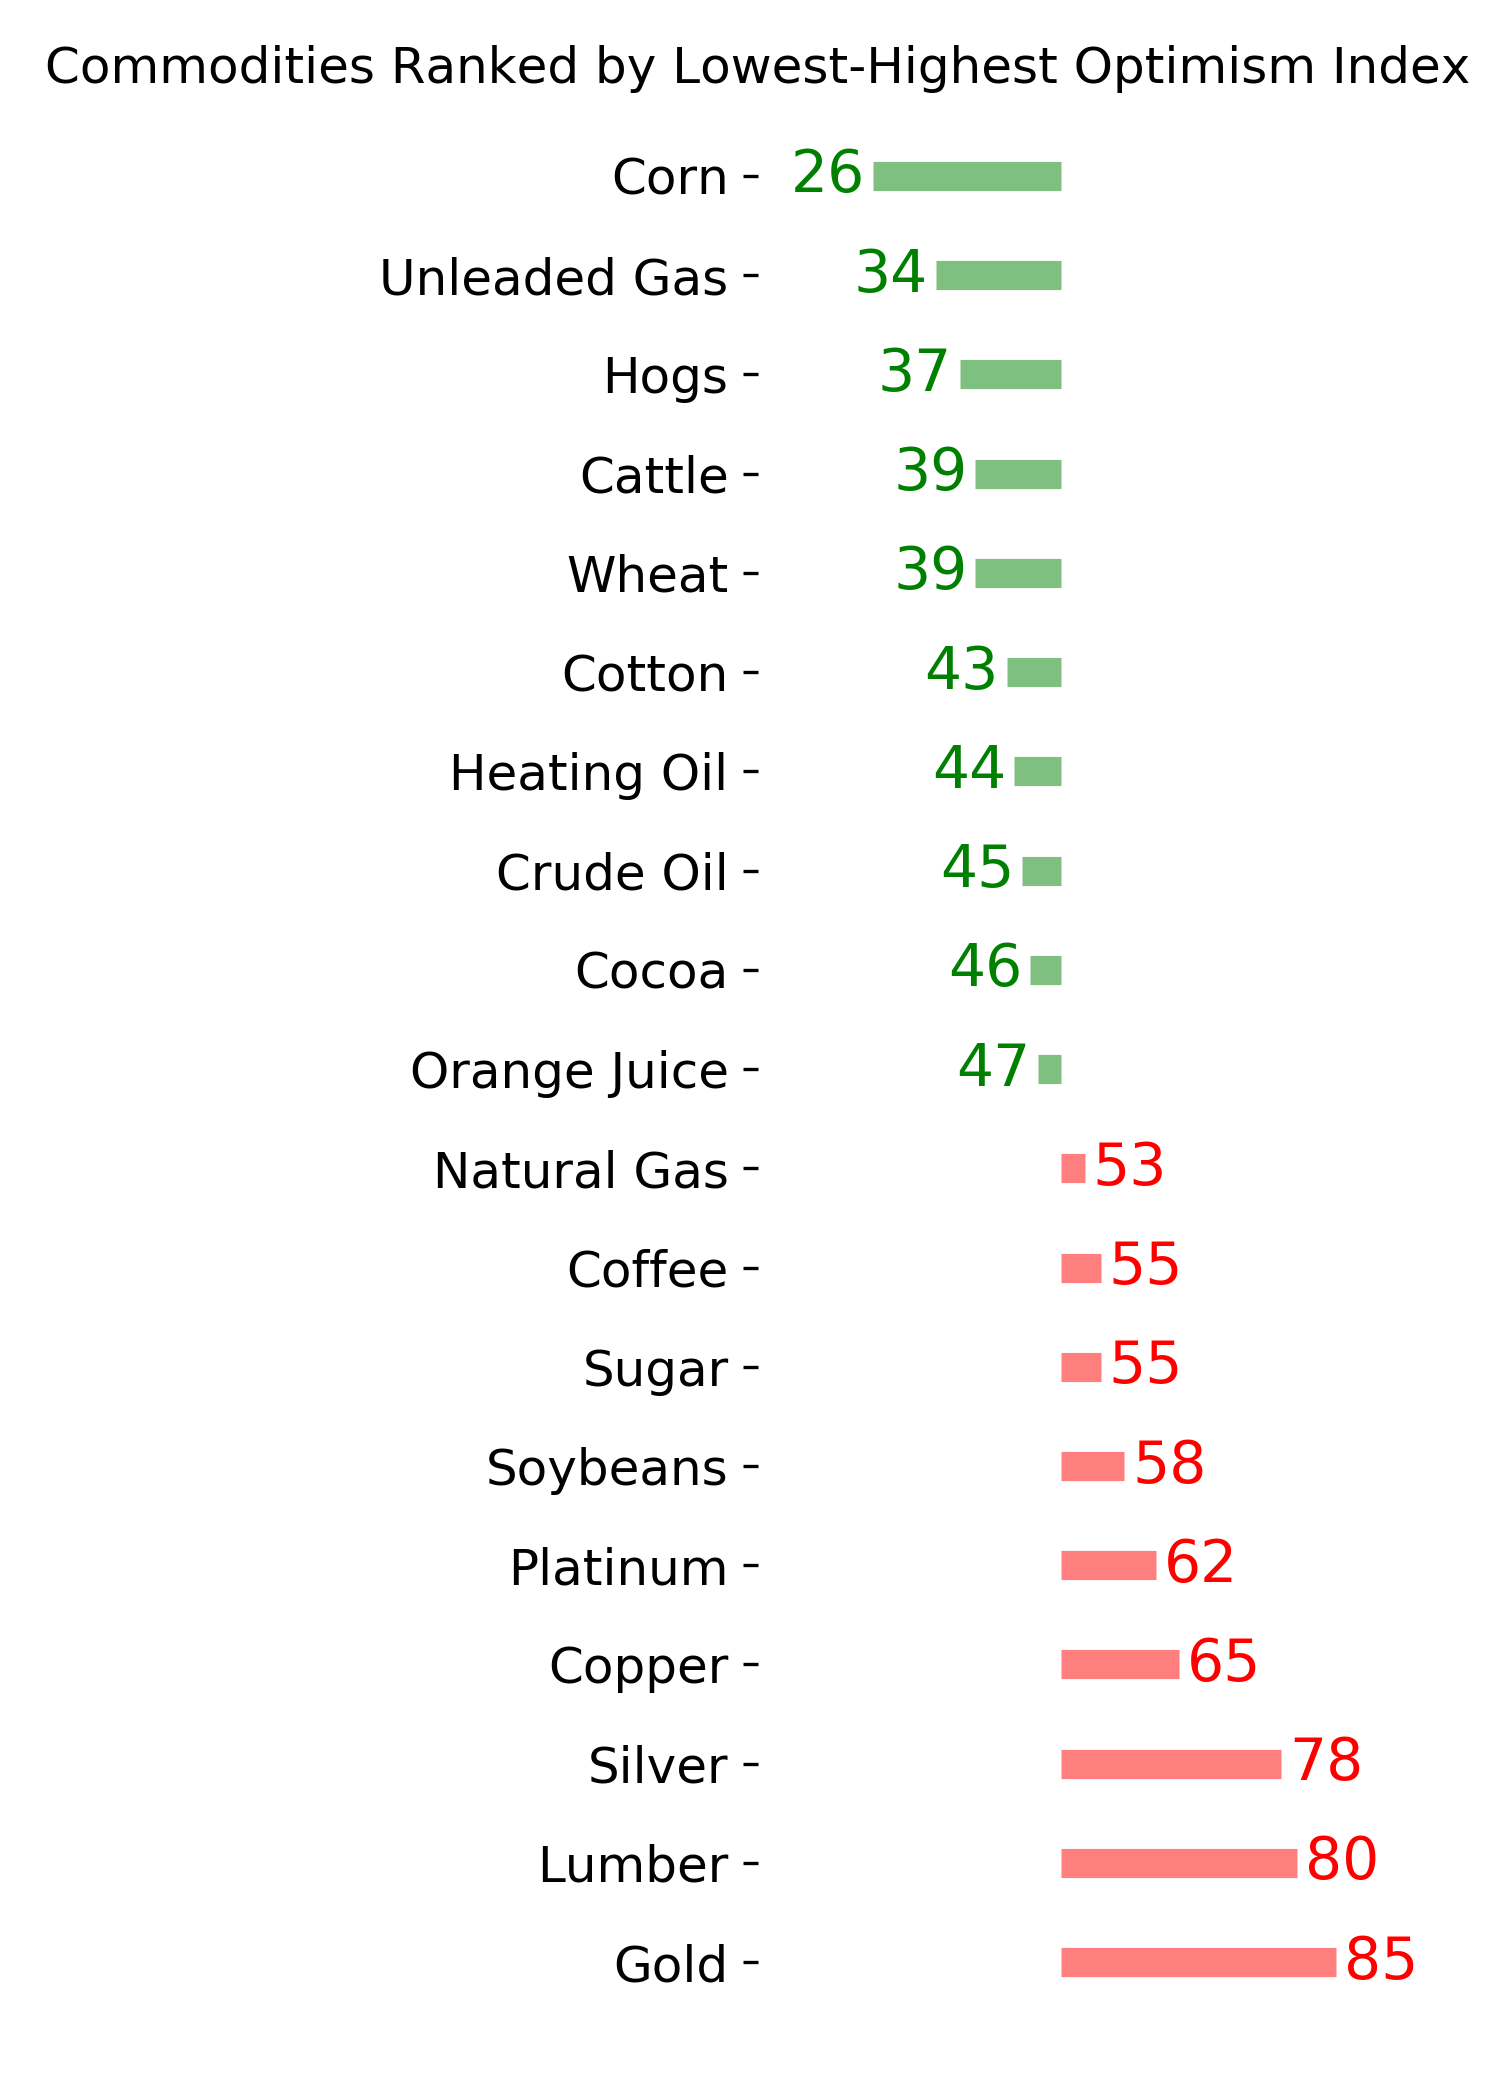
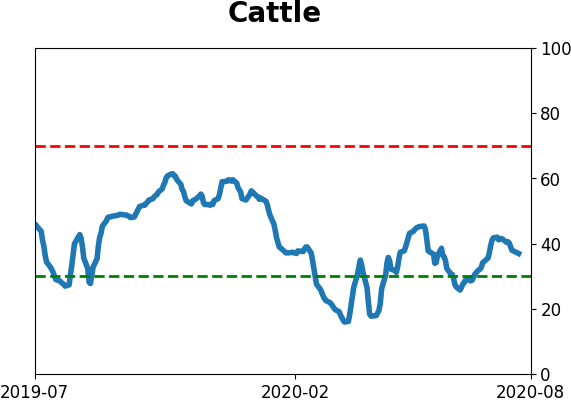
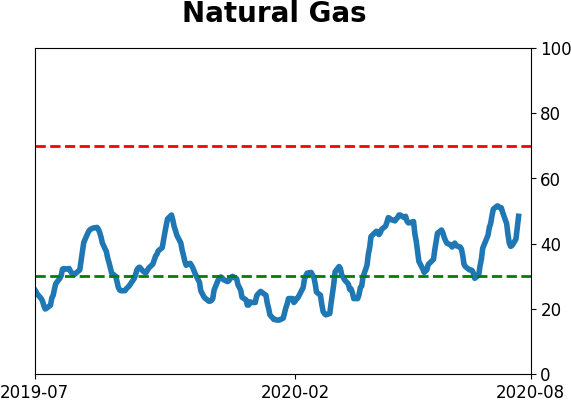
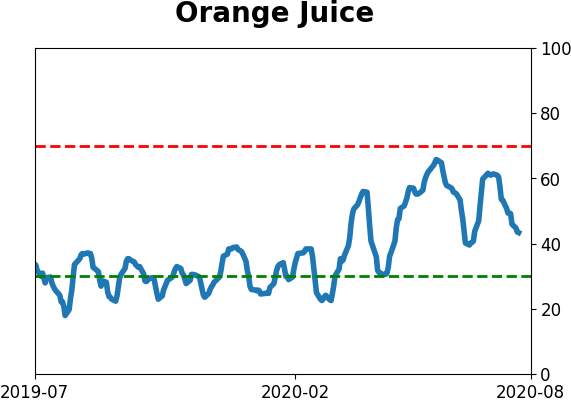
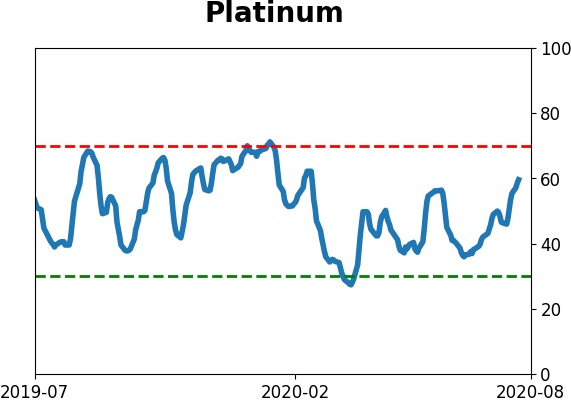
Commodity ETF's - 5-Day Moving Average
|
|