Headlines
|
|
Despite gains, more consumers expect stocks to fall:
The latest survey from the Conference Board shows that despite a huge jump in stocks in recent months, fewer consumers expect stock prices to increase than decrease in the future. This is highly unusual after a rally, and with stocks so close to their highs.
Investors continue to shy away from debt:
Stocks have soared in recent months, and investors have borrowed more and more against those gains. But the rate of change in stocks is still greater than the change in margin debt, showing some apathetic sentiment. That is unlike the behavior seen at other bubble peaks.
Bottom Line:
- Weight of the evidence has been suggesting flat/lower stock prices short- to medium-term again; still suggesting higher prices long-term
- Indicators show high optimism, with Dumb Money Confidence recently above 80% with signs of reckless speculation during what appears to be an unhealthy market environment, historically a bad combination
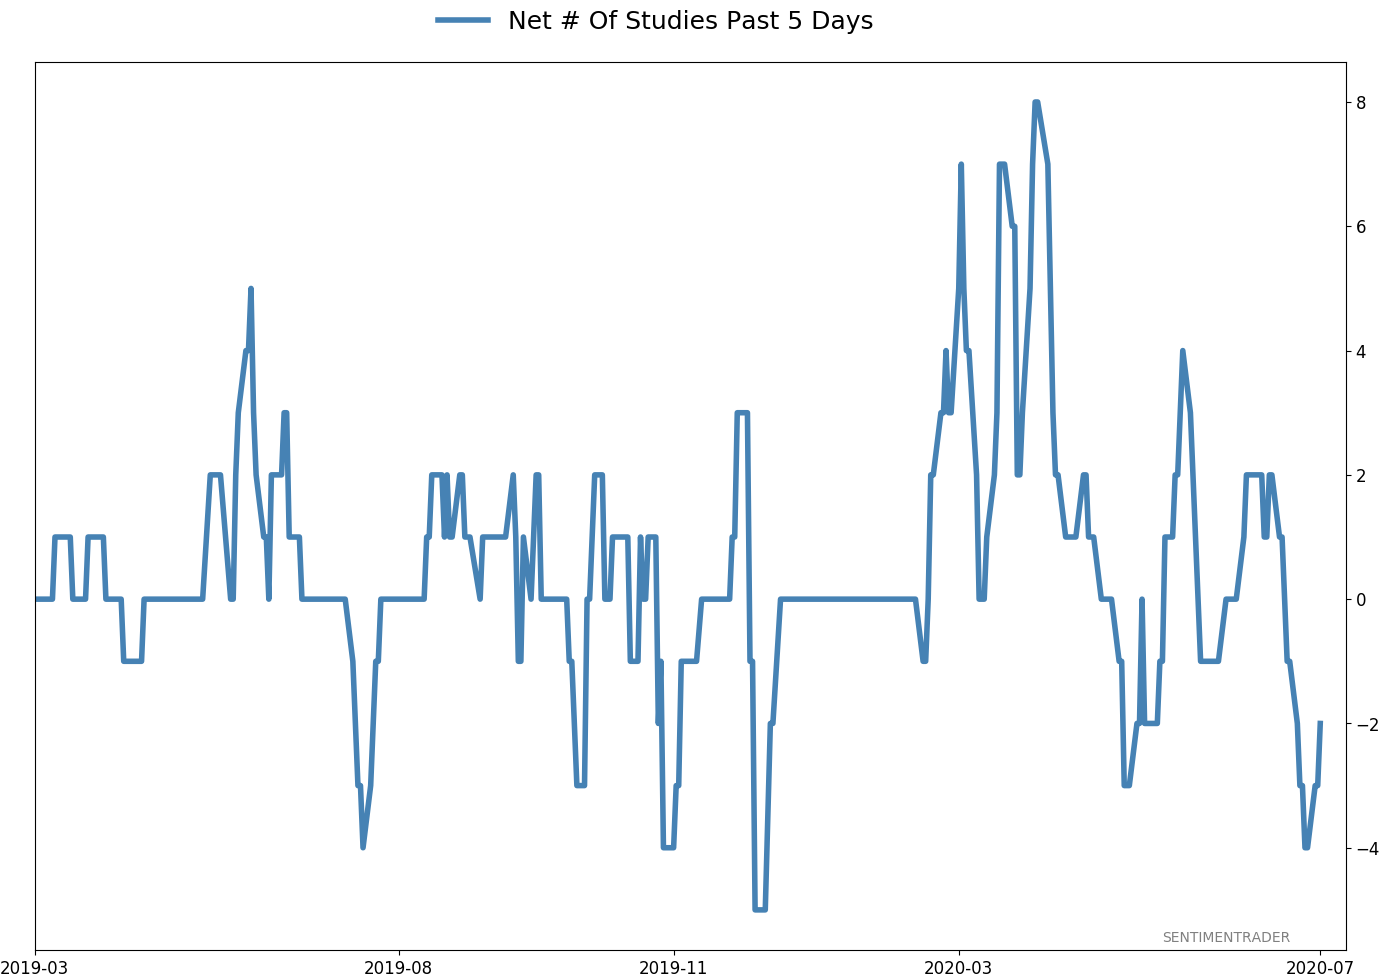
- Active Studies show a heavy positive skew over the medium- to long-term; breadth thrusts, recoveries, and trend changes have an almost unblemished record at preceding higher prices over a 6-12 month time frame
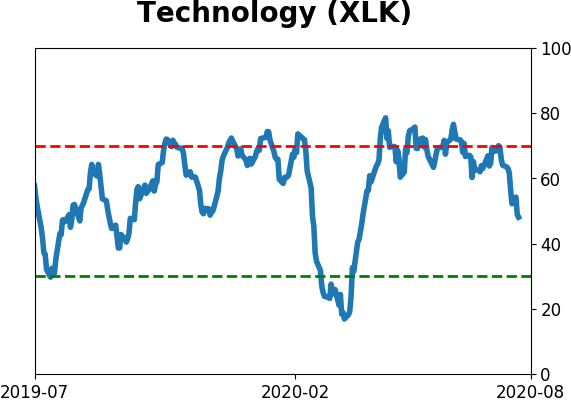
- Signs of extremely skewed preference for tech stocks neared exhaustion by late June, especially relative to industrials and financials (here and here)
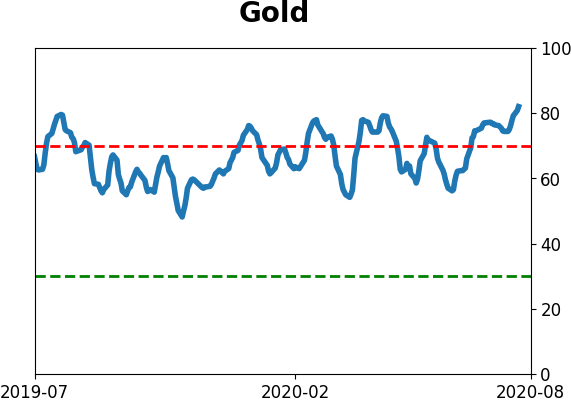
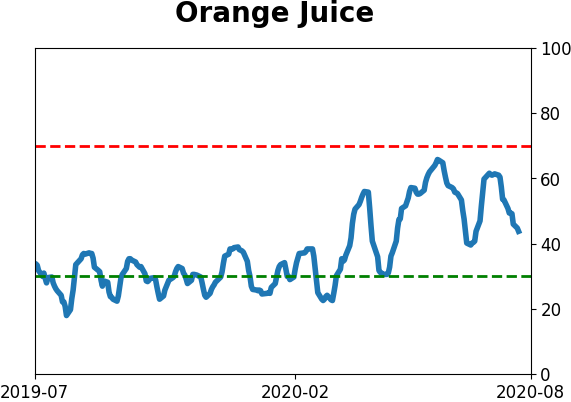
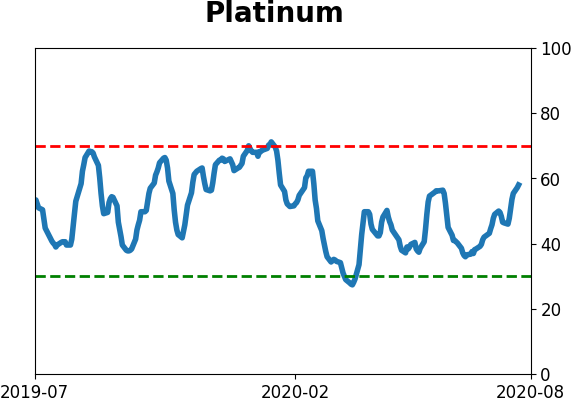
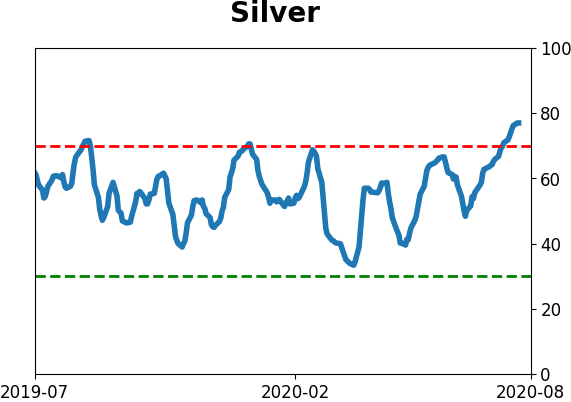
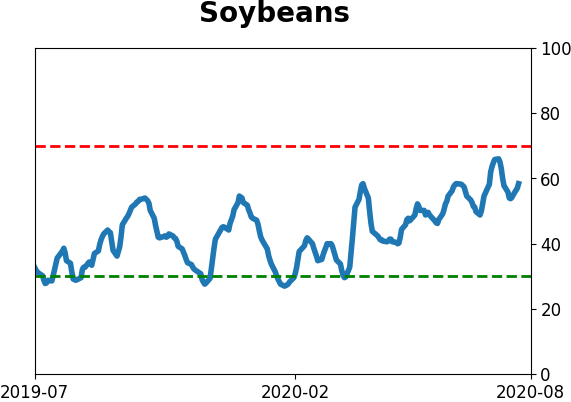
- Indicators and studies for other markets are showing less consistent forward results, though it's not a great sign for Treasuries that hedgers are net short and optimism on metals has become extreme, with "perfect" breadth among miners
|
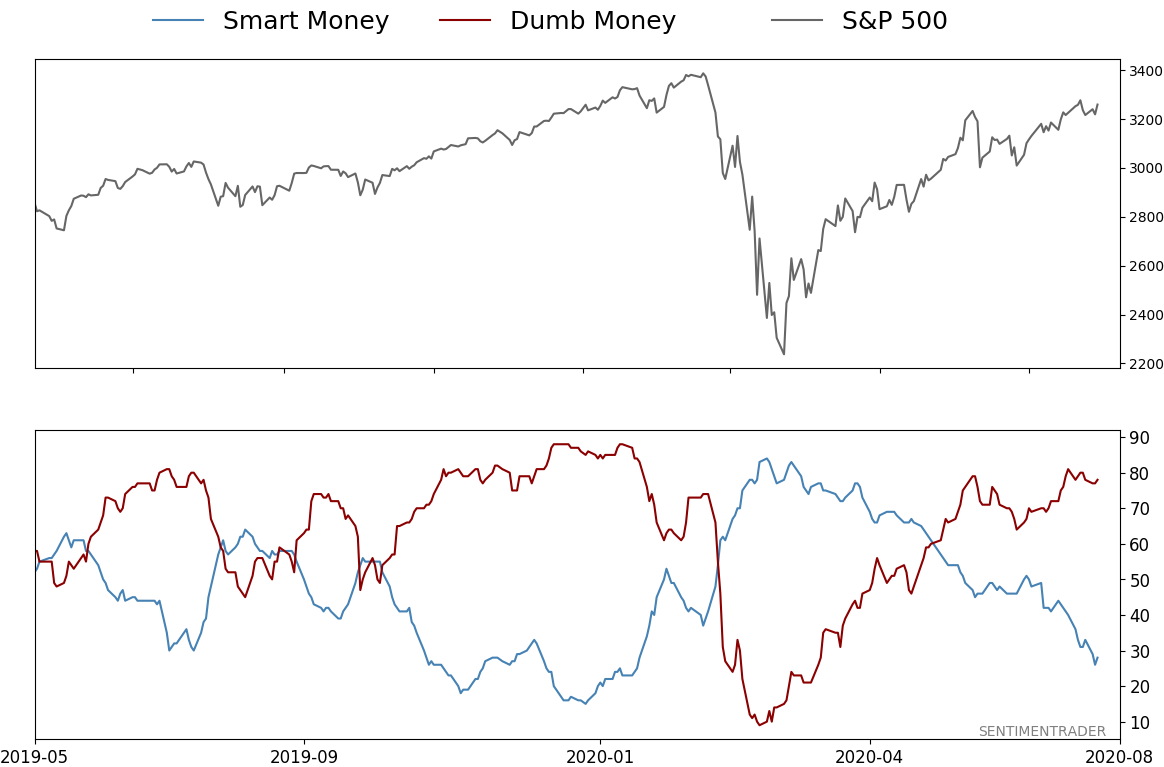
Smart / Dumb Money Confidence
|
Smart Money Confidence: 28%
Dumb Money Confidence: 78%
|
|
Risk Levels
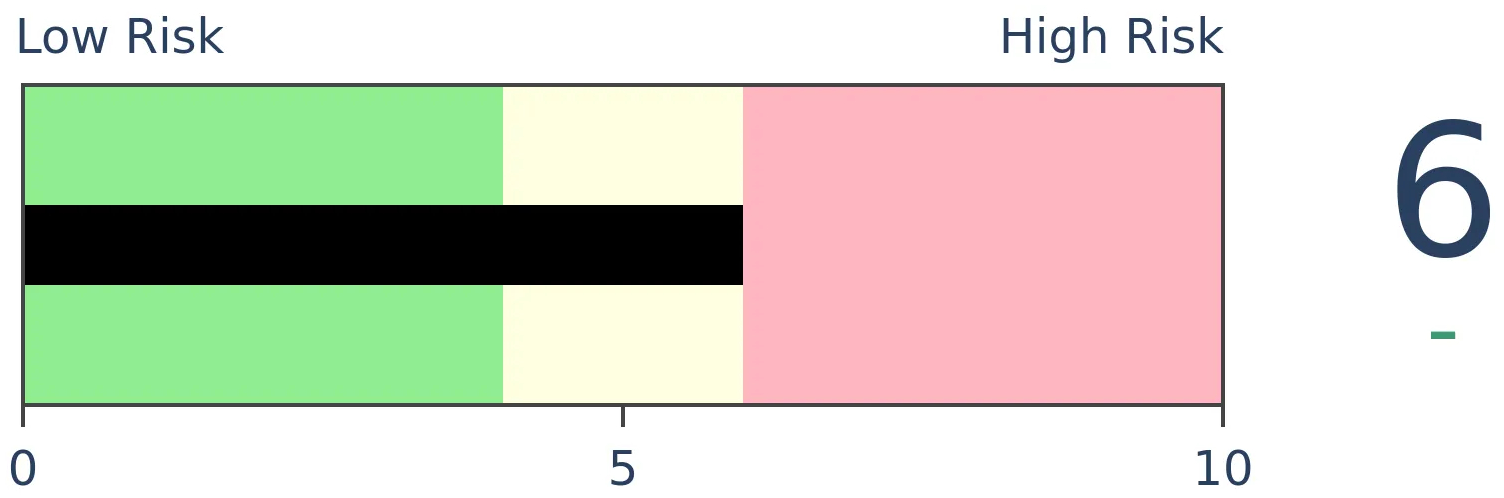
Stocks Short-Term
|
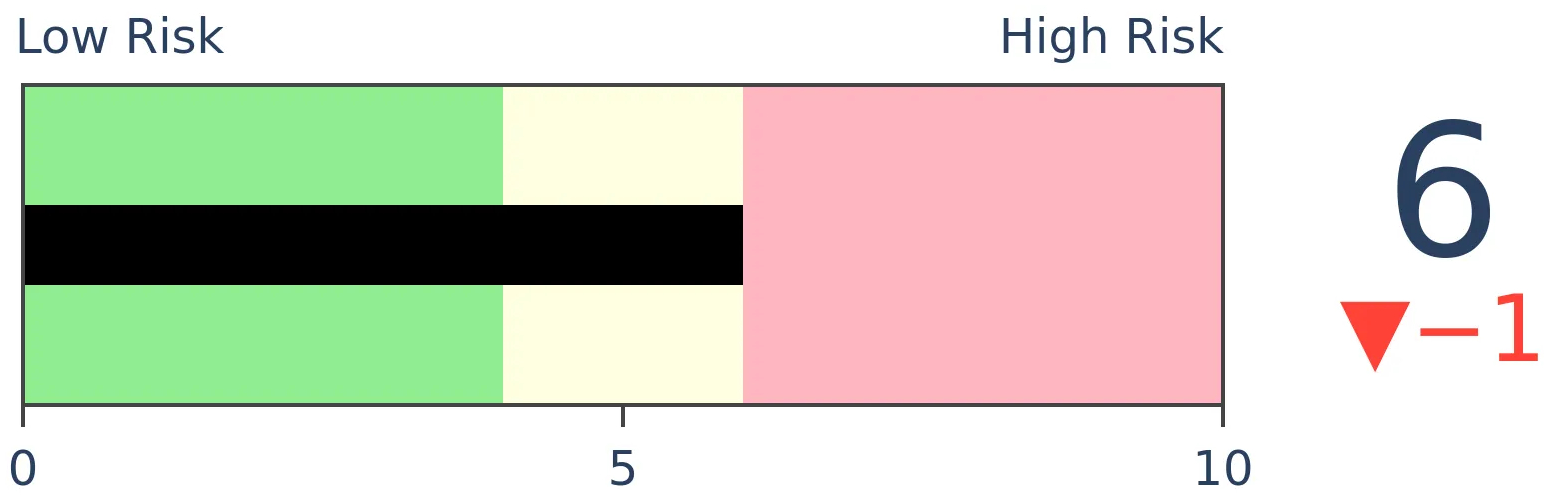
Stocks Medium-Term
|
|
Bonds
|
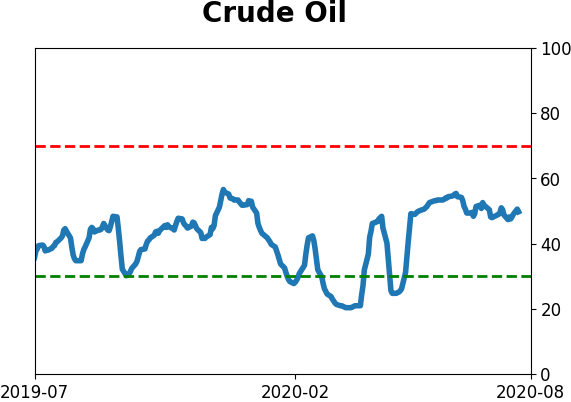
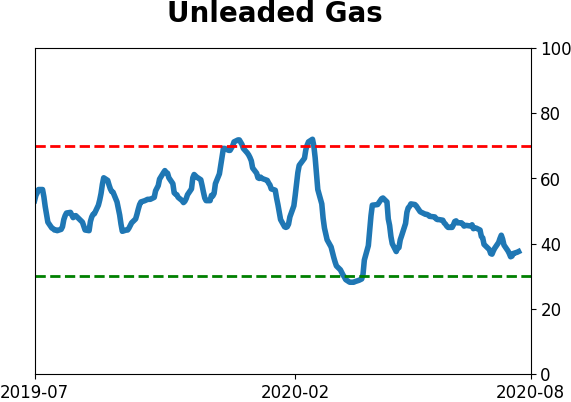
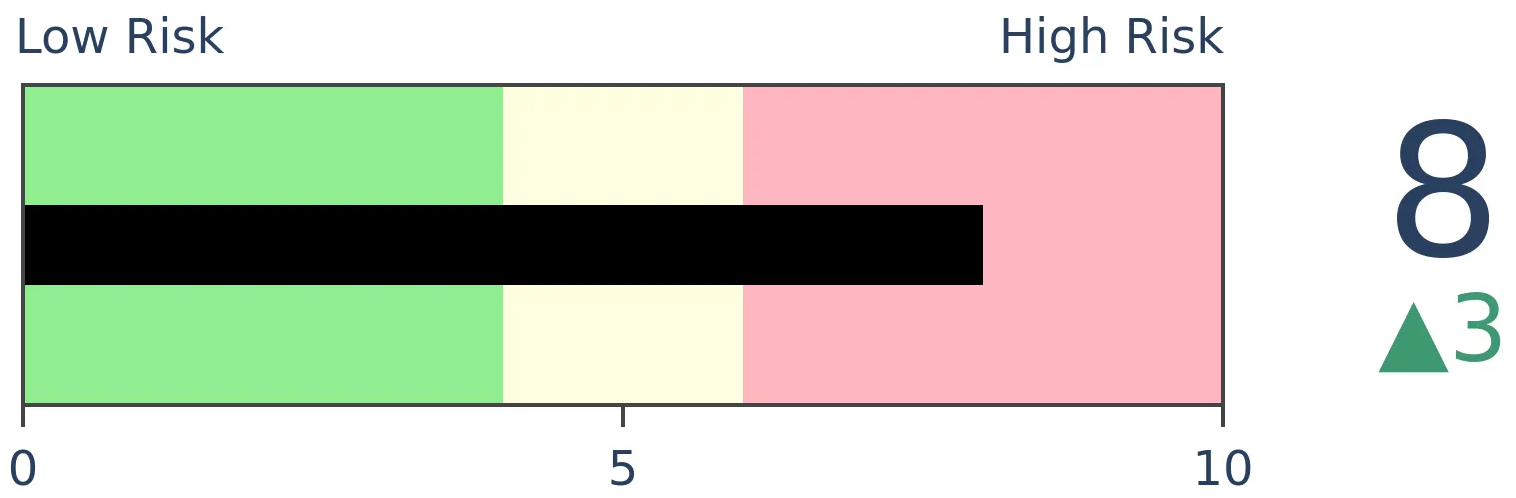
Crude Oil

|
|
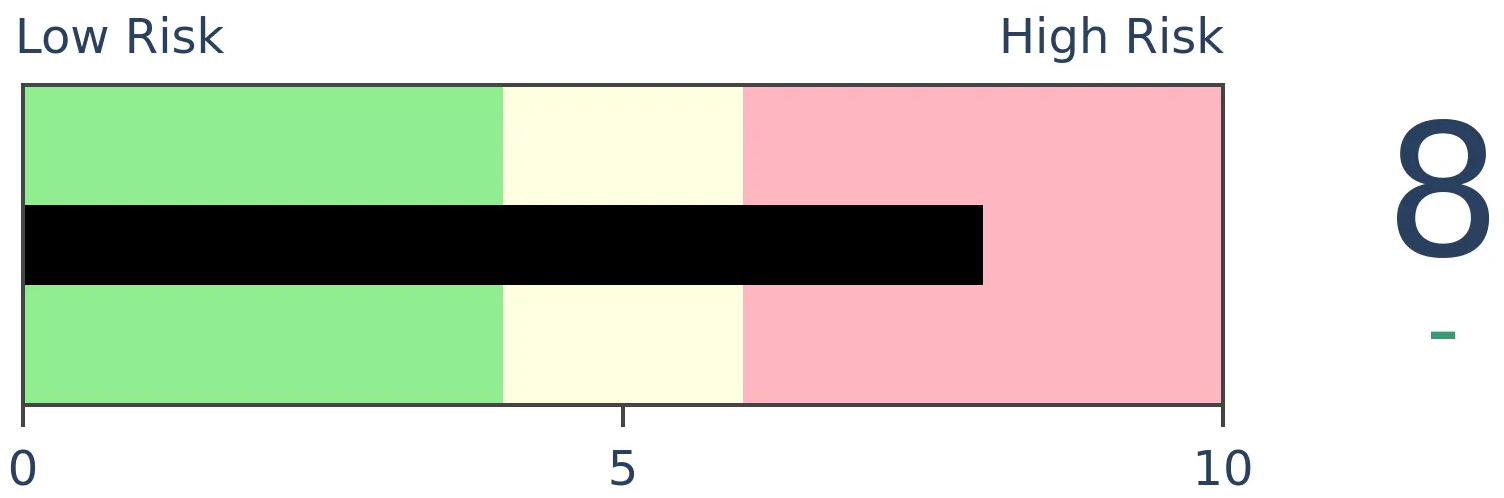
Gold

|
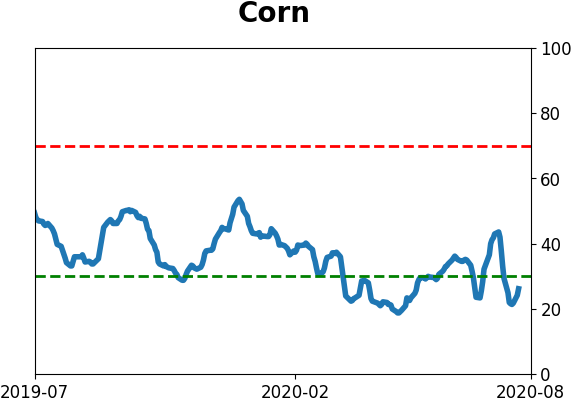
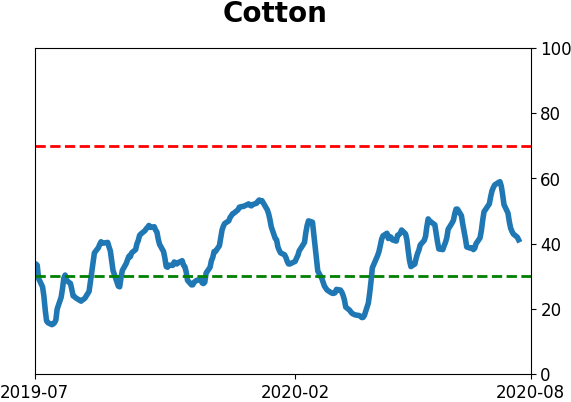
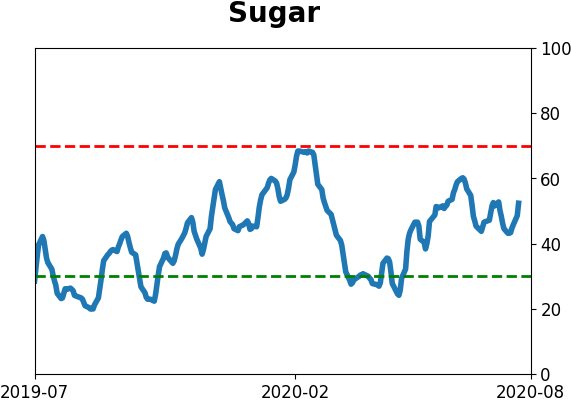
Agriculture
|
|
Research
BOTTOM LINE
The latest survey from the Conference Board shows that despite a huge jump in stocks in recent months, fewer consumers expect stock prices to increase than decrease in the future. This is highly unusual after a rally, and with stocks so close to their highs.
FORECAST / TIMEFRAME
SPY -- Up, Long-Term
|
We've been seeing for months that consumers haven't really been buying into the idea of an immediate economic recovery. And when stocks were gyrating wildly, they were hesitant to believe in the idea of a sustained rally.
Four months later and more than 25% higher in many indexes, consumers still aren't buying it.
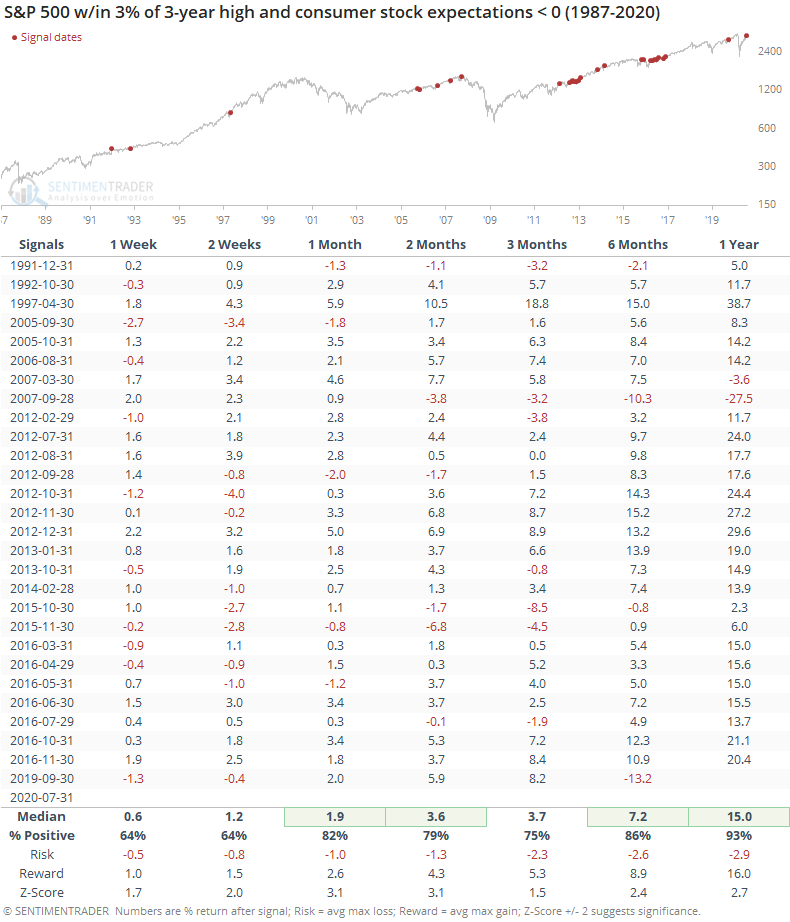
The latest survey from the Conference Board shows that more consumers expect stock prices to decrease over the coming months than increase. This is highly unusual - there is a strong positive relationship between the S&P 500's rate of change over the past four months and the net percentage of consumers who expect stocks to rise going forward.
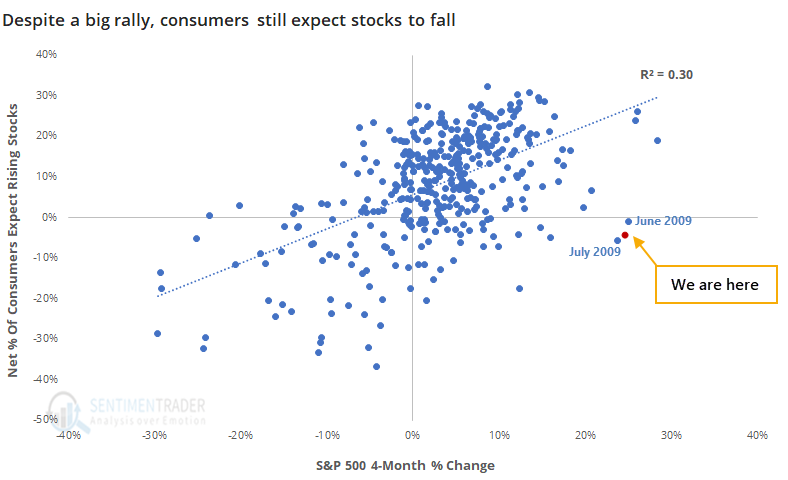
Recency bias is a real thing. The only other months in more than 30 years of history when the S&P gained more than 20% and yet consumers, on balance, expected stocks to fall were June and July 2009.
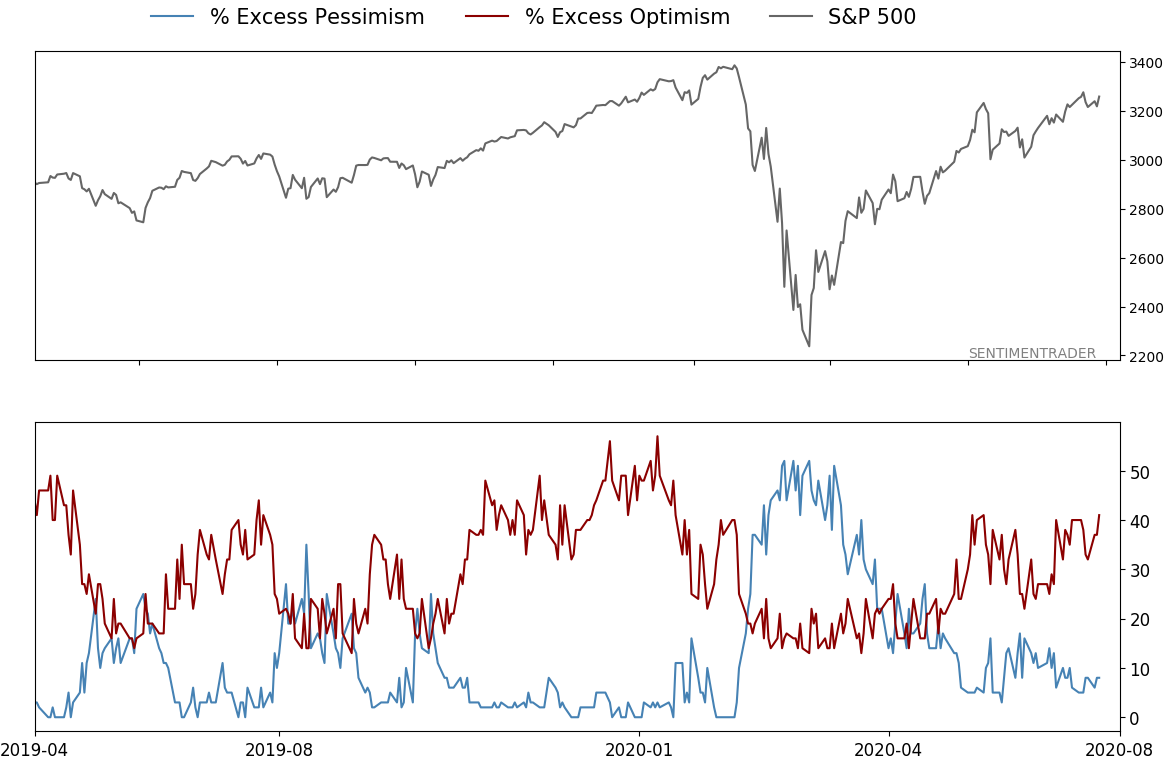
Below, we can see that the S&P's annualized return when consumers were pessimistic on stocks was very impressive. Even though this was the case during much of 2008, most of the other months showed a strong contrary bias.
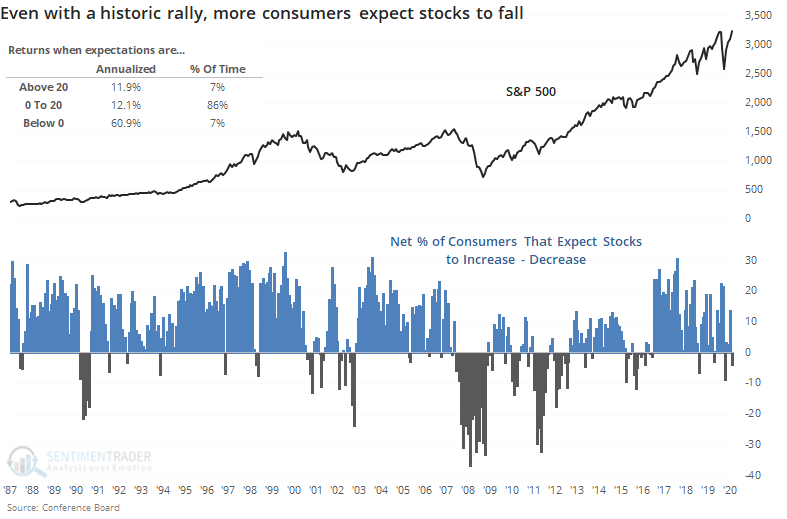
When the S&P finished a month within 3% of a multi-year high, and yet fewer consumers expected stocks to increase than decrease, it was a good medium- to long-term sign for stocks.
Like fund flows and a few other surveys, this data does not at all support the idea that investors are excessively optimistic. But more indicators show that they are, enough so that Dumb Money Confidence has hovered at or above 80%.
There is no good way to reconcile them all - there are rarely any times when every indicator agrees. It's just a matter of determining what matters most and using weight of the evidence. In recent weeks, that has tilted more toward the idea that risk is high over a multi-week to multi-month time frame, but is skewed more toward the upside over a 3-12 month time frame.
BOTTOM LINE
Stocks have soared in recent months, and investors have borrowed more and more against those gains. But the rate of change in stocks is still greater than the change in margin debt, showing some apathetic sentiment. That is unlike the behavior seen at other bubble peaks.
FORECAST / TIMEFRAME
None
|
Signs of speculation are pretty easy to spot across markets, but it's not like every single indicator is showing the same thing. Some are showing apathetic sentiment or even pessimism, like fund flows and isolated surveys.
One of those showing apathy is margin debt. The rising horde of retail traders has turned much more toward the options market to get its kicks than borrowing against rising stock balances.
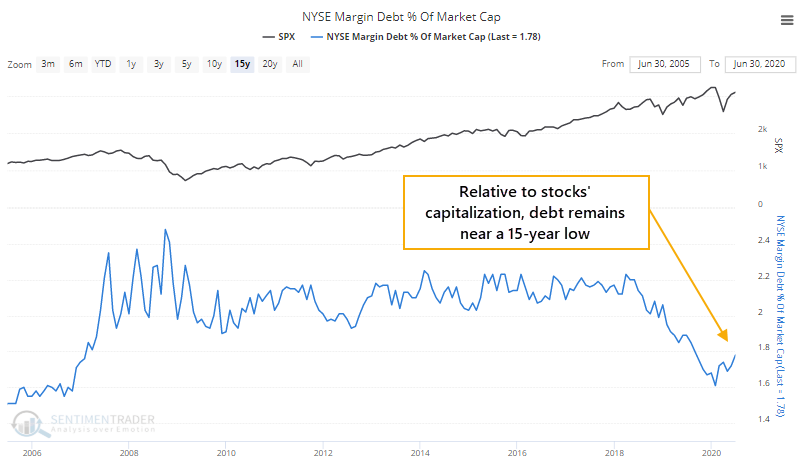
While investors have taken on more margin debt in recent months, as a percentage of the total capitalization of U.S. stocks, debt remains near a 15-year low.
Over the past year, growth in margin debt has trailed growth in the S&P 500 by more than 7%. This is the polar opposite of bubble peaks in 2000 and 2007 when the growth rate of debt exceeded the growth in stock prices by more than 50%.
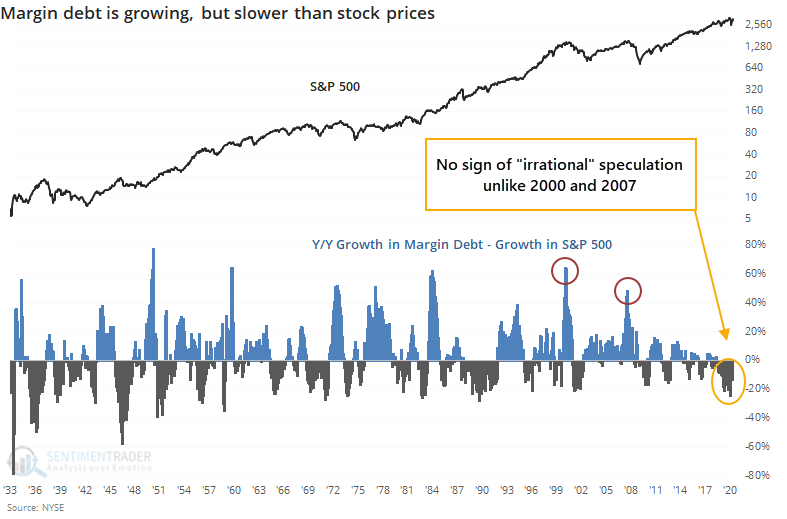
This has been a consistent theme for years. In 2000 and 2007, we saw tremendous, and sudden, growth in borrowings against stocks, but it's been entirely absent since then, at least relative to the growth in the market.
The year-over-year change in margin debt has trailed the change in the S&P 500 for 7 out of the past 12 months, ranking among the most apathetic periods since the 1930s.
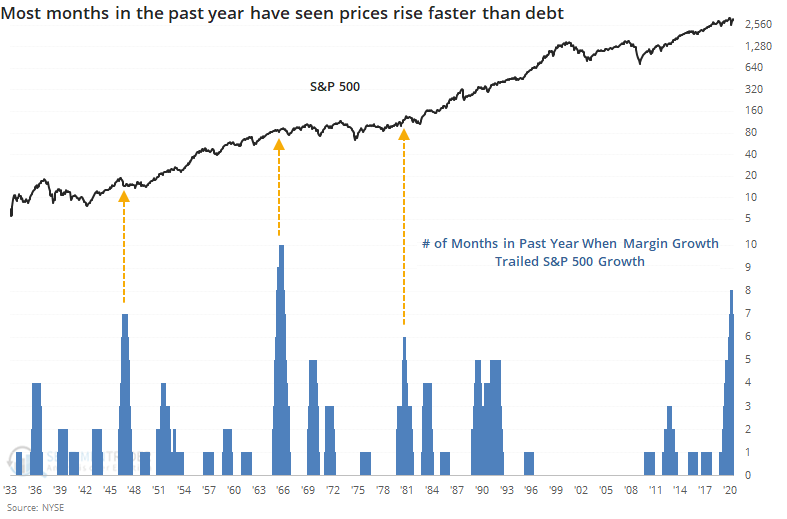
While theoretically, it seems like this should be a long-term positive for stocks, other periods like this were not necessarily so. When there were extended periods of lagging margin debt in the 1940s, 60s, and 80s, stocks languished for months on end before finally taking off again.
As the manager of a direct brokerage margin department in the 1990s, on a daily basis, I saw firsthand the emotions that go into client decisions about debt borrowed against their stock holdings. On an aggregate basis, though, using this data has proved to be a challenge. The best uses of the data occur when there is a massive growth in debt, especially relative to growth in stocks. That hasn't been the case for over a decade. Currently, the apathy shown in this data might be considered a very slight positive, but even that is a stretch.
Active Studies
| Time Frame | Bullish | Bearish | | Short-Term | 0 | 1 | | Medium-Term | 8 | 11 | | Long-Term | 45 | 1 |
|
Indicators at Extremes
Portfolio
| Position | Weight % | Added / Reduced | Date | | Stocks | 29.8 | Reduced 9.1% | 2020-06-11 | | Bonds | 0.0 | Reduced 6.7% | 2020-02-28 | | Commodities | 5.2 | Added 2.4%
| 2020-02-28 | | Precious Metals | 0.0 | Reduced 3.6% | 2020-02-28 | | Special Situations | 0.0 | Reduced 31.9% | 2020-03-17 | | Cash | 65.0 | | |
|
Updates (Changes made today are underlined)
After stocks bottomed on March 23rd, they enjoyed a historic buying thrust and retraced a larger amount of the decline than "just a bear market rally" tends to. Through June, there were signs of breadth thrusts, recoveries, and trend changes that have an almost unblemished record at preceding higher prices over a 6-12 month time frame. On a shorter-term basis, our indicators have been showing high optimism, with Dumb Money Confidence recently above 80%, along with signs of reckless speculation during what appears to be an unhealthy market environment, historically a bad combination. While there are certainly some outlier indicators that are showing apathy or even outright pessimism, a weight-of-the-evidence approach suggests high risk over a multi-week to multi-month time frame. I've been carrying a low (too low) level of exposure to stocks, as well as bonds and gold. I don't see a good opportunity to add to any of those currently, with poor prospects pretty much all the way around. As worried as I am over the medium-term, I would only grudgingly reduce my exposure even further, given the longer-term positives we spent so much time discussing in the spring.
RETURN YTD: -3.8% 2019: 12.6%, 2018: 0.6%, 2017: 3.8%, 2016: 17.1%, 2015: 9.2%, 2014: 14.5%, 2013: 2.2%, 2012: 10.8%, 2011: 16.5%, 2010: 15.3%, 2009: 23.9%, 2008: 16.2%, 2007: 7.8%
|
|
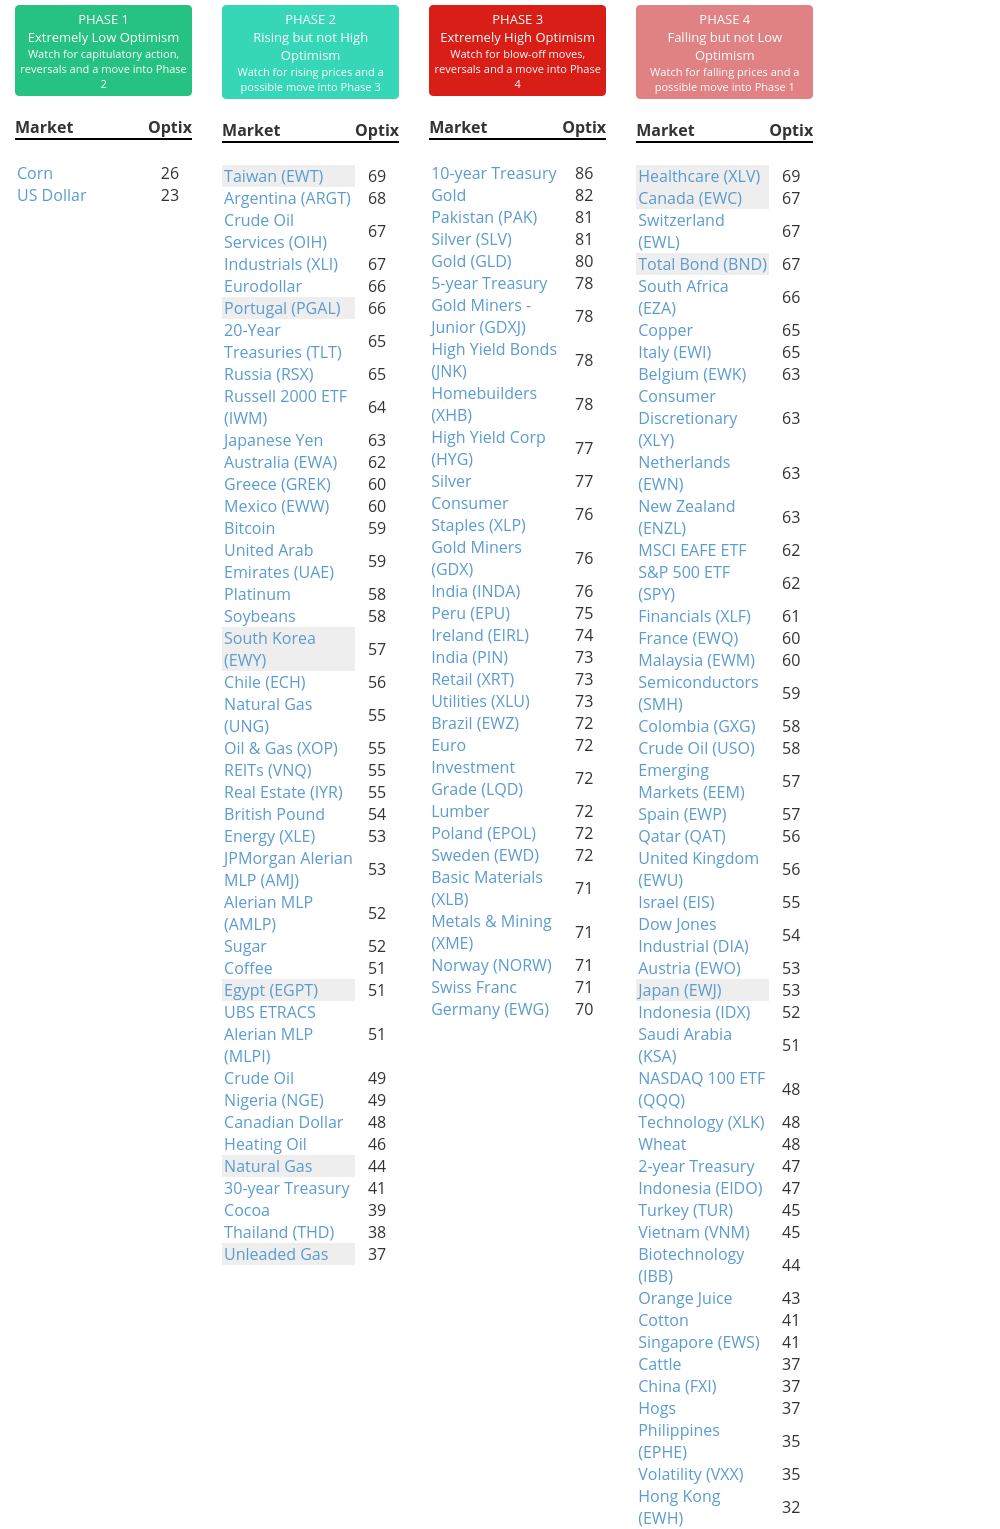
Phase Table
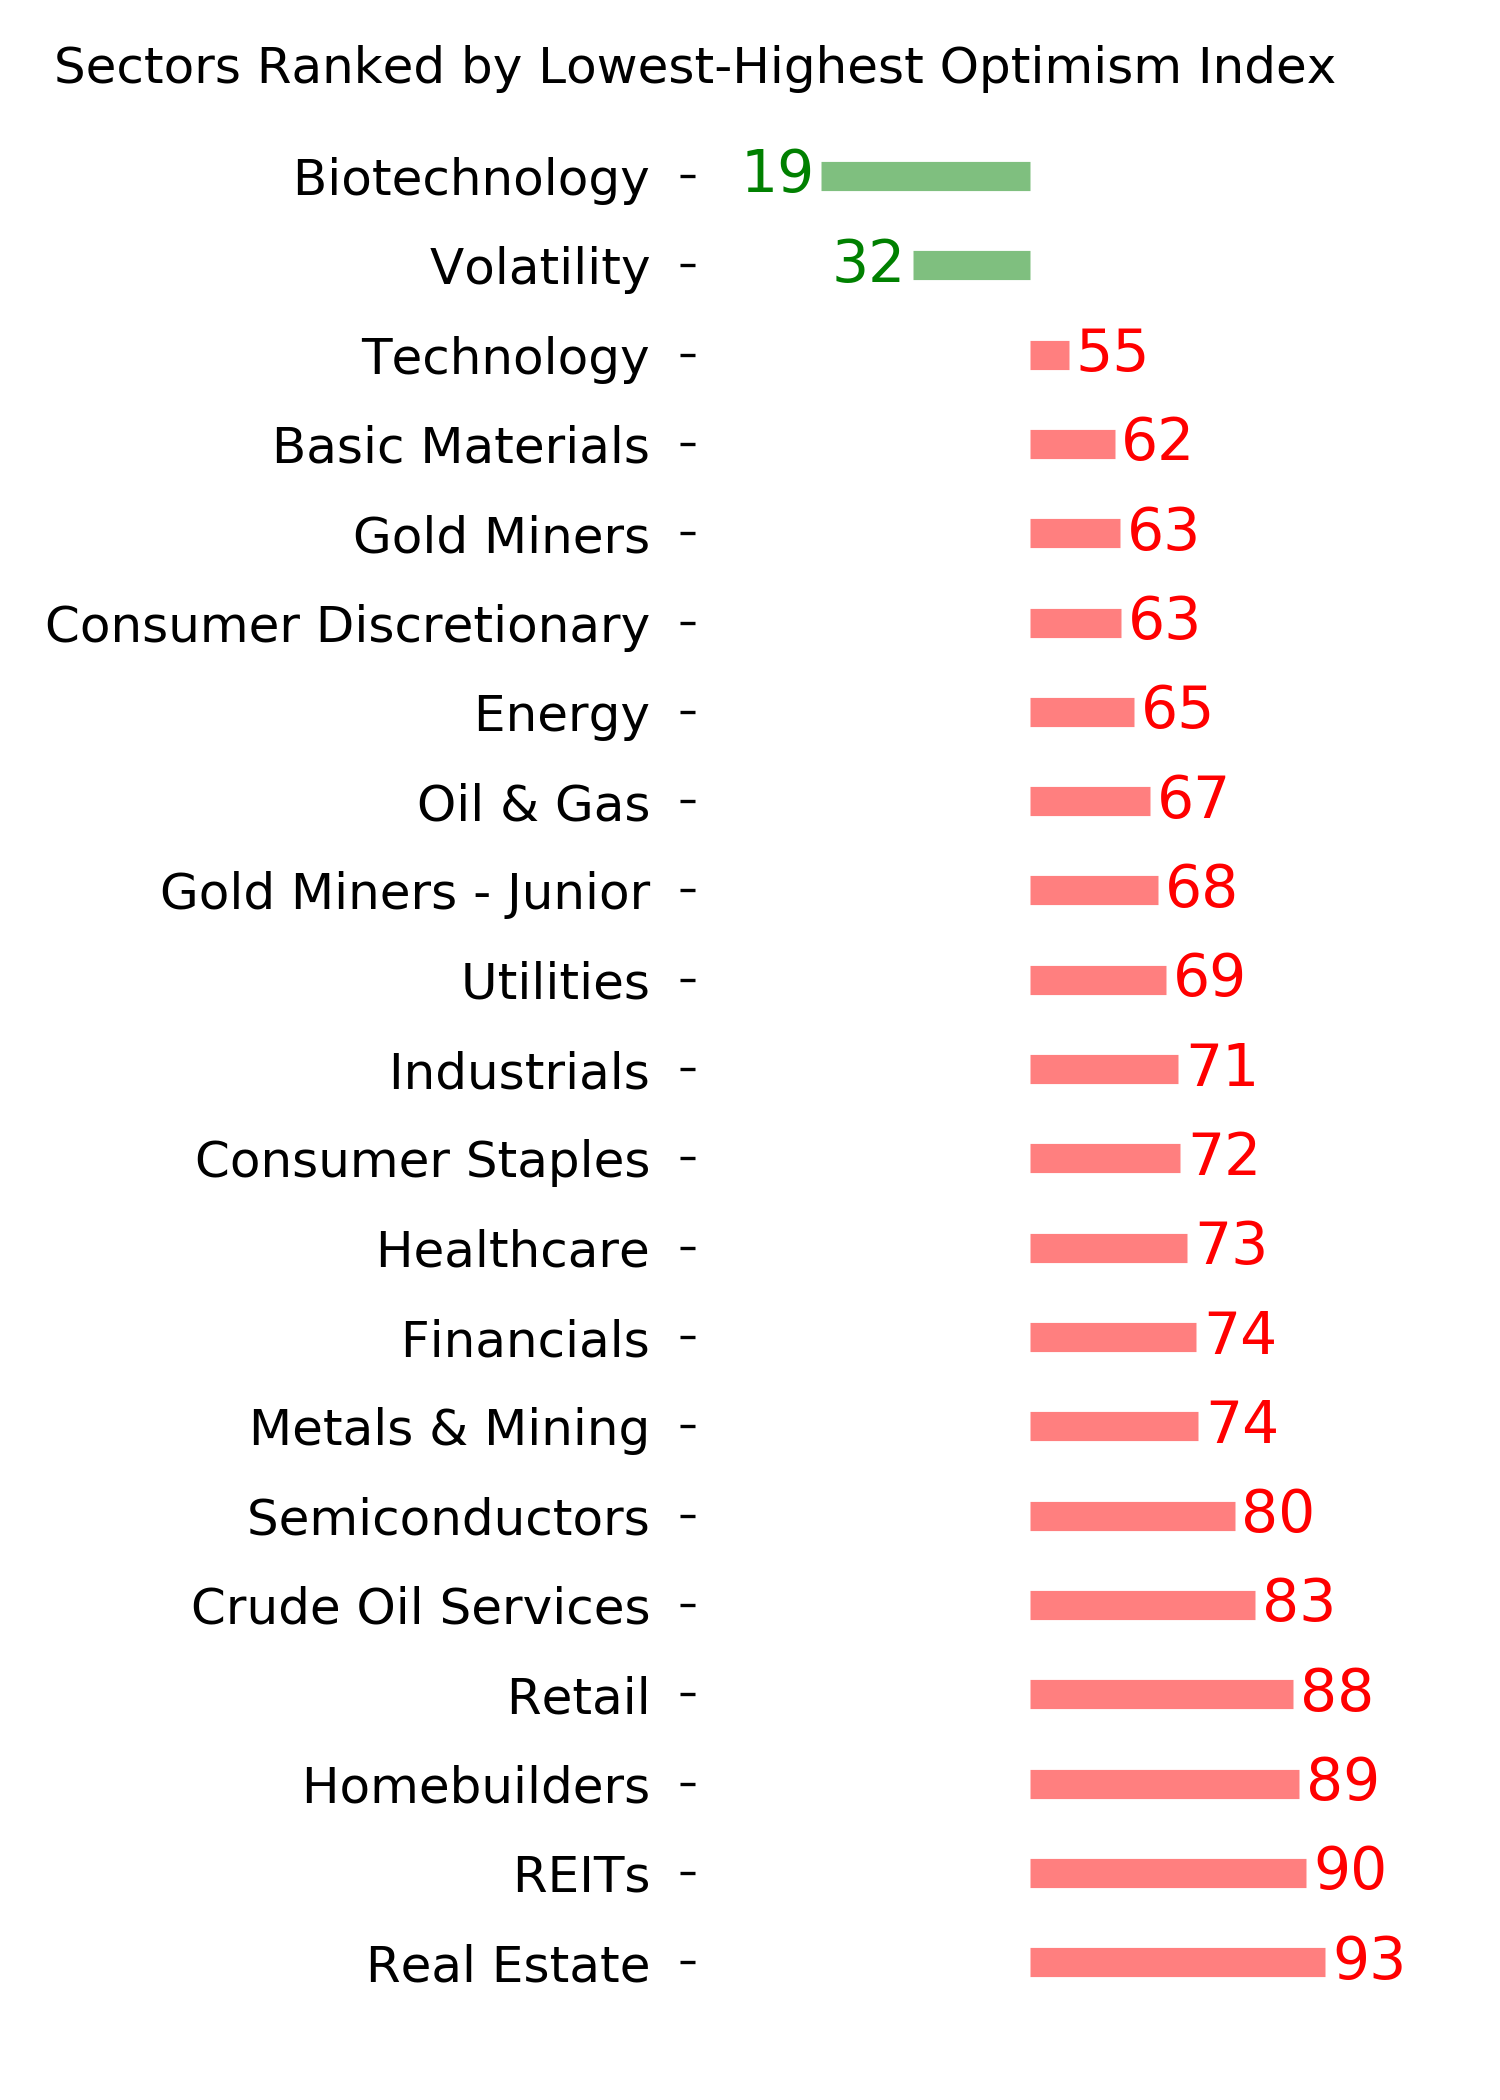
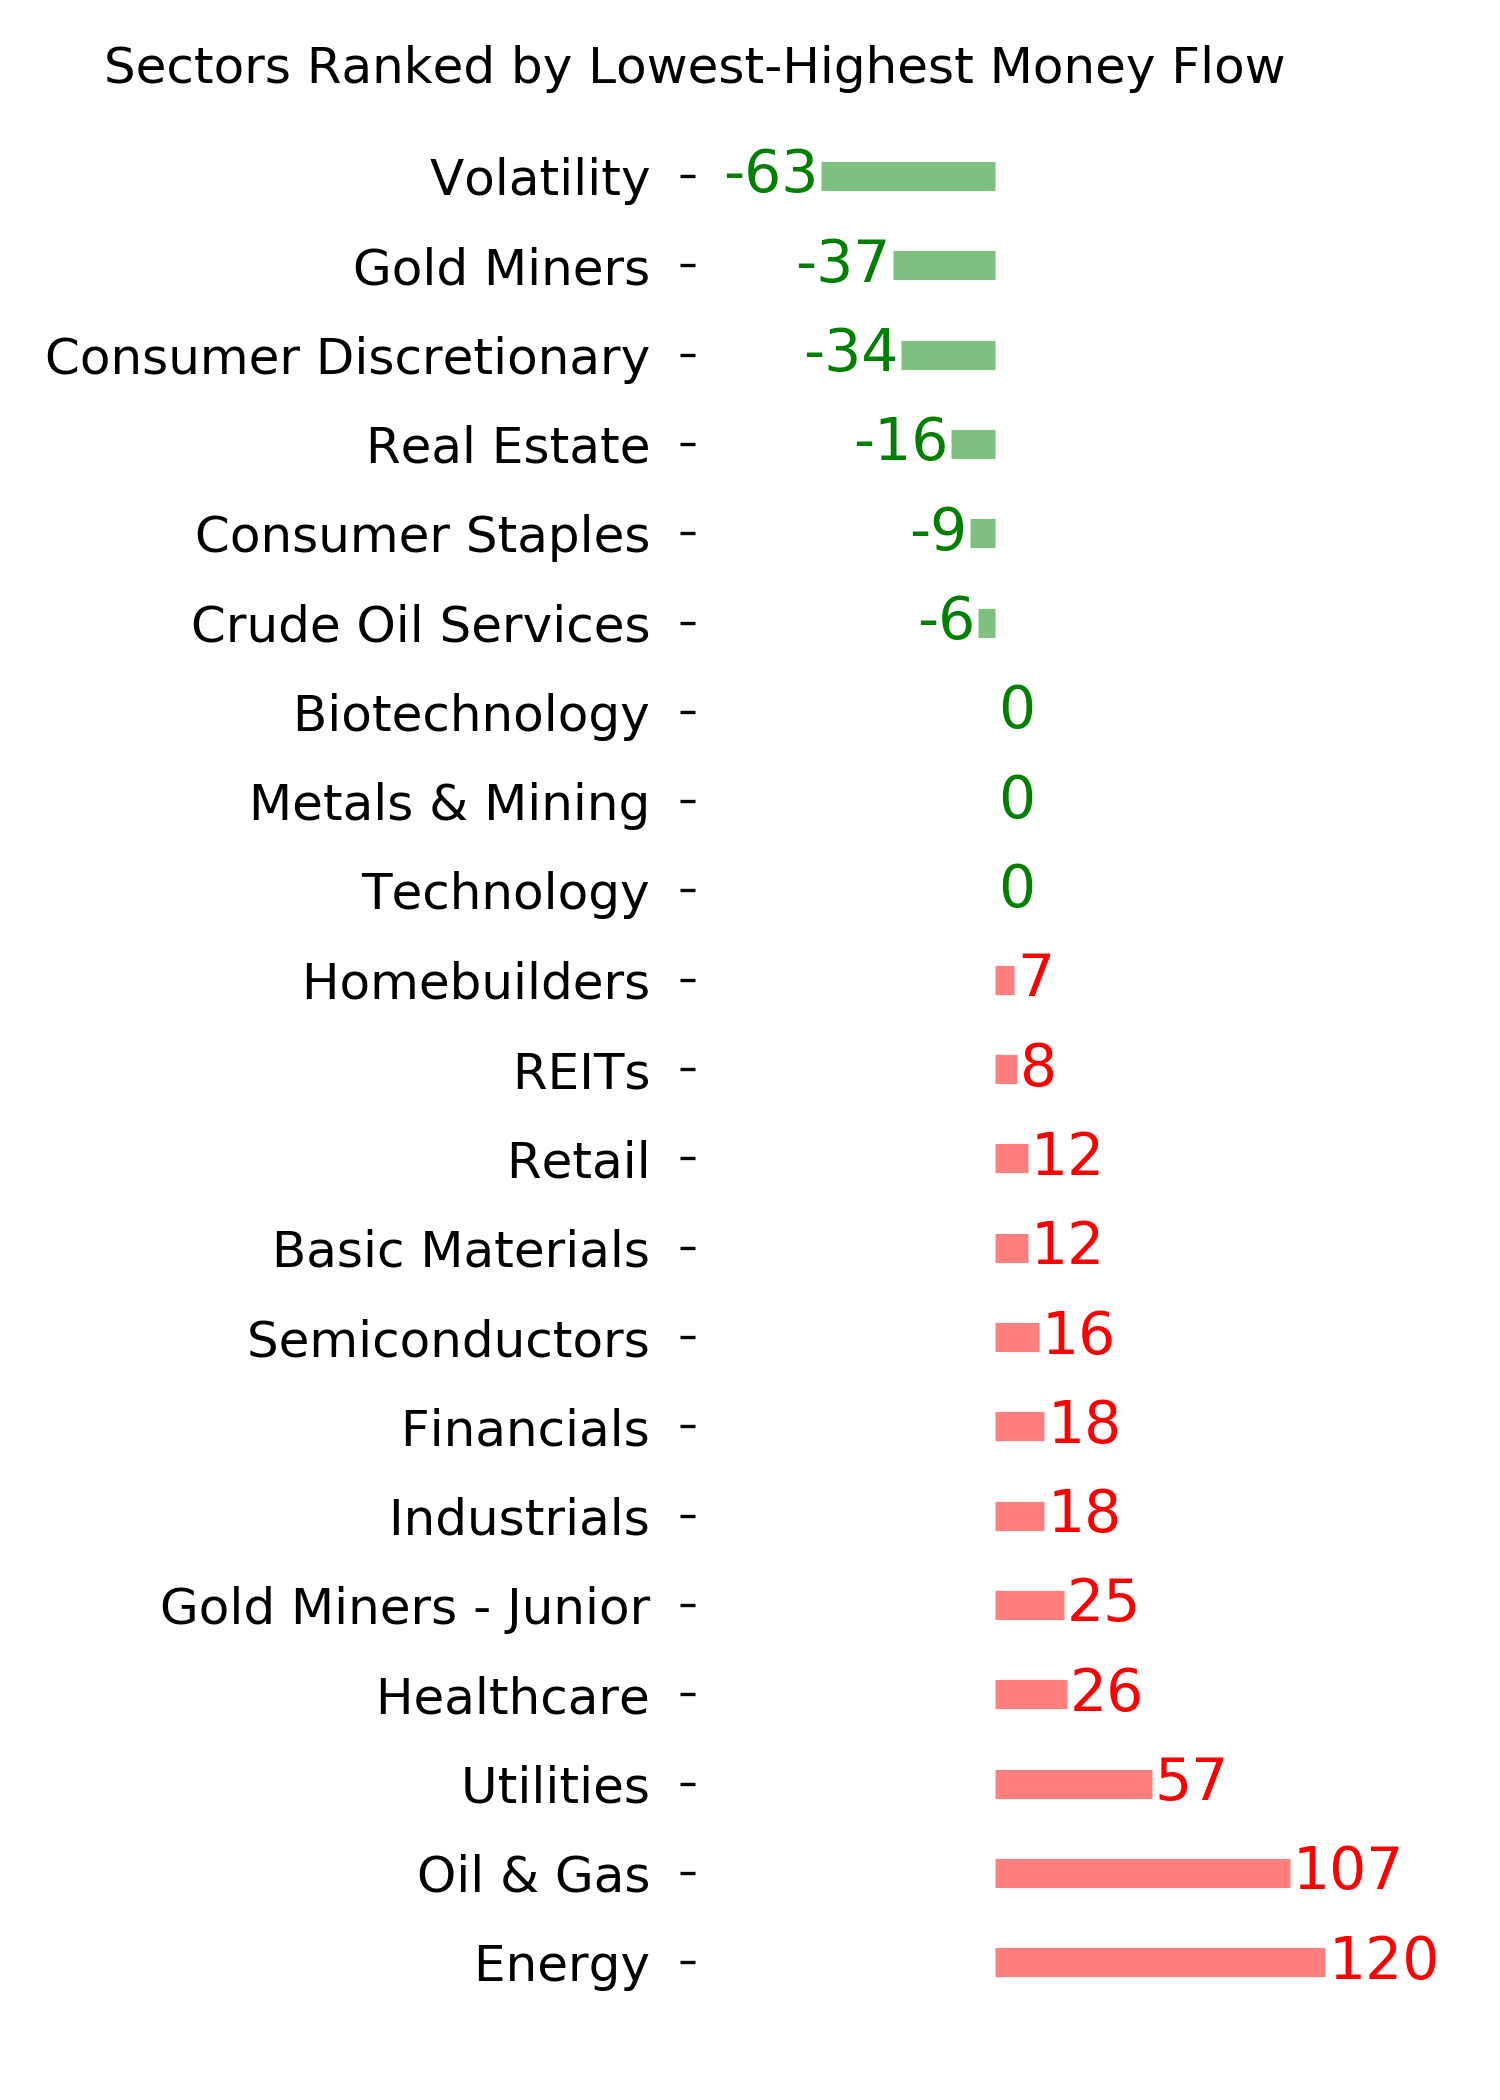
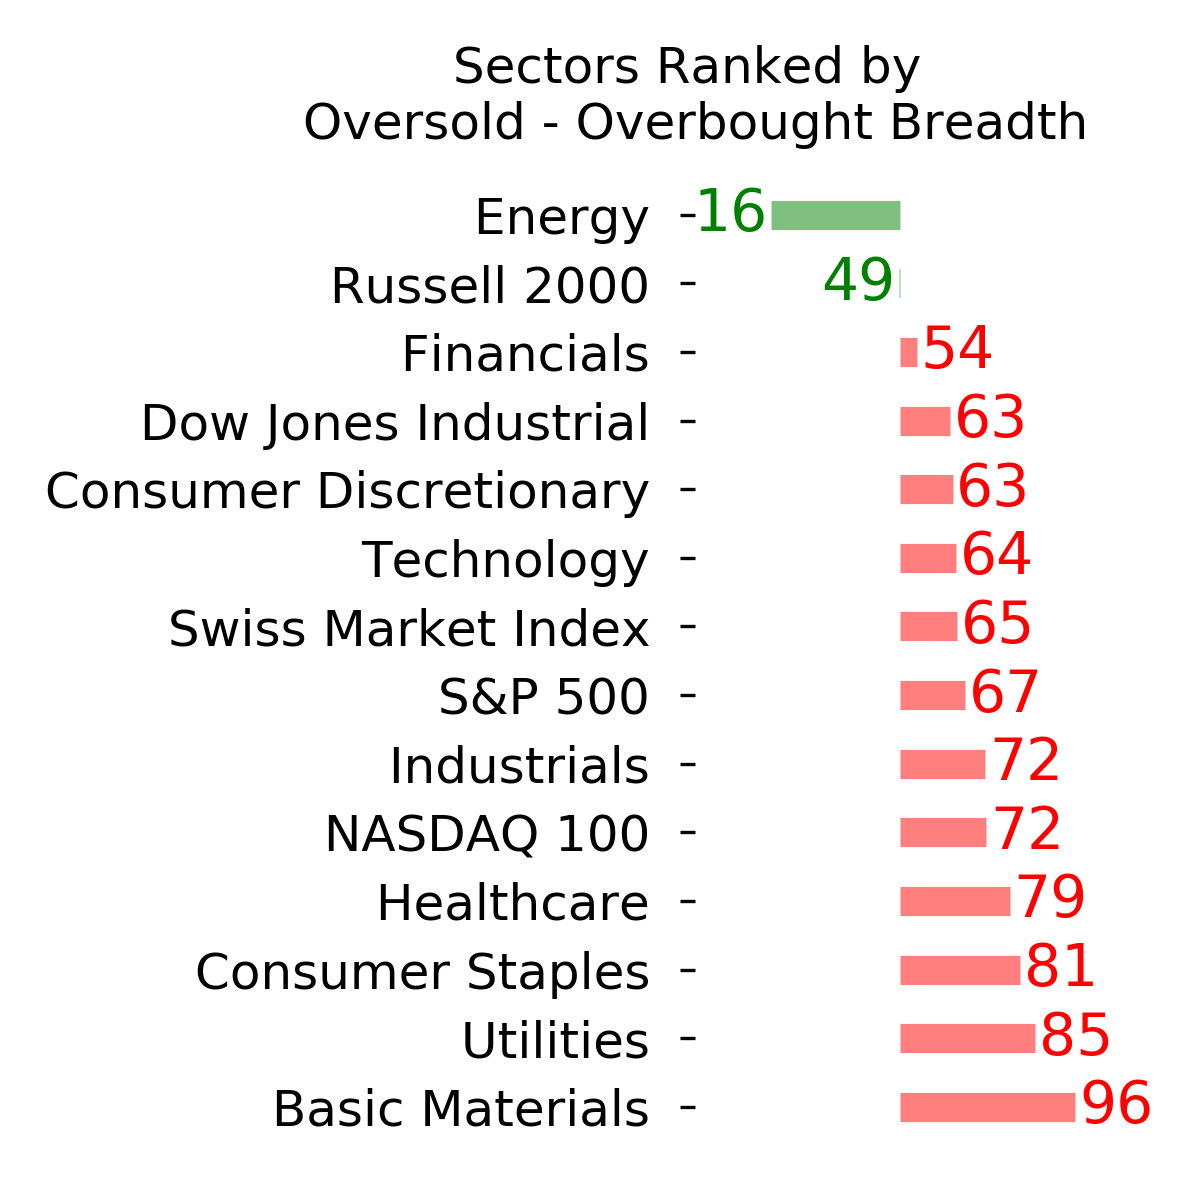
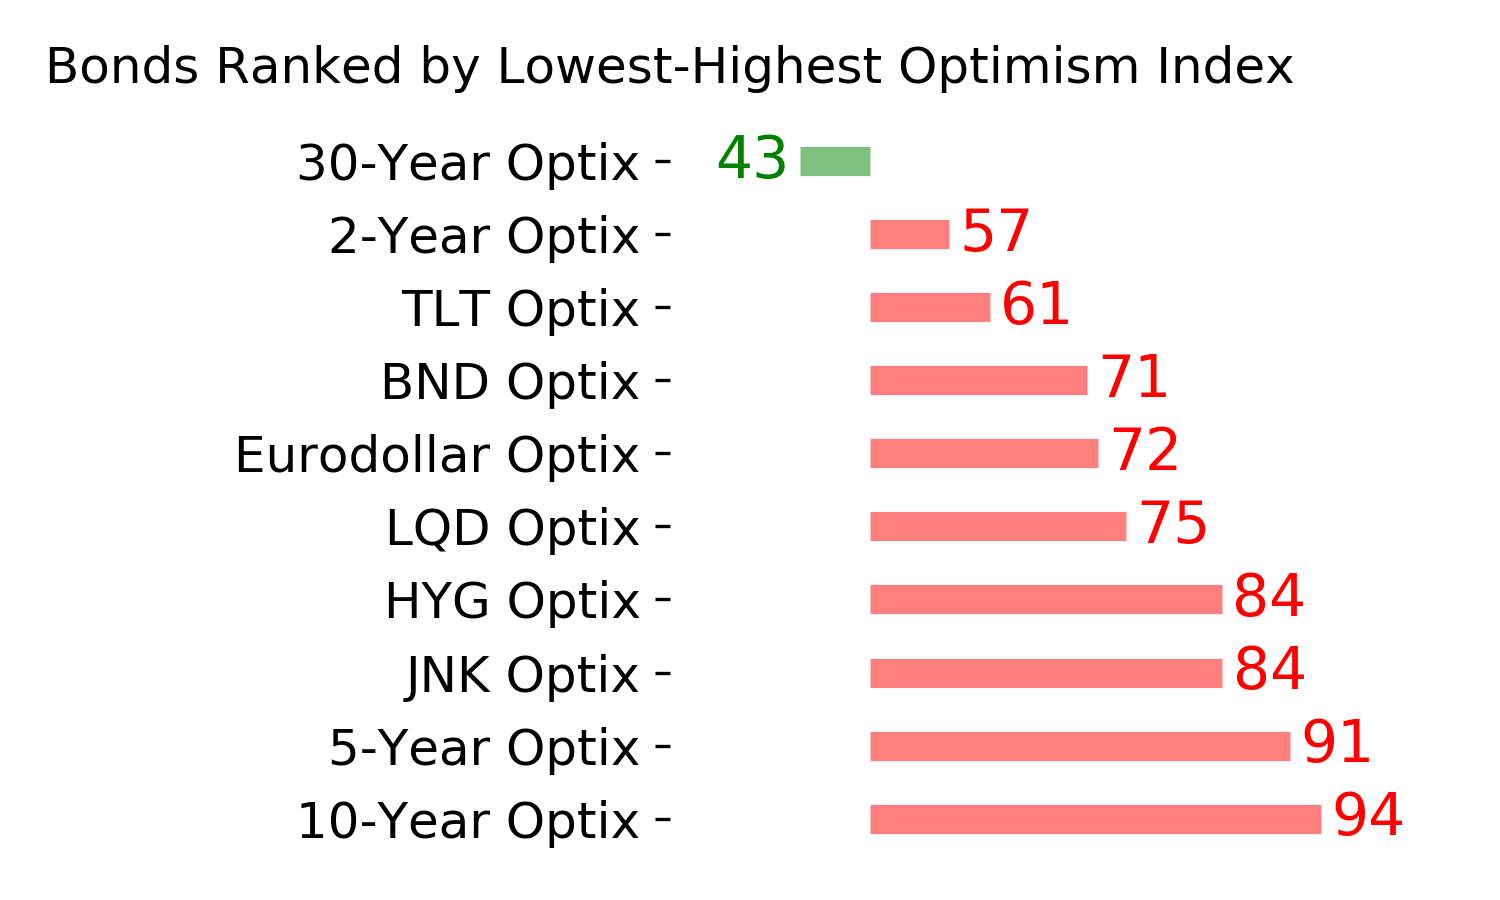
Ranks
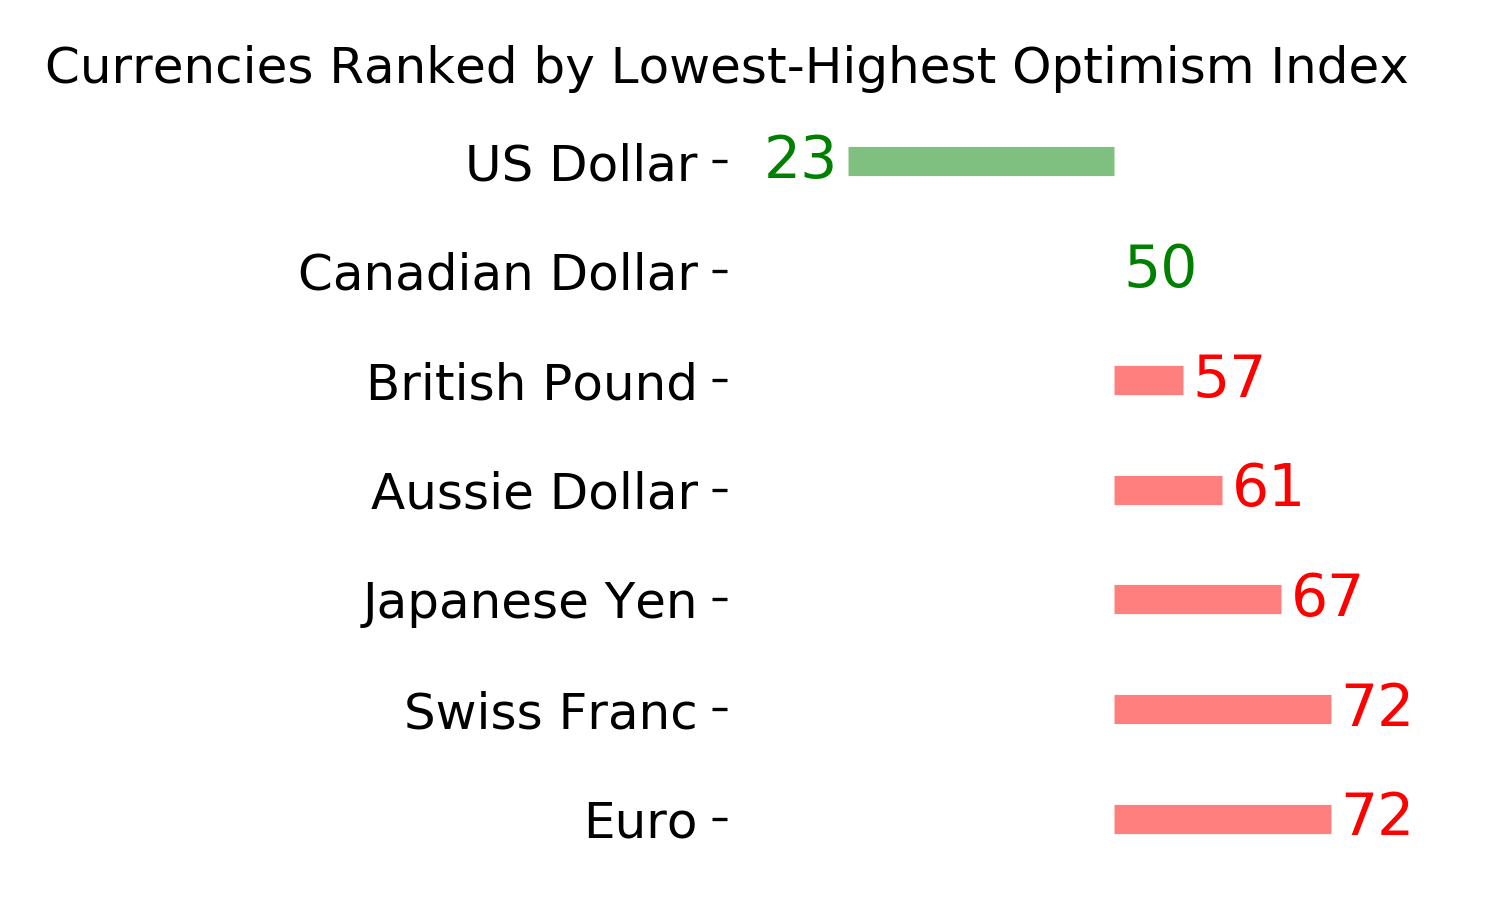
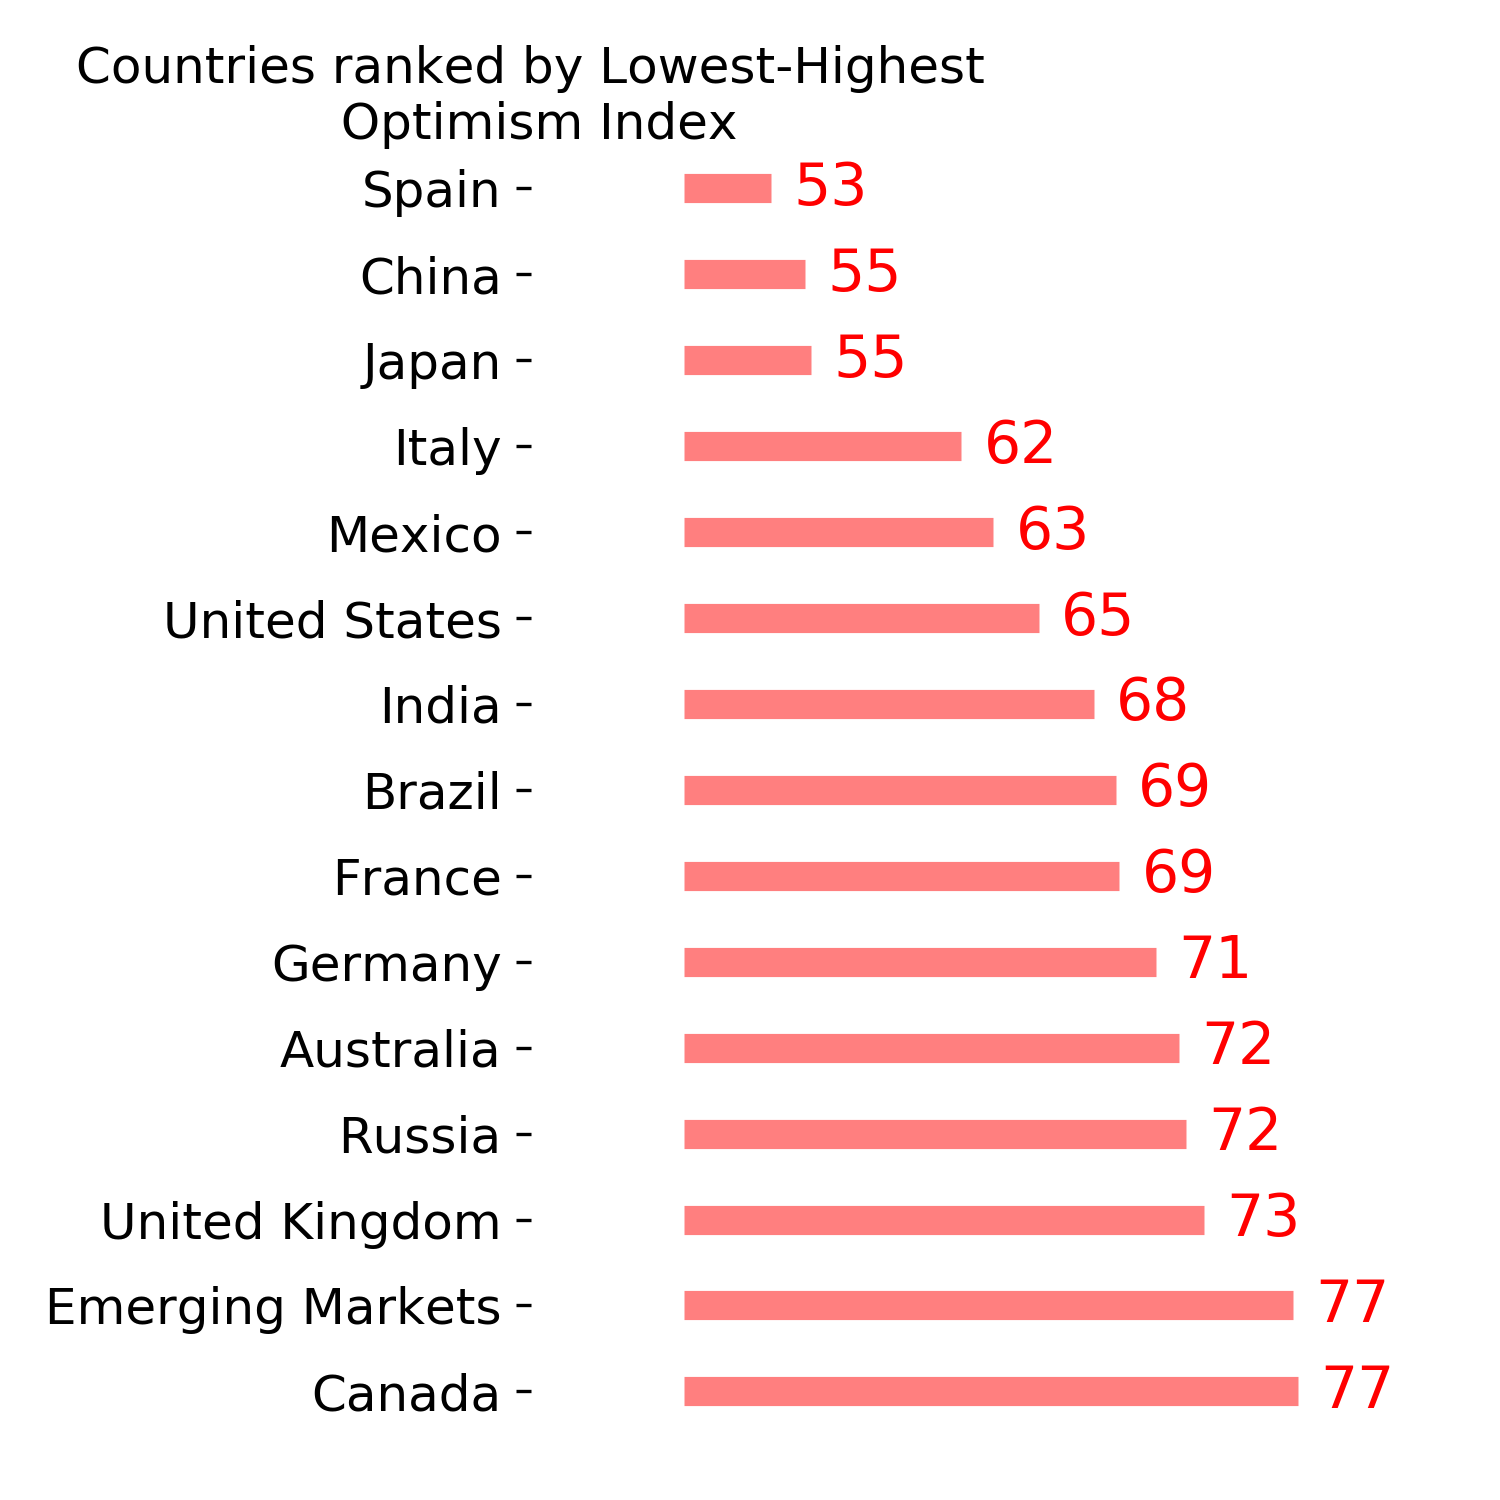
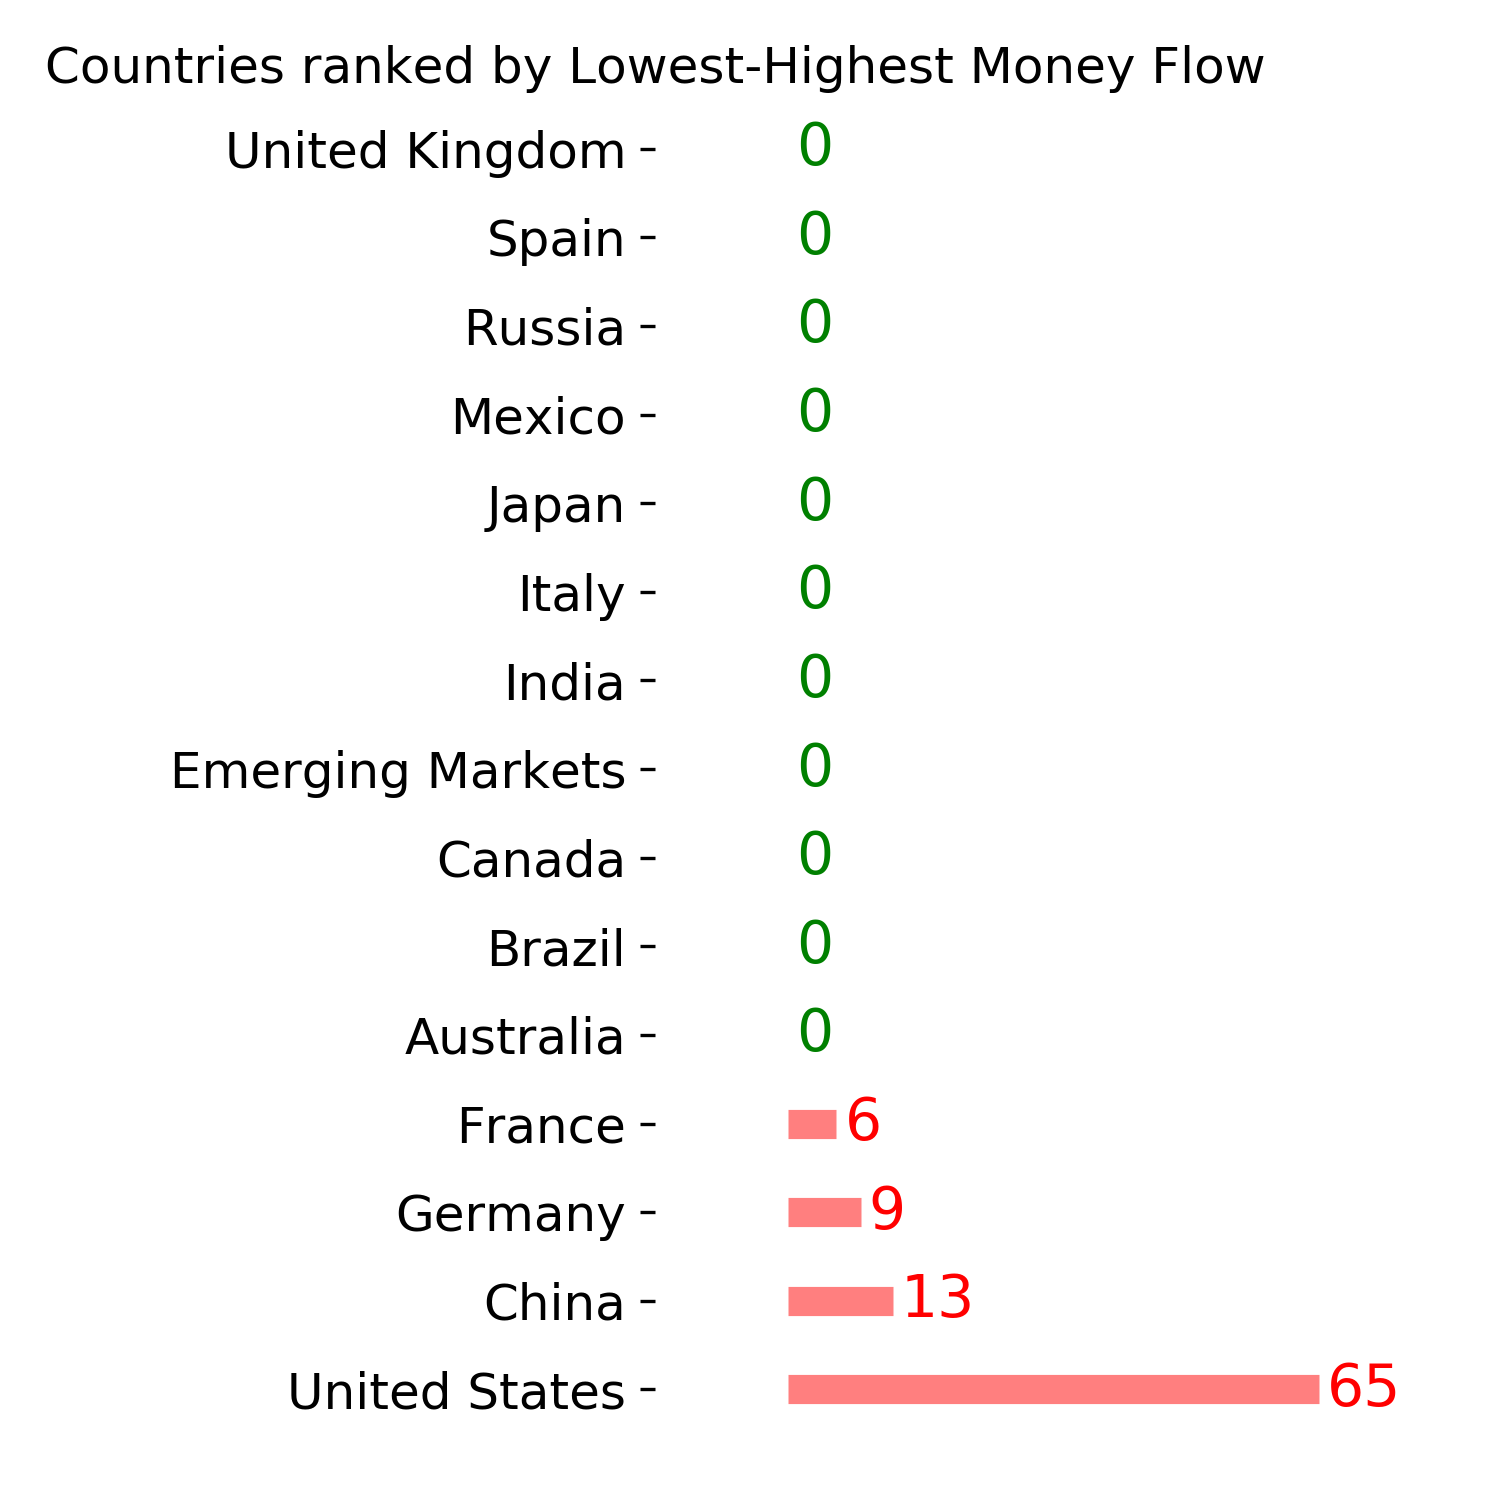
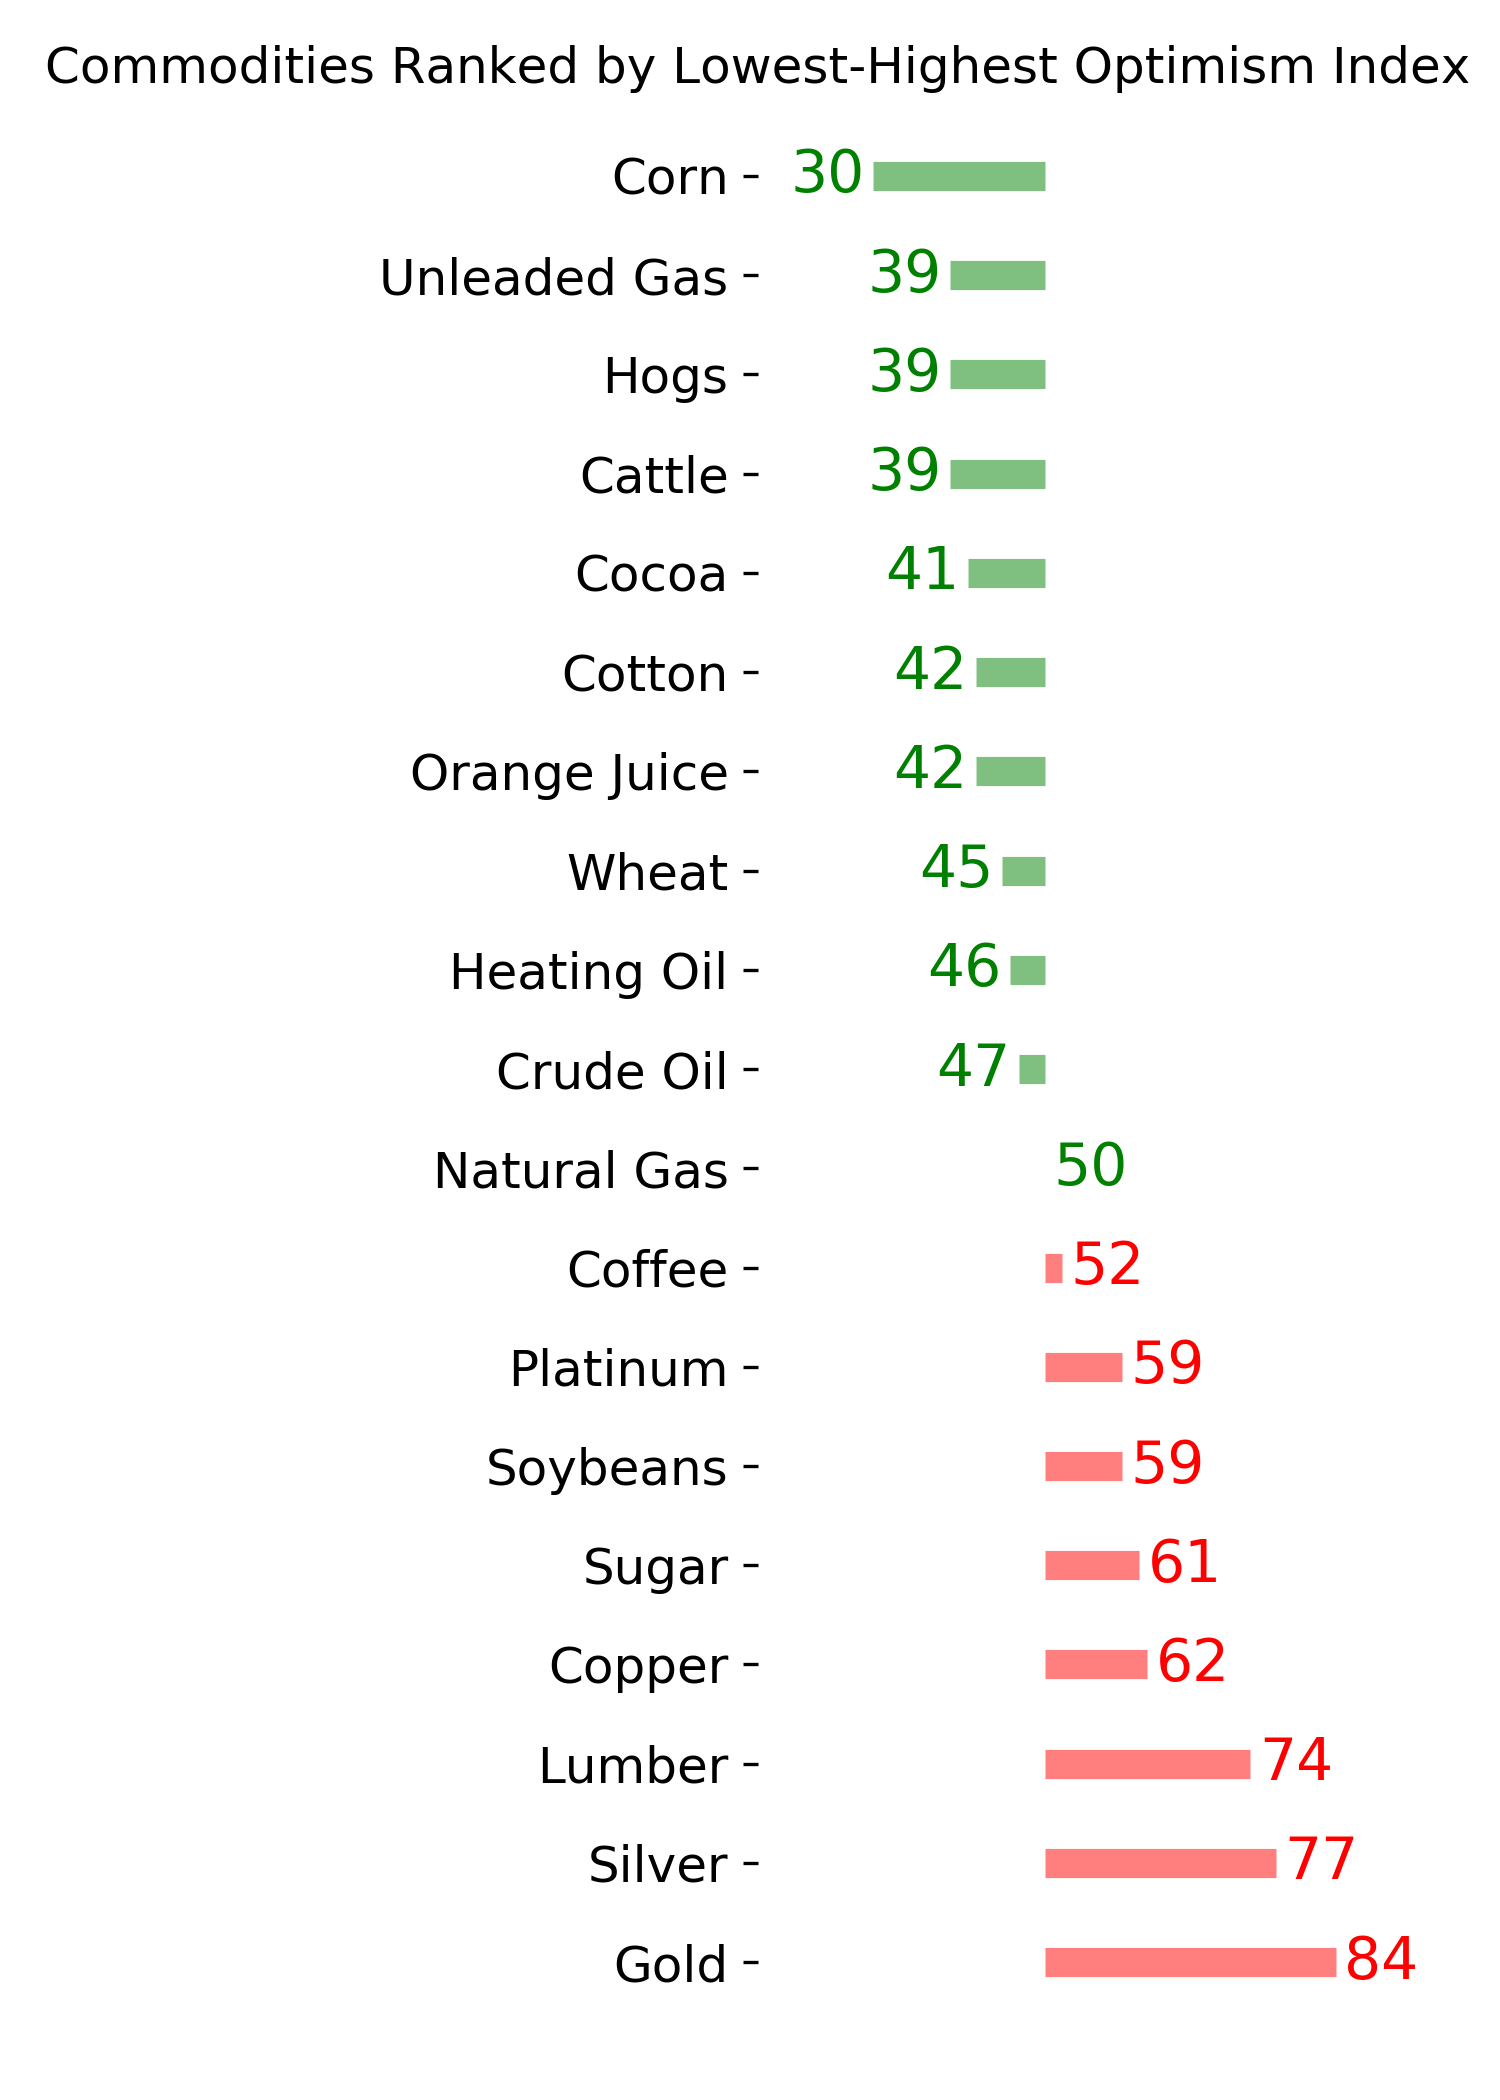
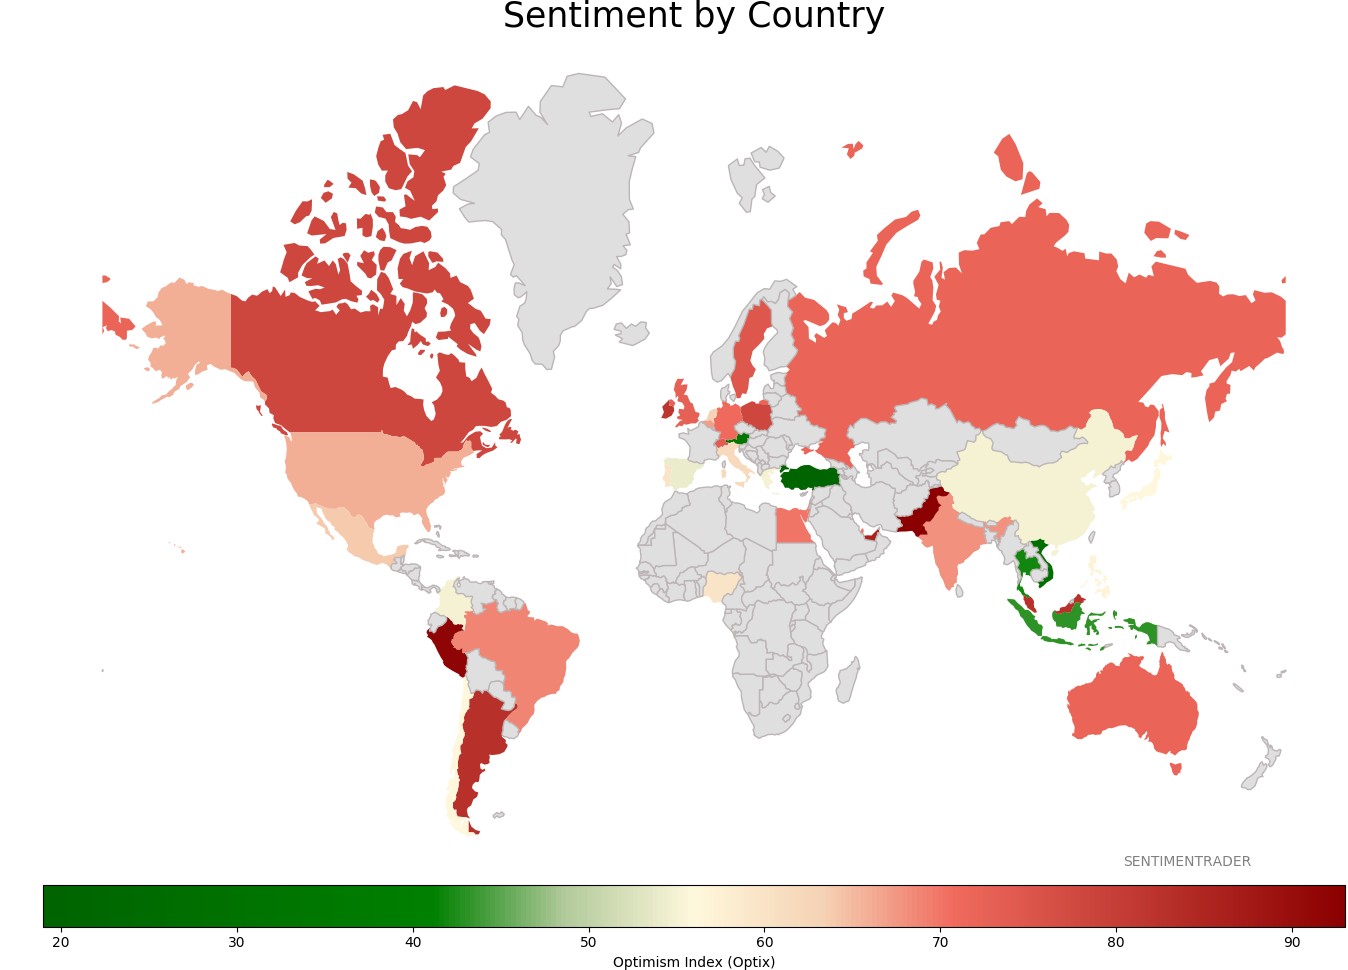
Sentiment Around The World
Optimism Index Thumbnails
|
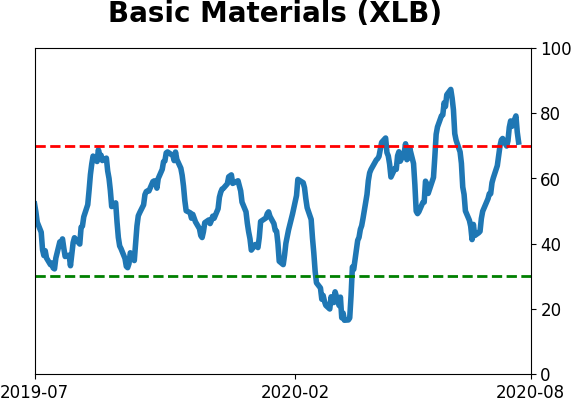
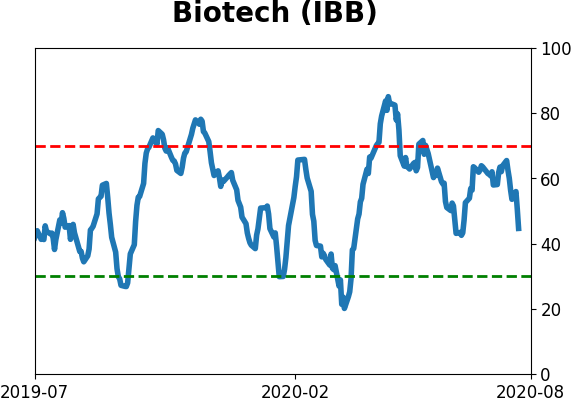
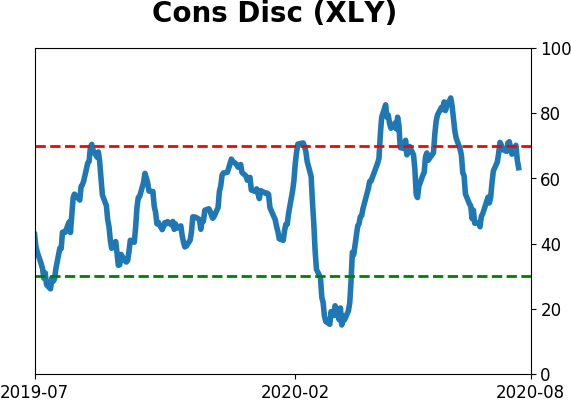
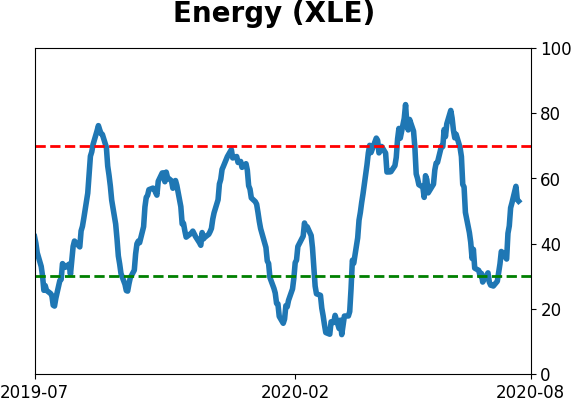
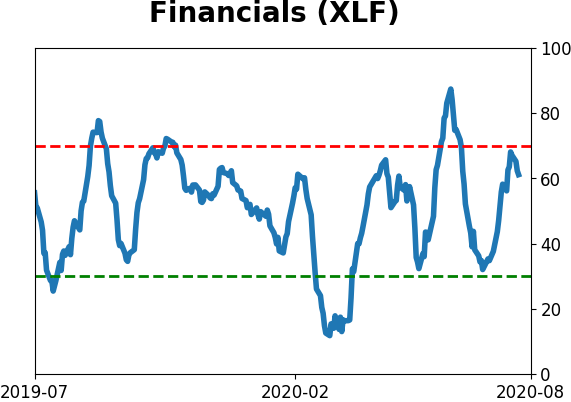
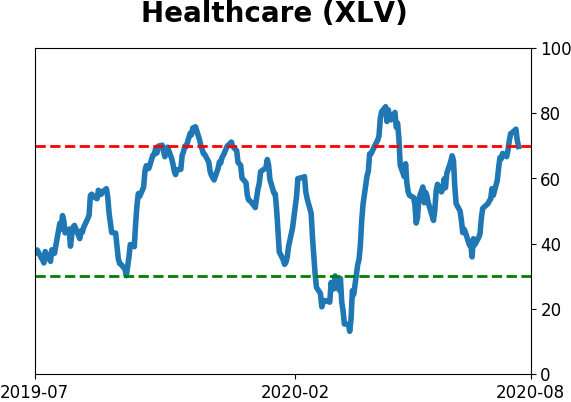
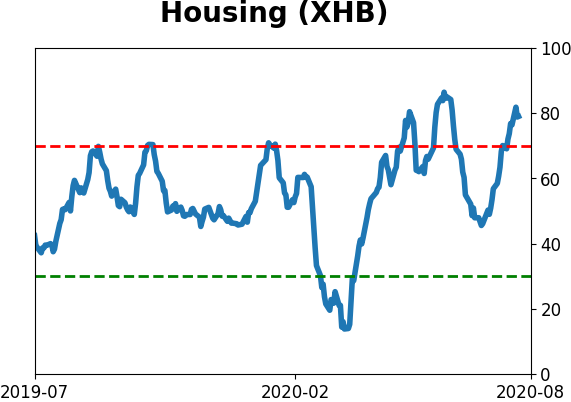
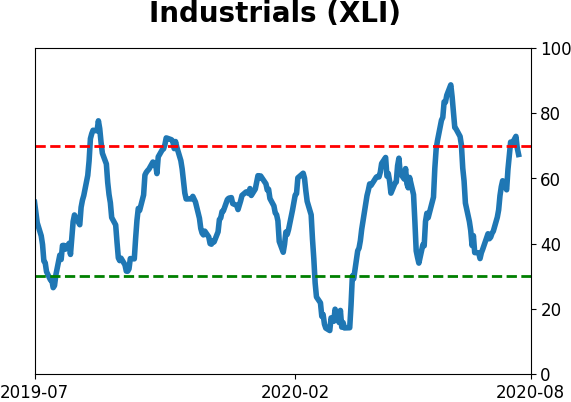
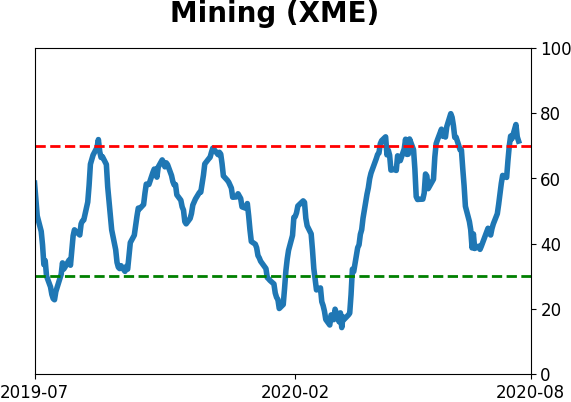
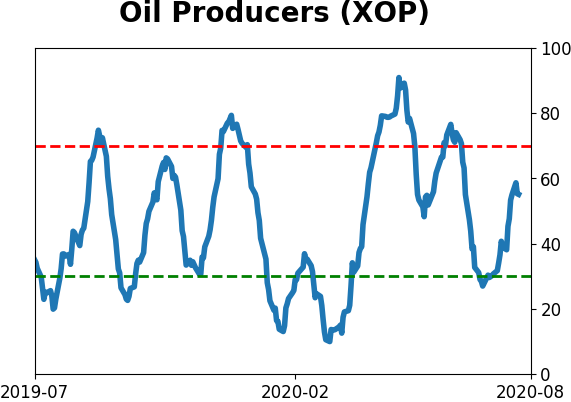
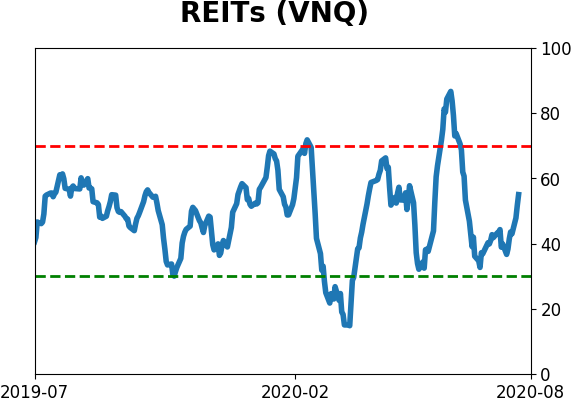
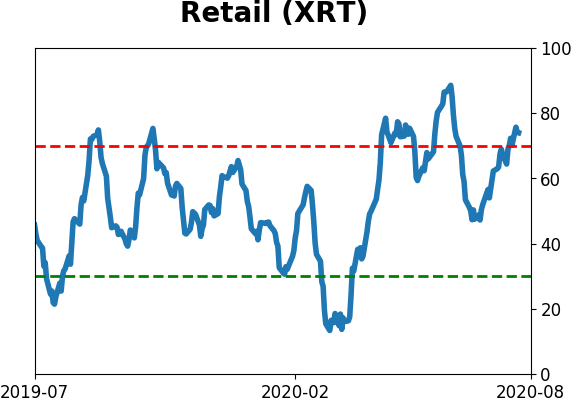
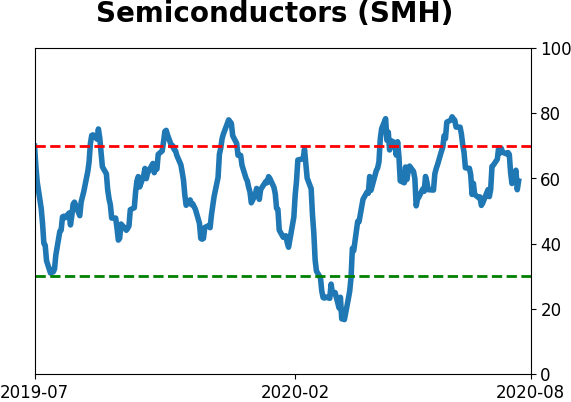
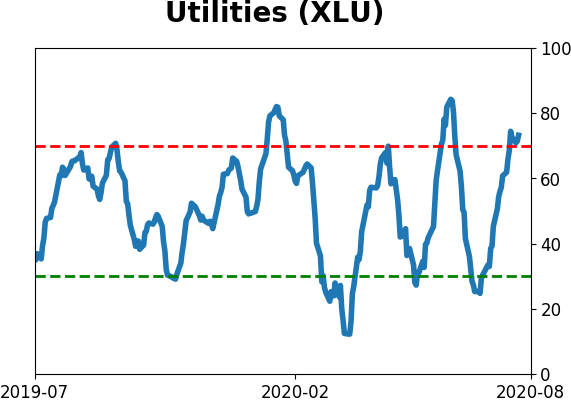
Sector ETF's - 10-Day Moving Average
|
|
|
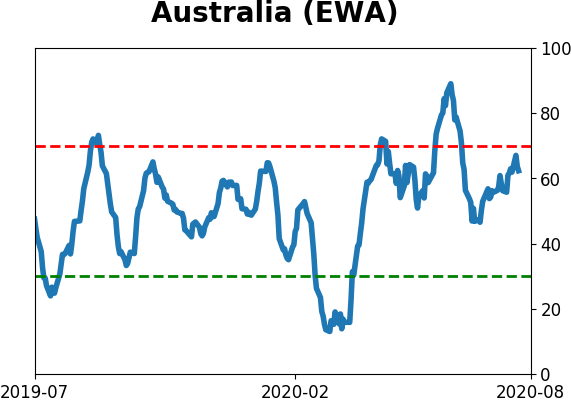
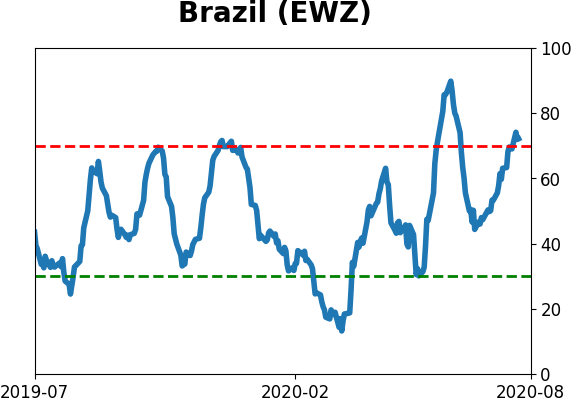
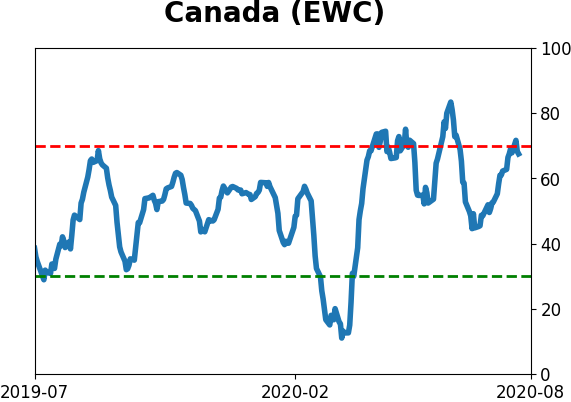
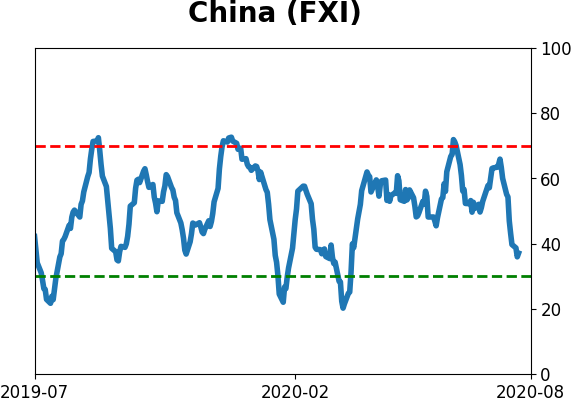
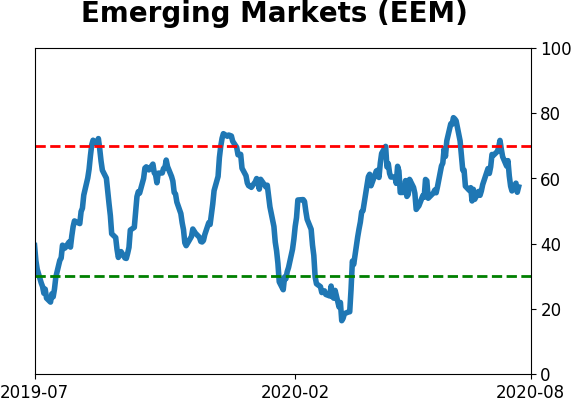
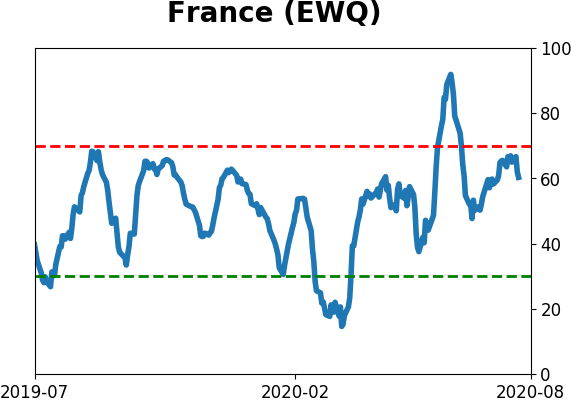
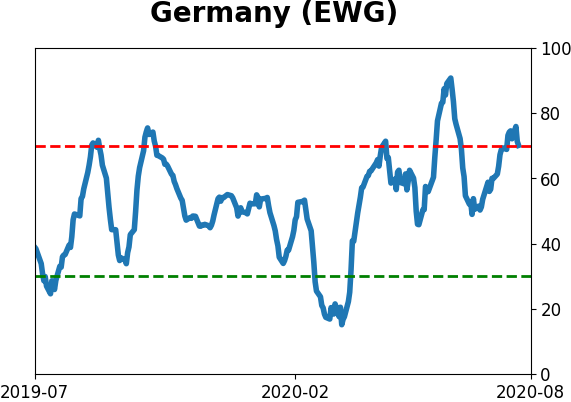
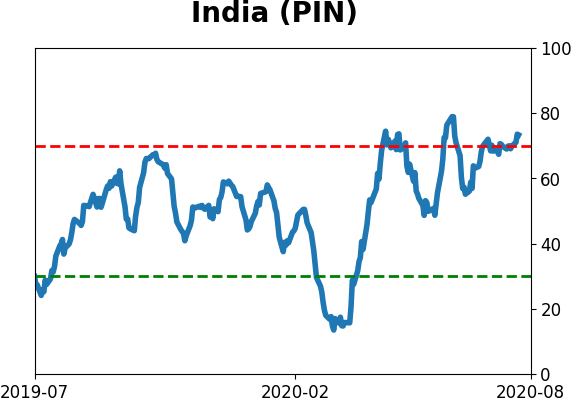
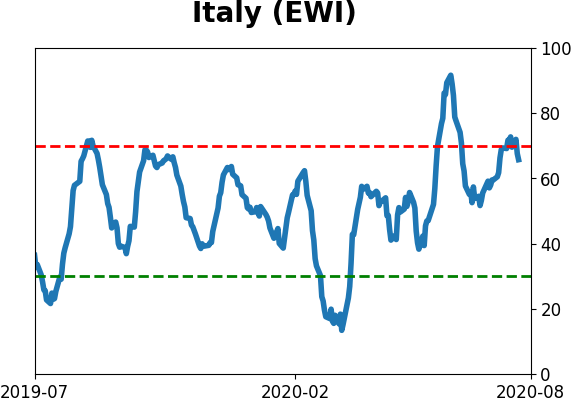
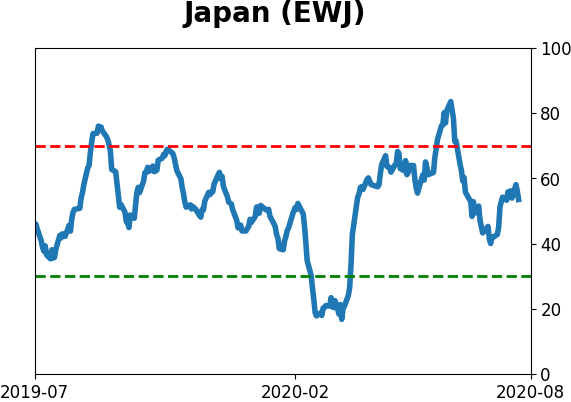
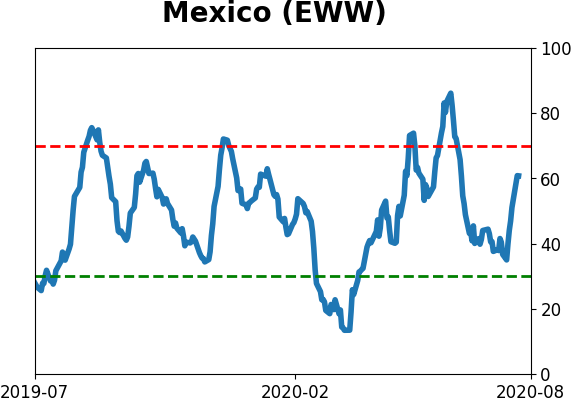
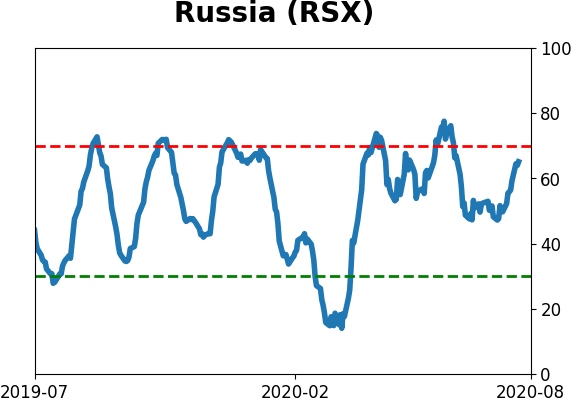
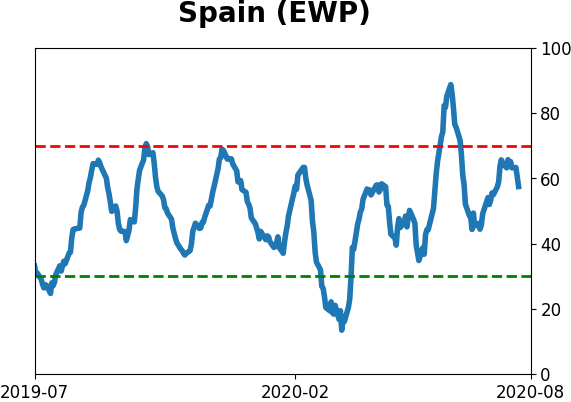
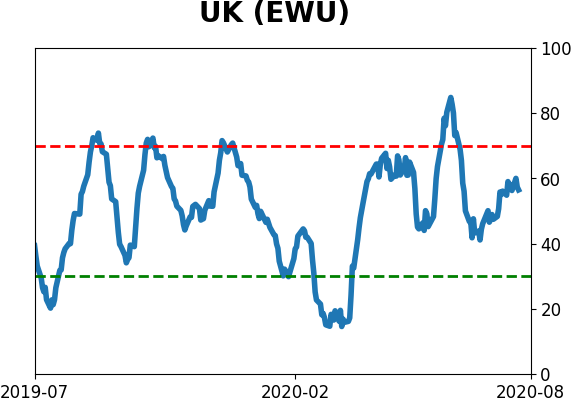
Country ETF's - 10-Day Moving Average
|
|
|
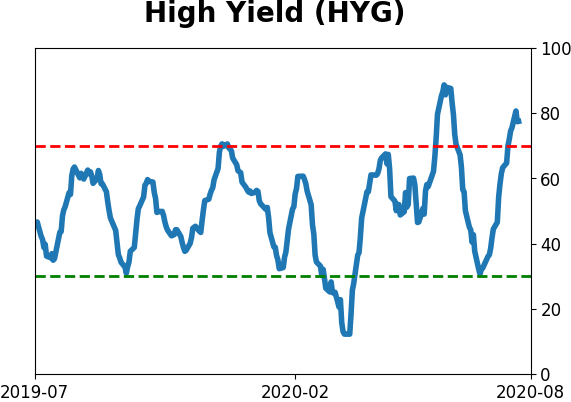
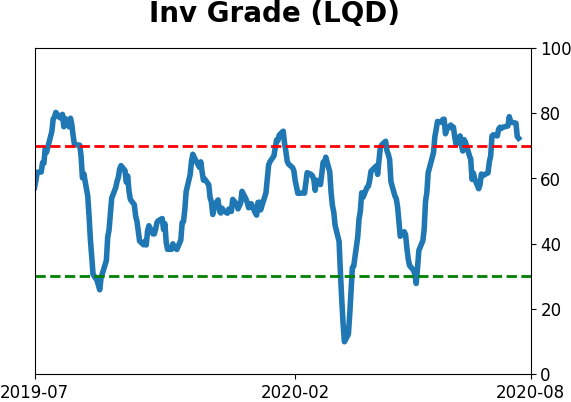
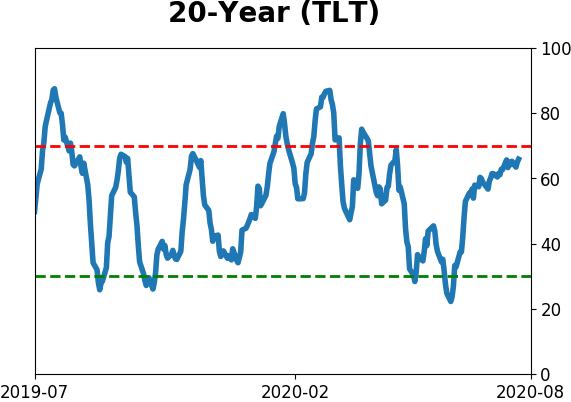
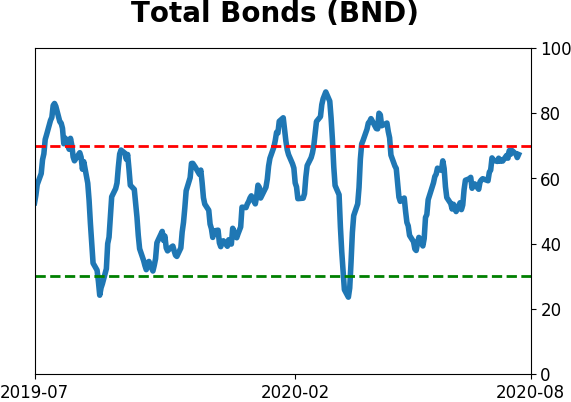
Bond ETF's - 10-Day Moving Average
|
|
|
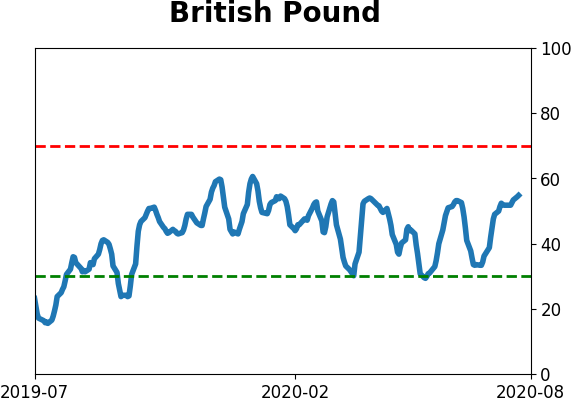
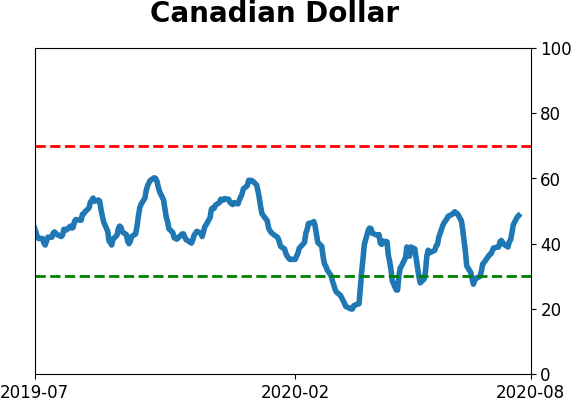
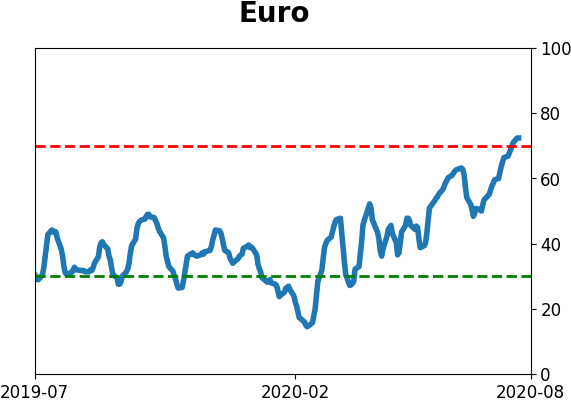
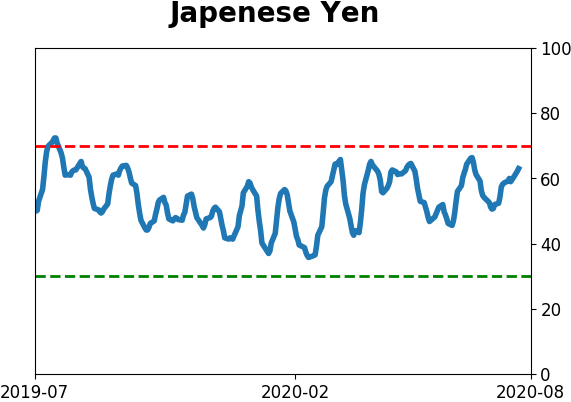
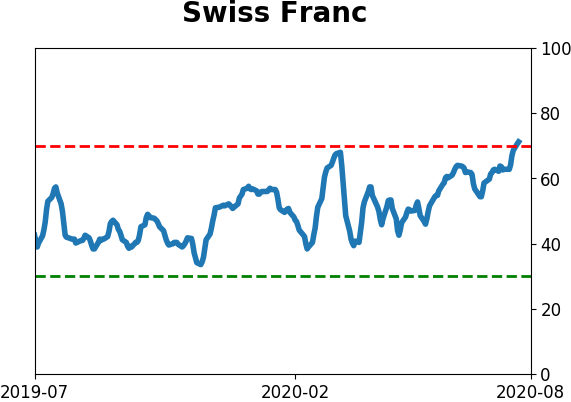
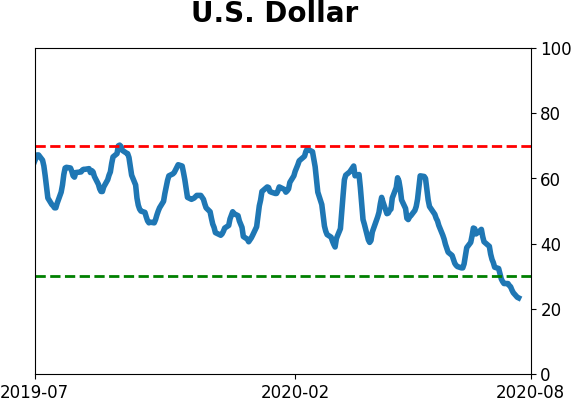
Currency ETF's - 5-Day Moving Average
|
|
|
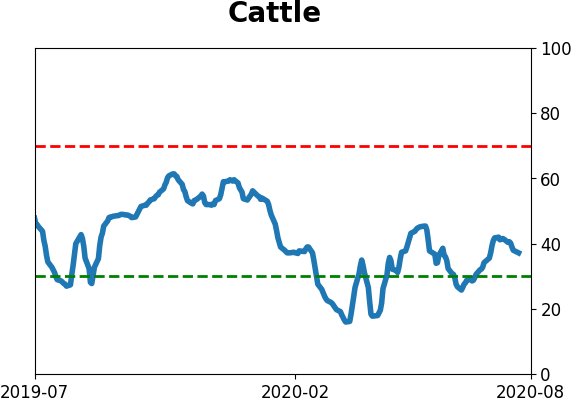
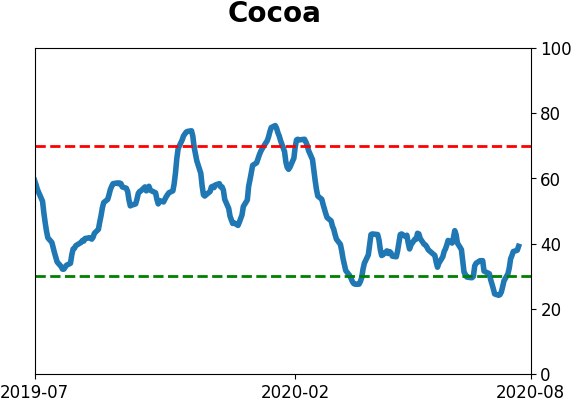
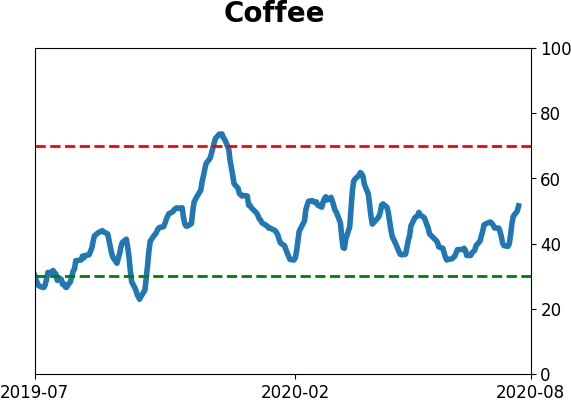
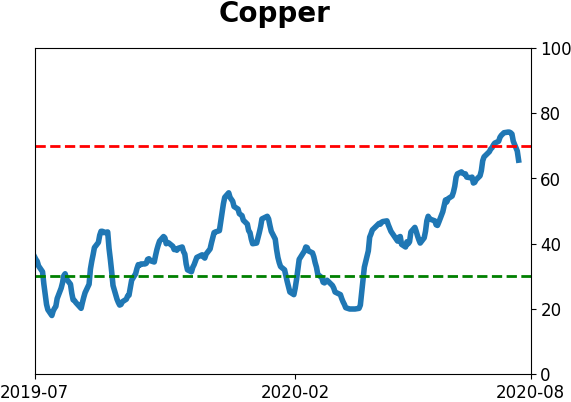
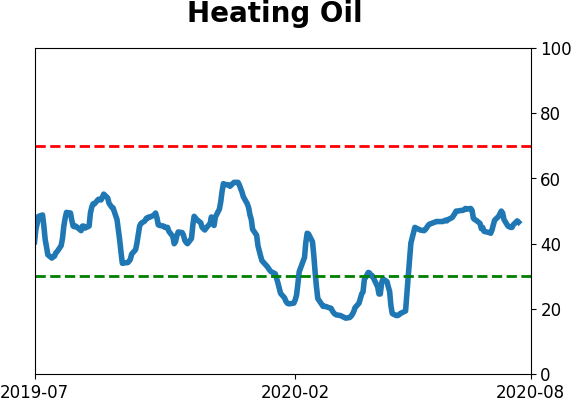
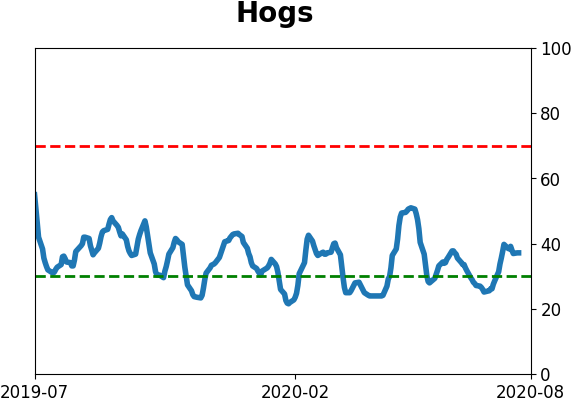
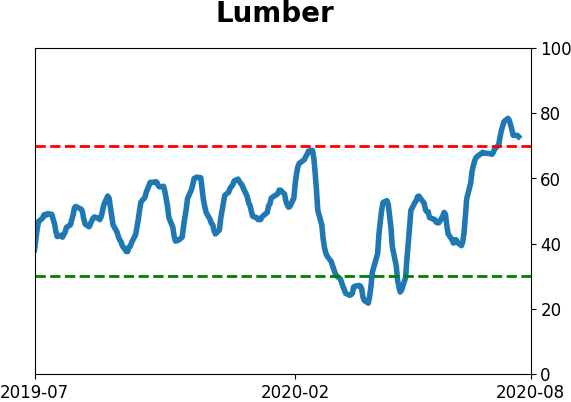
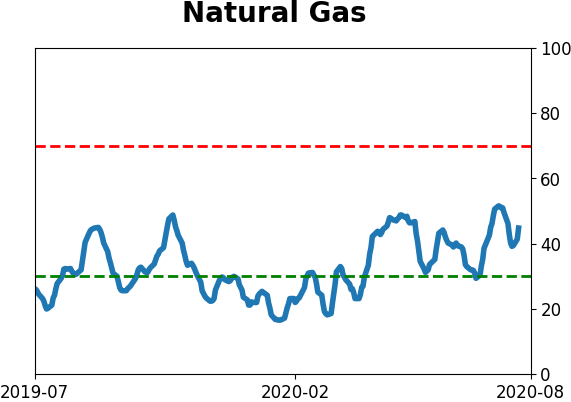
Commodity ETF's - 5-Day Moving Average
|
|