Headlines
|
|
High-yield bond market tries another recovery:
Over the past week, there has been a surge in advancing high-yield bonds. Internal momentum indicators are recovering, showing impressive thrusts that preceded short-term losses but long-term gains. The market is trying to recover from near-record levels of internal selling pressure.
|
Smart / Dumb Money Confidence
|
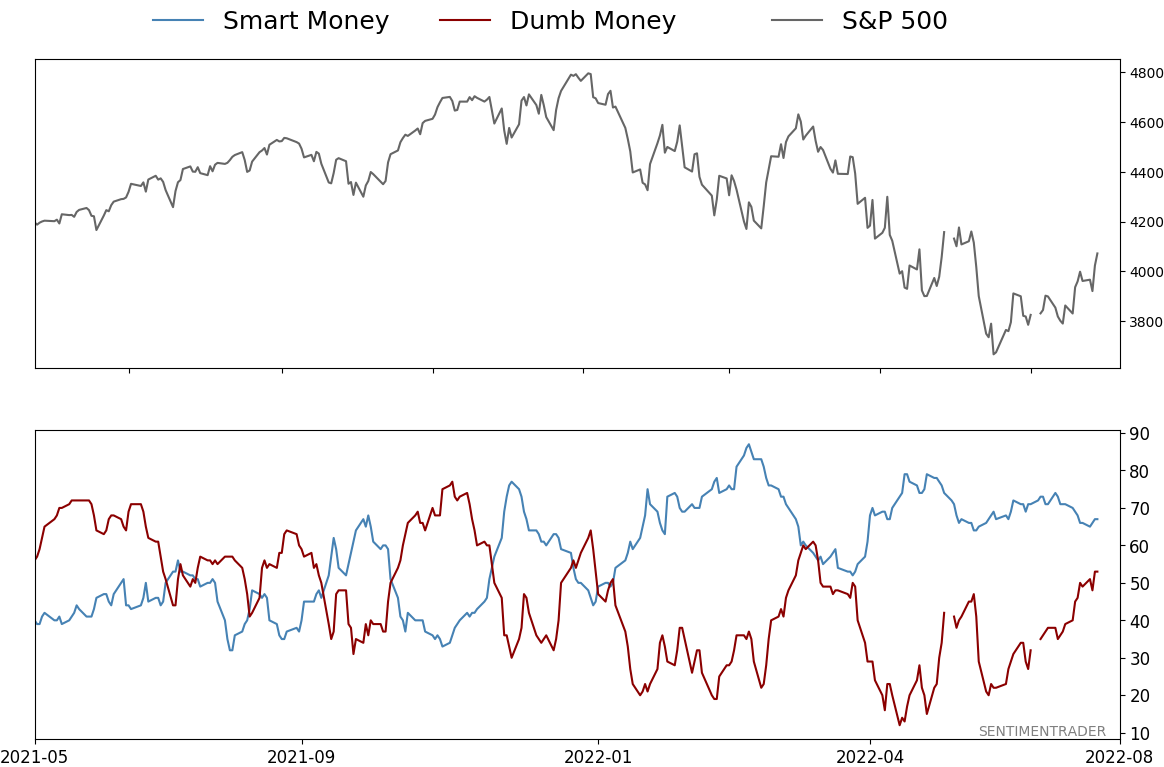
Smart Money Confidence: 67%
Dumb Money Confidence: 53%
|
|
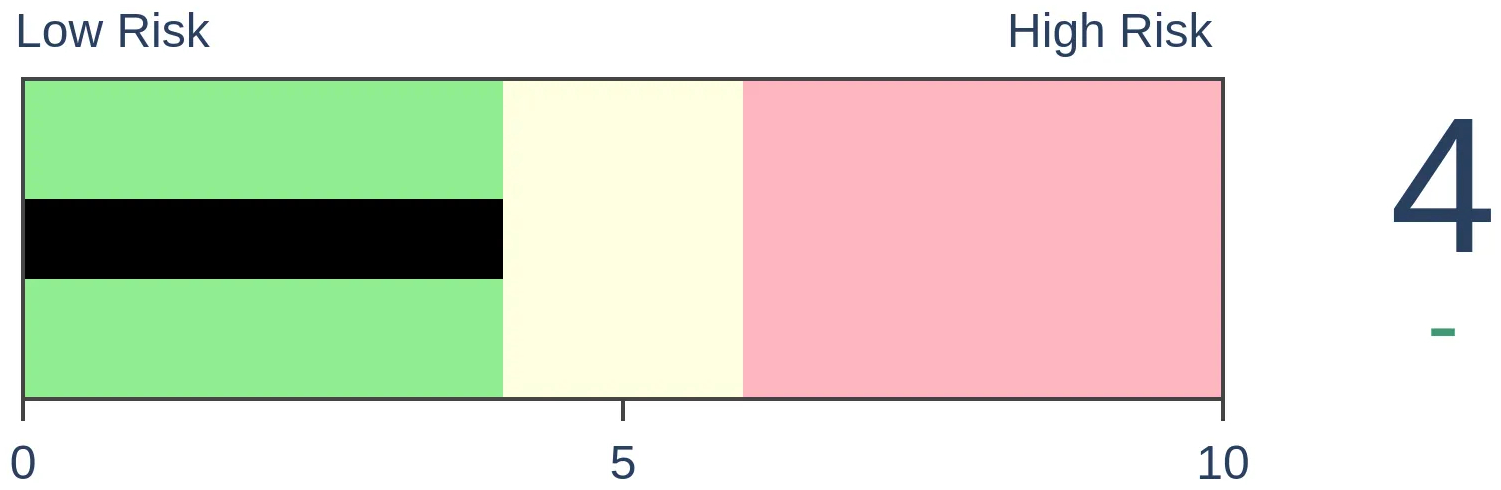
Risk Levels
Stocks Short-Term
|
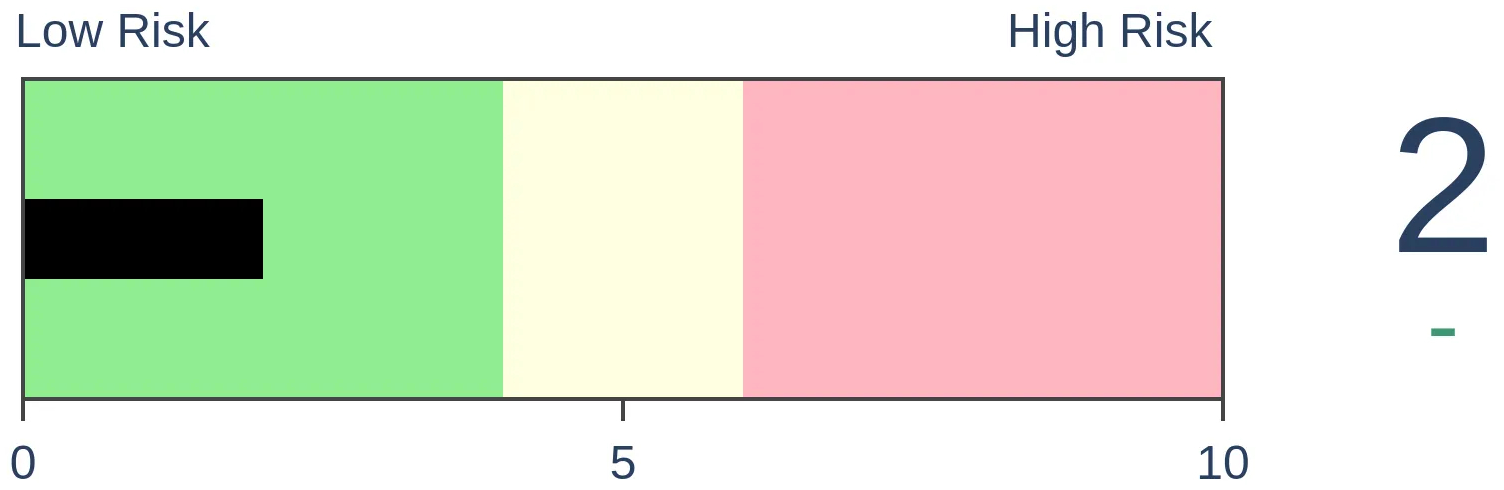
Stocks Medium-Term

|
|
Bonds
|
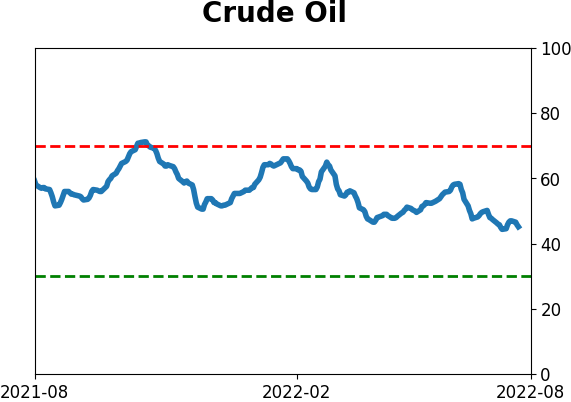
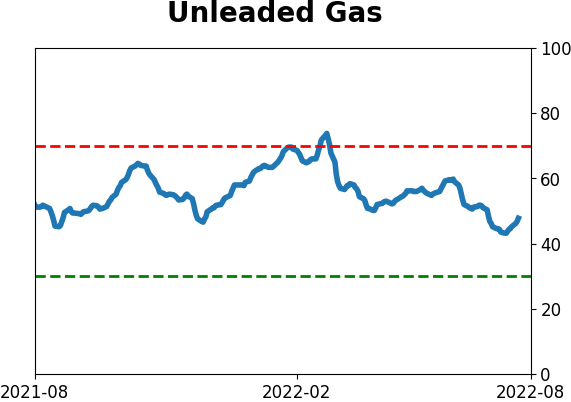
Crude Oil
|
|
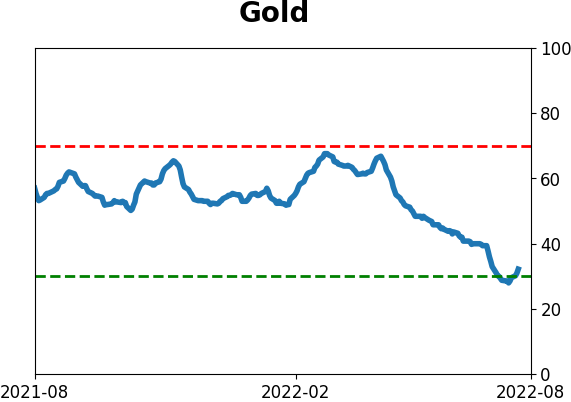
Gold
|
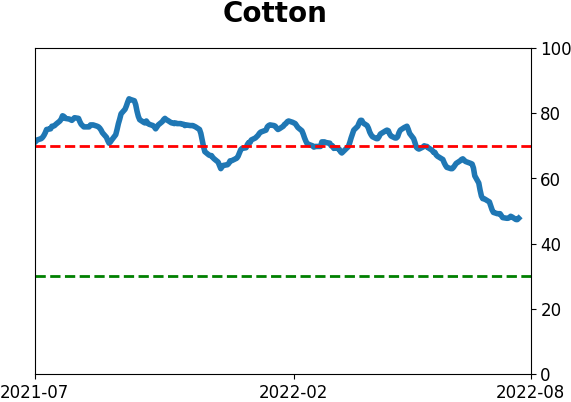
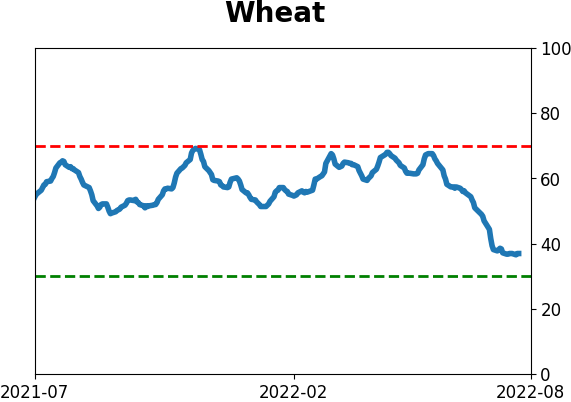
Agriculture

|
|
Research
By Jason Goepfert
BOTTOM LINE
Over the past week, there has been a surge in advancing high-yield bonds. Internal momentum indicators are recovering, showing impressive thrusts that preceded short-term losses but long-term gains. The market is trying to recover from near-record levels of internal selling pressure.
FORECAST / TIMEFRAME
HYG -- Up, Long-Term
|
Key points:
- There has been a surge in high-yield bonds advancing versus declining
- Similar surges preceded short-term pullbacks and long-term gains
- The market is trying to recover from its worst selling pressure in decades
The bear market in bonds is seeing some relief
As investors weigh the probability of a recession, it's depth, and future Fed response, one key area to watch is the high-yield corporate bond market.
As night follows day, investors pulled back on their appetite for these bonds after gorging on them in recent years. That allowed many undeserving companies to issue low-cost debt with few investor protections. The Wall Street Journal notes:
"The doldrums for bond sales by low-rated companies show no signs of ending, with July set to bring the slowest pace of new issuance in at least a decade and a half."
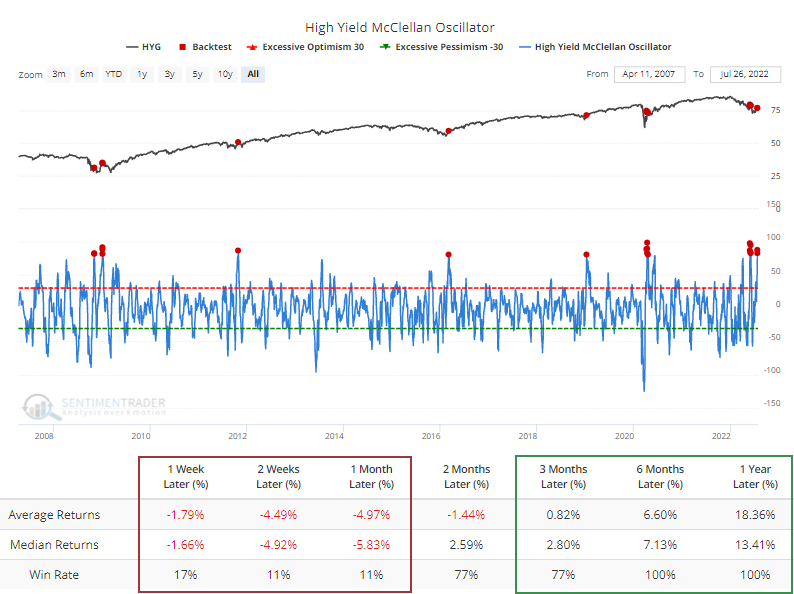
After a complete shellacking in June, many of these bonds have stabilized and there are some signs of recovery. In recent days, the McClellan Oscillator, a reflection of internal momentum, crossed above +80, an extremely strong number. There was a thrust in April, too; it failed immediately and miserably.
Maybe the difference this time is that we're seeing a more impressive thrust. The Backtest Engine shows that while the most popular high-yield bond fund, HYG, suffered short-term losses nearly every time, long-term returns were excellent.
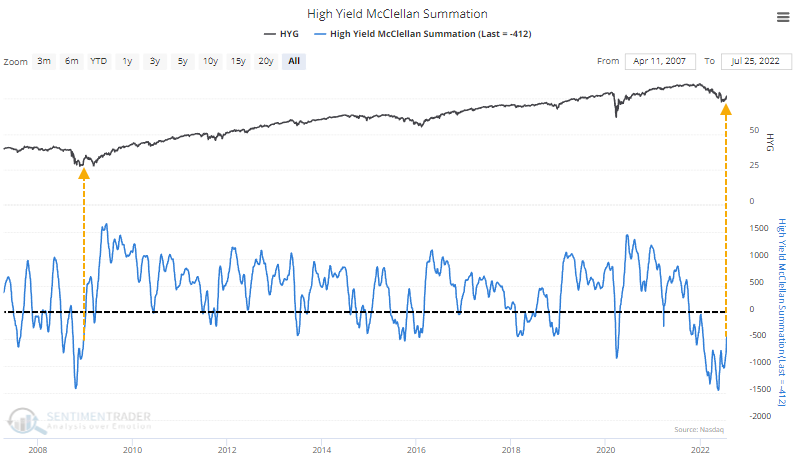
The jump in the McClellan Oscillator is helping to bring the Summation Index out of its deep funk. This is the first time in six months that the Summation Index climbed above -500. That's a remarkable streak of negative momentum, more than double the number of days the index spent below -500 during the financial crisis.
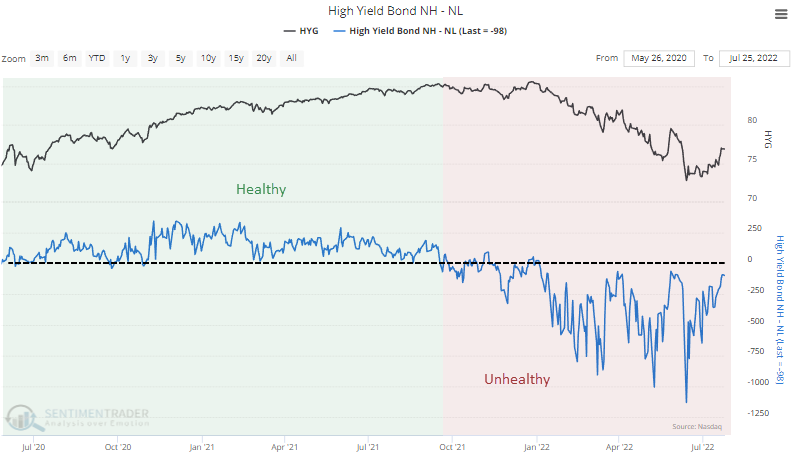
The delineation between a healthy and unhealthy market has been clear, and it's still clearly the latter. A handy way to determine this is simply by watching how many bonds (or indexes, or sectors, or stocks) are reaching 52-week highs minus those falling to 52-week lows. If highs are greater than lows, it's a reliable sign of a sustainable, healthy uptrend.
That is not the case in high-yield bonds. There have been a few days when highs outnumbered lows since last fall, but it's been deeply negative for most of the past six months.
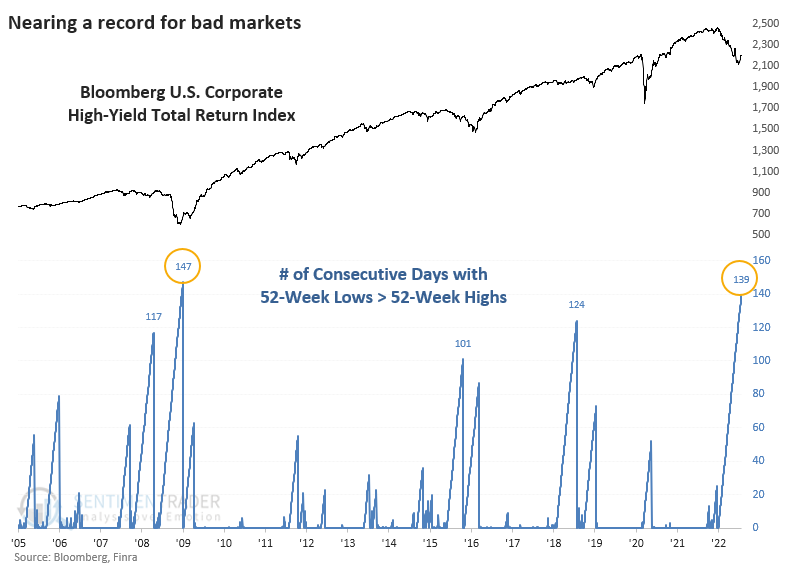
Like so many positives in recent weeks and months, across almost all markets, the only bright side for investors is that things are so bad that they're potentially good. High-yield bonds are nearing a record number of consecutive days when the number of 52-week lows outnumbered 52-week highs.
What the research tells us...
The high-yield bond market tends to track the stock market as much (or more) than the broader bond market. As such, it's suffered the double-whammy of a poor stock market and horrible bond market. Unfortunately, good data on high-yield bonds is limited, with only the financial crisis as a comparison. Even during that existential crisis, junk bonds haven't suffered as much selling as the past six months, or as severe. The recent surge in buying interest has been a reliable bullish sign for that market, though bulls have to hope it's strong enough to make up for the failures seen earlier this year.
Indicators at Extremes
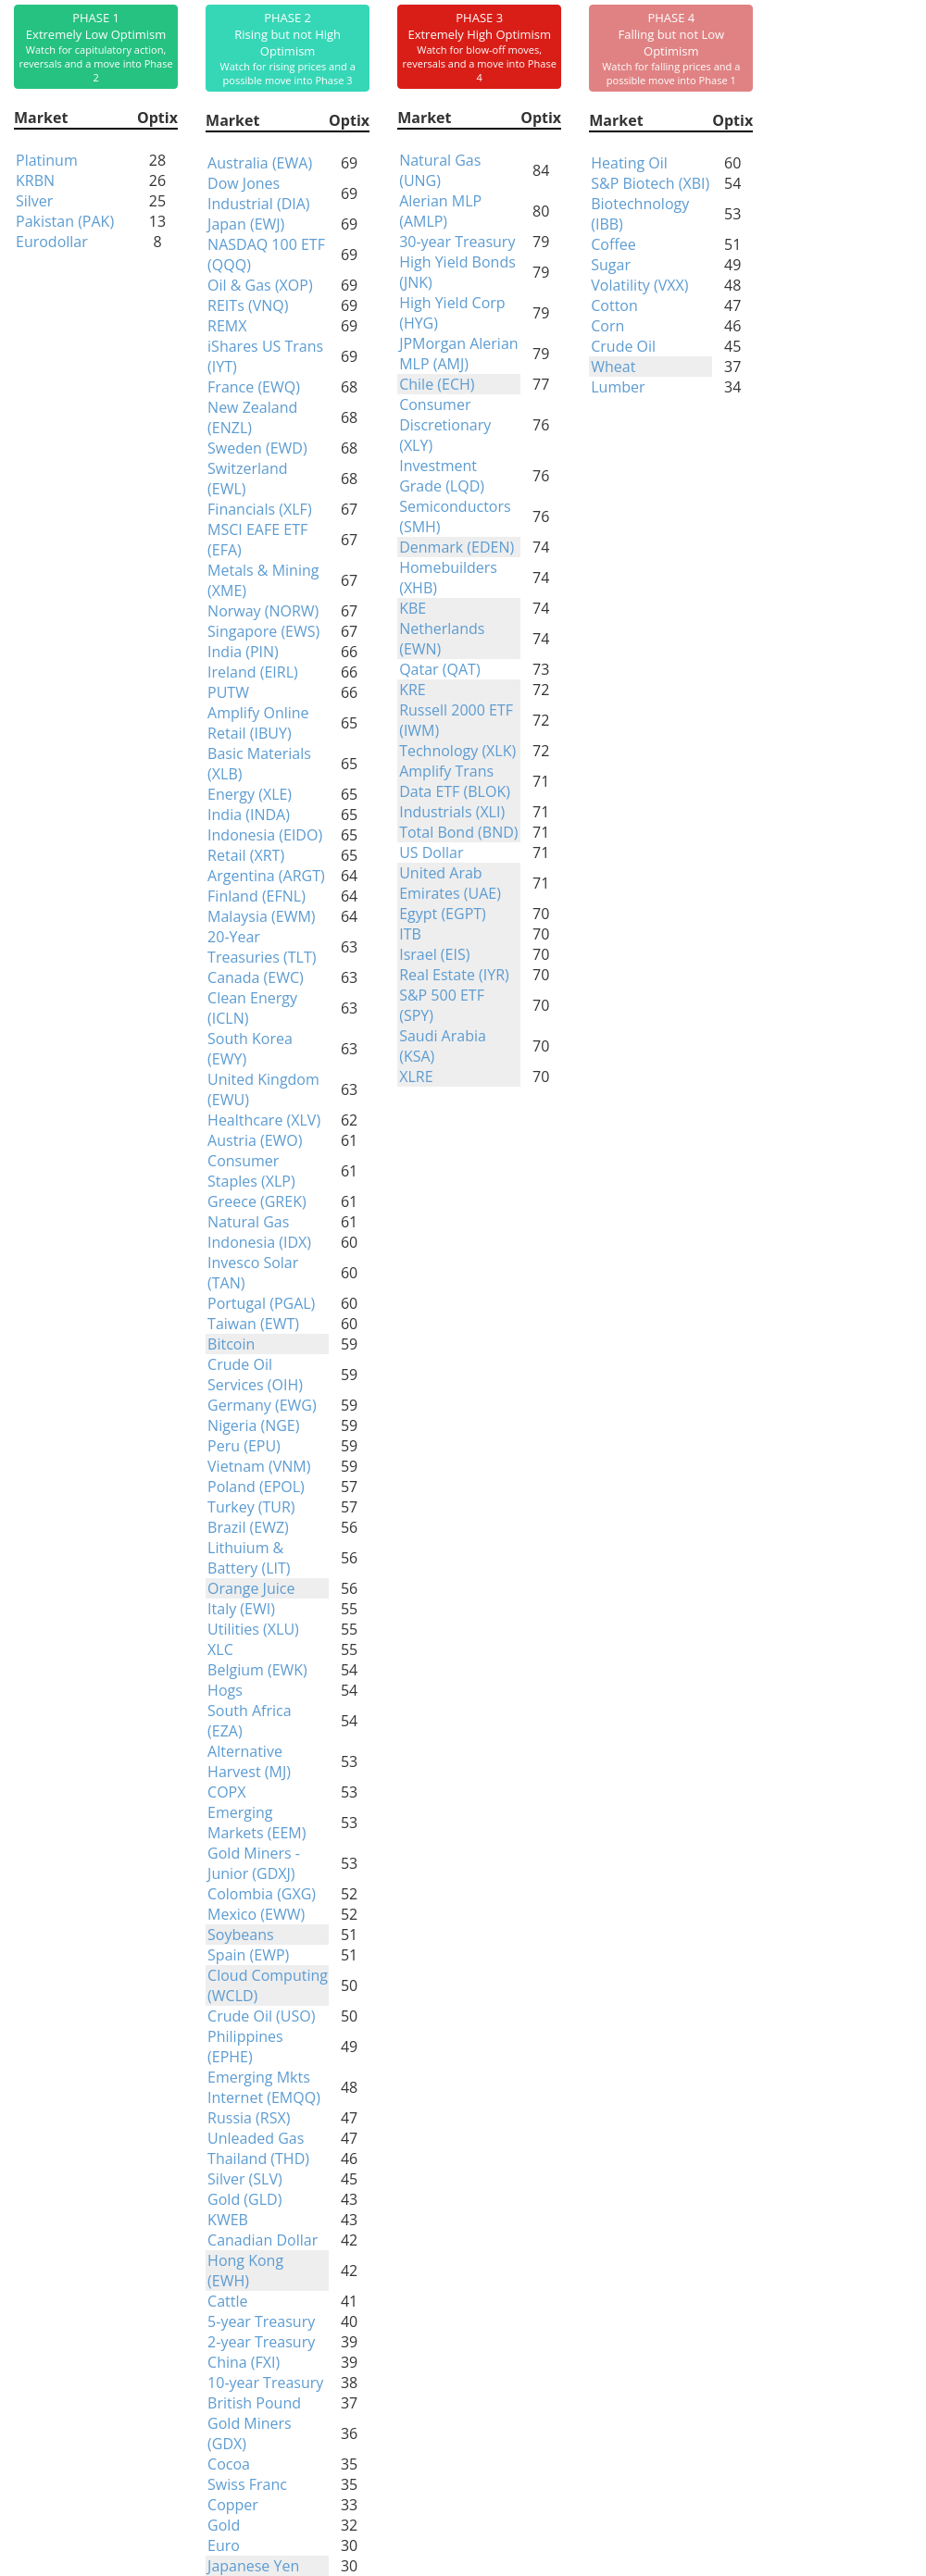
Phase Table
Ranks
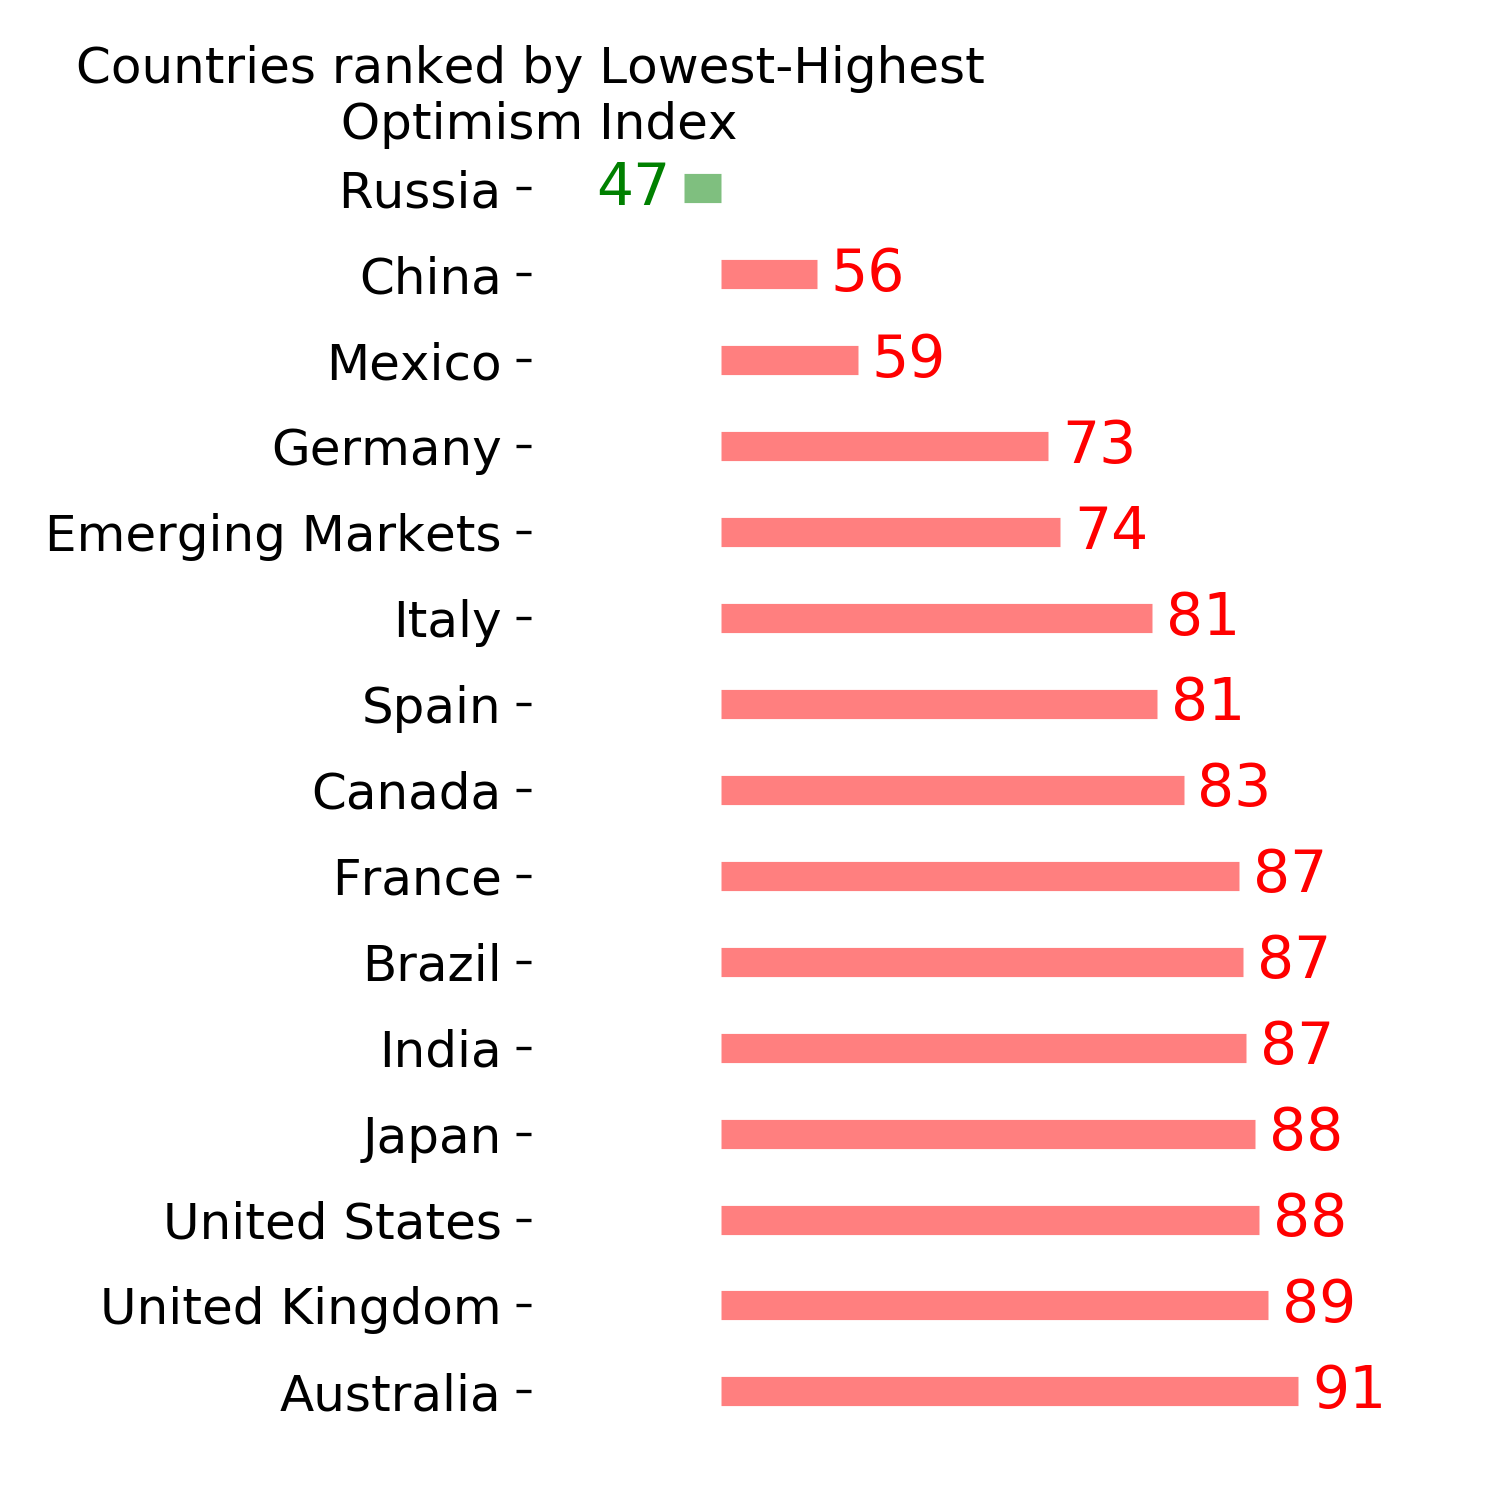
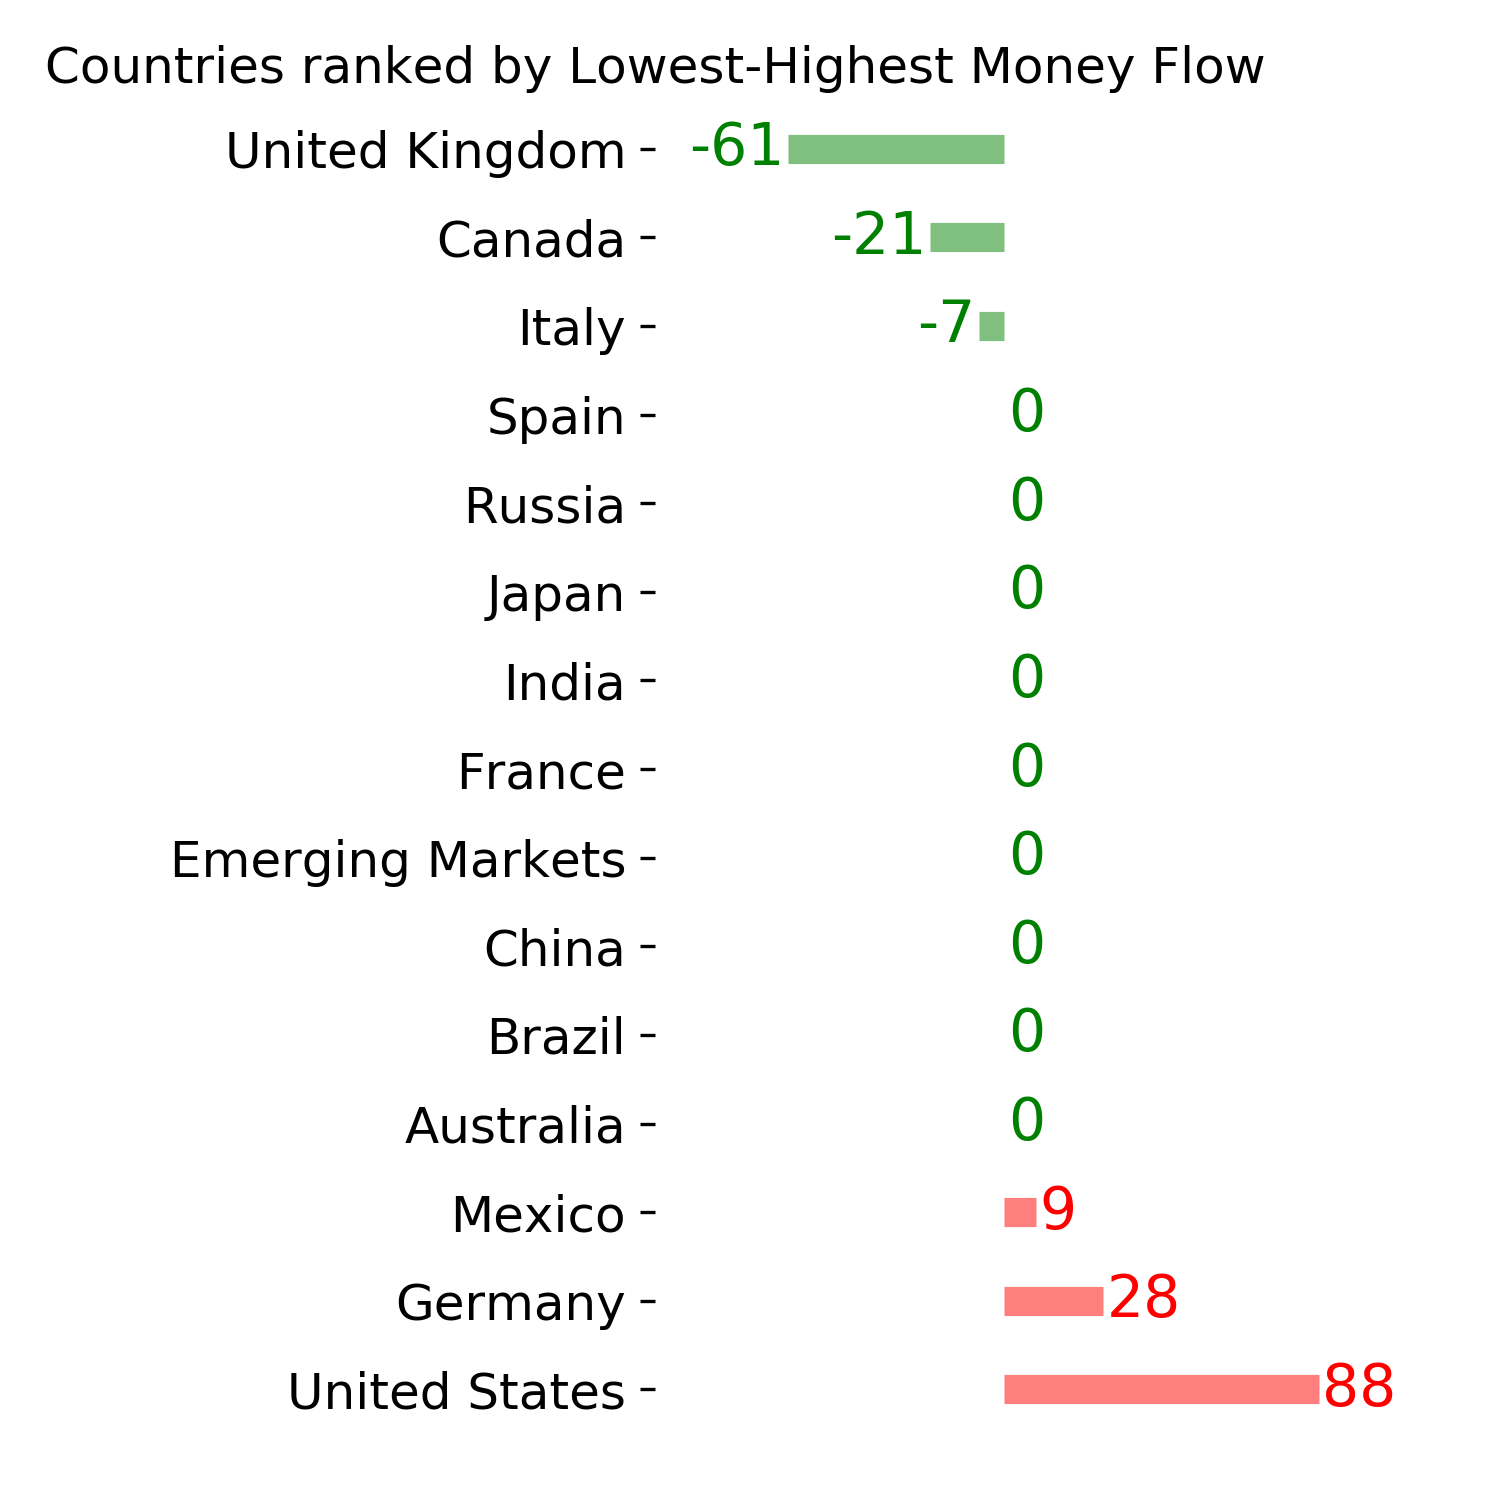
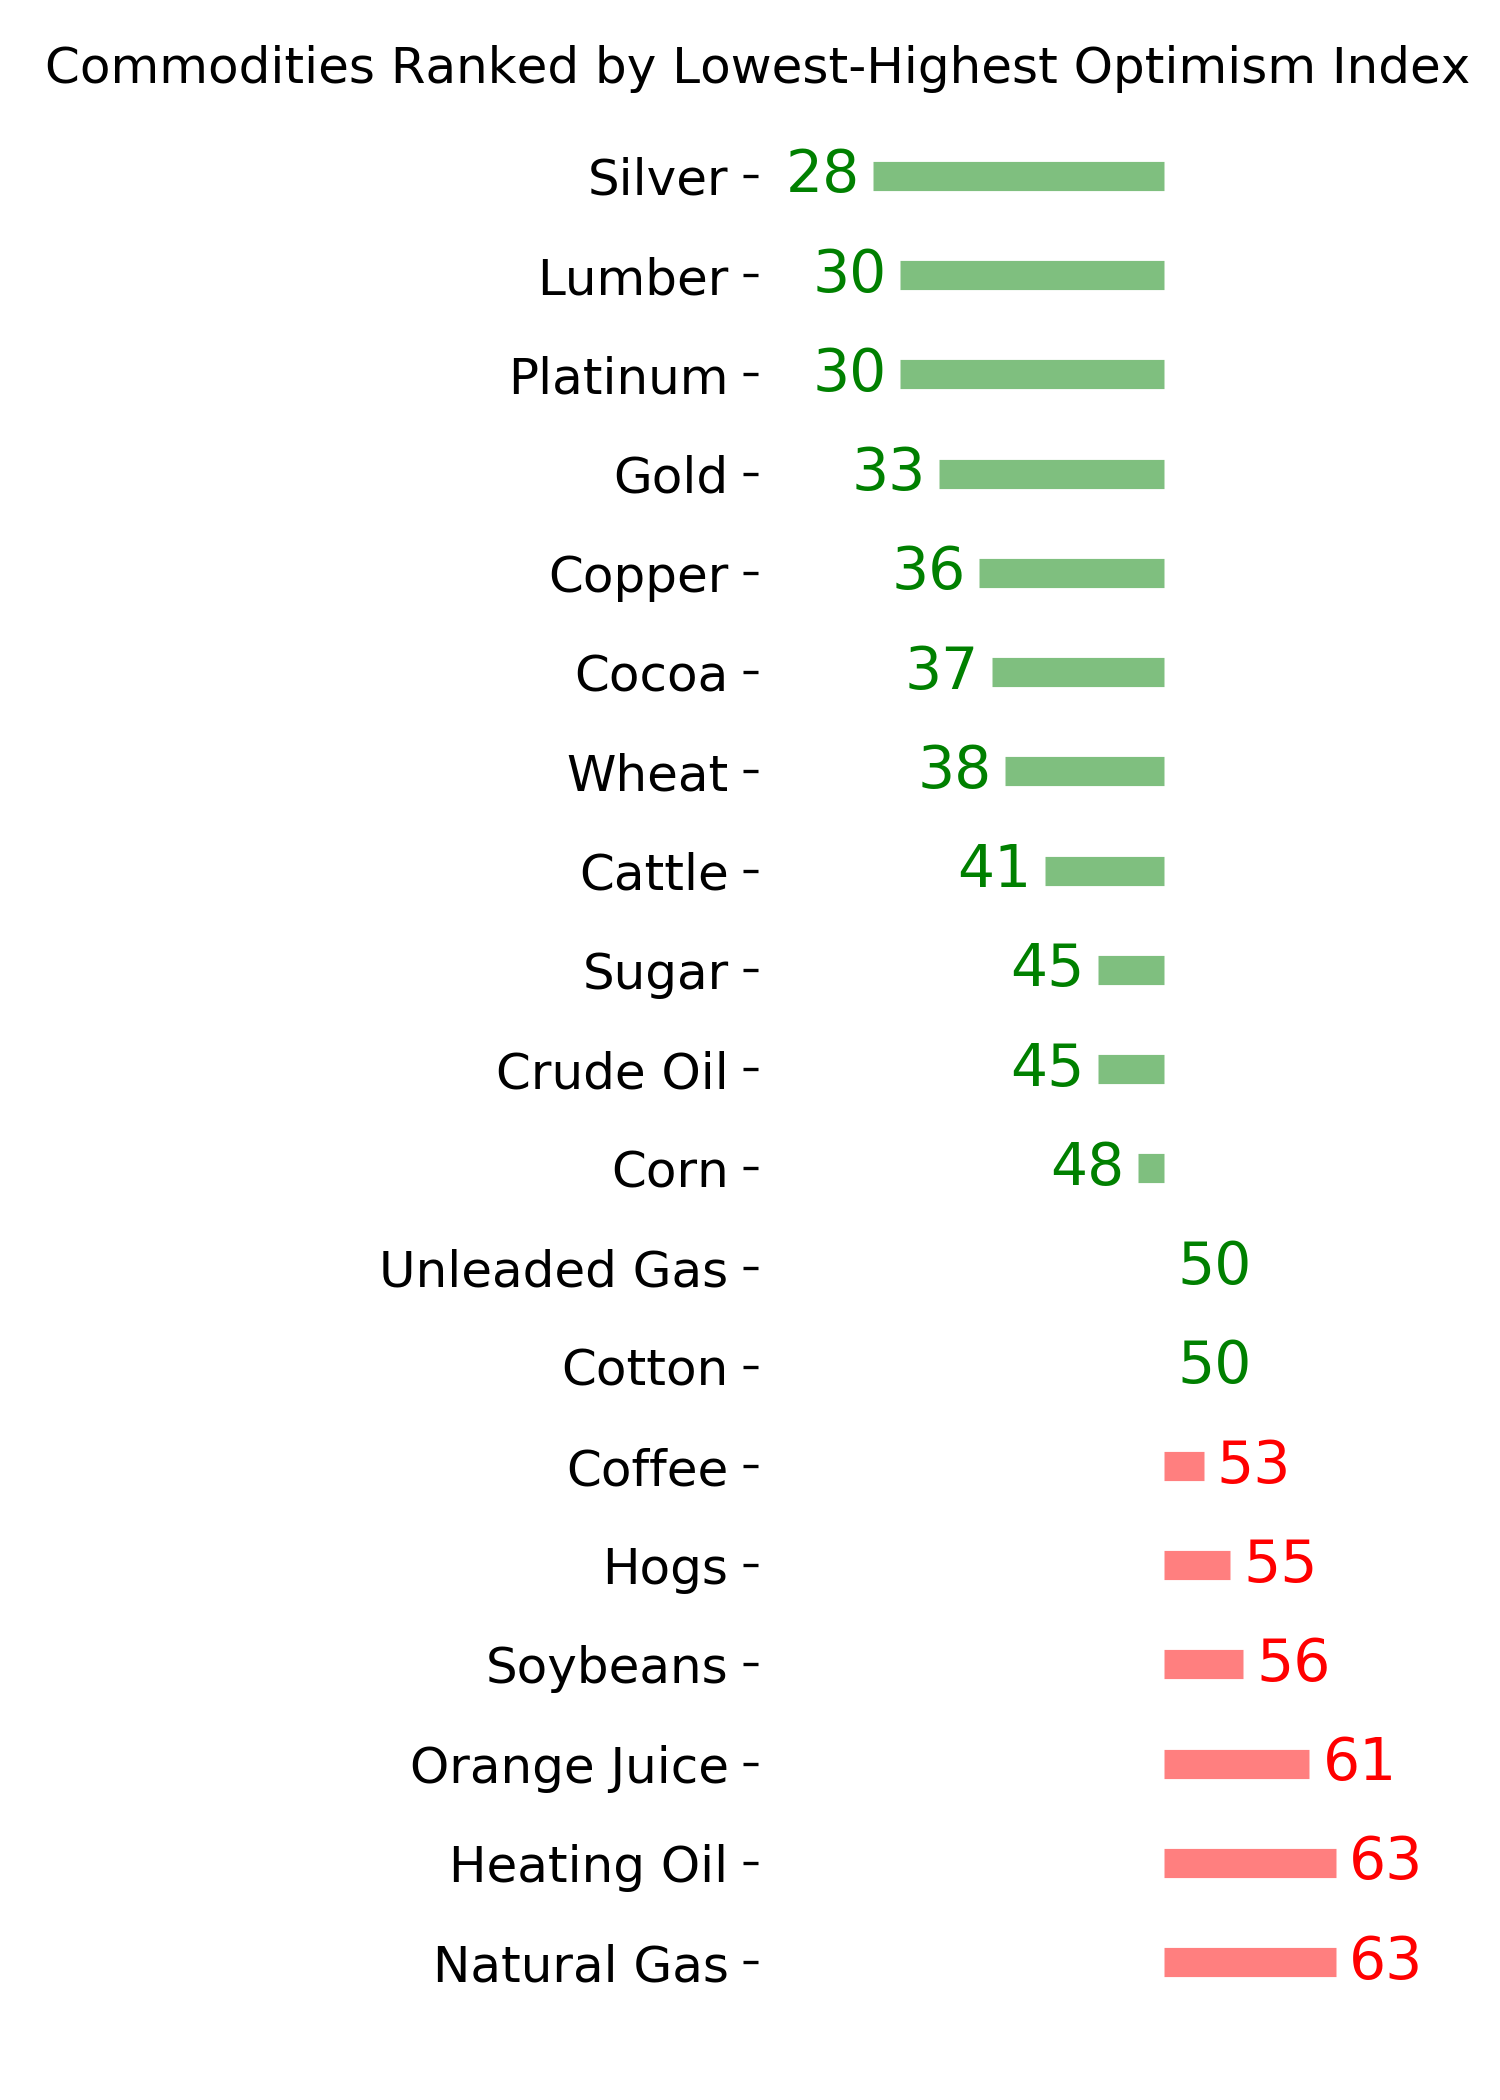
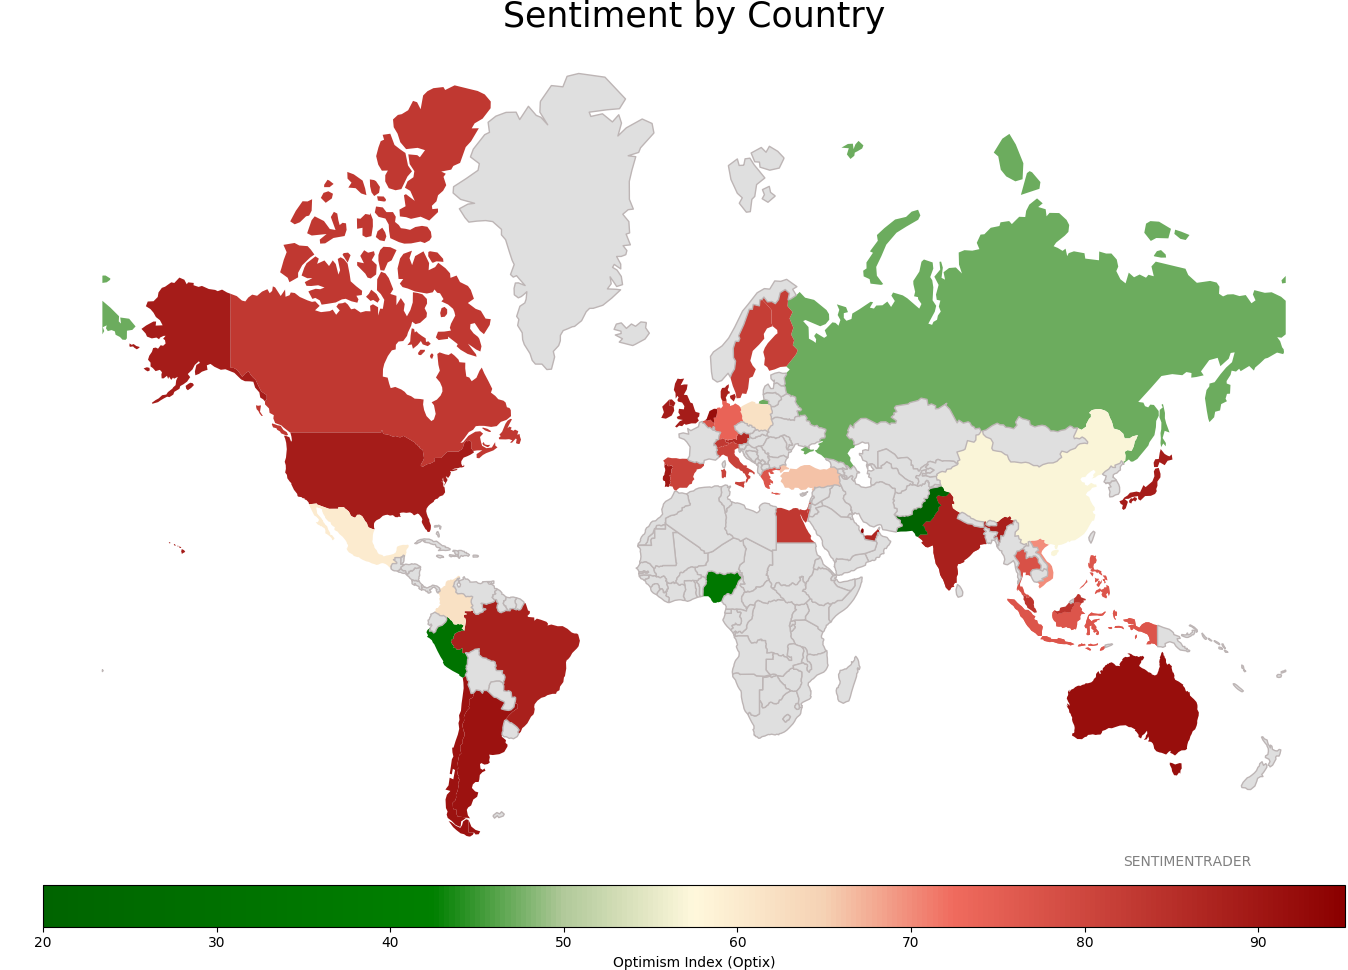
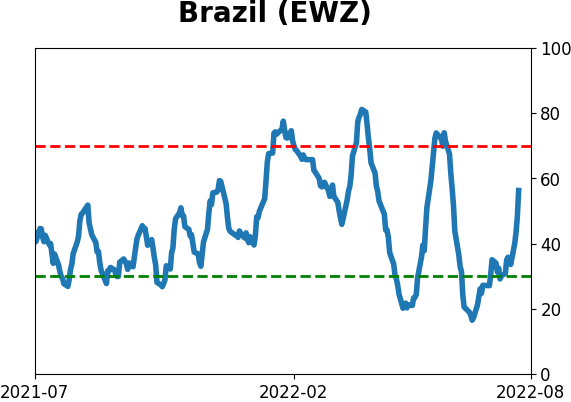
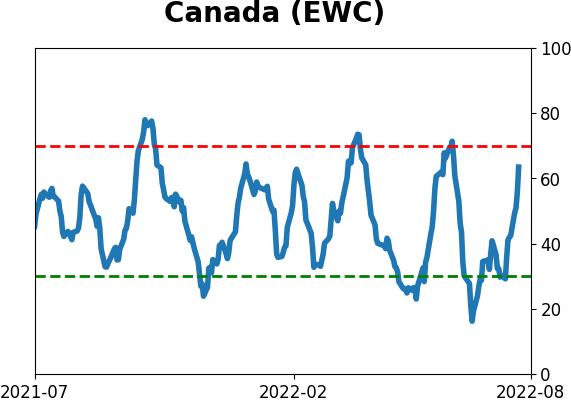
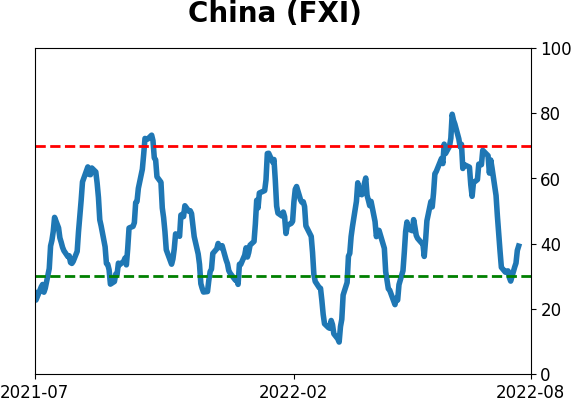
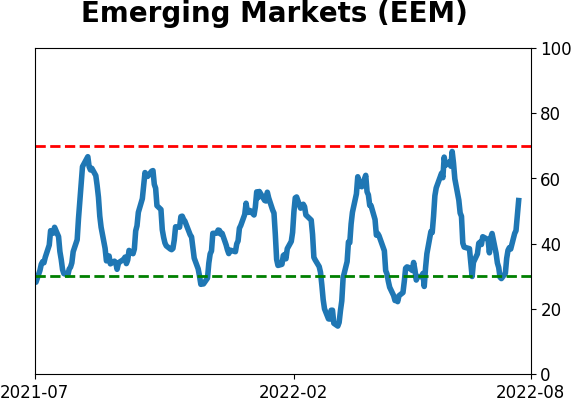
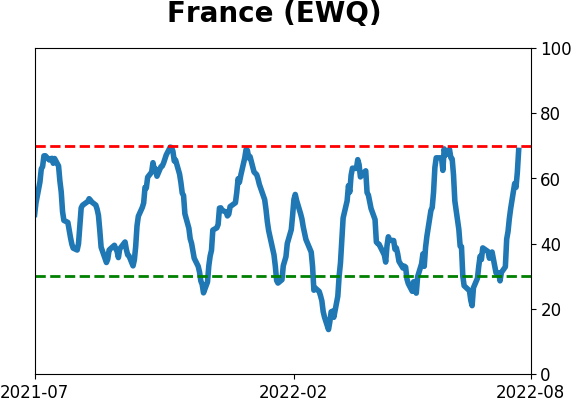
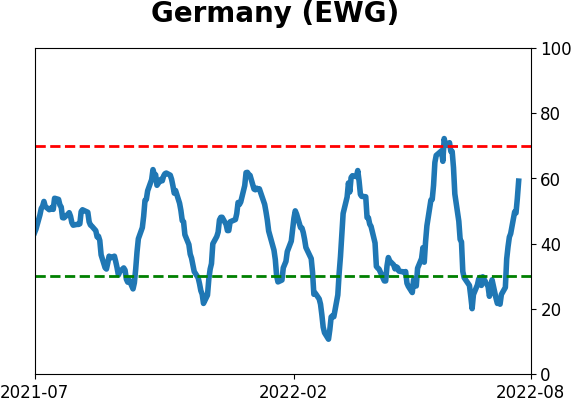
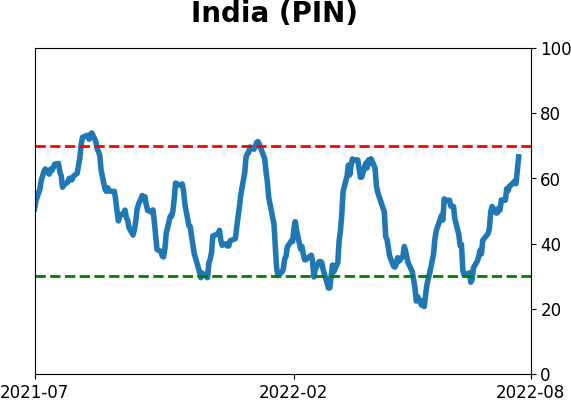
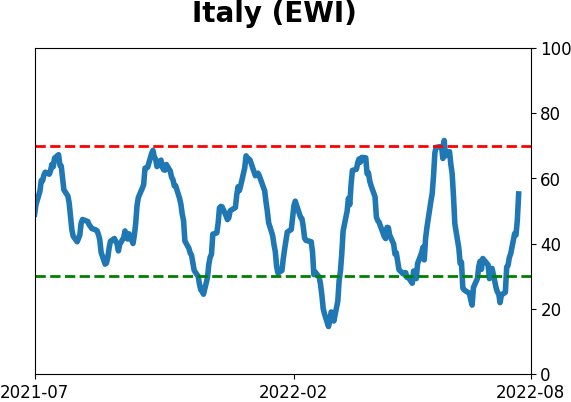
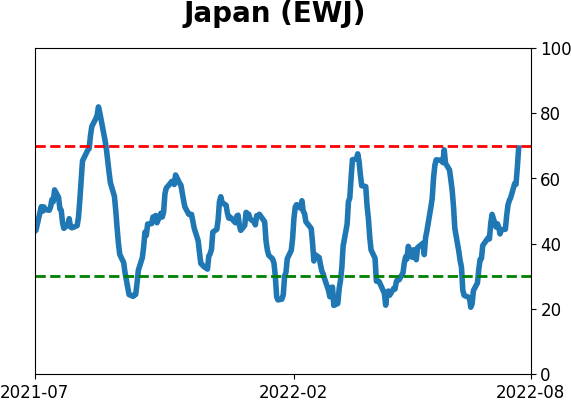
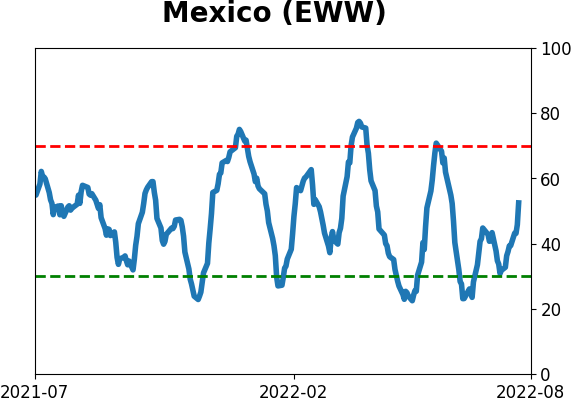
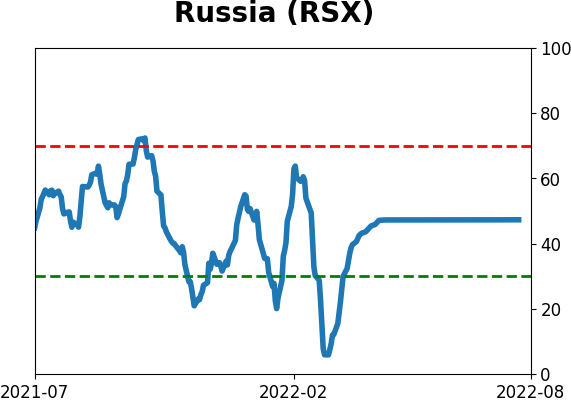
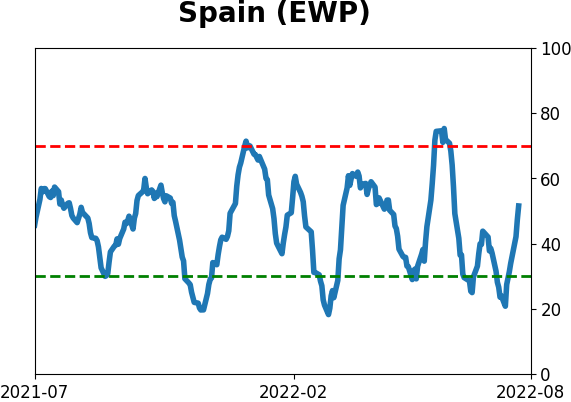
Sentiment Around The World
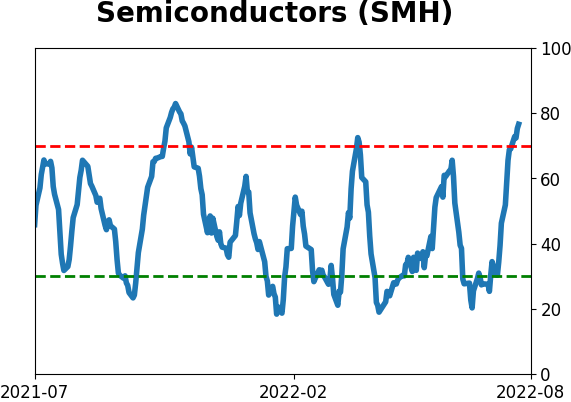
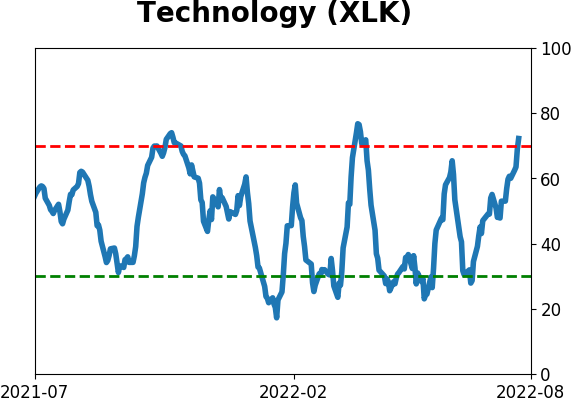
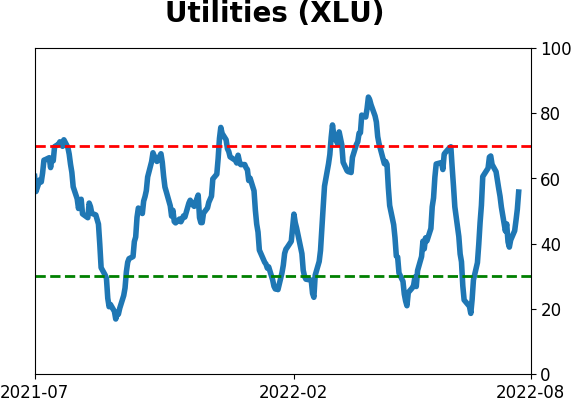
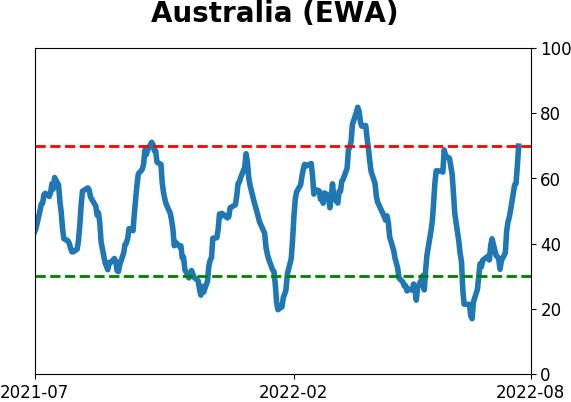
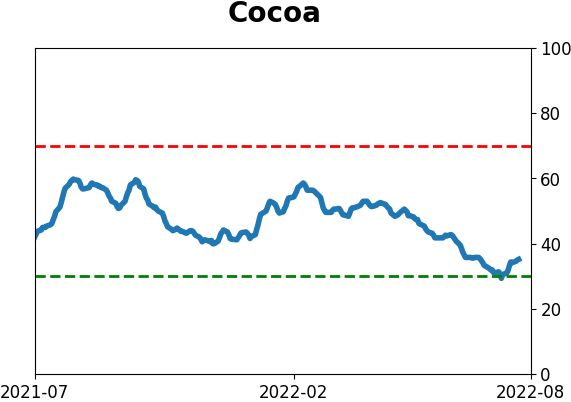
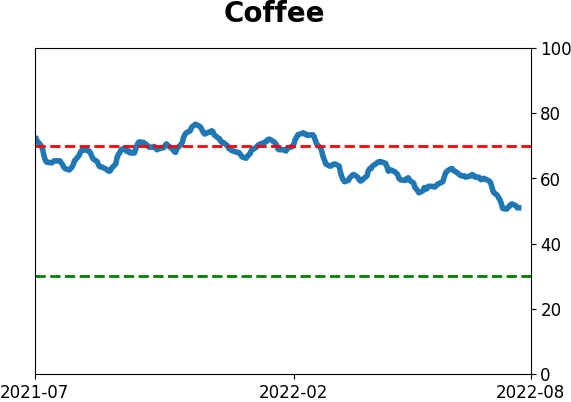
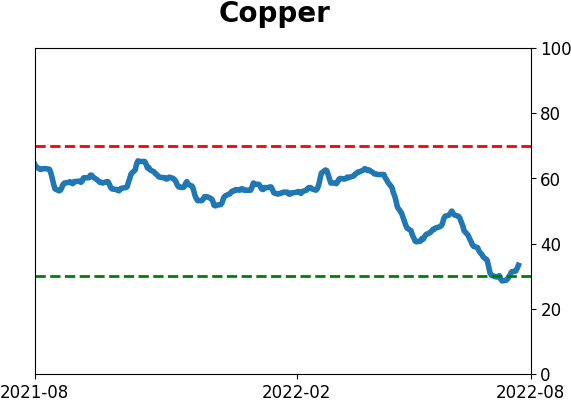
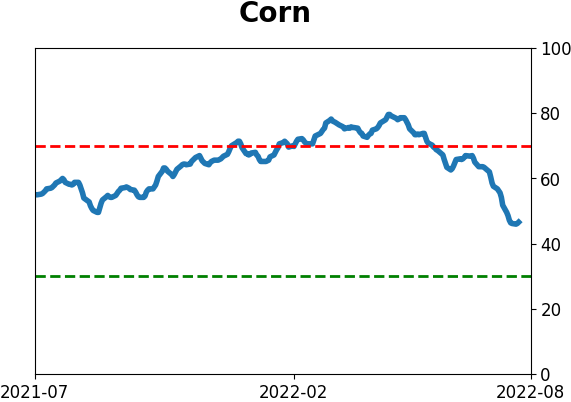
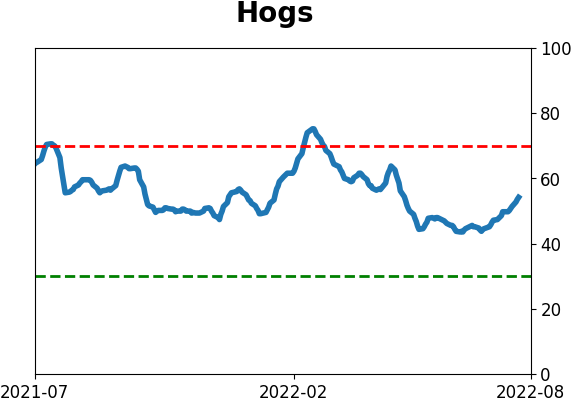
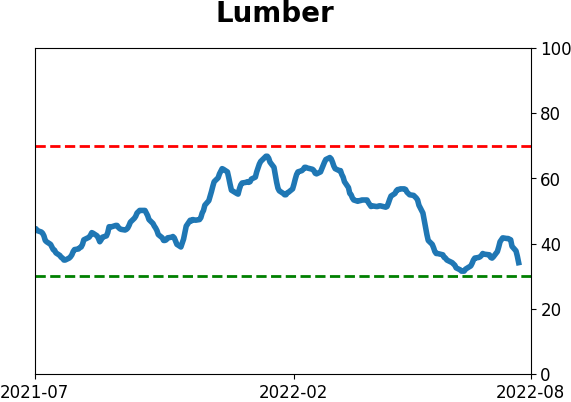
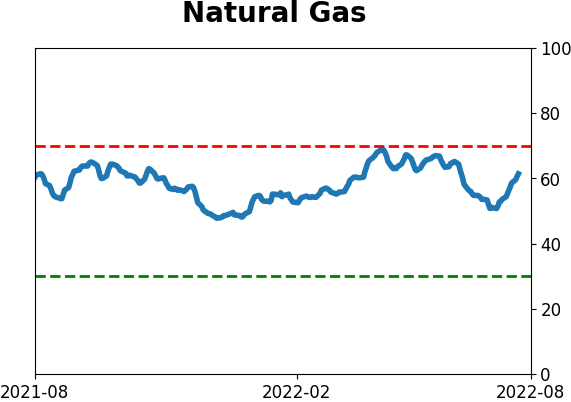
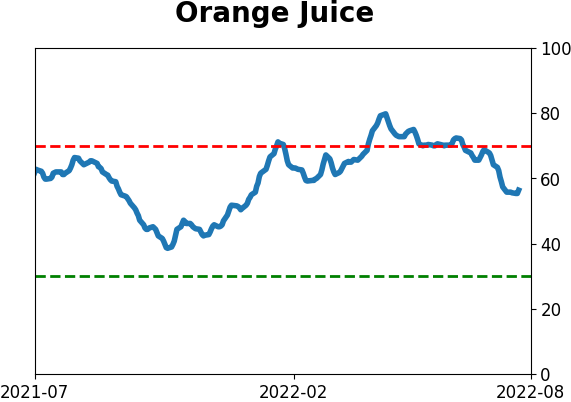
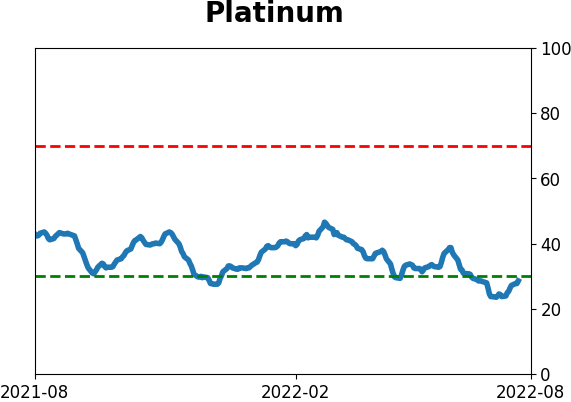
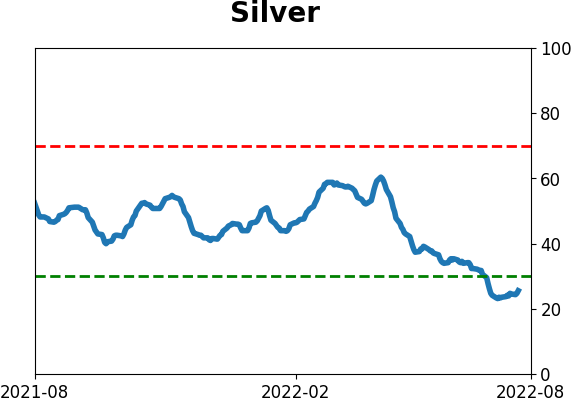
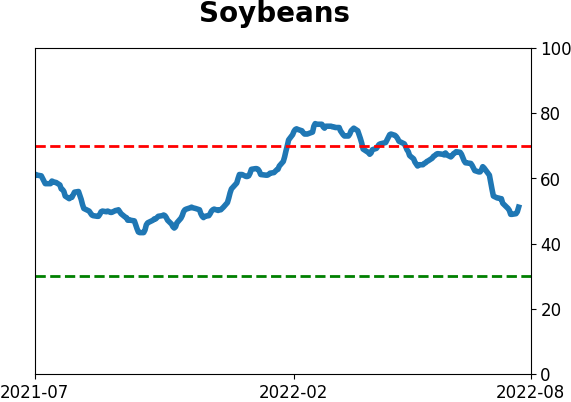
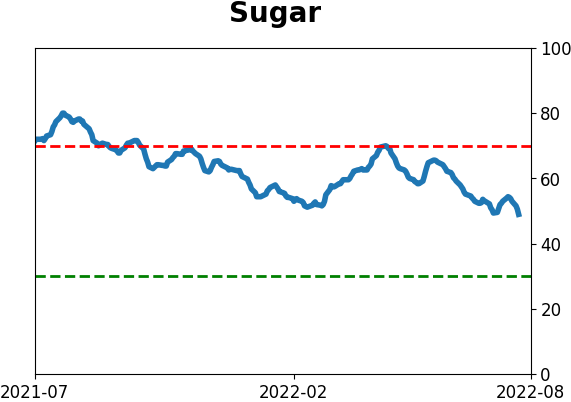
Optimism Index Thumbnails
|
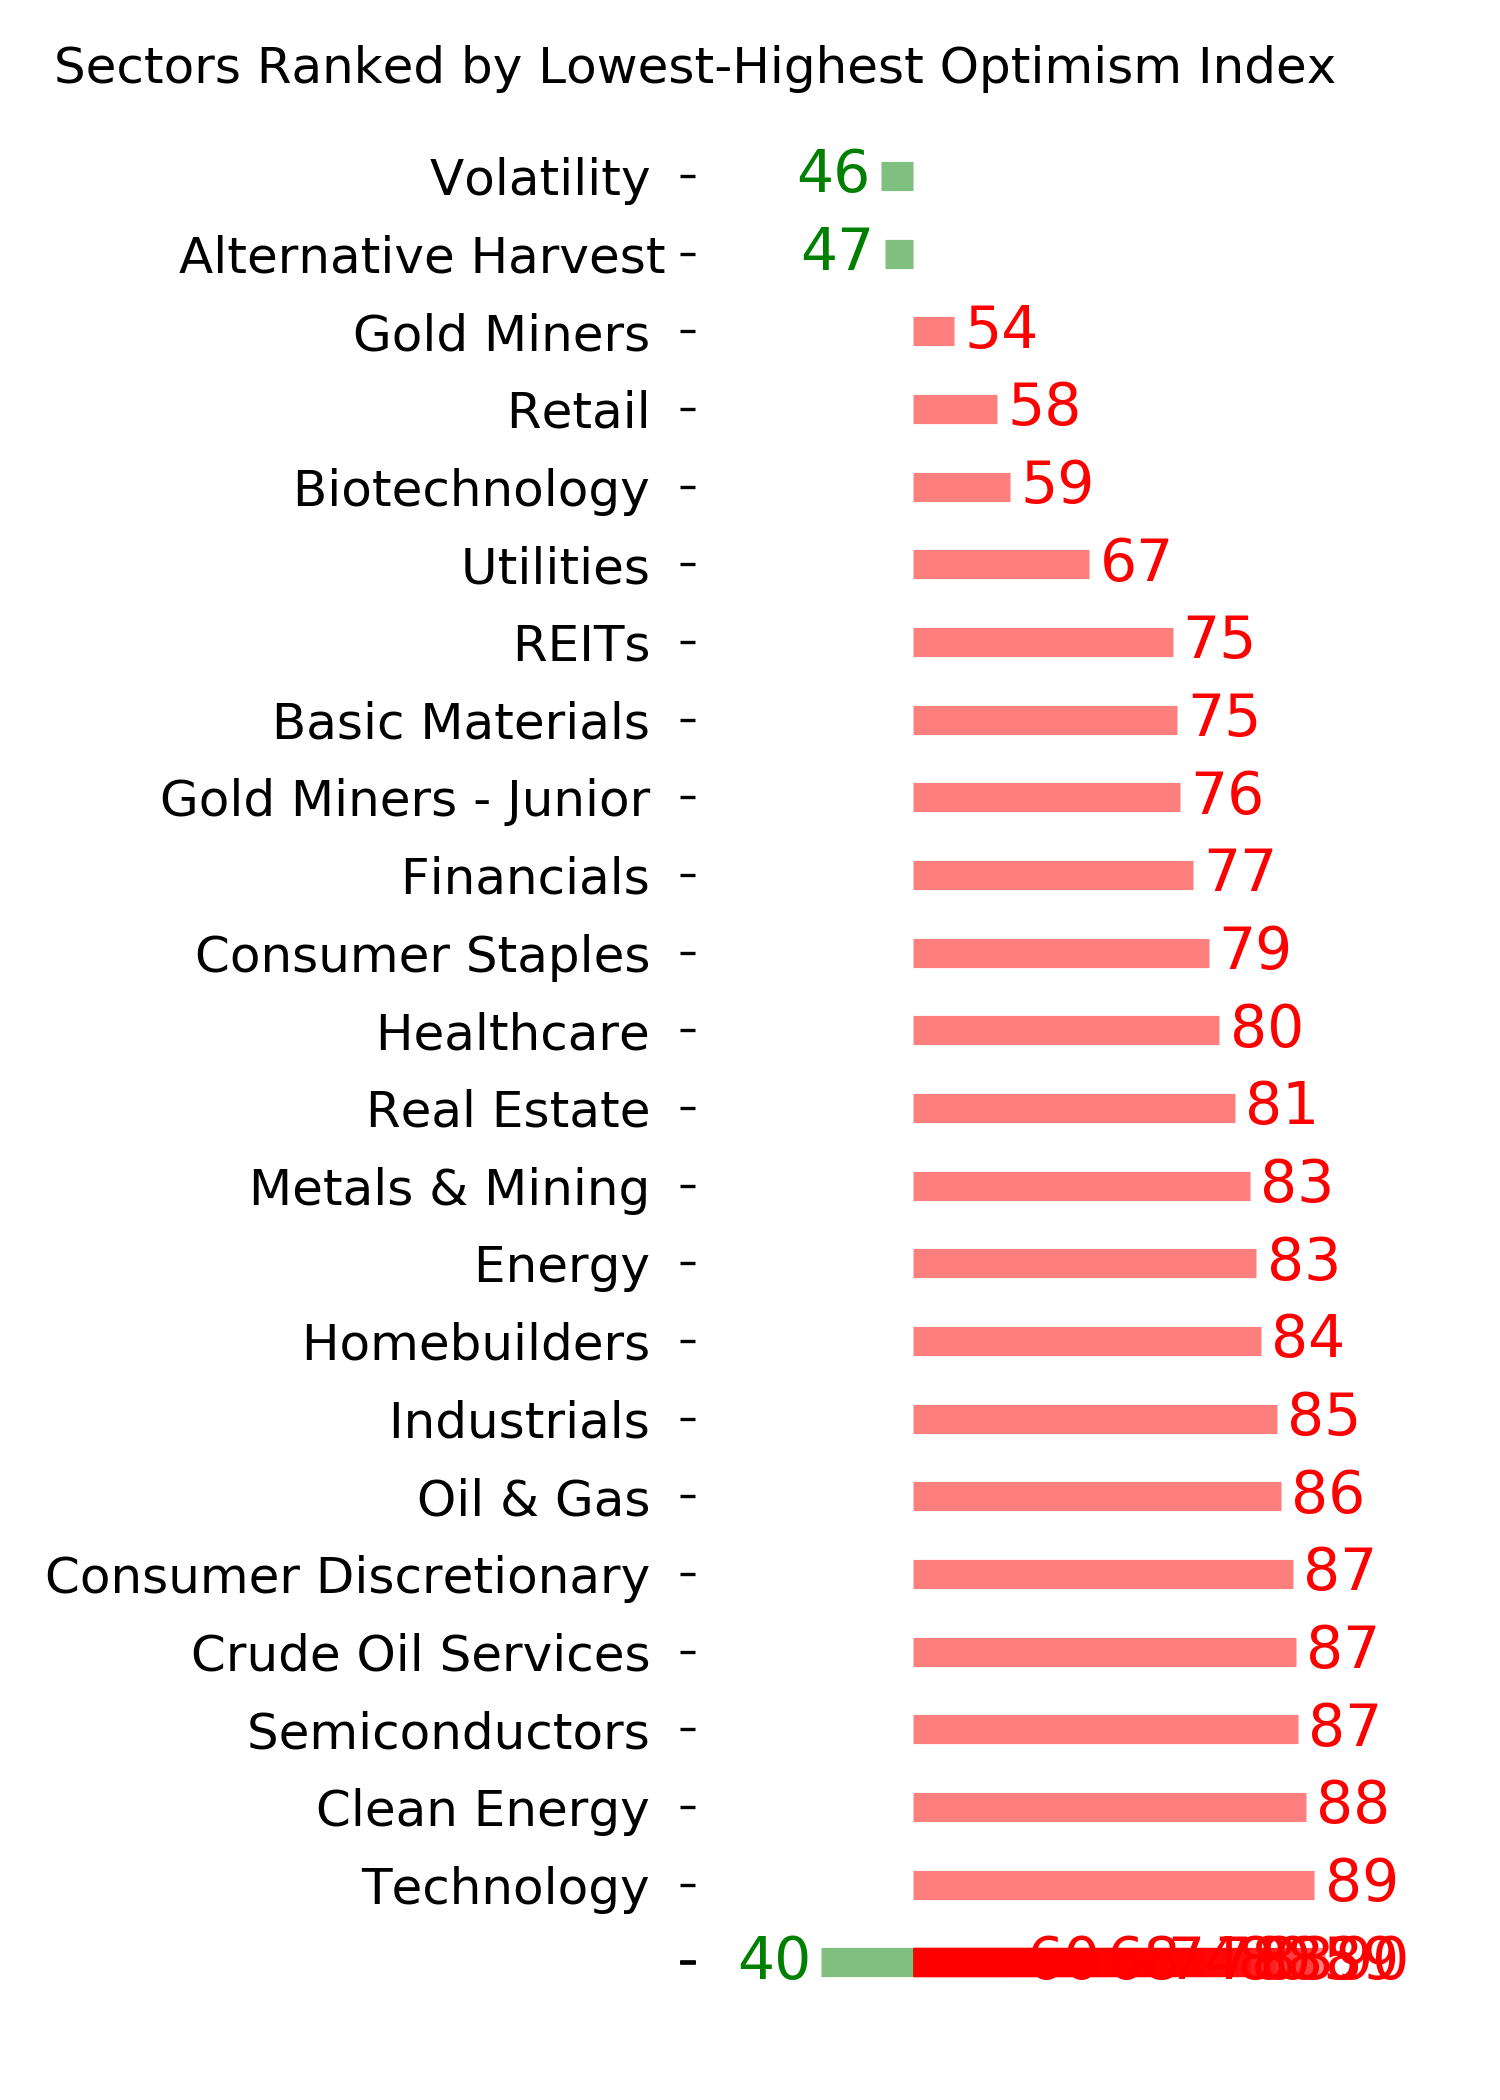
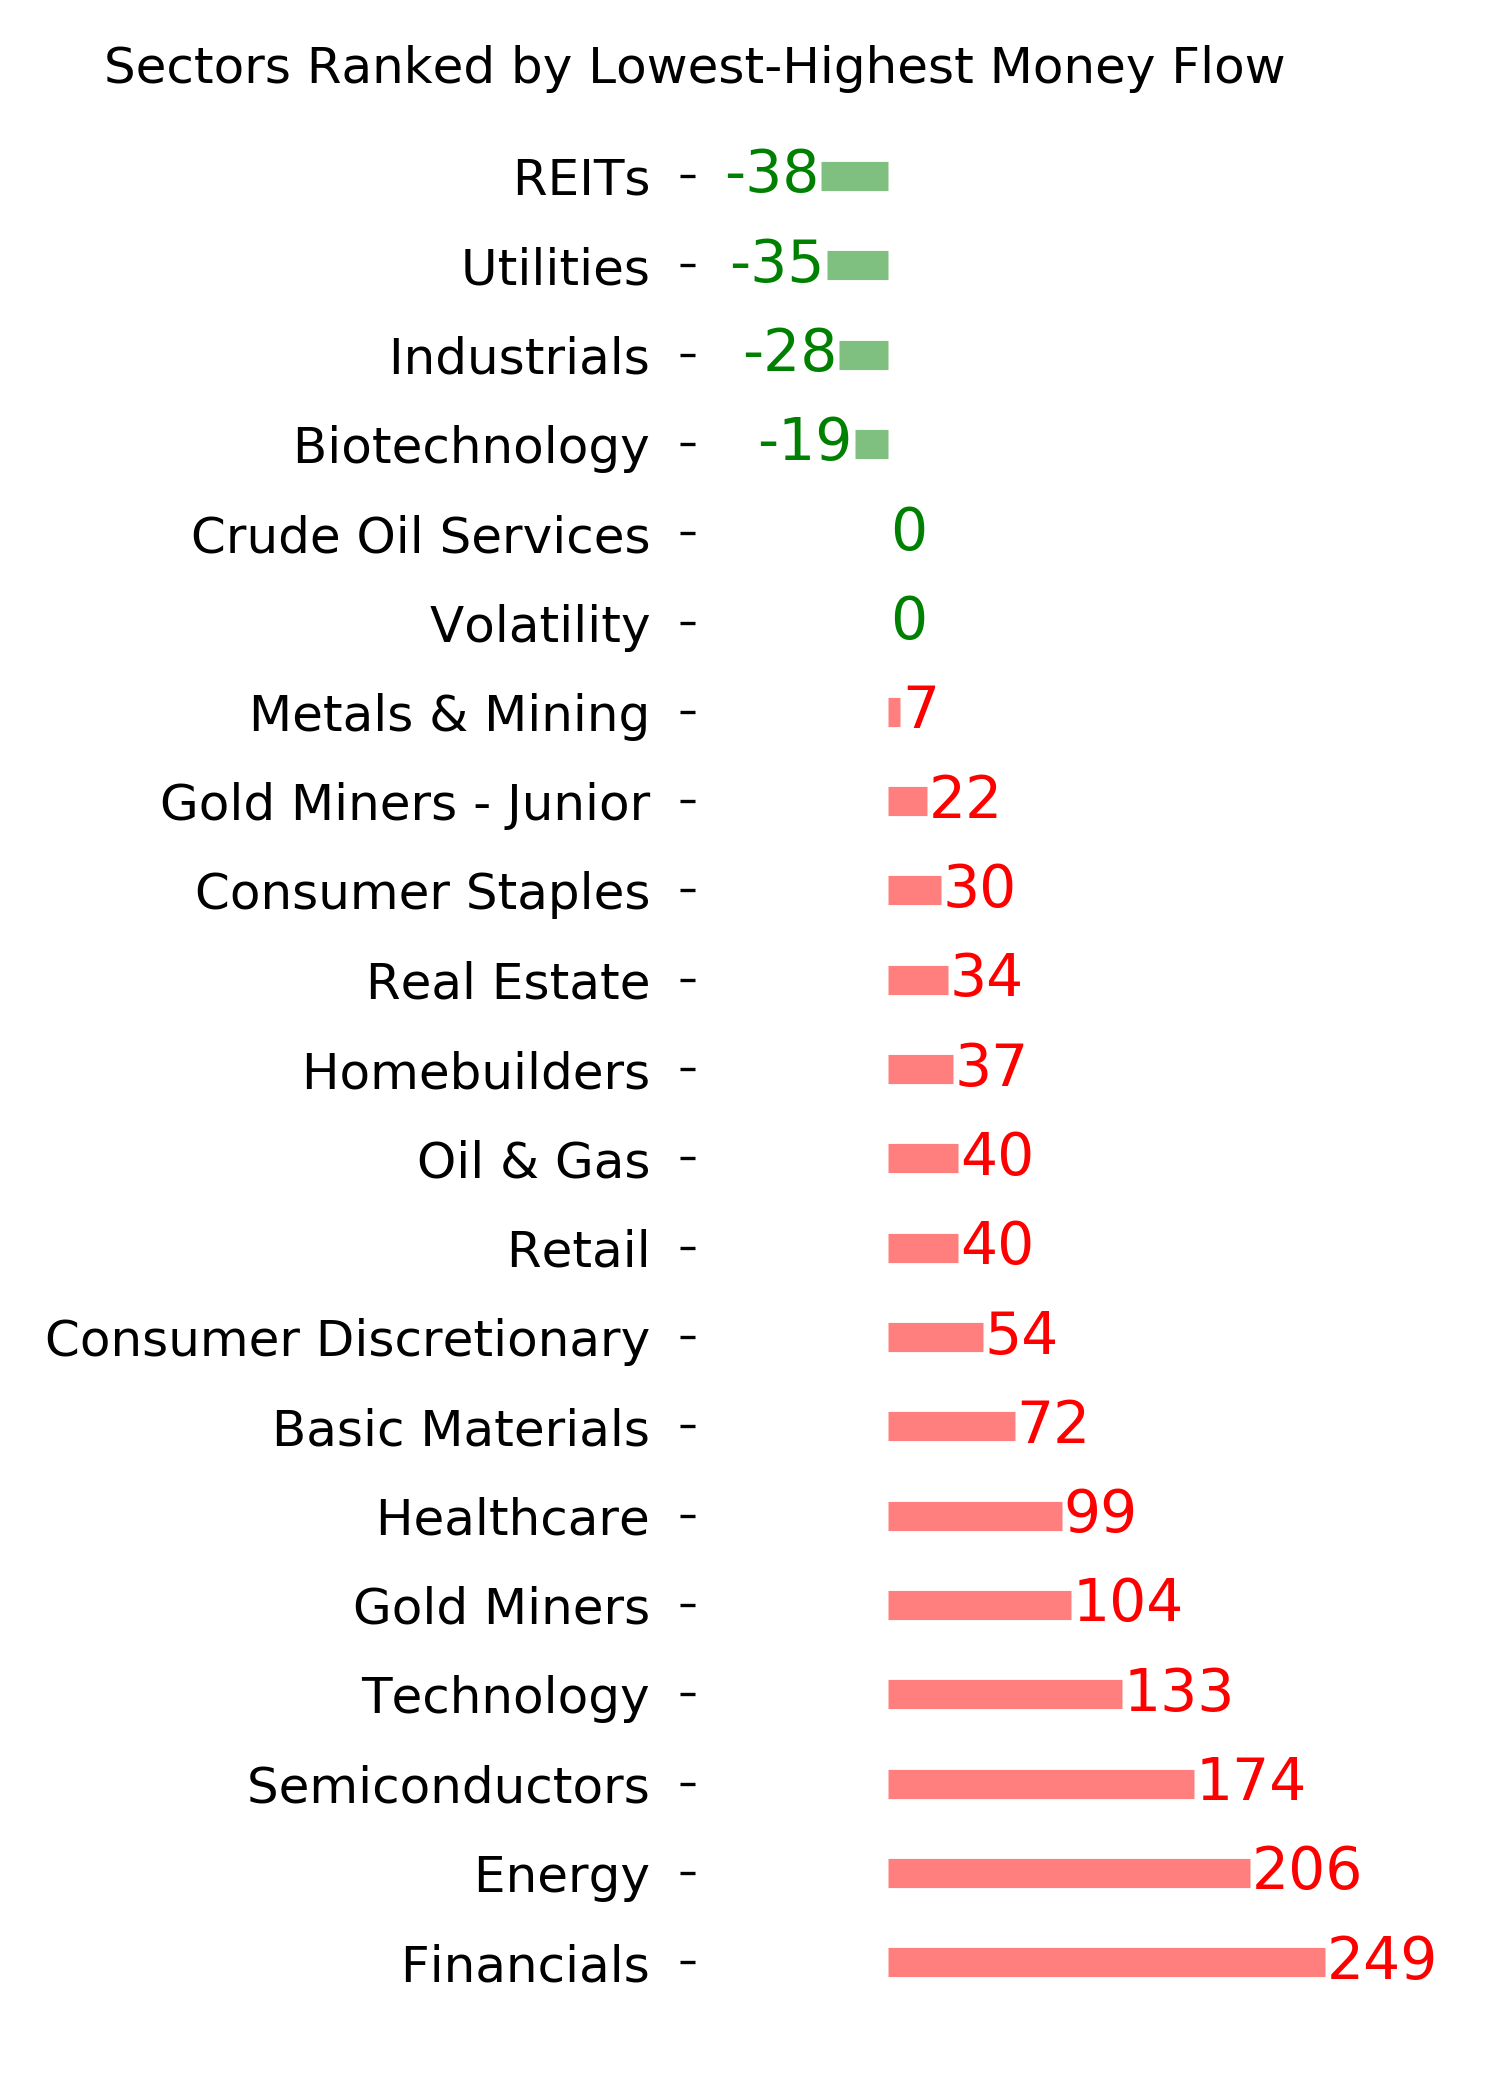
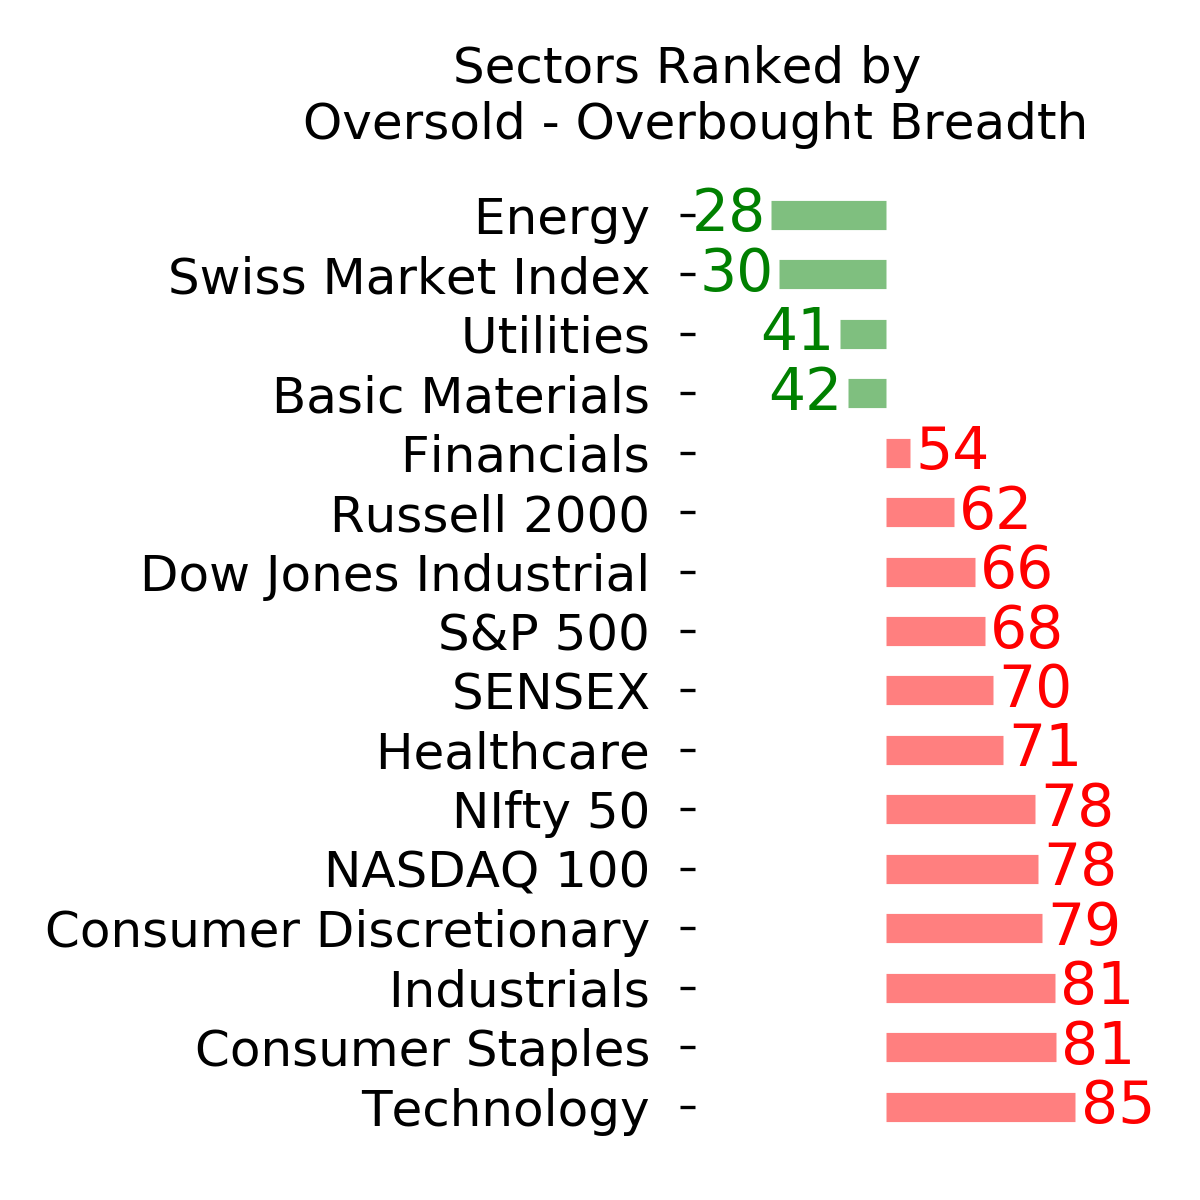
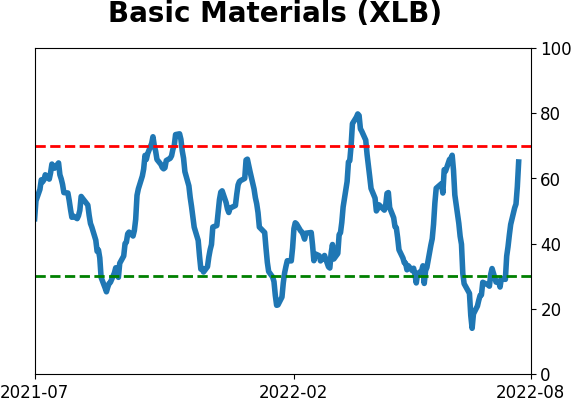
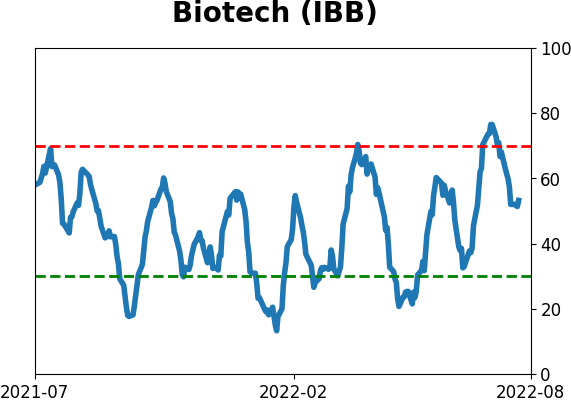
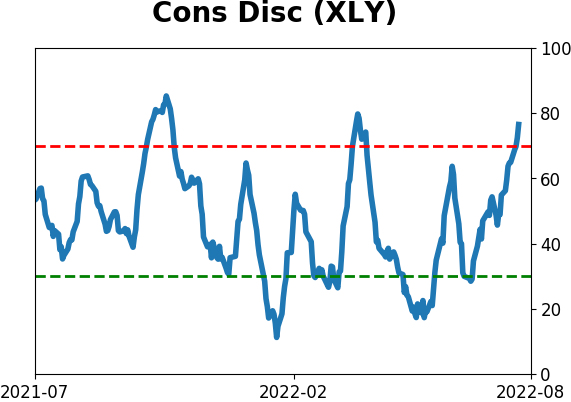
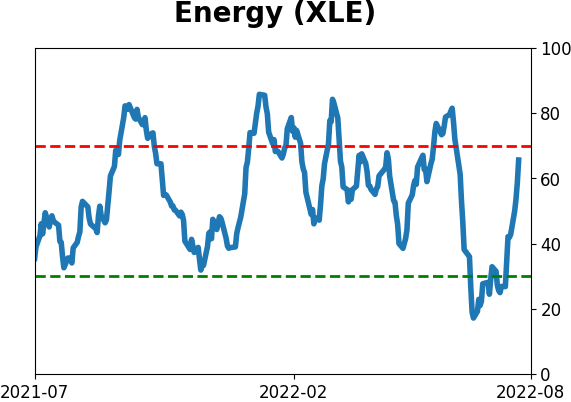
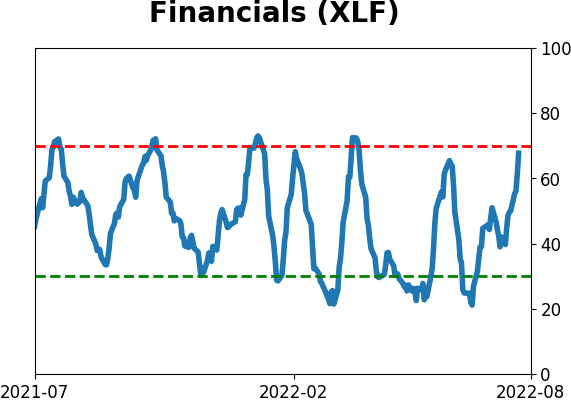
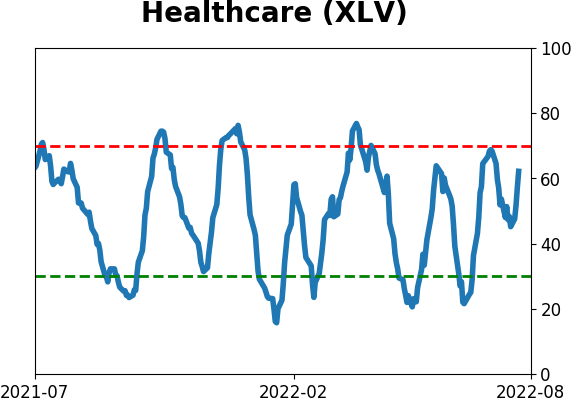
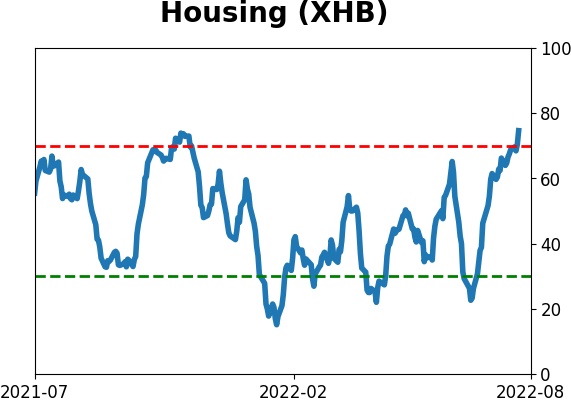
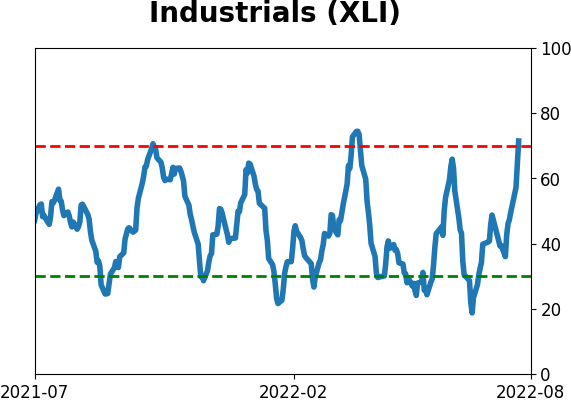
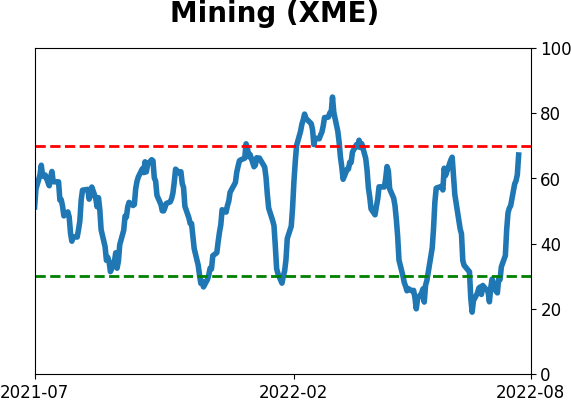
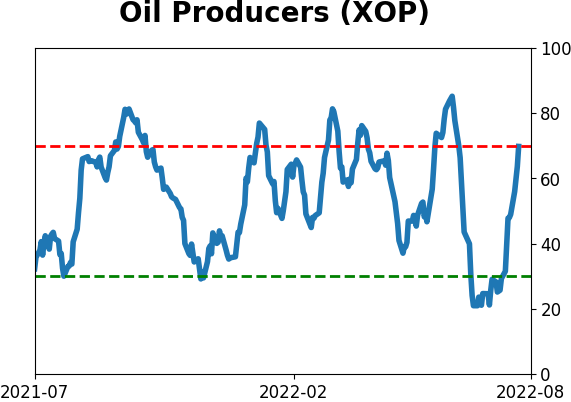
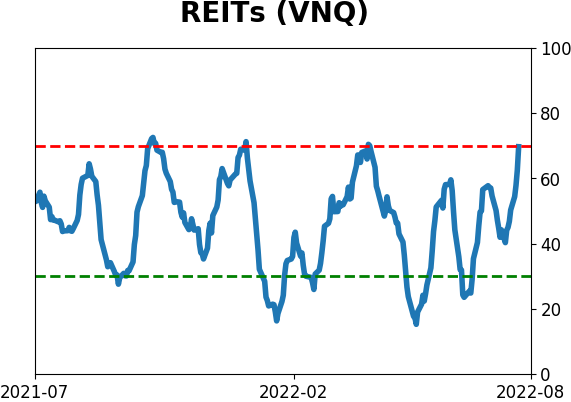
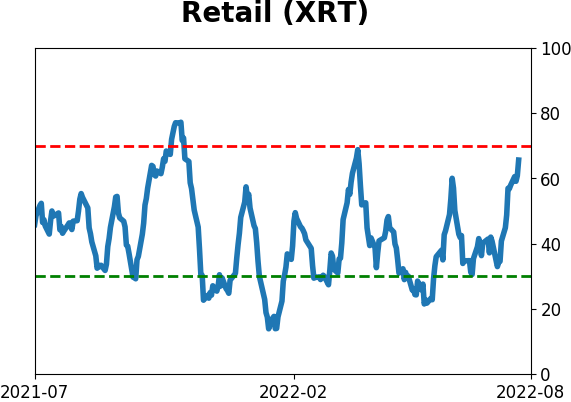
Sector ETF's - 10-Day Moving Average
|
|
|
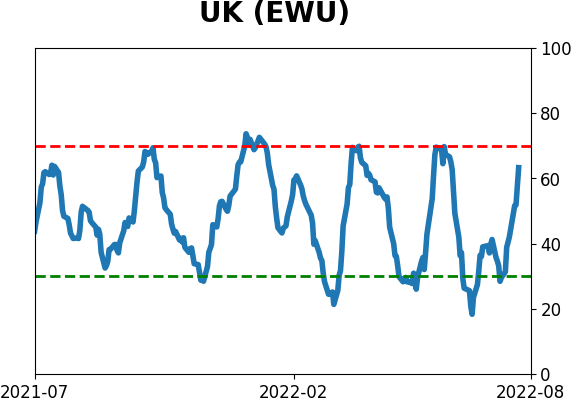
Country ETF's - 10-Day Moving Average
|
|
|
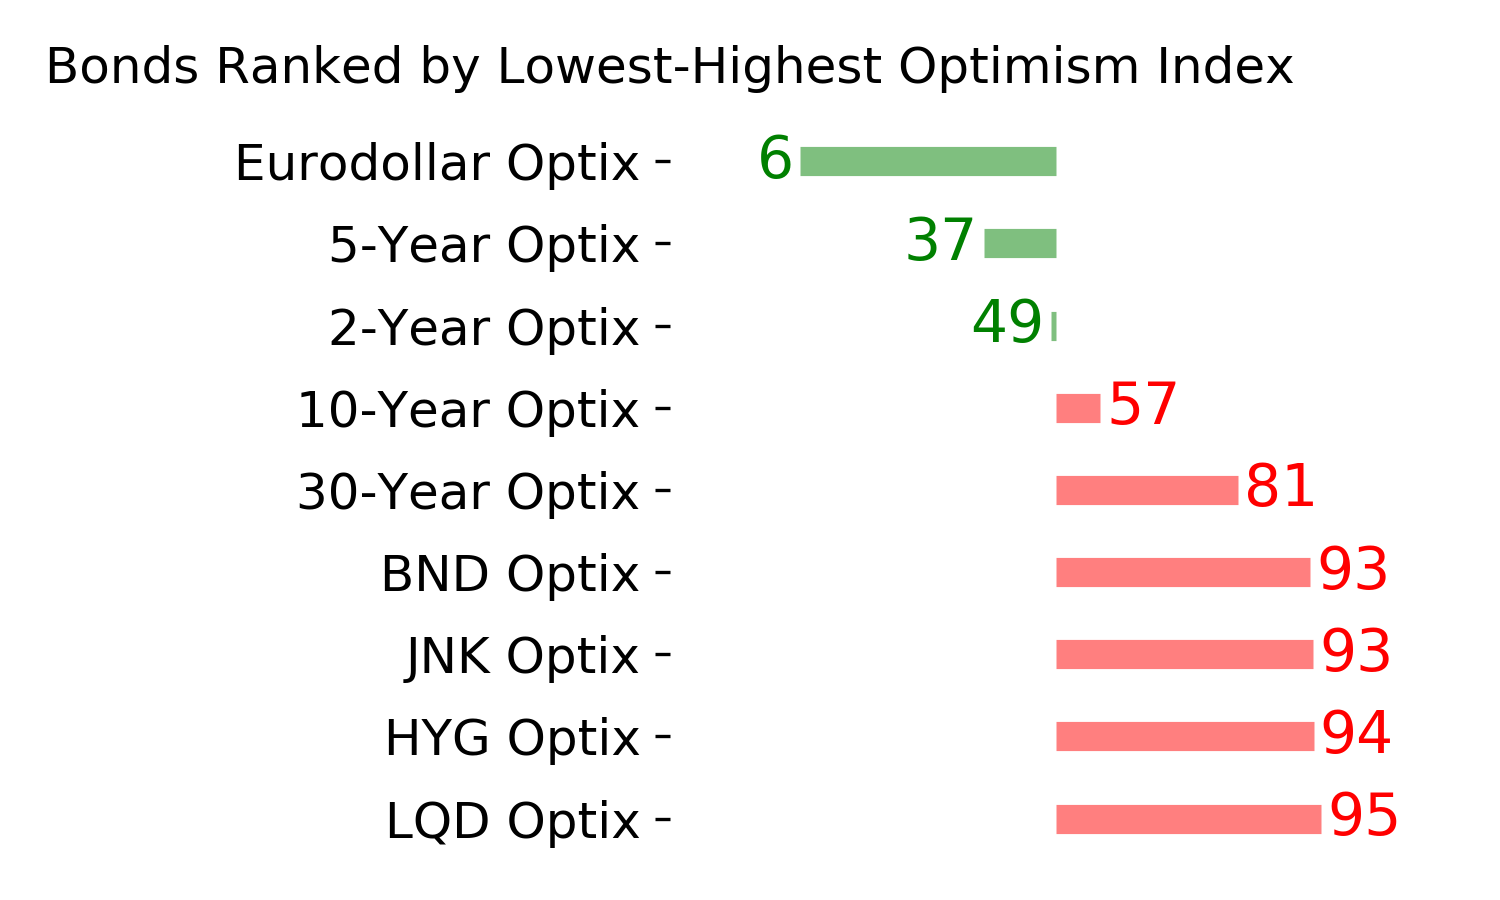
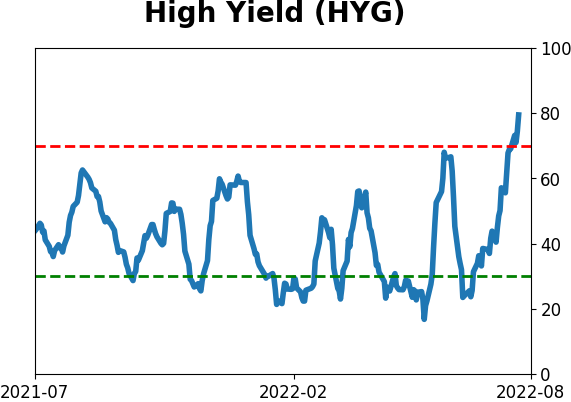
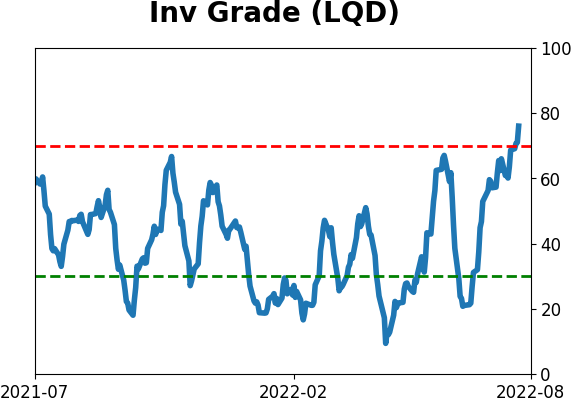
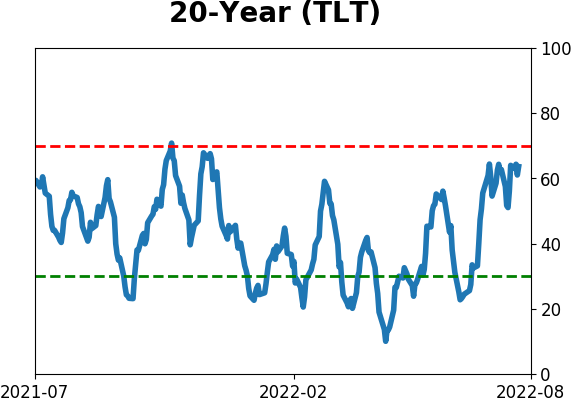
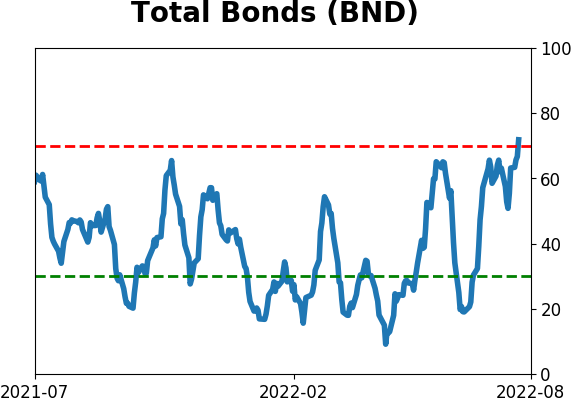
Bond ETF's - 10-Day Moving Average
|
|
|
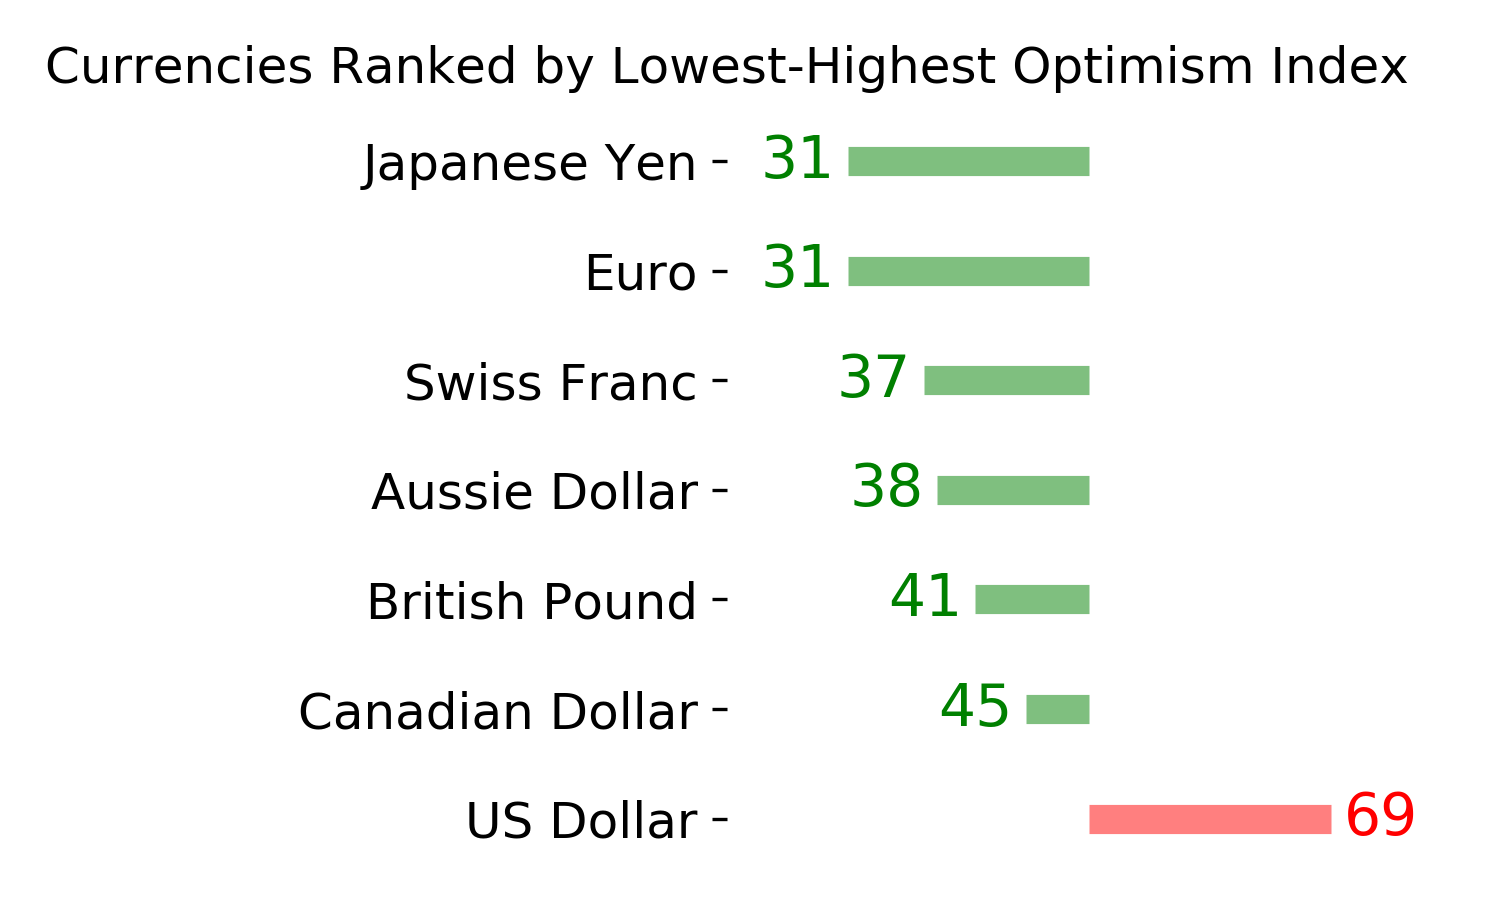
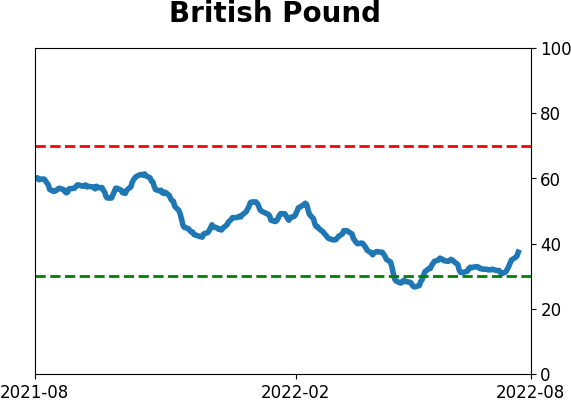
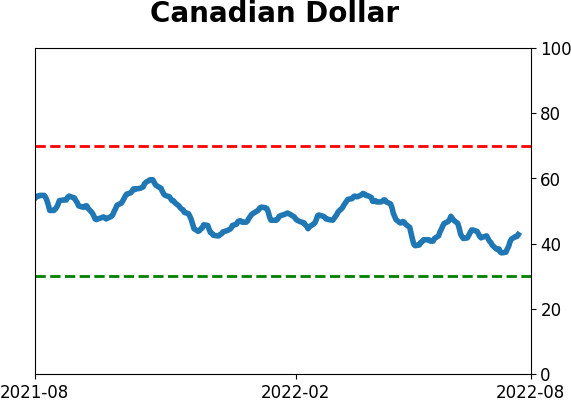
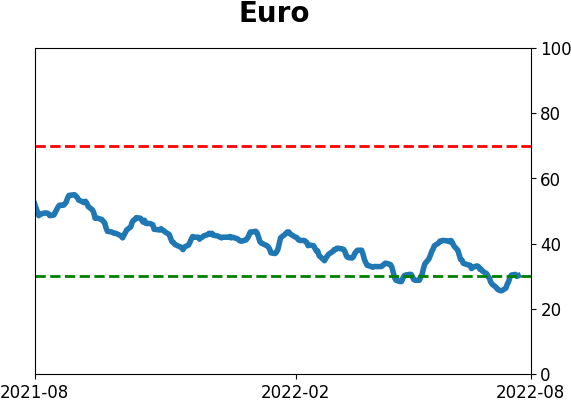
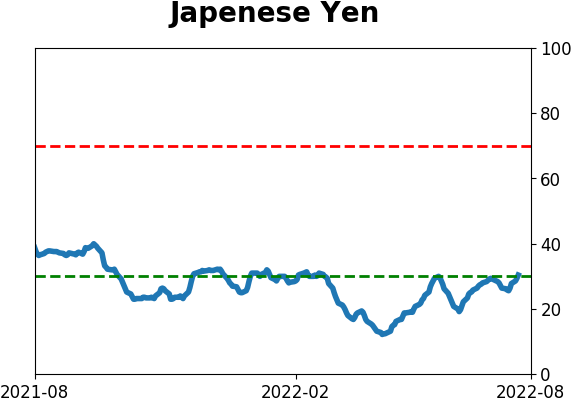
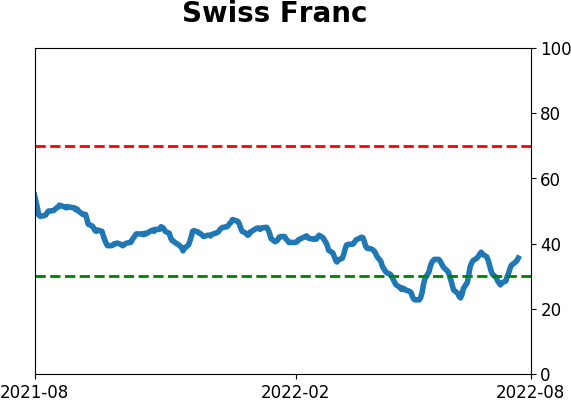
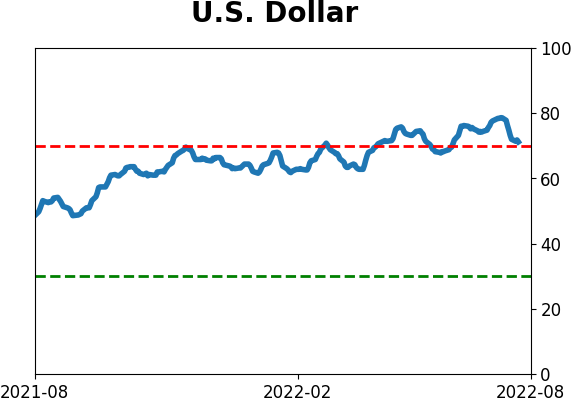
Currency ETF's - 5-Day Moving Average
|
|
|
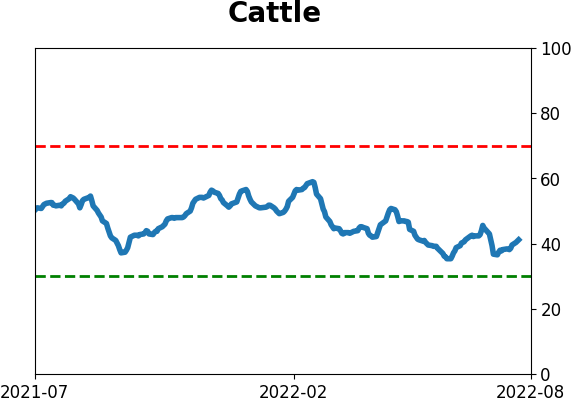
Commodity ETF's - 5-Day Moving Average
|
|