Products
SentimenTrader Trading Tools
‍
Backtest Engine
My Trading Toolkit
Correlation Analysis
Seasonality
Indicators & Data API
‍
Proprietary Indicators & Charts
Market Data API
Strategies & Scanner
‍
50+ Trading Strategies
Smart Stock Scanner
Research Reports
‍
Research Solutions
Reports Library
Free Resources
Simple Backtest Calculator
Simple Seasonality Calculator
The Kelly Criterion Calculator
Sentiment Geo Map
Public Research Reports
Education
Sentiment Indicators
Technical Indicators
Pricing
Company
About
In the News
Testimonials
Client Success Stories
Contact
Log inLoginSign up
< BACK TO ALL REPORTS

High-yield bond carnage

Jason Goepfert
2022-06-15
High-yield bonds were hit hard in recent weeks, and on Monday it cascaded into one of the most lopsided days of selling in 17 years. It pushed more than 70% of bonds to 52-week lows, one of the highest readings in two decades. The only times these bonds suffered similar selling pressure were October 2008 and March 2020.

Key points:

  • On Monday, high-yield bonds suffered the 2nd-most lopsided selling pressure in 17 years
  • It pushed the 3rd-most bonds to 52-week lows
  • Similar bouts of overwhelming selling preceded short-term pain, but long-term gains

High-yield bond market suffers historic carnage

The market carnage over the past week hasn't been limited to stocks. Bonds have also been hammered, especially those most geared to economic performance.

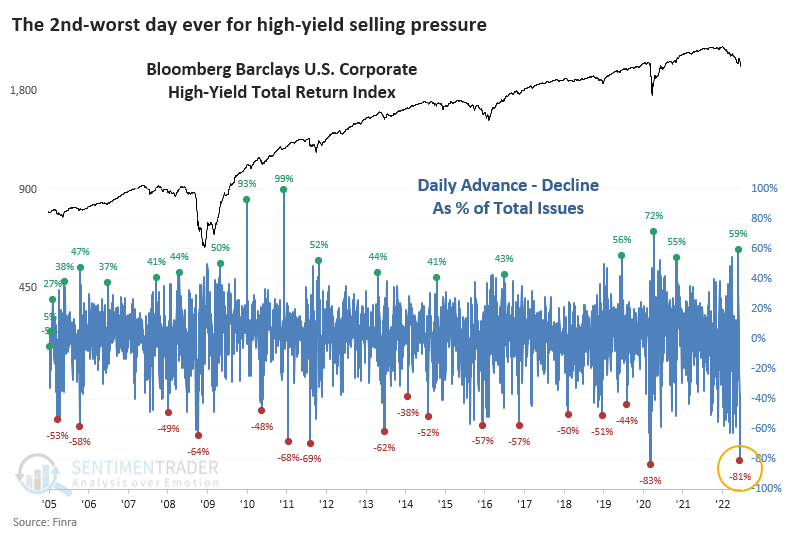
Like we saw in stocks, investors dumped pretty much all bonds, particularly of the high-yield variety. In a remarkable fit of selling pressure, more than 80% of high-yield bonds declined on Monday. That's the most lopsided bout of selling in 17 years next to March 9, 2020.

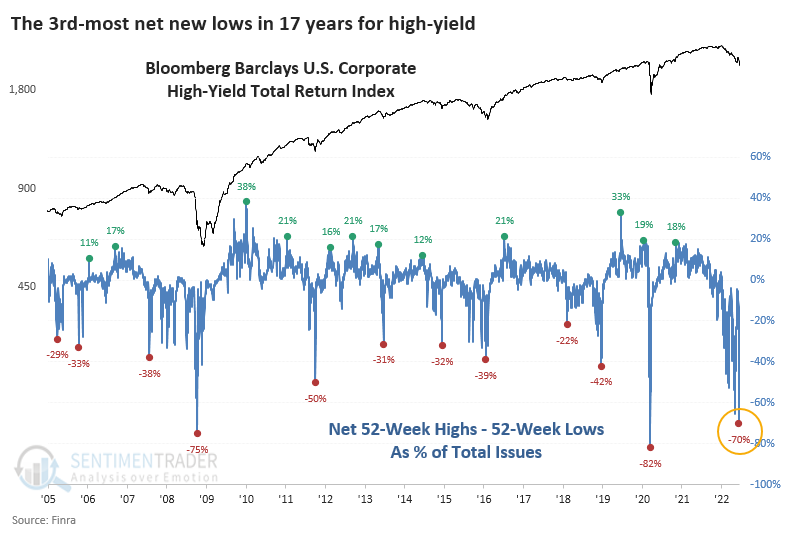
The overwhelming selling pressure knocked even more of the bonds to a 52-week low. A net of more than 70% of high-yield issues fell to a new low, the 3rd-worst reading since 2005. The only dates with more panicked selling were October 2008 and March 2020.

A buying opportunity, but not right away

When we combine the two figures, it's clear that we're in rare territory in terms of how eager and how broadly investors are looking to reduce exposure to this part of the market.

It's also clear that neither bout of panic coincided with the exact low for high-yield.

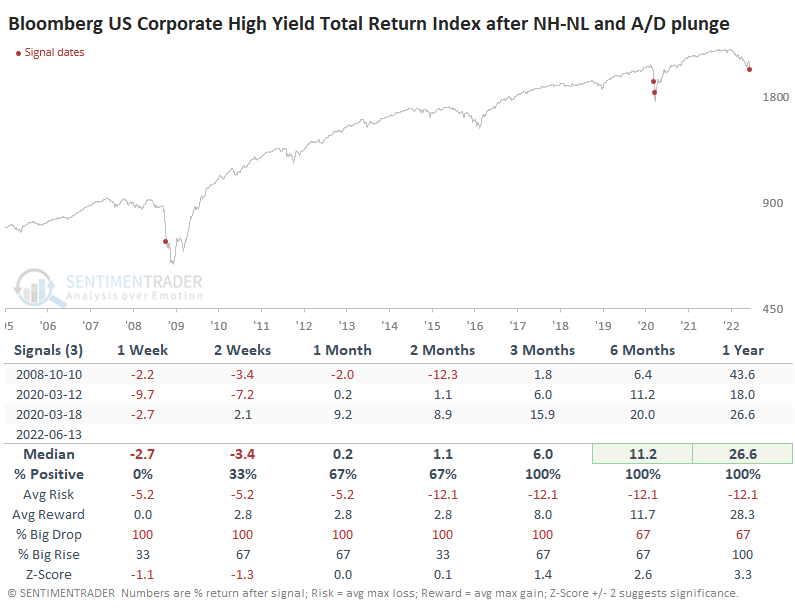
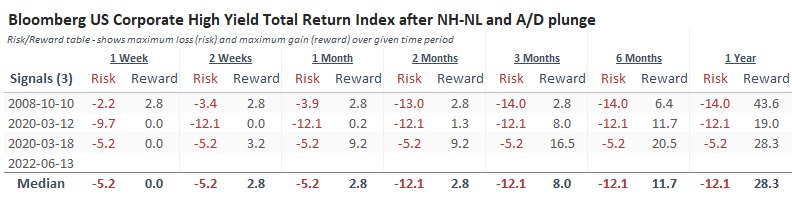
That's clearer when we look at the Risk/Reward Table for the signals. In 2008 and 2020, high-yield bonds declined at least 10% within the next two months, then roared ahead as the market recovered.

What the research tells us...

The past few days have triggered panic in several markets simultaneously. High-yield bonds were among the worst-hit relative to their historical behavior, and the only precedents we have for this level of selling were the two worst waves of panic in 17 years. Unfortunately, neither one marked a low for the bonds, as investors continue to sell in the weeks ahead. While this level of panic might be too early of a signal for buyers, it should serve as a heads-up that additional pressure in the next couple of weeks should present an excellent buying opportunity.

Sorry, you don't have access to this report

Upgrade your subscription plan to get access
Go to Dasboard
PRODUCTS
SentimenTrader
Trading Tools
Indicators & Data API
‍
Strategies & Scanner
‍
Research Reports
FREE
RESOUrCES
Simple Backtest
Calculator
Simple Seasonality
Calculator
The Kelly Criterion
Calculator
Sentiment Geo Map
‍
Public Research Reports
‍
Education
Sentiment Indicators
‍
Technical Indicators
‍
Pricing
Bundle pricing
‍
FAQ
‍
Announcements
‍
COMPANY
‍
About
‍
In the News
‍
Testimonials
‍
Client Success Stories
CONTACT
‍
General Inquiries
‍
Media Inquiries
‍
Financial Professionals Inquiries
‍
© 2026 Sundial Capital Research Inc. All rights reserved.
Setsail Marketing
TermsPrivacyAffiliate Program
Risk Disclosure: The information and tools provided are for research and analytical purposes only and are not intended as investment advice. Market analysis involves uncertainty, and outcomes may differ from expectations. Users should conduct their own due diligence and consider their individual circumstances before making any financial decisions. Past performance is not necessarily indicative of future results.

Hypothetical Performance Disclosure: Hypothetical performance results have many inherent limitations, some of which are described below. No representation is being made that any account will or is likely to achieve profits or losses similar to those shown; in fact, there are frequently sharp differences between hypothetical performance results and the actual results subsequently achieved by any particular trading program. One of the limitations of hypothetical performance results is that they are generally prepared with the benefit of hindsight. In addition, hypothetical trading does not involve financial risk, and no hypothetical trading record can completely account for the impact of financial risk of actual trading. for example, the ability to withstand losses or to adhere to a particular trading program in spite of trading losses are material points which can also adversely affect actual trading results. There are numerous other factors related to the markets in general or to the implementation of any specific trading program which cannot be fully accounted for in the preparation of hypothetical performance results and all which can adversely affect trading results.

Testimonial Disclosure: Testimonials appearing on this website may not be representative of other clients or customers and is not a guarantee of future performance or success.