Headlines
|
|
Poor environment coupled with high optimism:
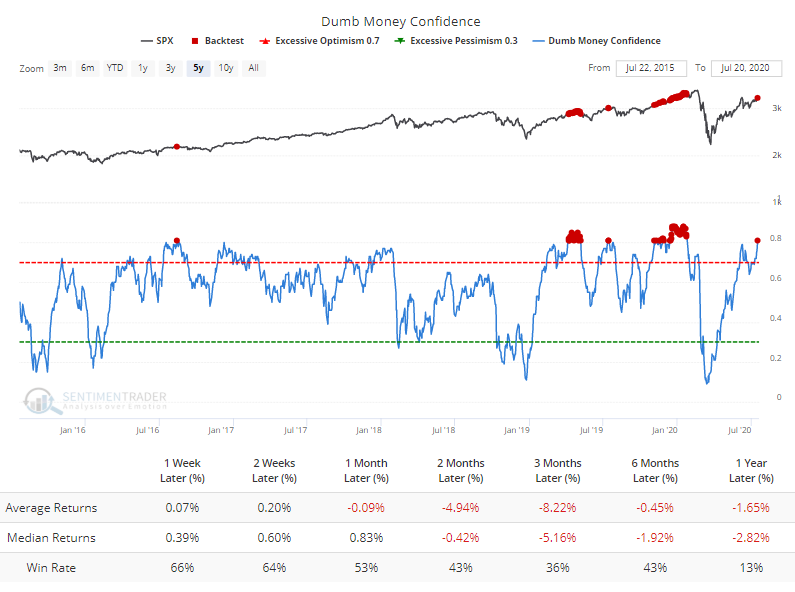
Despite the furious rally in some stocks in recent months, there are still fewer than 60% of S&P 500 stocks holding above their 200-day moving averages. Even so, Dumb Money Confidence has jumped above 80%, showing extremely high optimism during a relatively unhealthy market environment.
Gold miner breadth: Today we've introduced some new premium breadth charts, covering gold mining stocks. Updated daily, Eric has created charts that show the percentage of gold mining stocks in bear markets and corrections, as well as the percentage of those stocks trading above their 10-, 50-, and 200-day moving averages, and the percentages that hit a 52-week high and 52-week low. The indicators are showing that more than 95% of the member stocks are trading above their 200-day averages, a level matched by 195 other days since the inception of the GDX exchange-traded fund. It needs to break its recent pattern since GDX showed a positive return three months later only 38% of the time according to the Backtest Engine. Using the longer history of the NYSE Arca Gold Miners Index (GDM), the only additional precedent was in January 1994 right before a rough few months for these stocks.
Bottom Line:
- Weight of the evidence has been suggesting flat/lower stock prices short- to medium-term again; still suggesting higher prices long-term
- Indicators show high optimism, with Dumb Money Confidence recently above 80% with signs of reckless speculation during what appears to be an unhealthy market environment, historically a bad combination
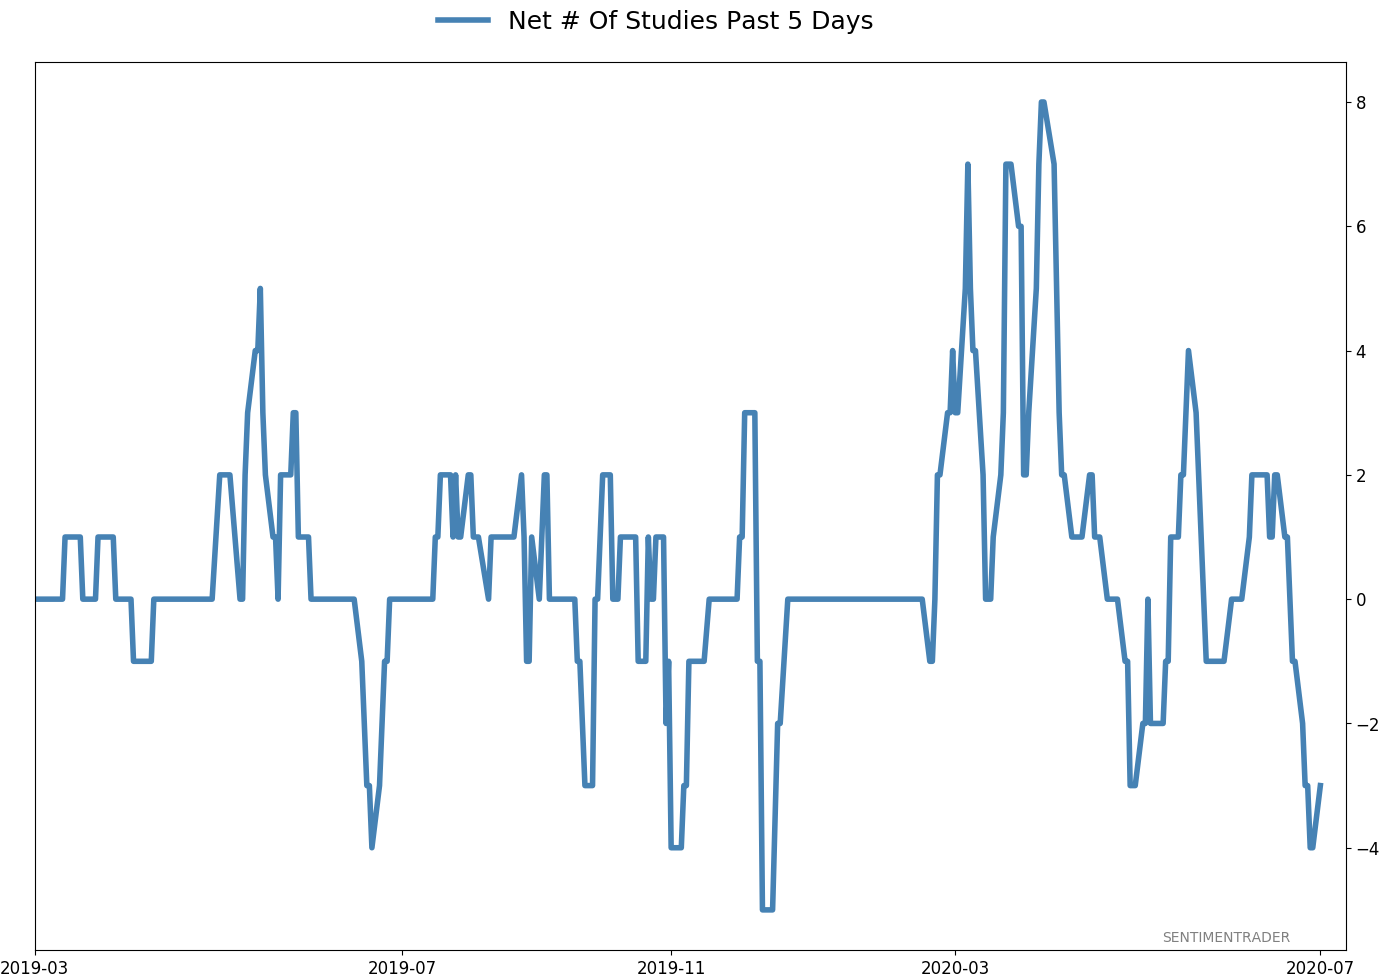
- Active Studies show a heavy positive skew over the medium- to long-term; breadth thrusts, recoveries, and trend changes have an almost unblemished record at preceding higher prices over a 6-12 month time frame
- Signs of extremely skewed preference for tech stocks neared exhaustion by late June, especially relative to industrials and financials (here and here)
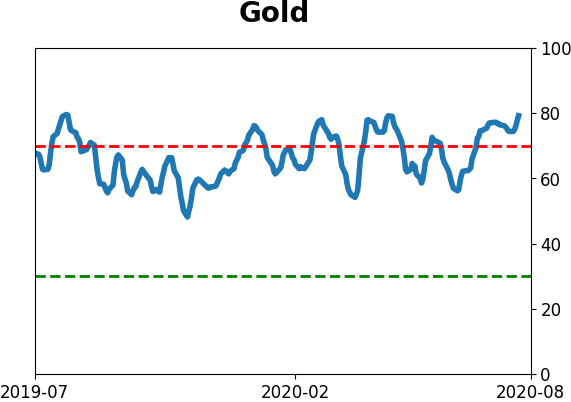
- Indicators and studies for other markets are showing less consistent forward results, though it's not a great sign for Treasuries that hedgers are net short and optimism on metals has become extreme
|
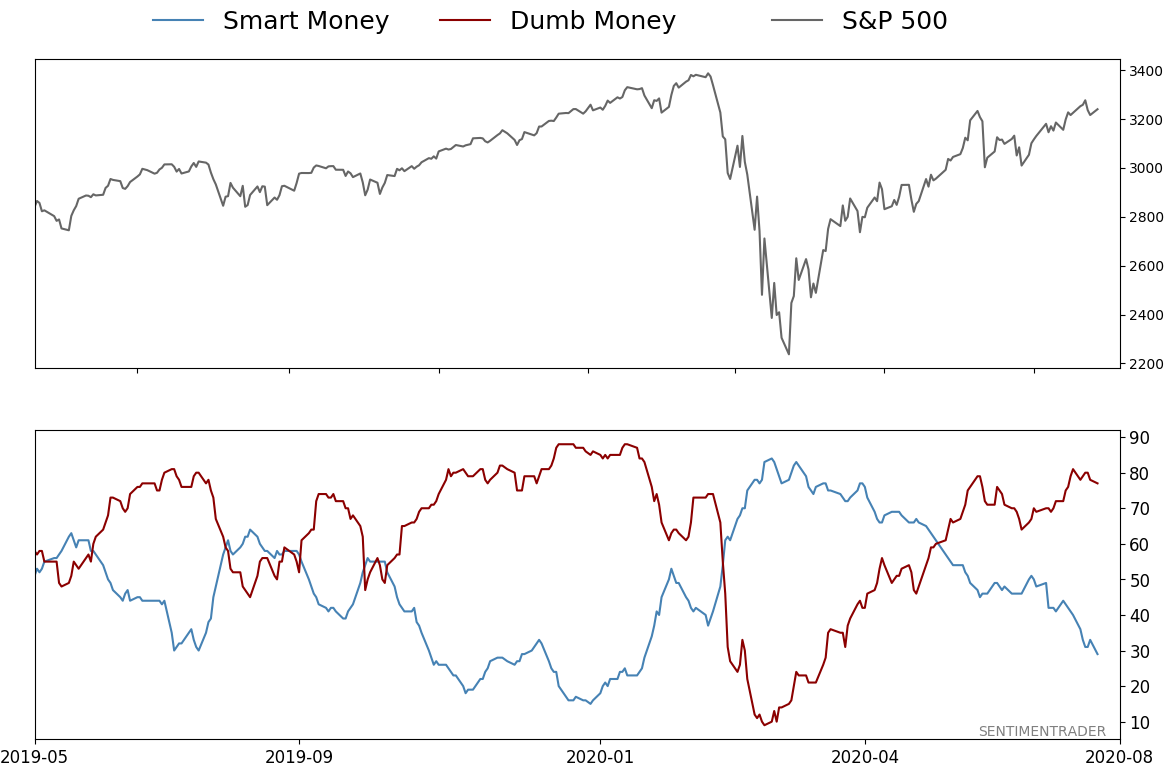
Smart / Dumb Money Confidence
|
Smart Money Confidence: 29%
Dumb Money Confidence: 77%
|
|
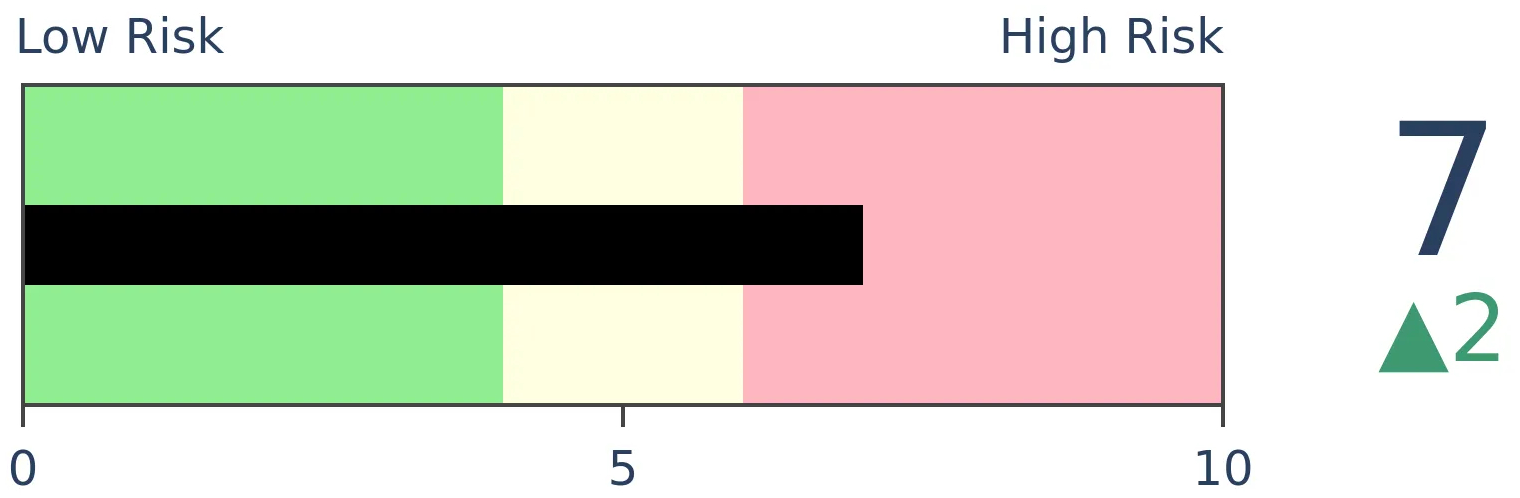
Risk Levels
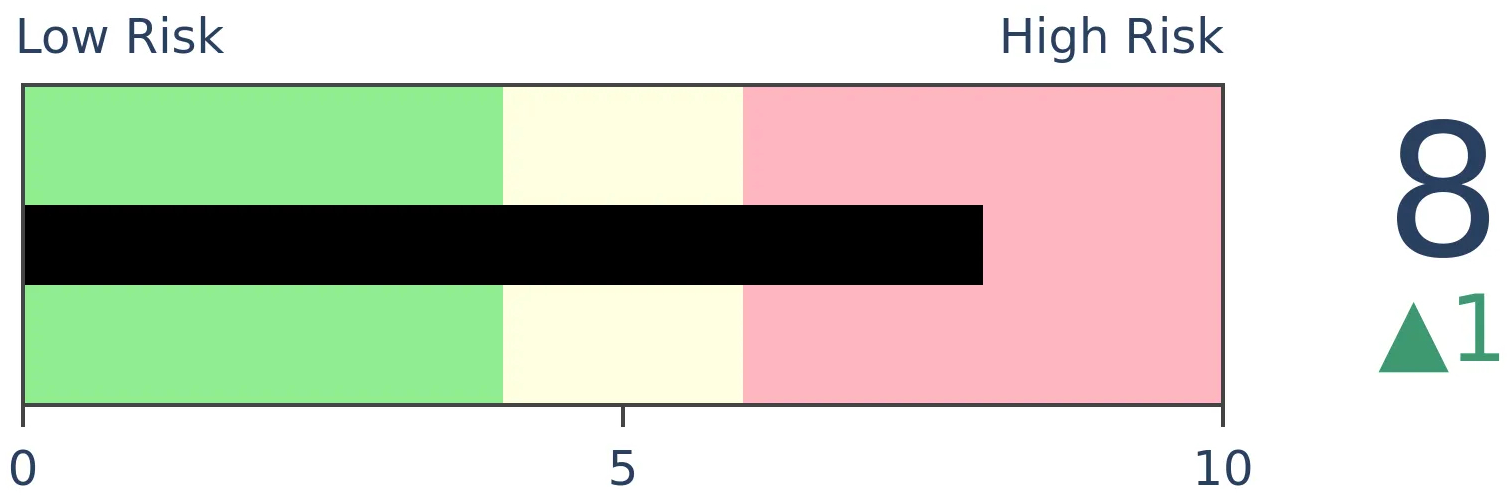
Stocks Short-Term
|
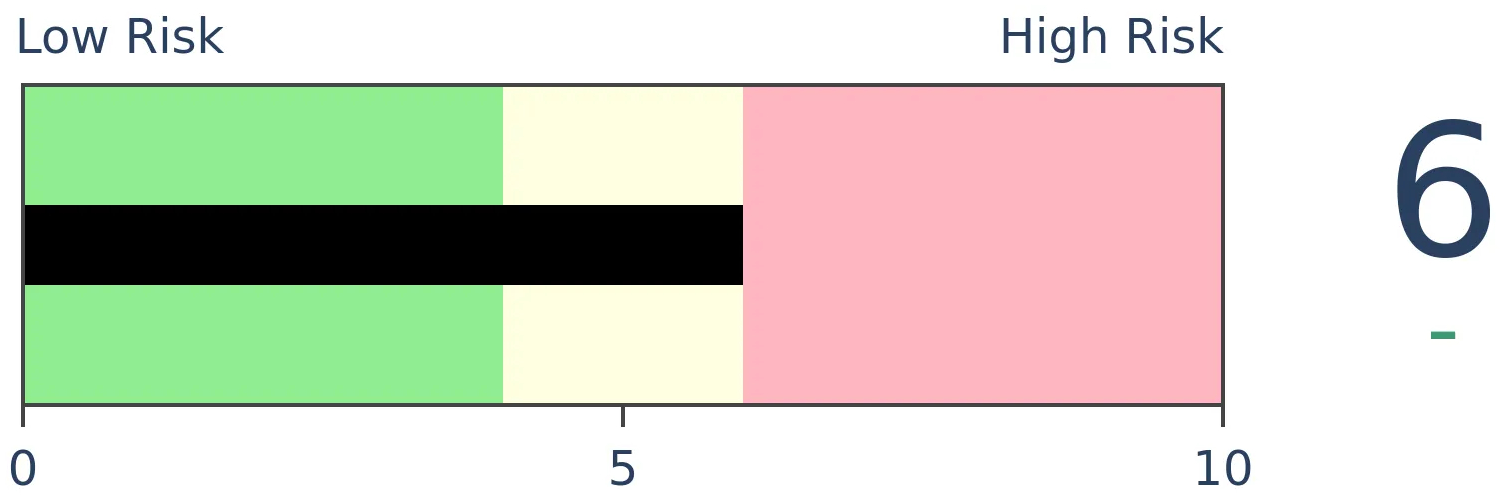
Stocks Medium-Term
|
|
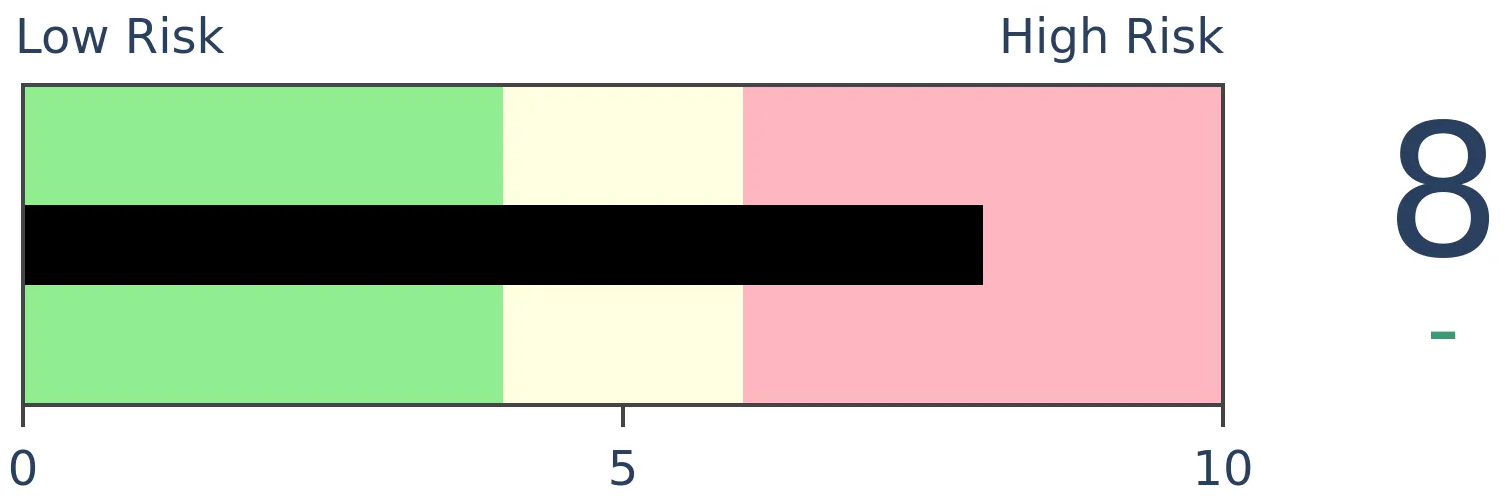
Bonds
|
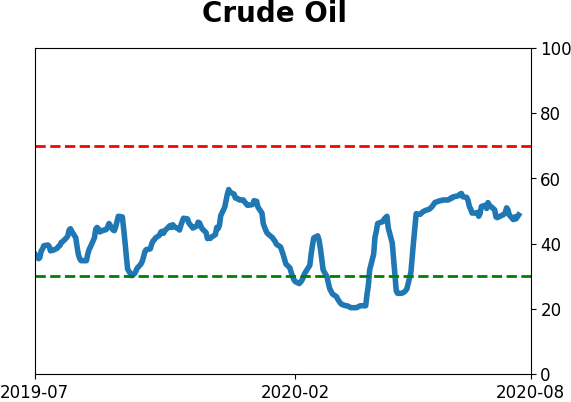
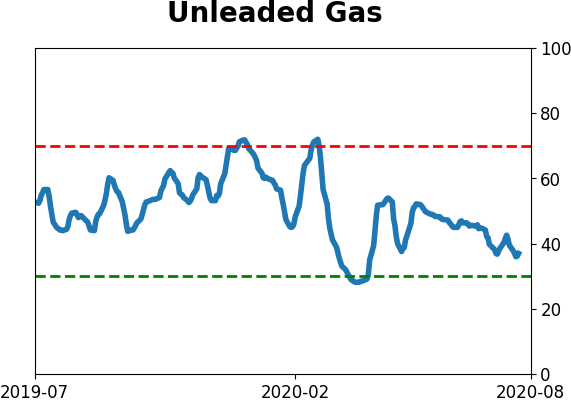
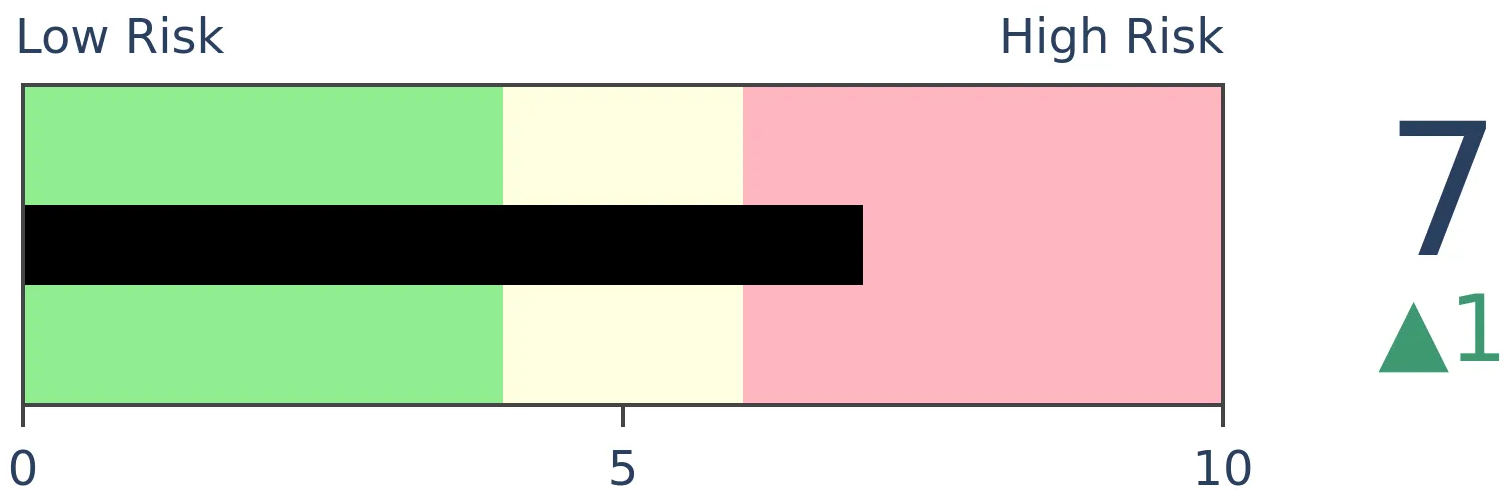
Crude Oil

|
|
Gold
|
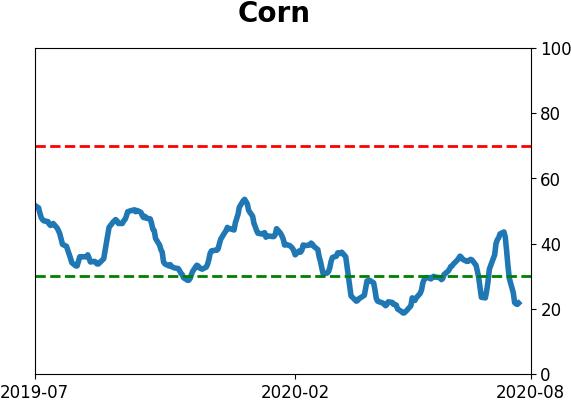
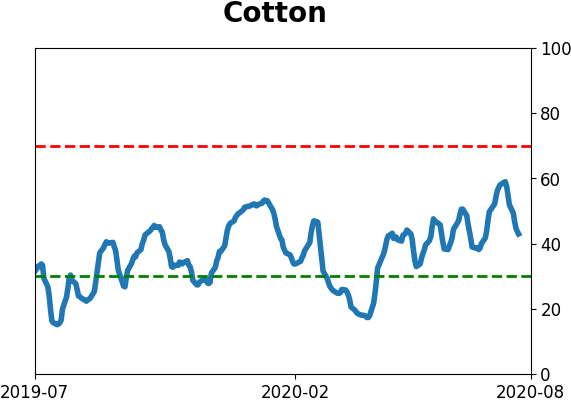
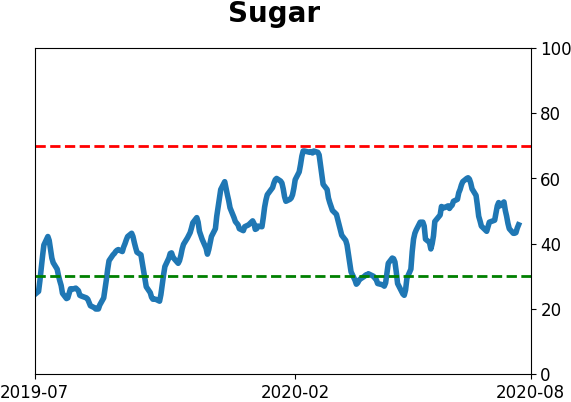
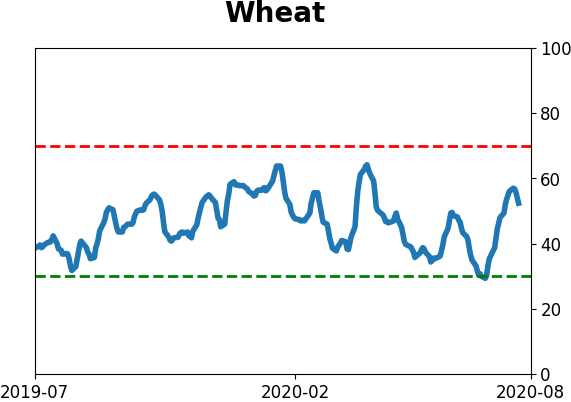
Agriculture
|
|
Research
BOTTOM LINE
Despite the furious rally in some stocks in recent months, there are still fewer than 60% of S&P 500 stocks holding above their 200-day moving averages. Even so, Dumb Money Confidence has jumped above 80%, showing extremely high optimism during a relatively unhealthy market environment.
FORECAST / TIMEFRAME
SPY -- Down, Medium-Term
|
The Bottom Line part of the Dashboard and Daily Report hasn't changed too much in recent weeks. The overall theme is that we're seeing extreme optimism during an unhealthy market environment.
MARKET ENVIRONMENT
There are a number of ways to define this. Simply looking for prices above/below the 200-day moving average works just about as well as complex trend models, and it's a good, clear-defined alternative. Combine that with a simple view of whether prices are making higher highs and higher lows (bull trend), lower highs and lower lows (bear trend), or both (neutral trend) and you can get an excellent sense for whether bulls or bears are in control. Those are mixed right now, with a slight edge to the bullish camp.
Another of our preferred methods is looking at participation - how many securities are in uptrends/downtrends.
Healthy environments consistently see more than 60% of stocks, industries, sectors, and countries holding above their 200-day averages. When it dips below 40% (and especially below 20%), it's usually only temporary and proves to be good buying opportunities. Unhealthy environments consistently see fewer than 60% of these above their averages, and spikes above that level tend to get sold quickly.
That's where we are now. In addition to a large number of stocks trailing the S&P by double-digits, fewer than 60% have been able to hold above their 200-day averages. When it spiked above 60% in June, selling pressure picked up immediately.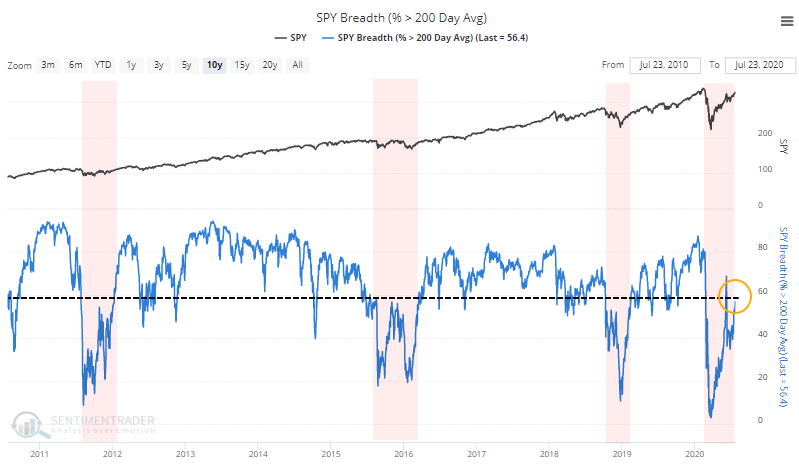
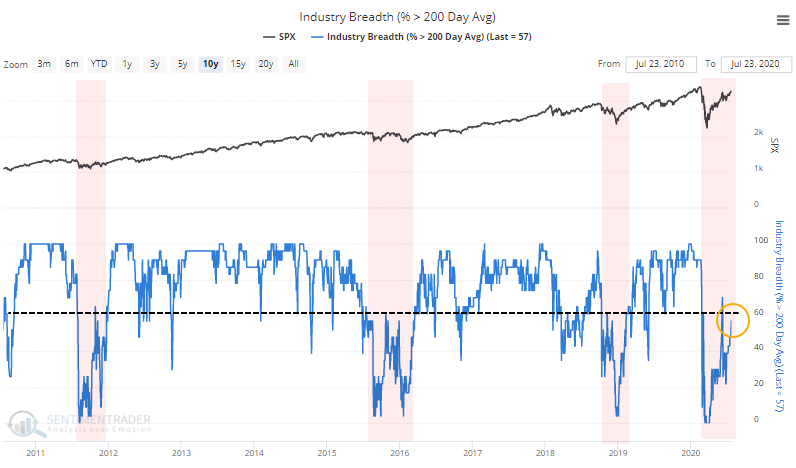
Same for industries...
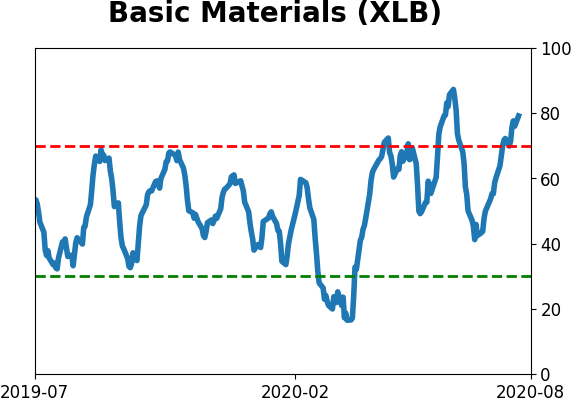
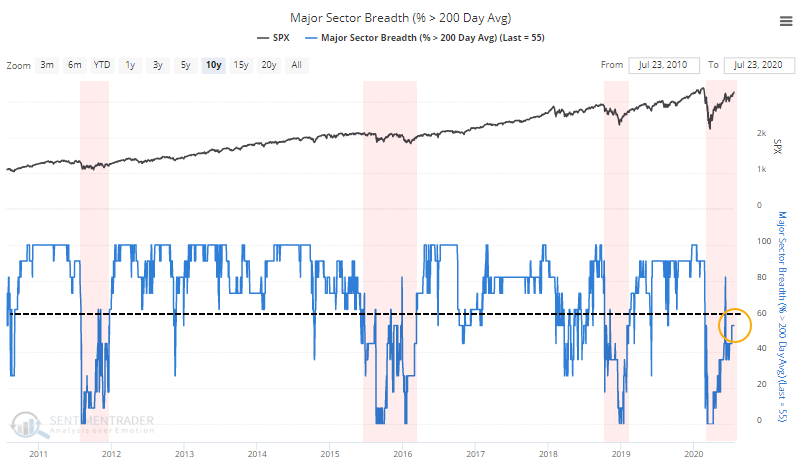
...and sectors...
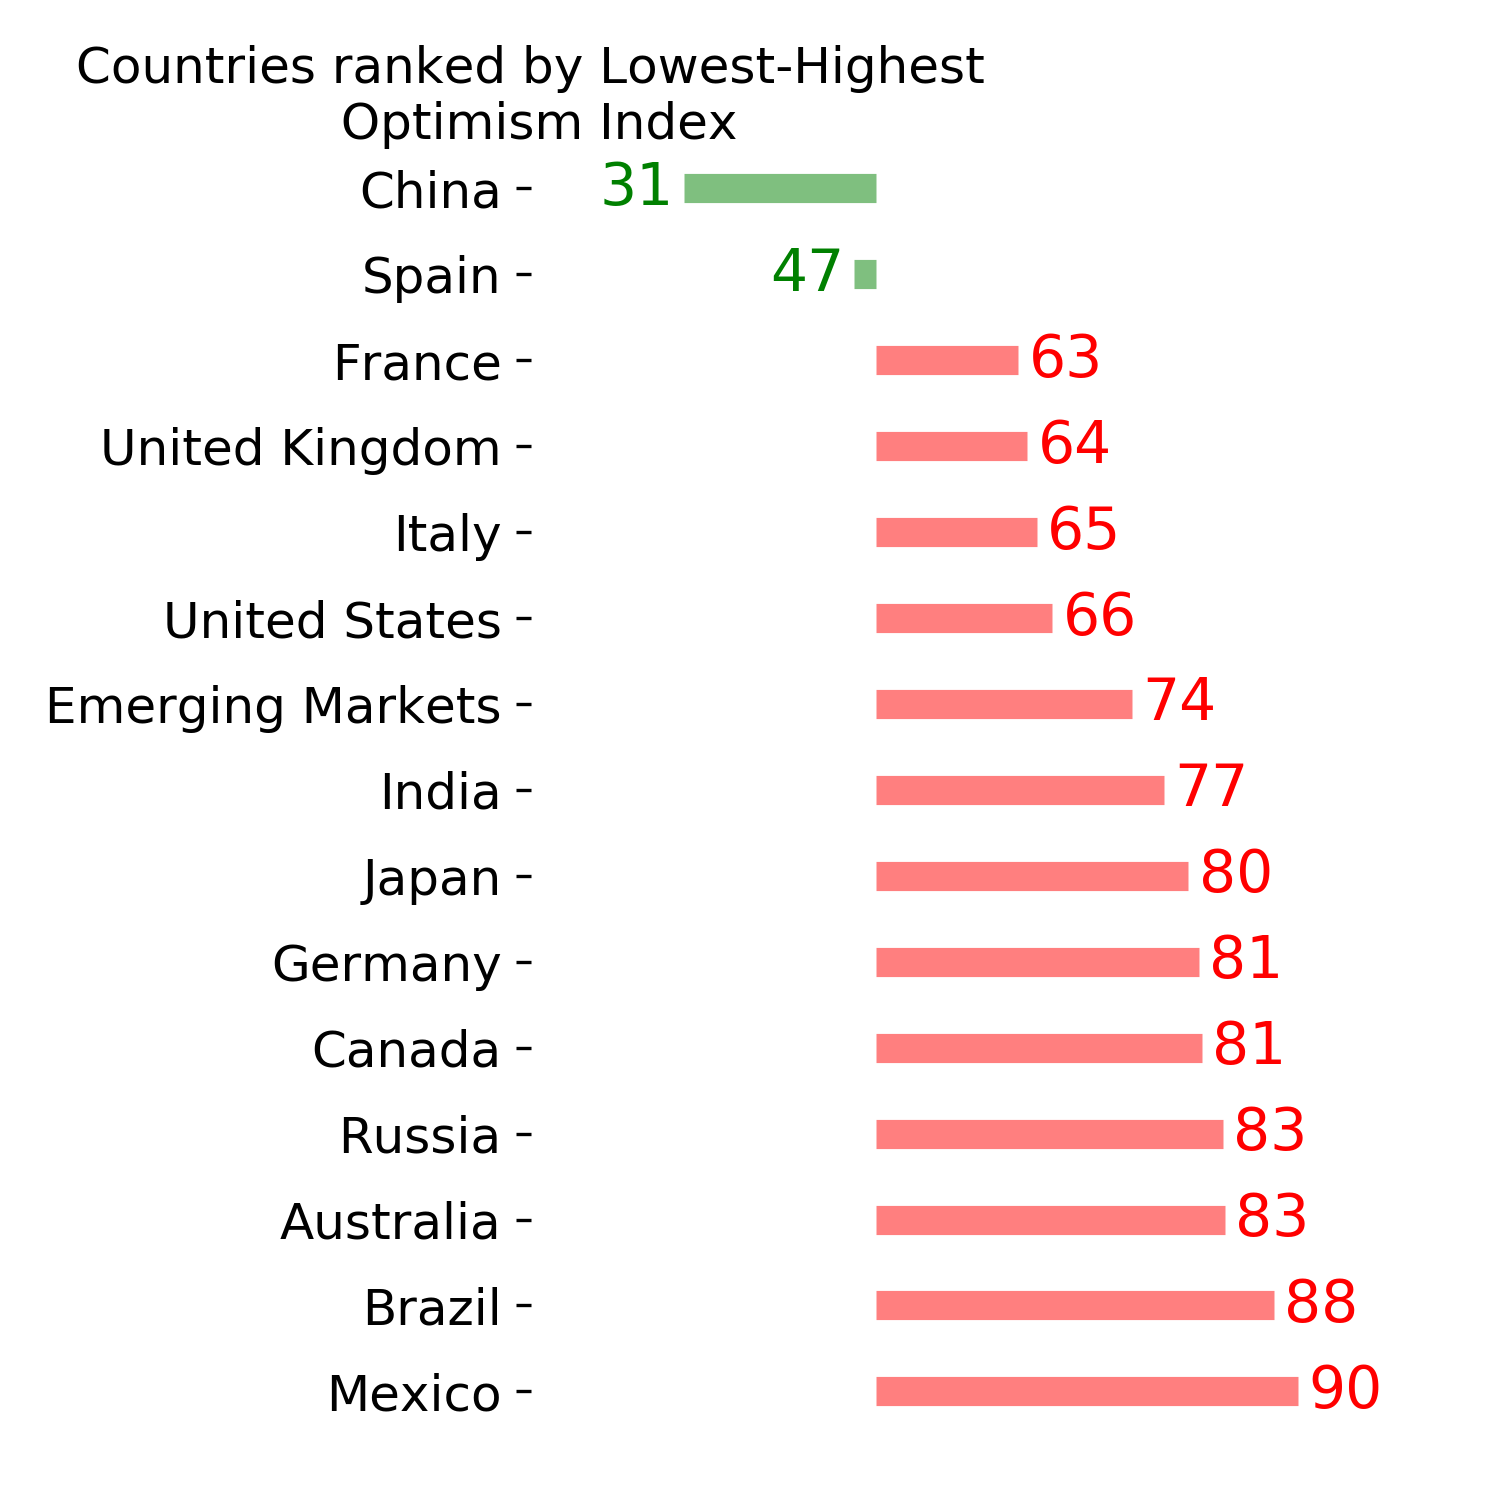
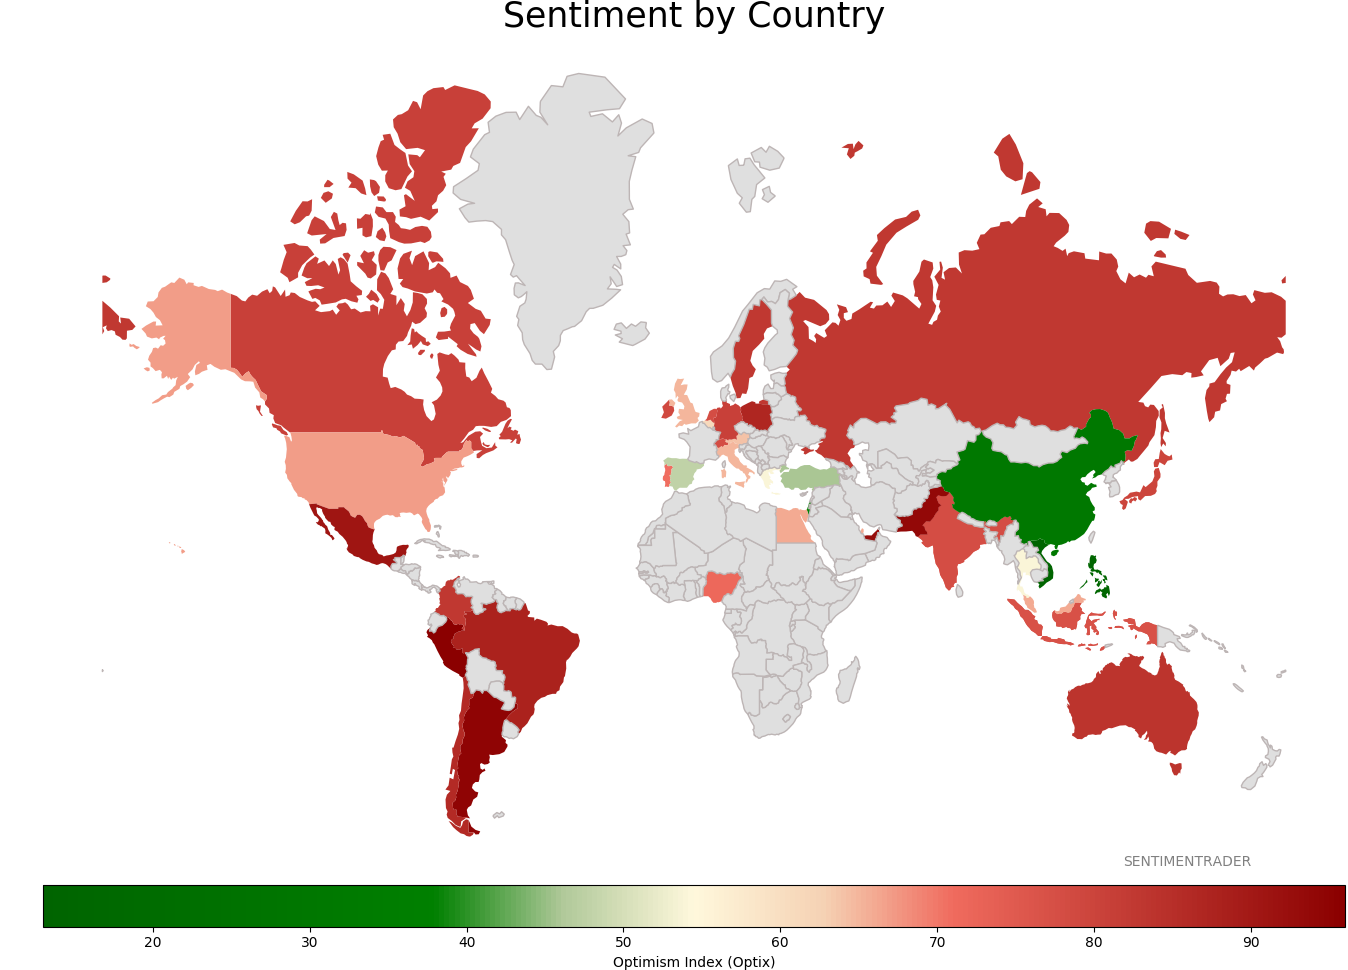
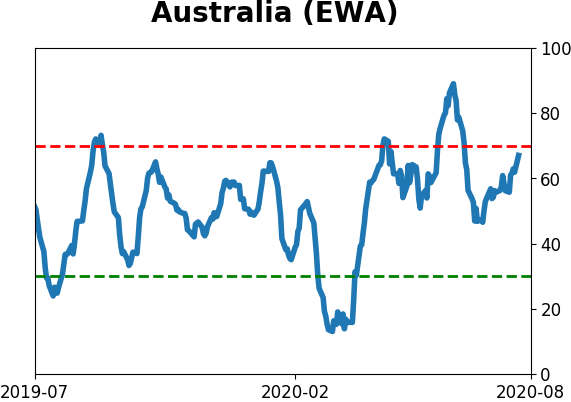
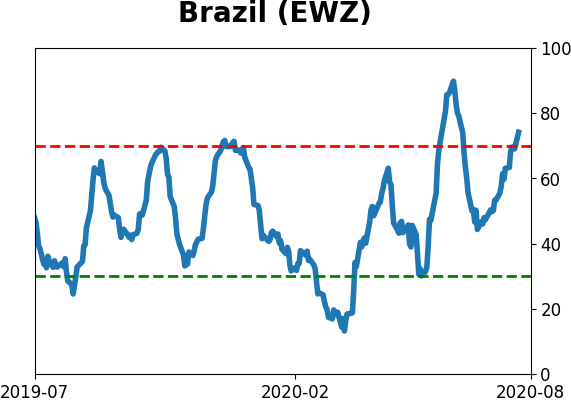
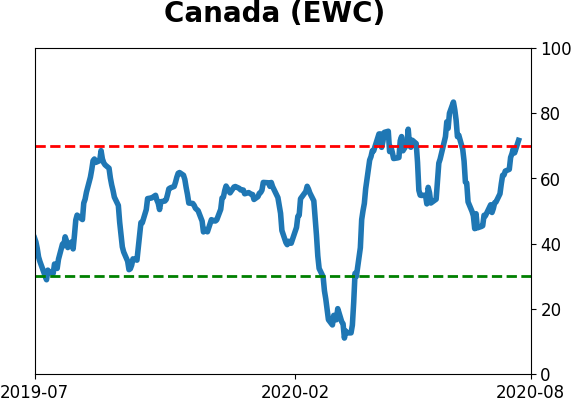
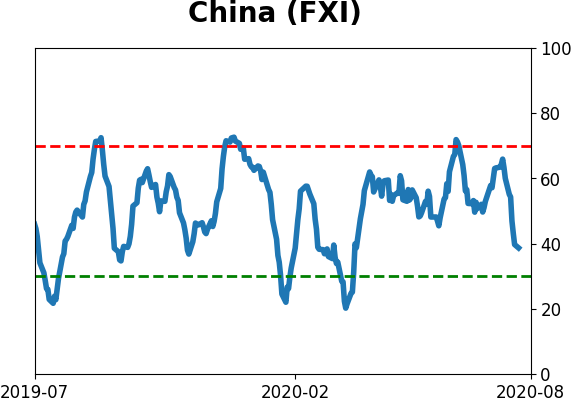
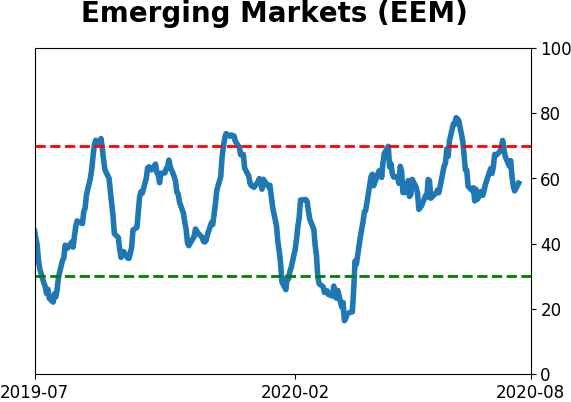
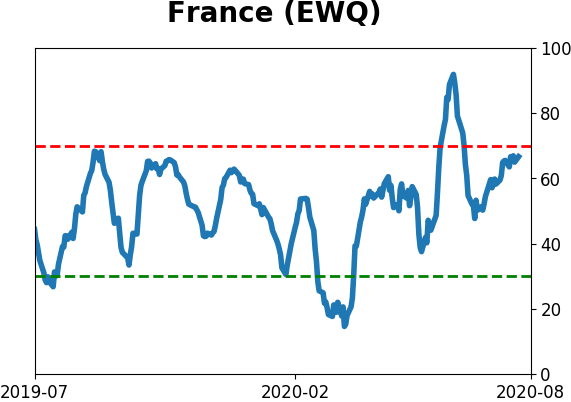
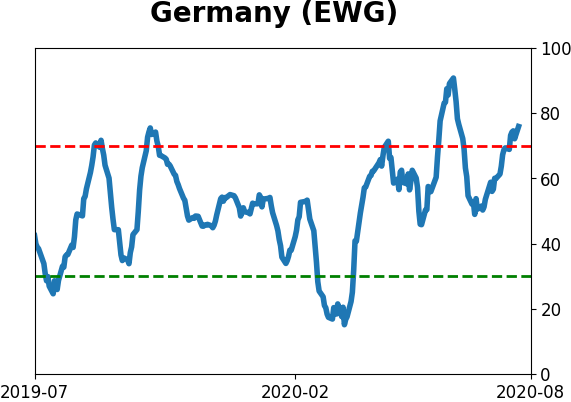
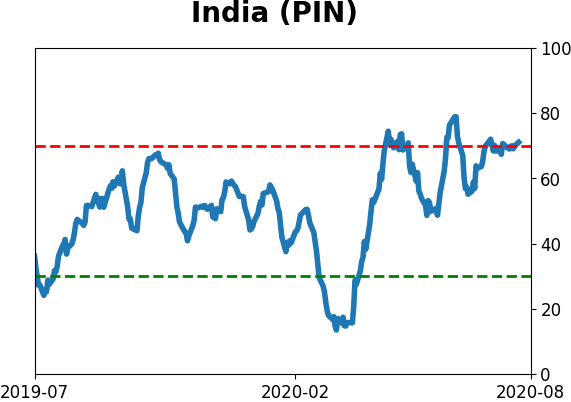
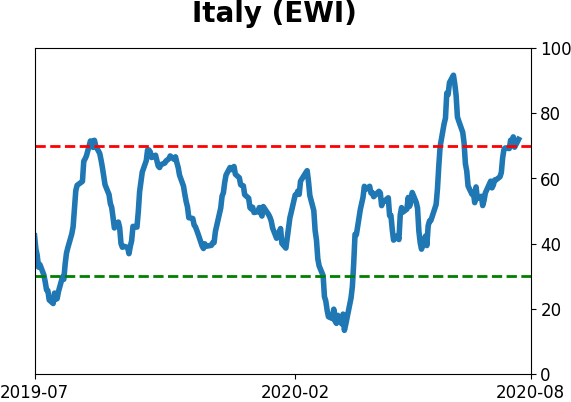
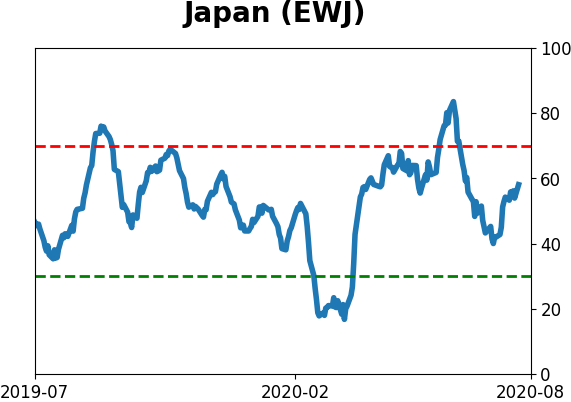
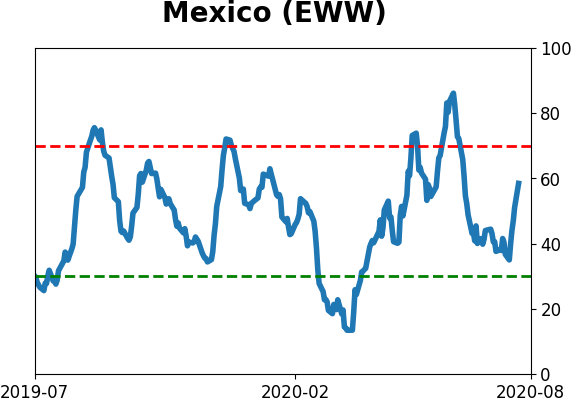
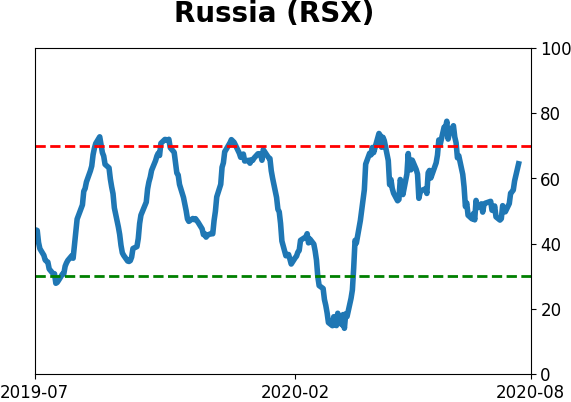
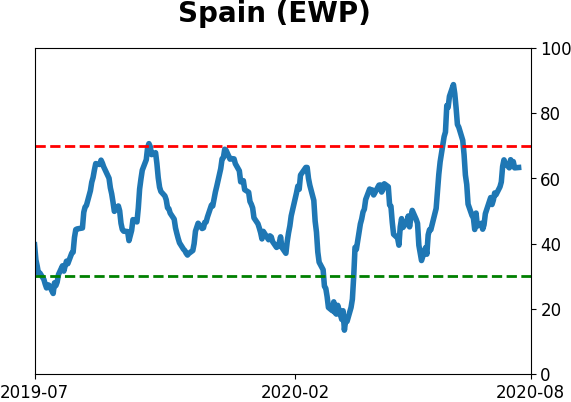
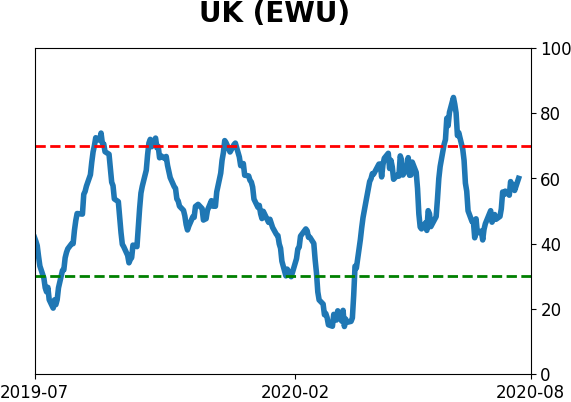
...and countries.
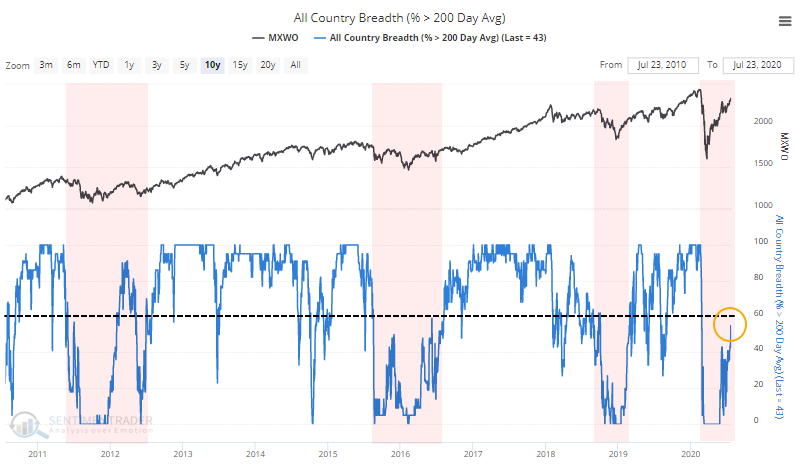
These are not on/off switches, but rather general reflections of the environment. As long as these metrics consistently hold below 60%, signs of excessive optimism tend to lead to very poor forward returns. That's where we are now, along with seeing the top 5 stocks dominate the indexes and mask some poor underlying participation.
SENTIMENT
As we saw last week, optimism is extremely high. Dumb Money Confidence has been hovering at or above 80%, which has preceded poor returns, especially in recent years.
Helping to push this higher was recent record-setting option speculation. Even though some of the market's leaders stumbled last week, the Options Speculation Index remains near a 20-year high. Plus, we have the added headwind of being in the most seasonally unfavorable period for stocks.
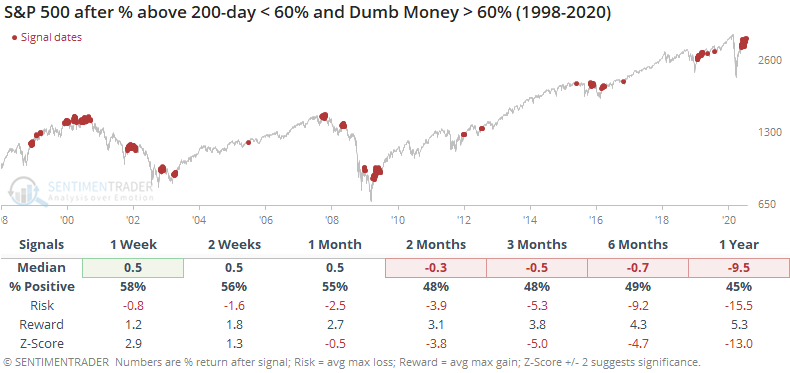
We've often noted that during times of unhealthy market environments, when fewer than 60% of stocks can hold above their 200-day averages, that periods of high optimism tend to lead to below-average forward returns.
We're seeing that now, to a historic degree. Since we've been tracking this data, just over 20 years, there has never been a day when Dumb Money Confidence was at or above 80% while fewer than 60% of stocks in the S&P 500 were trading above their 200-day averages. Until now.
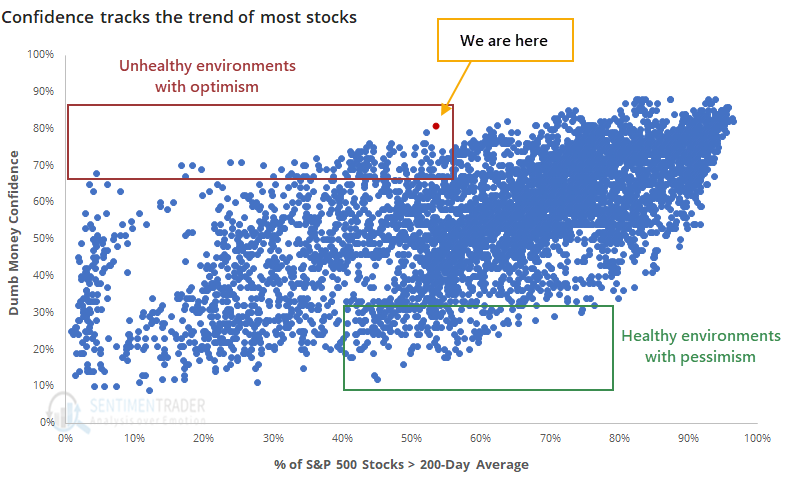
Historically, the combination of relatively few stocks in uptrends and high overall optimism has led to poor returns.
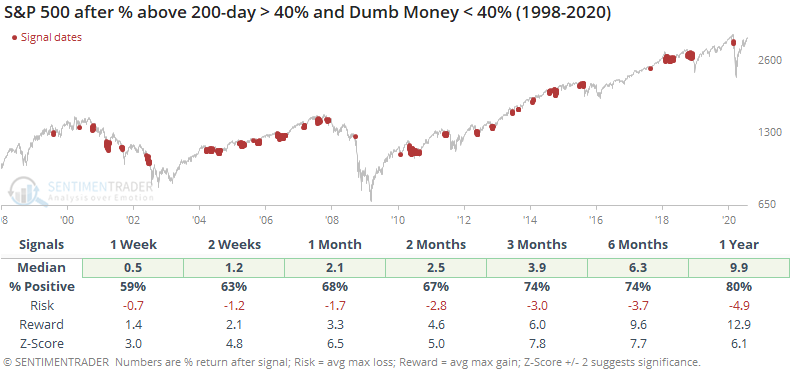
Contrast that to times of generally healthy environments coupled with low optimism.
The two most important factors for determining multi-month risk/reward, at least how we see it, are market environment and sentiment extremes. Both are now skewing heavily to the "risk" side of the ledger.
The wild cards that have existed since March continue to lurk - whether the promise of a vaccine/treatment along with a historic bucket of fiscal and monetary stimulus are enough to override any and all technical, fundamental, or behavioral factors, even over shorter time frames like several weeks to several months. The evidence is mixed on that front, so, for now, the view is that the medium-term has significantly higher-than-normal risk.
Active Studies
| Time Frame | Bullish | Bearish | | Short-Term | 0 | 1 | | Medium-Term | 8 | 11 | | Long-Term | 44 | 1 |
|
Indicators at Extremes
Portfolio
| Position | Weight % | Added / Reduced | Date | | Stocks | 29.8 | Reduced 9.1% | 2020-06-11 | | Bonds | 0.0 | Reduced 6.7% | 2020-02-28 | | Commodities | 5.2 | Added 2.4%
| 2020-02-28 | | Precious Metals | 0.0 | Reduced 3.6% | 2020-02-28 | | Special Situations | 0.0 | Reduced 31.9% | 2020-03-17 | | Cash | 65.0 | | |
|
Updates (Changes made today are underlined)
In the first months of the year, we saw manic trading activity. From big jumps in specific stocks to historic highs in retail trading activity to record highs in household confidence to almost unbelievable confidence among options traders. All of that came amid a market where the average stock couldn't keep up with their indexes. There were signs of waning momentum in stocks underlying the major averages, which started triggering technical warning signs in late January. After stocks bottomed on the 23rd, they enjoyed a historic buying thrust and retraced a larger amount of the decline than "just a bear market rally" tends to. Those thrusts are the most encouraging sign we've seen in years. Through early June, we were still seeing thrusts that have led to recoveries in longer-term breadth metrics. The longer-term prospects for stocks (6-12 months) still look decent given the above. On a short- to medium-term basis, it was getting harder to make that case. Dumb Money Confidence spiked and there were multiple signs of a historic level of speculation. This is likely the lowest I will go given what I still consider to be compelling positives over a longer time frame. There is not a slam-dunk case to be made for either direction, so it will seem like a mistake whether stocks keep dropping (why didn't I sell more?) or if they turn and head higher (why did I let short-term concerns prevail?). After nearly three decades of trading, I've learned to let go of the idea of perfection.
RETURN YTD: -4.0% 2019: 12.6%, 2018: 0.6%, 2017: 3.8%, 2016: 17.1%, 2015: 9.2%, 2014: 14.5%, 2013: 2.2%, 2012: 10.8%, 2011: 16.5%, 2010: 15.3%, 2009: 23.9%, 2008: 16.2%, 2007: 7.8%
|
|
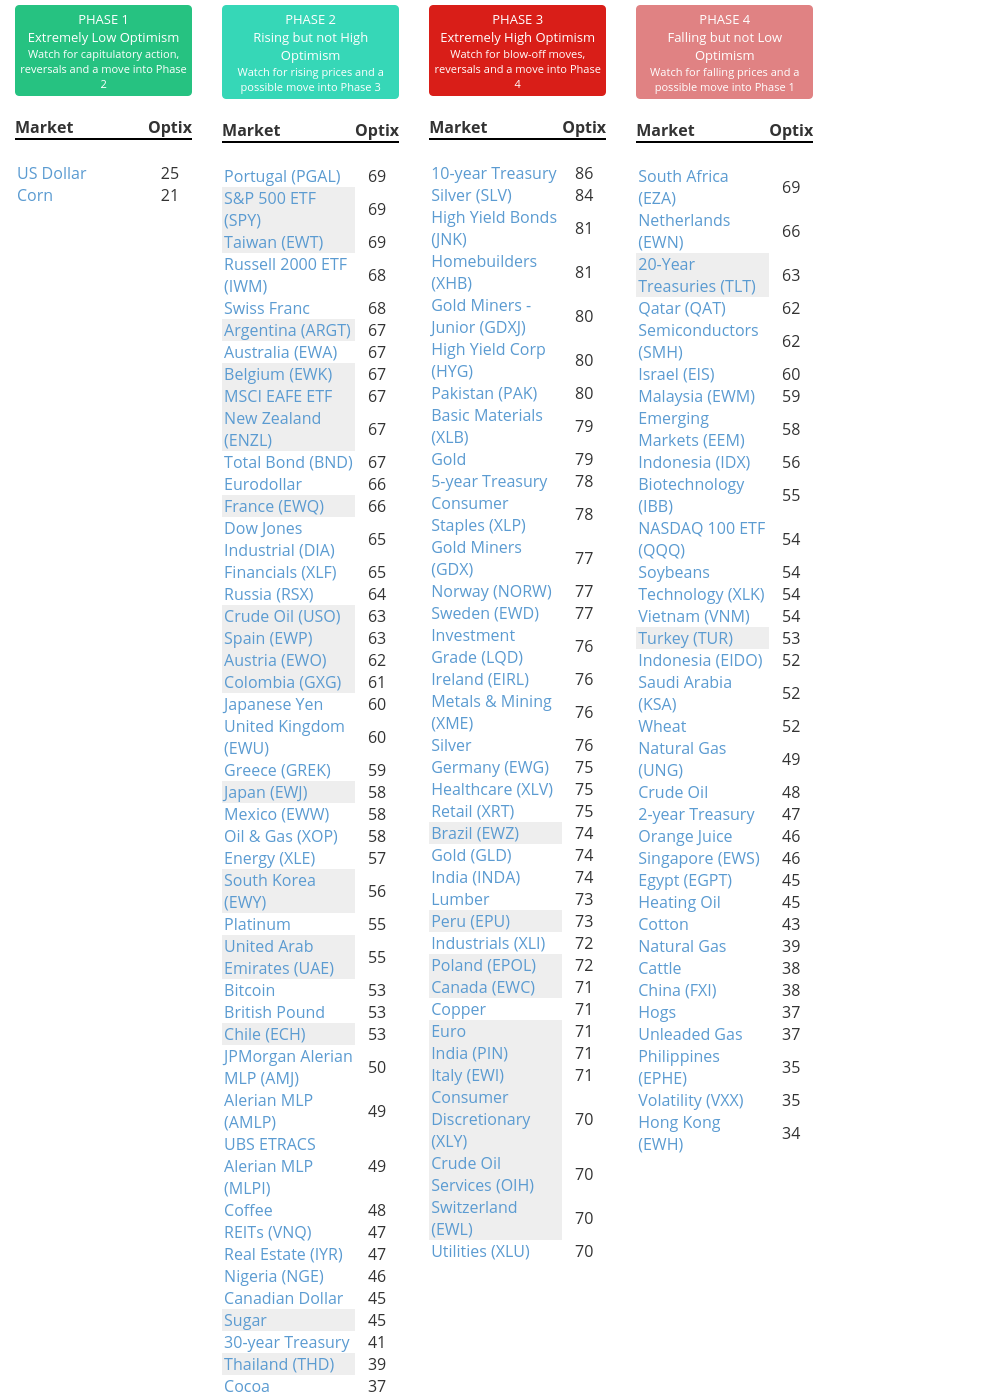
Phase Table
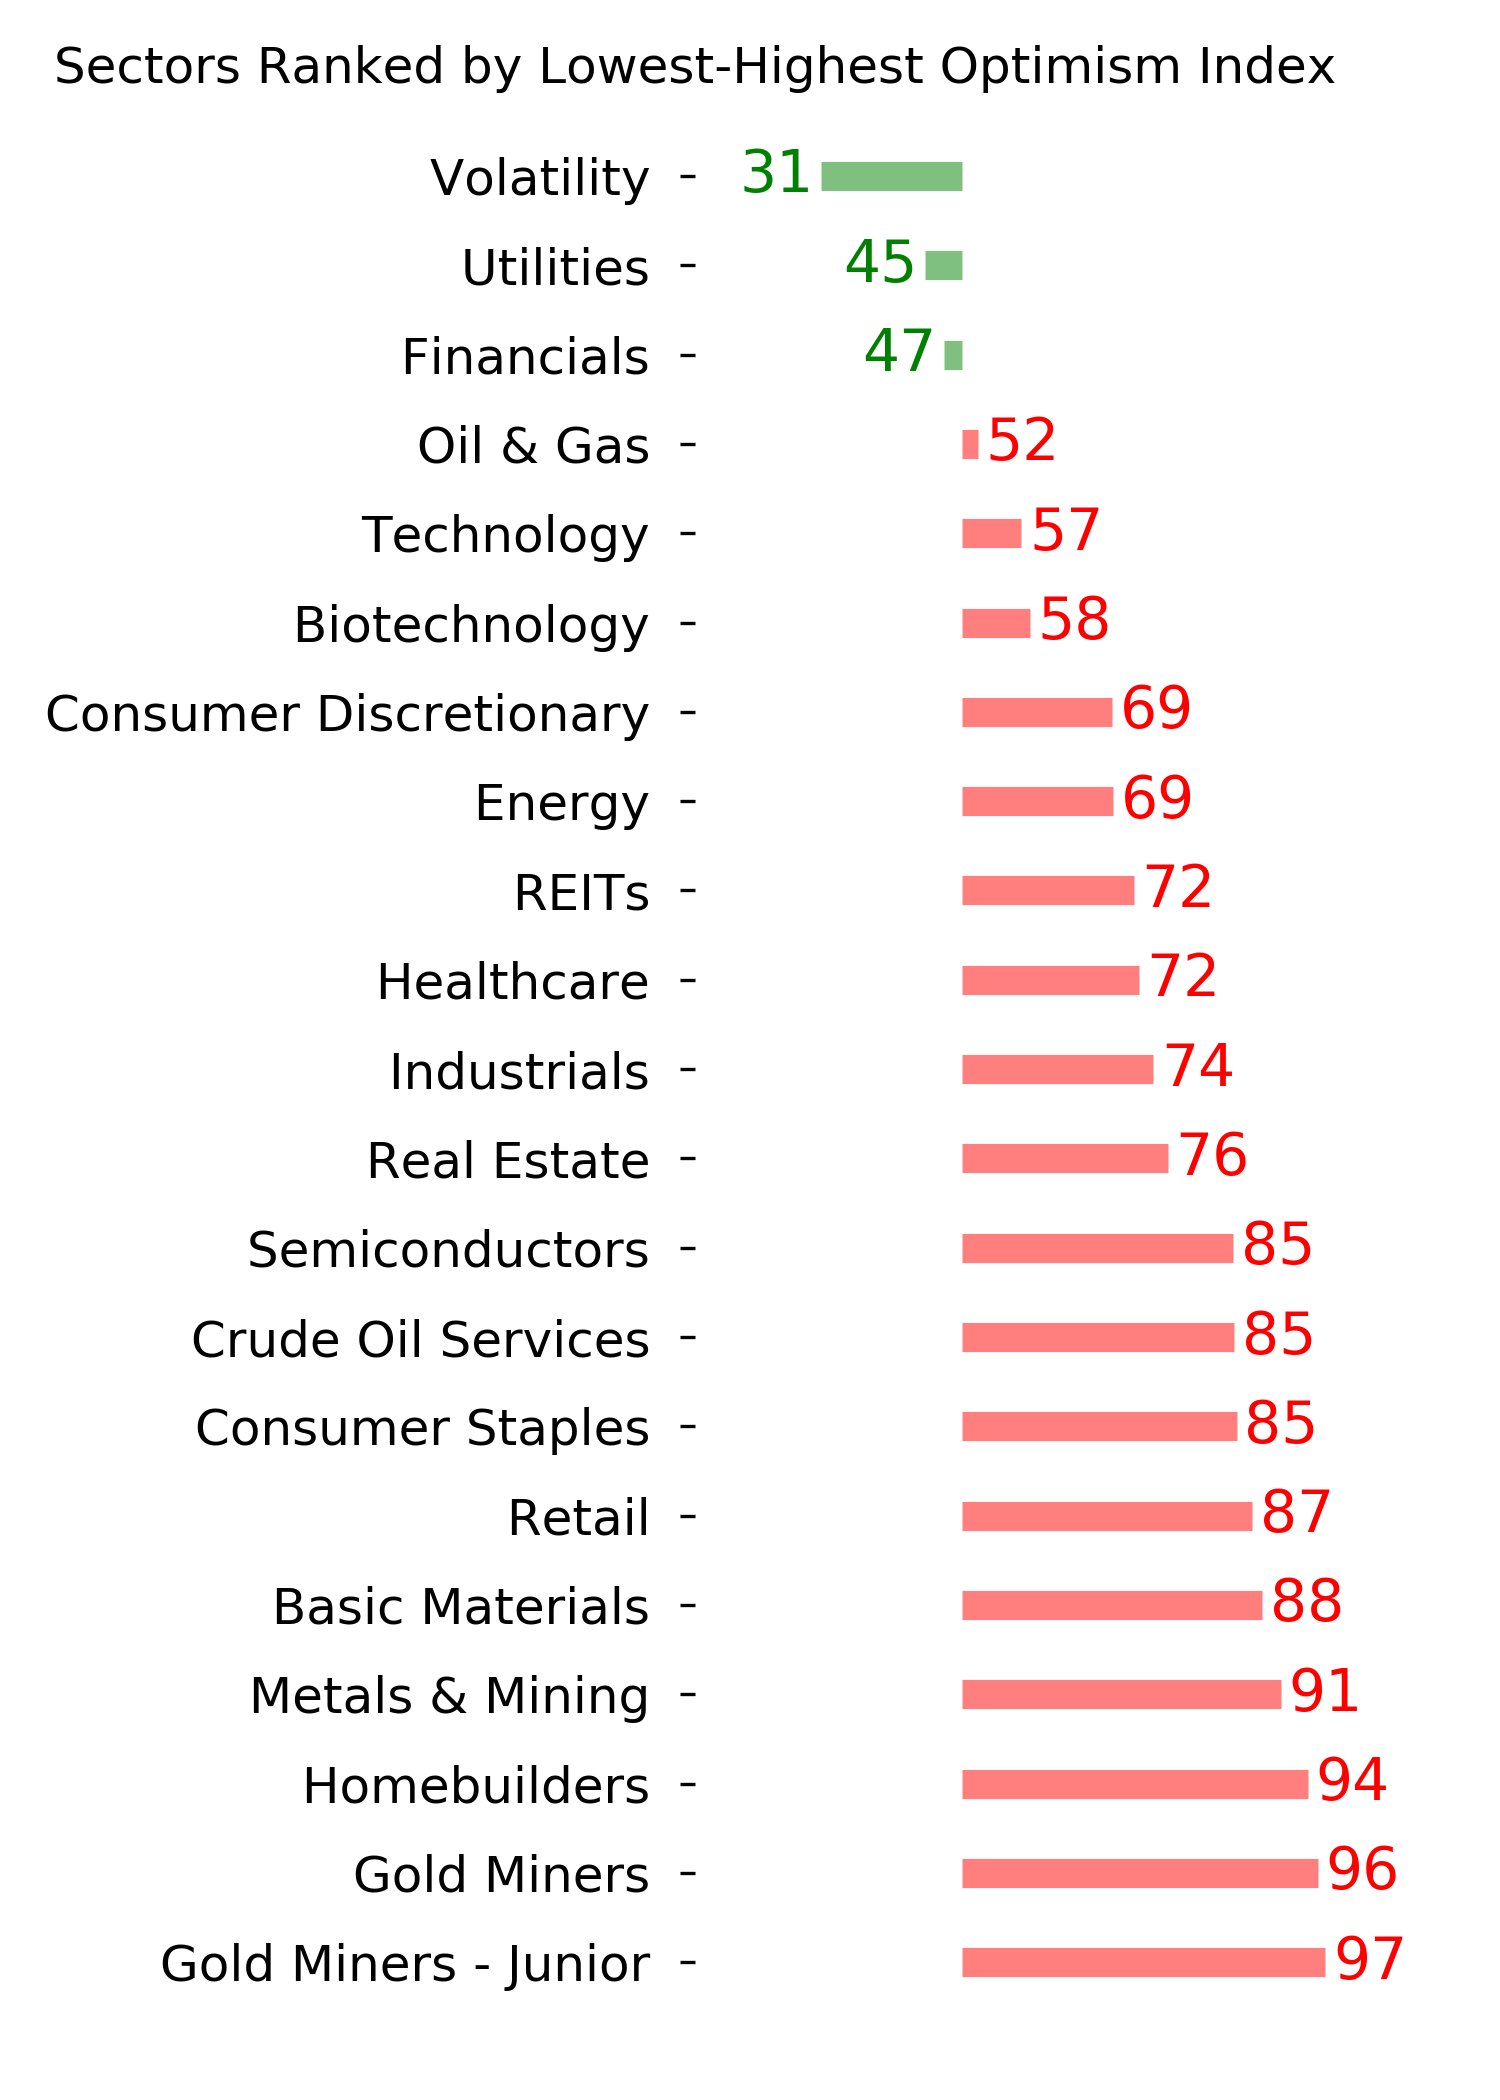
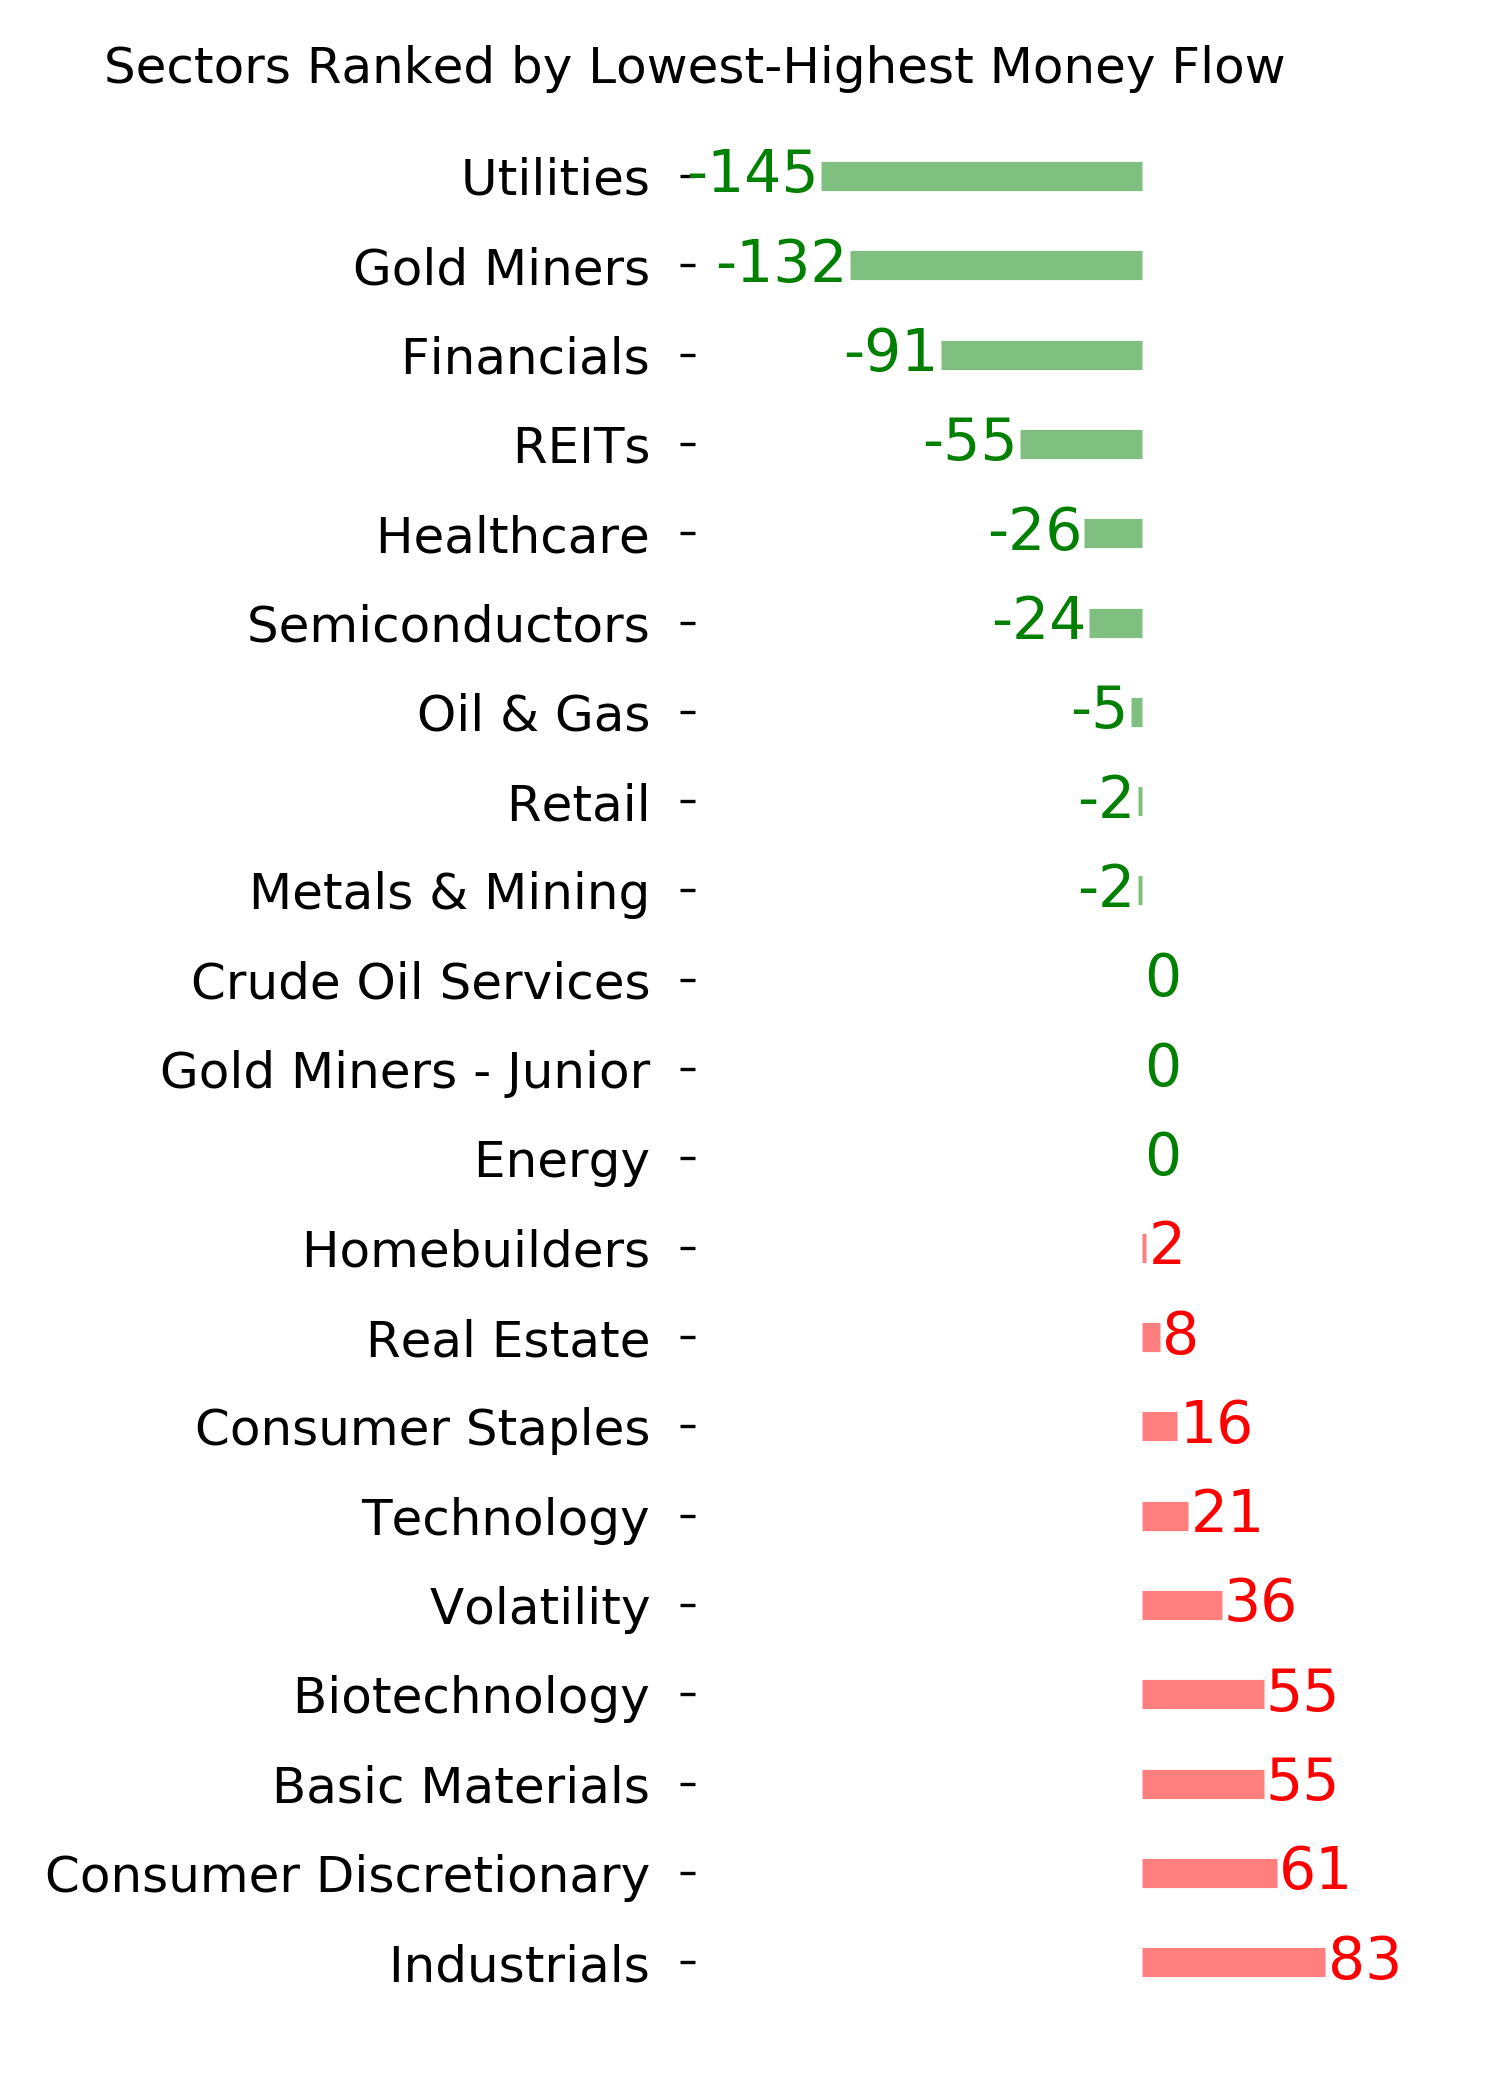
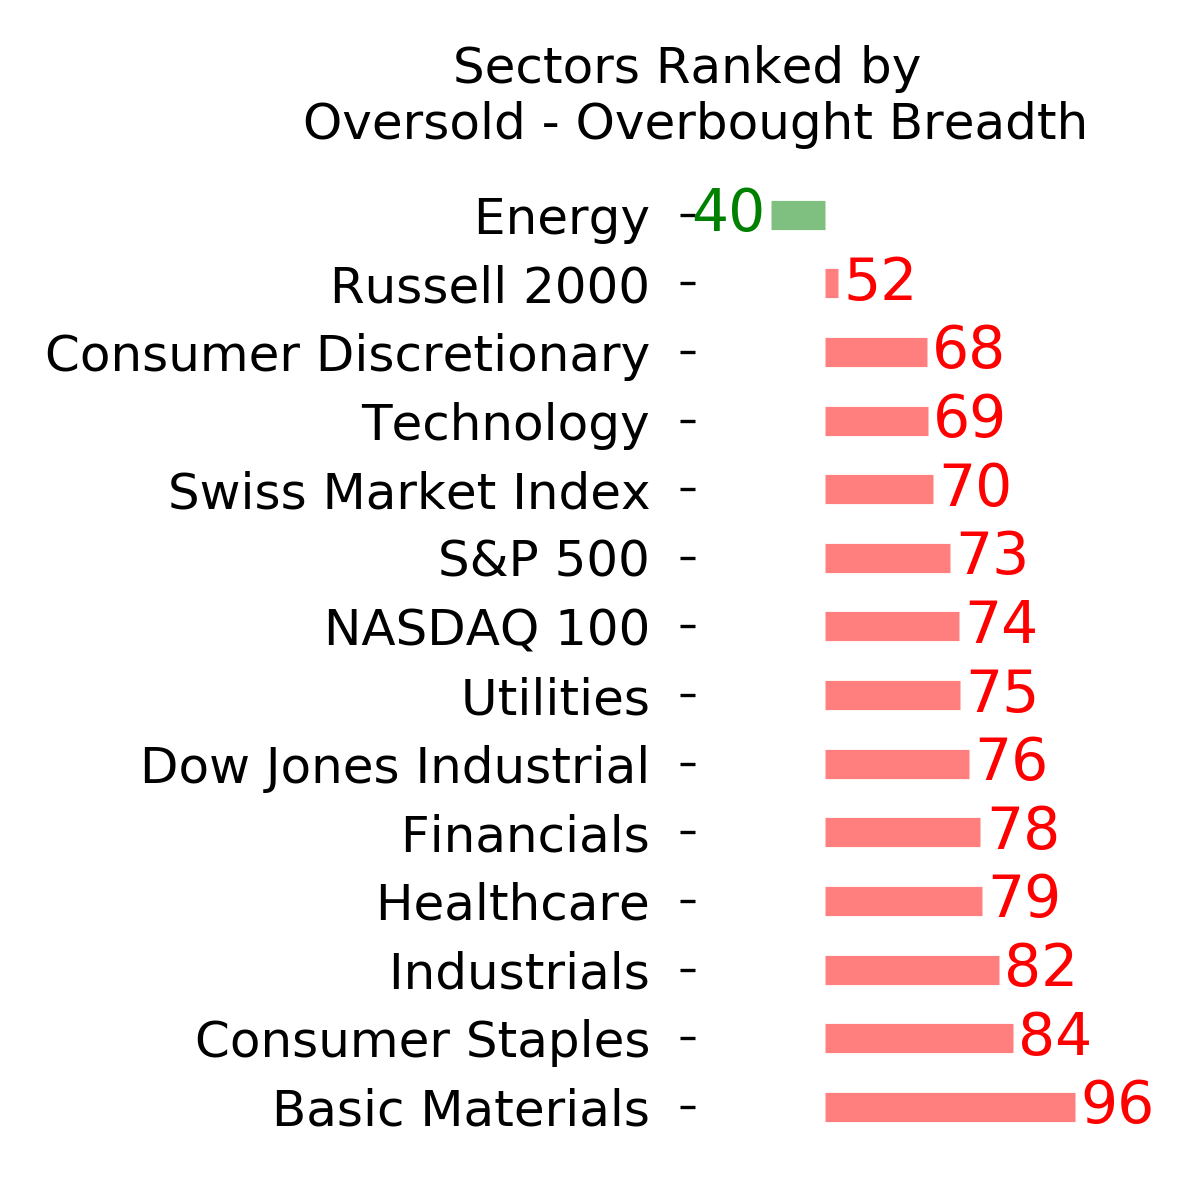
Ranks
Sentiment Around The World
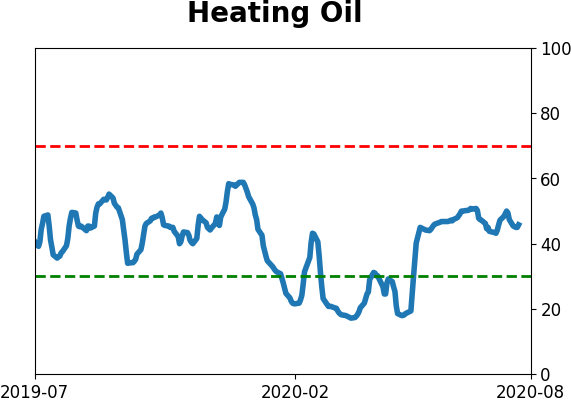
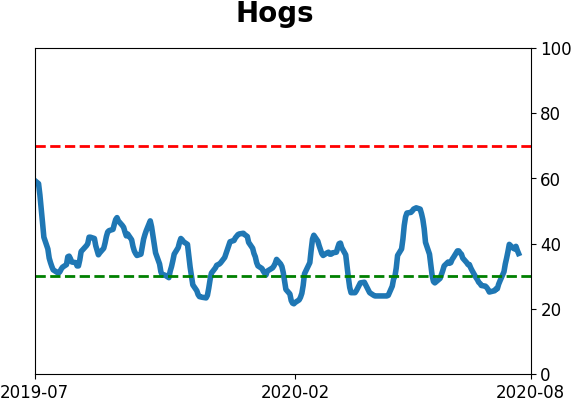
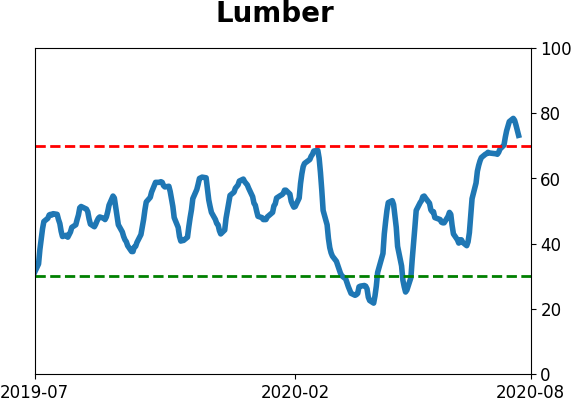
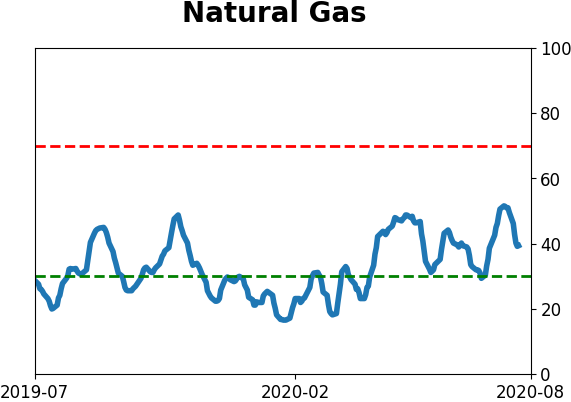
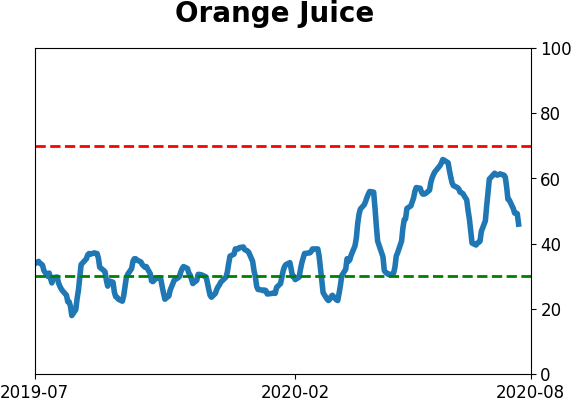
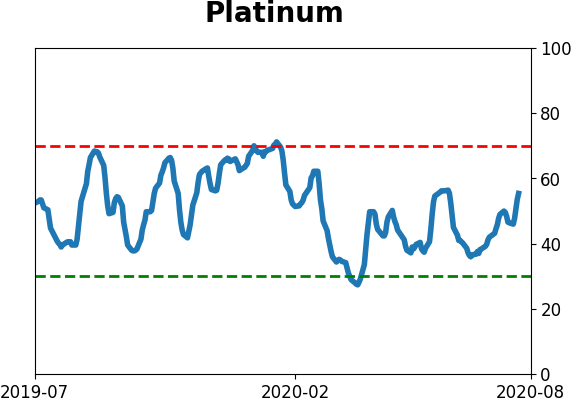
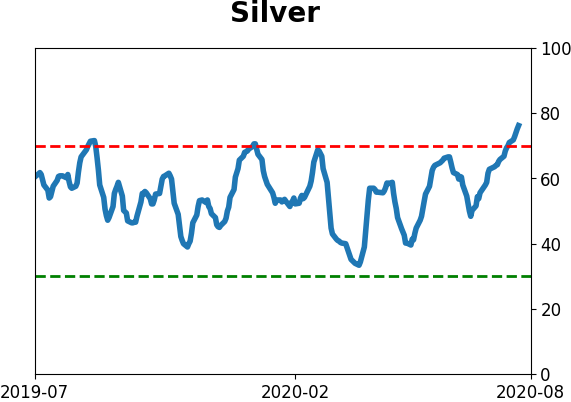
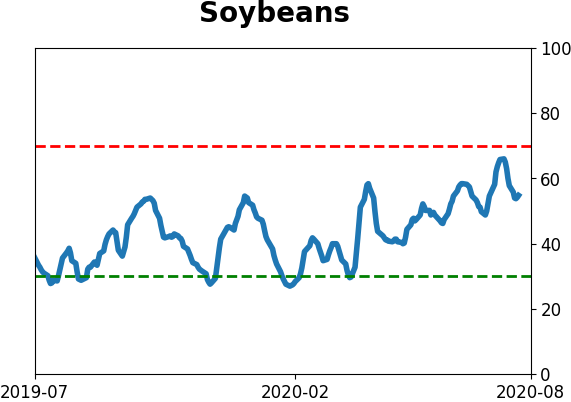
Optimism Index Thumbnails
|
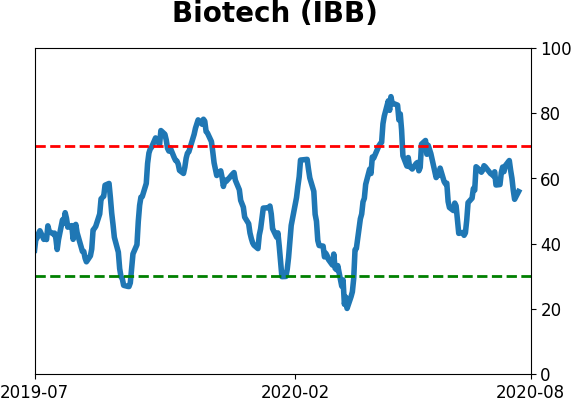
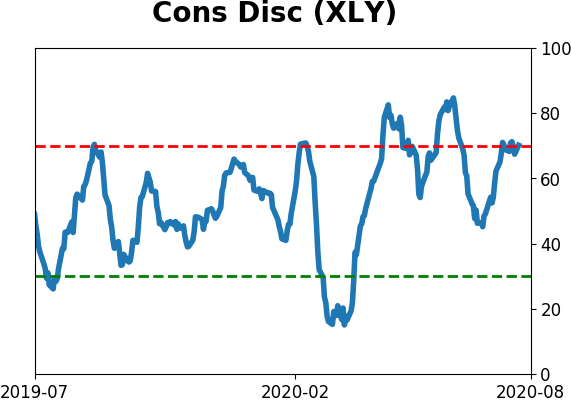
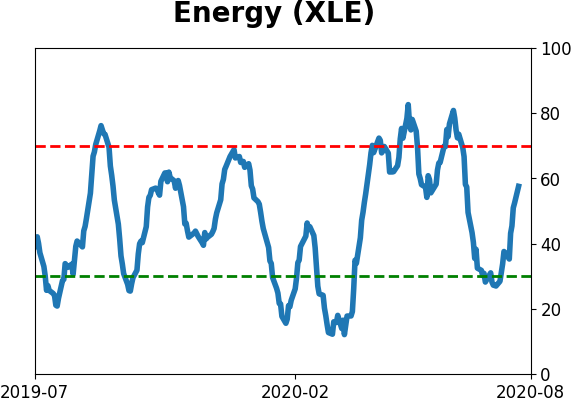
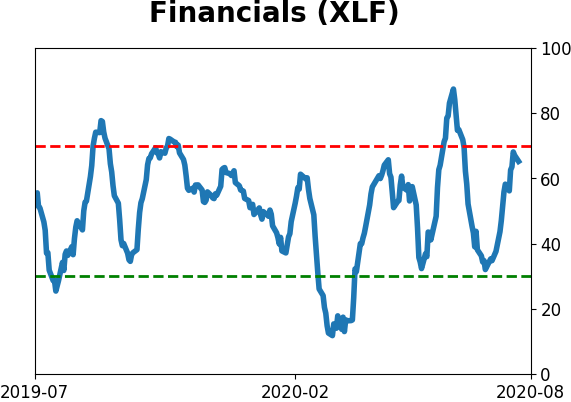
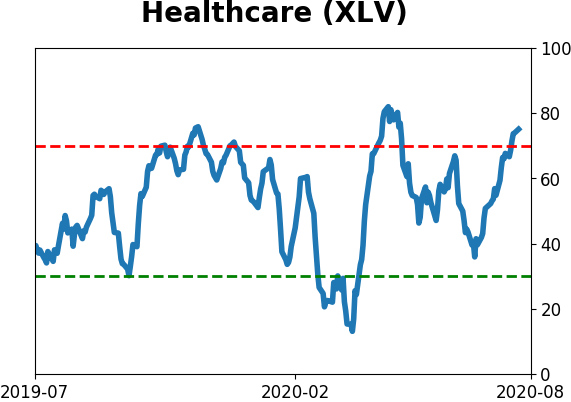
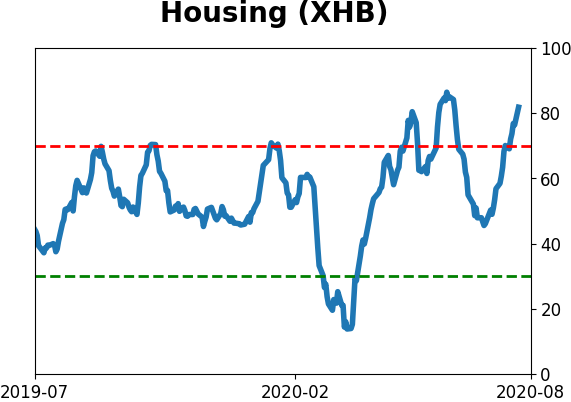
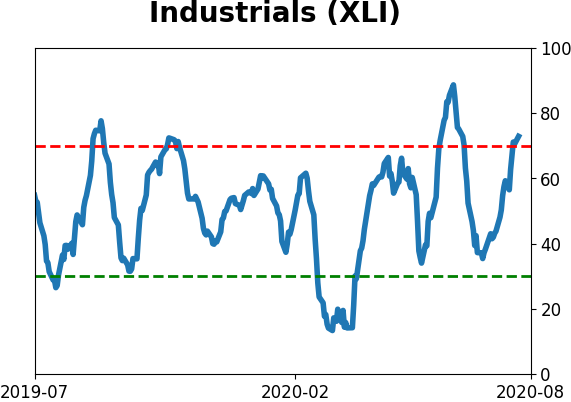
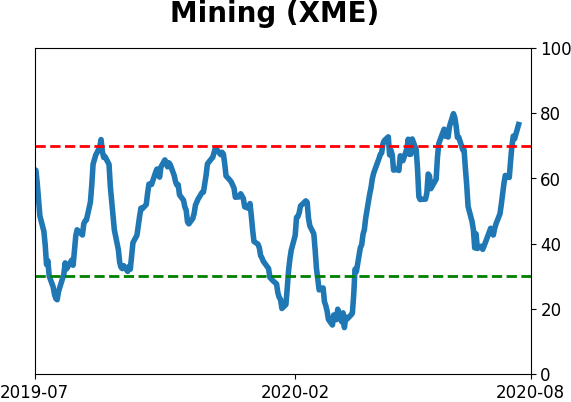
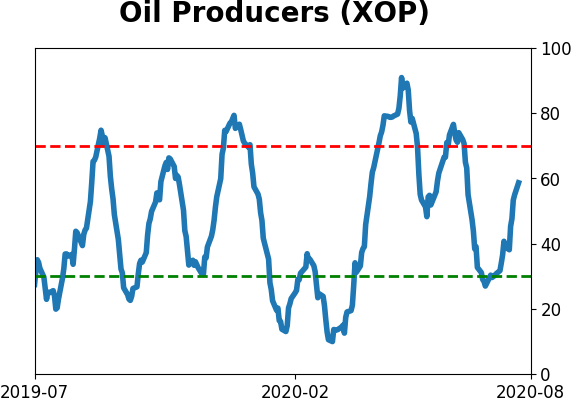
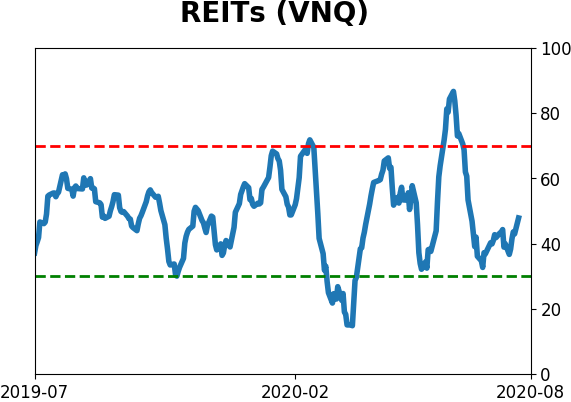
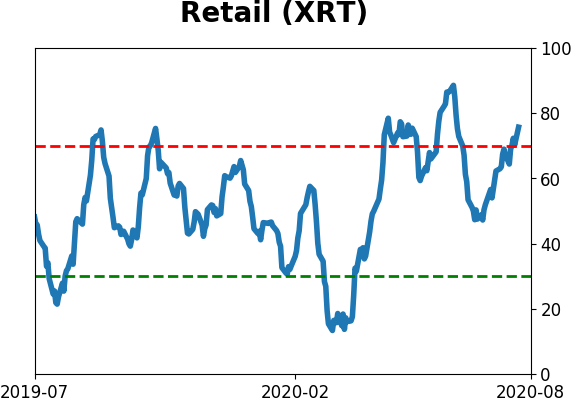
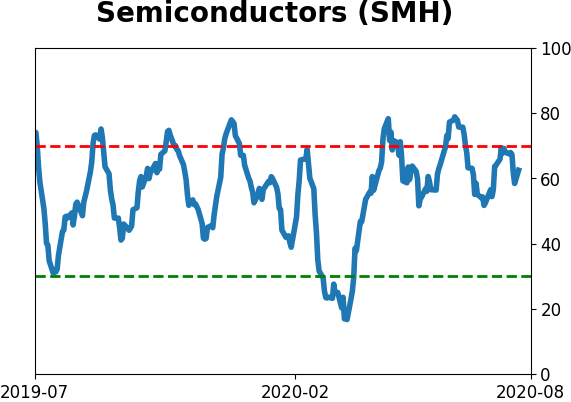
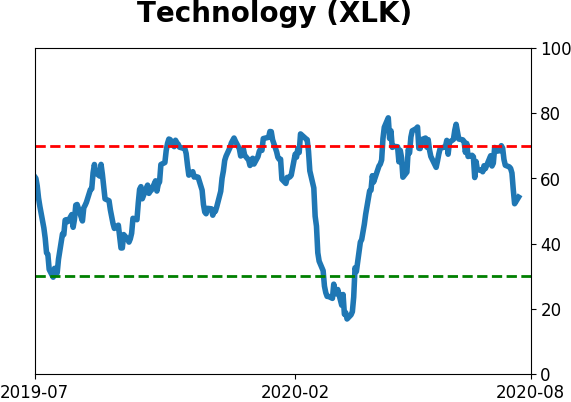
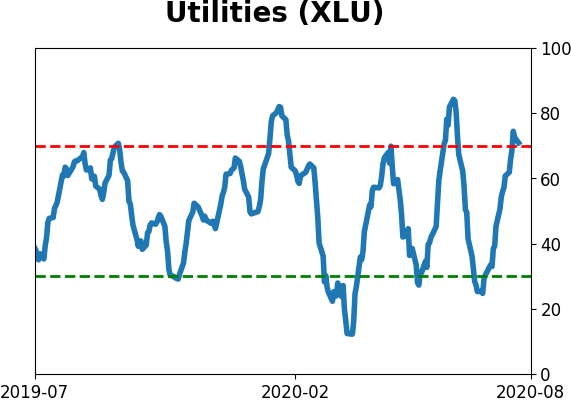
Sector ETF's - 10-Day Moving Average
|
|
|
Country ETF's - 10-Day Moving Average
|
|
|
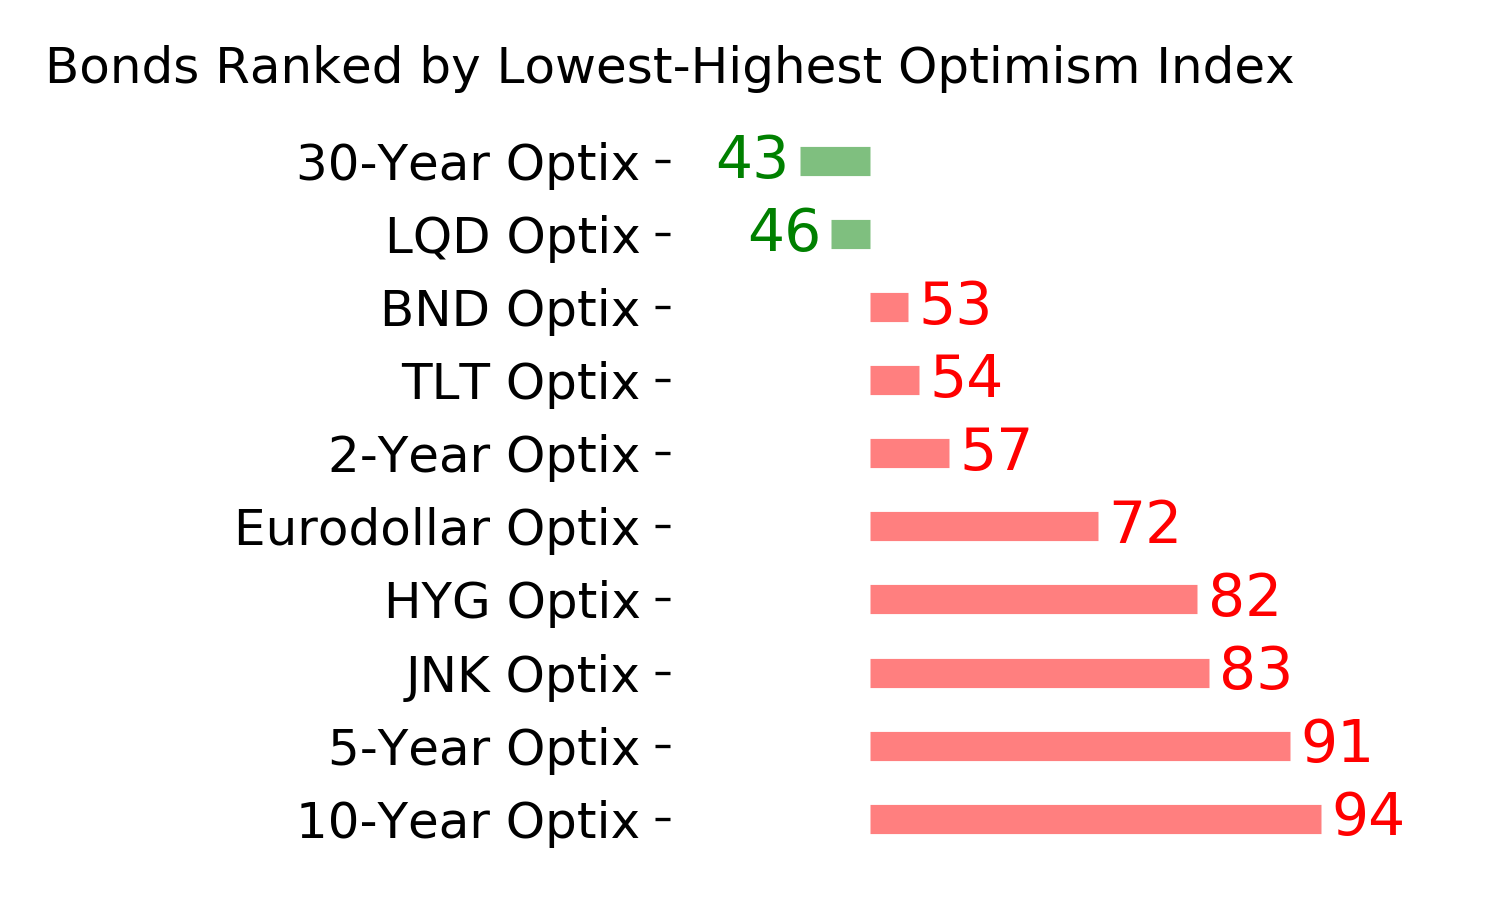
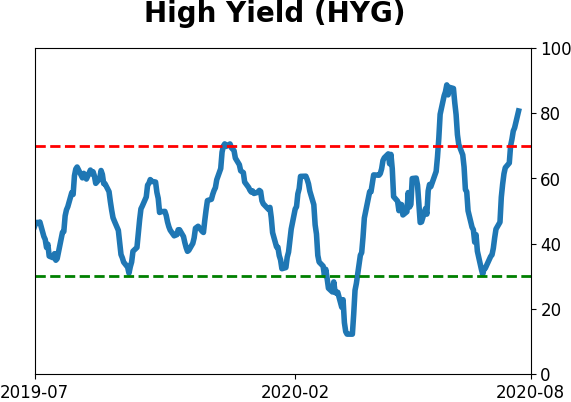
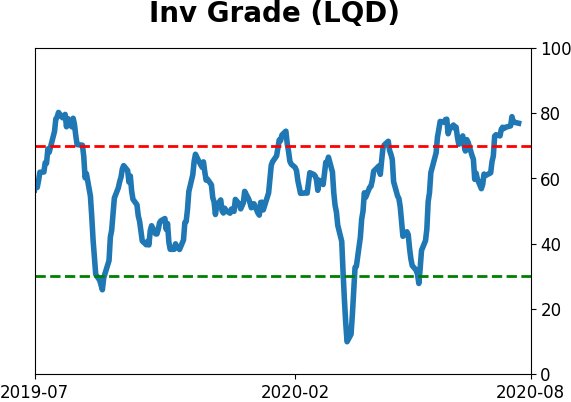
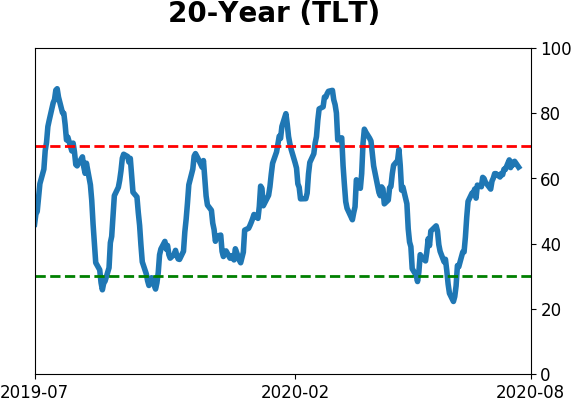
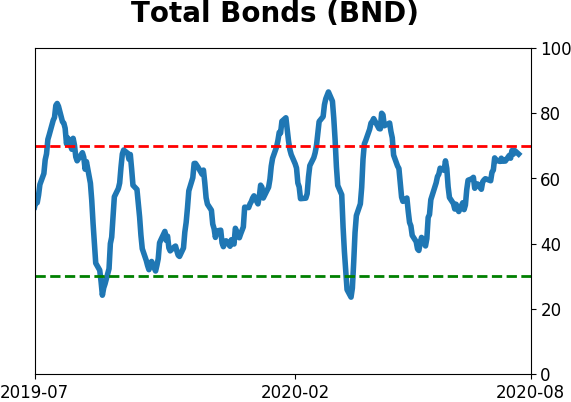
Bond ETF's - 10-Day Moving Average
|
|
|
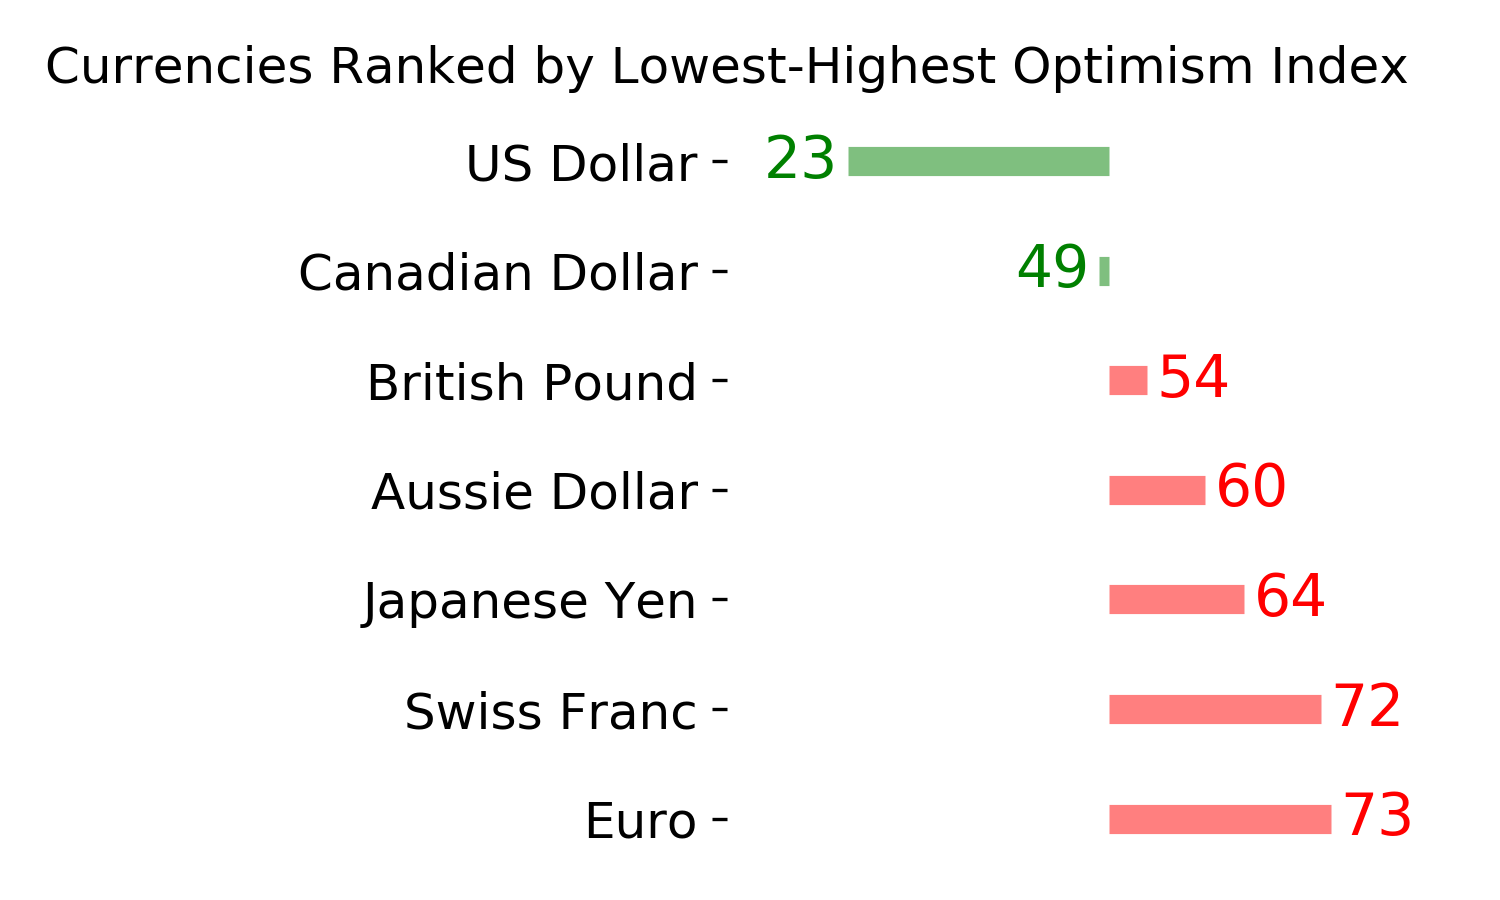
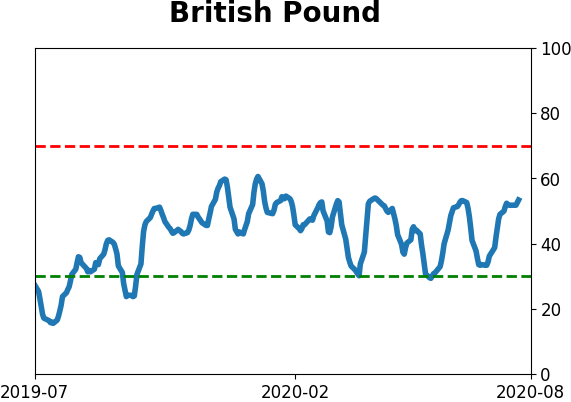
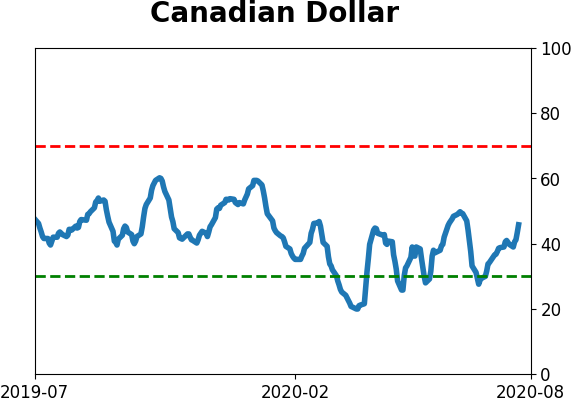
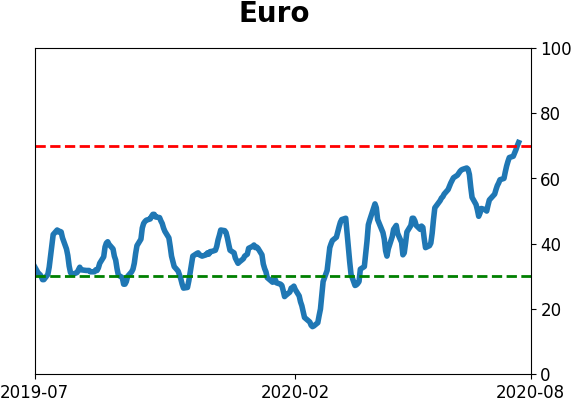
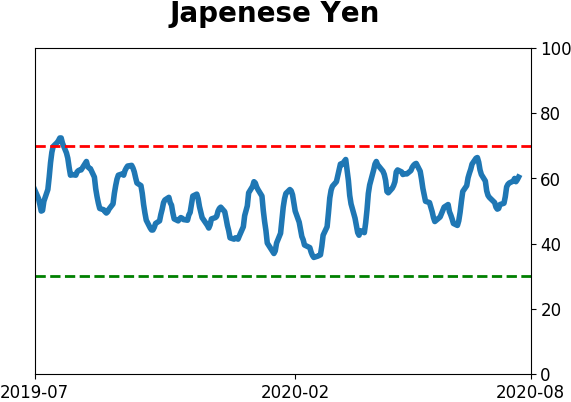
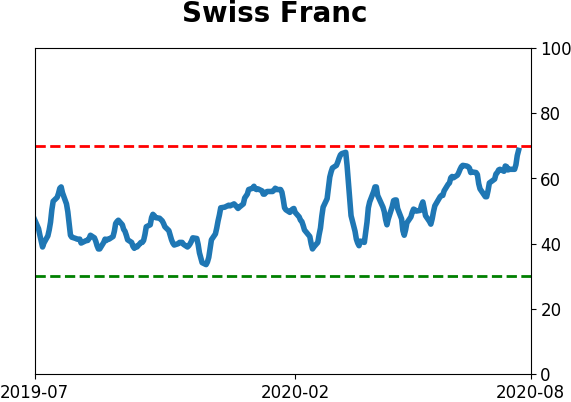
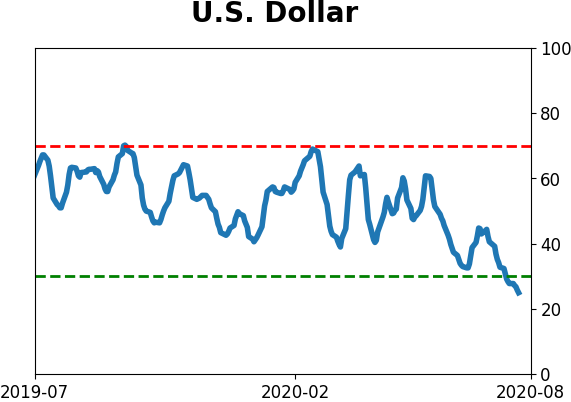
Currency ETF's - 5-Day Moving Average
|
|
|
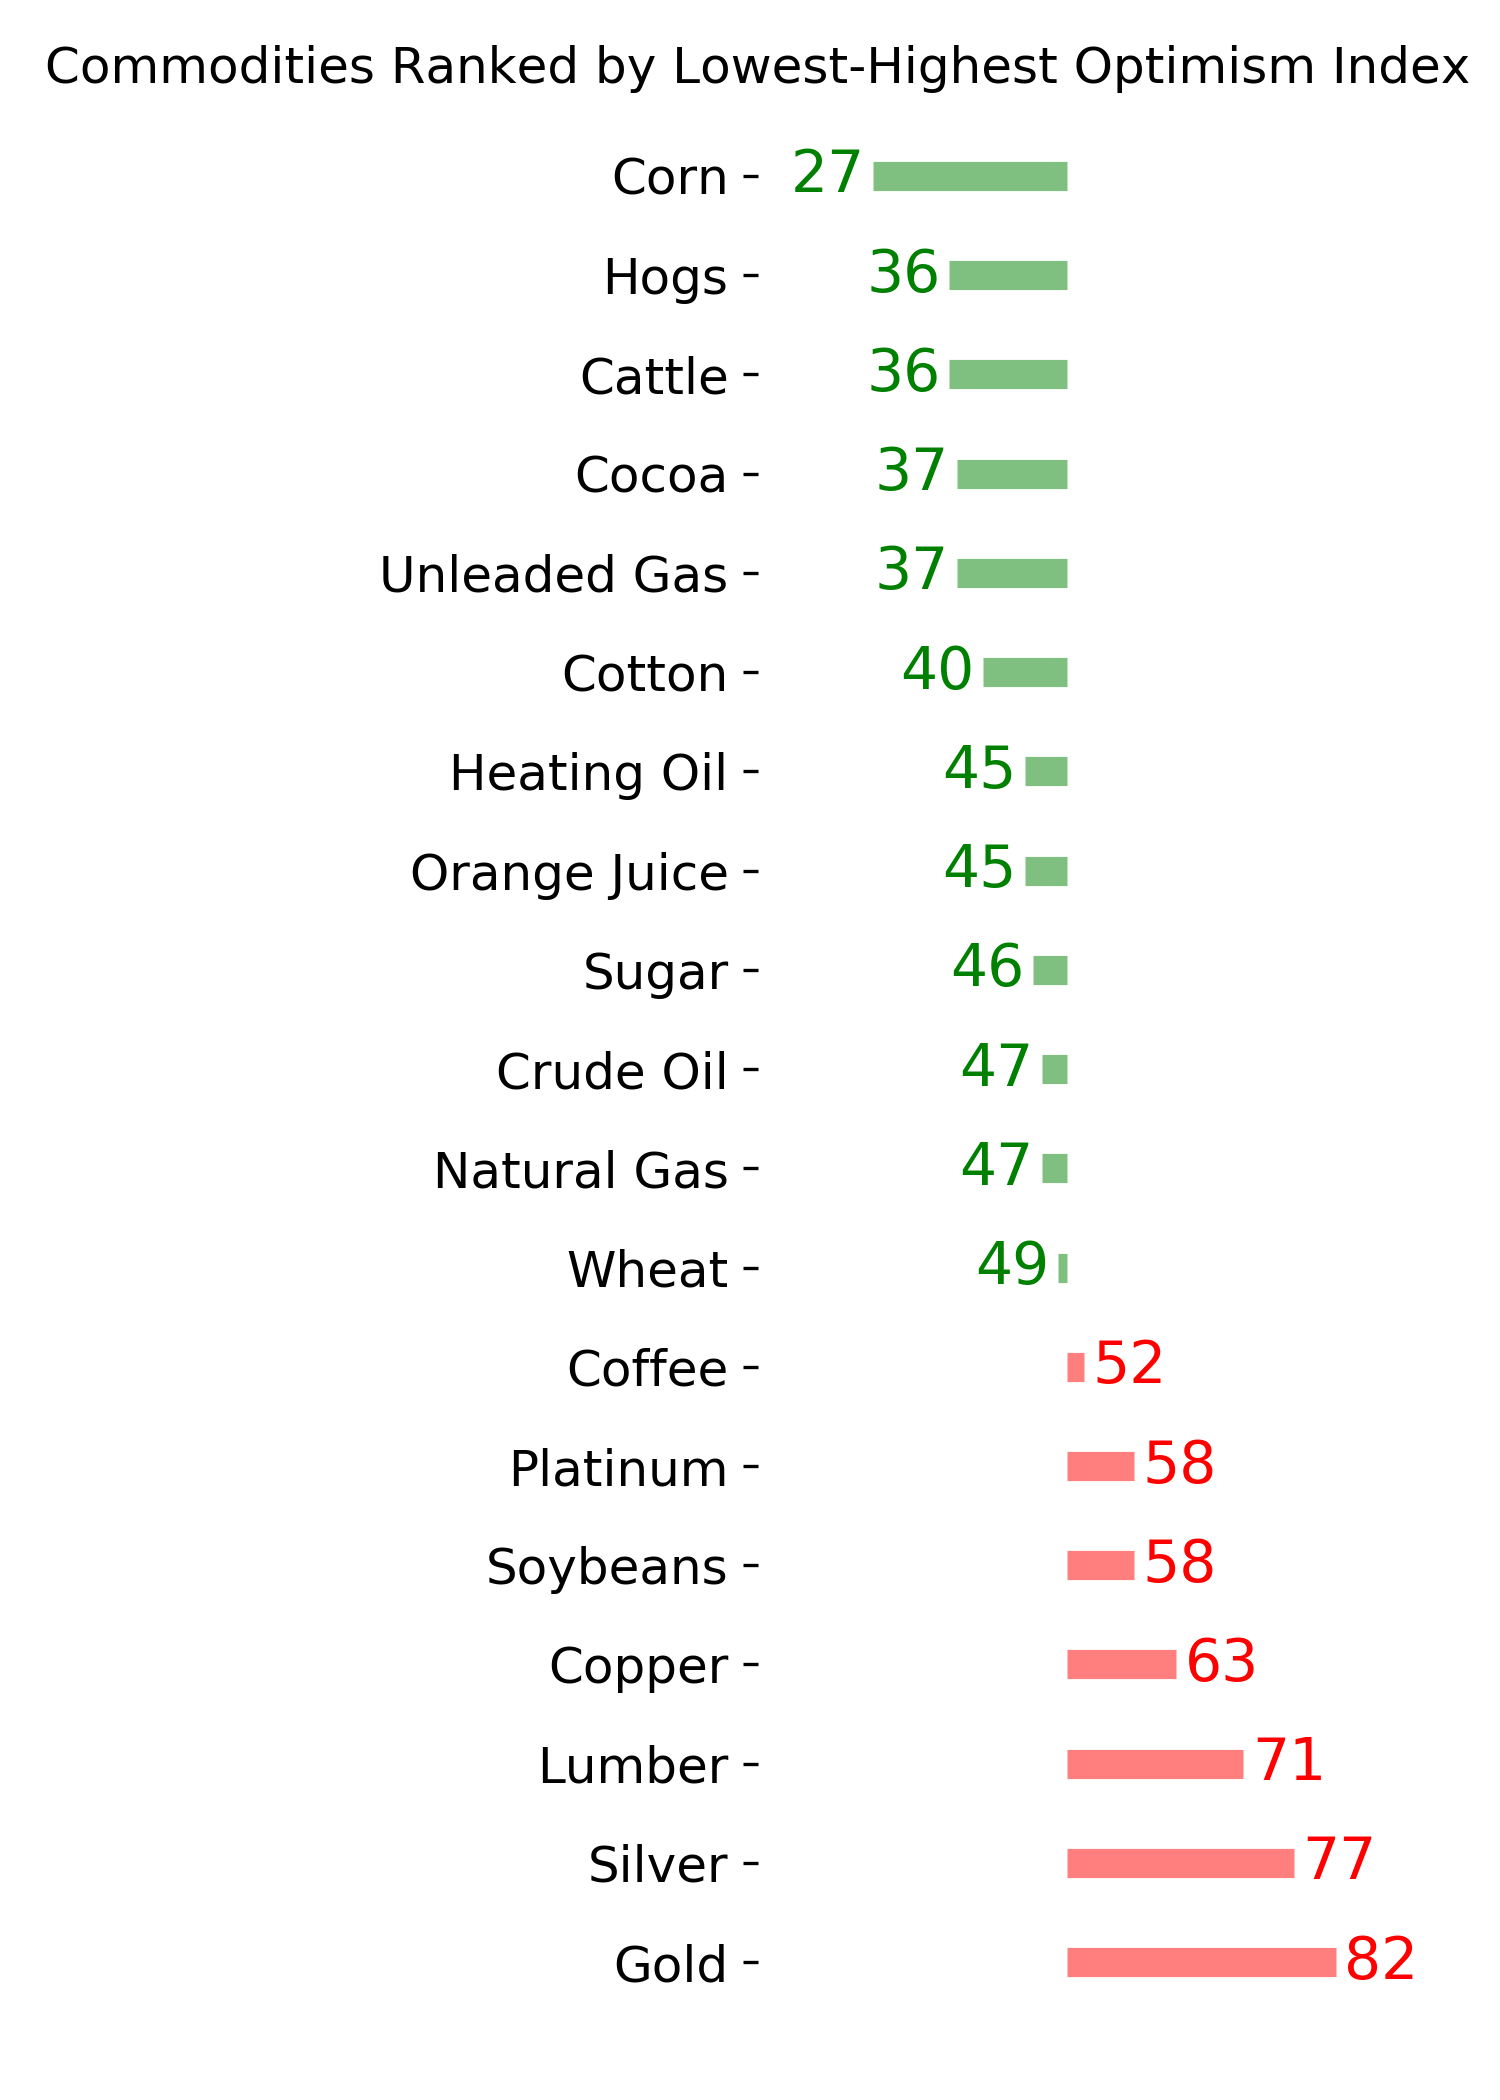
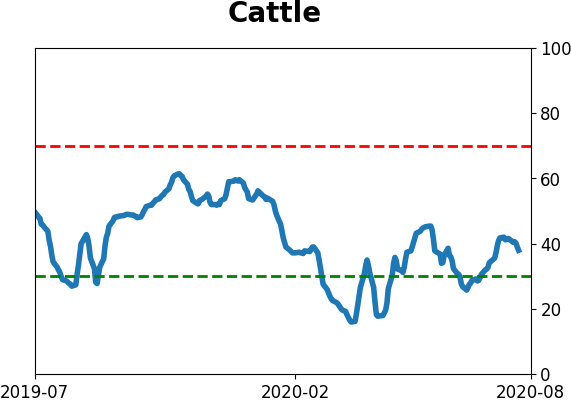
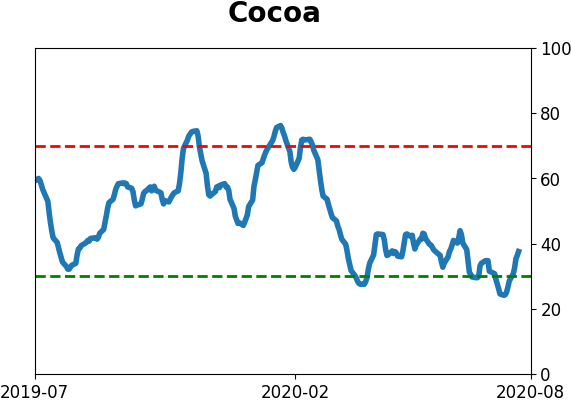
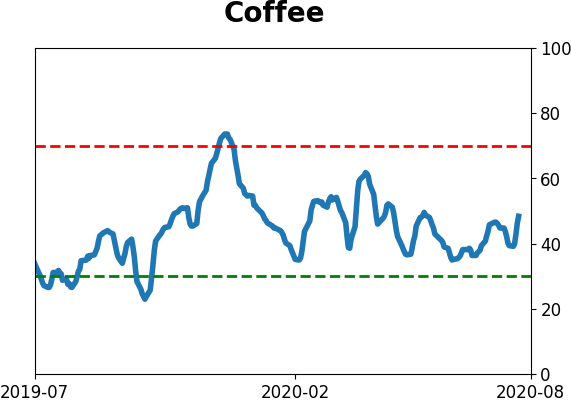
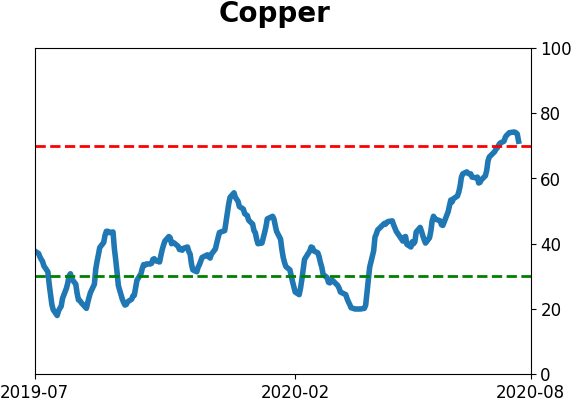
Commodity ETF's - 5-Day Moving Average
|
|