Headlines
|
|
As metals soar, safe-haven correlations are breaking down:
Gold has decoupled from other safe-haven assets like the yen. While that in itself hasn't meant much in the past, gold's recent run-up is reaching historic proportions. Other times it streaked like this, and optimism was as high as it is now, proved to be unsustainable for the metal.
Tech's back-to-back streak: One of the most widely-cited stats in recent days has been about tech's streak of more than two months without suffering back-to-back losses. That was snapped on Friday. Using a proxy for the sector back to 1926, this streak of 49 days ranks as the 2nd-longest of all time, next to one that went 52 days ending in March 2012. Once streaks longer than 30 days finally ended, it didn't mean much. Tech's returns going forward were almost perfectly in line with random. This kind of thing has proven to be maybe interesting, but not especially useful.
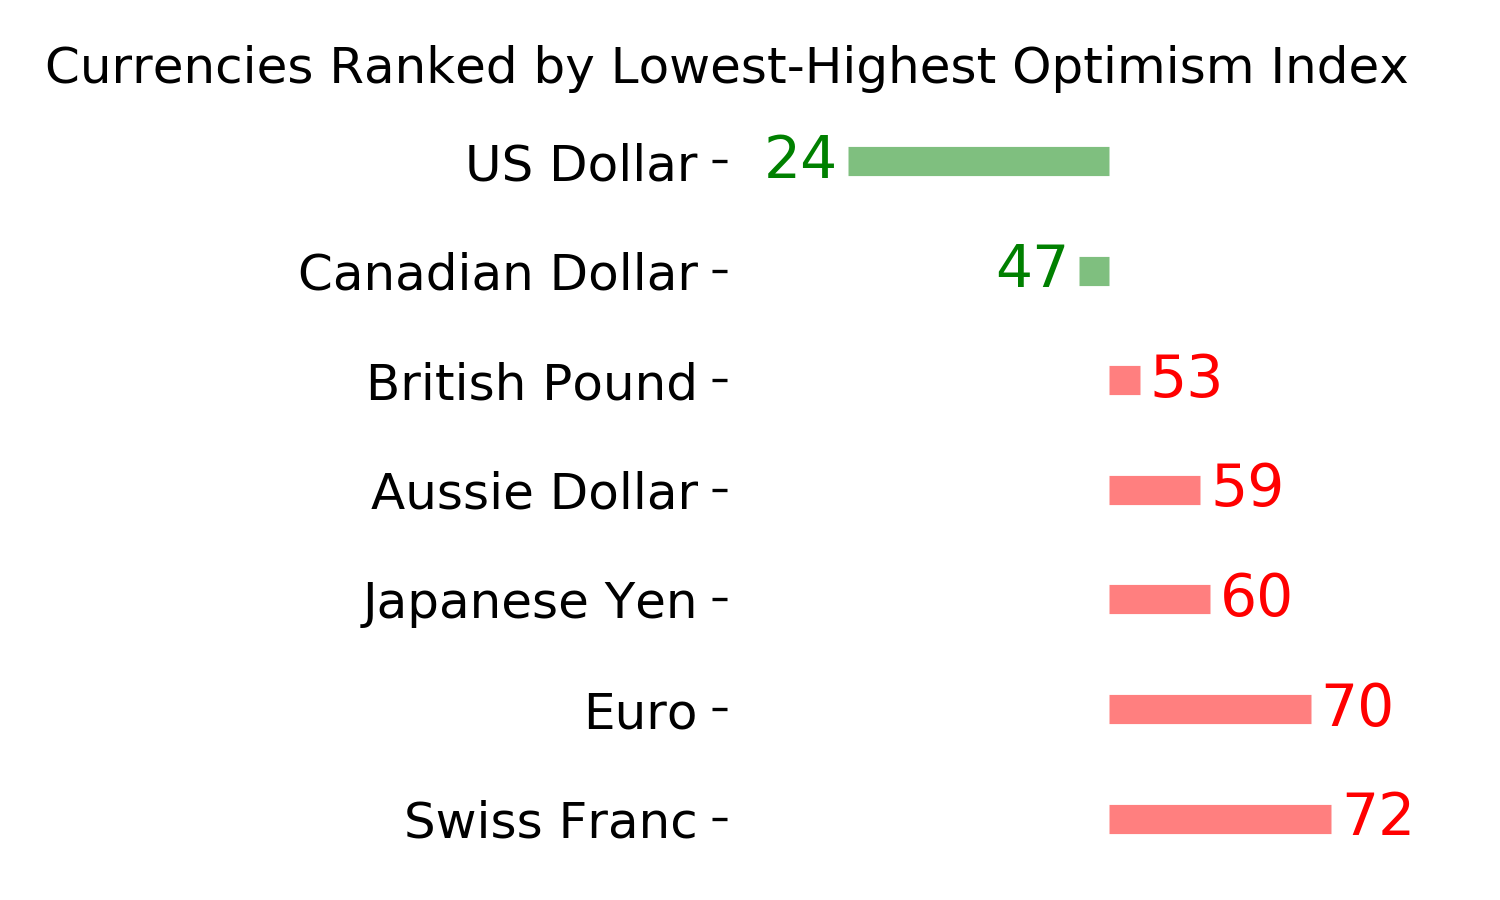
The latest Commitments of Traders report was released, covering positions through Tuesday: The 3-Year Min/Max Screen showed that "smart money" hedgers added to their multi-year extreme net long position in the U.S. dollar (while shorting more Swiss franc). They've also been heavily selling into the rally in copper but not to a multi-year extreme yet. Most other contracts saw hedgers slightly retreat from prior positions. In stocks, they added to their combined net long position in major equity indexes, to nearly $30 billion. This remains an extremely odd development from them given the magnitude and duration of the rally.
Bottom Line:
|
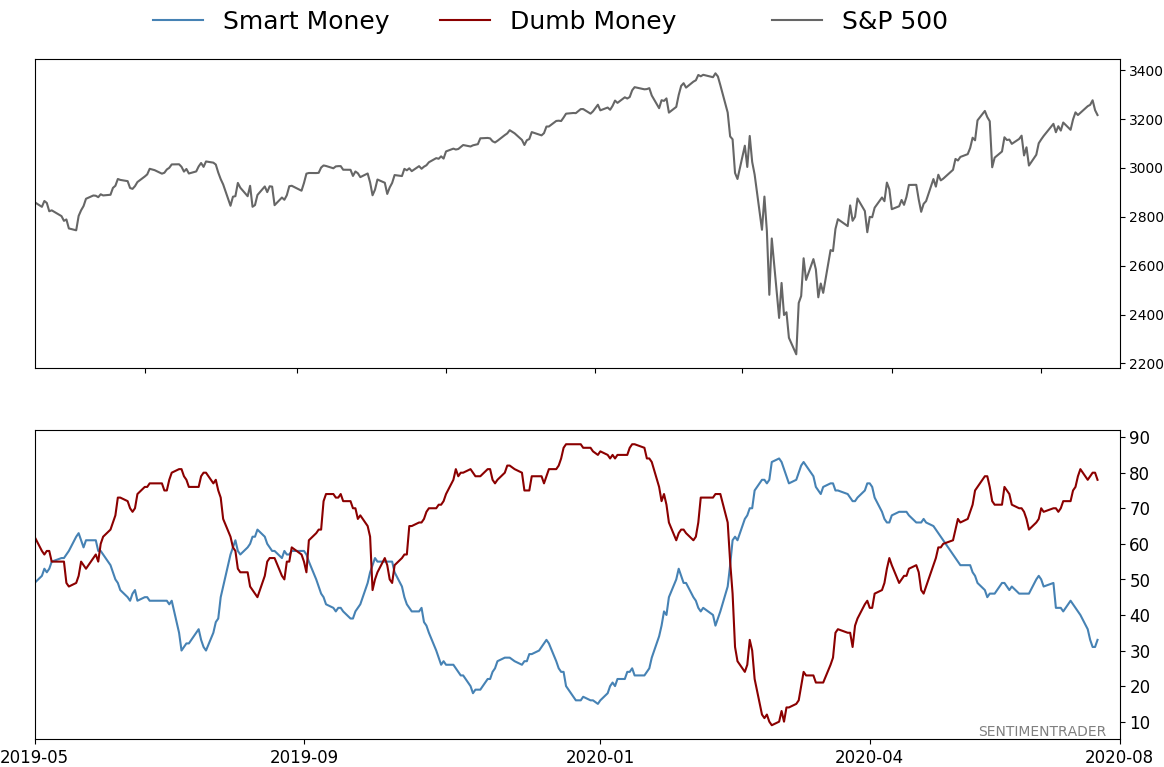
Smart / Dumb Money Confidence
|
Smart Money Confidence: 33%
Dumb Money Confidence: 78%
|
|
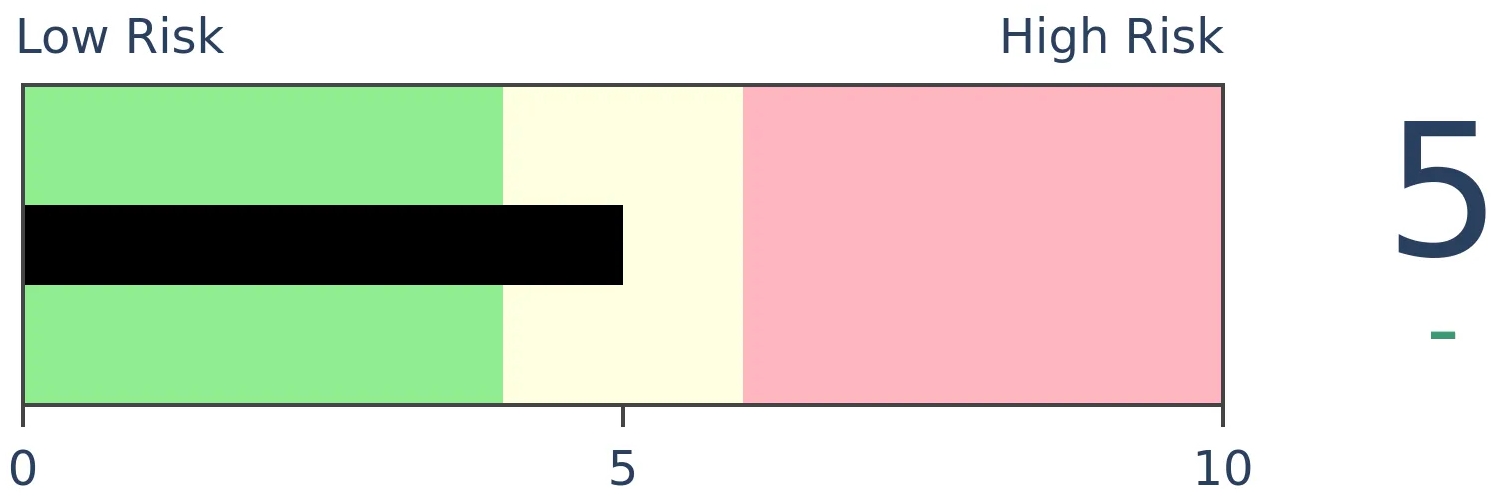
Risk Levels
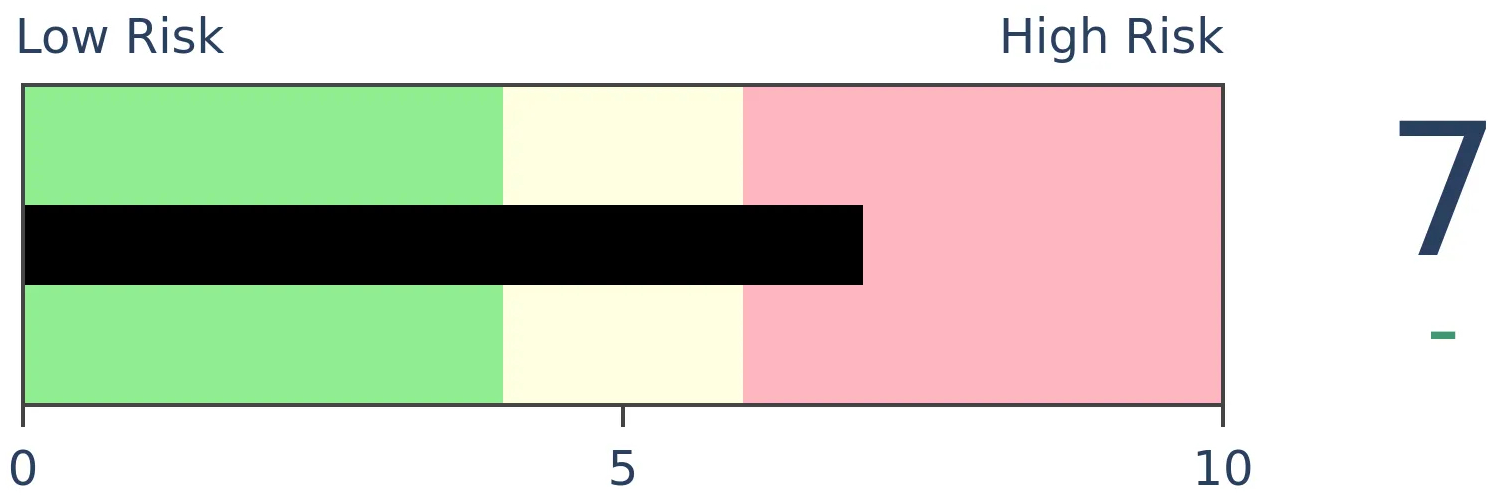
Stocks Short-Term
|
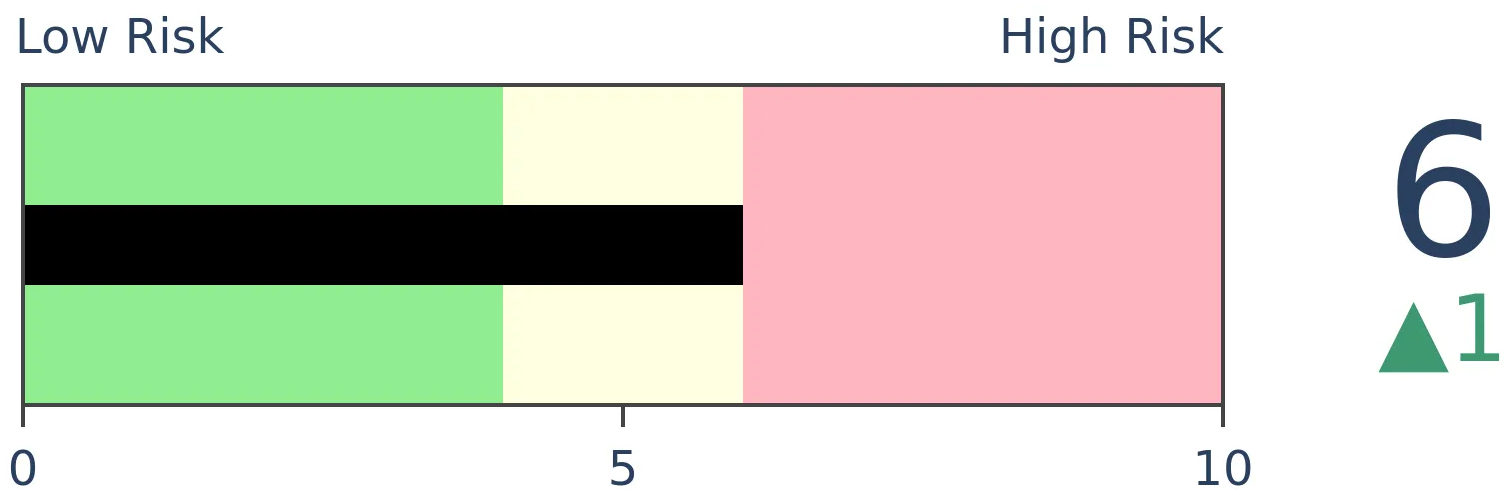
Stocks Medium-Term
|
|
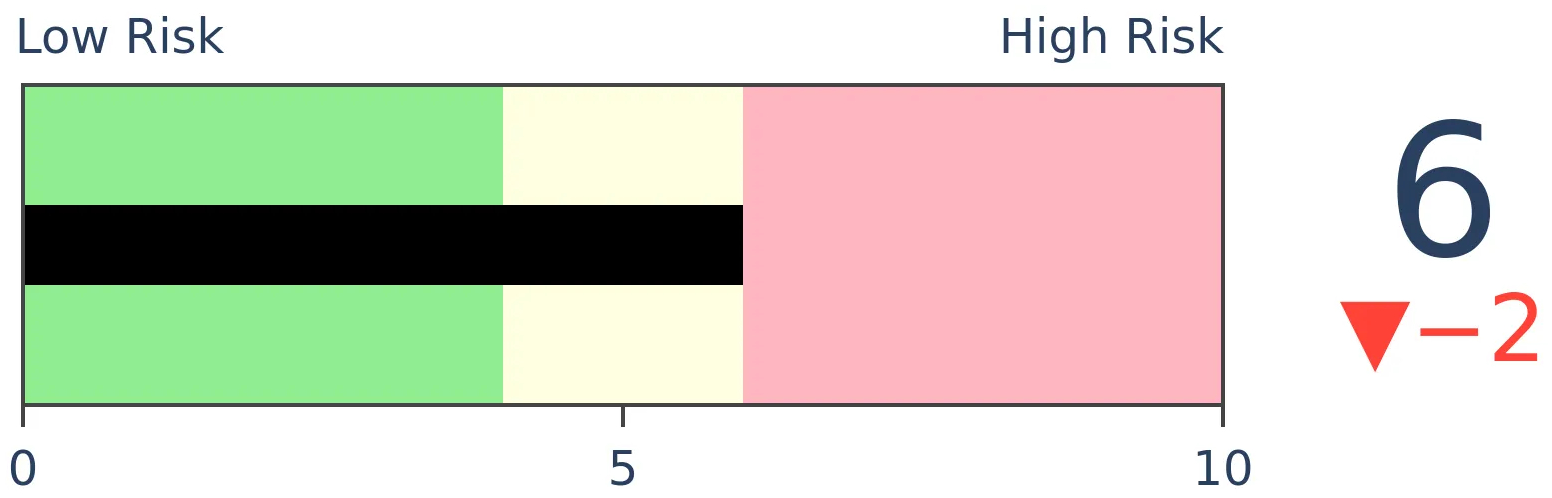
Bonds
|
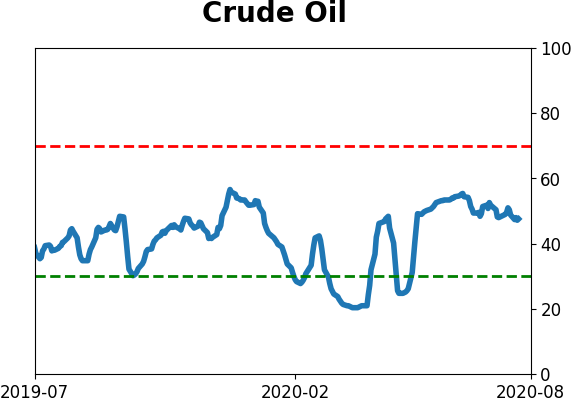
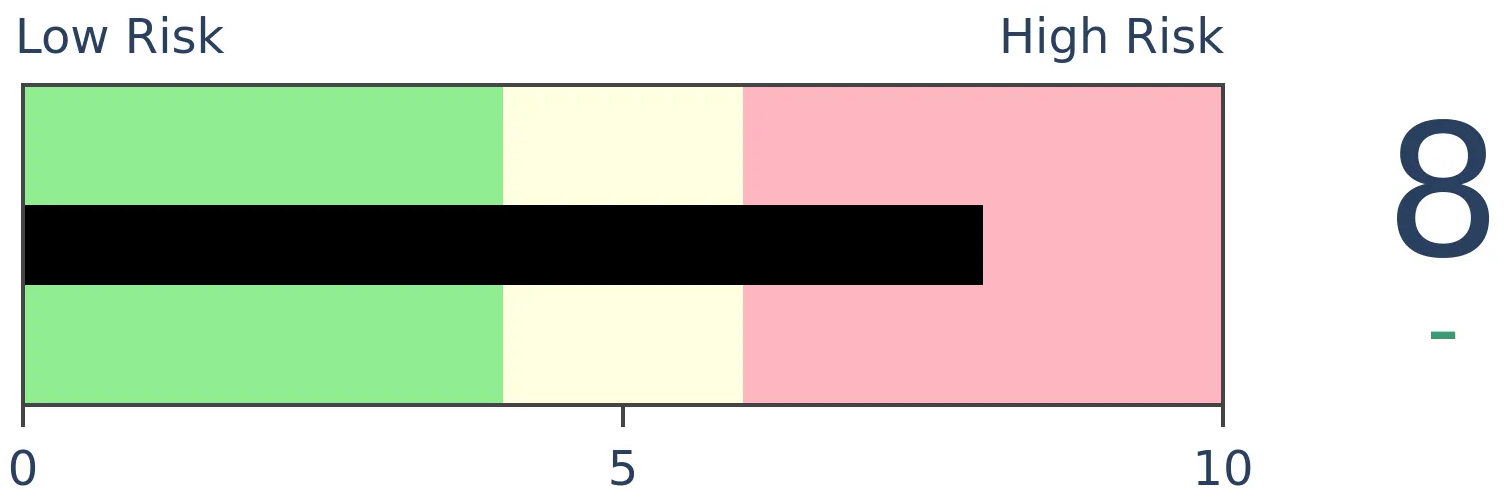
Crude Oil
|
|
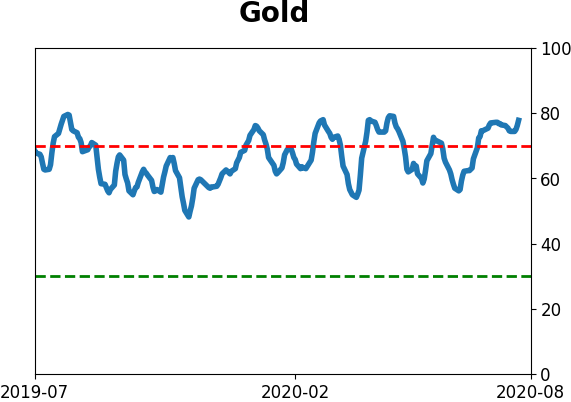
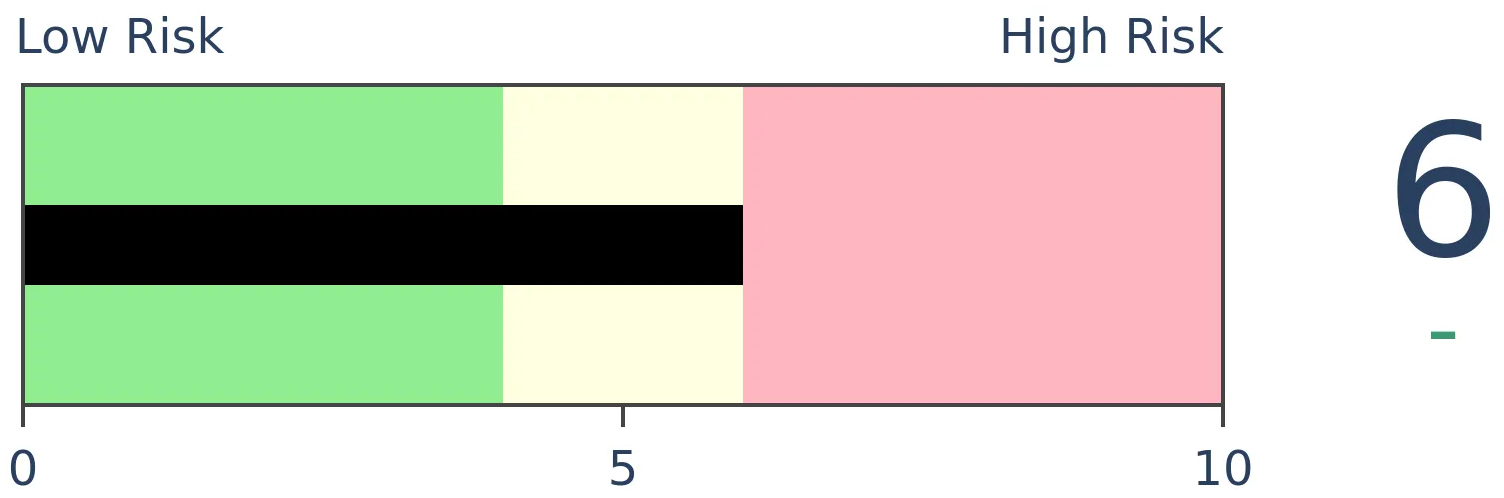
Gold
|
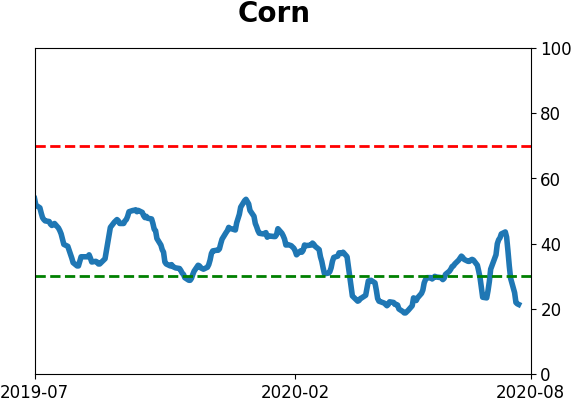
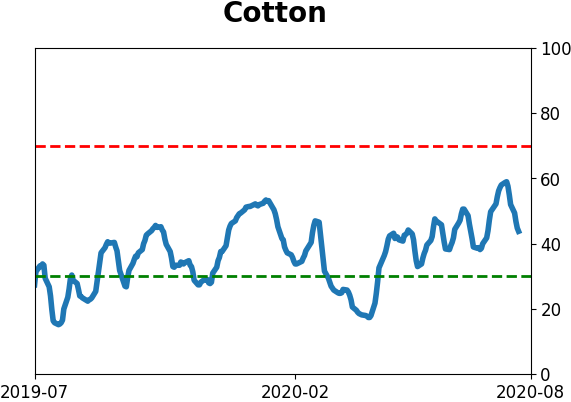
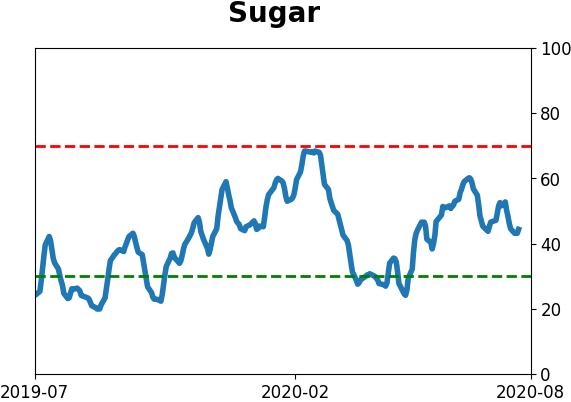
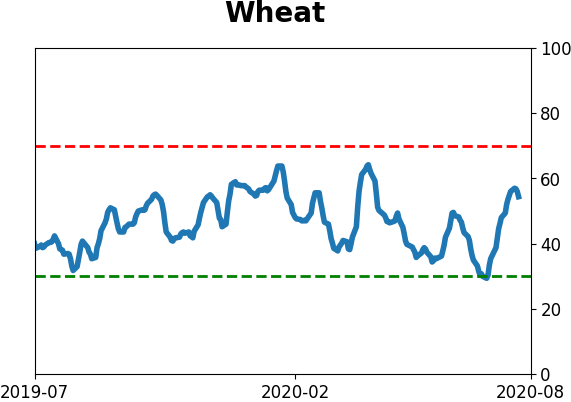
Agriculture
|
|
Research
BOTTOM LINE
Gold has decoupled from other safe-haven assets like the yen. While that in itself hasn't meant much in the past, gold's recent run-up is reaching historic proportions. Other times it streaked like this, and optimism was as high as it is now, proved to be unsustainable for the metal.
FORECAST / TIMEFRAME
GLD -- Down, Short-Term
|
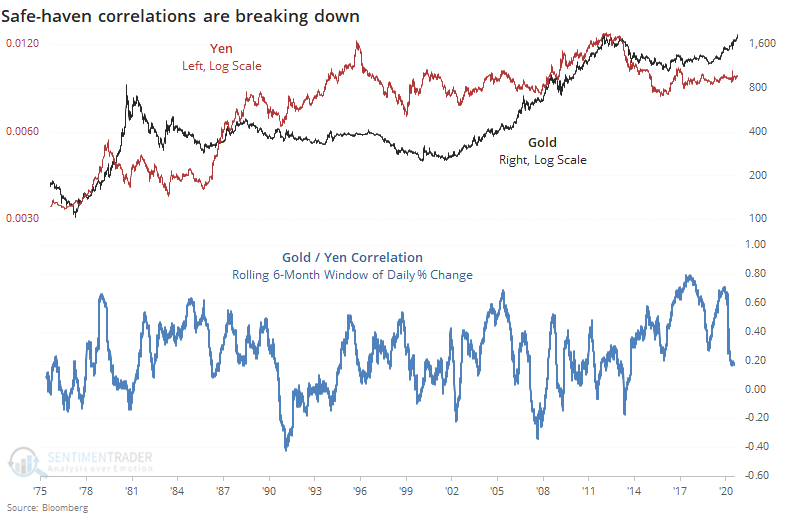
The correlation between two of the more reliable safe havens has been wobbling.
Normally, during times of duress, the price of gold and the exchange rate of the Japanese yen mostly move together. Lately, however, that has been breaking down, leading to the lowest 6-month correlation in five years.
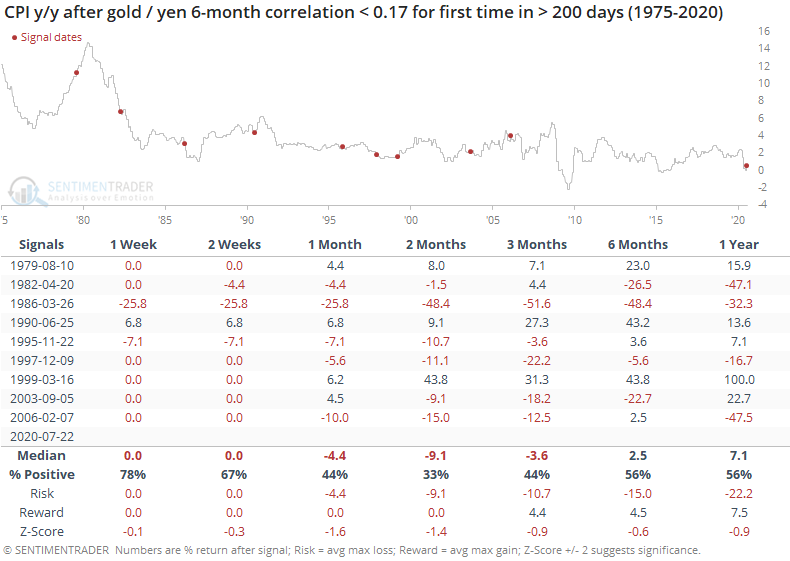
This is often considered a sign that inflation is about to do "something". Depending on who you ask, this either means that inflation is about to spiral out of control...or not. People tend to get an almost religious zealotry about things like this.
Historically, it hasn't necessarily meant much in terms of the growth in the U.S. rate of inflation.
Looking at forward returns across major markets, they were good over the next 6-12 months in stocks and gold, while others were mostly mixed. The big standout was 10-year Treasury note futures. Over the next 2-3 months, they consistently declined as interest rates rose, even if the rate of inflation didn't consistently increase.
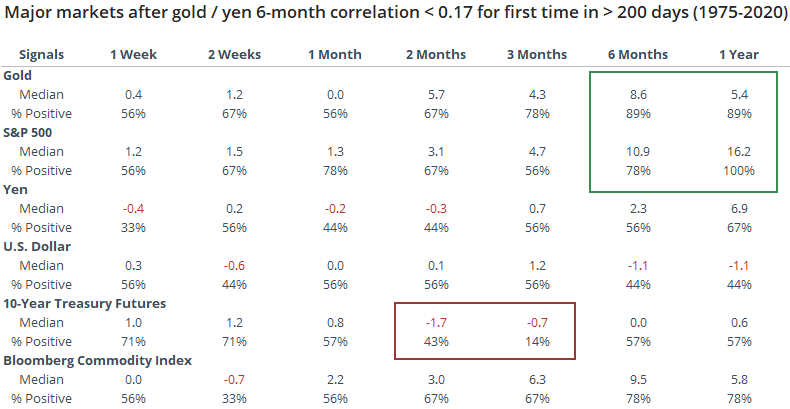
When this "something" was driving gold and not the yen, gold had a consistent tendency to rise from three months and beyond. The factors we outlined a month ago are still pretty much in place but a couple have reached points that are more troubling for the near-term.
Regarding its momentum, it only continues to build. The metal is on the cusp of rising more than 4% during a week it will close at an all-time high (using weekly closing prices of the XAU index from Bloomberg).
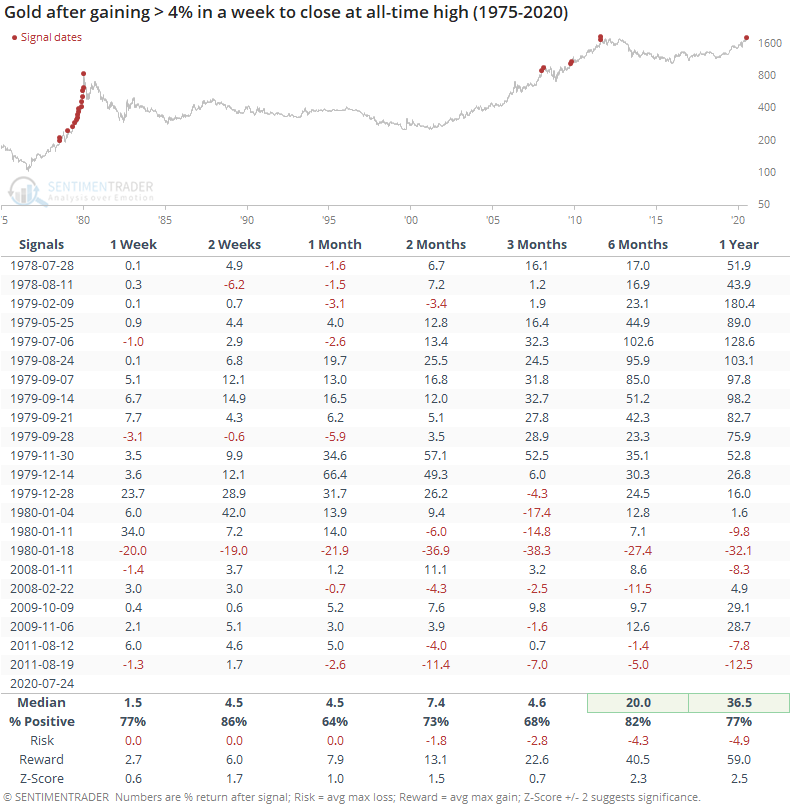
Most of this kind of rise occurred during the tremendous run-up in 1979-80. It triggered a handful of times during the run in the 2000s, and those had much more of a tendency to give back short-term gains. Of the signals that triggered since 2008, all of them showed further gains over the next couple of weeks, but also all but one of them fell back in the months ahead.
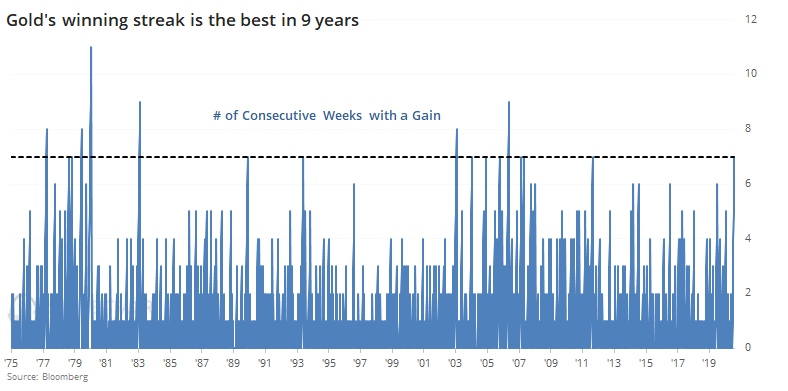
Also troubling is that this is gold's 7th straight week of gains, the most in 9 years.
By the time it enjoyed this much momentum, it rarely led to further gains in the weeks and months ahead.
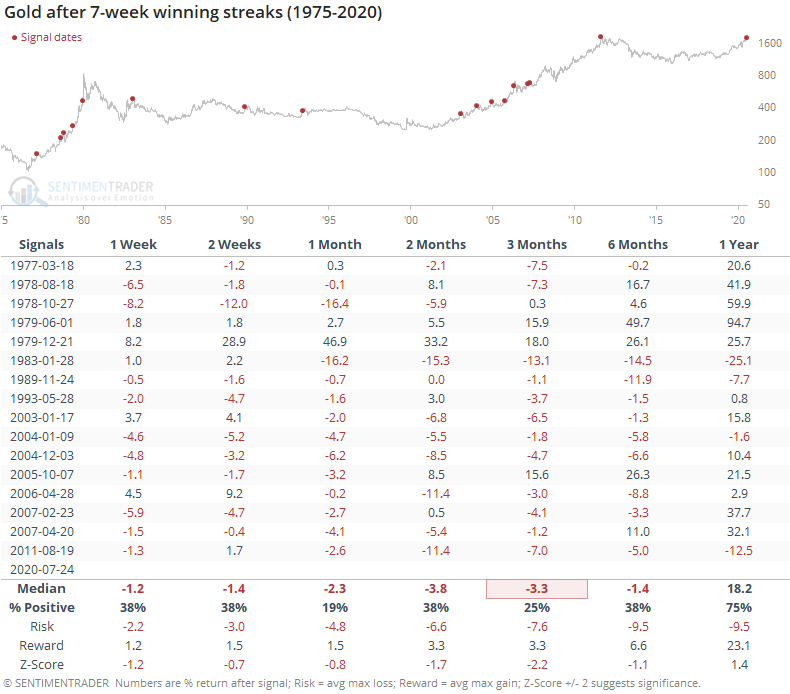
Outside of the late 1970's run-up, every single signal showed a loss over the next month. Only one of them showed a gain even three months later.
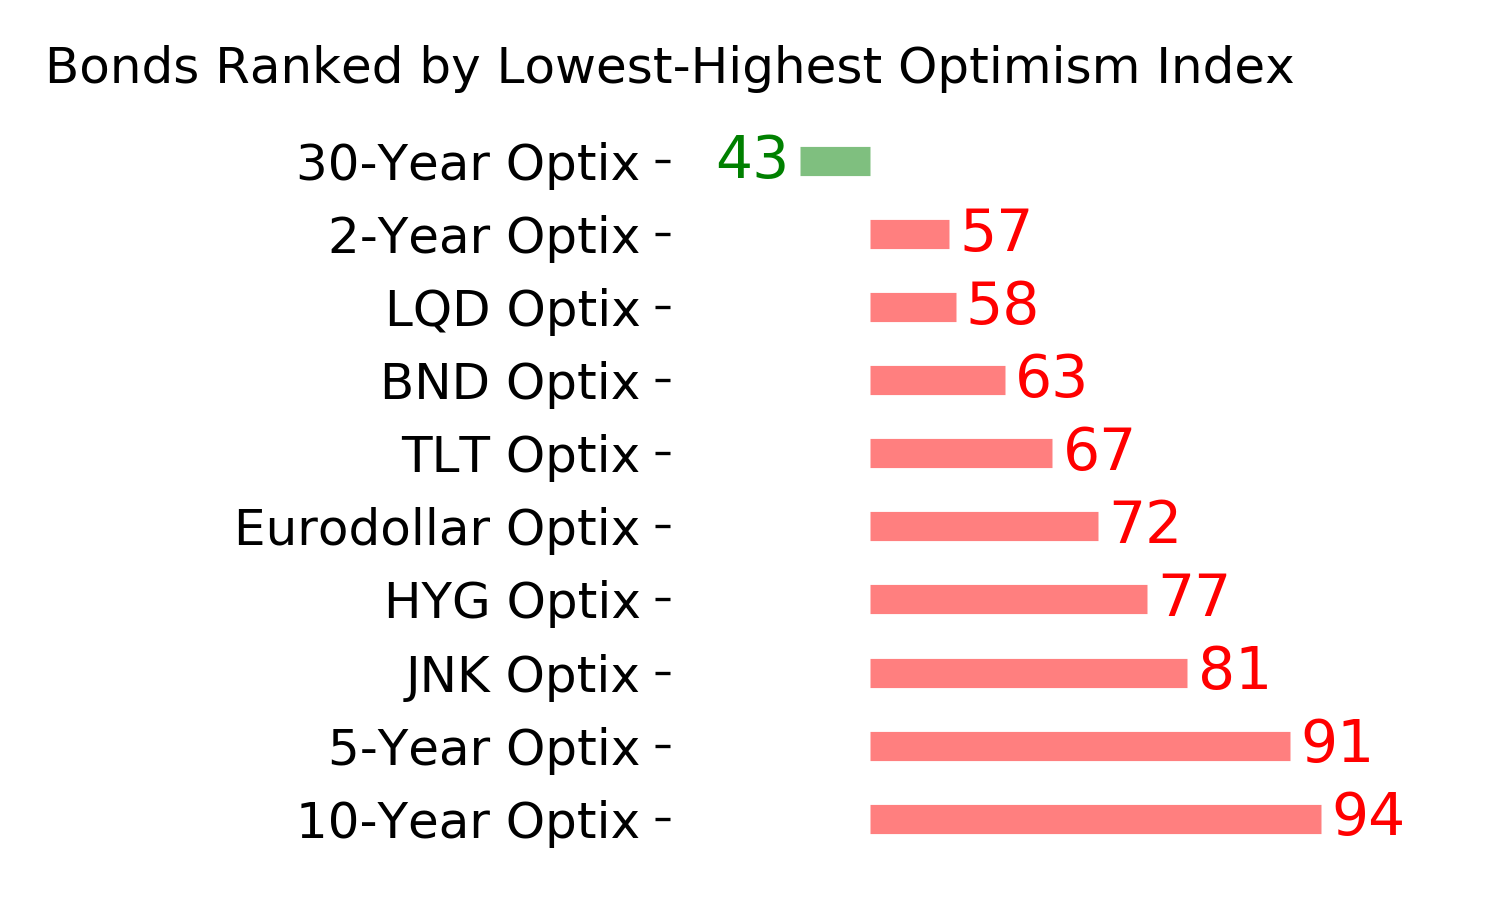
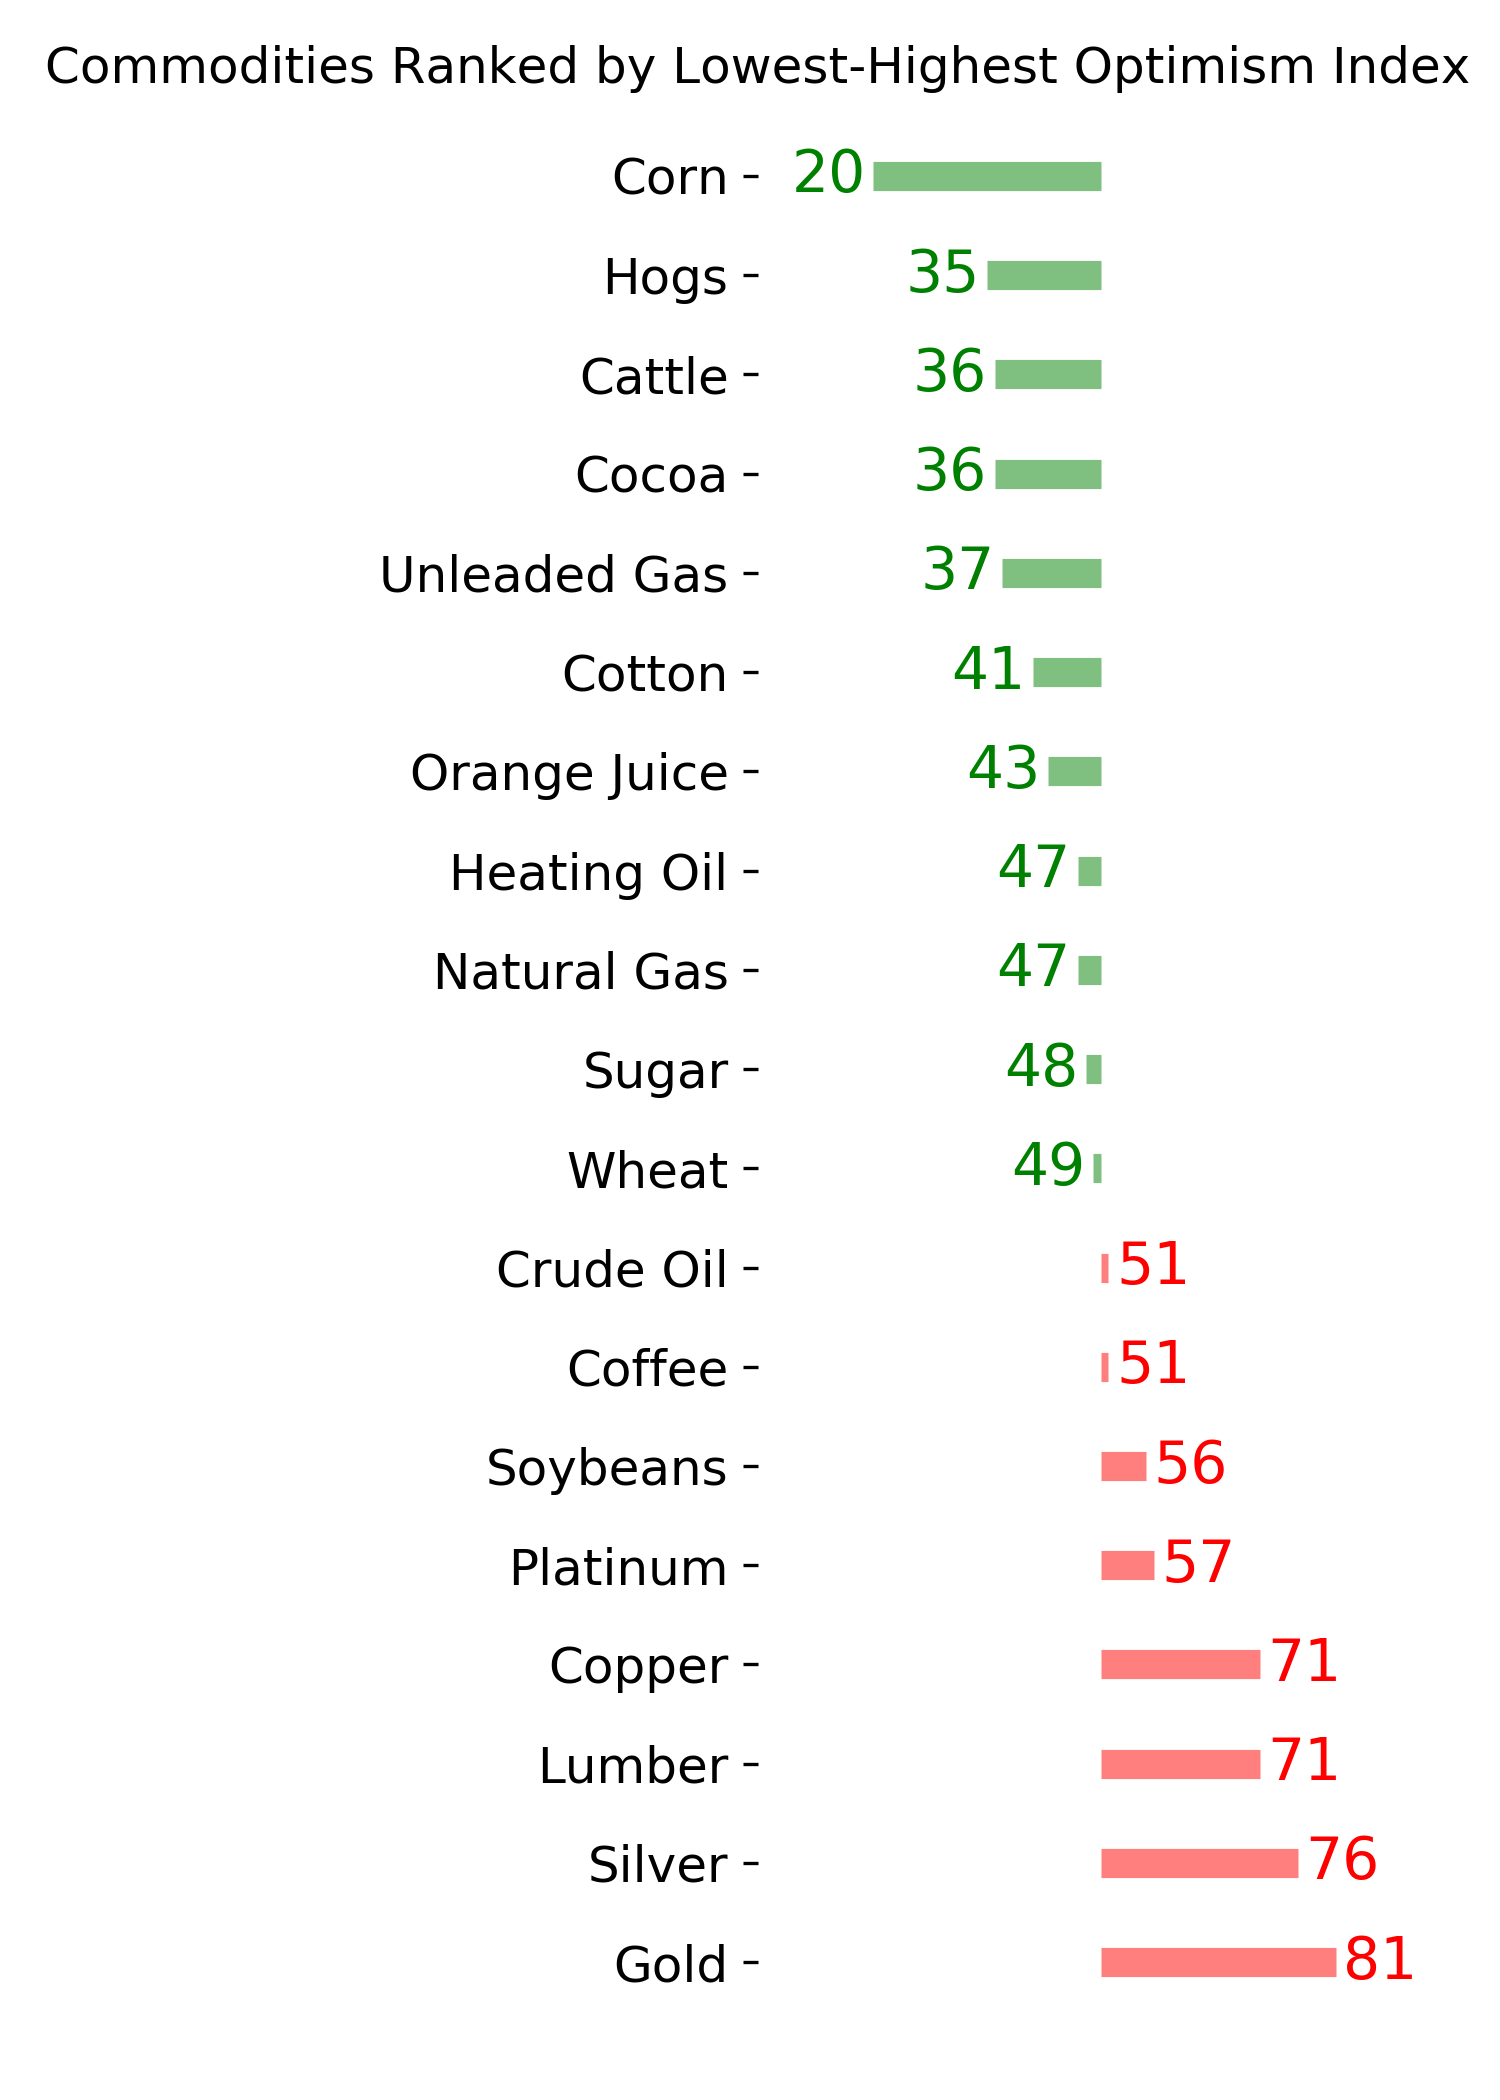
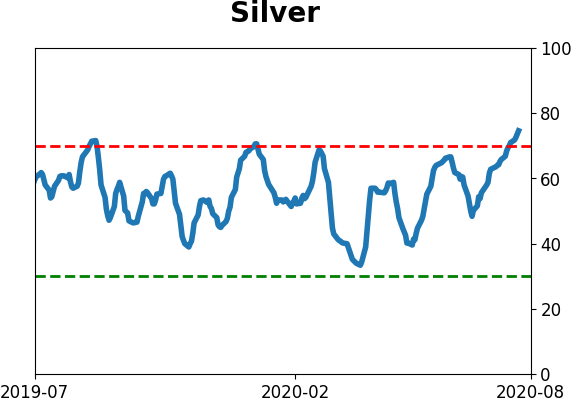
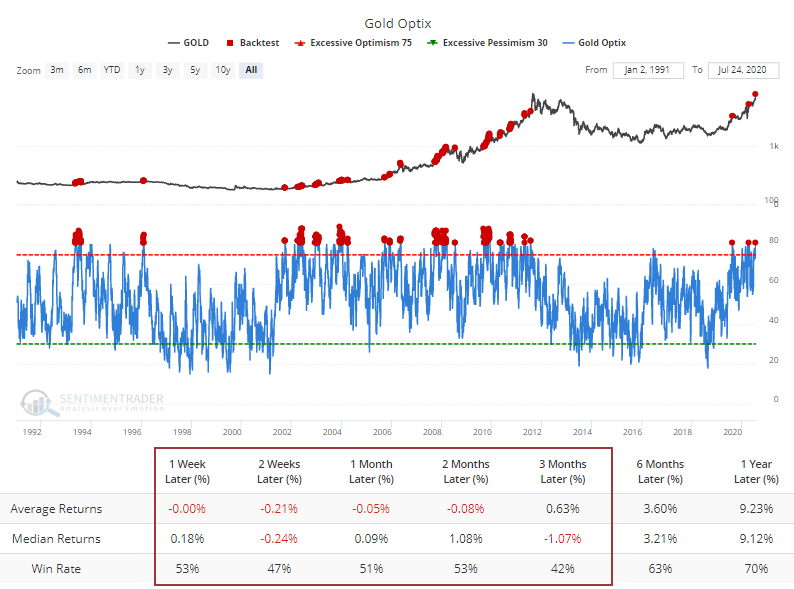
Also worth noting is that sentiment has become stretched again. The Optimism Index on gold just popped above 80, which the Backtest Engine shows has led to weak short- to medium-term returns. This is a change from the last note when it wasn't quite high enough to precede average negative returns or a win rate below 50%.
The run in both silver and gold has been impressive, and perhaps there are structural forces that will continue to push them higher, no matter historical precedent or stretched sentiment. That's always a bet on "this time is different", which we're loathe to do because it rarely is. Especially on a short- to medium-term time frame, the risk on gold (and silver) has risen to a high level.
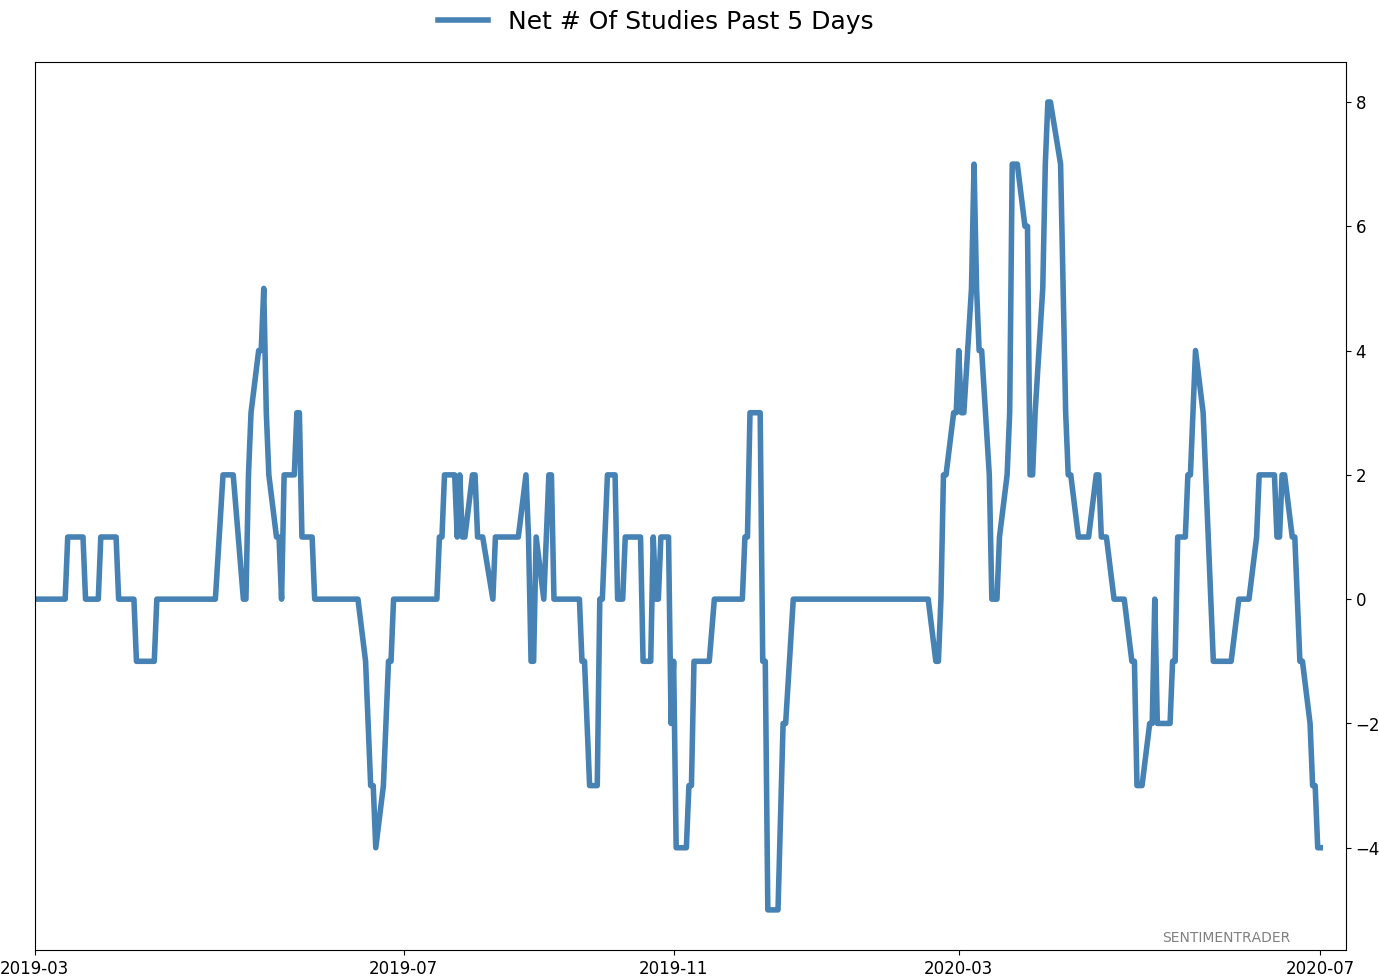
Active Studies
| Time Frame | Bullish | Bearish | | Short-Term | 0 | 1 | | Medium-Term | 8 | 10 | | Long-Term | 44 | 1 |
|
Indicators at Extremes
Portfolio
| Position | Weight % | Added / Reduced | Date | | Stocks | 29.8 | Reduced 9.1% | 2020-06-11 | | Bonds | 0.0 | Reduced 6.7% | 2020-02-28 | | Commodities | 5.2 | Added 2.4%
| 2020-02-28 | | Precious Metals | 0.0 | Reduced 3.6% | 2020-02-28 | | Special Situations | 0.0 | Reduced 31.9% | 2020-03-17 | | Cash | 65.0 | | |
|
Updates (Changes made today are underlined)
In the first months of the year, we saw manic trading activity. From big jumps in specific stocks to historic highs in retail trading activity to record highs in household confidence to almost unbelievable confidence among options traders. All of that came amid a market where the average stock couldn't keep up with their indexes. There were signs of waning momentum in stocks underlying the major averages, which started triggering technical warning signs in late January. After stocks bottomed on the 23rd, they enjoyed a historic buying thrust and retraced a larger amount of the decline than "just a bear market rally" tends to. Those thrusts are the most encouraging sign we've seen in years. Through early June, we were still seeing thrusts that have led to recoveries in longer-term breadth metrics. The longer-term prospects for stocks (6-12 months) still look decent given the above. On a short- to medium-term basis, it was getting harder to make that case. Dumb Money Confidence spiked and there were multiple signs of a historic level of speculation. This is likely the lowest I will go given what I still consider to be compelling positives over a longer time frame. There is not a slam-dunk case to be made for either direction, so it will seem like a mistake whether stocks keep dropping (why didn't I sell more?) or if they turn and head higher (why did I let short-term concerns prevail?). After nearly three decades of trading, I've learned to let go of the idea of perfection.
RETURN YTD: -4.4% 2019: 12.6%, 2018: 0.6%, 2017: 3.8%, 2016: 17.1%, 2015: 9.2%, 2014: 14.5%, 2013: 2.2%, 2012: 10.8%, 2011: 16.5%, 2010: 15.3%, 2009: 23.9%, 2008: 16.2%, 2007: 7.8%
|
|
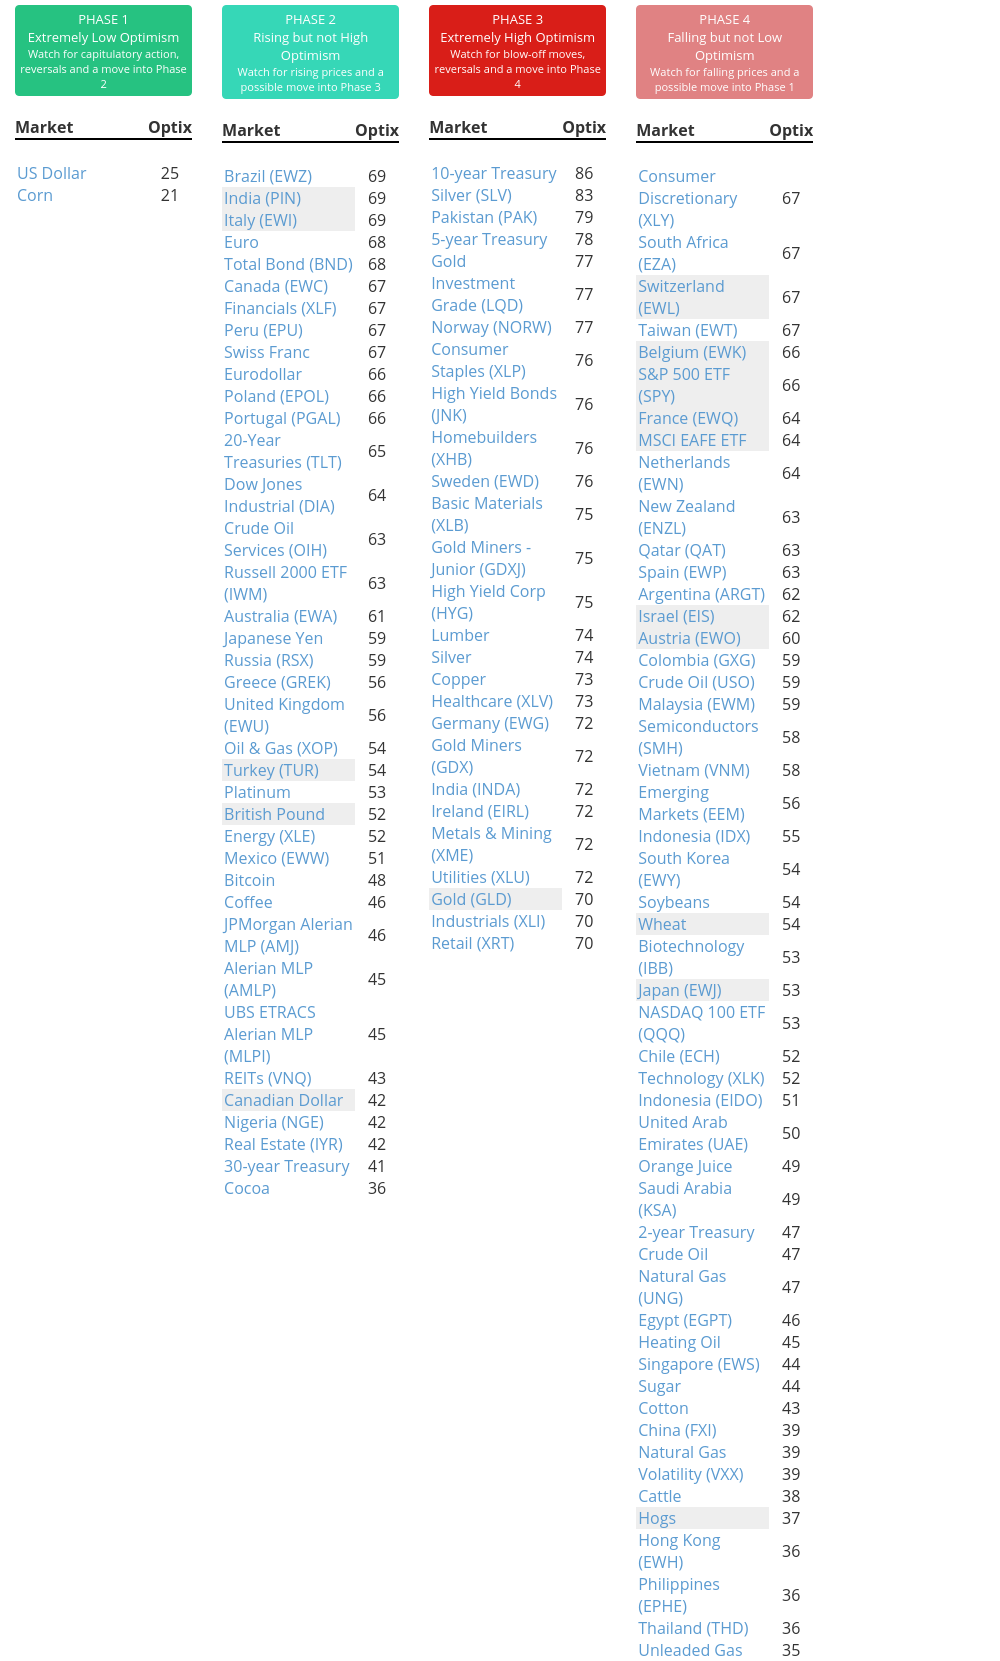
Phase Table
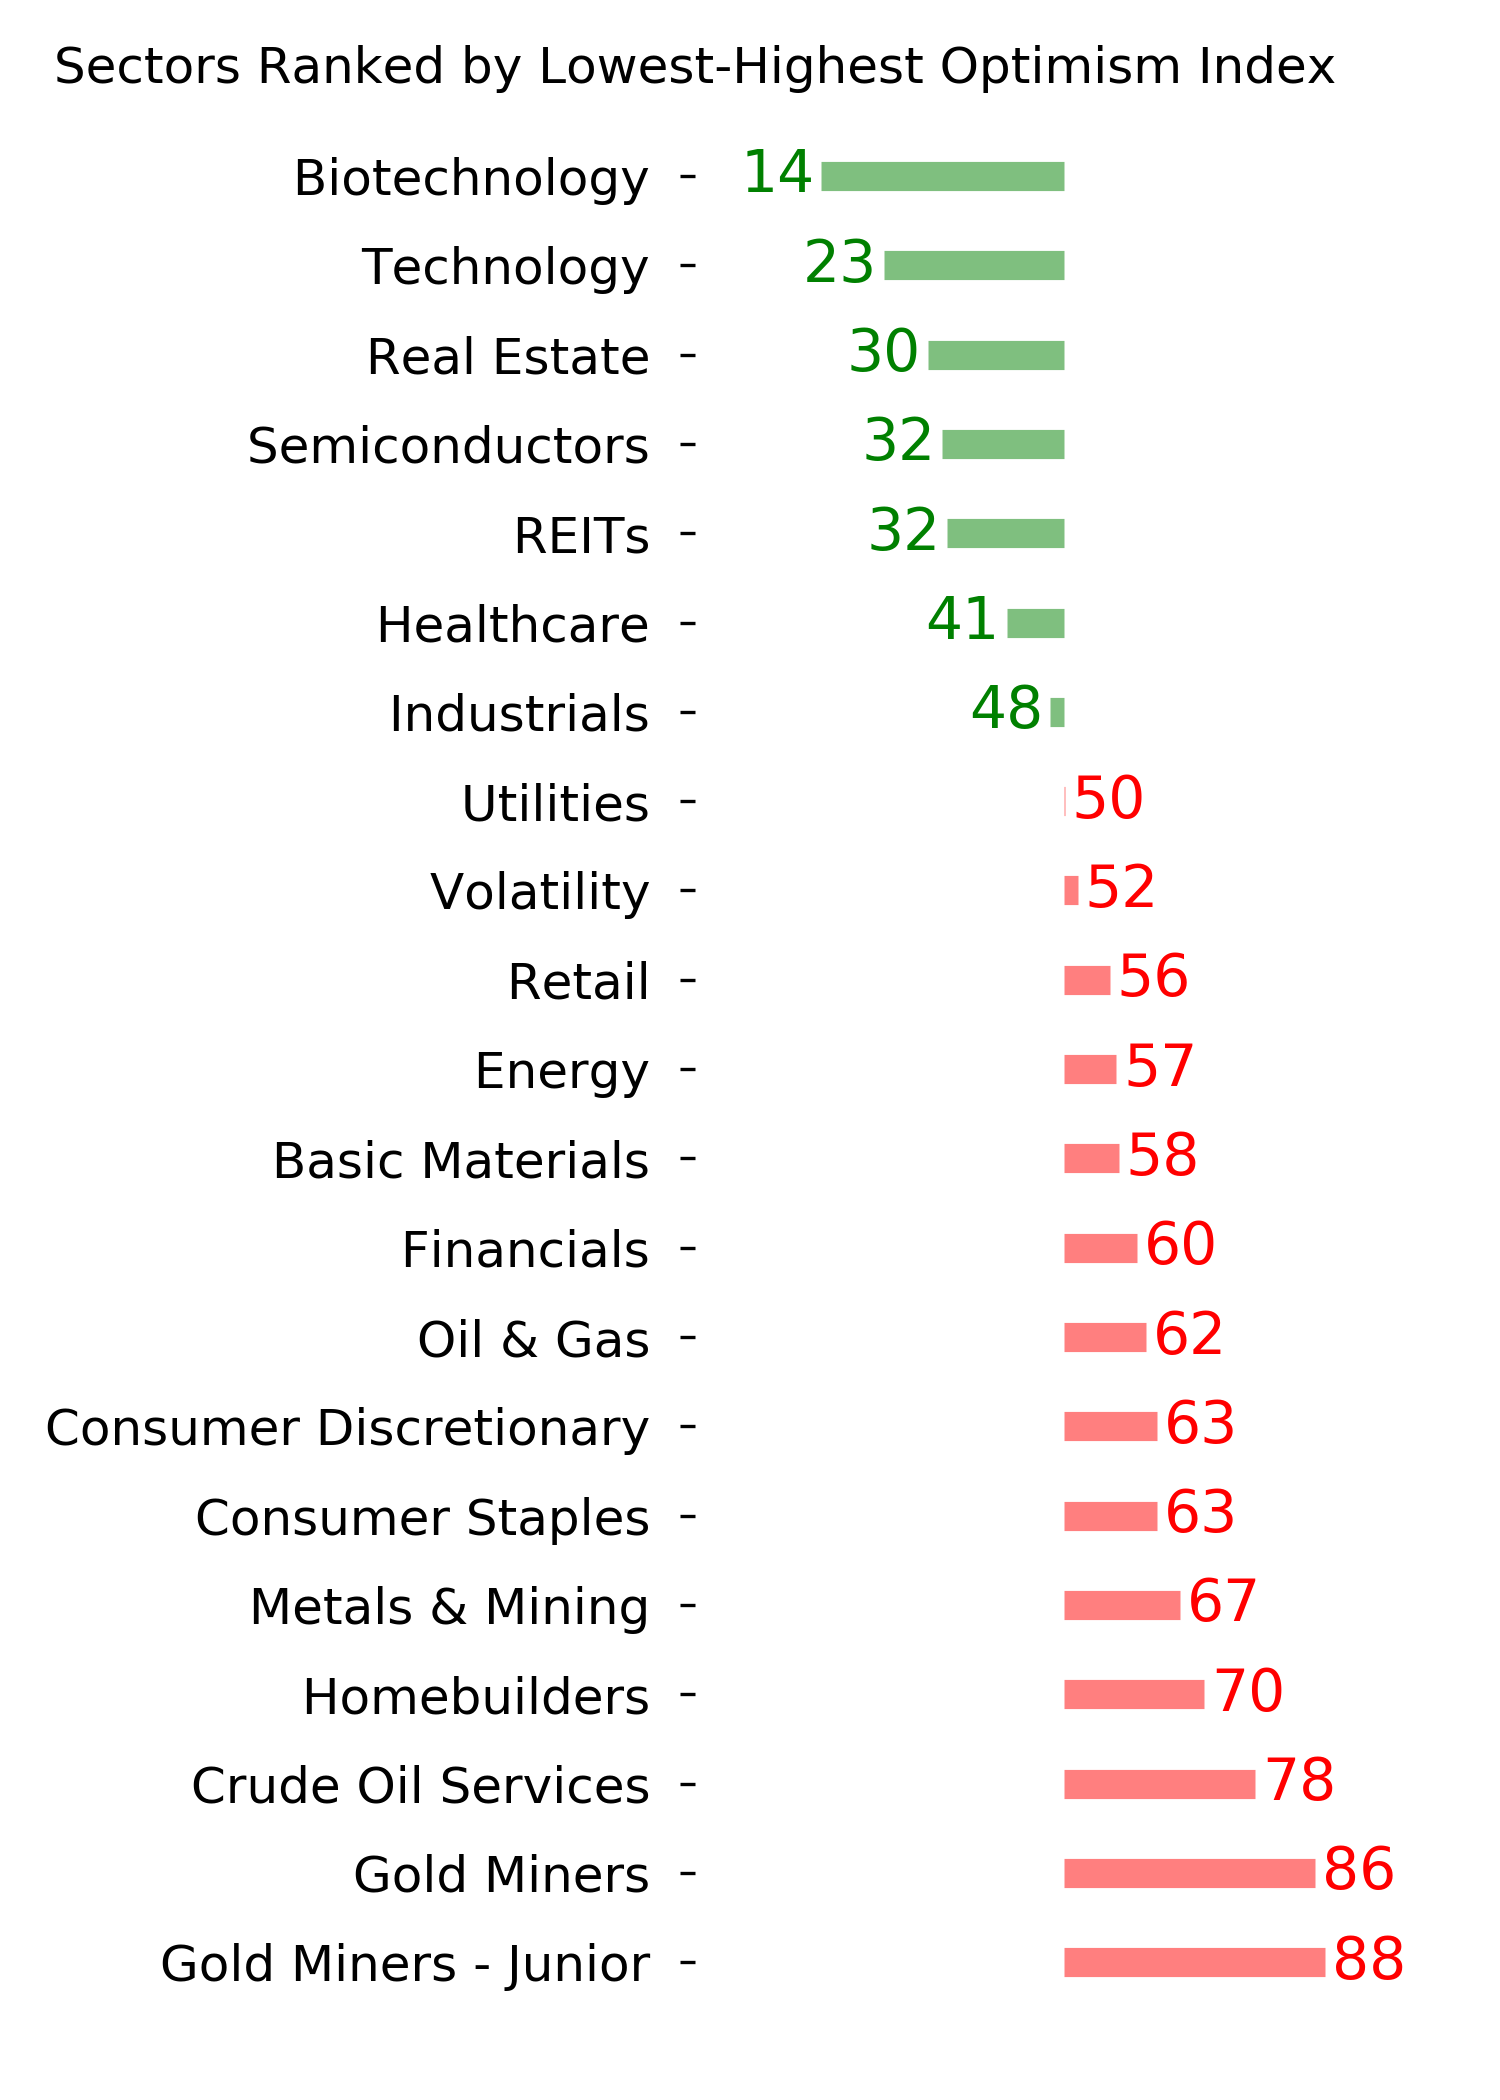
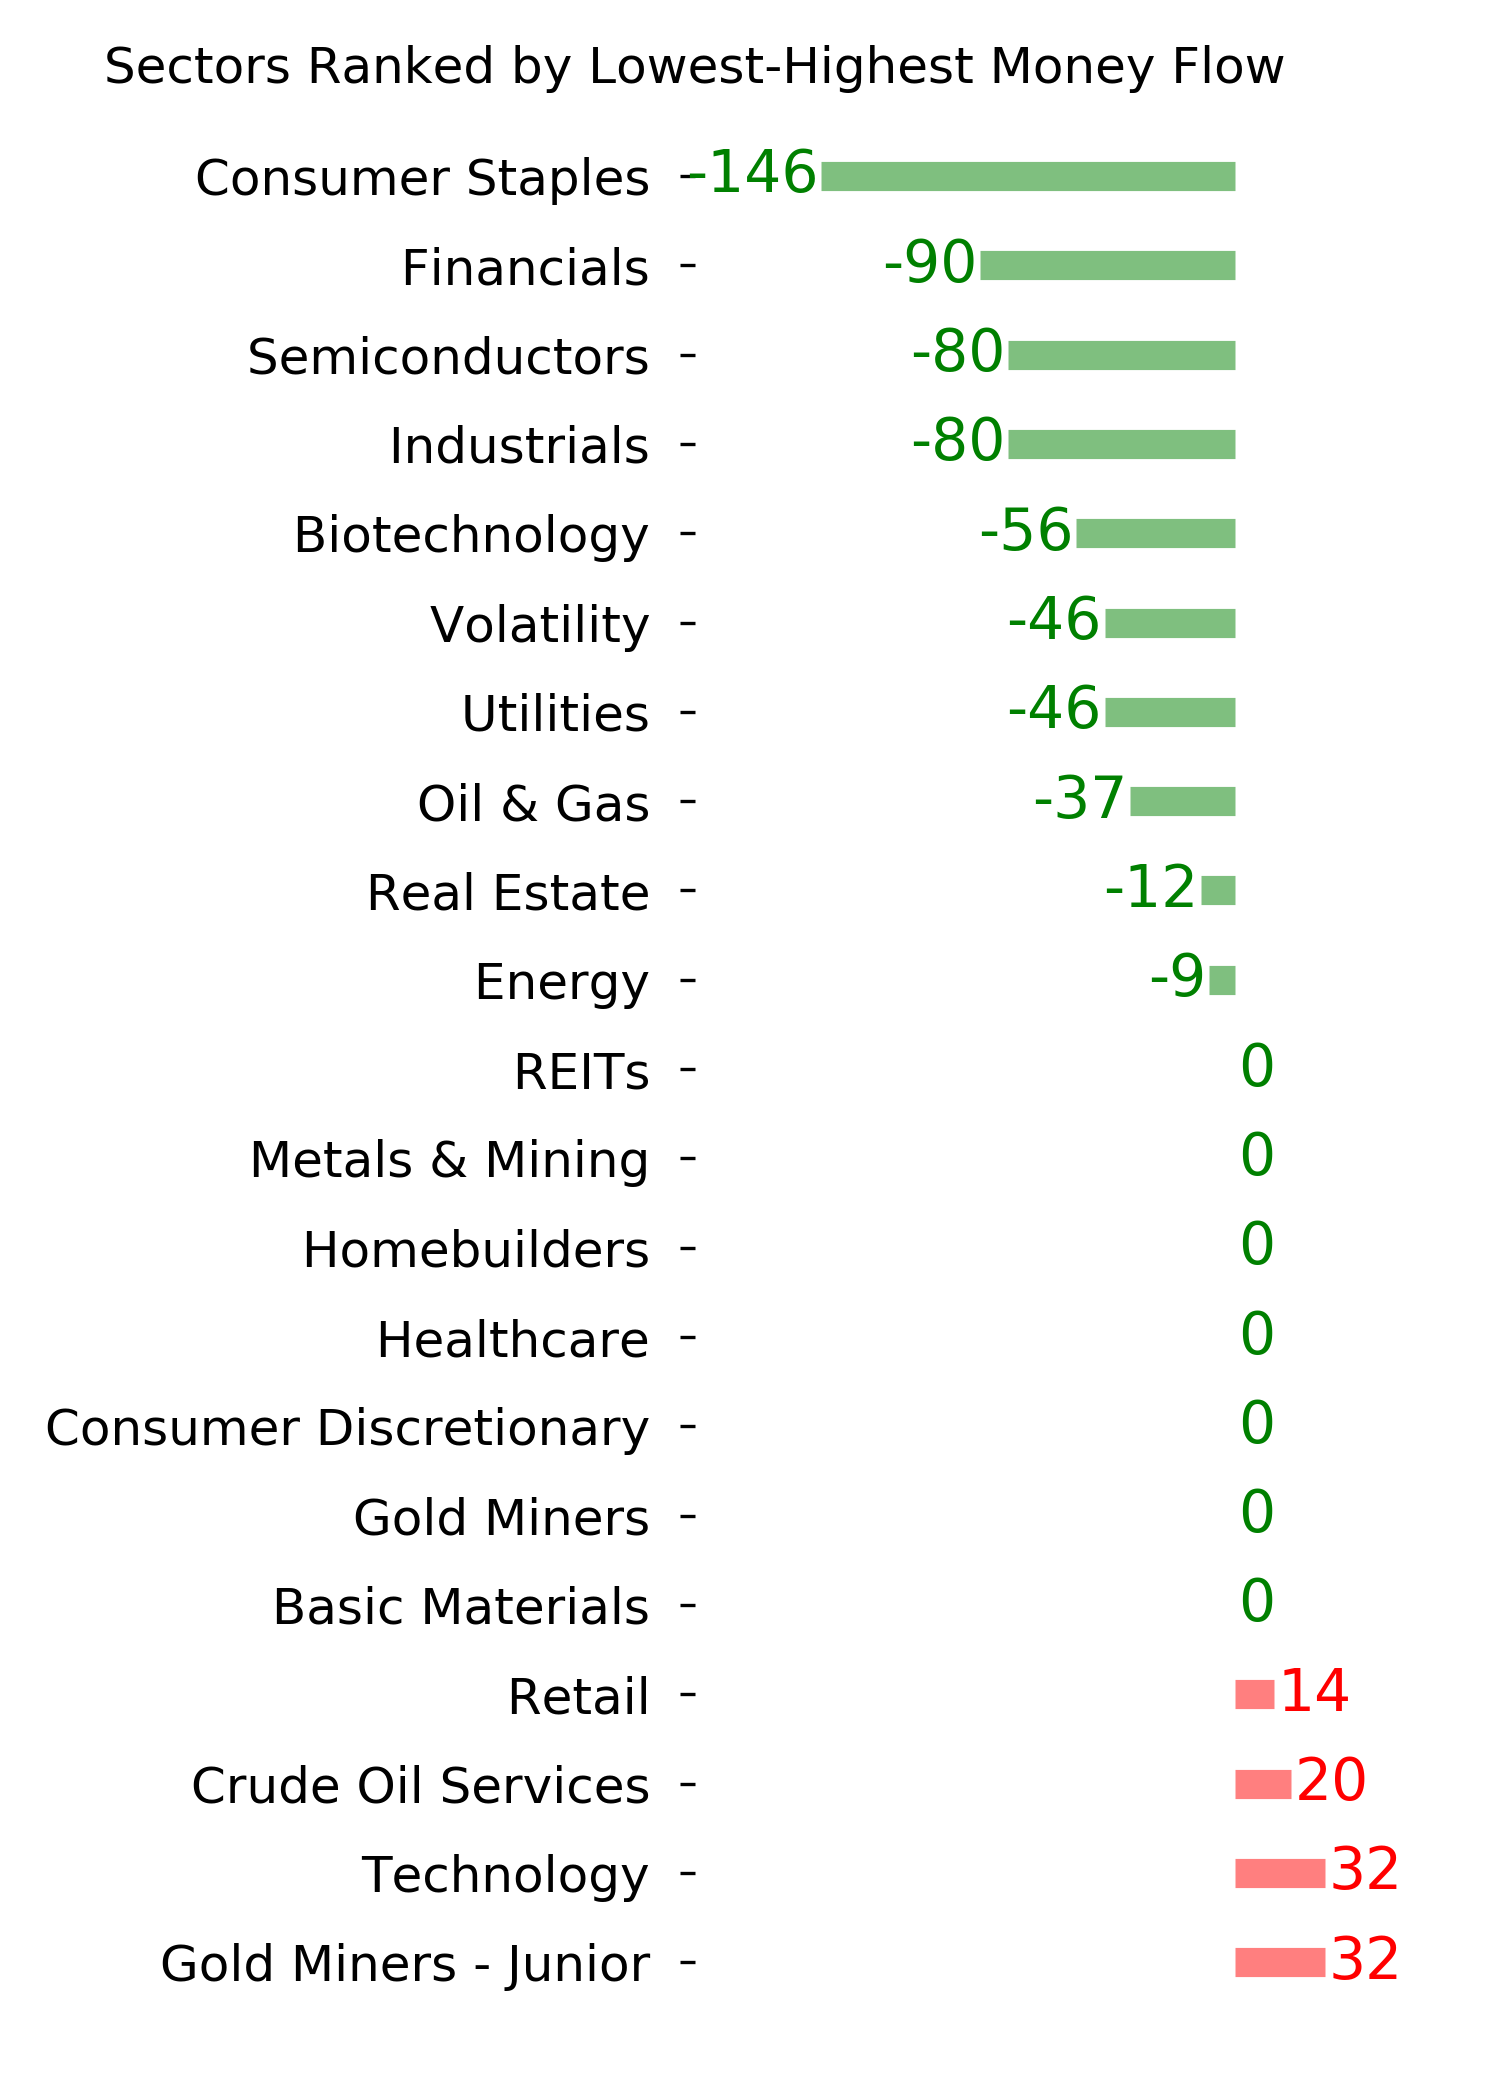
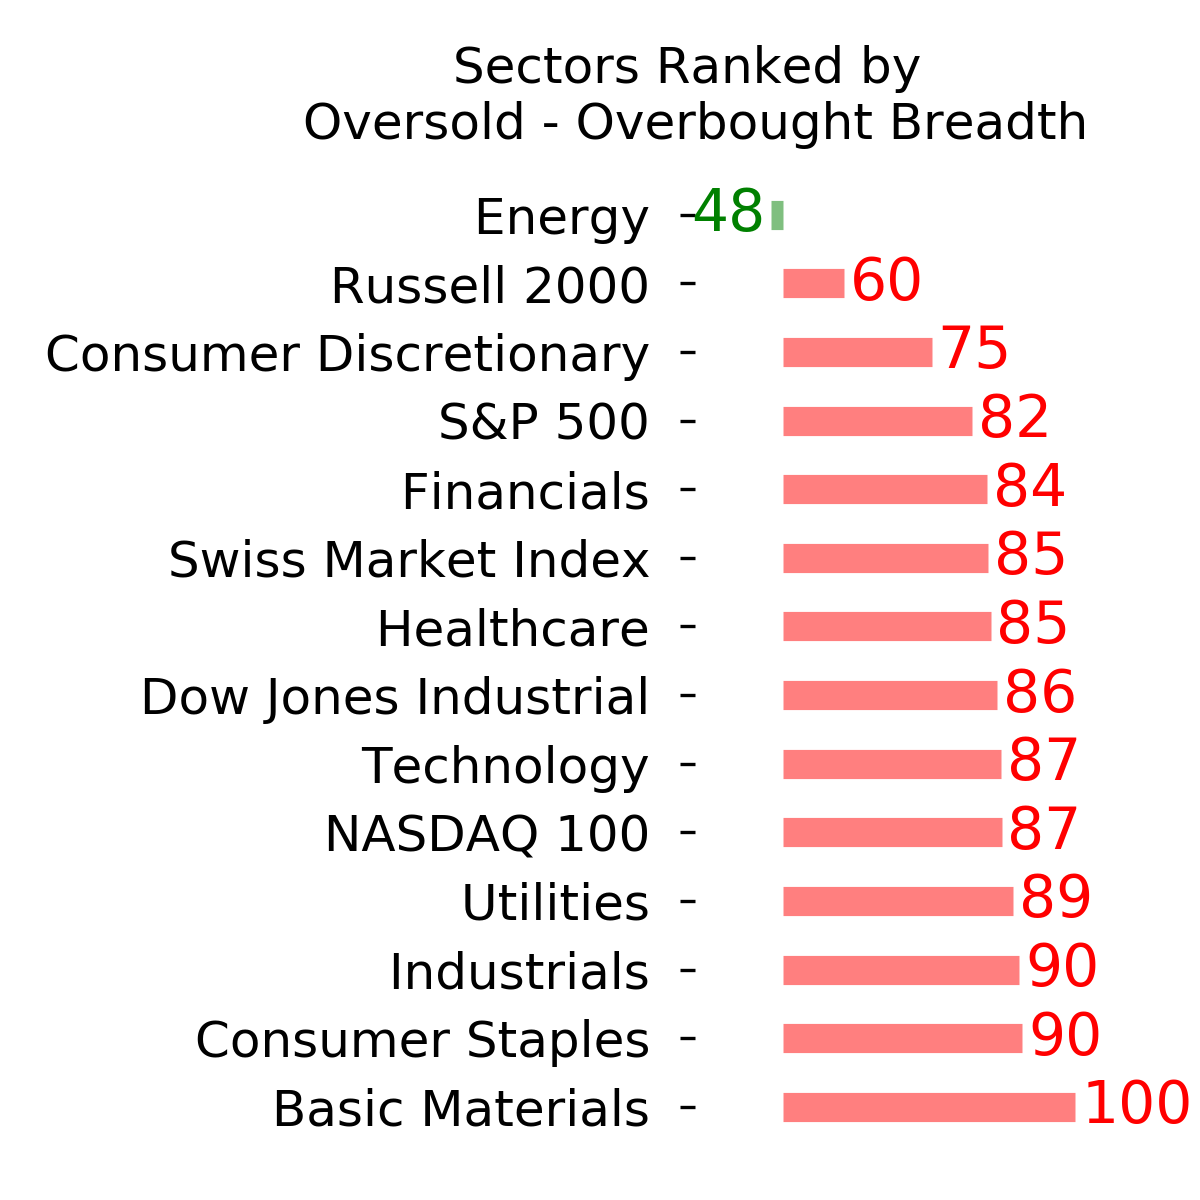
Ranks
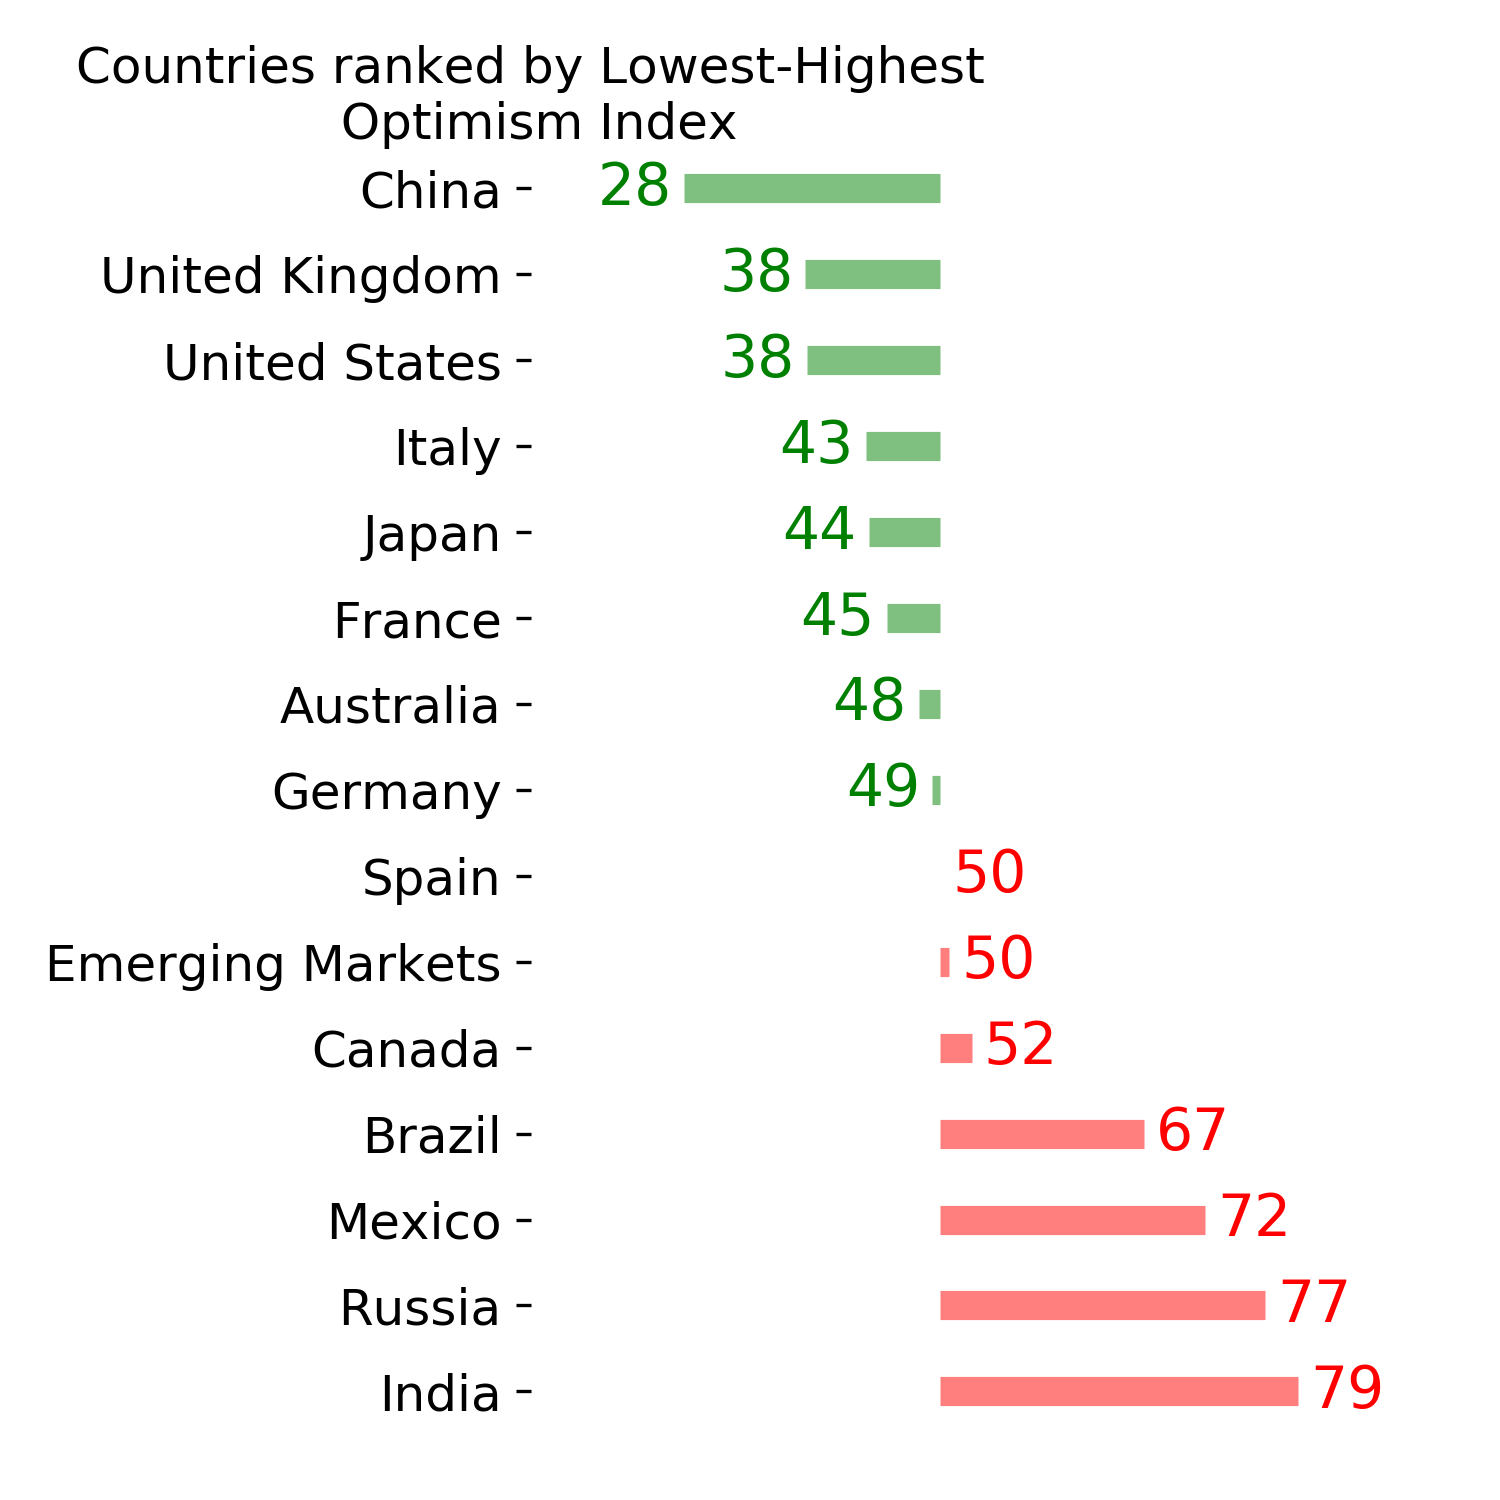
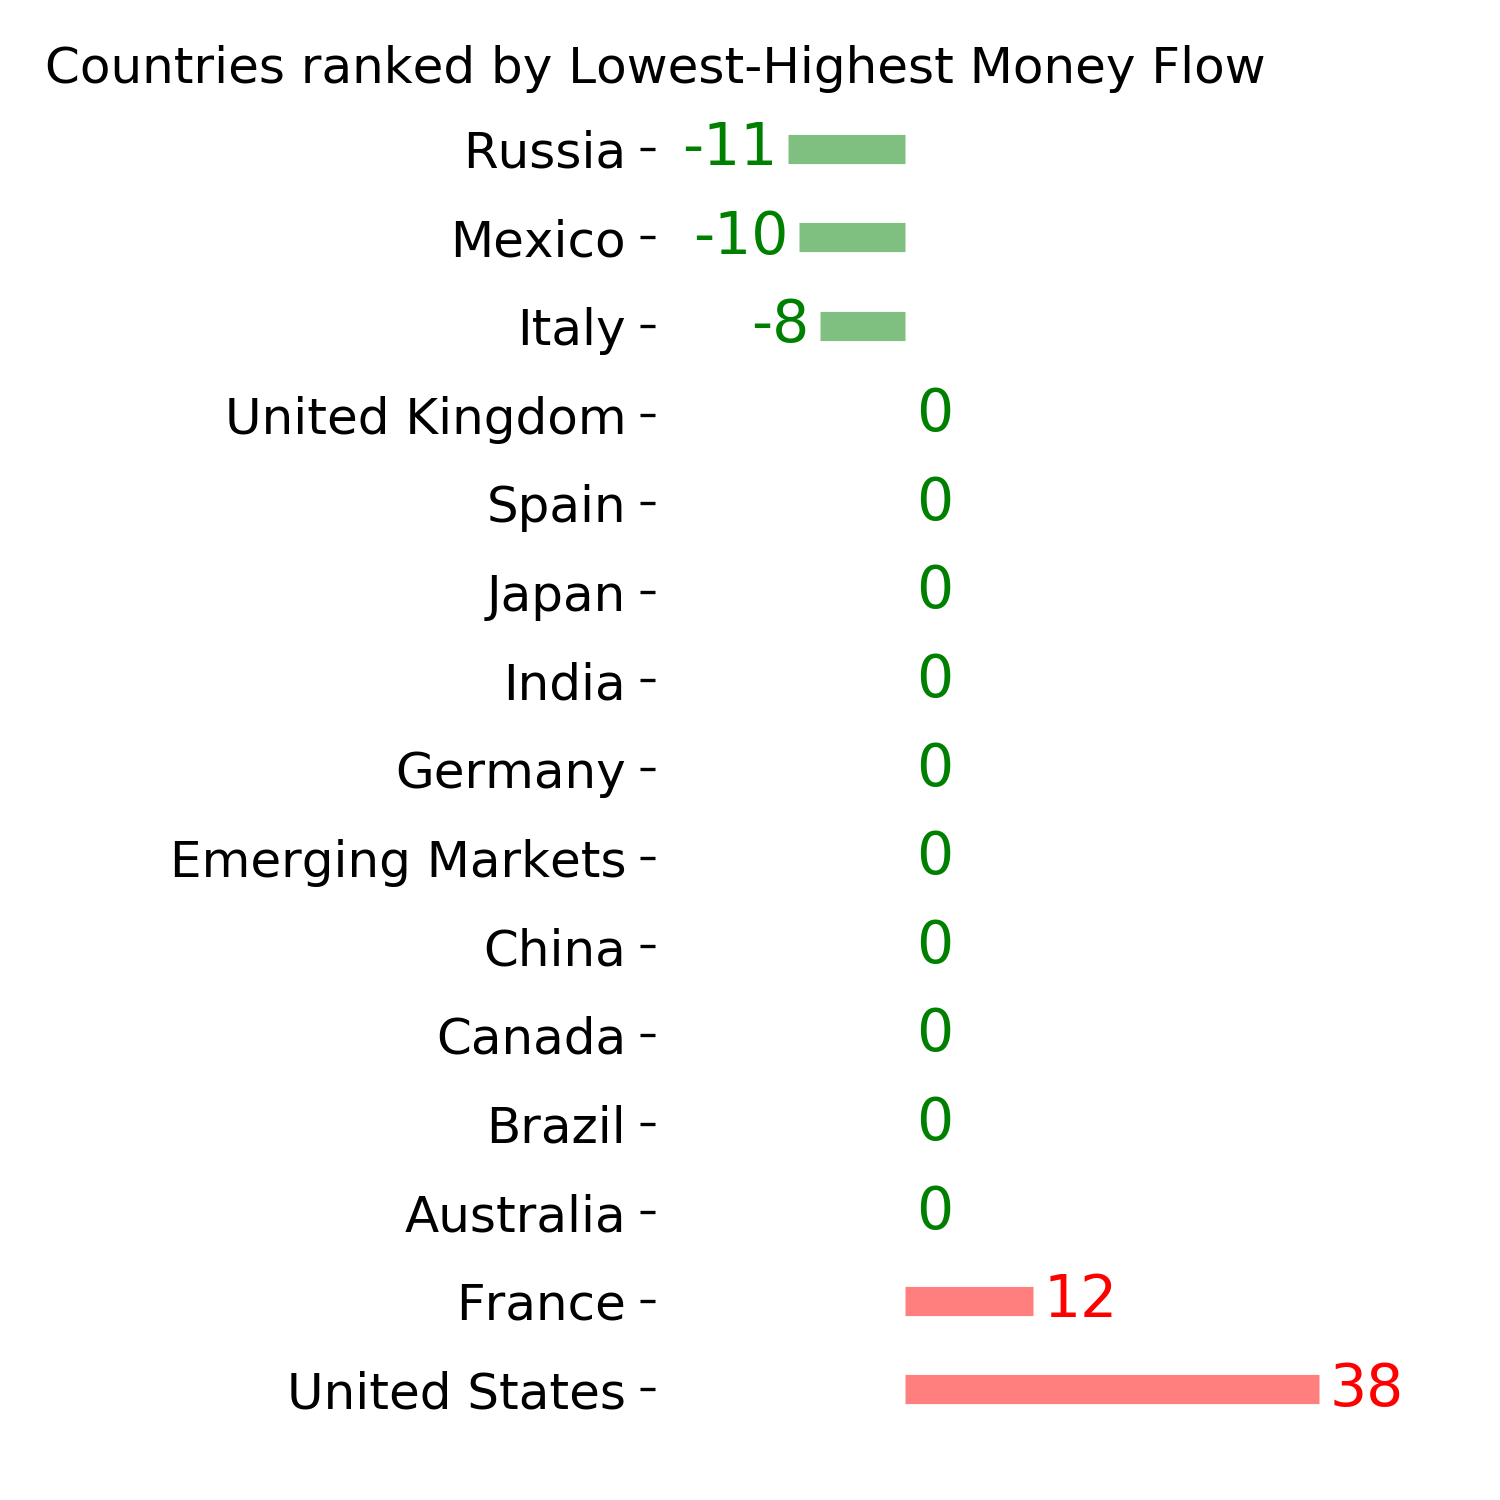
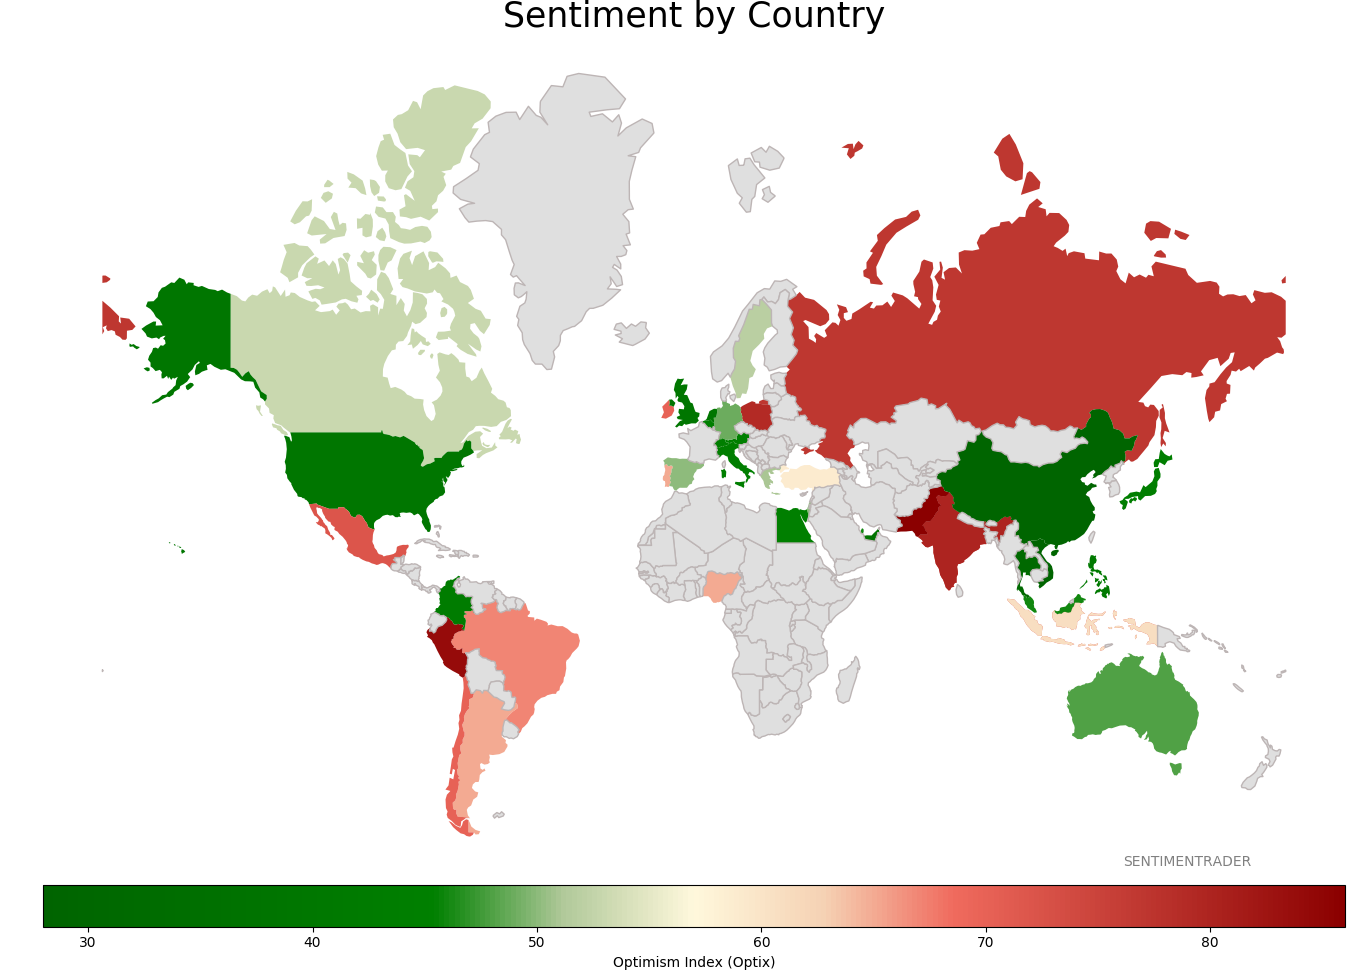
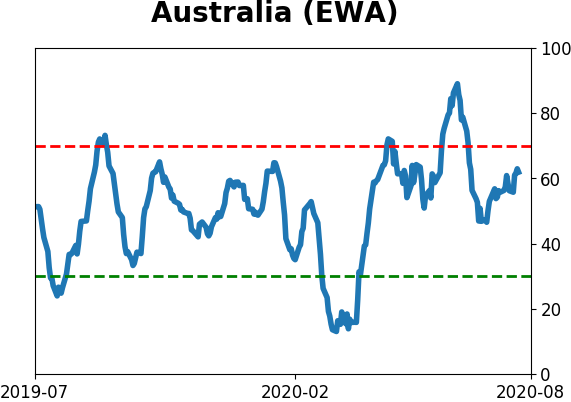
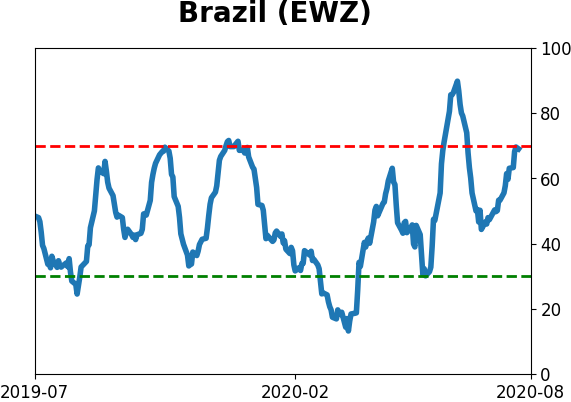
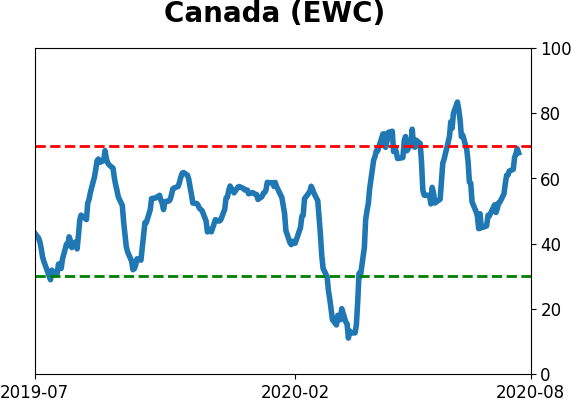
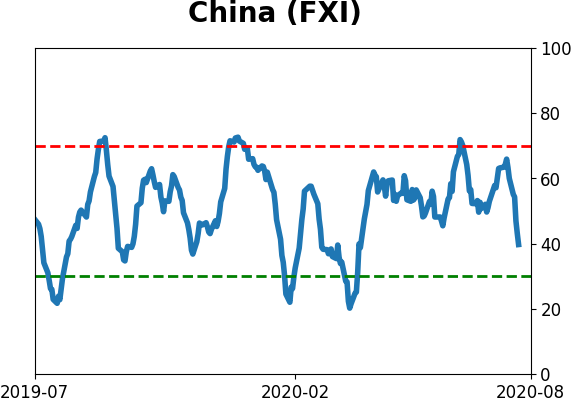
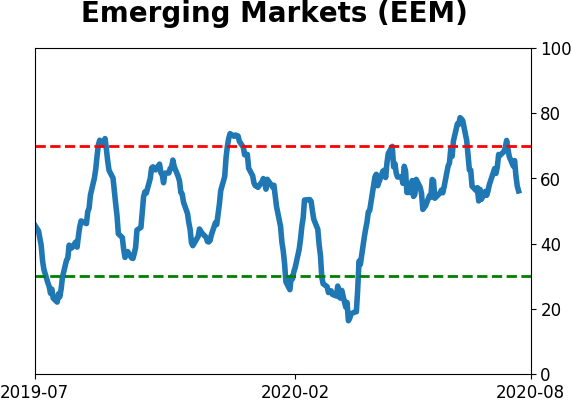
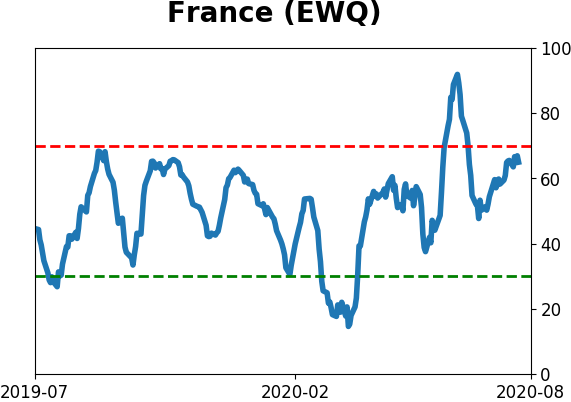
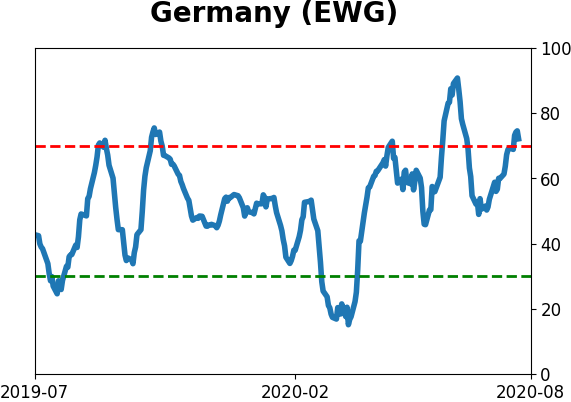
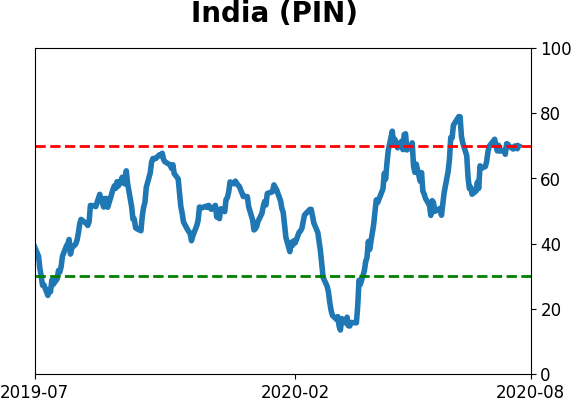
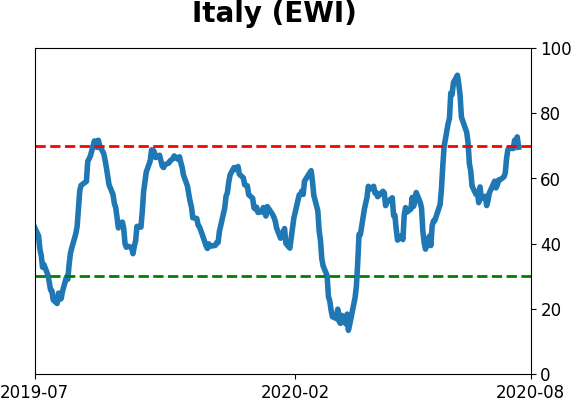
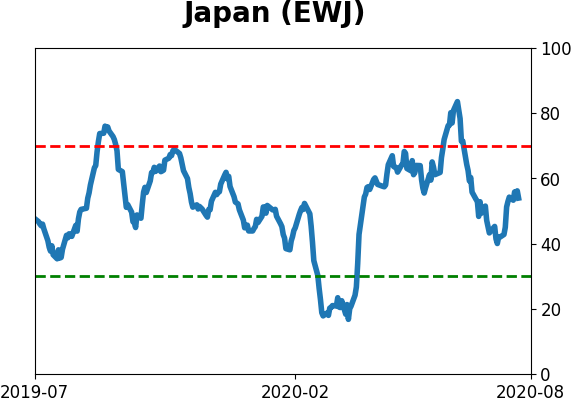
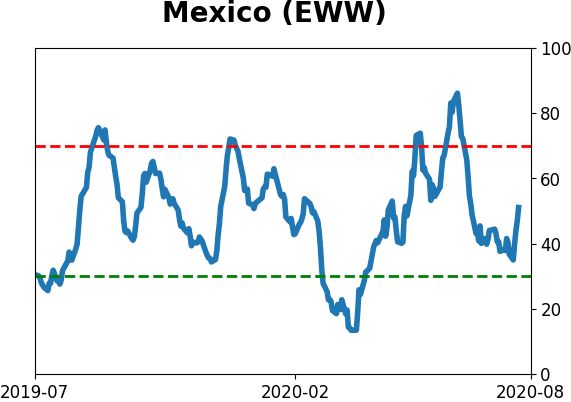
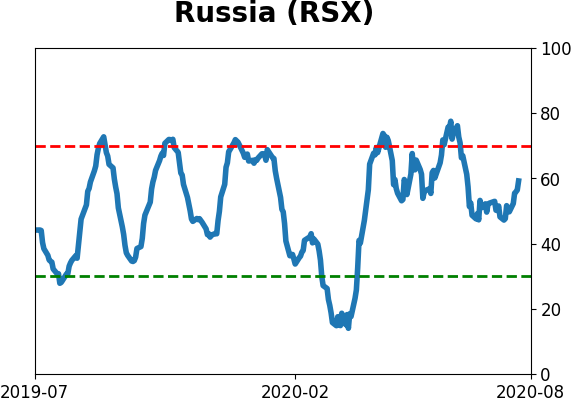
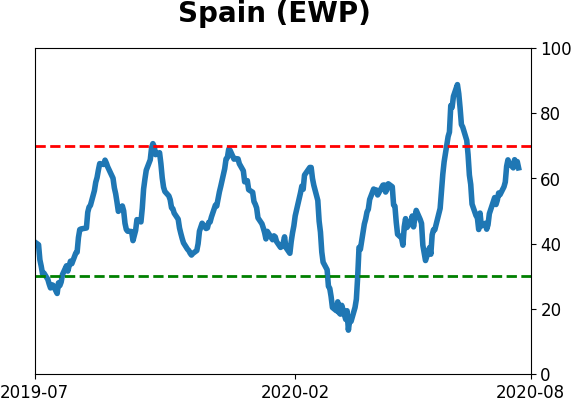
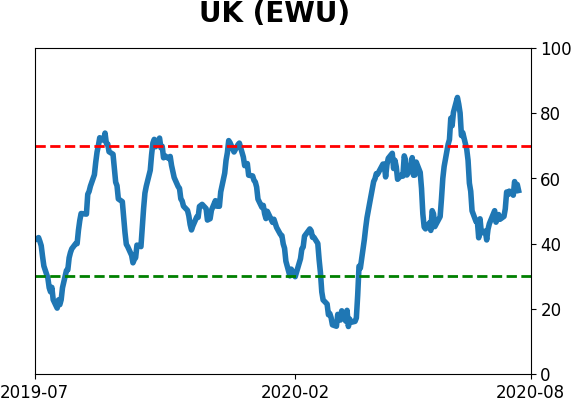
Sentiment Around The World
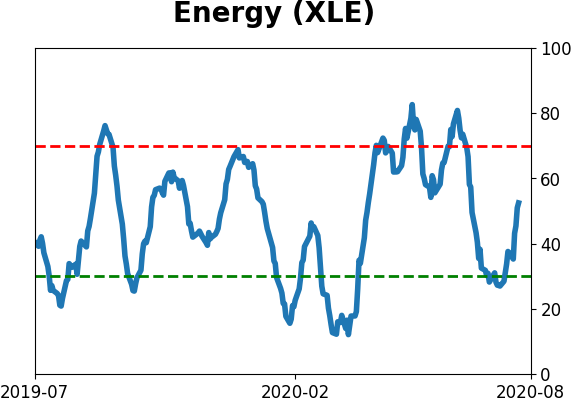
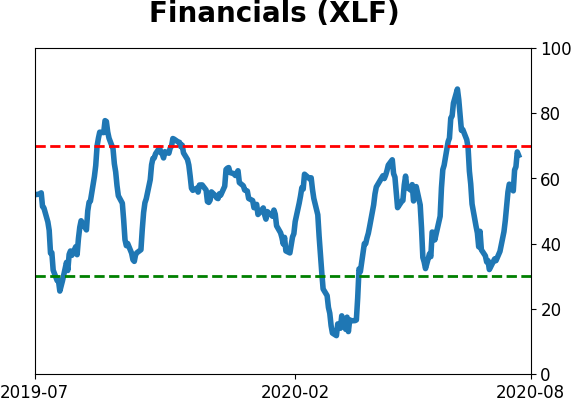
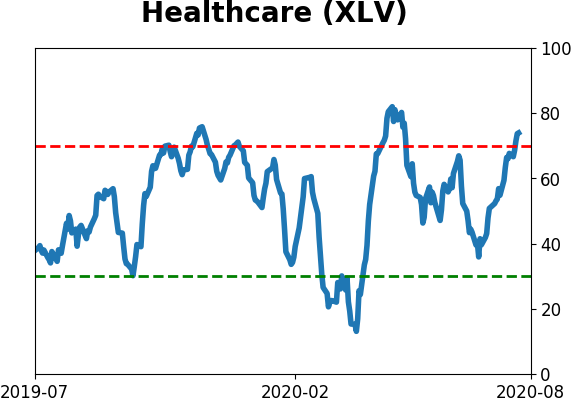
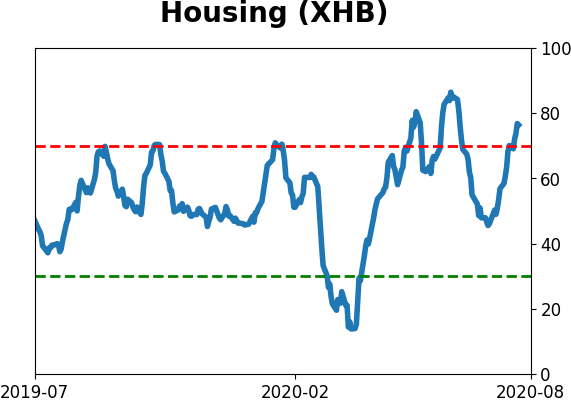
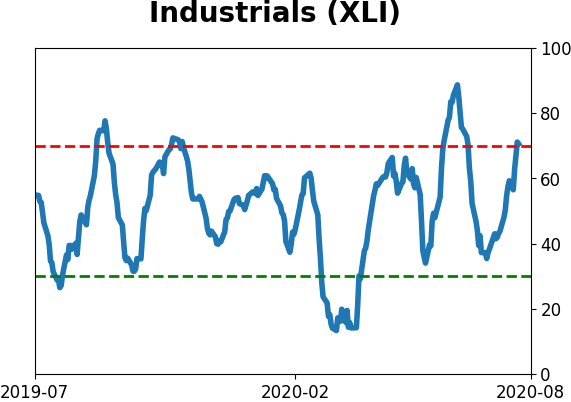
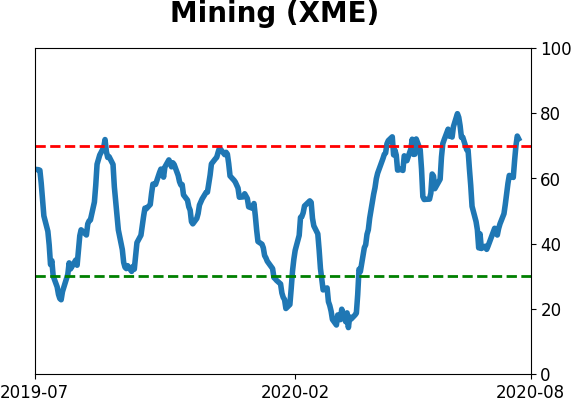
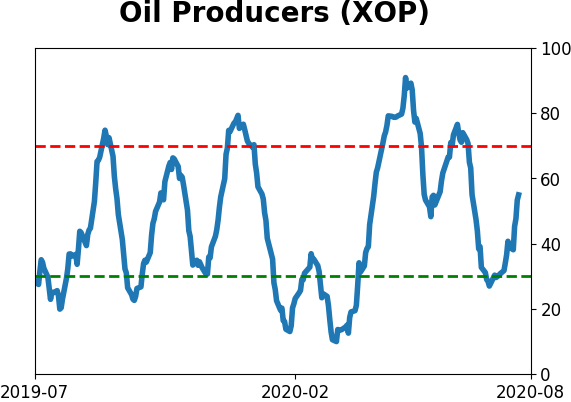
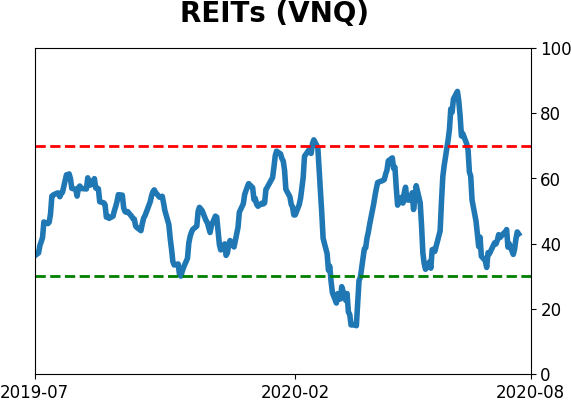
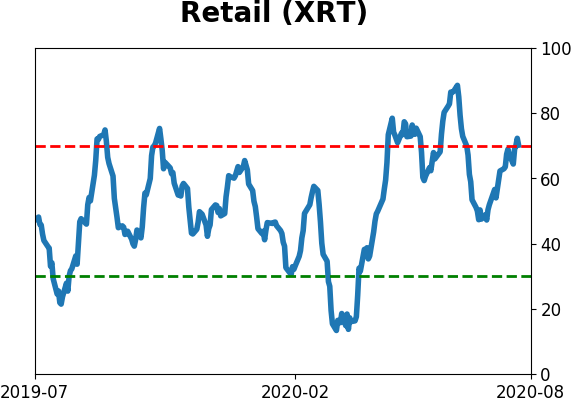
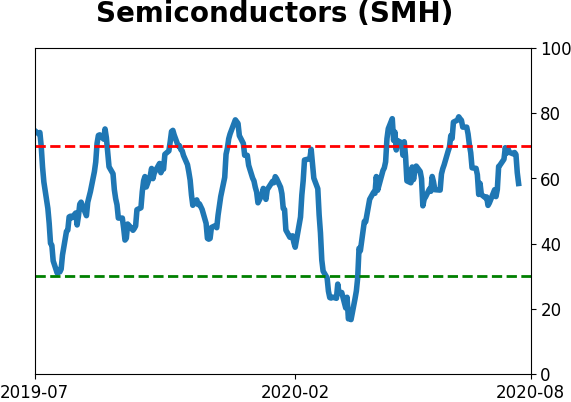
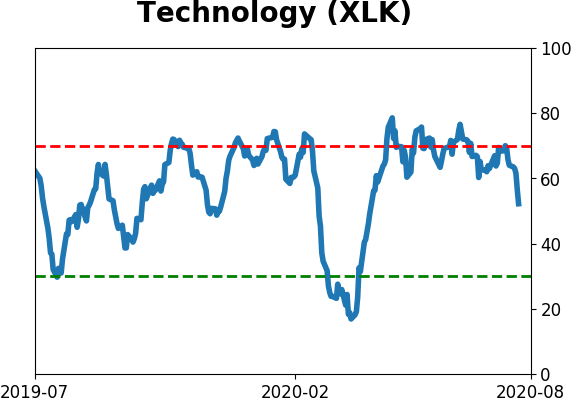
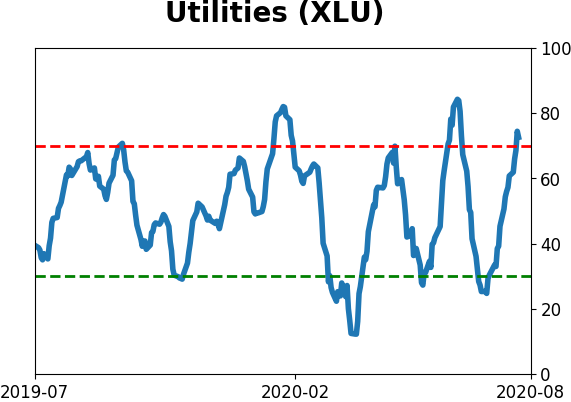
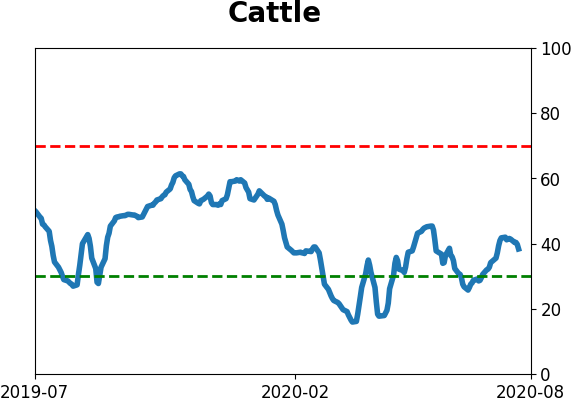
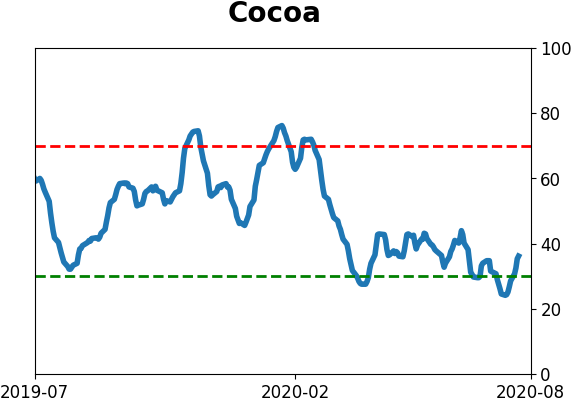
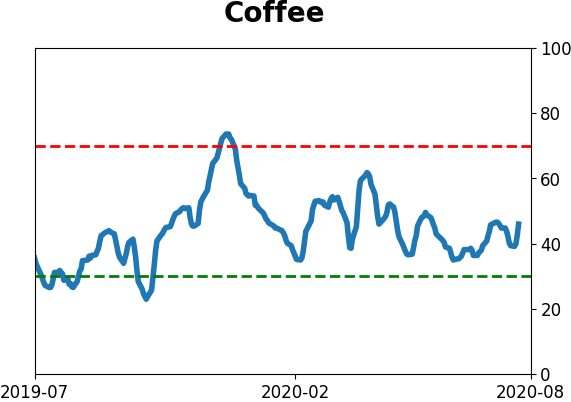
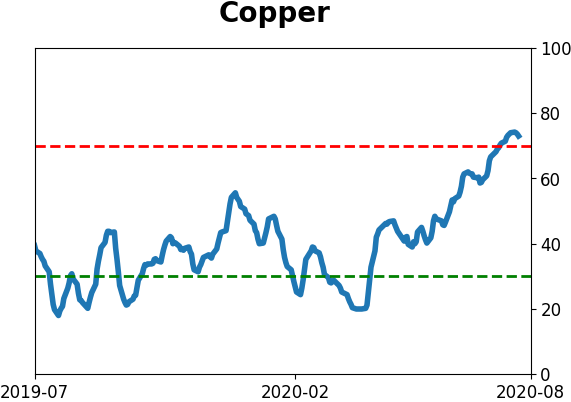
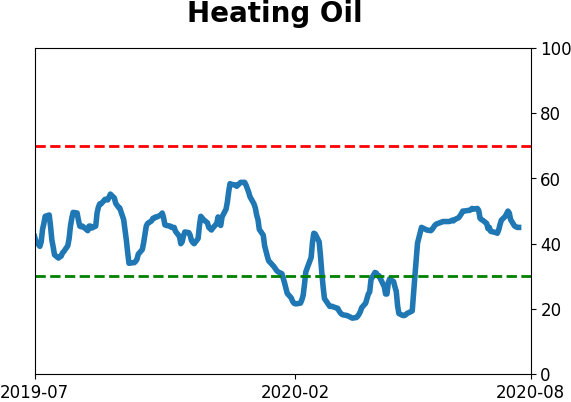
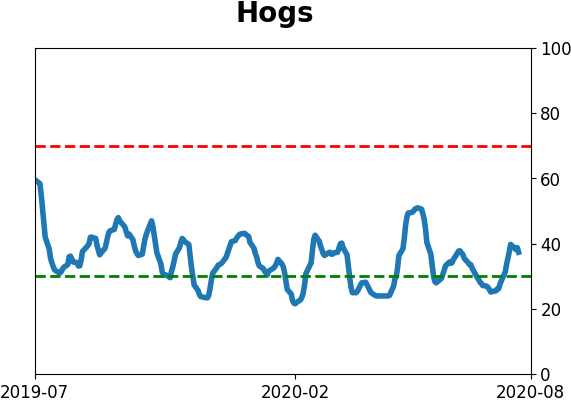
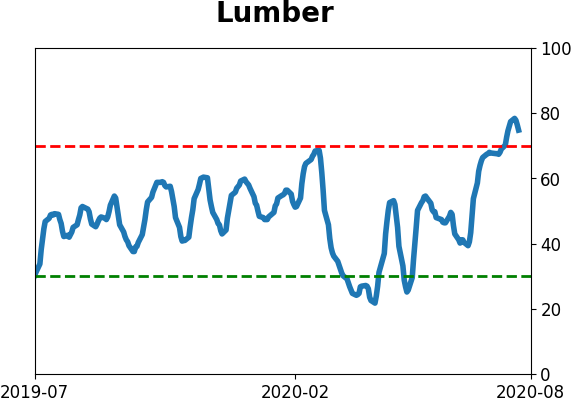
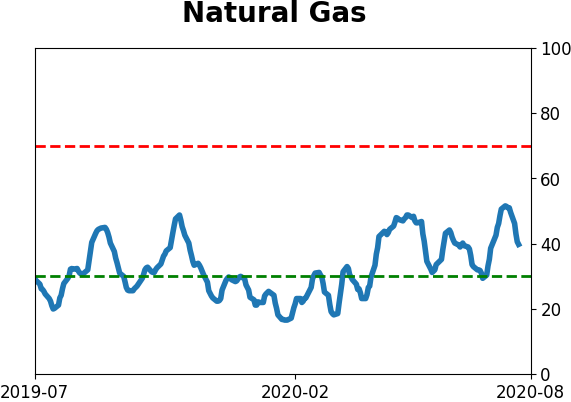
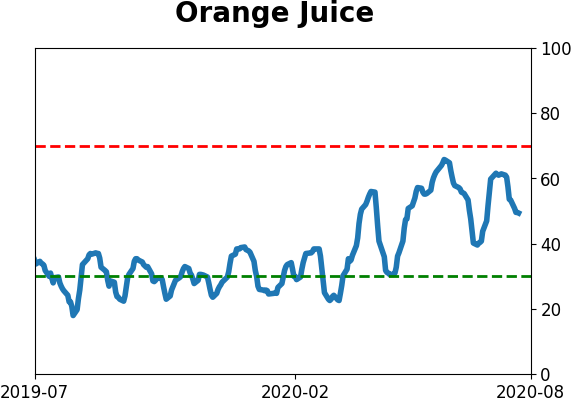
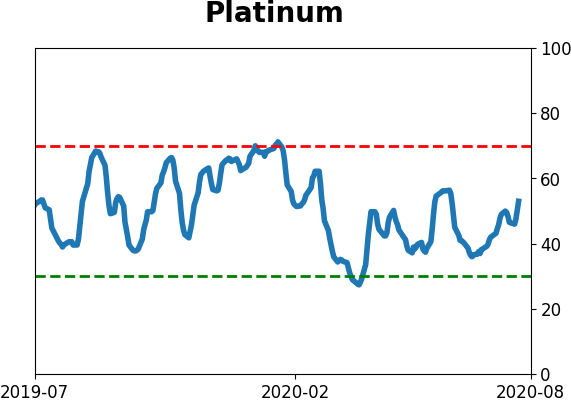
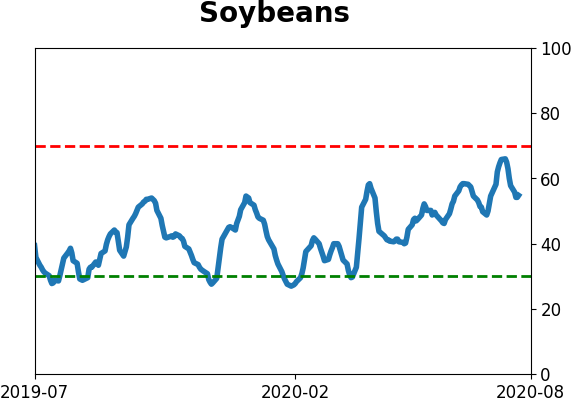
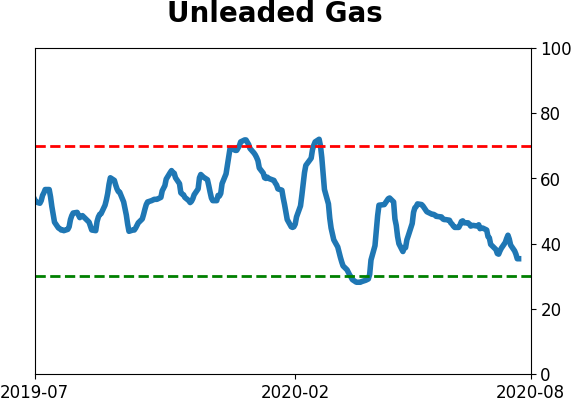
Optimism Index Thumbnails
|
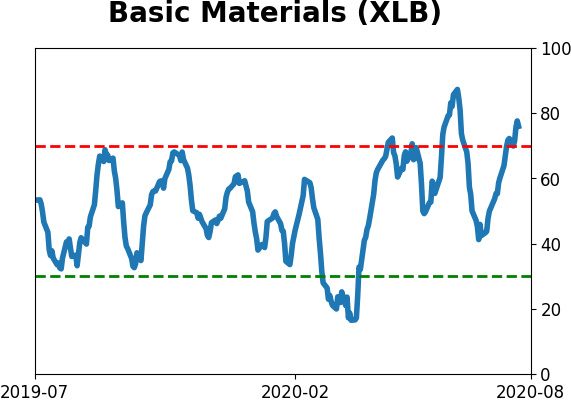
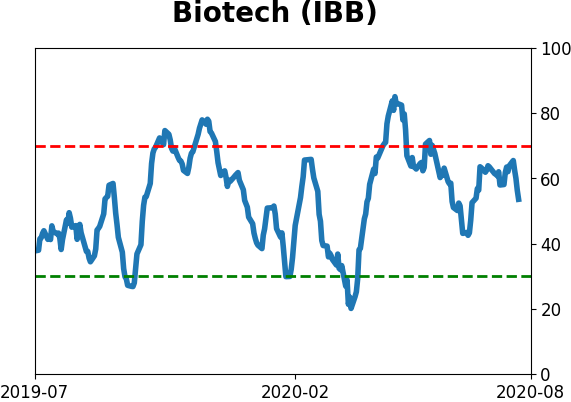
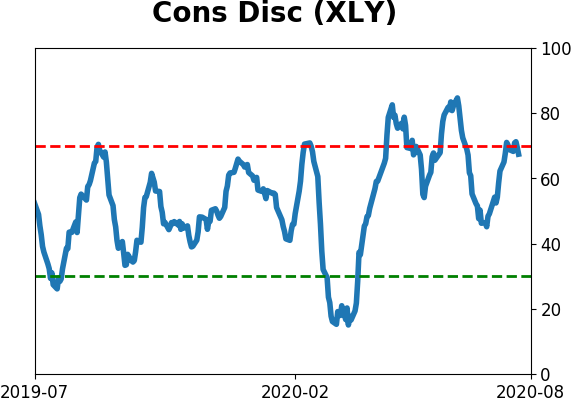
Sector ETF's - 10-Day Moving Average
|
|
|
Country ETF's - 10-Day Moving Average
|
|
|
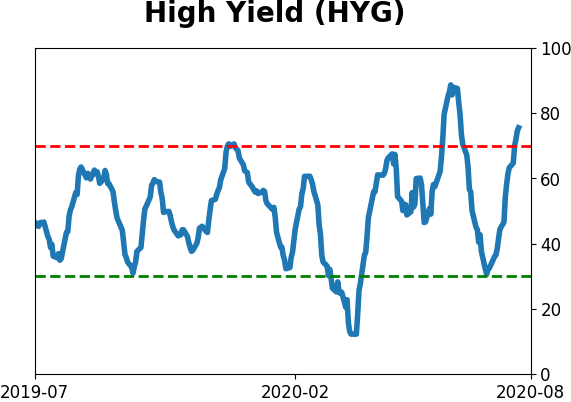
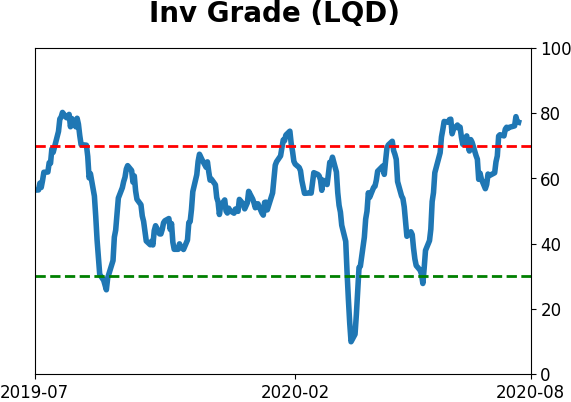
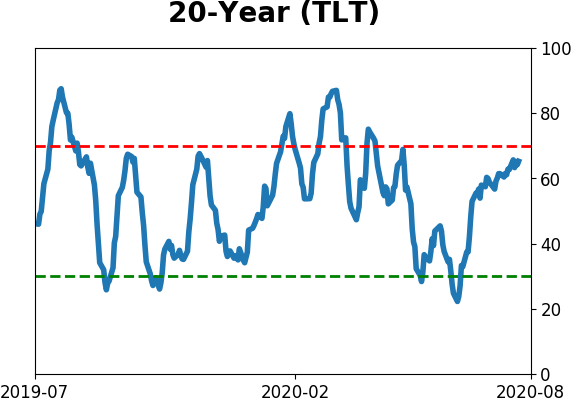
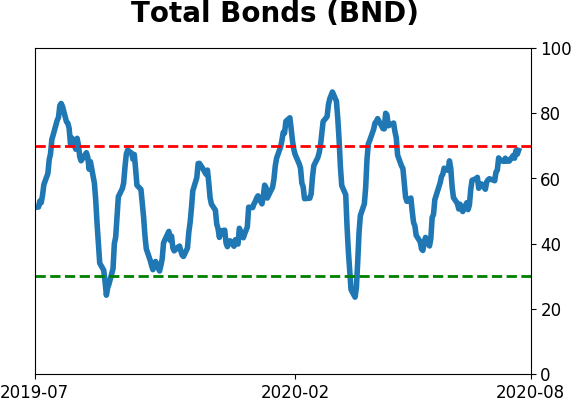
Bond ETF's - 10-Day Moving Average
|
|
|
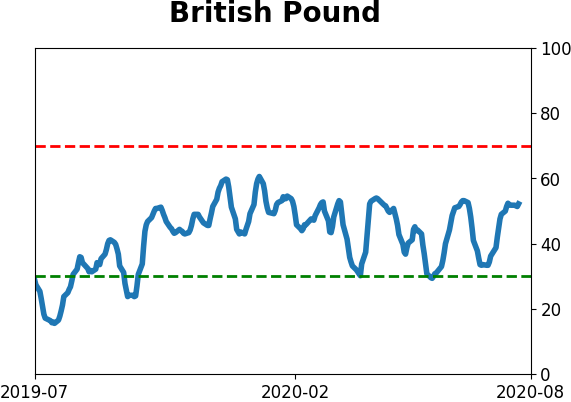
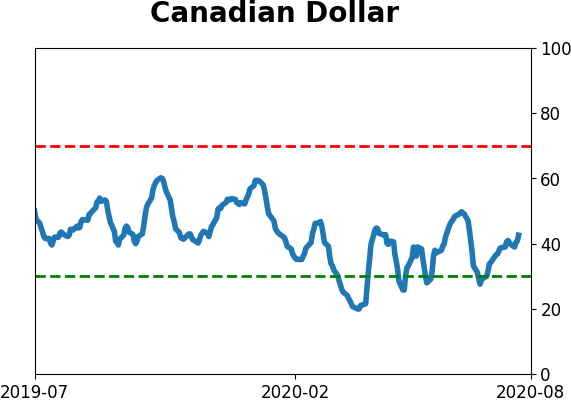
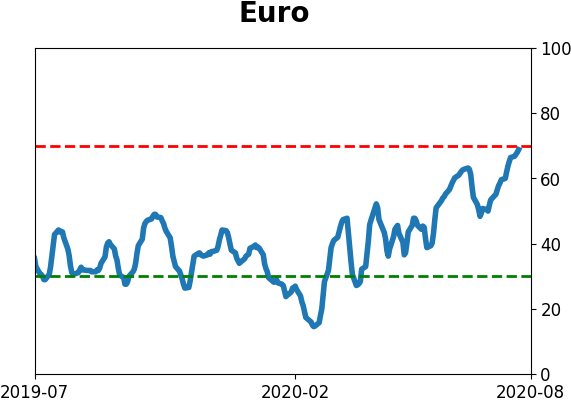
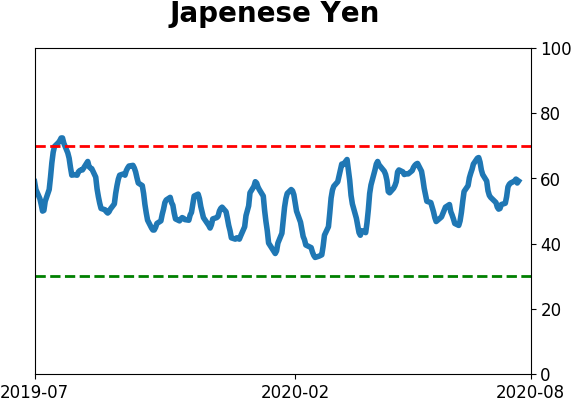
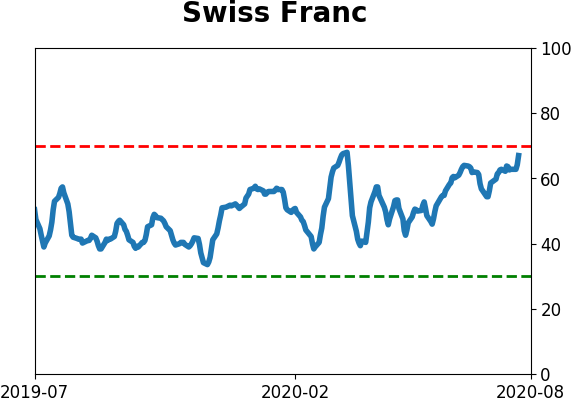
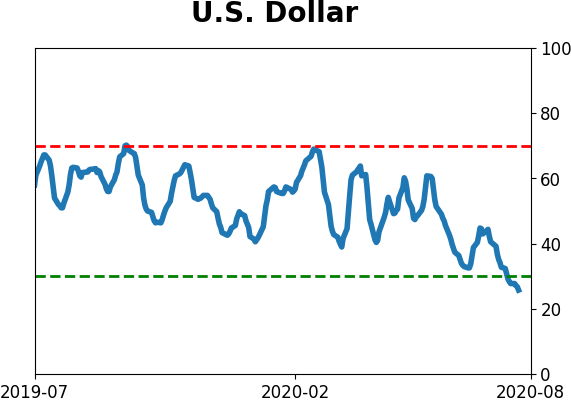
Currency ETF's - 5-Day Moving Average
|
|
|
Commodity ETF's - 5-Day Moving Average
|
|