Headlines
|
|
Corporate insiders drift away from their buying binge:
Corporate insiders were heavy buyers in March. They've gradually tapered off from their buying and selling pressure has picked up. Depending on the source, the amount that selling has picked up ranges from a little bit to a huge amount.
Too many S&P stocks underperforming by 10%:
As the S&P 500 has climbed toward its prior highs, more than 25% of its stocks are underperforming the index by more than 10% during the past few months. That's a figure that's more typically seen during bear markets.
Active managers are nearly all-in: The latest survey of active investment managers from the NAAIM organization showed that the average manager is 97% exposed to stocks, with even the most bearish manager net long, and a small standard deviation among them (i.e. lots of group-think). We've been discussing this survey since its inception, with the conclusion that it's not necessarily a great contrarian indicator. There have been 11 weeks with similar positioning since 2006, and the S&P 500's forward returns were slightly better than random, but with a worse risk/reward skew. Those weeks were 2007-01-03, 2016-08-17, 2016-11-30, 2016-12-21, 2016-12-28, 2017-09-20, 2017-12-13, 2017-12-20, 2018-06-13, 2018-08-29, and 2019-12-18.
Bottom Line:
|
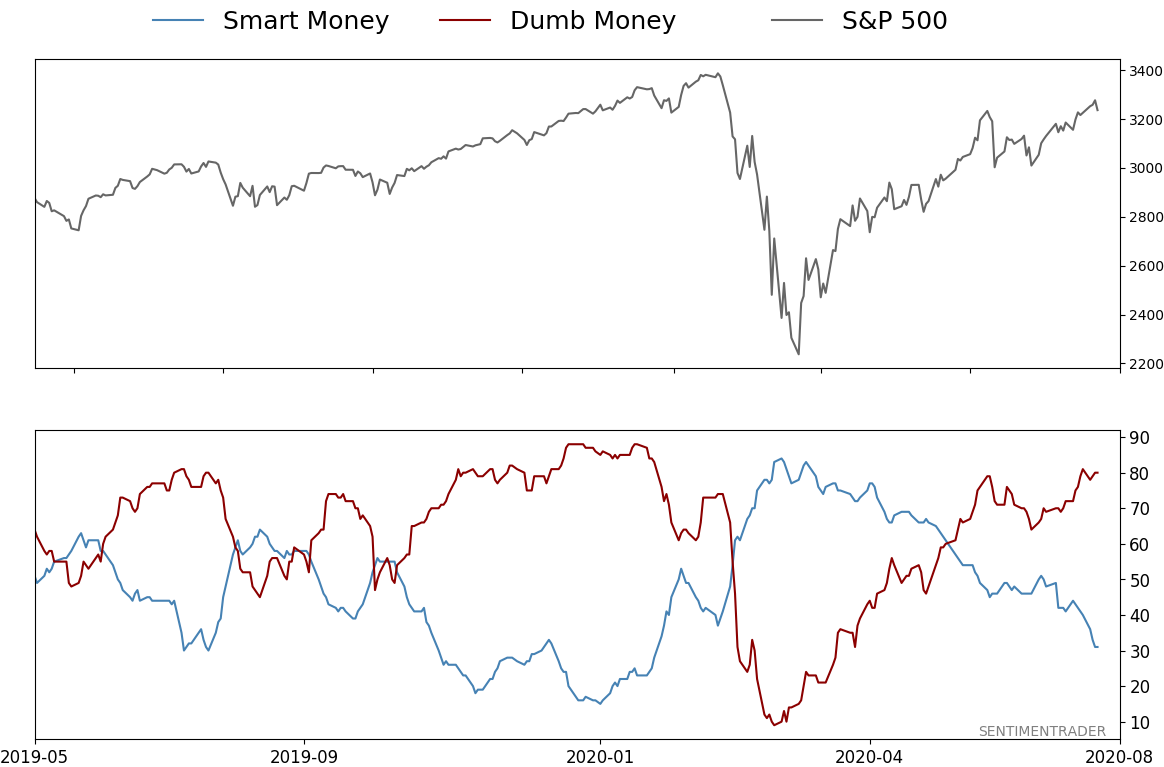
Smart / Dumb Money Confidence
|
Smart Money Confidence: 31%
Dumb Money Confidence: 80%
|
|
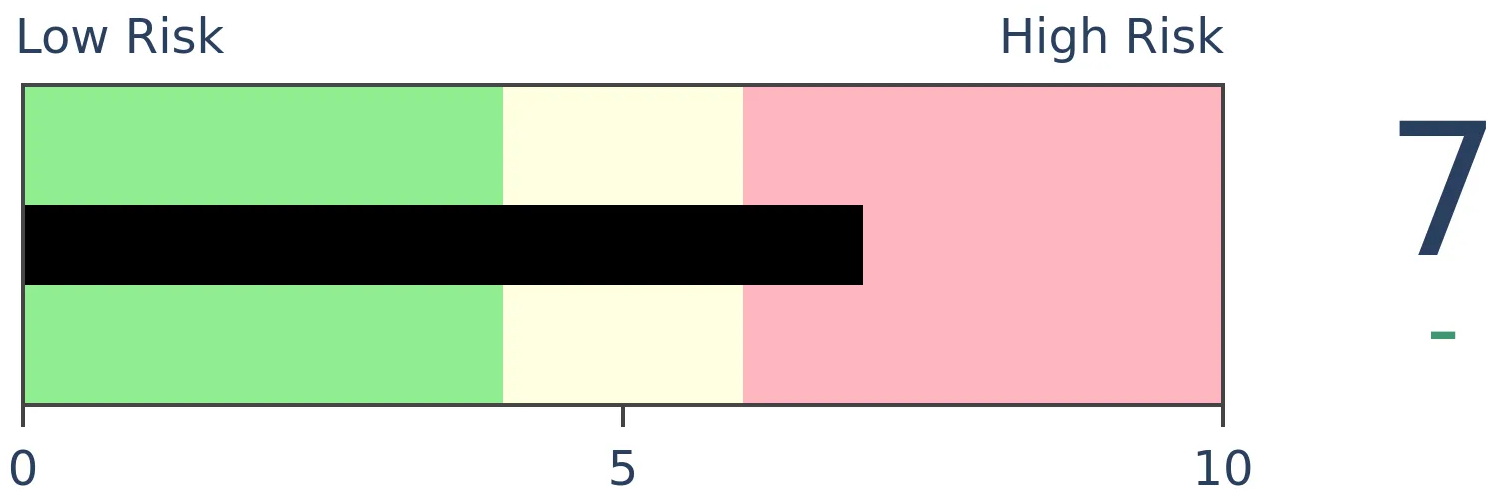
Risk Levels
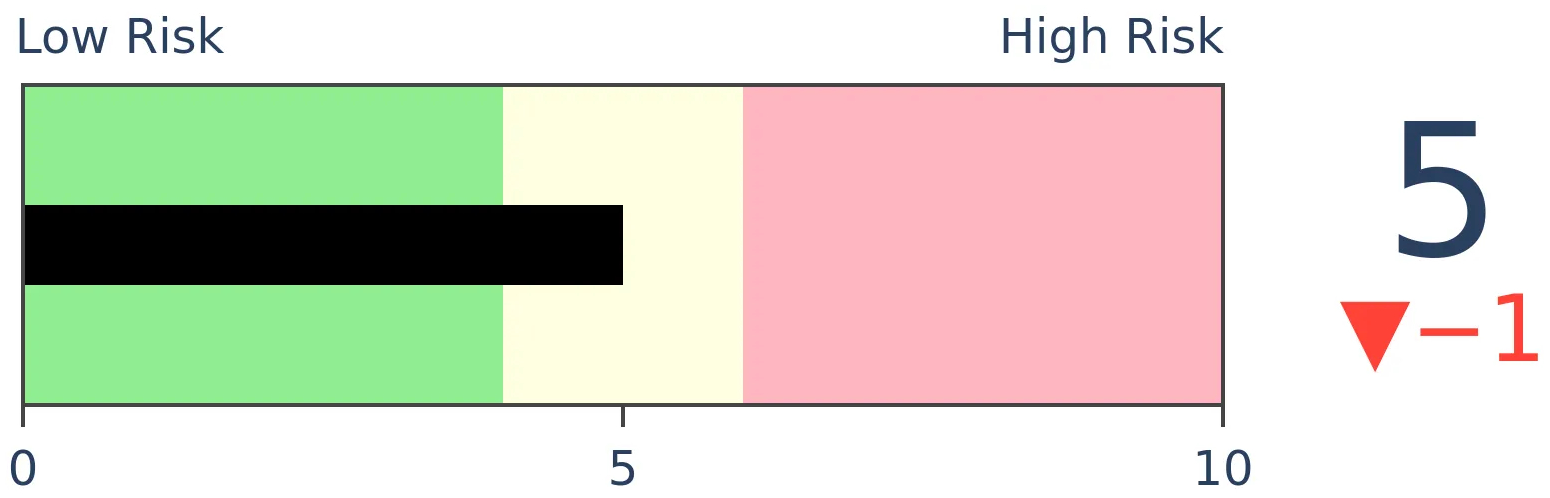
Stocks Short-Term

|
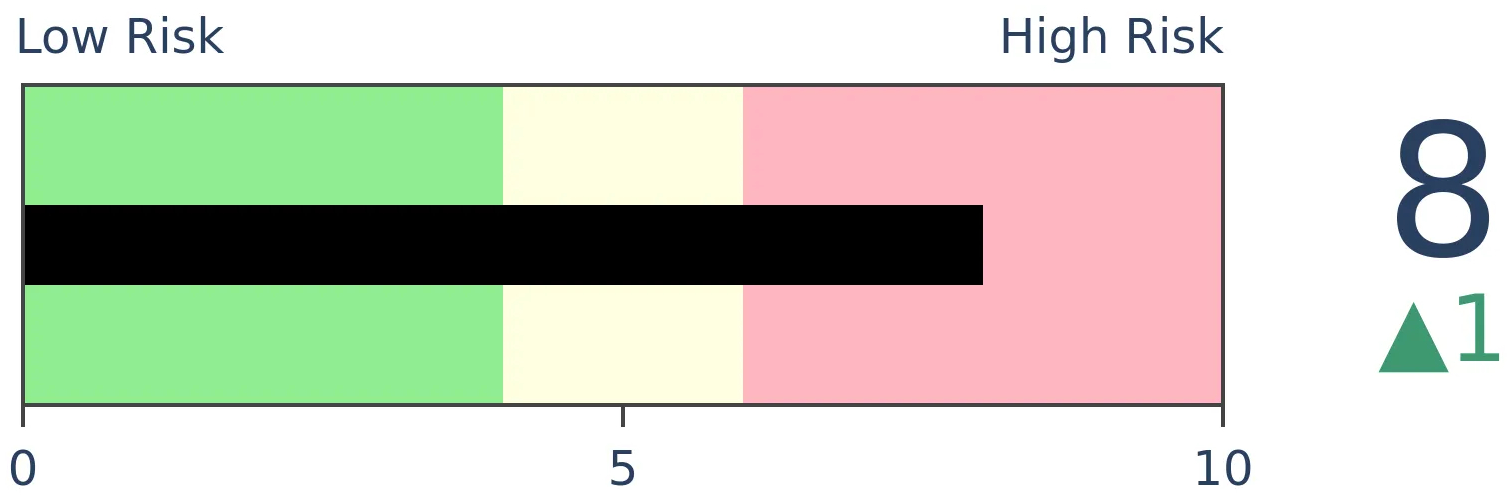
Stocks Medium-Term
|
|
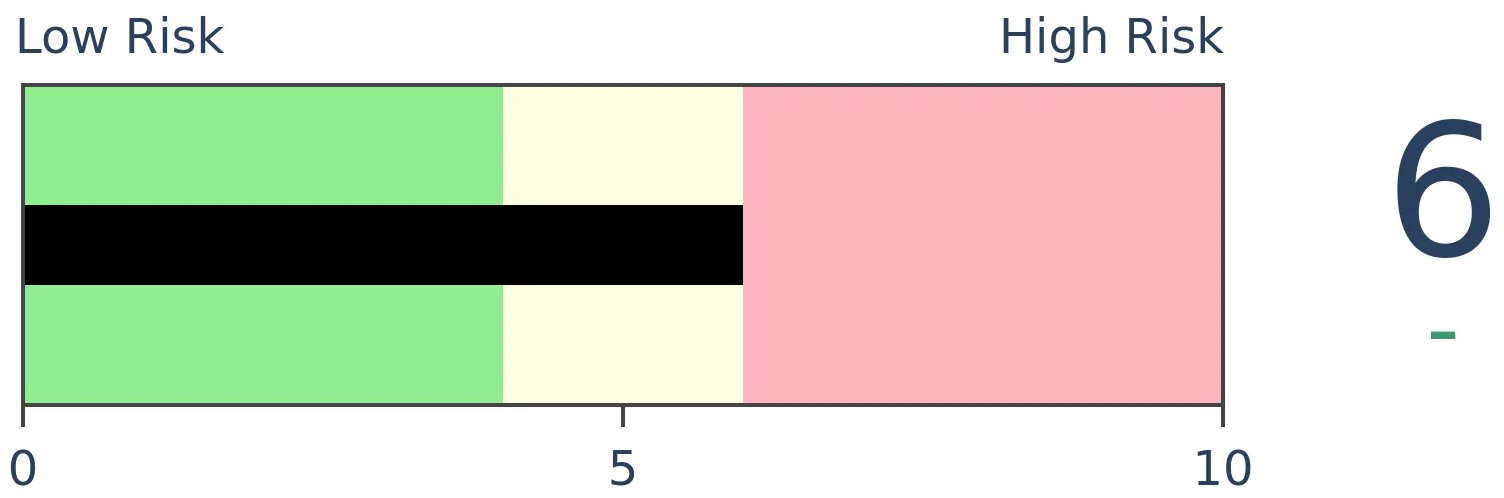
Bonds
|
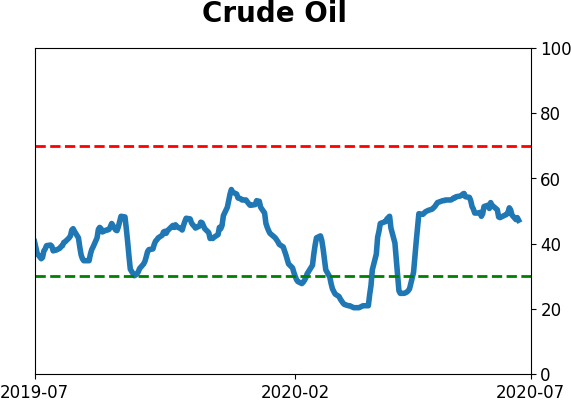
Crude Oil
|
|
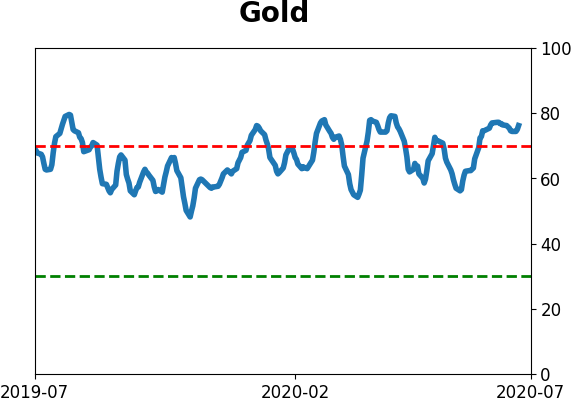
Gold

|
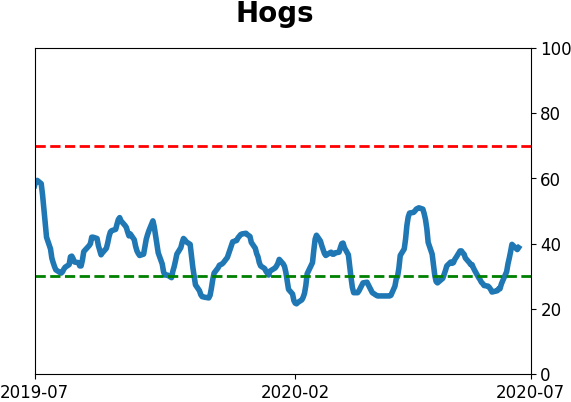
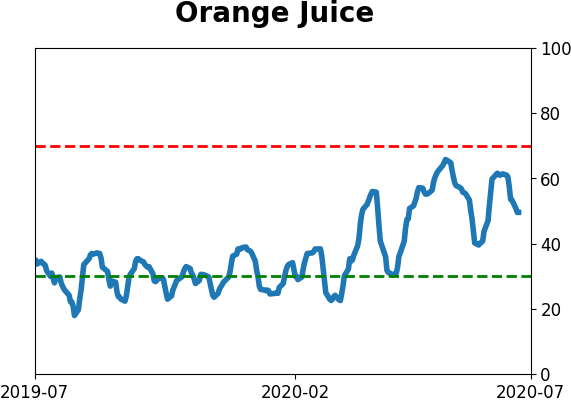
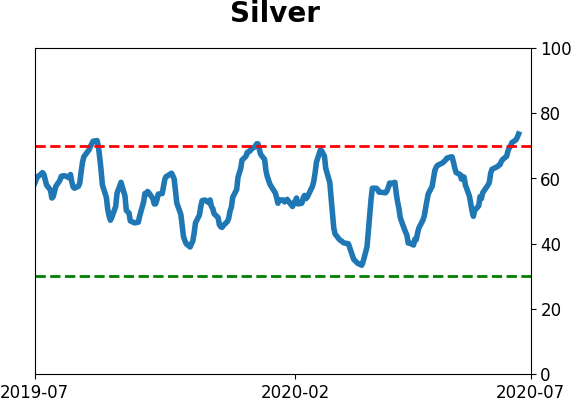
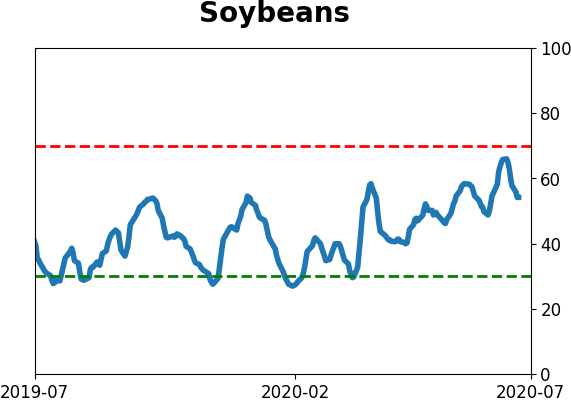
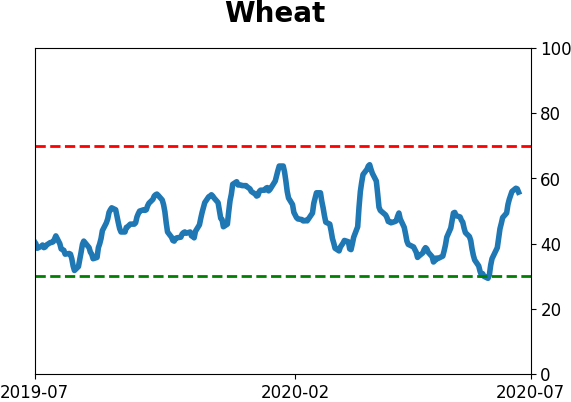
Agriculture
|
|
Research
BOTTOM LINE
Corporate insiders were heavy buyers in March. They've gradually tapered off from their buying and selling pressure has picked up. Depending on the source, the amount that selling has picked up ranges from a little bit to a huge amount.
FORECAST / TIMEFRAME
None
|
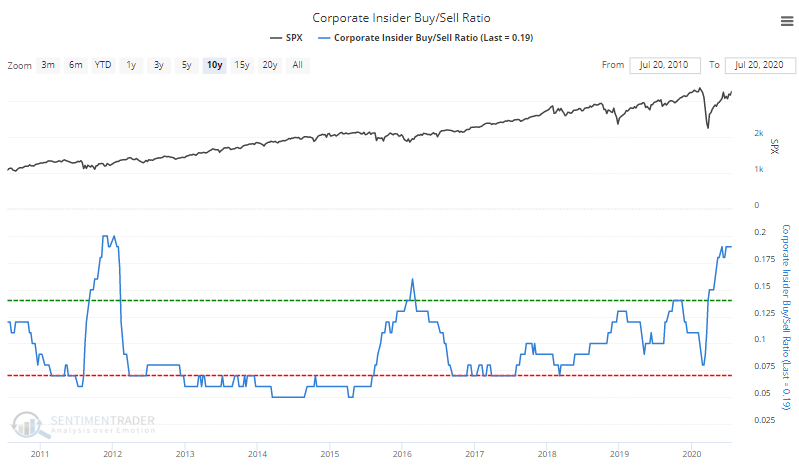
Smart-money corporate insiders were heavy buyers in March, the data is pretty clear on that. Now they're either still buying, or selling heavily, depending on the source.
Insider transactions are one of those areas of sentiment that typically takes some finessing. Transactions are dependent on a lot of factors, and take many forms, most of them unrelated to sentiment. We prefer to use only open market transactions tracked by Bloomberg. When viewed that way, the Corporate Insider Buy/Sell Ratio for stocks within the S&P 500 is still quite positive.
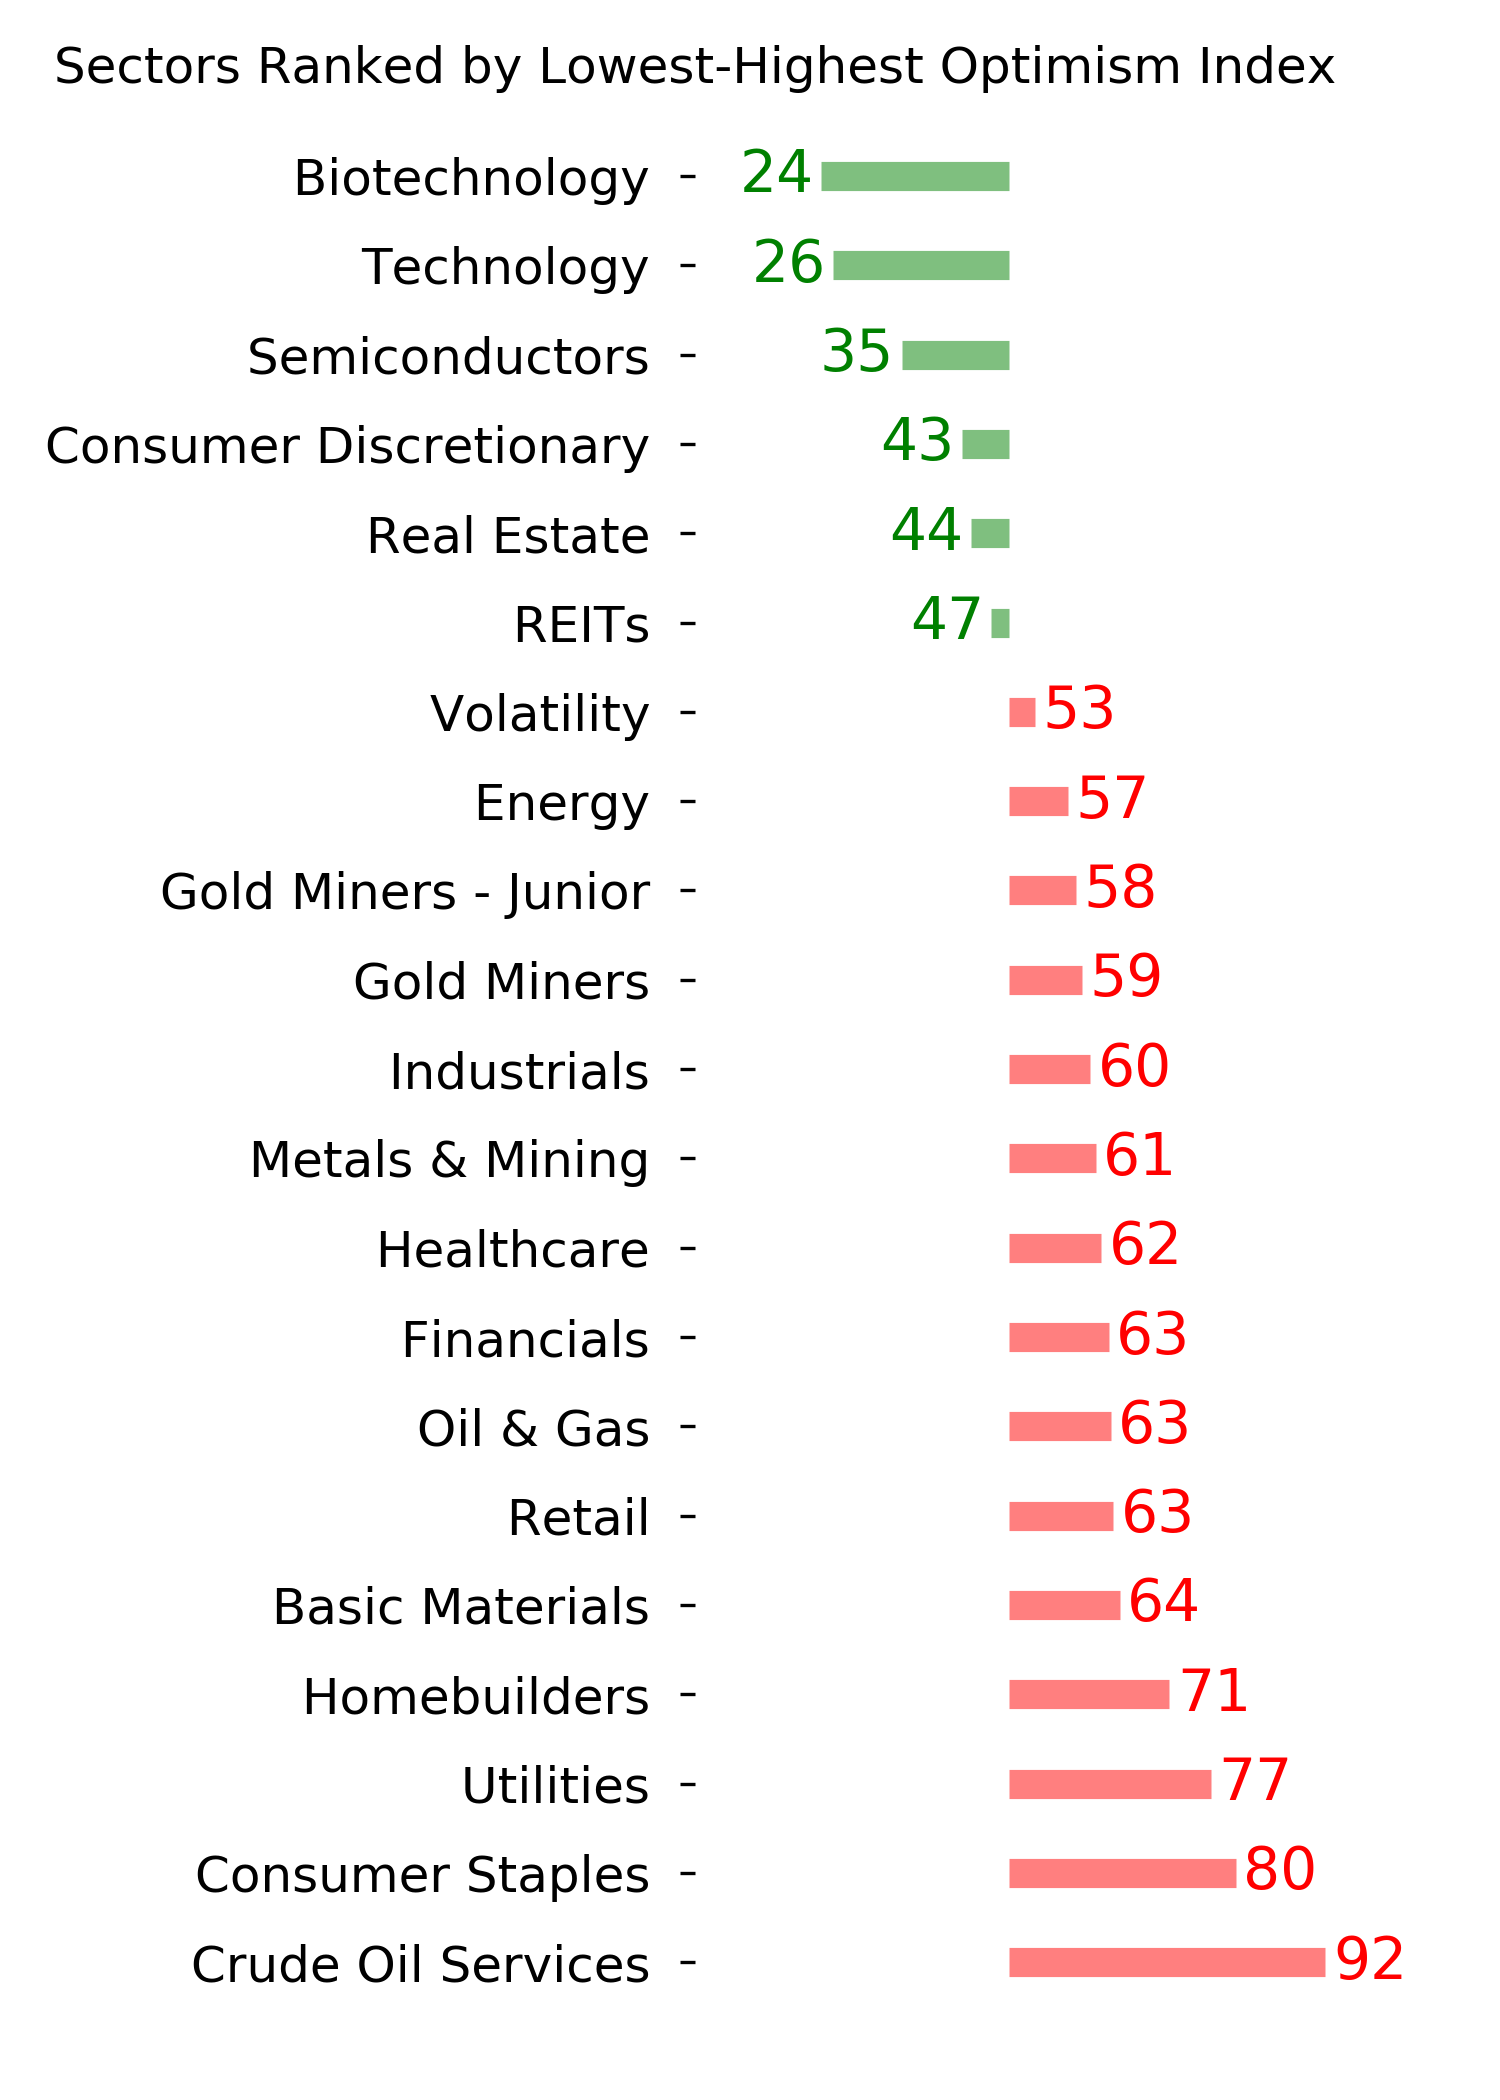
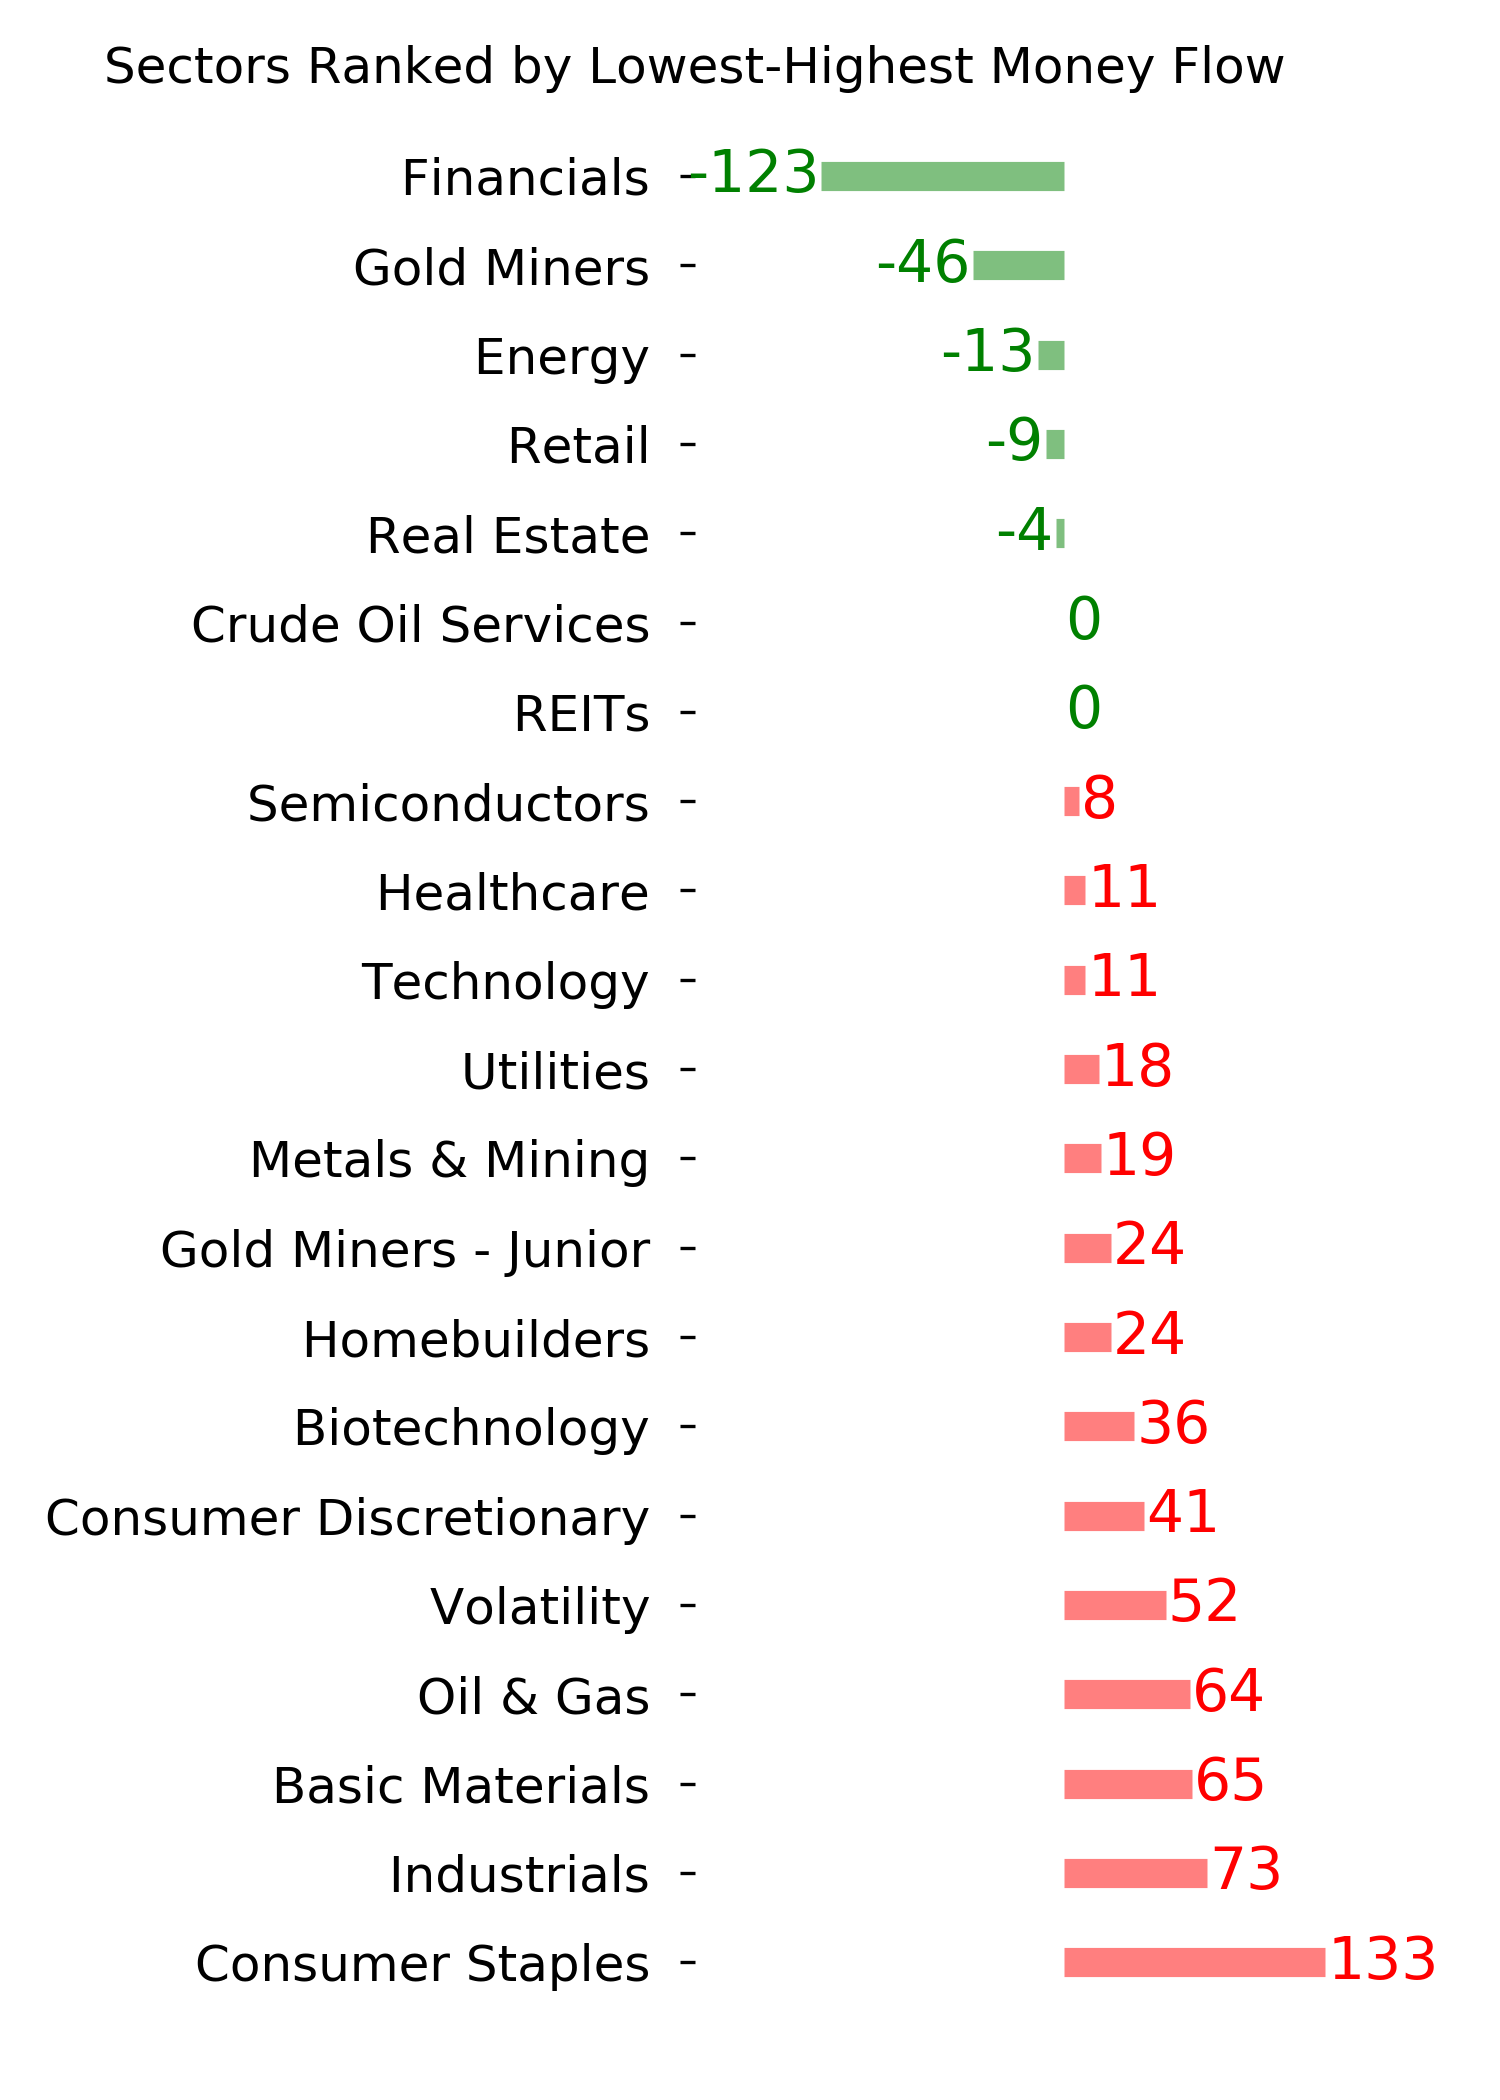
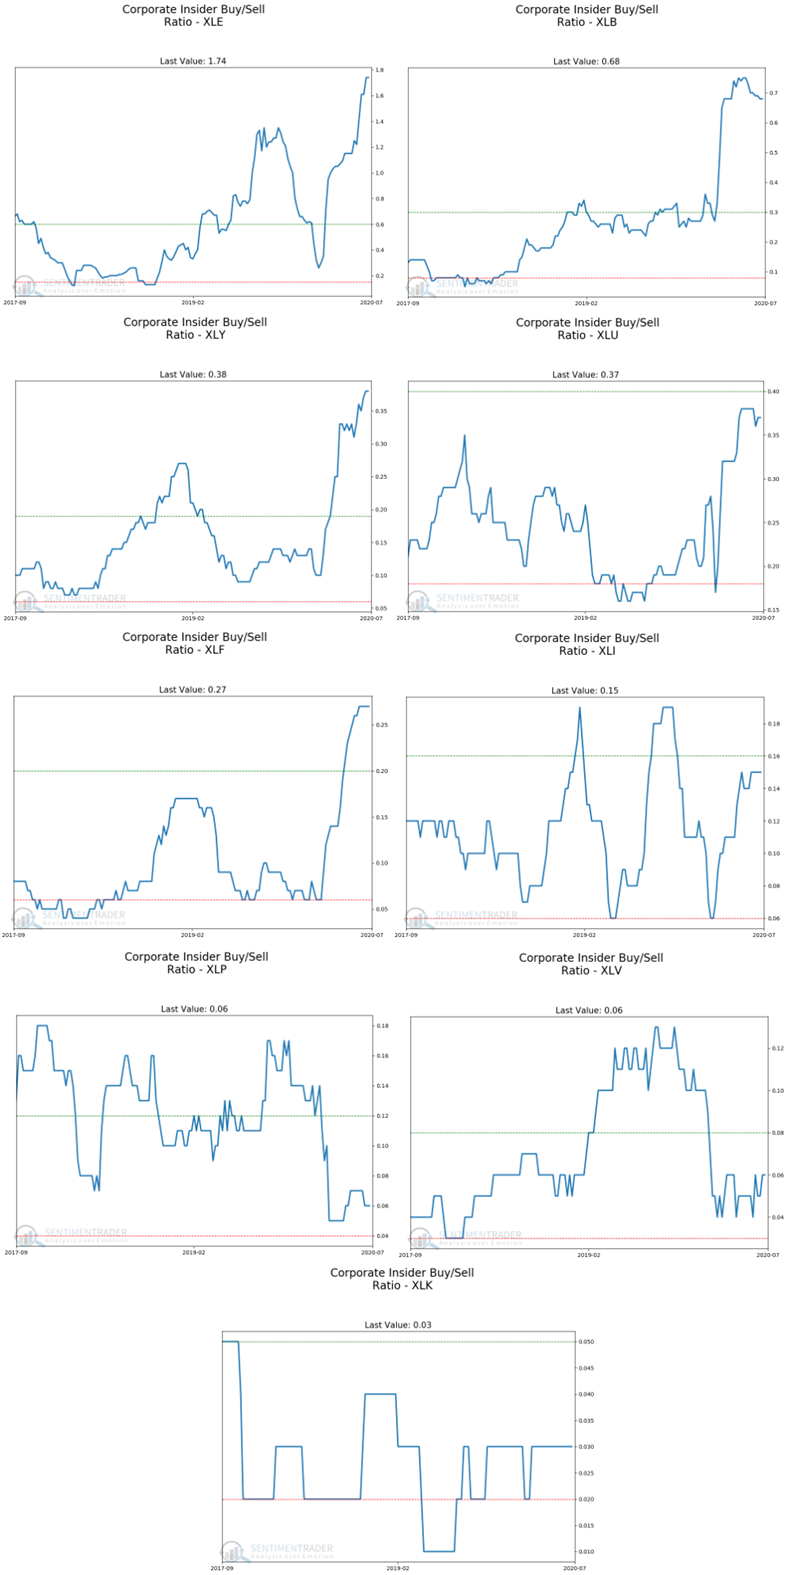
It's especially high for certain sectors like Energy.
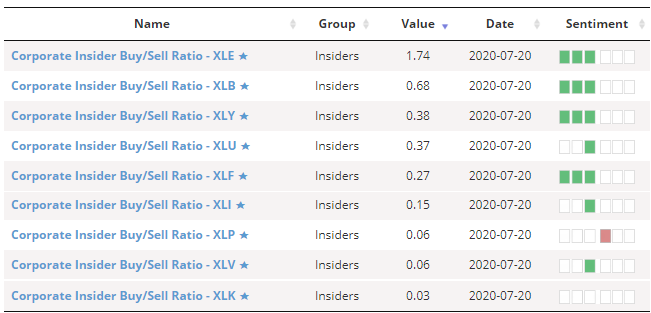
Below, we can see each of their ratios relative to the range over the past nine months.
When we look at the 4-week rate of change in insider buys minus insider sells for all S&P 500 stocks, they showed decade-high eagerness to buy in March and have since leveled off. Extremely eager buying was an excellent signal for future returns in the S&P 500; eager selling led to poor returns, at least over the short- to medium-term.
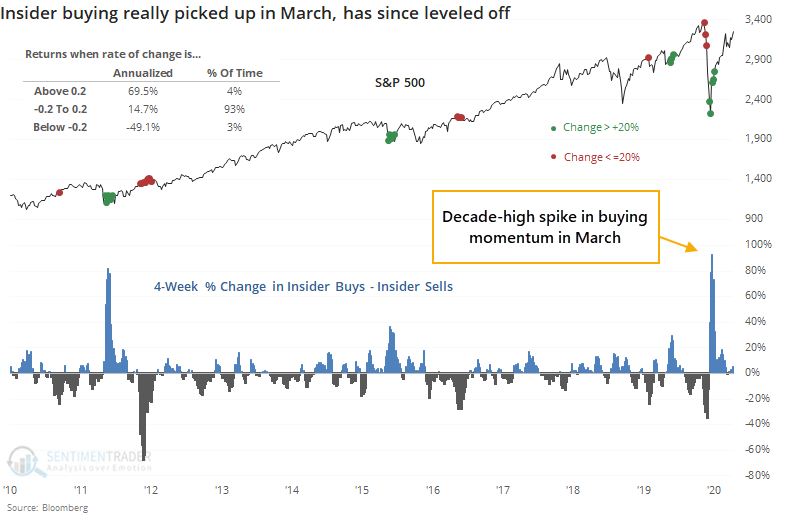
While buying interest among insiders has tailed off in recent weeks, it's still net positive. That's been a good sign for months and shows no looming signs of being a negative.
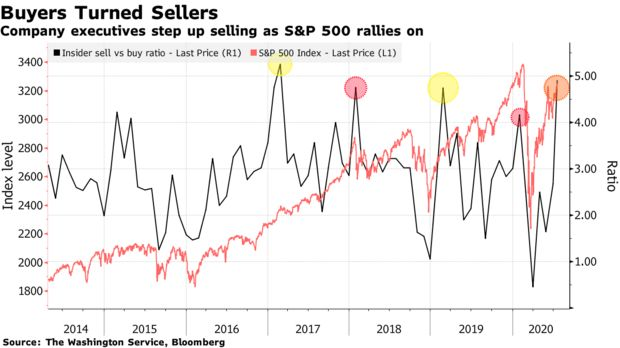
The only caveat is that other services are showing vastly different data. Bloomberg notes that according to the Washington Service, selling interest has picked up dramatically.
"Corporate insiders, whose buying correctly signaled the bottom in March, are now mostly sellers. Almost 1,000 corporate executives and officers have unloaded shares of their own companies this month, outpacing insider buyers by a ratio of 5-to-1, data compiled by the Washington Service showed. Only twice in the past three decades has the sell-buy ratio been higher than now."
Other times it got this high were mostly negative for stocks.
Parsing signal from noise in insider data takes specialized knowledge and good experience. There are dozens of services that focus on this data - most of them are decent, and most of them confirm what the others are saying. Unfortunately, the best ones are also only reserved for institutions, but it's not necessarily required to get a general handle on how corporate insiders are feeling about their stocks.
Right now, it's a confusing mix because various data providers aren't confirming each other as much as they usually do. About the best (or worst) we could say about these smart money transactions right now is that they've trailed off quite a bit from the buying binge in March. That might be enough to be a short- to medium-term headwind, but the massive buying this spring should continue to be a longer-term positive.
BOTTOM LINE
As the S&P 500 has climbed toward its prior highs, more than 25% of its stocks are underperforming the index by more than 10% during the past few months. That's a figure that's more typically seen during bear markets.
FORECAST / TIMEFRAME
SPY -- Down, Short-Term
|
We saw on Wednesday that the Cumulative Advance/Decline Line has broken out to a new high. The stocks-only line, however, is still lagging.
As noted by The Daily Shot, the percentage of stocks trailing the index by more than 10% has spiked. While we have different data sources and likely a different methodology, we can see that this is the case.
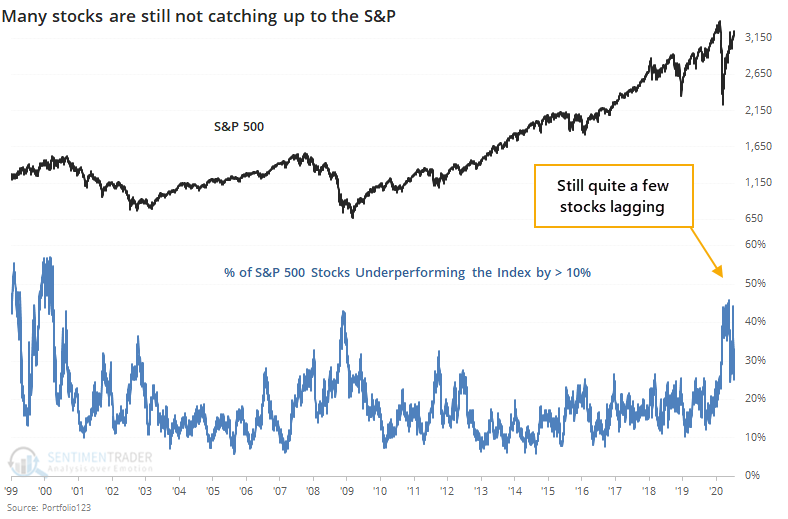
The chart shows the percentage of stocks within the S&P 500 that are trailing the index's returns by 10% or more over the past 13 weeks. It's not unusual to see this figure jump during bear markets, which it did during the pandemic, but it is relatively unusual to see so many stocks continue to lag the index by so much when the index has climbed close to its prior highs.
The table below shows every date since 1999 when the S&P was within 3.5% of its 52-week high and yet more than a quarter of its component stocks were trailing the index by double-digits.
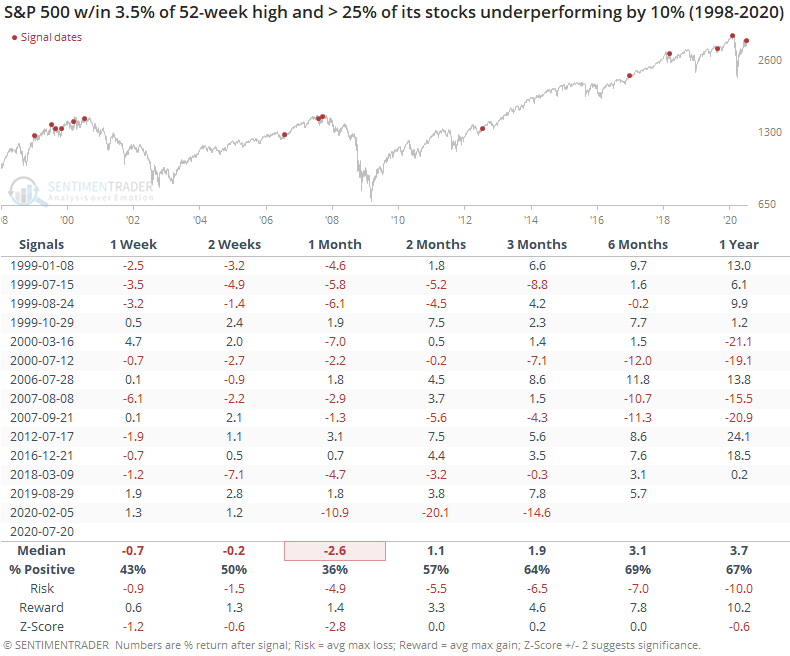
Forward returns over the shorter-term were poor, with a very negative risk/reward skew during the next month. Even up to three months later, the risk/reward was more heavily tilted toward "risk".
We'd rate this as a modest shorter-term negative here.
Active Studies
| Time Frame | Bullish | Bearish | | Short-Term | 0 | 1 | | Medium-Term | 8 | 10 | | Long-Term | 44 | 1 |
|
Indicators at Extremes
Portfolio
| Position | Weight % | Added / Reduced | Date | | Stocks | 29.8 | Reduced 9.1% | 2020-06-11 | | Bonds | 0.0 | Reduced 6.7% | 2020-02-28 | | Commodities | 5.2 | Added 2.4%
| 2020-02-28 | | Precious Metals | 0.0 | Reduced 3.6% | 2020-02-28 | | Special Situations | 0.0 | Reduced 31.9% | 2020-03-17 | | Cash | 65.0 | | |
|
Updates (Changes made today are underlined)
In the first months of the year, we saw manic trading activity. From big jumps in specific stocks to historic highs in retail trading activity to record highs in household confidence to almost unbelievable confidence among options traders. All of that came amid a market where the average stock couldn't keep up with their indexes. There were signs of waning momentum in stocks underlying the major averages, which started triggering technical warning signs in late January. After stocks bottomed on the 23rd, they enjoyed a historic buying thrust and retraced a larger amount of the decline than "just a bear market rally" tends to. Those thrusts are the most encouraging sign we've seen in years. Through early June, we were still seeing thrusts that have led to recoveries in longer-term breadth metrics. The longer-term prospects for stocks (6-12 months) still look decent given the above. On a short- to medium-term basis, it was getting harder to make that case. Dumb Money Confidence spiked and there were multiple signs of a historic level of speculation. This is likely the lowest I will go given what I still consider to be compelling positives over a longer time frame. There is not a slam-dunk case to be made for either direction, so it will seem like a mistake whether stocks keep dropping (why didn't I sell more?) or if they turn and head higher (why did I let short-term concerns prevail?). After nearly three decades of trading, I've learned to let go of the idea of perfection.
RETURN YTD: -4.1% 2019: 12.6%, 2018: 0.6%, 2017: 3.8%, 2016: 17.1%, 2015: 9.2%, 2014: 14.5%, 2013: 2.2%, 2012: 10.8%, 2011: 16.5%, 2010: 15.3%, 2009: 23.9%, 2008: 16.2%, 2007: 7.8%
|
|
Phase Table
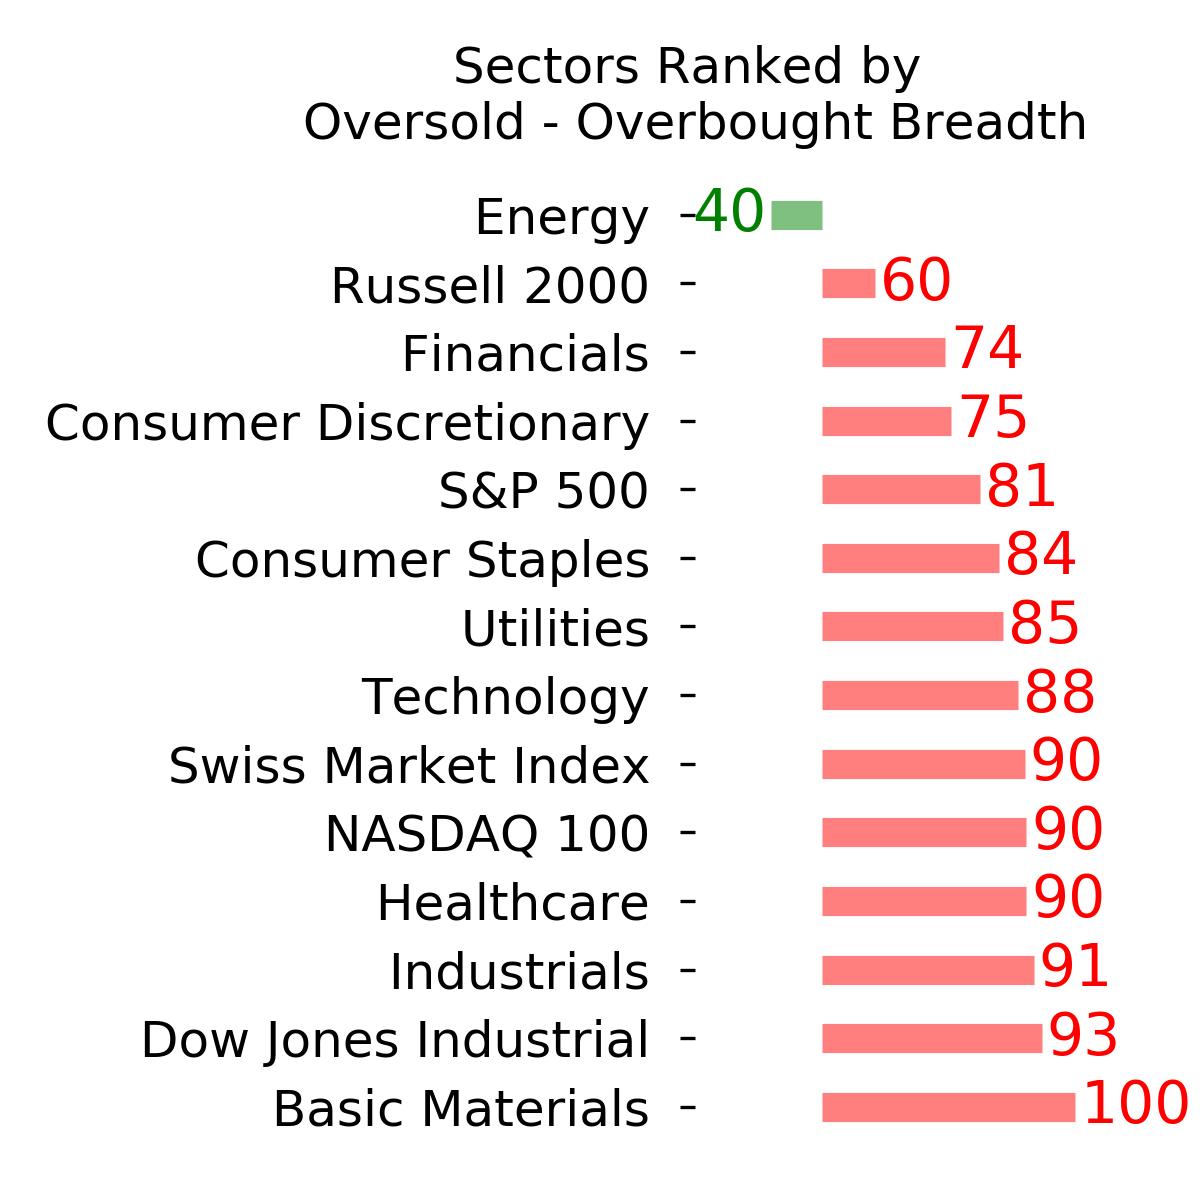
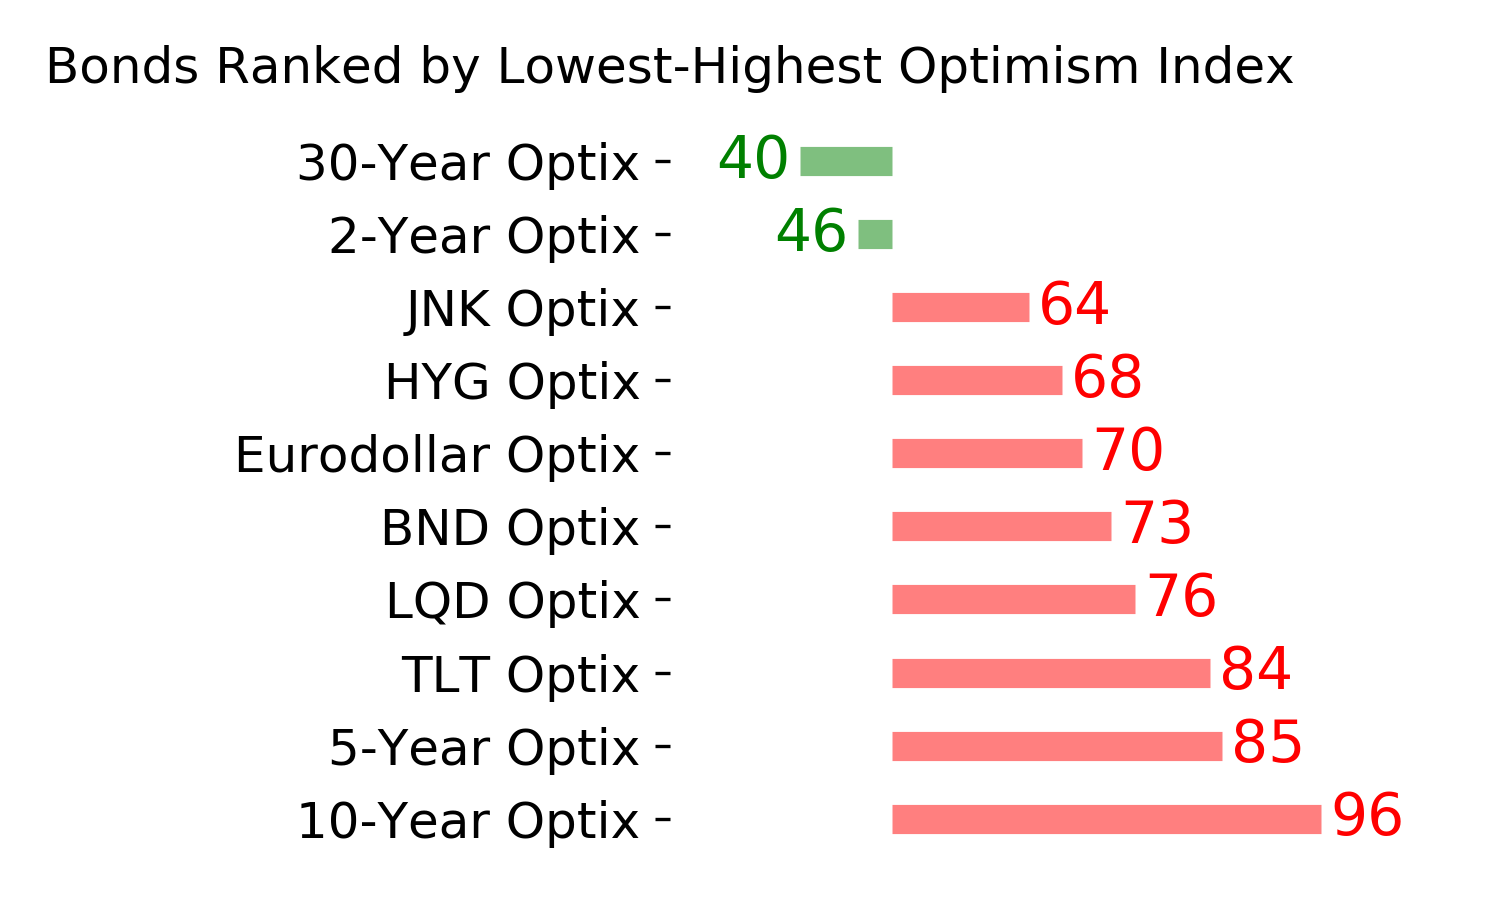
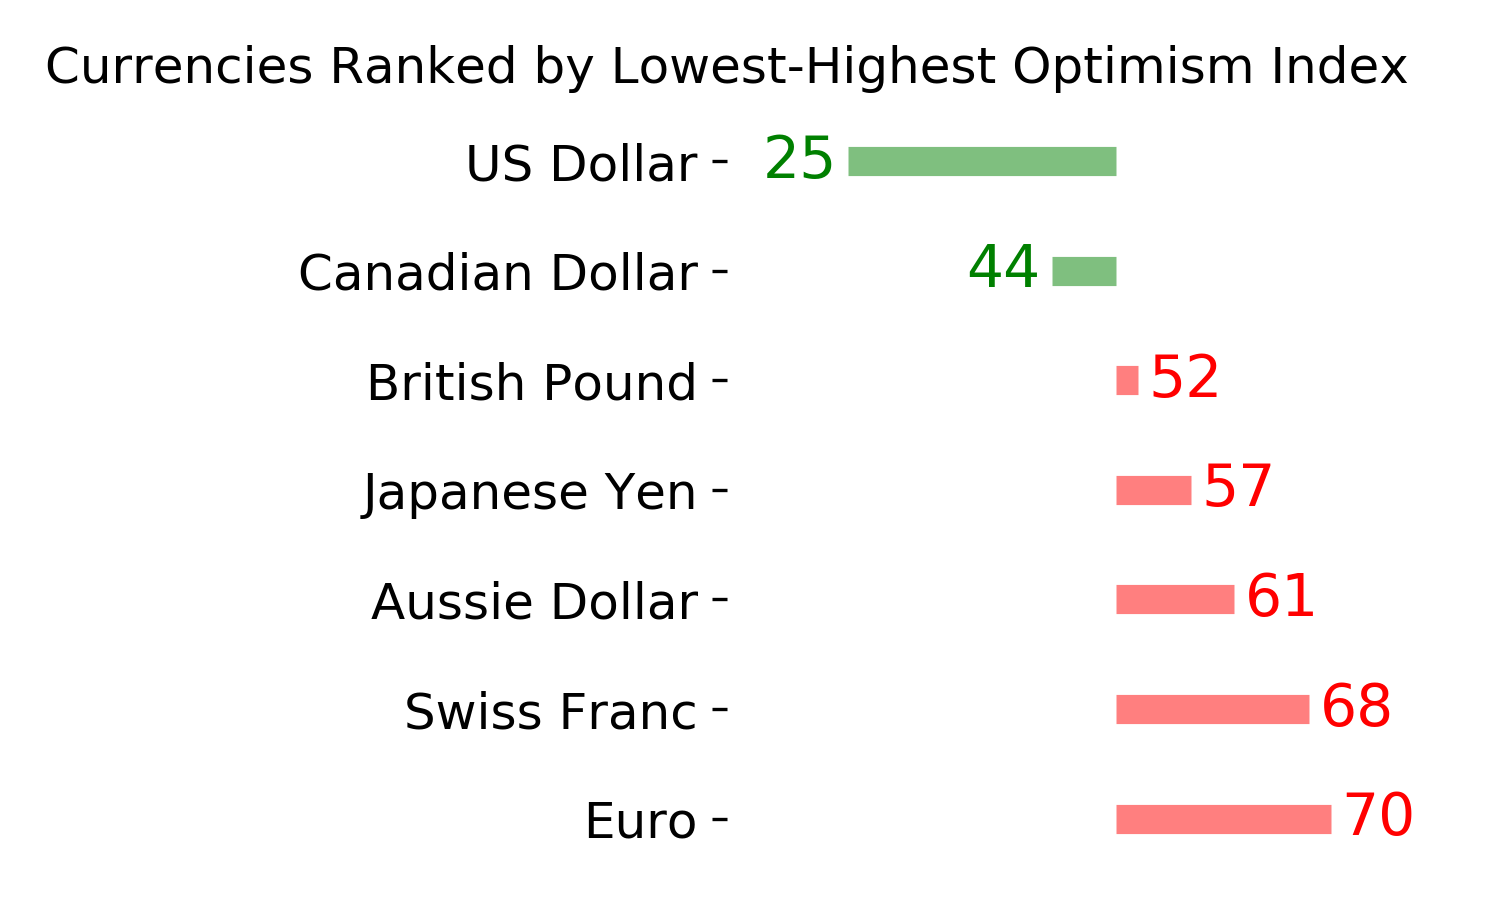
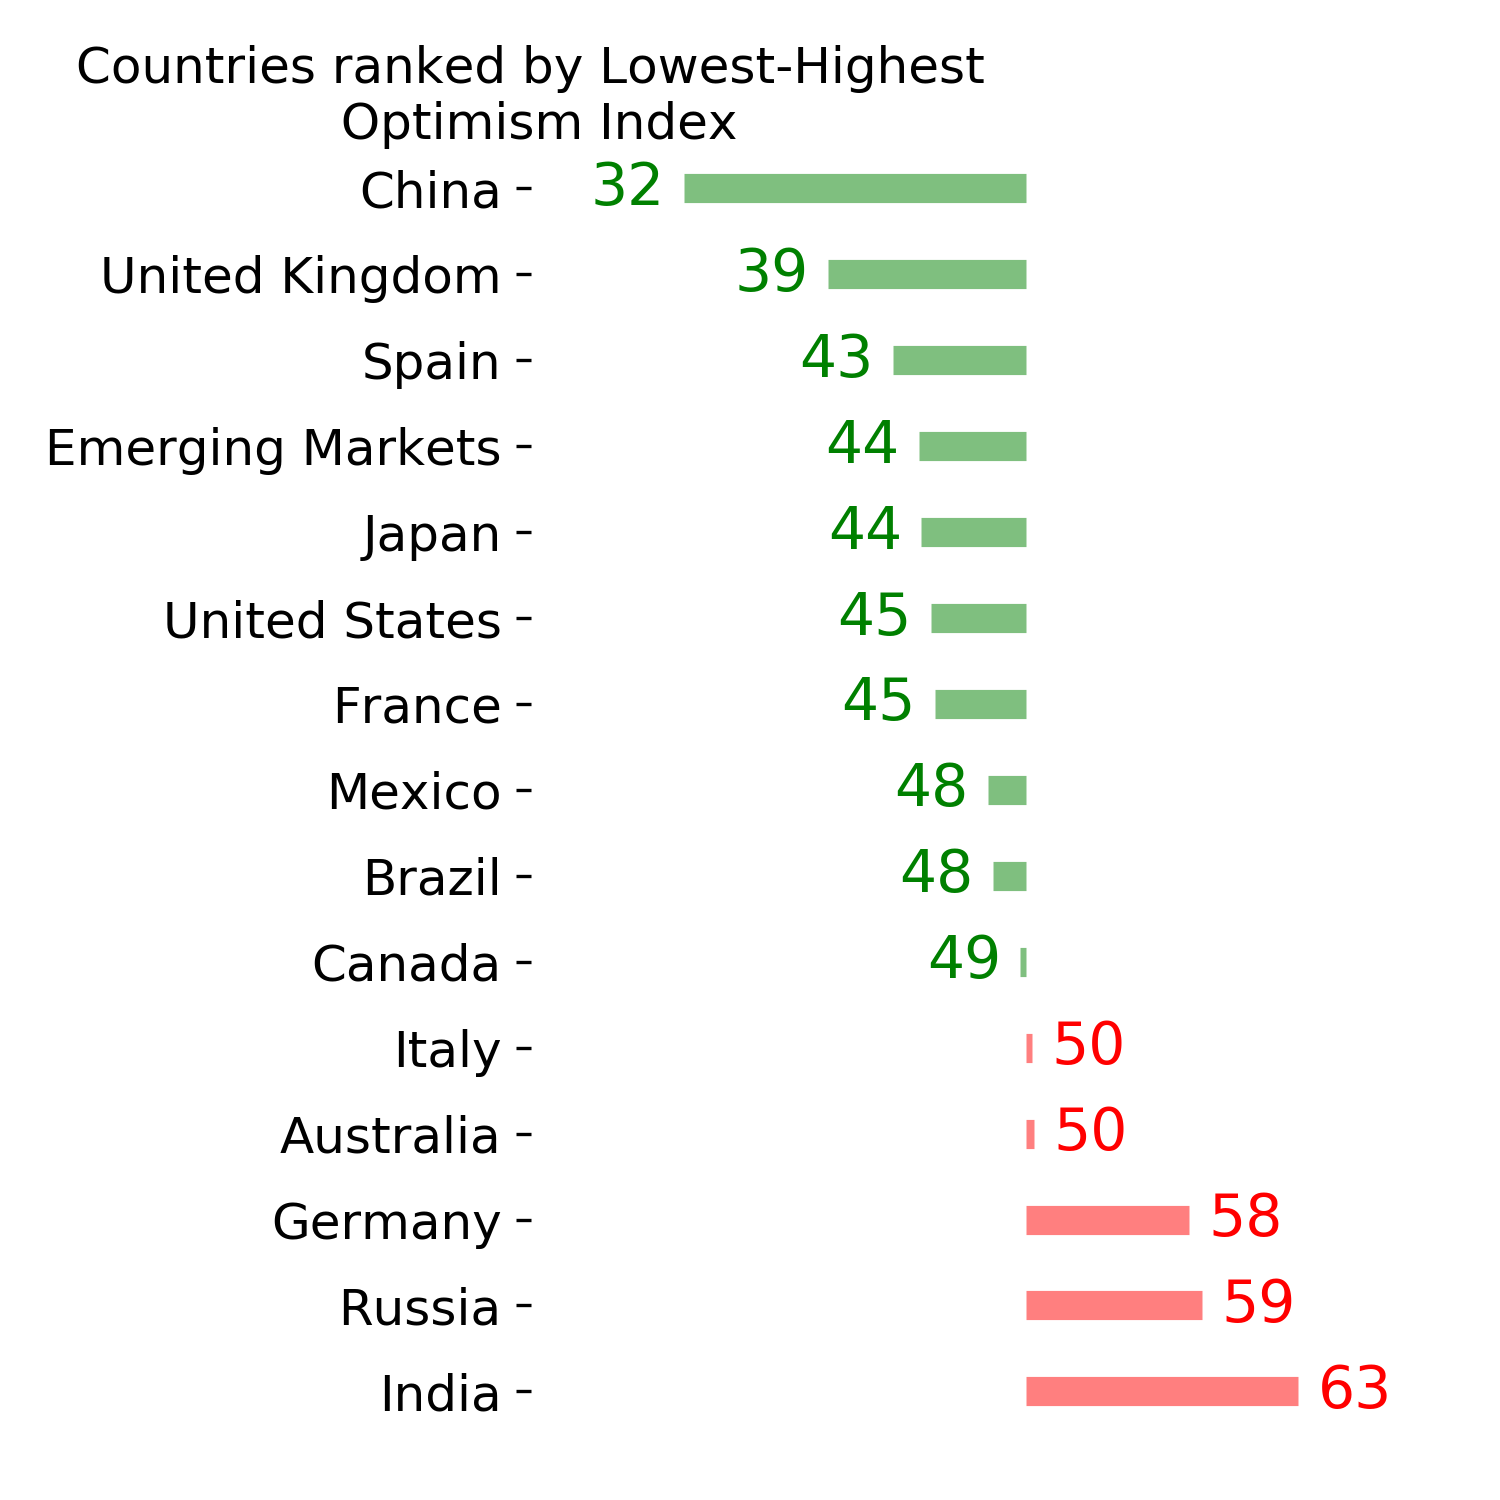
Ranks
Sentiment Around The World
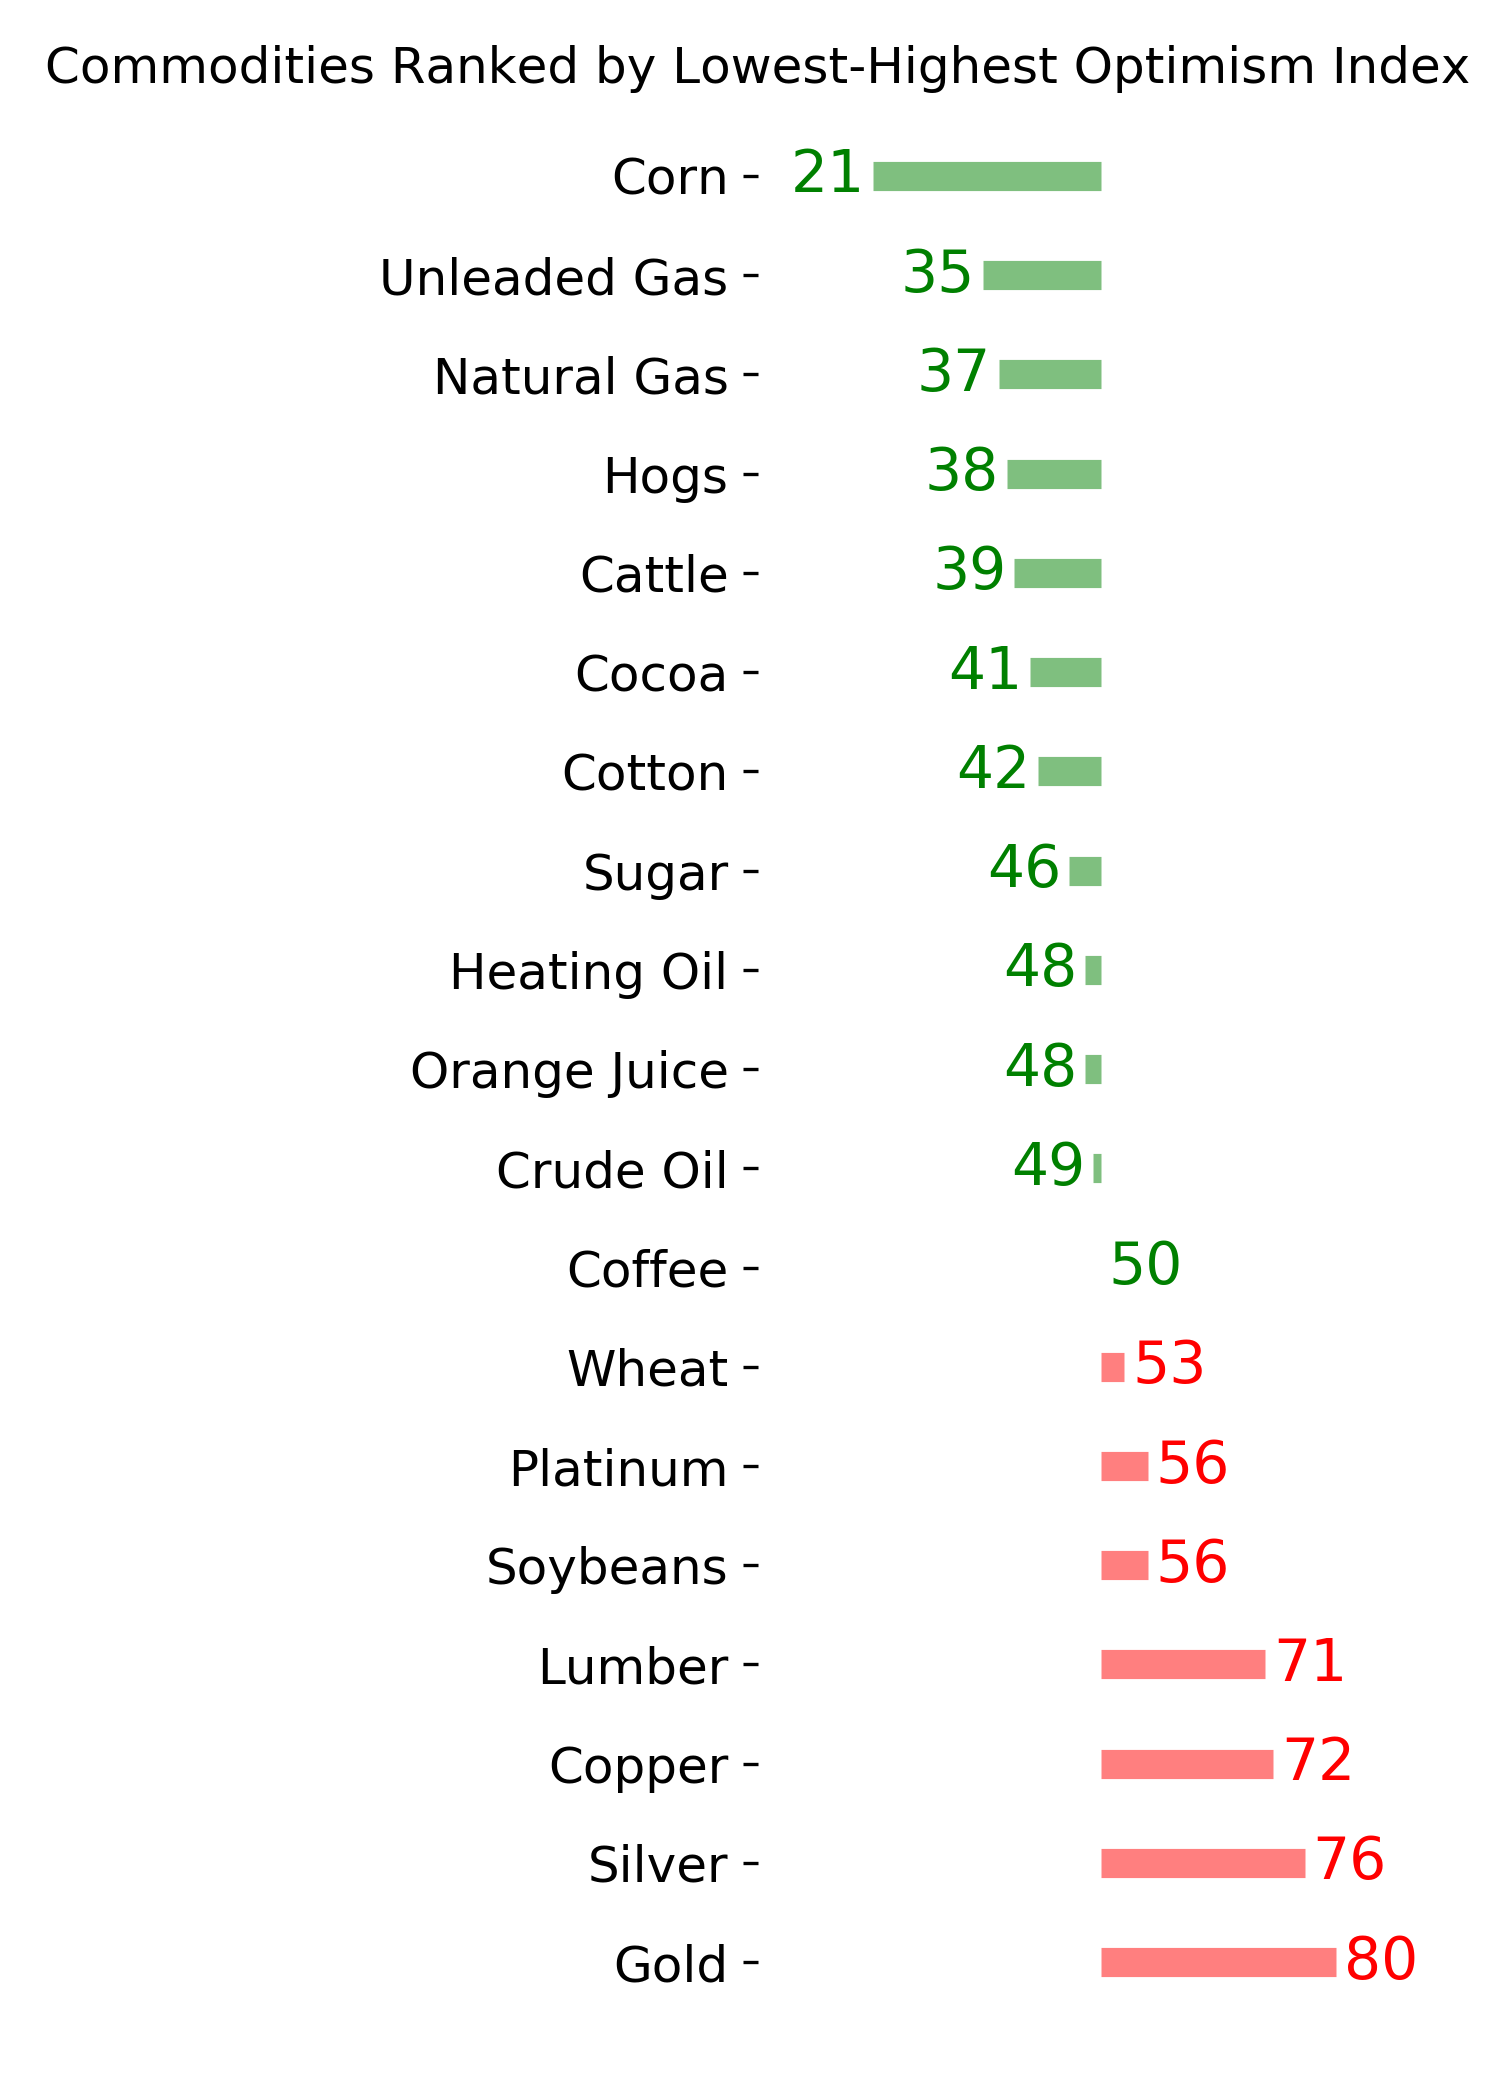
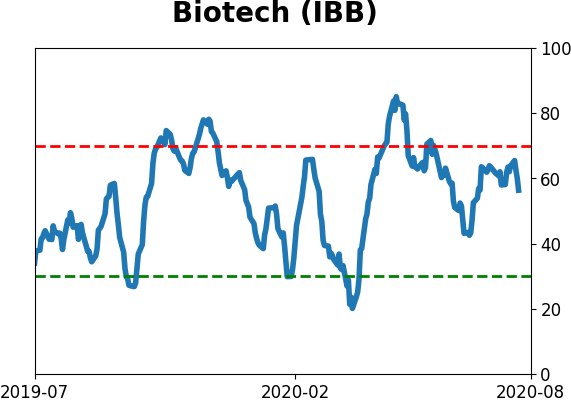
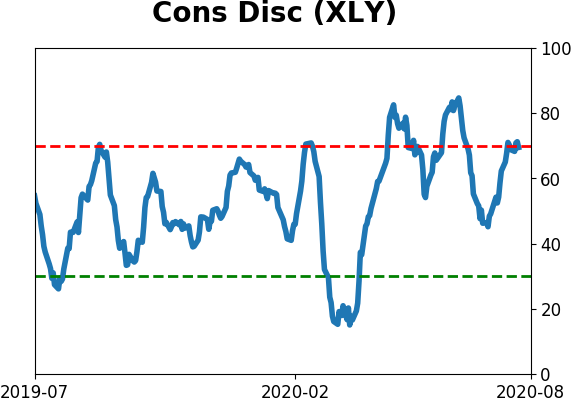
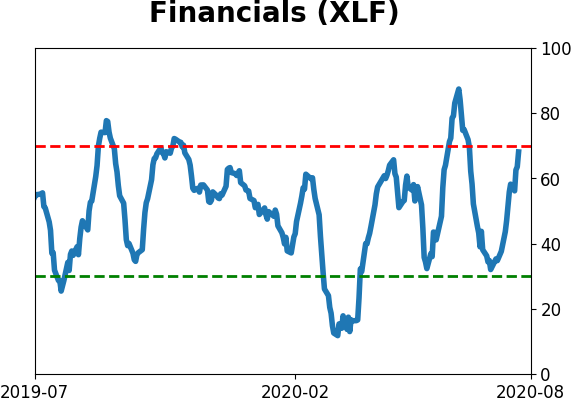
Optimism Index Thumbnails
|
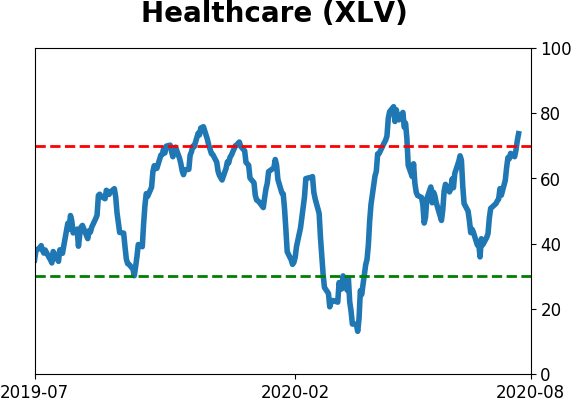
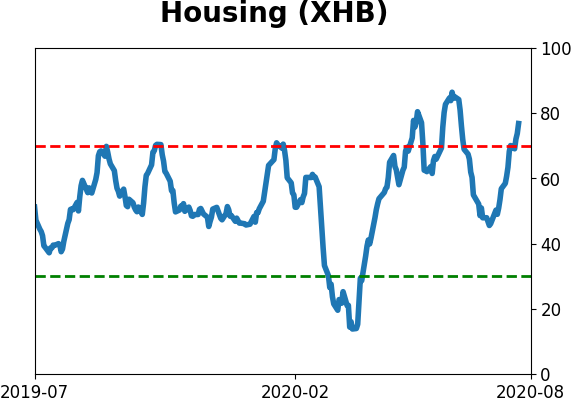
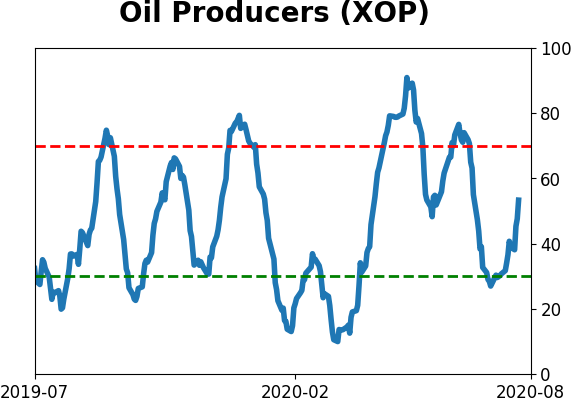
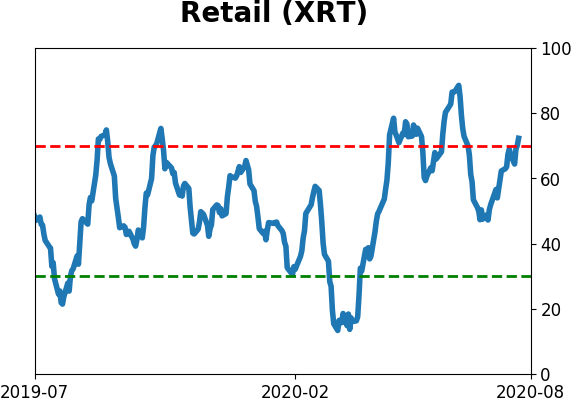
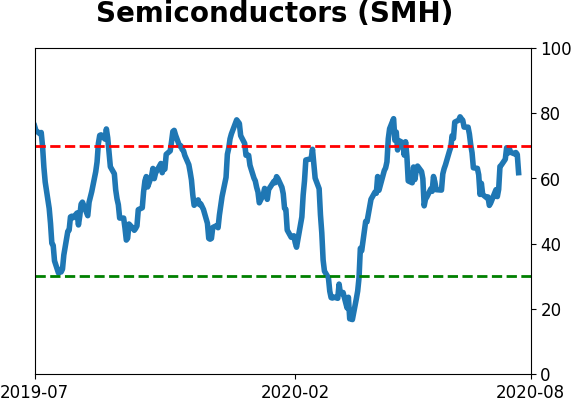
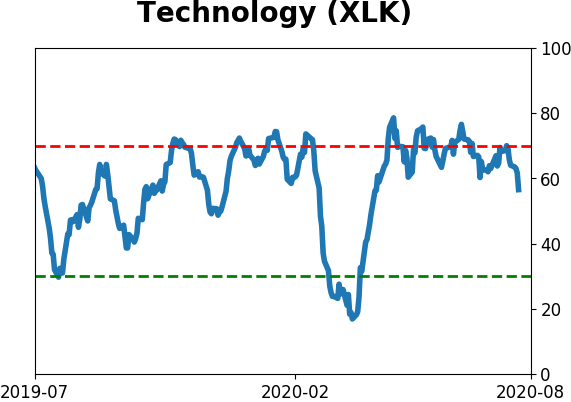
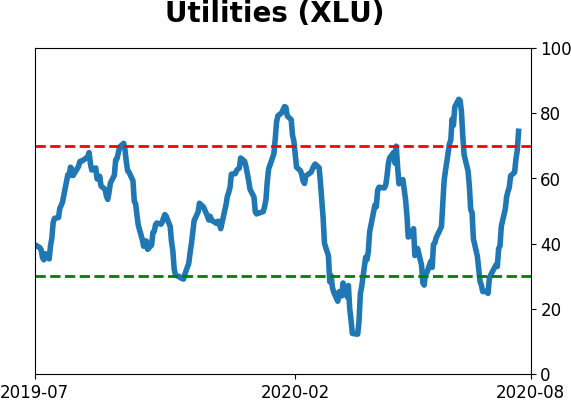
Sector ETF's - 10-Day Moving Average
|
|
|
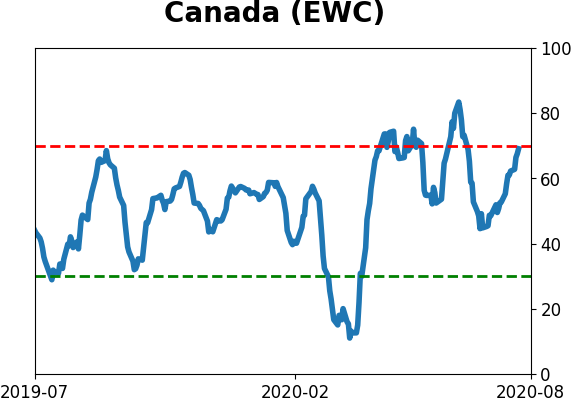
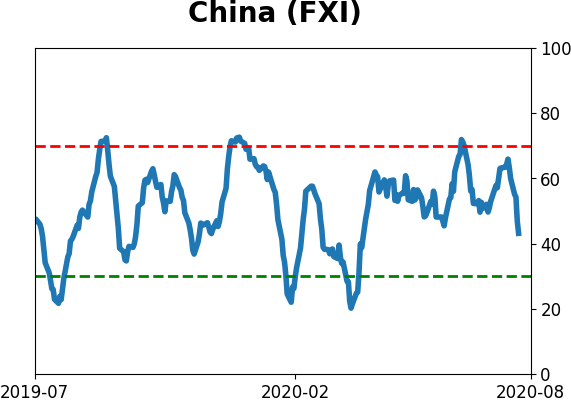
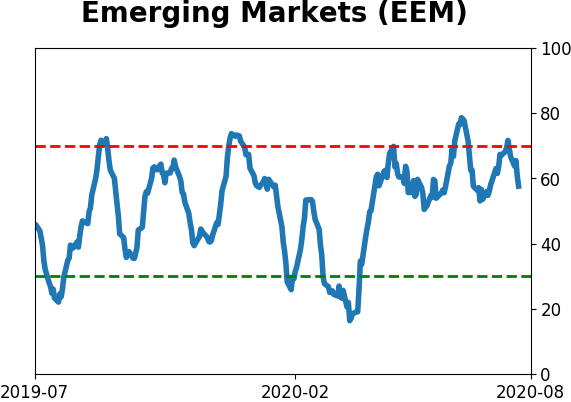
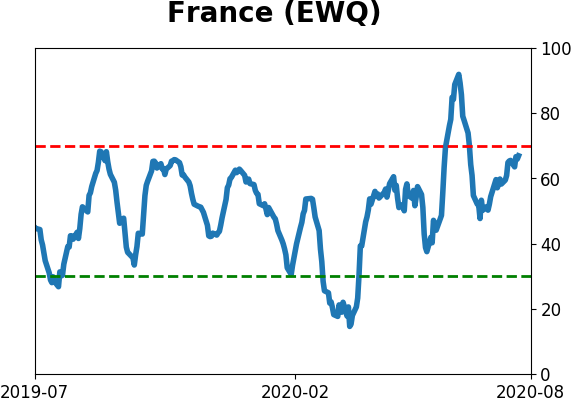
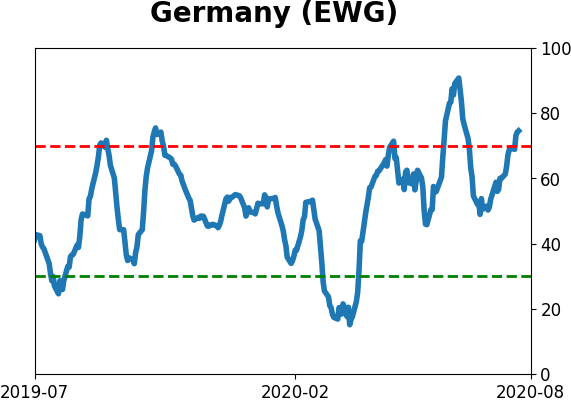
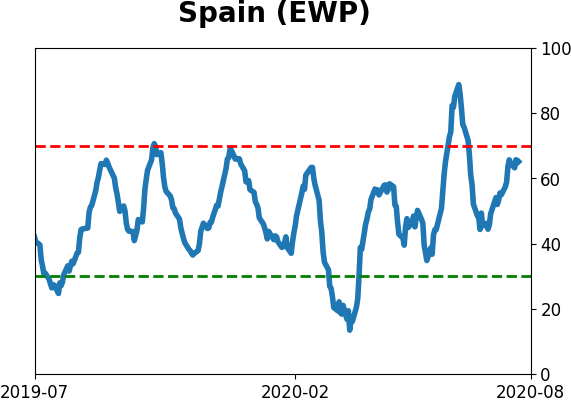
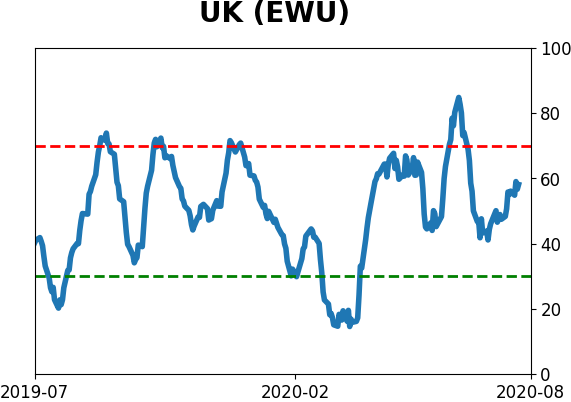
Country ETF's - 10-Day Moving Average
|
|
|
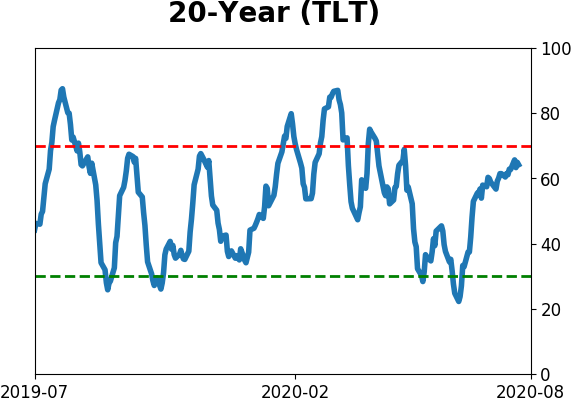
Bond ETF's - 10-Day Moving Average
|
|
|
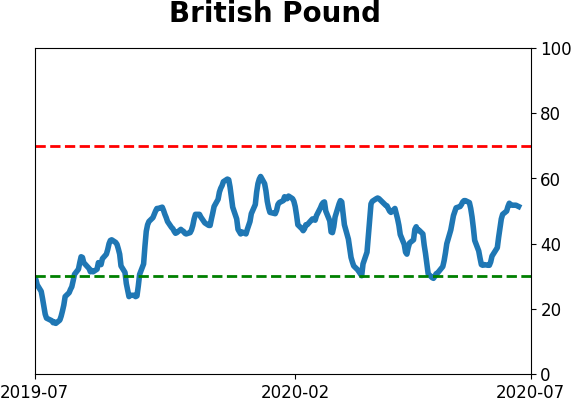
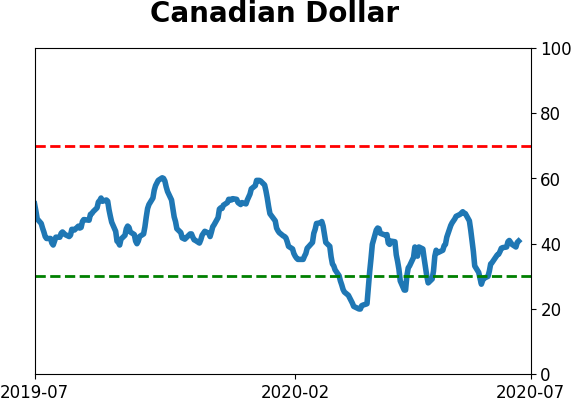
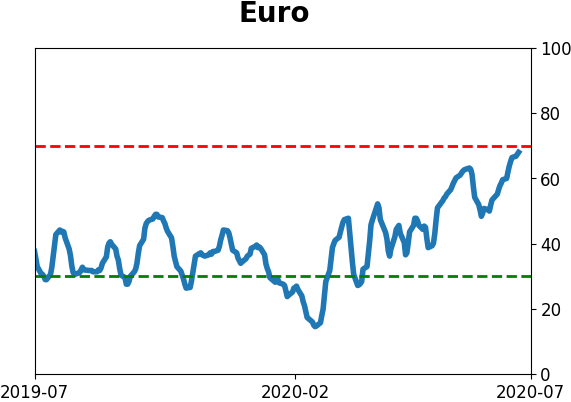
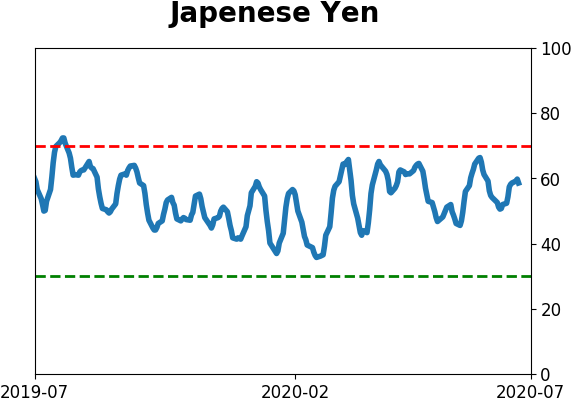
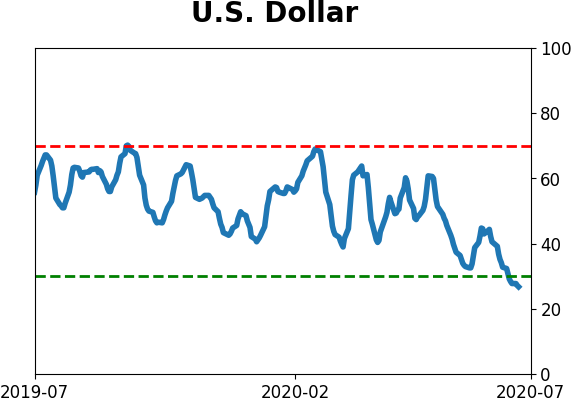
Currency ETF's - 5-Day Moving Average
|
|
|
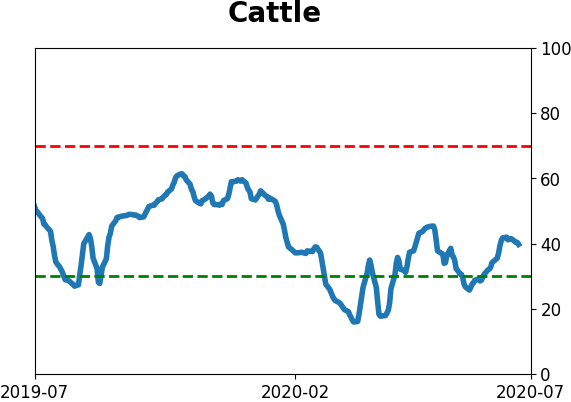
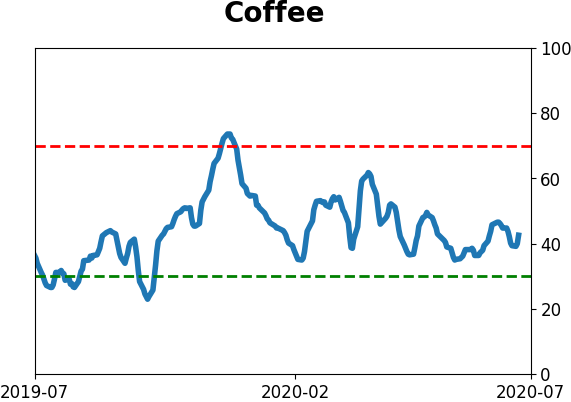
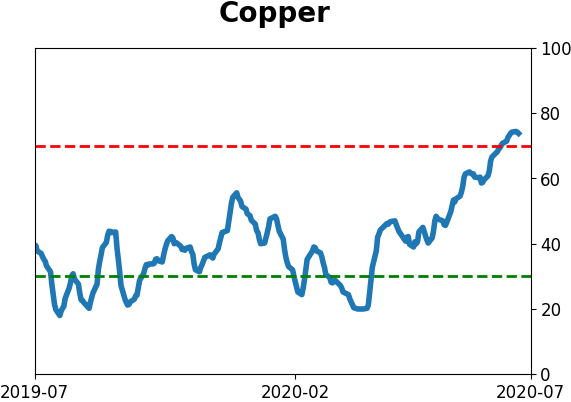
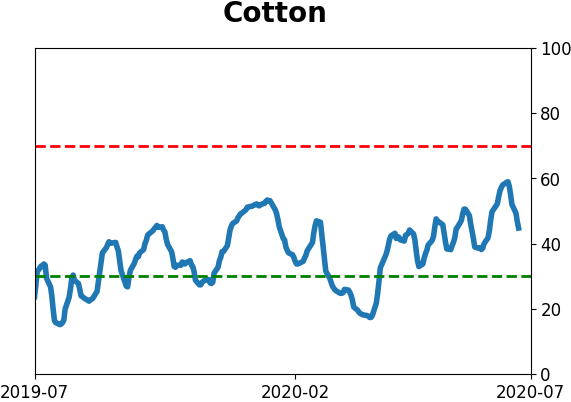
Commodity ETF's - 5-Day Moving Average
|
|