Headlines
|
|
Top 5 stocks mask some underlying issues:
The top 5 stocks in the S&P 500 are holding the most weight in the index since 1979, which has helped to mask some underlying weakness in the breadth of the index. On Monday, the index rose the most ever given how many more declining than advancing stocks were in the index.
Foreign buyers come back in a historic way:
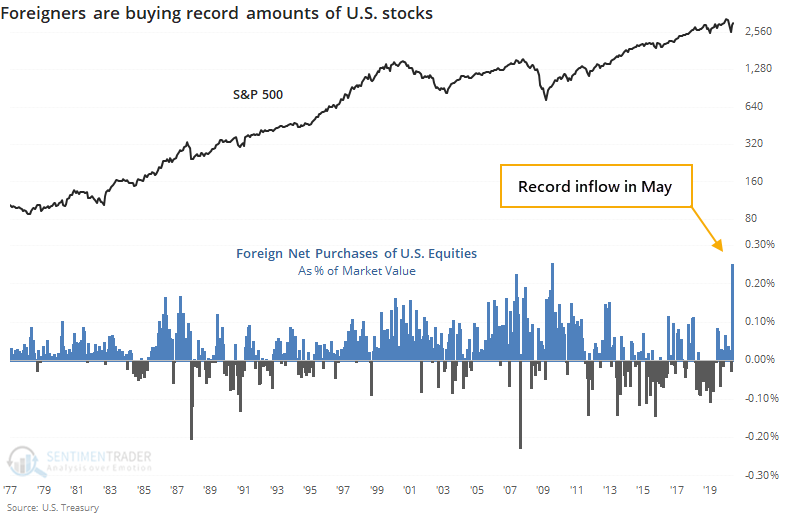
Foreign buyers bought a record amount of U.S. stocks in May, accounting for more than 0.25% of total market capitalization. Historically, big flows by these entities have been a modest contrary indicator, suggesting that this optimism is a slight negative going forward.
Breadth breakout: The Cumulative Advance/Decline Line for the NYSE has hit a new high, even while the S&P 500 is more than 3.5% below its own high. While this is considered a positive development, and it mostly is, it's not an automatic buy signal. We'll see on Wednesday that when this triggered over the past 80 years, it took a median of more than 80 days before the S&P finally closed at its own new high.
Bottom Line:
|
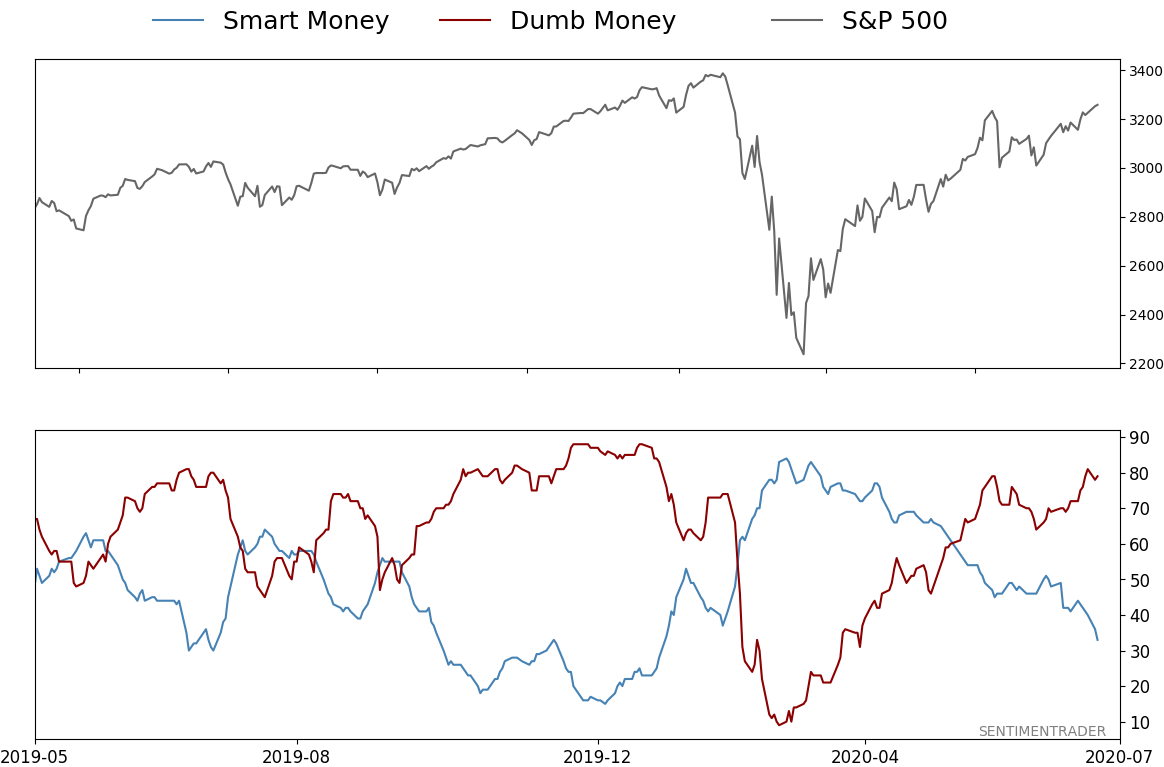
Smart / Dumb Money Confidence
|
Smart Money Confidence: 33%
Dumb Money Confidence: 79%
|
|
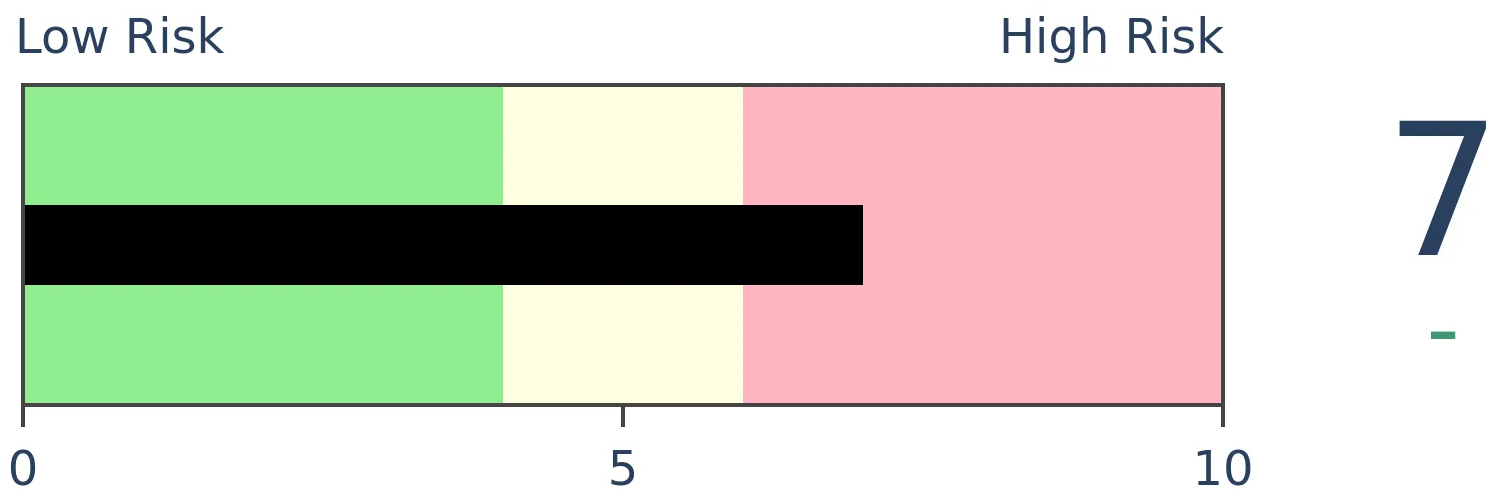
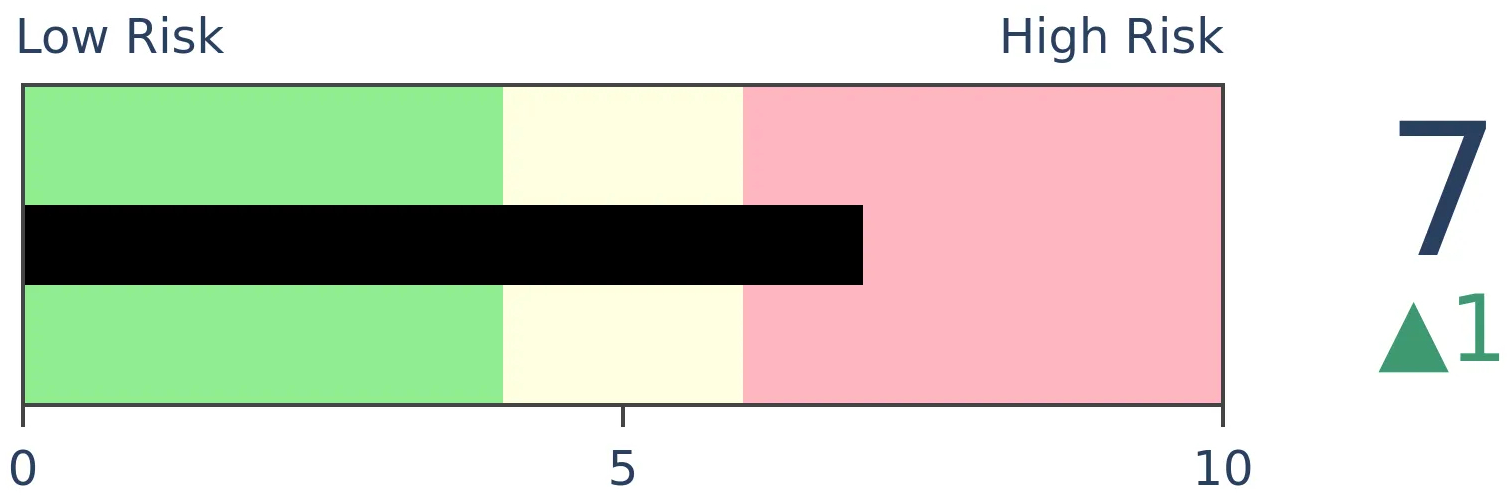
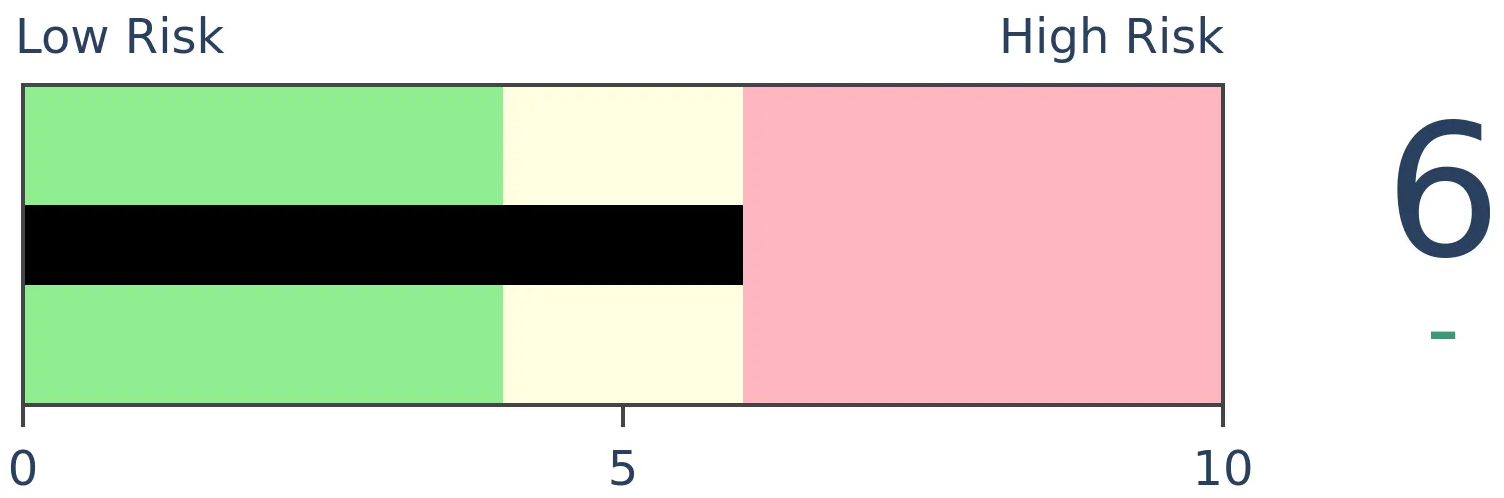
Risk Levels
Stocks Short-Term
|
Stocks Medium-Term

|
|
Bonds

|
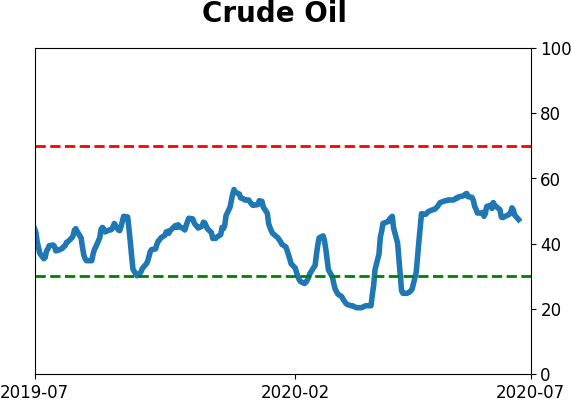
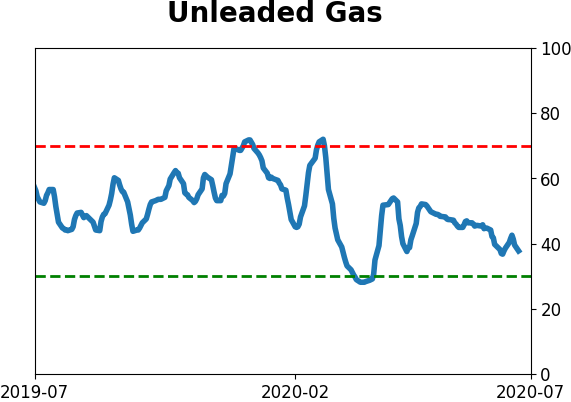
Crude Oil
|
|
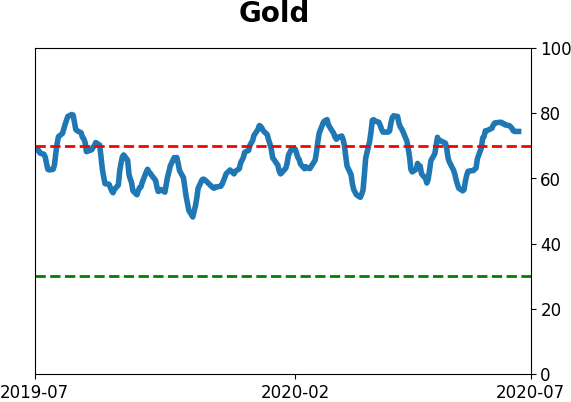
Gold
|
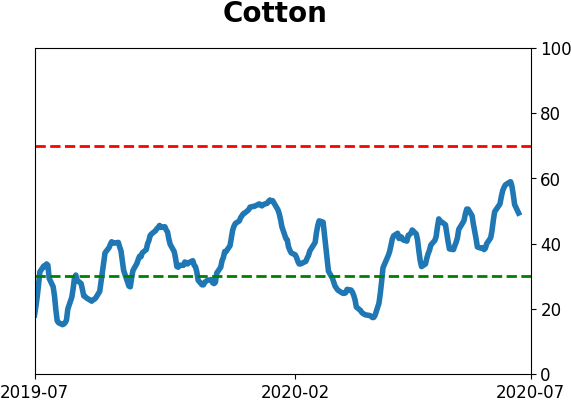
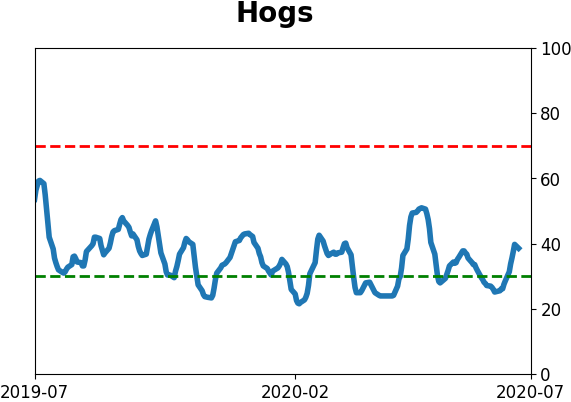
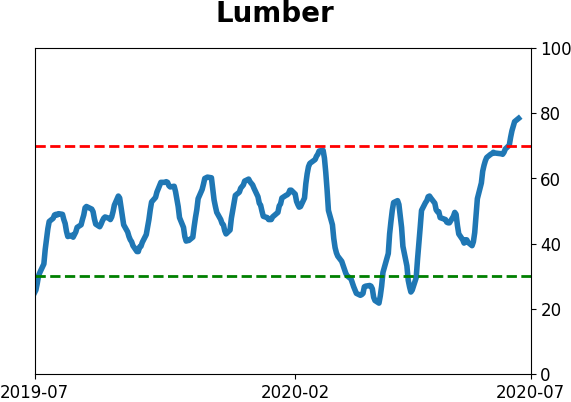
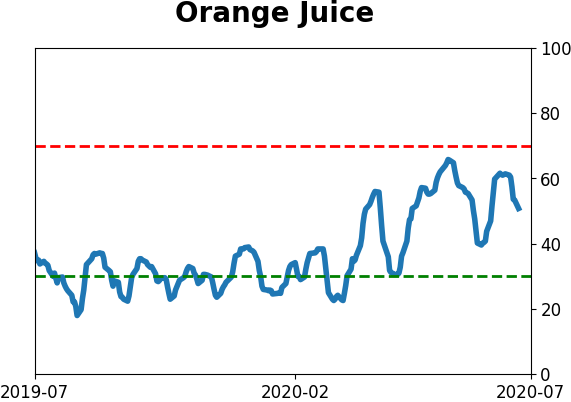
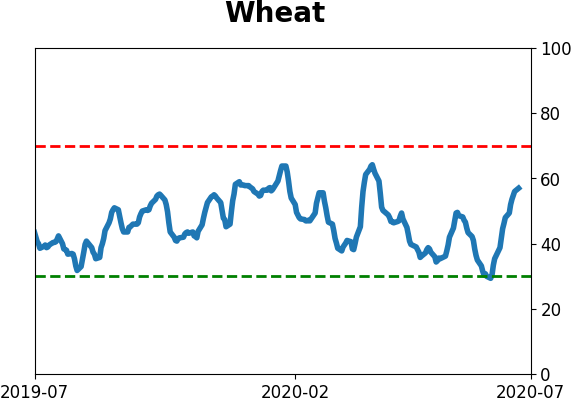
Agriculture

|
|
Research
BOTTOM LINE
The top 5 stocks in the S&P 500 are holding the most weight in the index since 1979, which has helped to mask some underlying weakness in the breadth of the index. On Monday, the index rose the most ever given how many more declining than advancing stocks were in the index.
FORECAST / TIMEFRAME
SPY -- Down, Medium-Term
|
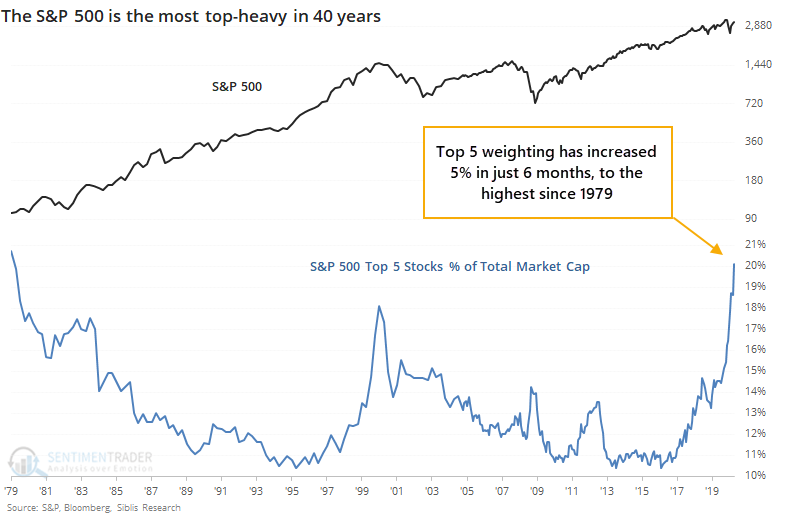
Thanks to the big tech stocks that we're all so familiar with, the most important equity index in the world has become historically top-heavy.
For the first time since 1979, only 5 stocks account for more than 20% of the S&P's market cap. Back then, it was IBM and AT&T with more than 6% weight each, followed by GM, GE, and Kodak.
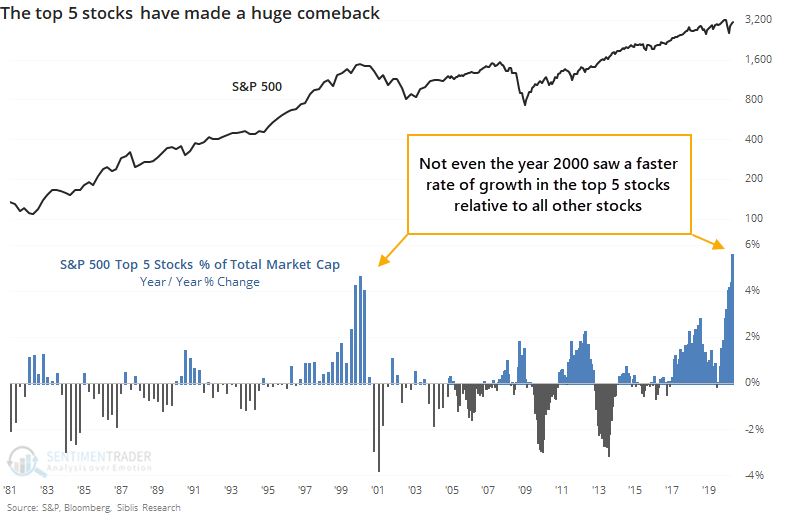
Over the past year, the rate of growth in these stocks relative to the overall market just surpassed the 2000 peak.
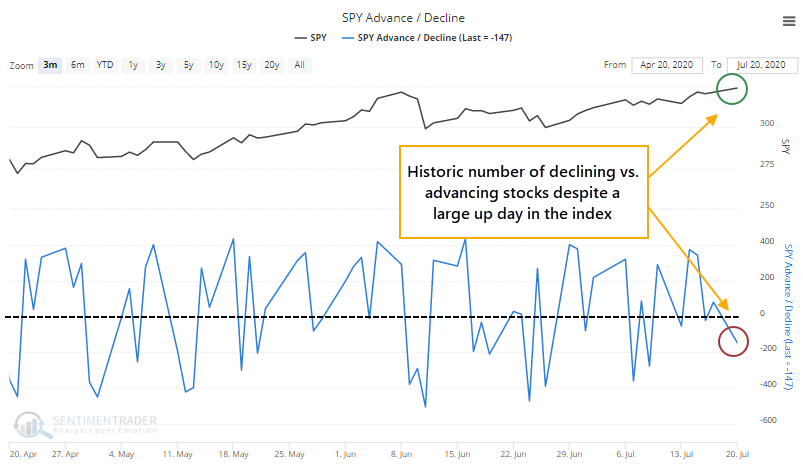
Because the large stocks are dominating the index so much right now, the index itself can show a gain even when most of its stocks are declining. That's what happened on Monday, and to a historic degree. Never before in 30 years has the S&P risen so much on a day when so many more of its component stocks declined rather than advanced.
This has been an absolutely horrid sign for forward returns.
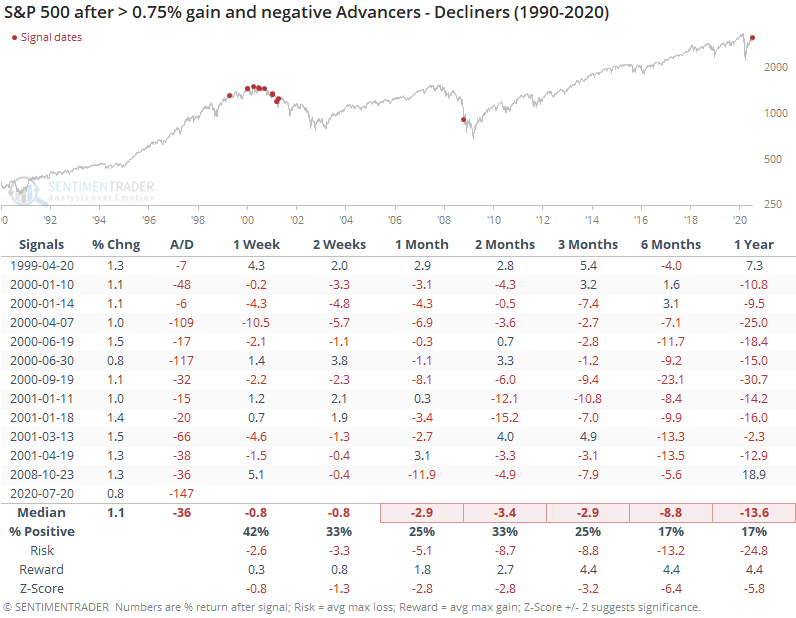
Because most of the signals triggered in 2000, the medium- to long-term results were terrible. The risk/reward ratios over all time frames were heavily skewed to the downside.
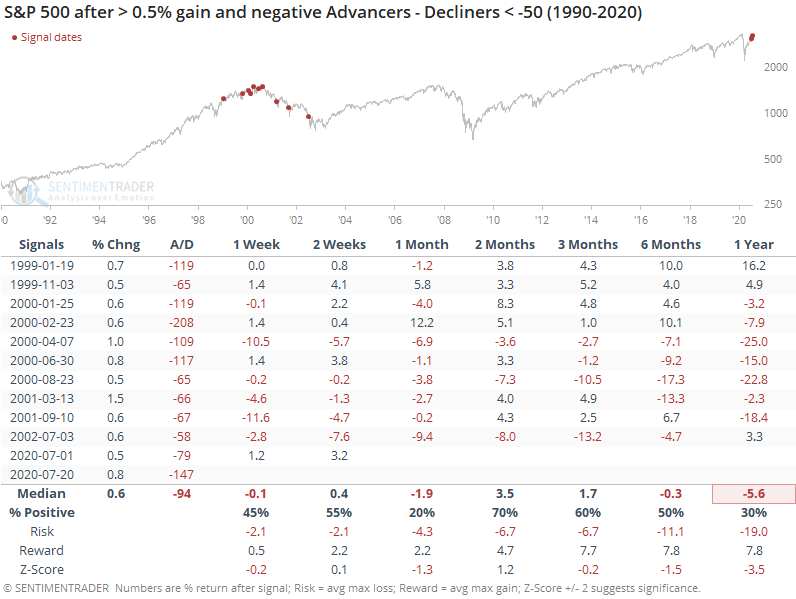
Even if we look for smaller gains in the index but with worse breadth, returns were poor.
It wasn't just the S&P. Across the entire NYSE, more securities declined than advanced, and more volume flowed into those declining issues.
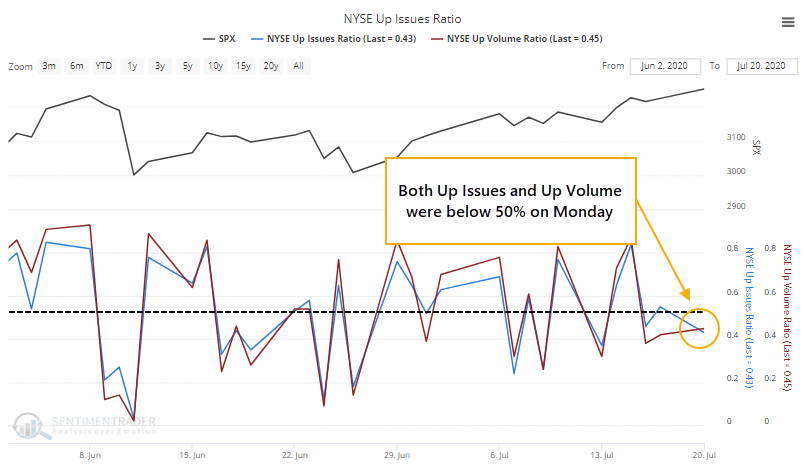
This, too, has not been a good sign.
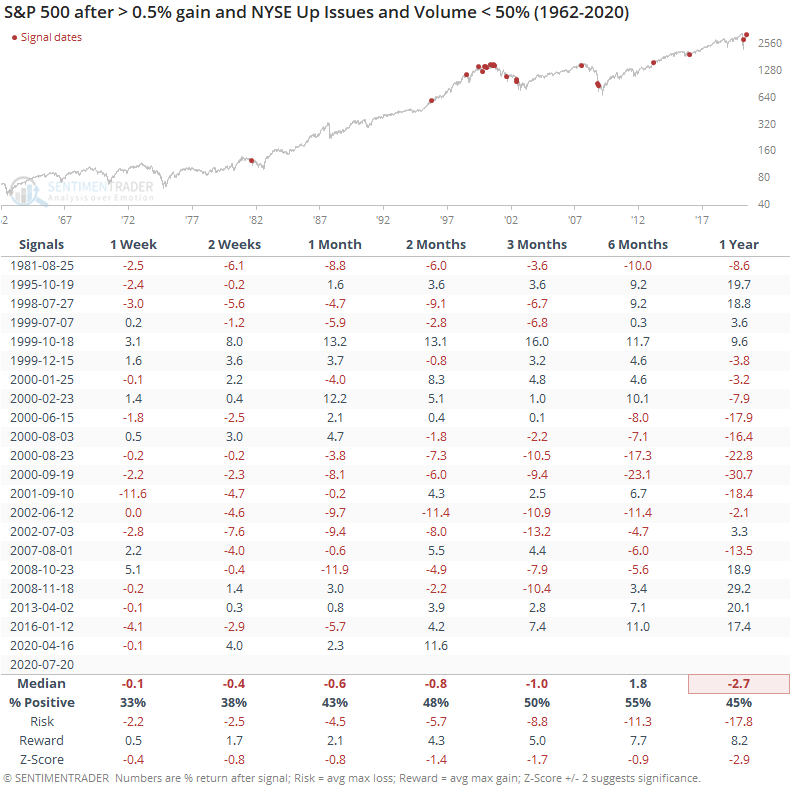
We tend to not put a lot of weight on single-day breadth readings. Sometimes a single stock can heavily skew volume figures, or some weird news event can trigger an odd reading. It's more worrying when these oddities pile up. We're seeing some evidence of that in recent weeks, and when combined with extremely high optimism, it's a concern.
BOTTOM LINE
Foreign buyers bought a record amount of U.S. stocks in May, accounting for more than 0.25% of total market capitalization. Historically, big flows by these entities have been a modest contrary indicator, suggesting that this optimism is a slight negative going forward.
FORECAST / TIMEFRAME
None
|
According to the U.S. Treasury, foreign buyers have stepped into U.S. stocks in a big way. A record way, even. They bought more than $79 billion worth of stocks in May alone, more than 0.25% of the market cap of U.S. stocks.
The next-largest inflow was soon after the bottom in 2009, but otherwise, their pattern was to buy after a rally and not a decline. So, other big inflows were a modest contrary indicator.
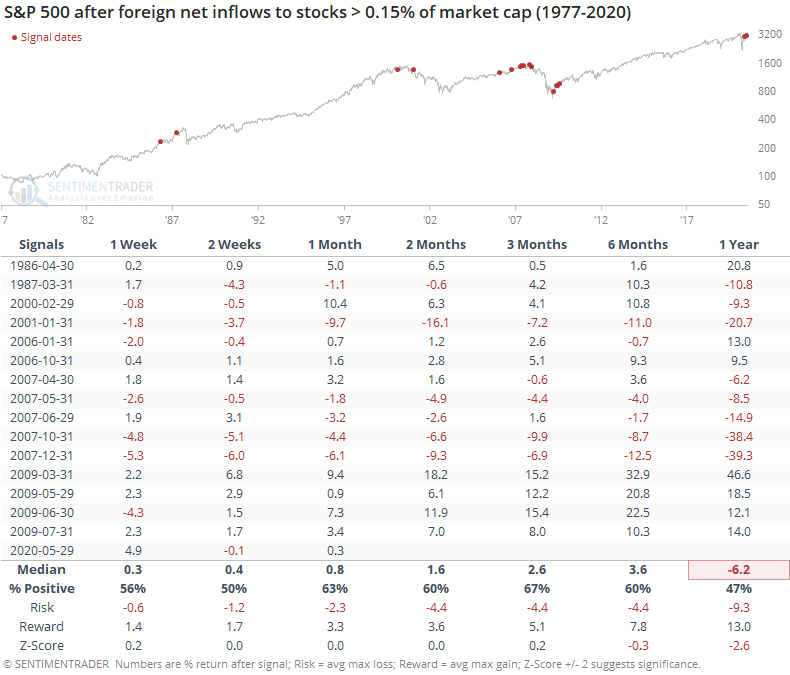
Because there were clusters of these big inflows leading up to the financial crisis, overall longer-term results were well below random. We're in a weird junction now because stocks are near their highs, but also just coming out of a major decline, so it's hard to know which precedents are more apropos.
May's surge in inflows pushed foreigners' 12-month total to more than $157 billion. That's the most since 2013. From a long-term perspective, this wasn't necessarily a reason to expect stocks to suffer.
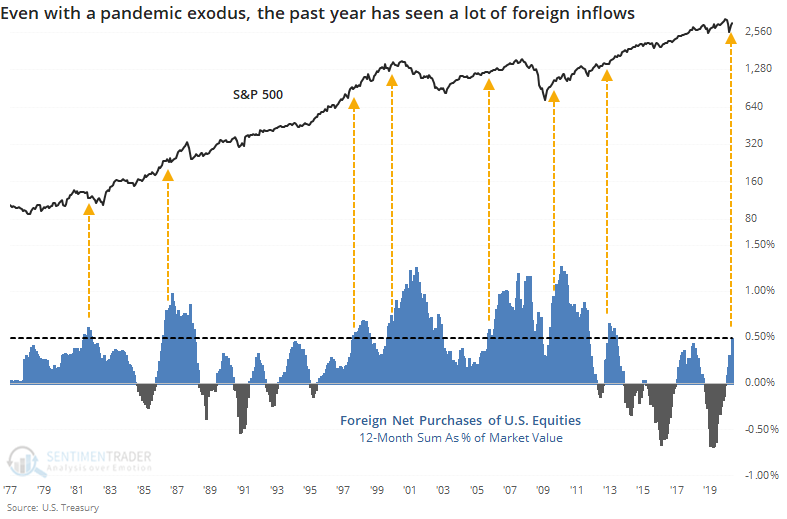
When we've looked at this data in various ways in the past, it has confirmed that it's a modest contrary indicator on most time frames. So this surge in buying pressure could be considered a slight negative over the medium- to long-term, but not enough to be a major worry.
Active Studies
| Time Frame | Bullish | Bearish | | Short-Term | 0 | 0 | | Medium-Term | 8 | 10 | | Long-Term | 44 | 1 |
|
Indicators at Extremes
Portfolio
| Position | Weight % | Added / Reduced | Date | | Stocks | 29.8 | Reduced 9.1% | 2020-06-11 | | Bonds | 0.0 | Reduced 6.7% | 2020-02-28 | | Commodities | 5.2 | Added 2.4%
| 2020-02-28 | | Precious Metals | 0.0 | Reduced 3.6% | 2020-02-28 | | Special Situations | 0.0 | Reduced 31.9% | 2020-03-17 | | Cash | 65.0 | | |
|
Updates (Changes made today are underlined)
In the first months of the year, we saw manic trading activity. From big jumps in specific stocks to historic highs in retail trading activity to record highs in household confidence to almost unbelievable confidence among options traders. All of that came amid a market where the average stock couldn't keep up with their indexes. There were signs of waning momentum in stocks underlying the major averages, which started triggering technical warning signs in late January. After stocks bottomed on the 23rd, they enjoyed a historic buying thrust and retraced a larger amount of the decline than "just a bear market rally" tends to. Those thrusts are the most encouraging sign we've seen in years. Through early June, we were still seeing thrusts that have led to recoveries in longer-term breadth metrics. The longer-term prospects for stocks (6-12 months) still look decent given the above. On a short- to medium-term basis, it was getting harder to make that case. Dumb Money Confidence spiked and there were multiple signs of a historic level of speculation. This is likely the lowest I will go given what I still consider to be compelling positives over a longer time frame. There is not a slam-dunk case to be made for either direction, so it will seem like a mistake whether stocks keep dropping (why didn't I sell more?) or if they turn and head higher (why did I let short-term concerns prevail?). After nearly three decades of trading, I've learned to let go of the idea of perfection.
RETURN YTD: -3.9% 2019: 12.6%, 2018: 0.6%, 2017: 3.8%, 2016: 17.1%, 2015: 9.2%, 2014: 14.5%, 2013: 2.2%, 2012: 10.8%, 2011: 16.5%, 2010: 15.3%, 2009: 23.9%, 2008: 16.2%, 2007: 7.8%
|
|
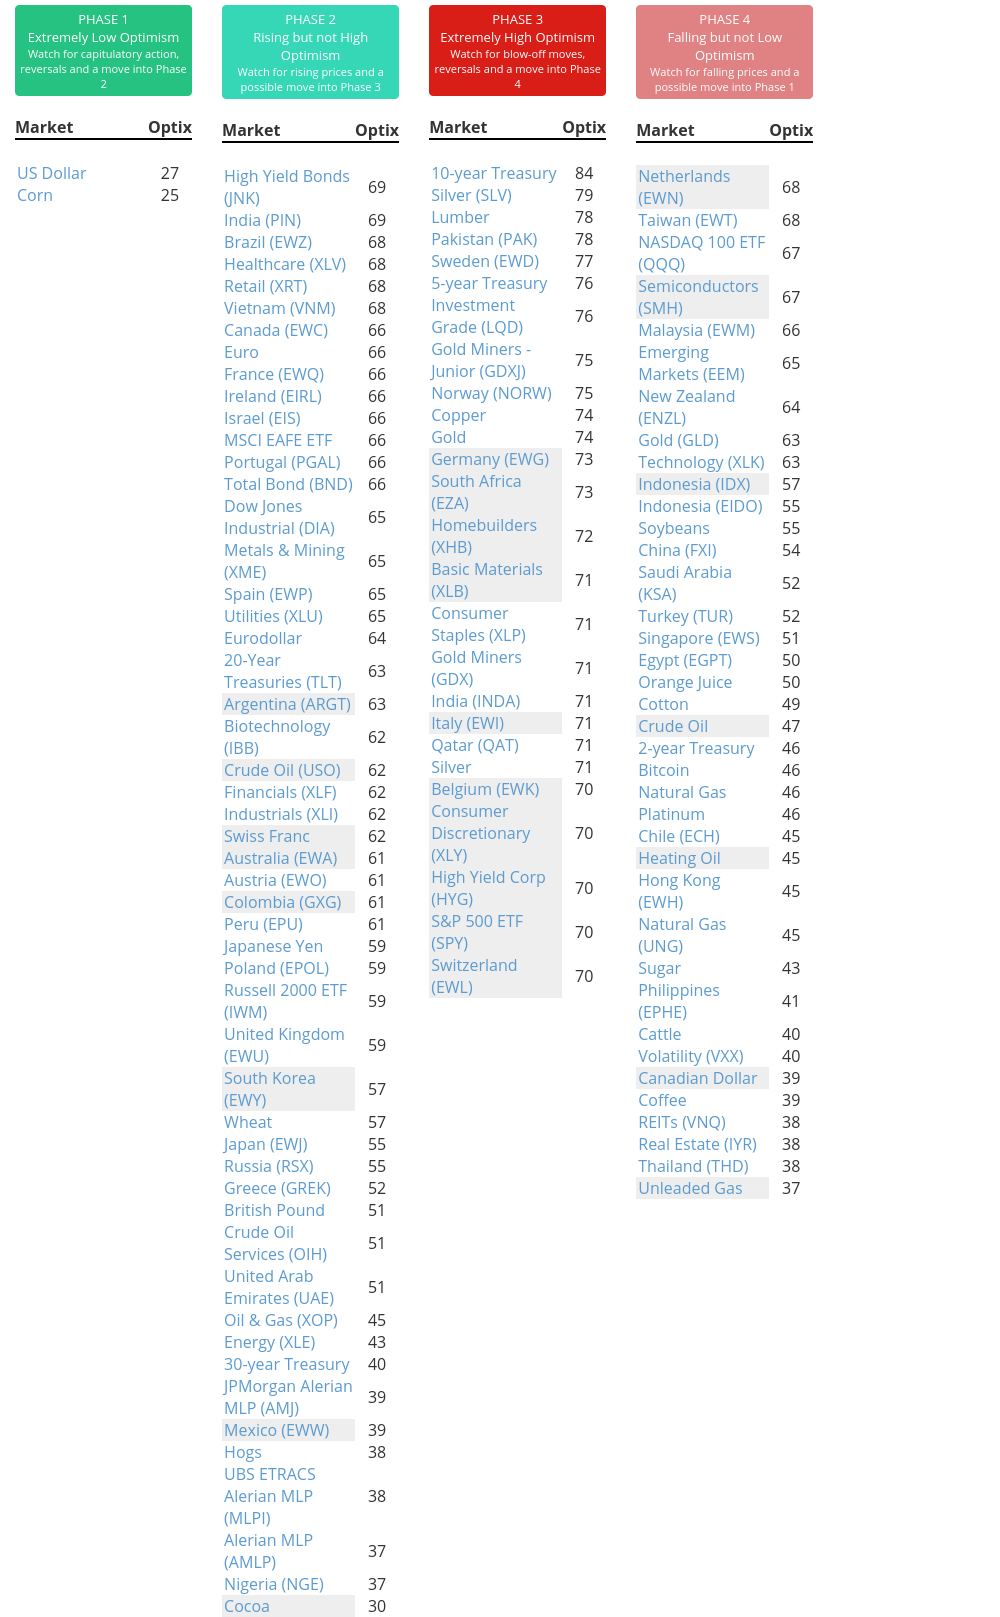
Phase Table
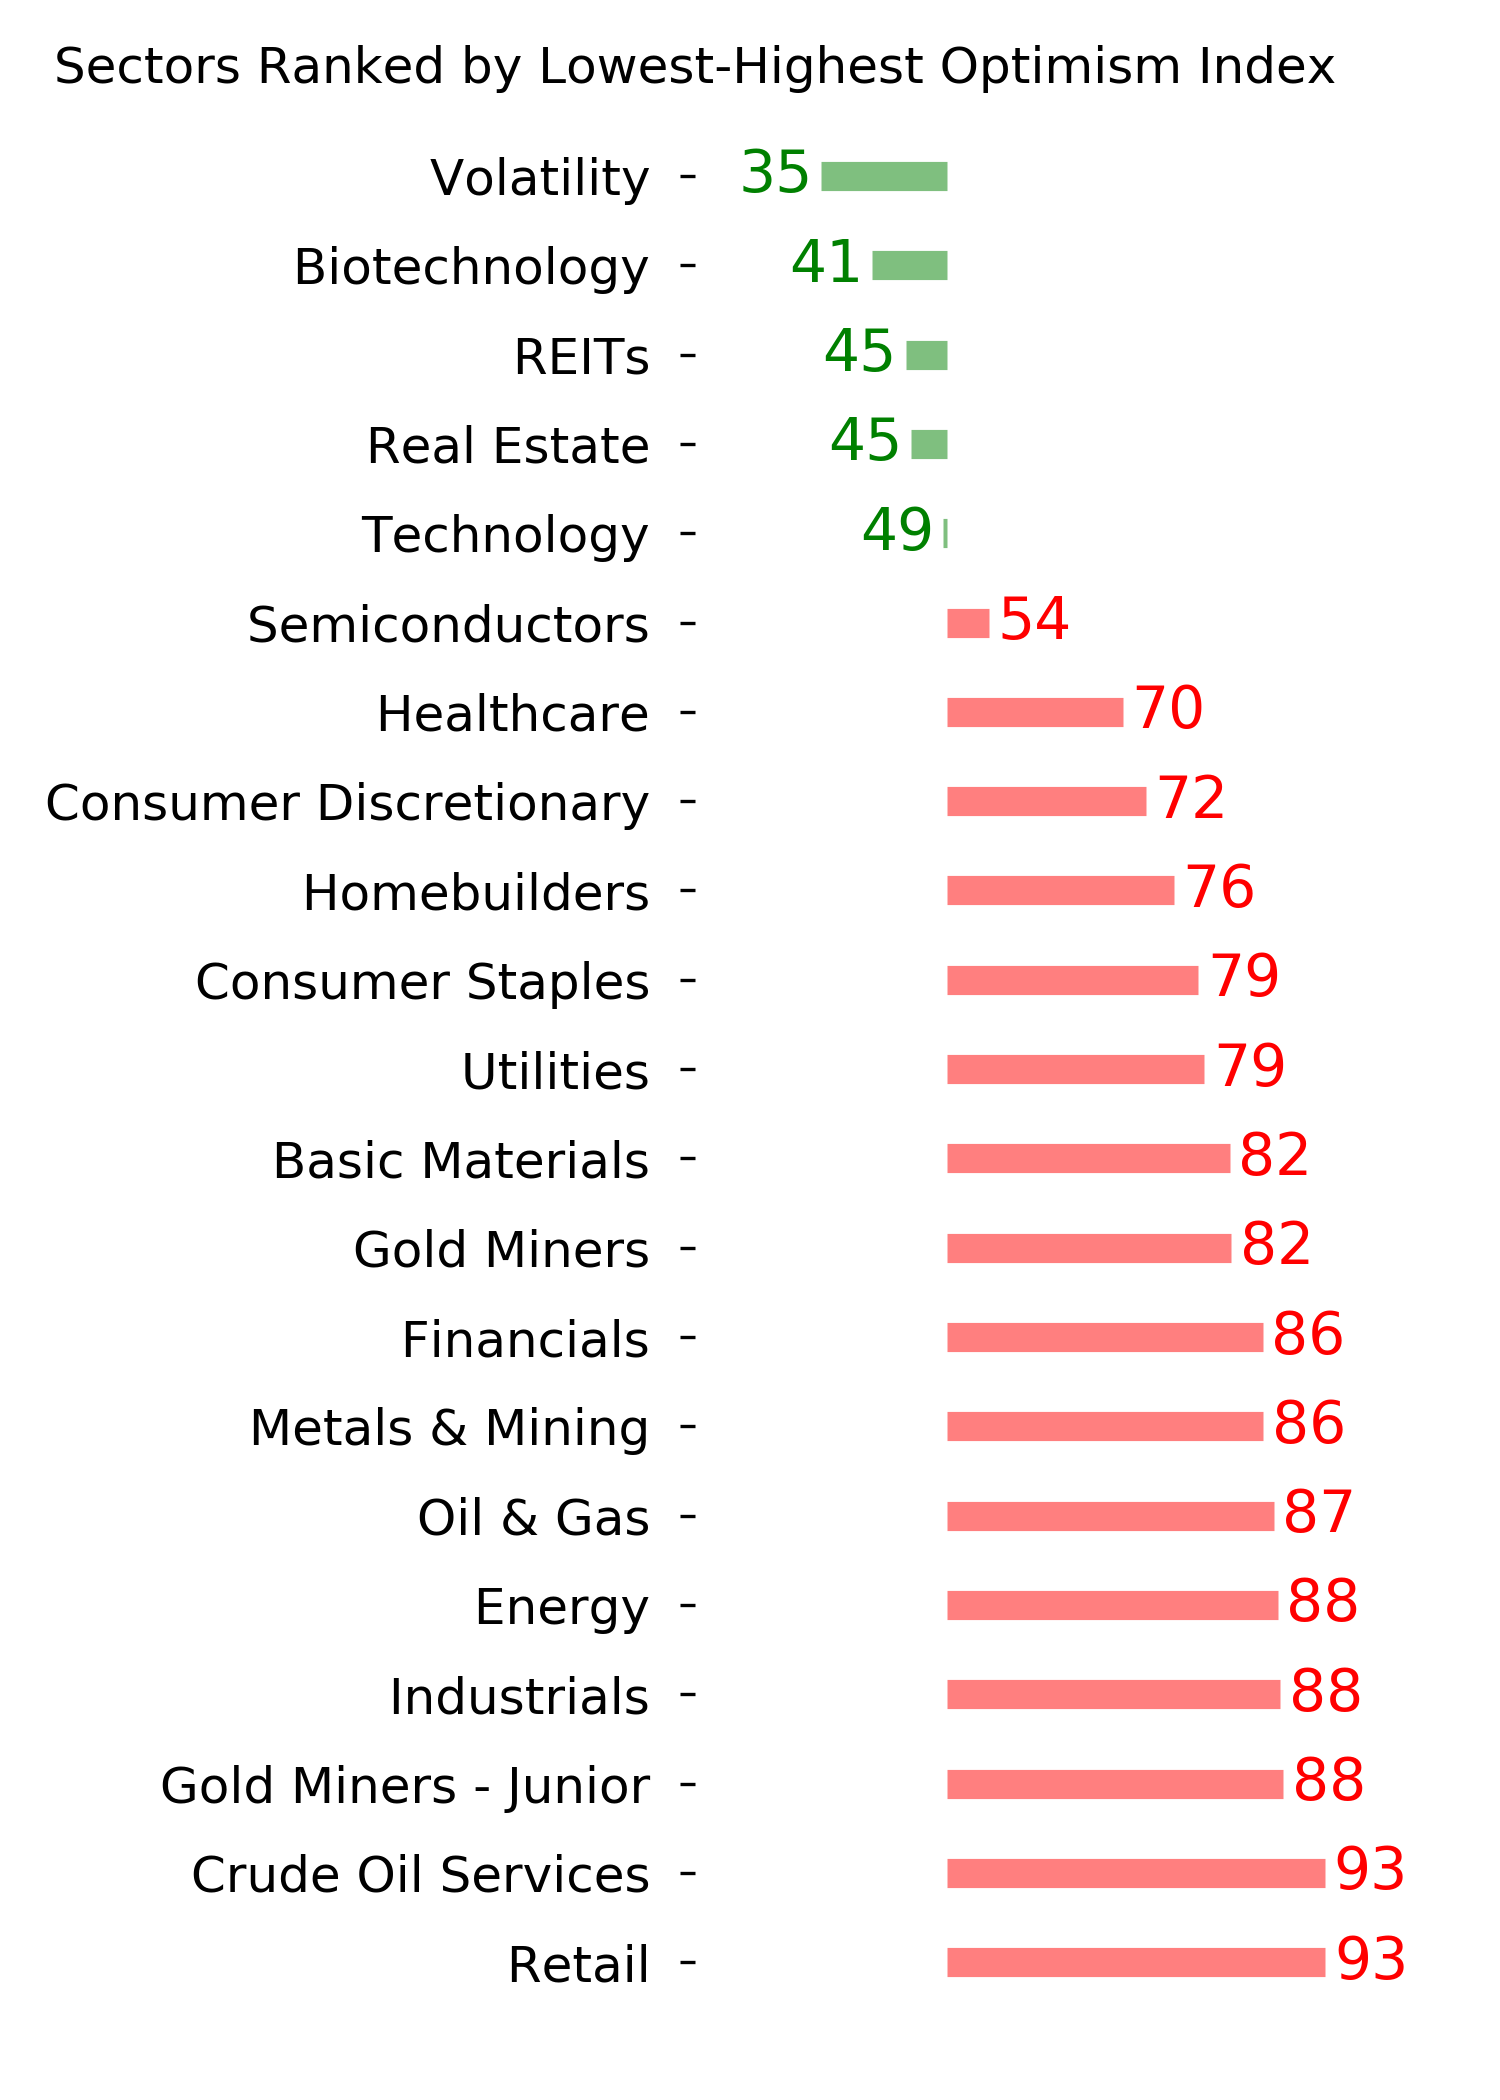
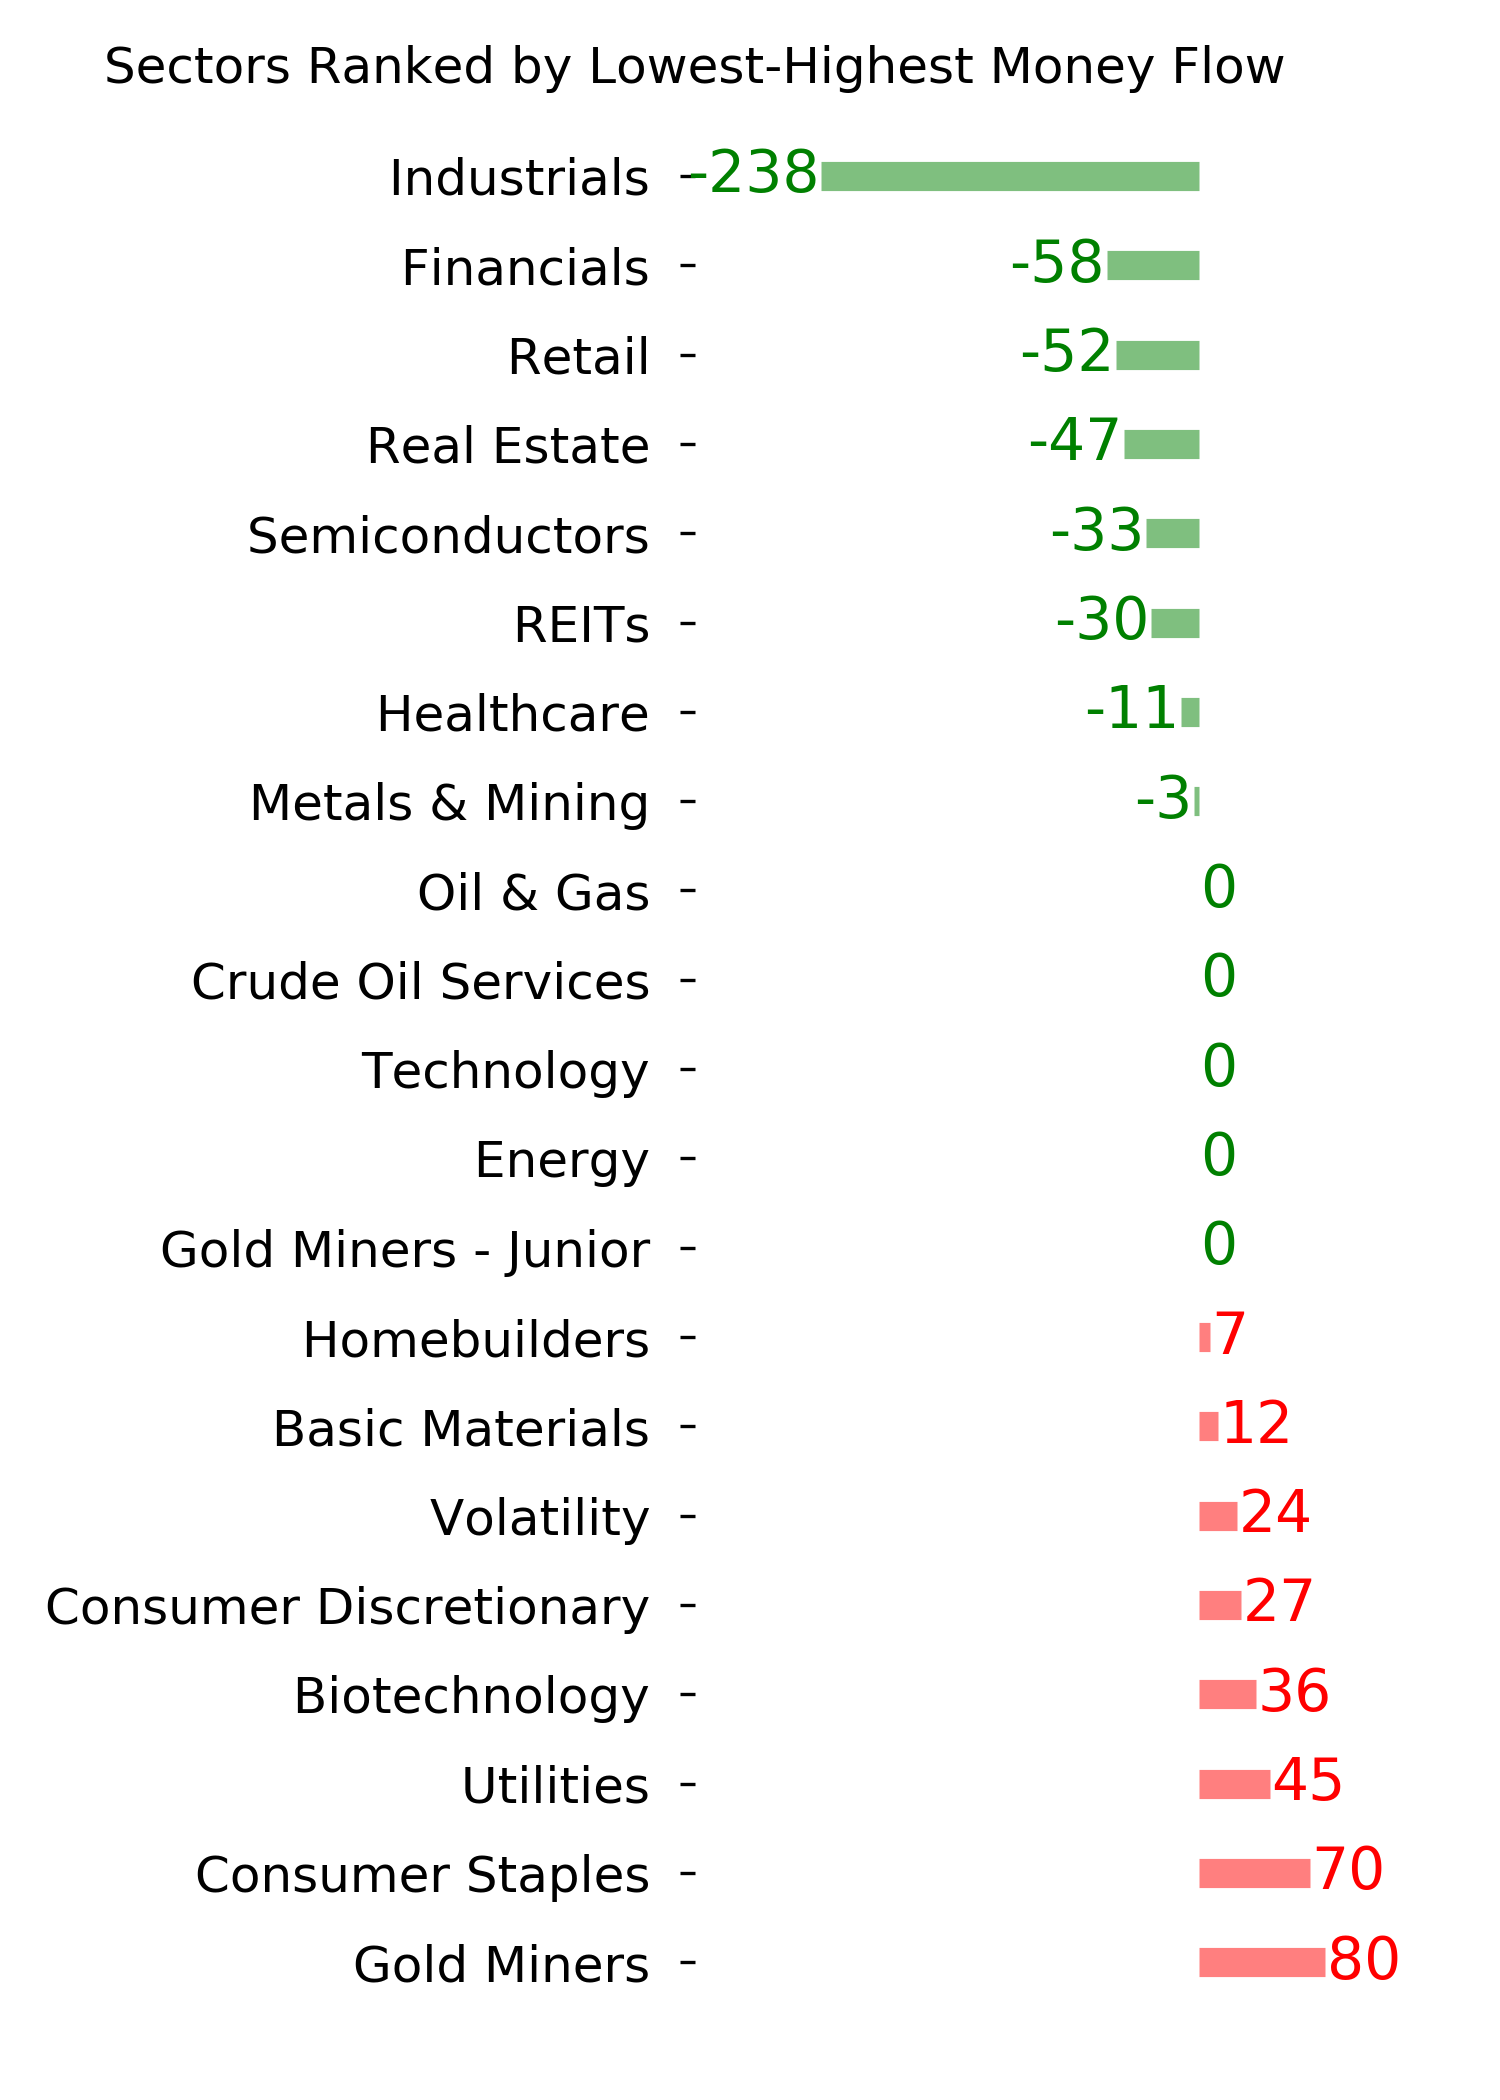
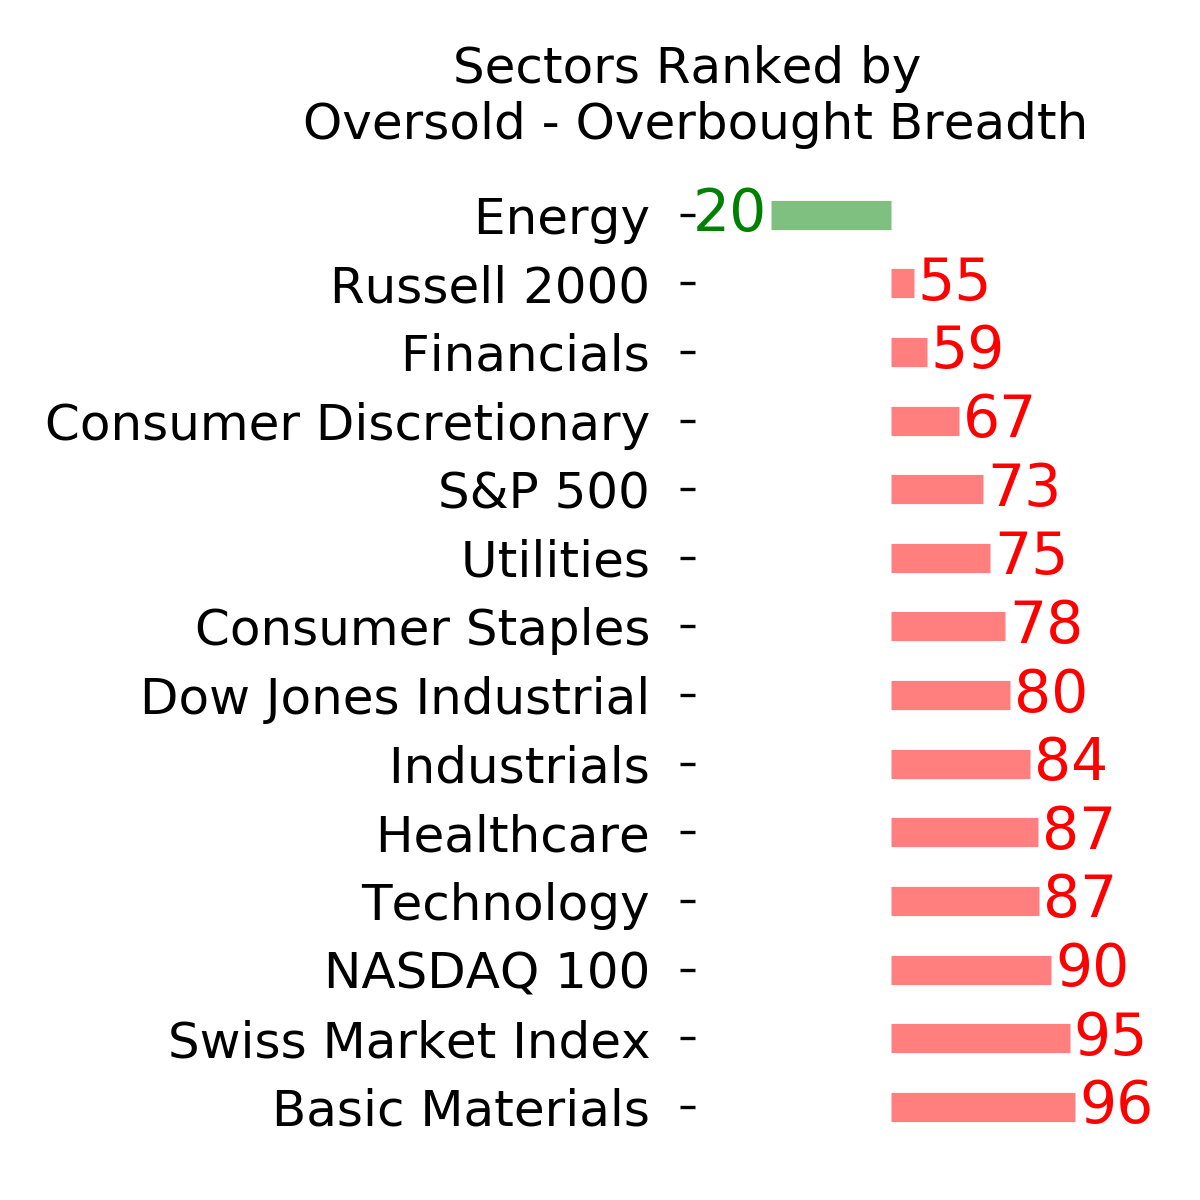
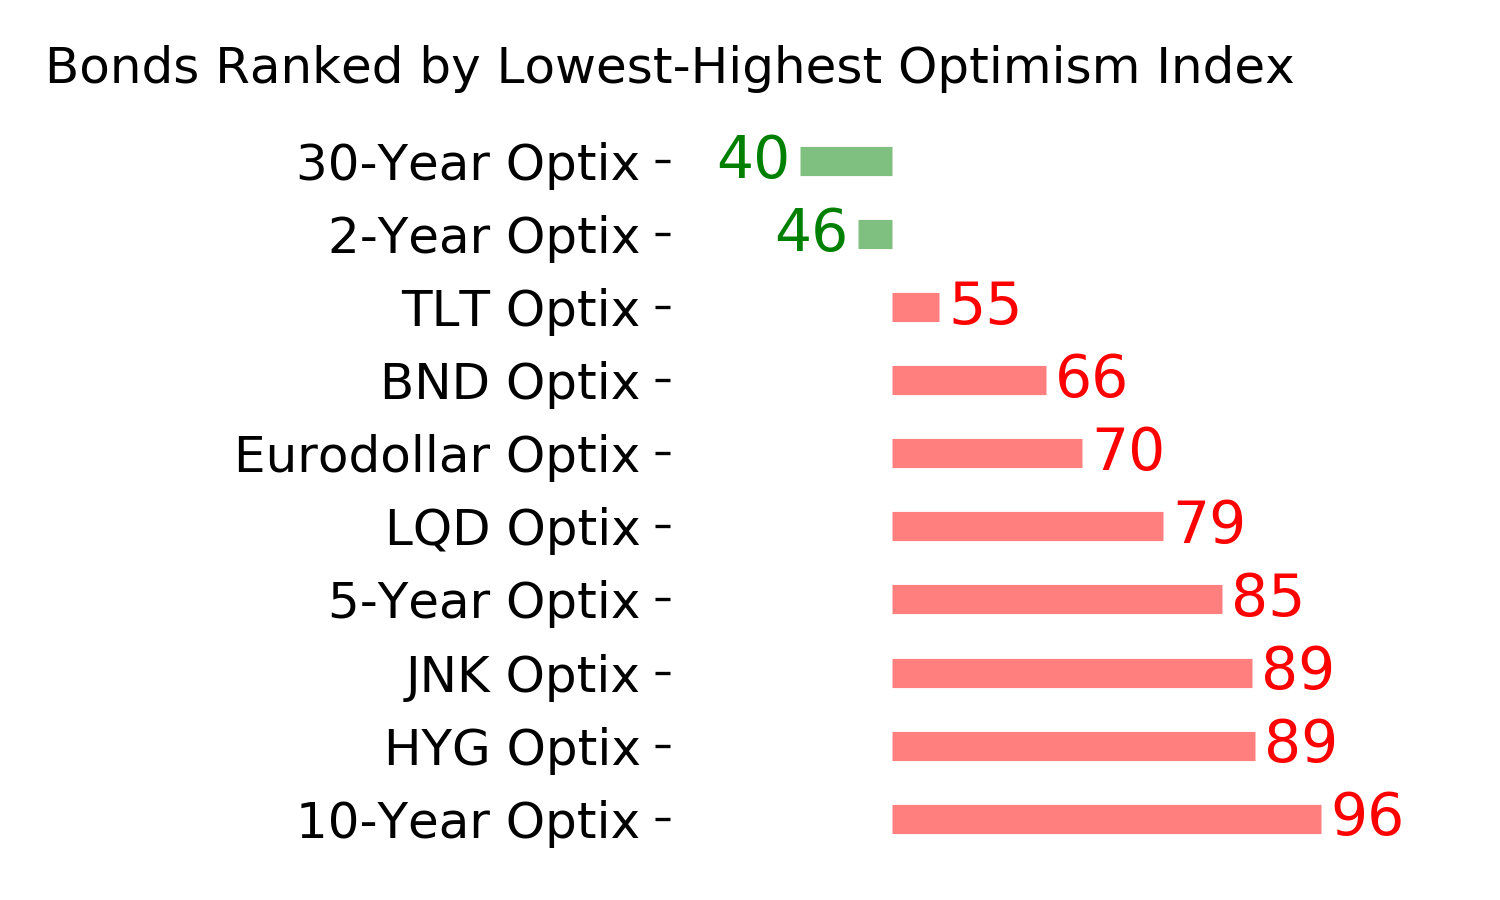
Ranks
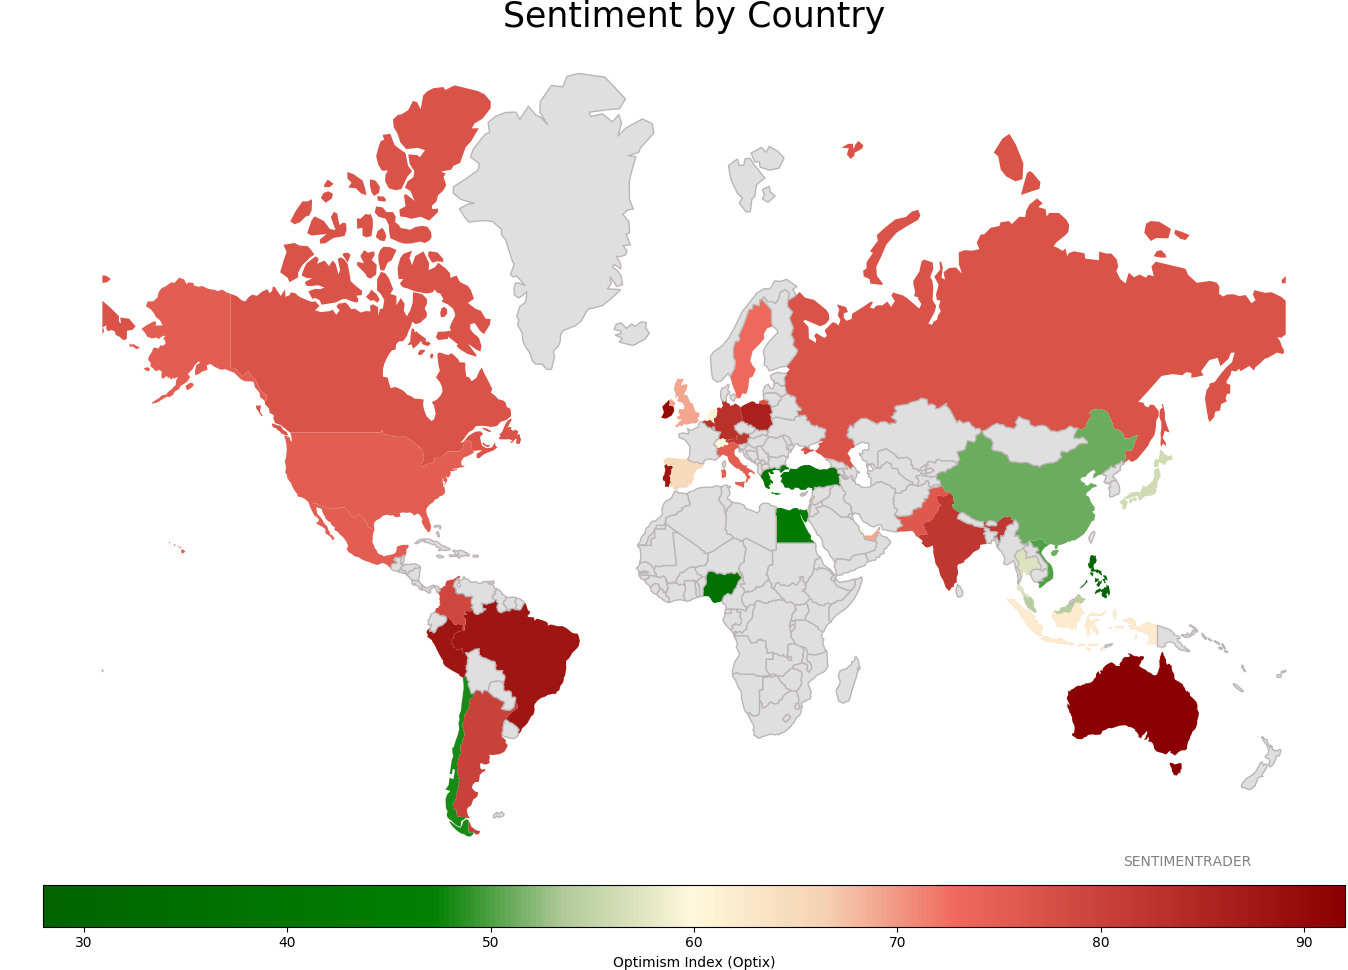
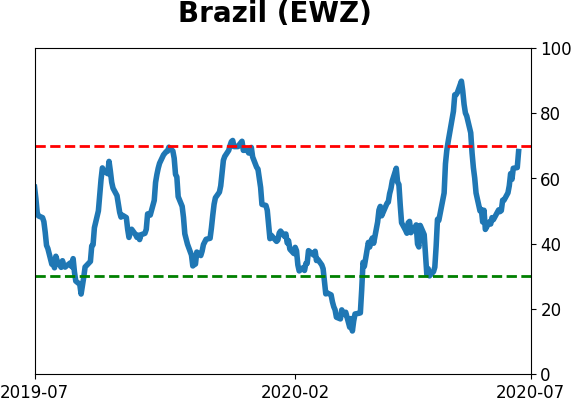
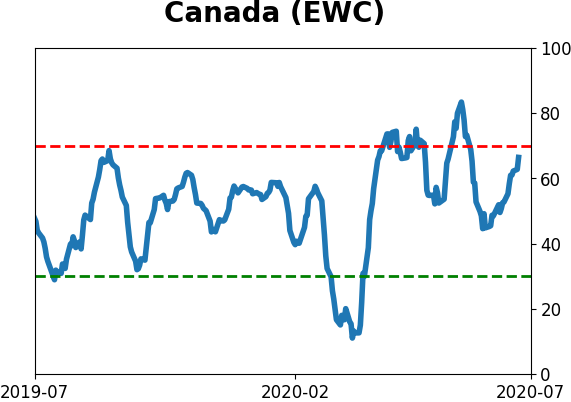
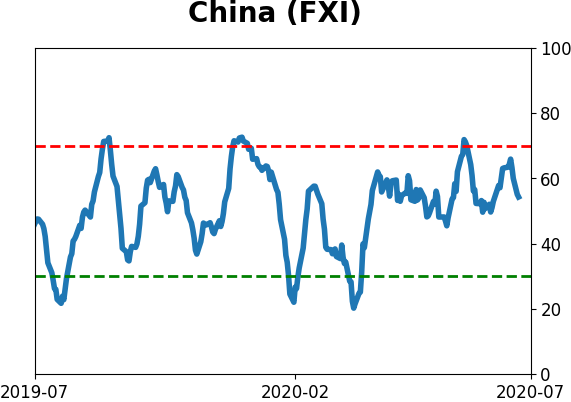
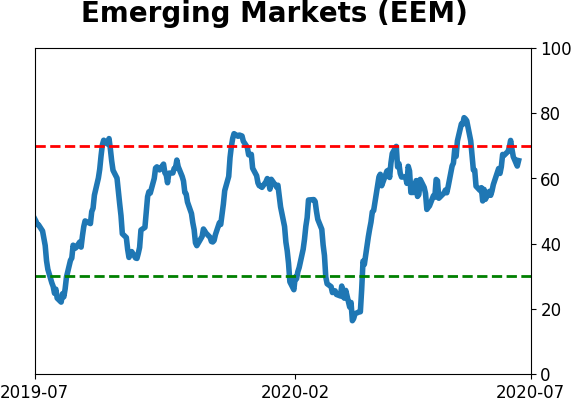
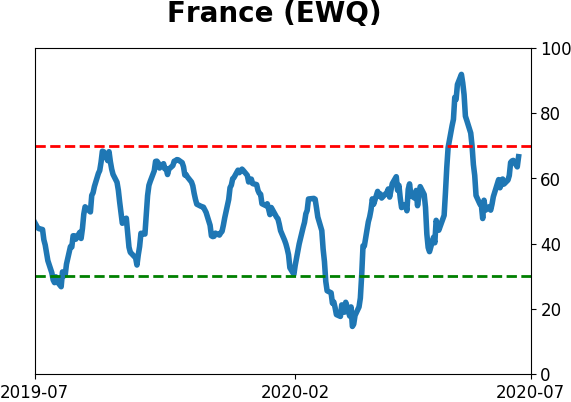
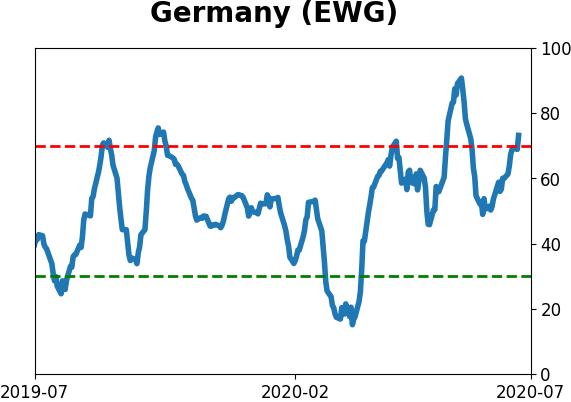
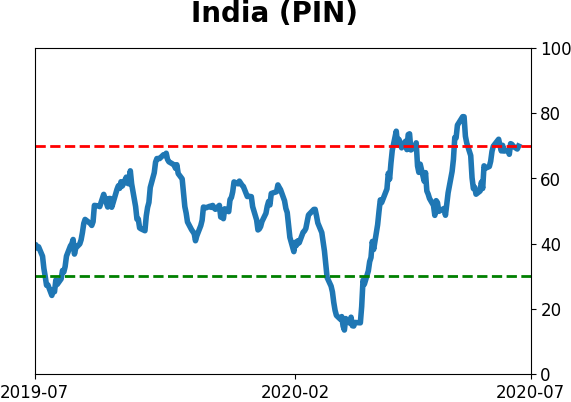
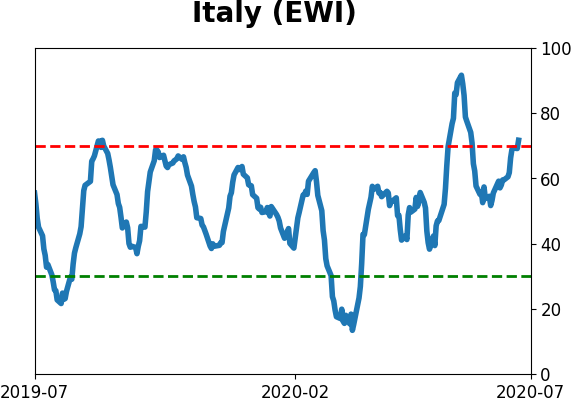
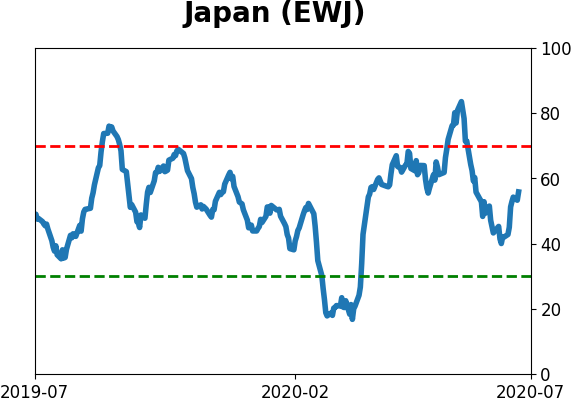
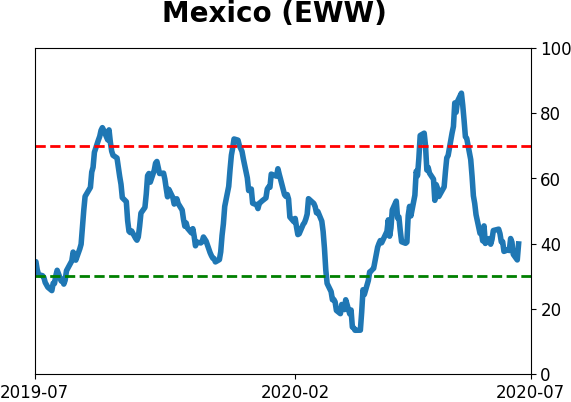
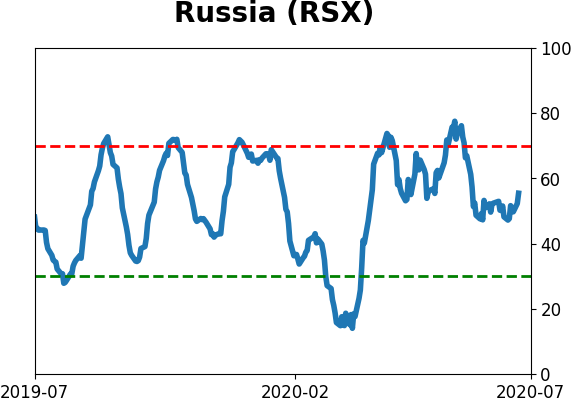
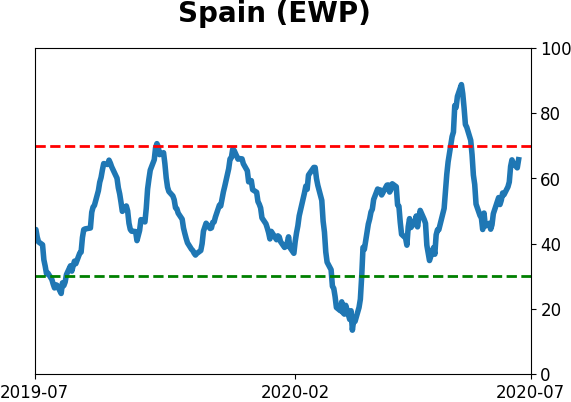
Sentiment Around The World
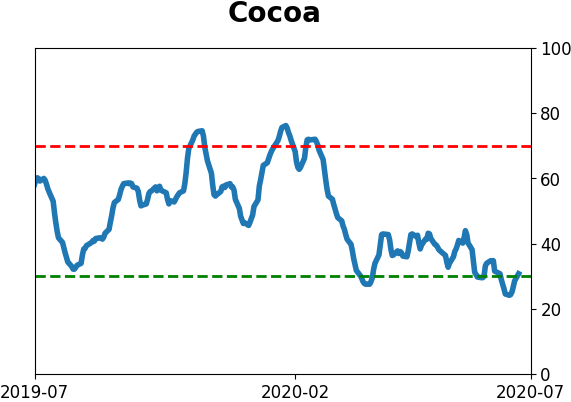
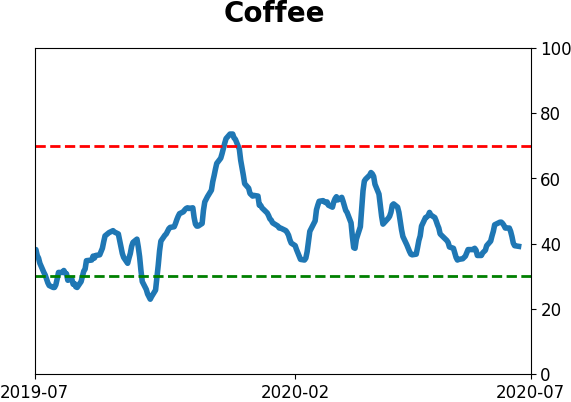
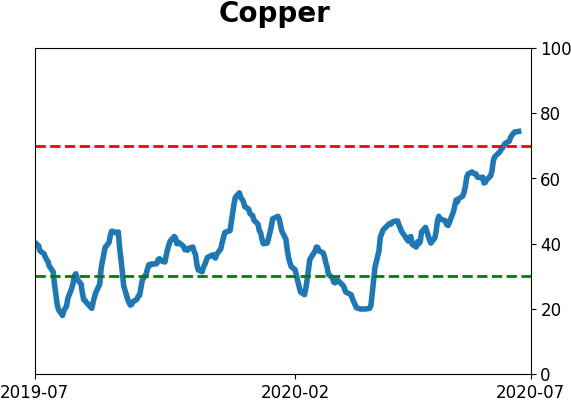
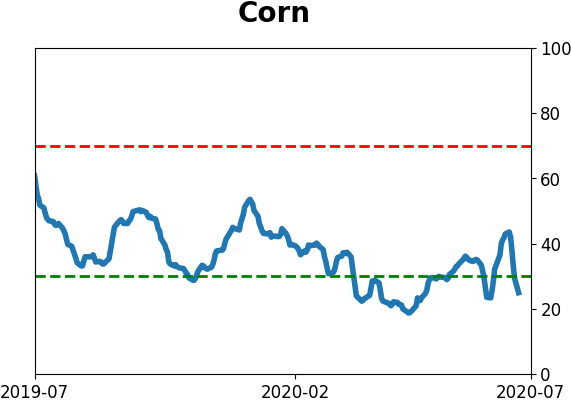
Optimism Index Thumbnails
|
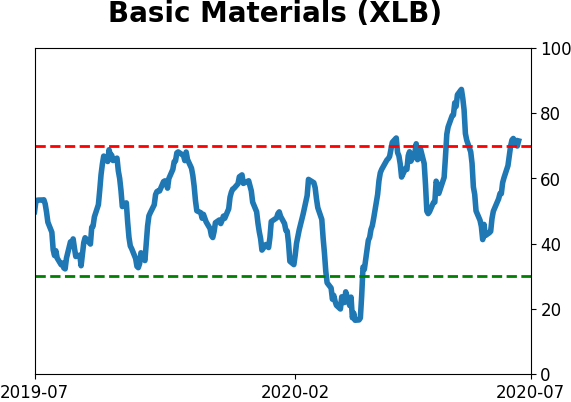
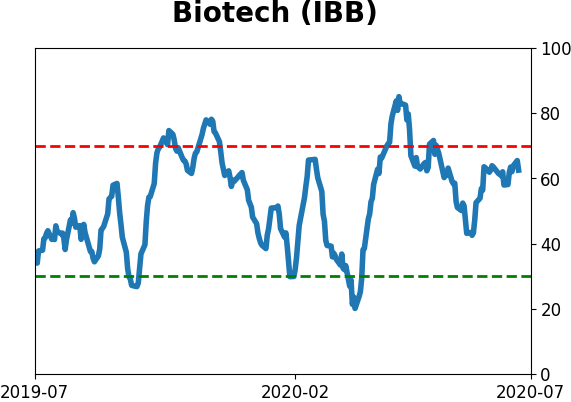
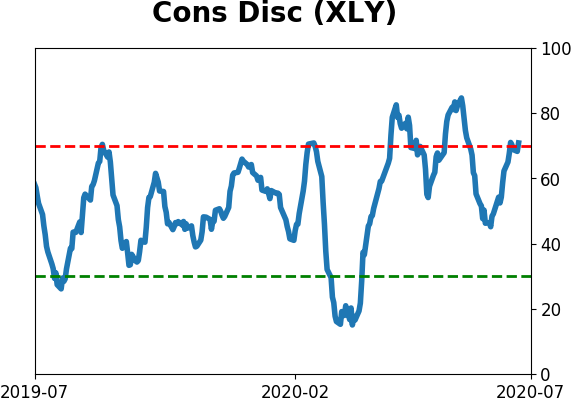
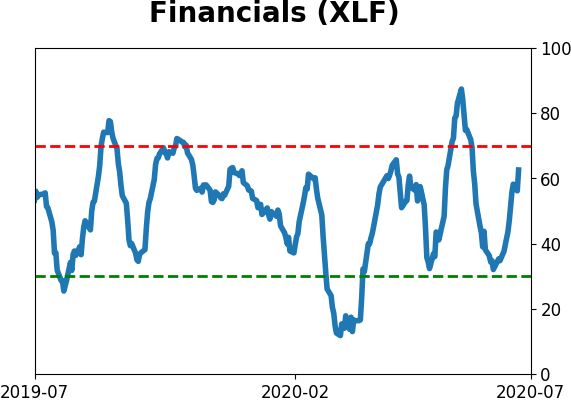
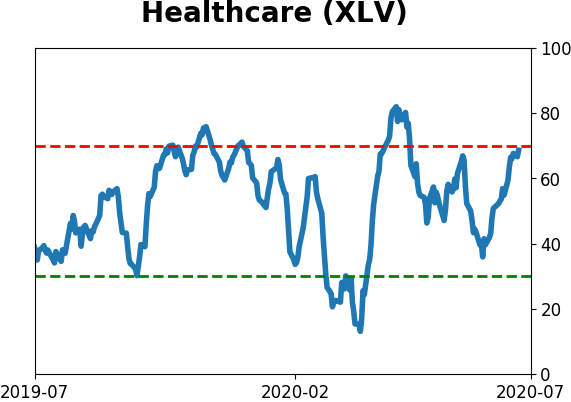
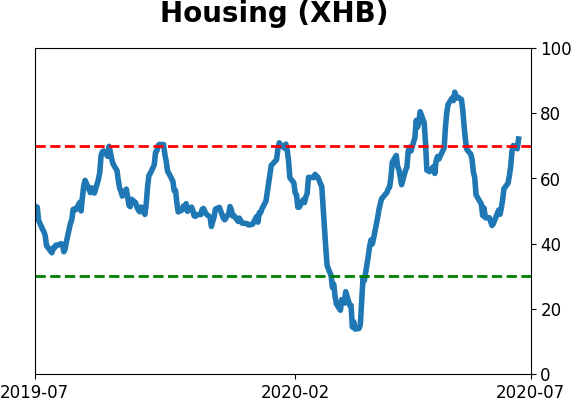
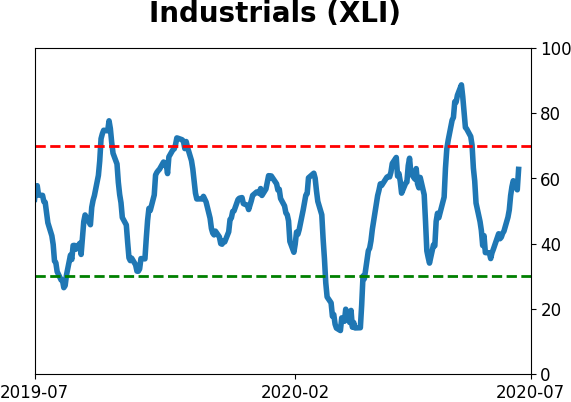
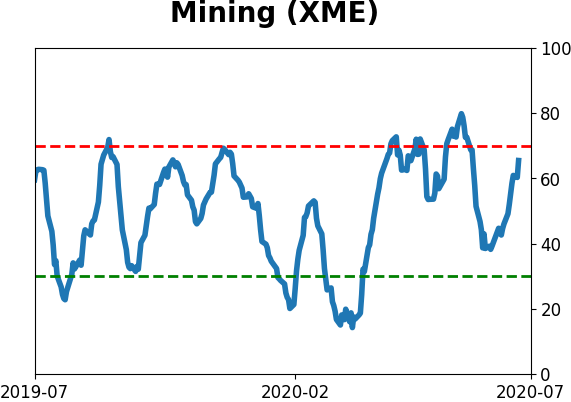
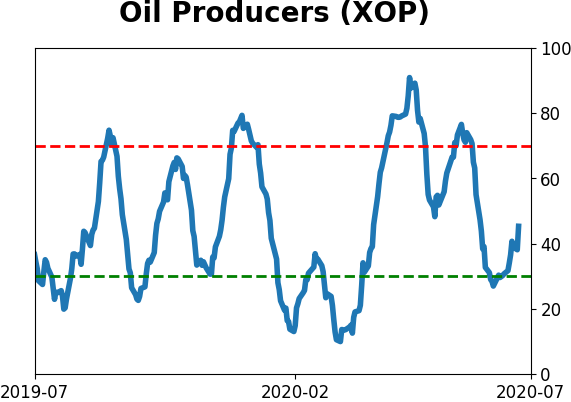
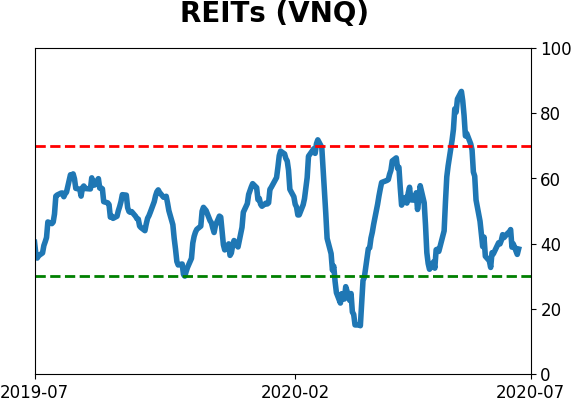
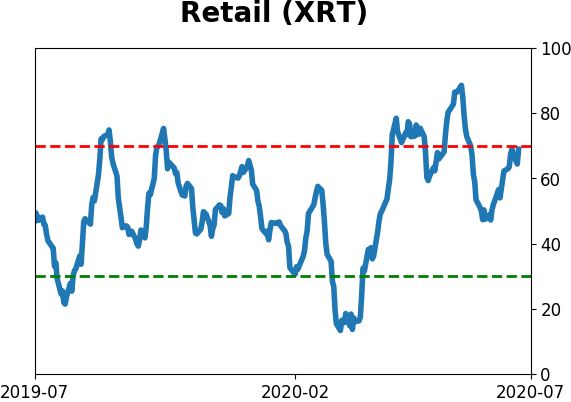
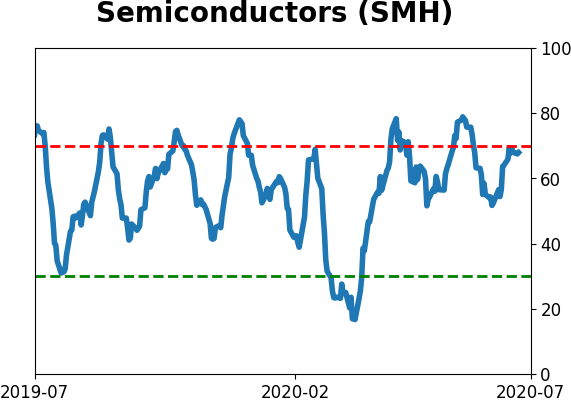
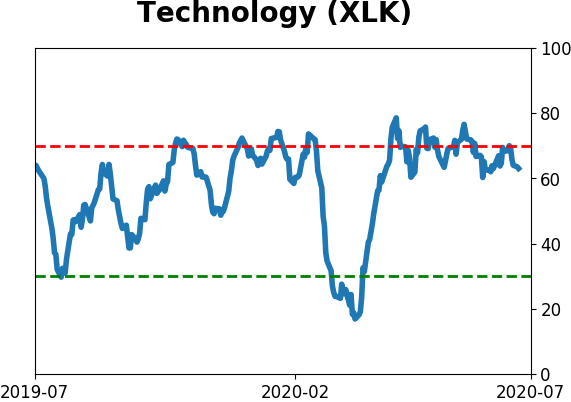
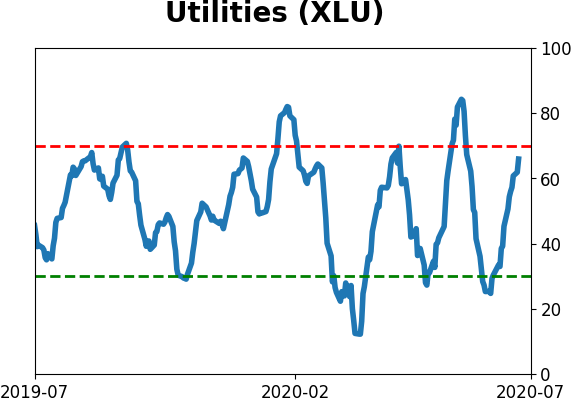
Sector ETF's - 10-Day Moving Average
|
|
|
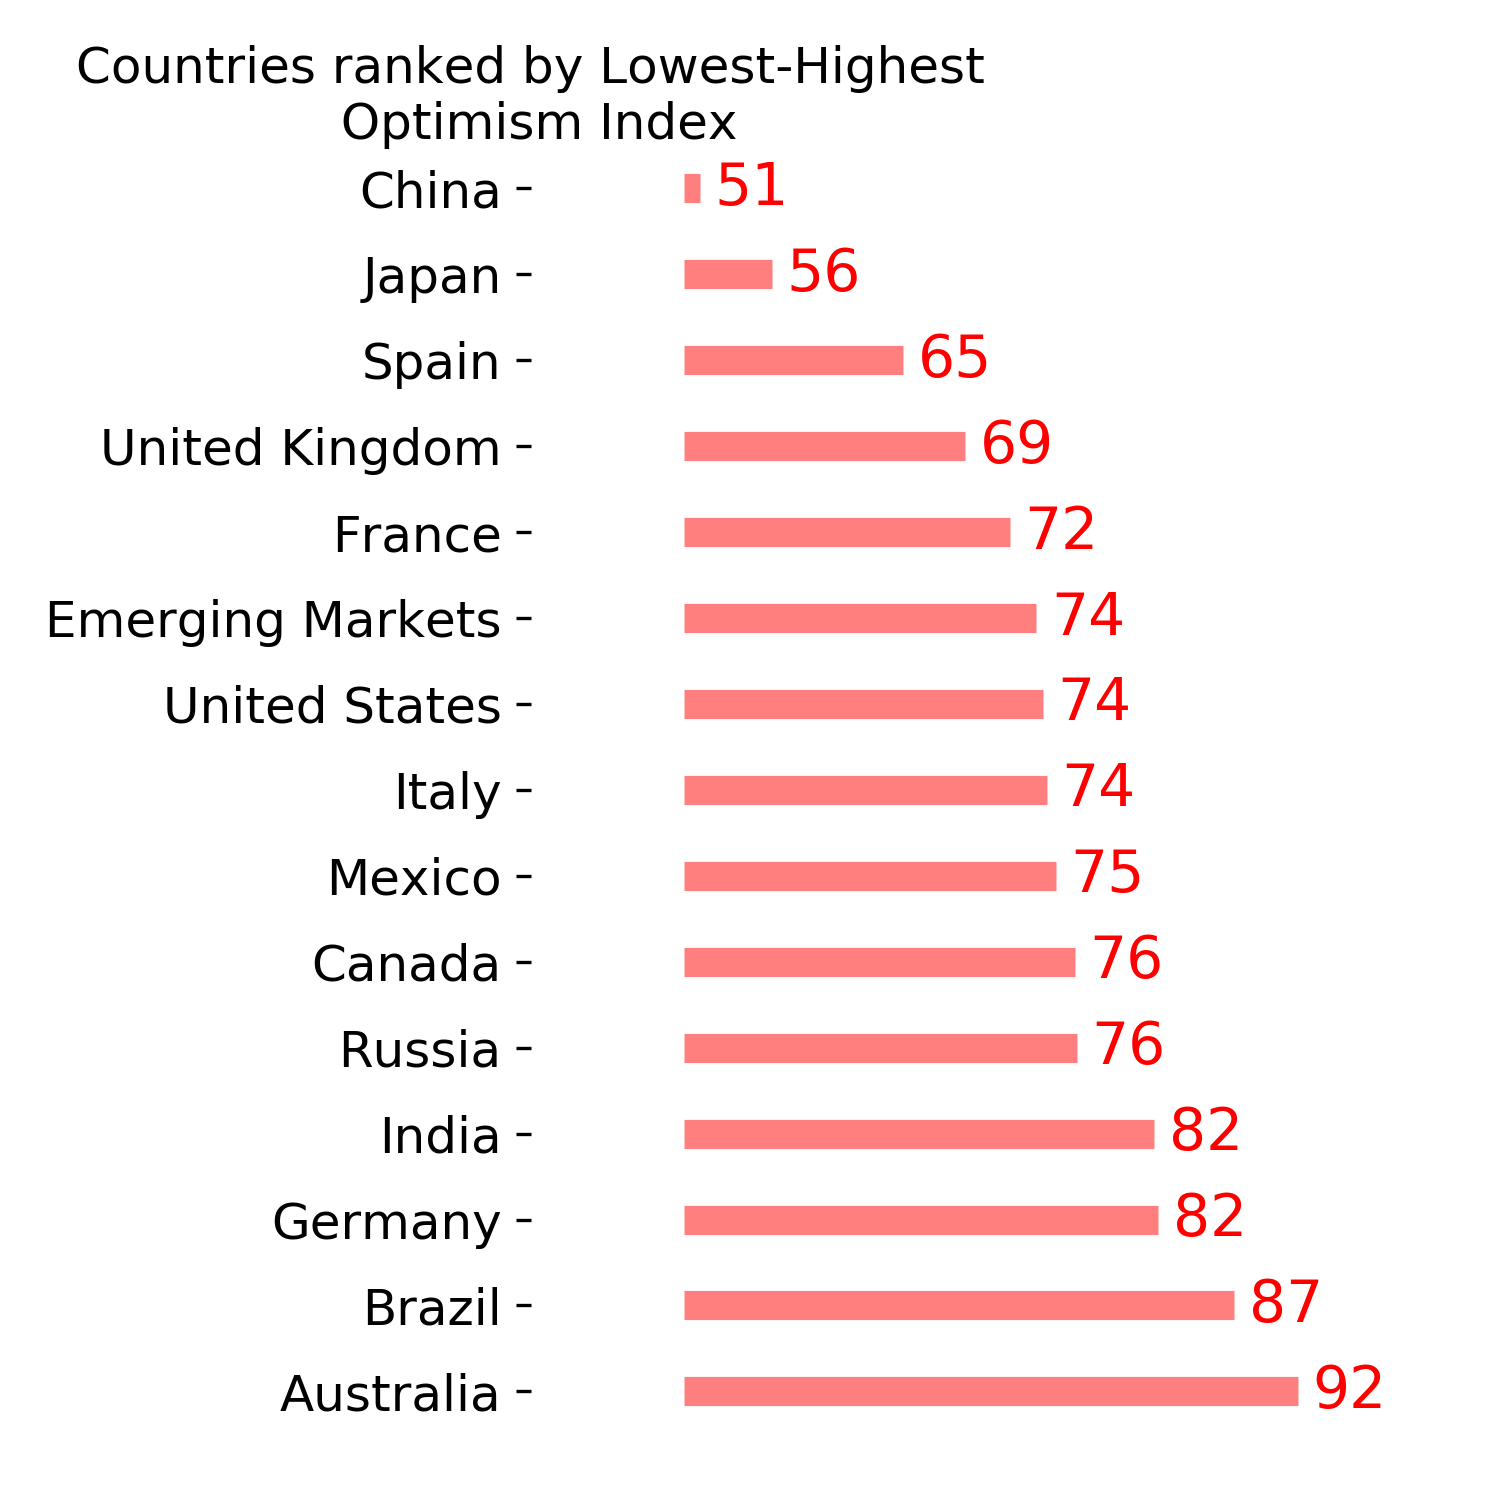
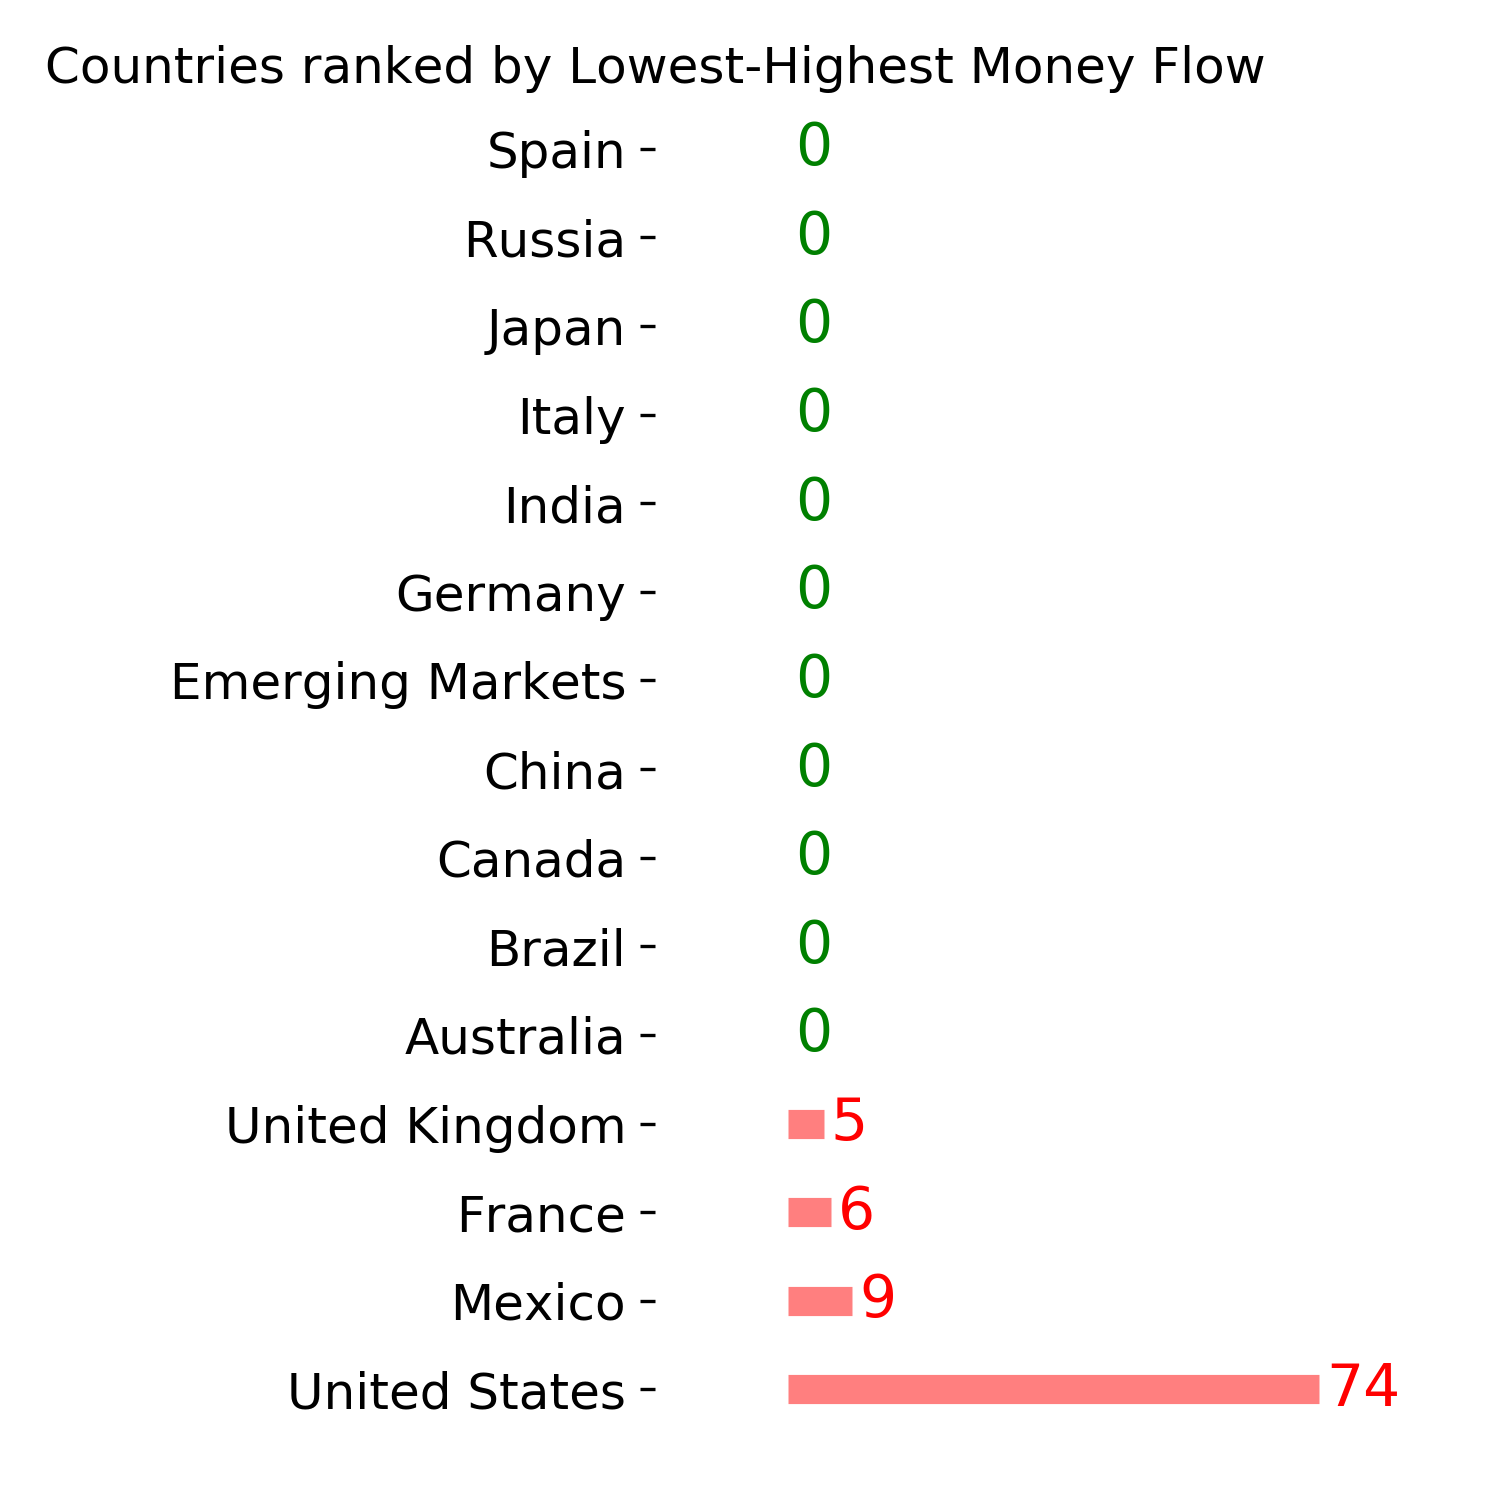
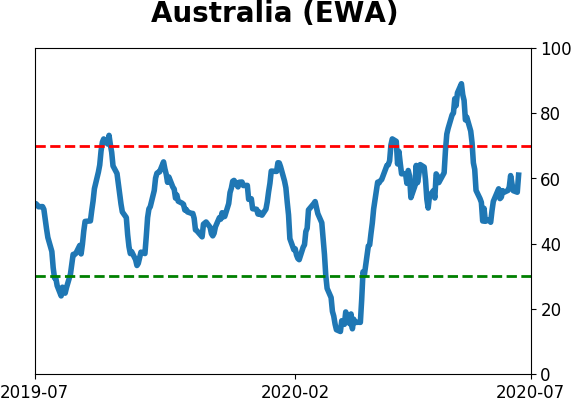
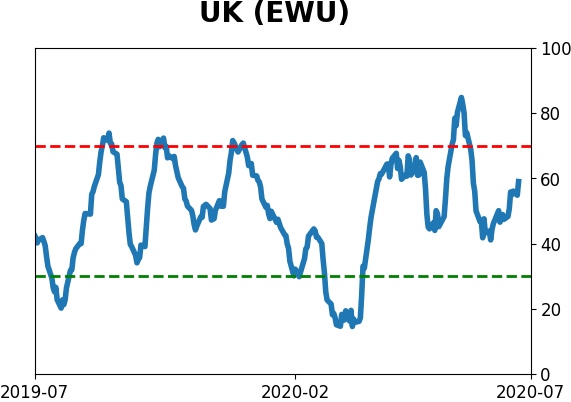
Country ETF's - 10-Day Moving Average
|
|
|
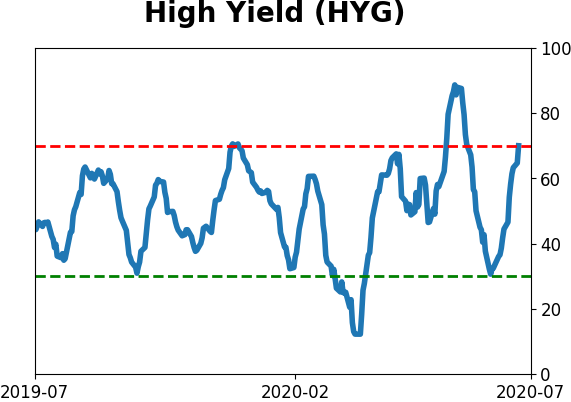
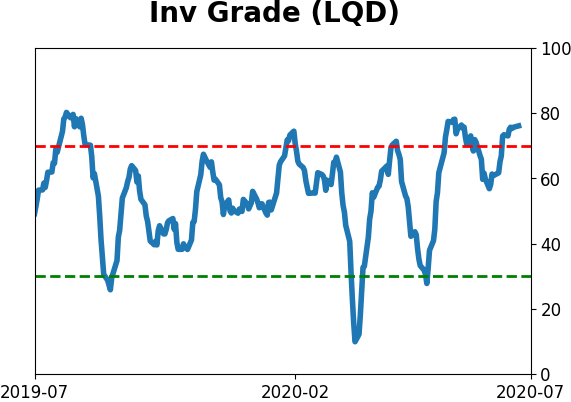
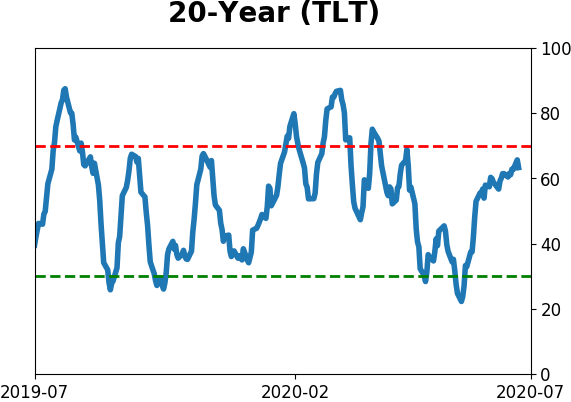
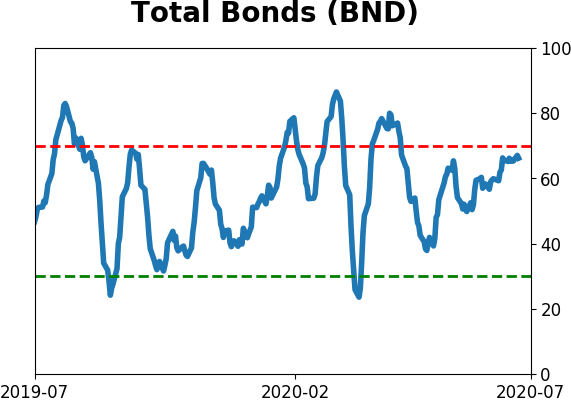
Bond ETF's - 10-Day Moving Average
|
|
|
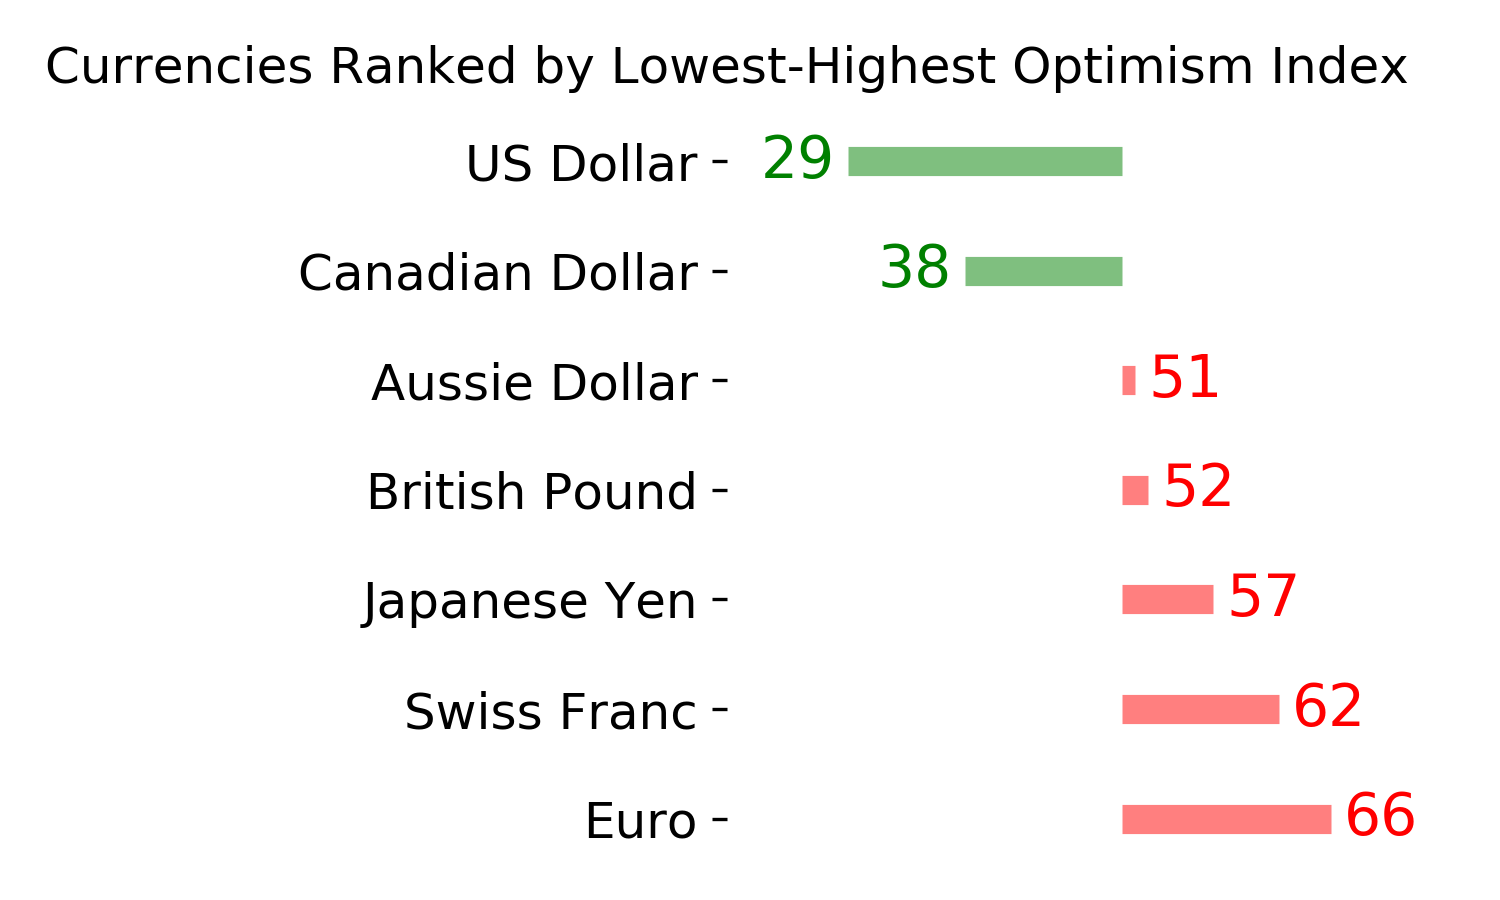
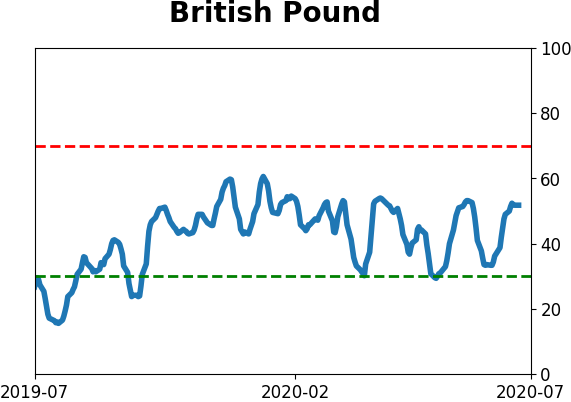
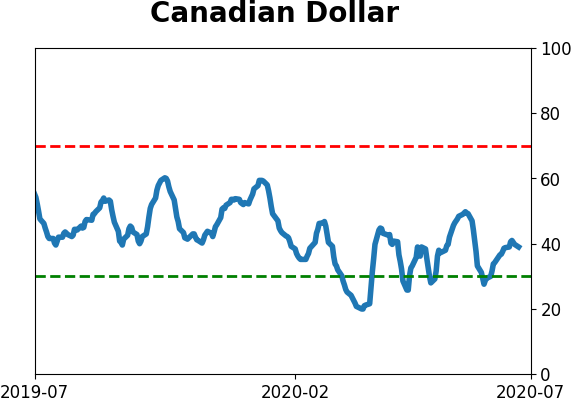
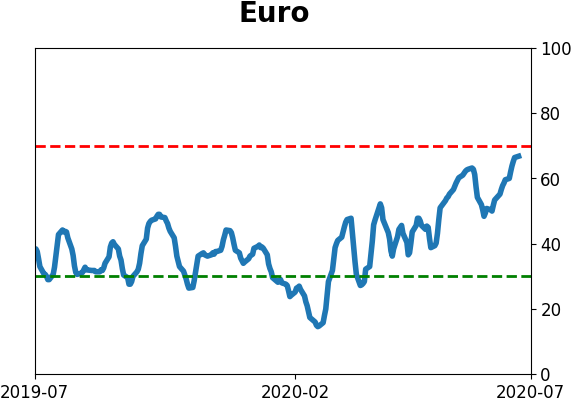
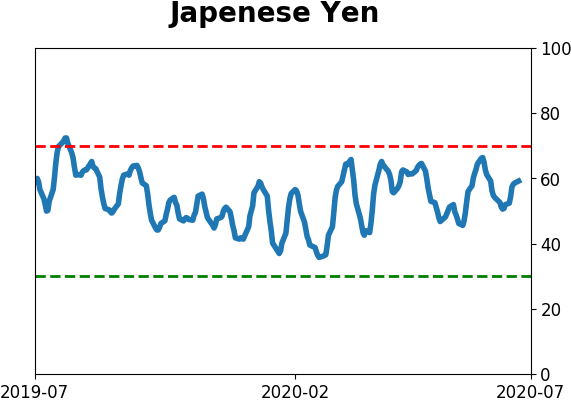
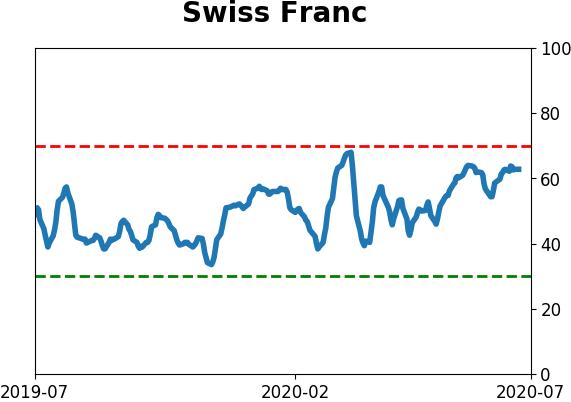
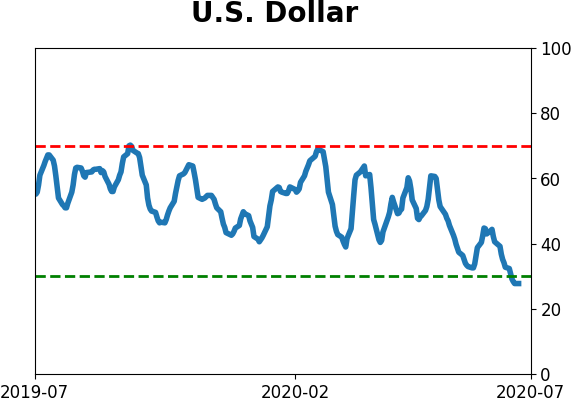
Currency ETF's - 5-Day Moving Average
|
|
|
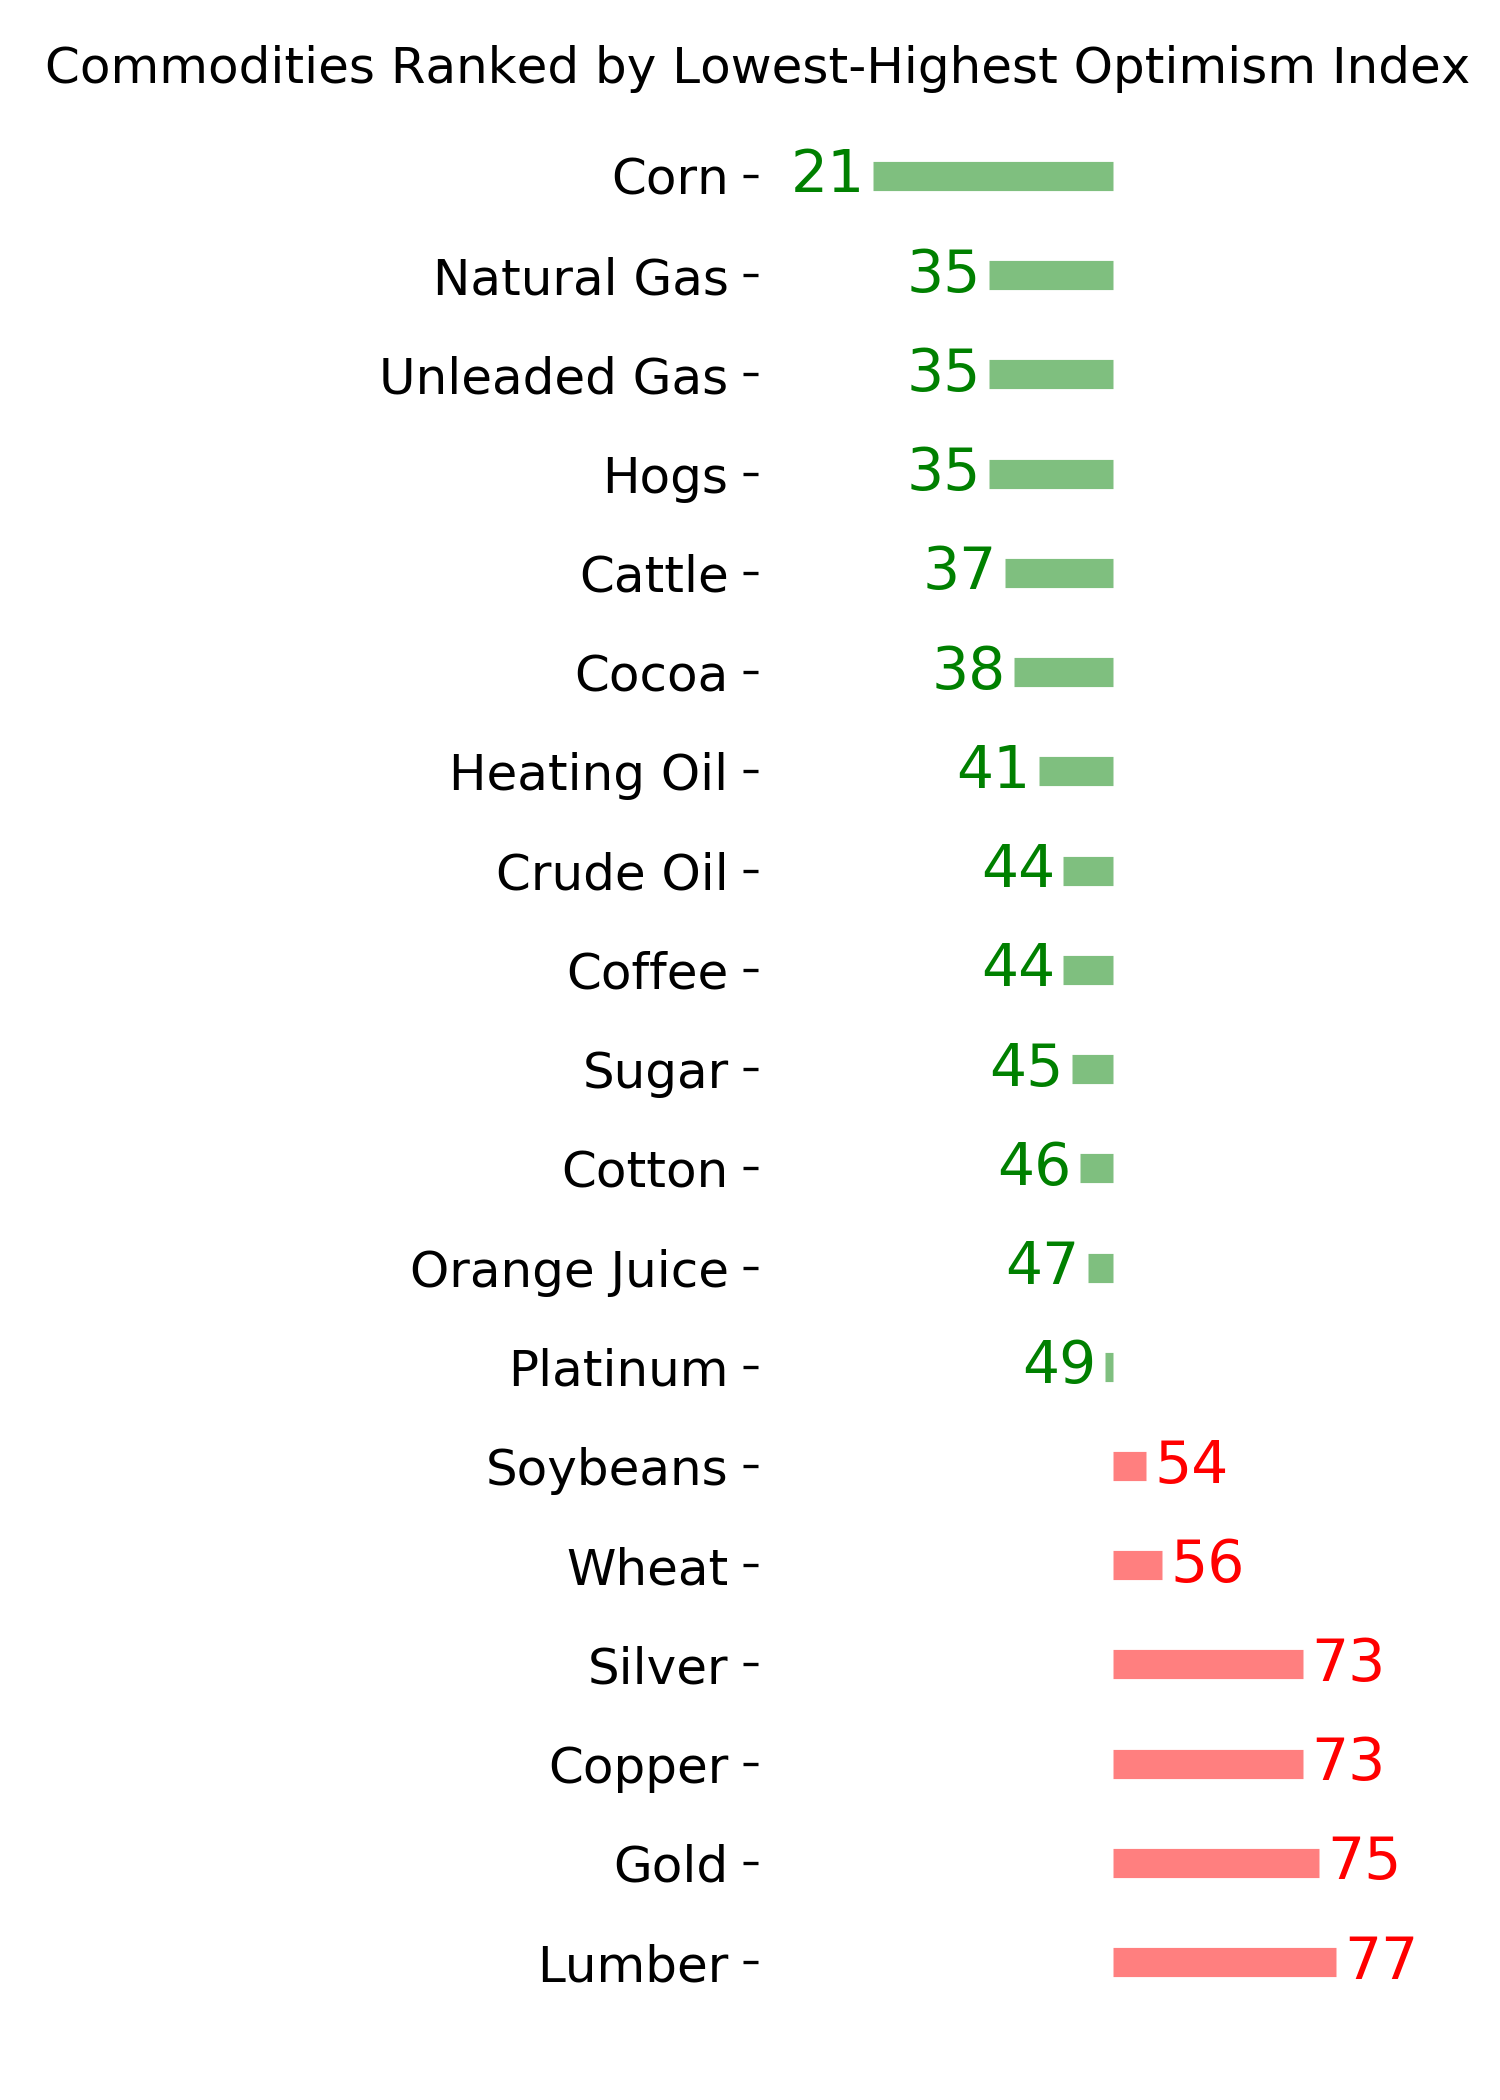
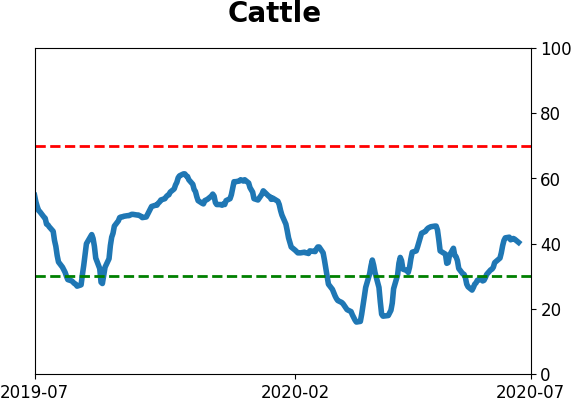
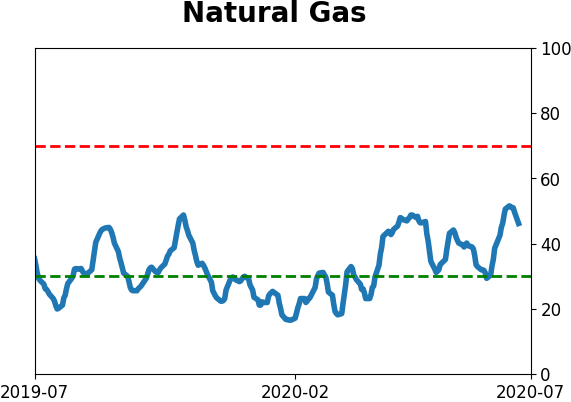
Commodity ETF's - 5-Day Moving Average
|
|