Headlines
|
|
As options volume explodes, penny stock trading picks up:
Options volume continues to skew toward speculative trades, with call volume nearing historic highs relative to S&P 500 volume. At the same time, volume in penny stocks is hitting multi-year highs, but it's still well below prior extremes.
Small business sales outlook rebounds:
Small businesses drive much of the U.S. economic engine, and some of these businesses are seeing an improved outlook on their sales. This reverses historic pessimism from April.
Bottom Line:
- Weight of the evidence has been suggesting flat/lower stock prices short- to medium-term, though that turned more neutral as stocks pulled back recently; still suggesting higher prices long-term
- Indicators show high and declining optimism, as Dumb Money Confidence neared 80% in early June with signs of reckless speculation, historic buying pressure, then even more speculation during what appears to be an unhealthy market environment
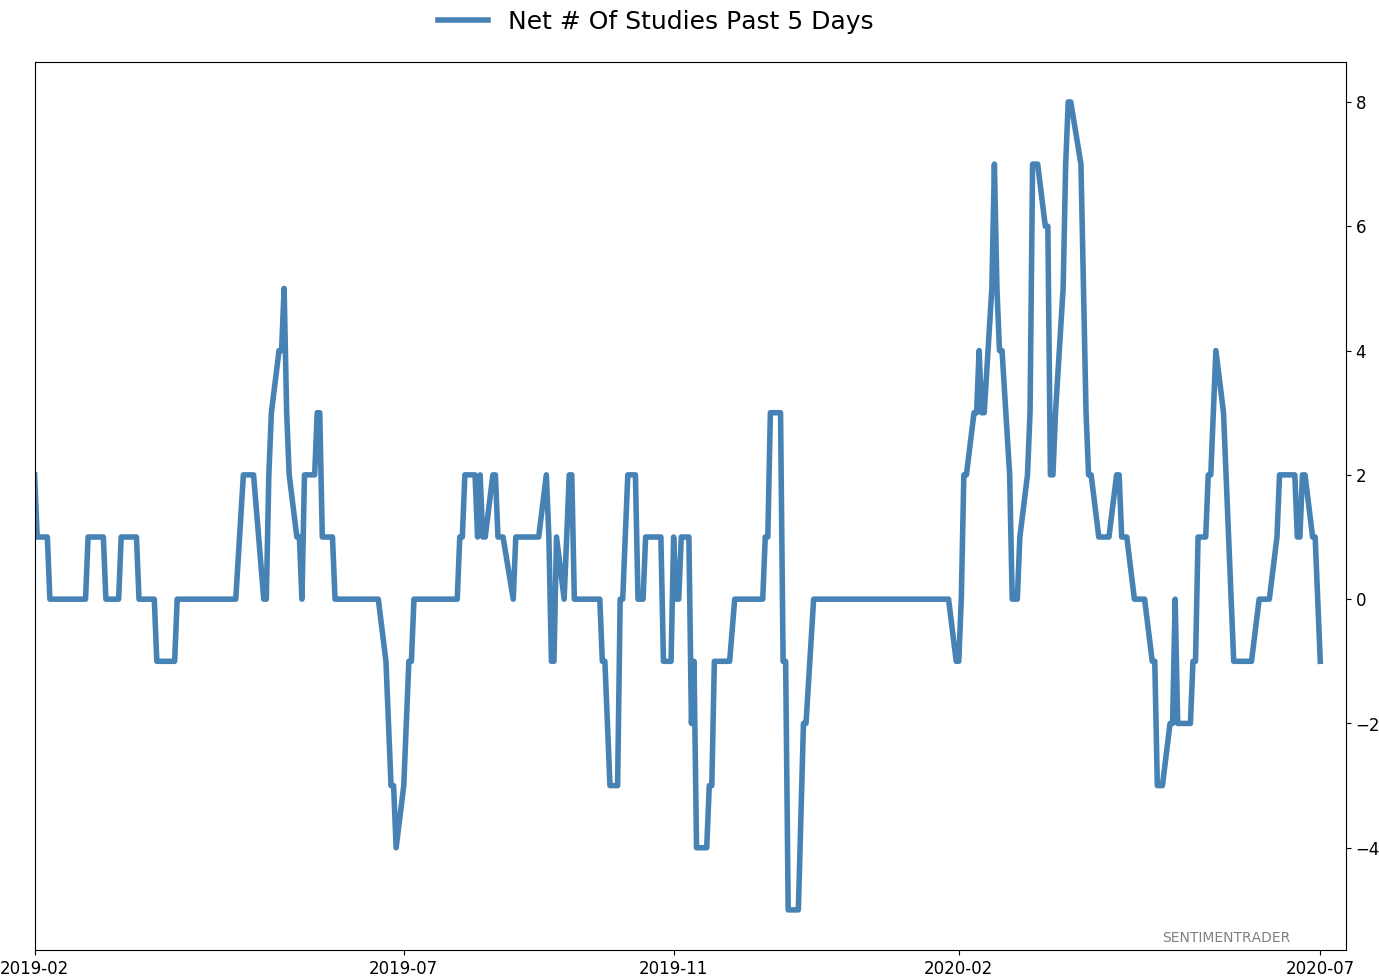
- Active Studies show a heavy positive skew over the medium- to long-term; breadth thrusts, recoveries, and trend changes have an almost unblemished record at preceding higher prices over a 6-12 month time frame
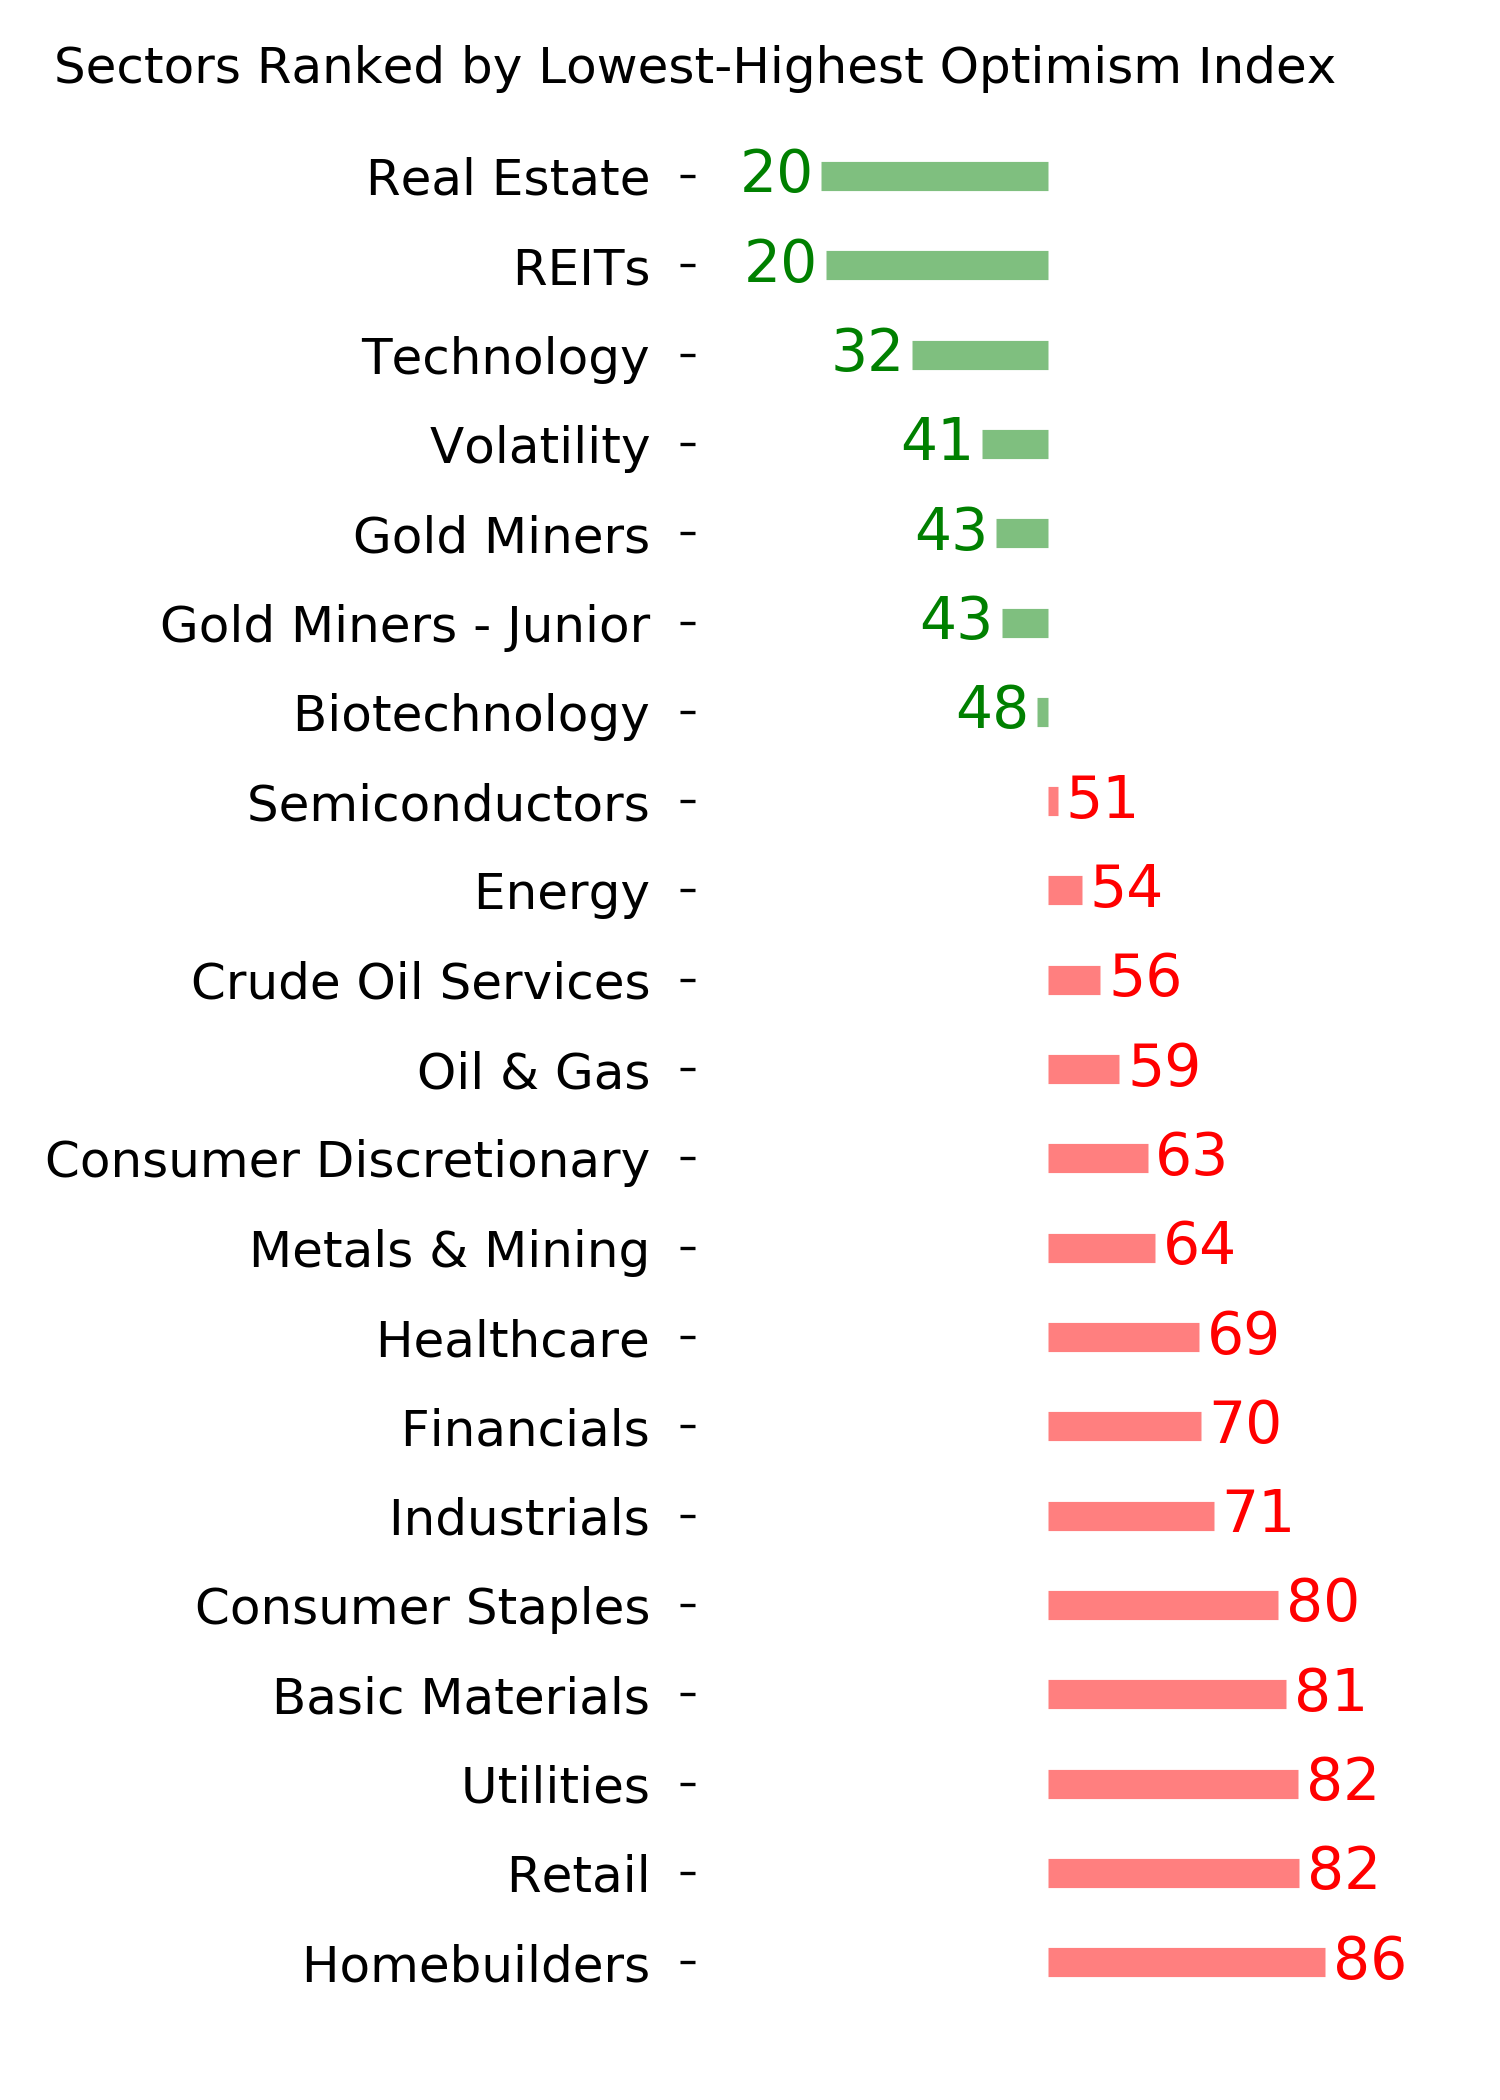
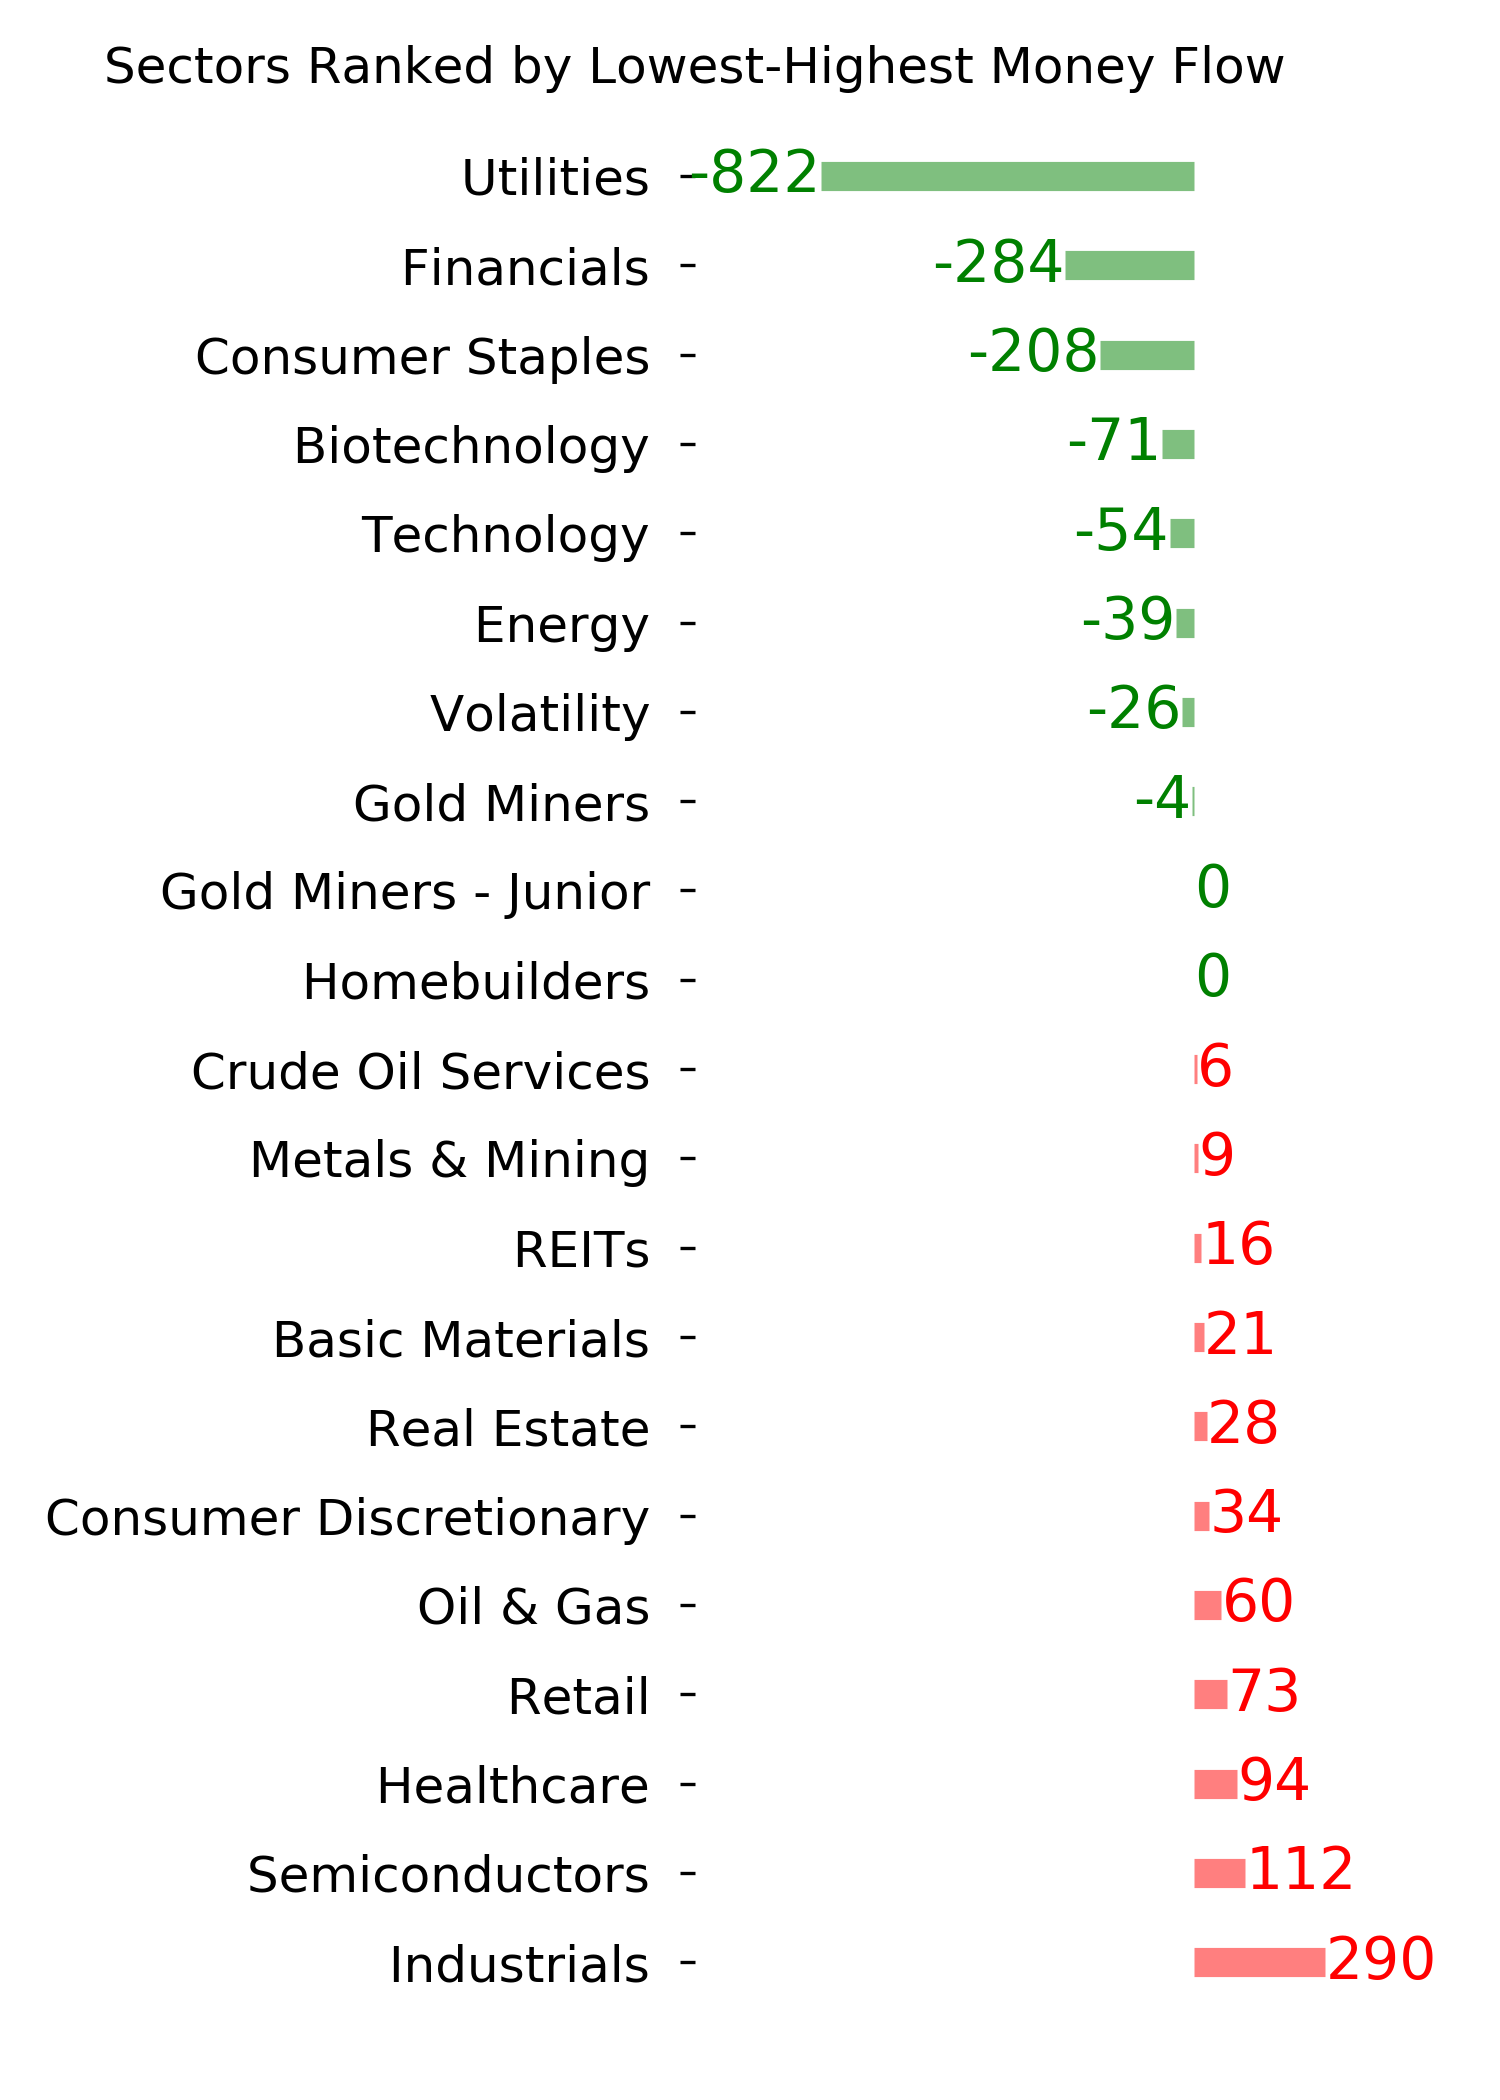
- Signs of extremely skewed preference for tech stocks nearing exhaustion, especially relative to industrials and financials (here and here)
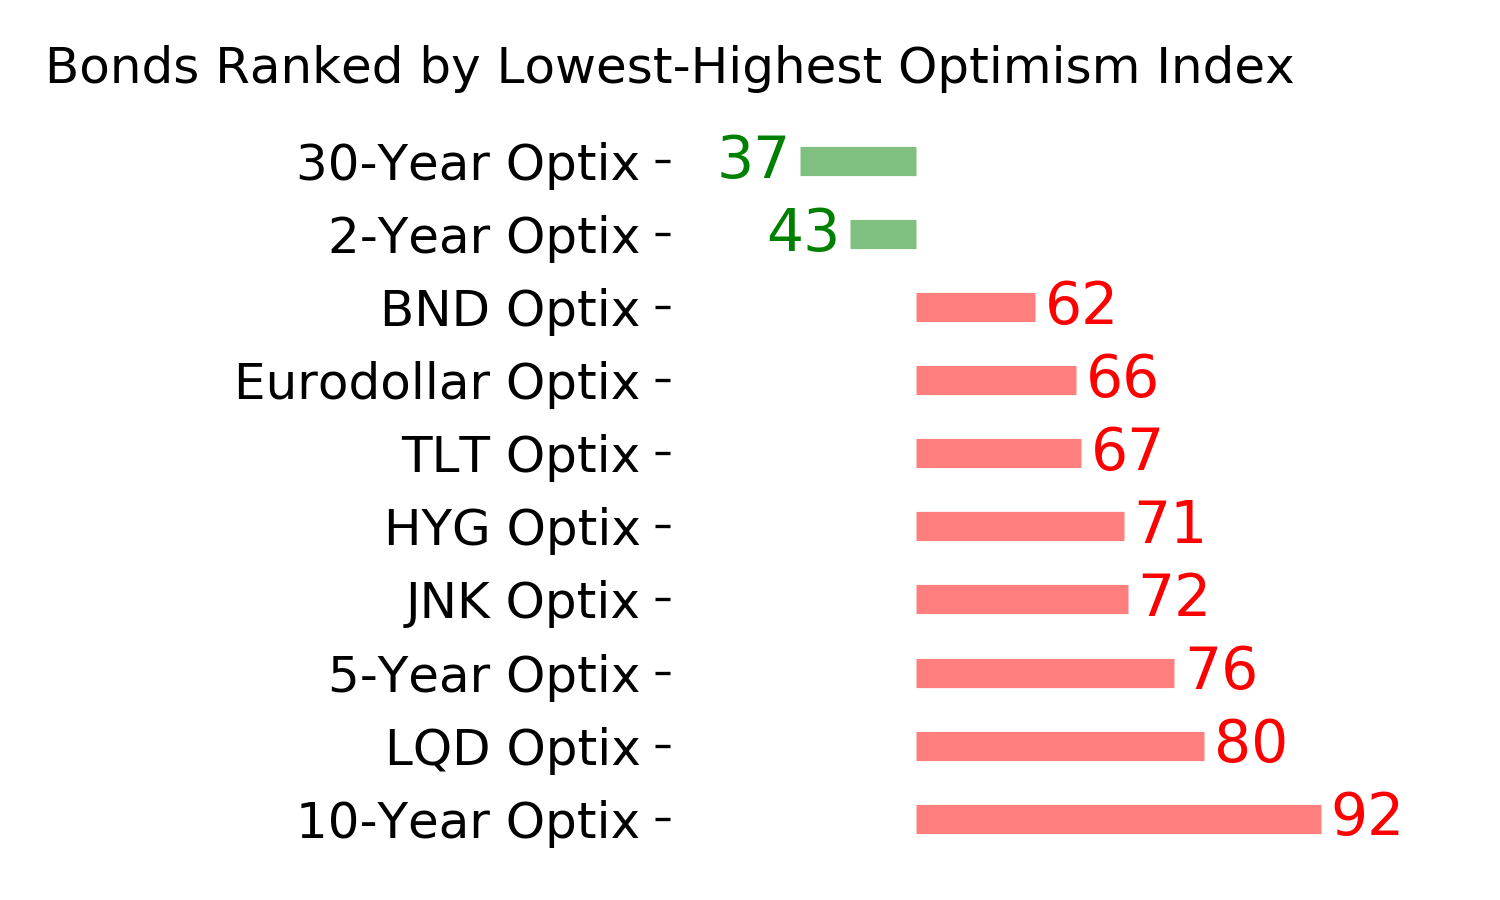
- Indicators and studies for other markets are mixed with no strong conclusion, though it's not a great sign for Treasuries that hedgers are net short.
|
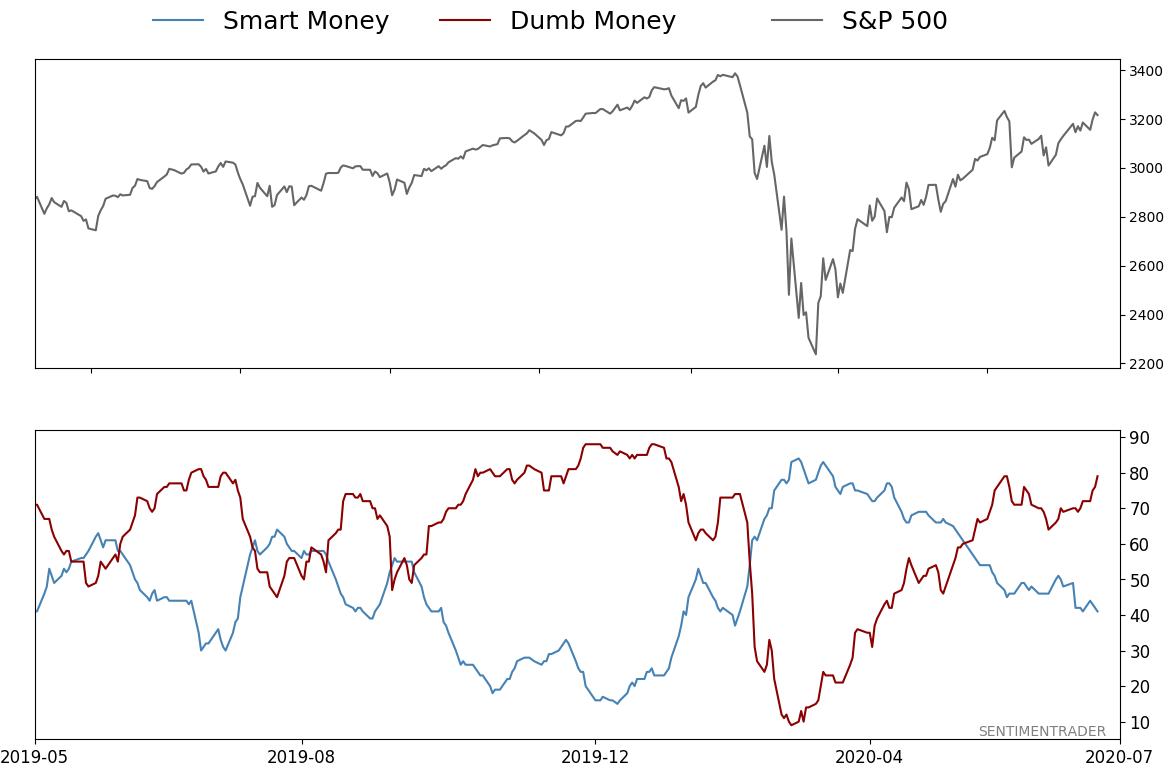
Smart / Dumb Money Confidence
|
Smart Money Confidence: 41%
Dumb Money Confidence: 79%
|
|
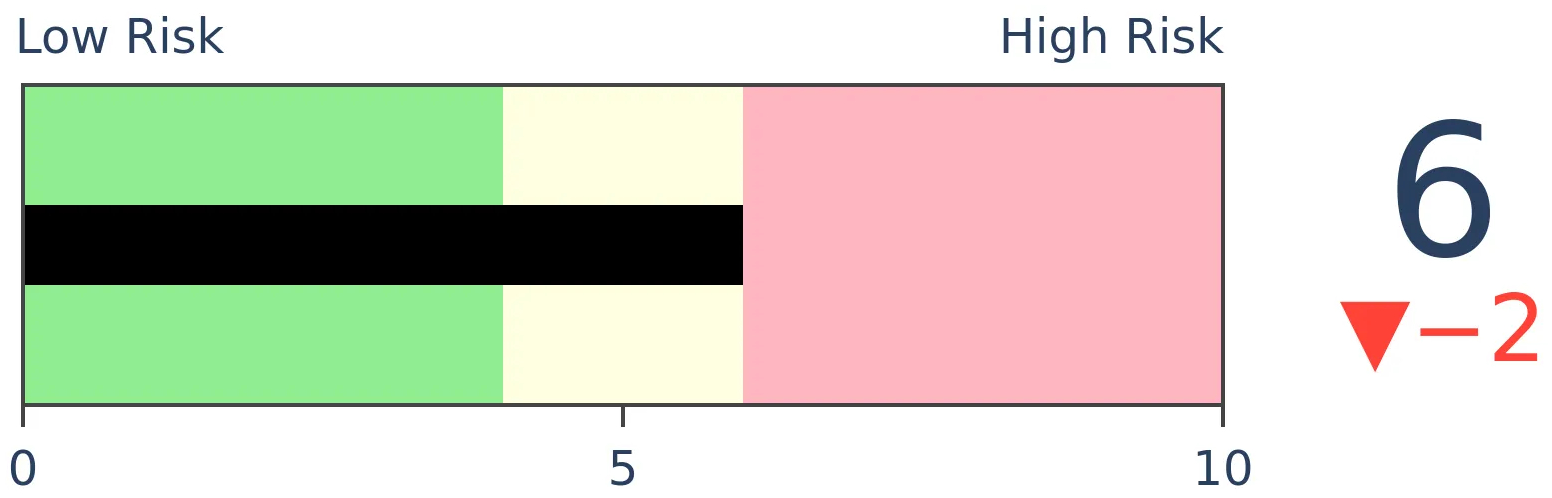
Risk Levels
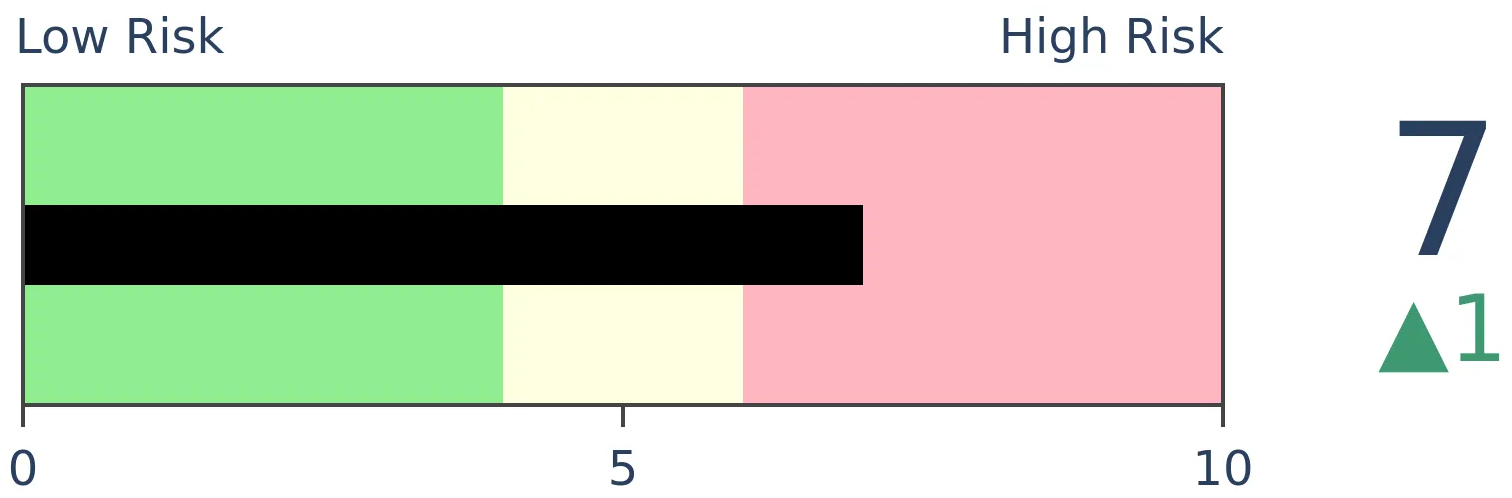
Stocks Short-Term
|
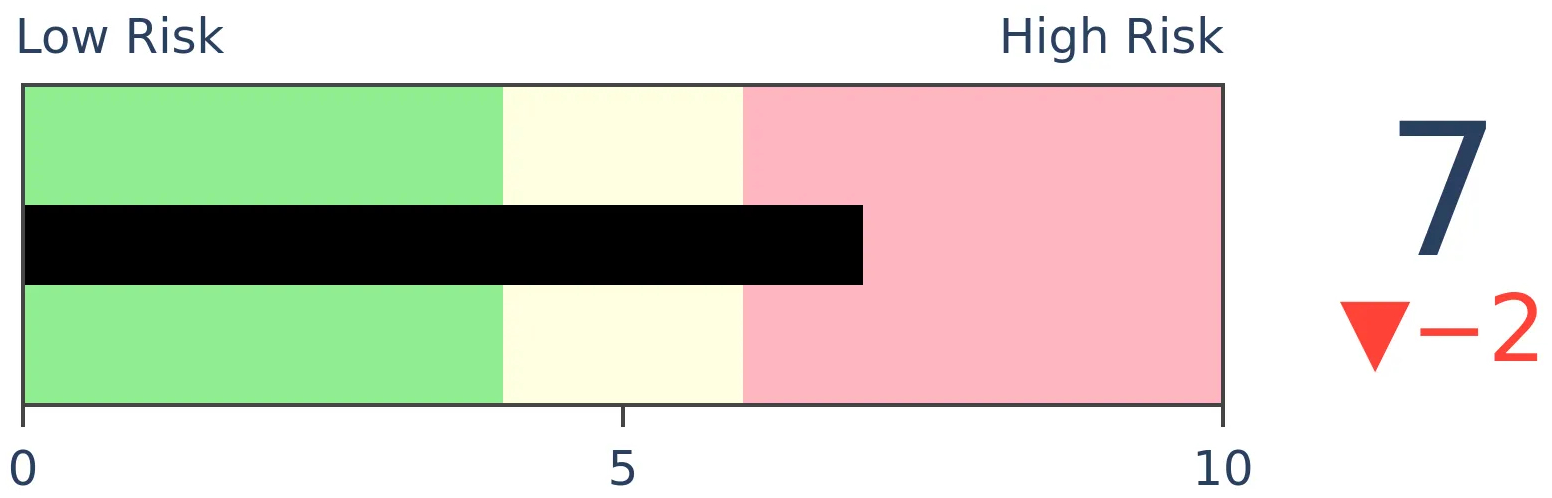
Stocks Medium-Term
|
|
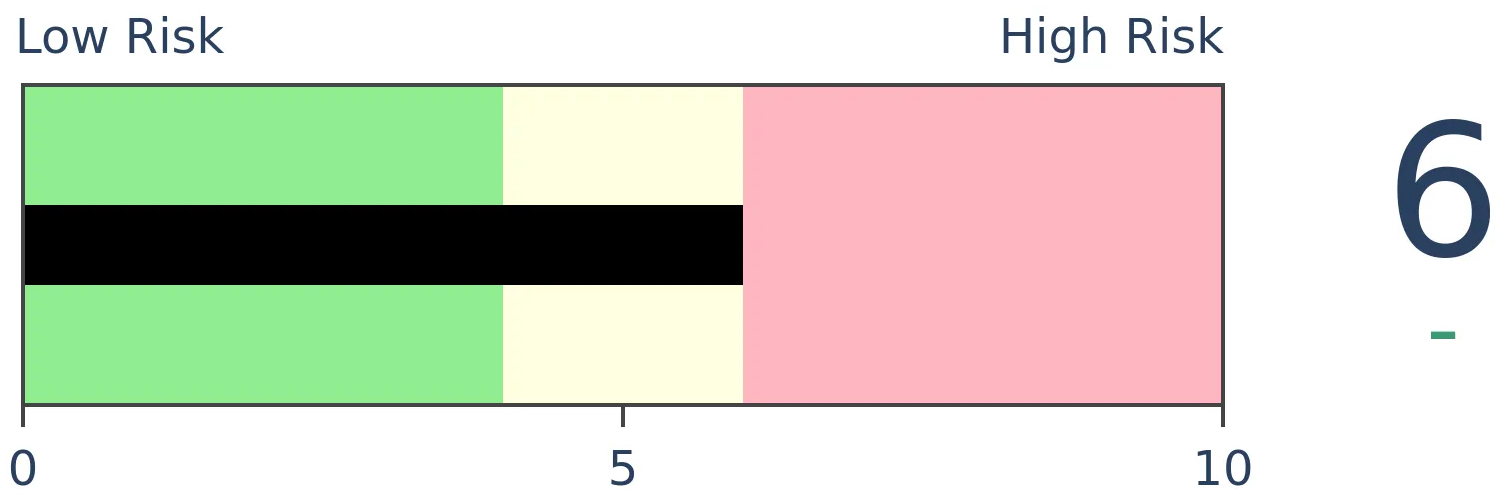
Bonds

|
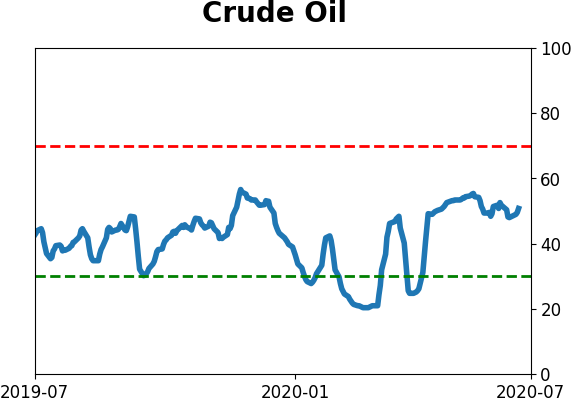
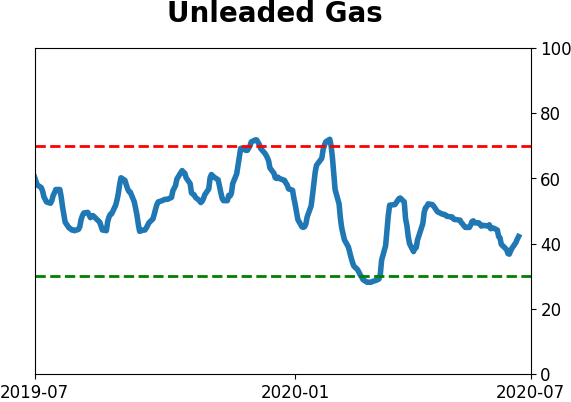
Crude Oil
|
|
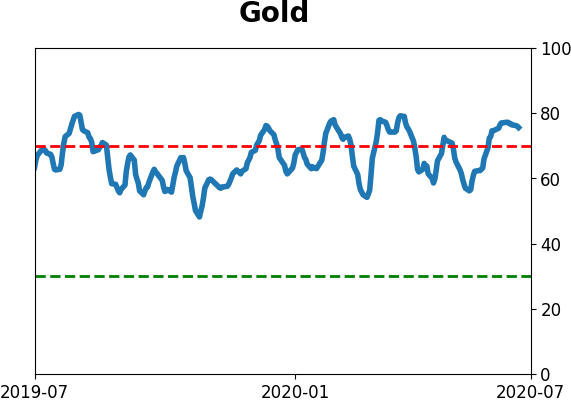
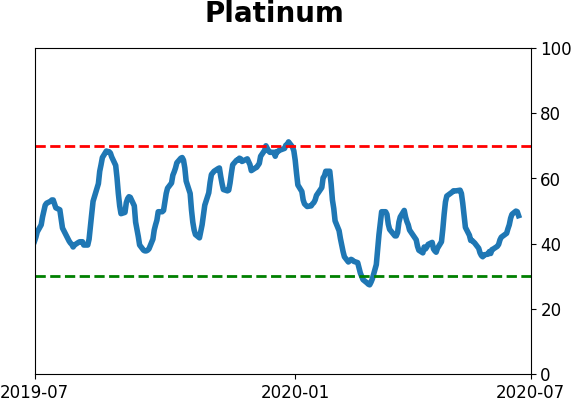
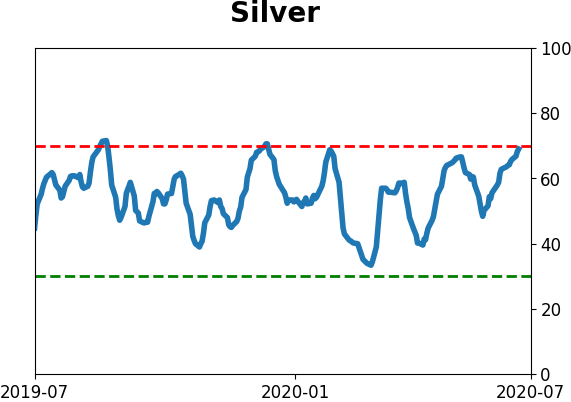
Gold
|
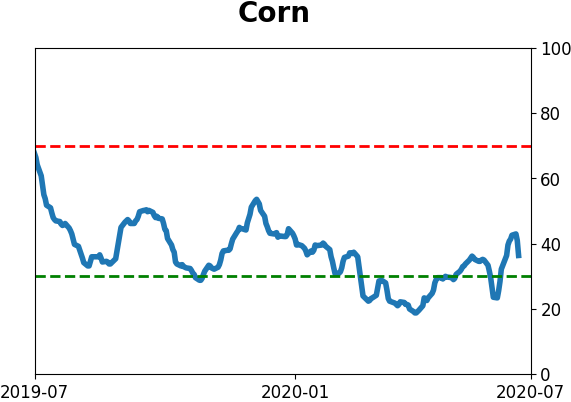
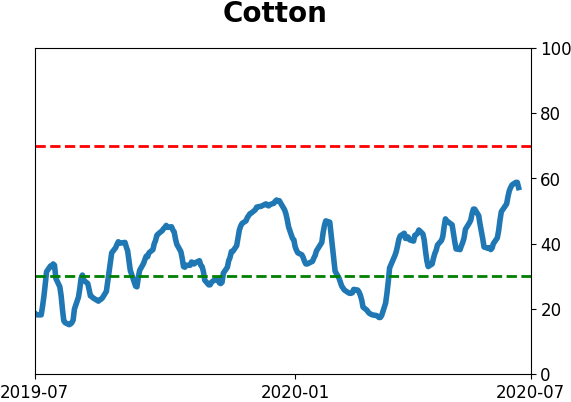
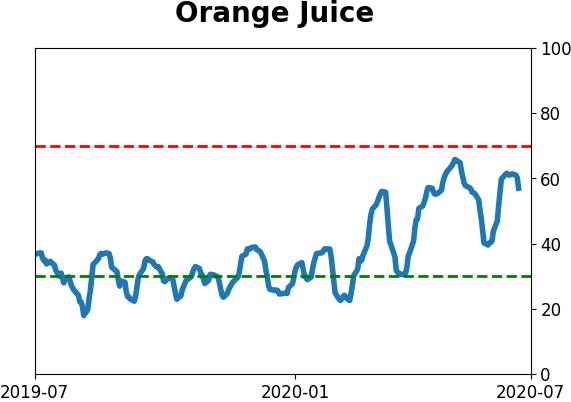
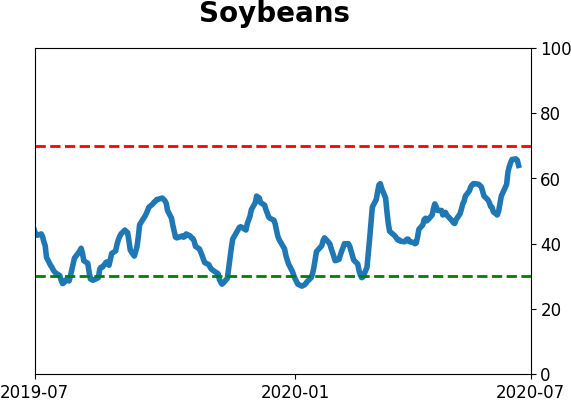
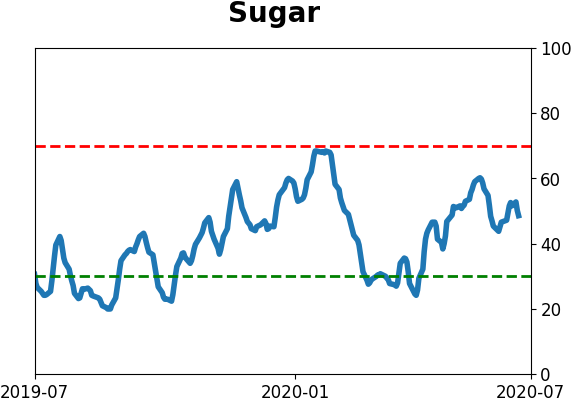
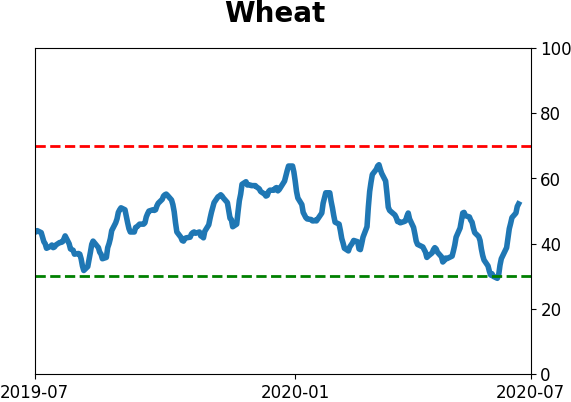
Agriculture

|
|
Research
BOTTOM LINE
Options volume continues to skew toward speculative trades, with call volume nearing historic highs relative to S&P 500 volume. At the same time, volume in penny stocks is hitting multi-year highs, but it's still well below prior extremes.
FORECAST / TIMEFRAME
None
|
With the rise in interest for trading stocks among new investors, one of the concerns is that it's a sign that unsophisticated investors are helping to push markets higher, increasing the likelihood that these gains are only temporary.
While the rise of new accounts is a fact, the implications are far less clear and open for debate. Sentiment among the smallest of traders, especially in the options market, is unprecedented, and that has never been a good sign.
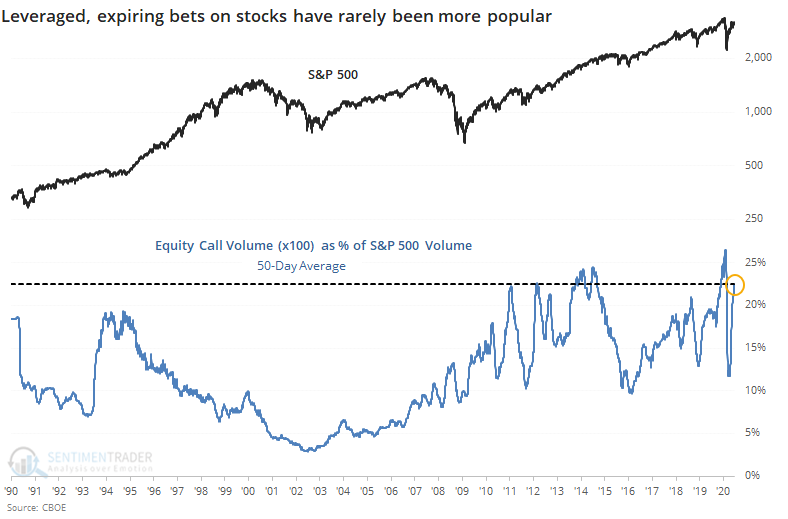
The Equity Put/Call Ratio plunged again on Wednesday, and the 10-day average is now below 0.45 for the first time since the year 2000. If we take a slightly different look than we have in the past, we can see just how much speculative juices are flowing right now, and not just among the smallest of options traders.
Share-equivalent volume in all equity call options on the Chicago Board Options Exchange over the past 50 days is now more than 22% of volume in the S&P 500. That's nearing the record high from February, and the rounded peak formed in 2014 prior to that.
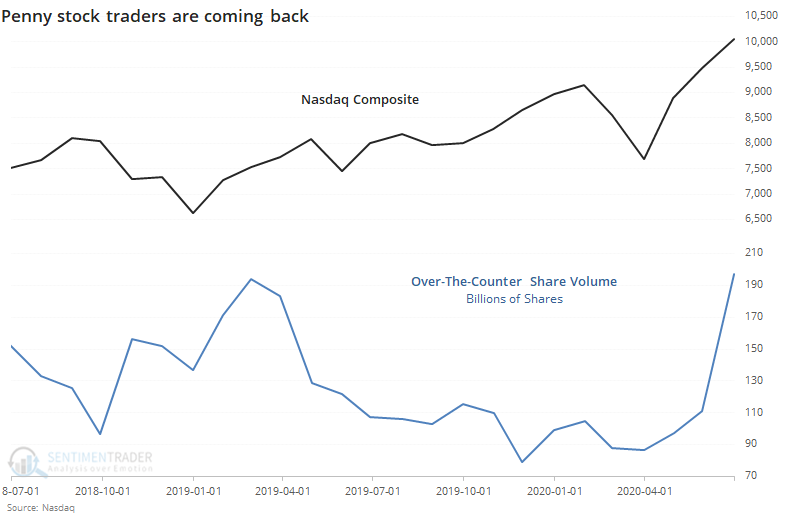
There has been an explosion of new accounts on retail-facing trading platforms, so another place of speculative activity we can check is whether that has translated into a rush into the lowest-priced stocks on the market, those trading over-the-counter, often for less than $1 per share.
According to the latest Nasdaq data, volume in these shares just hit the highest in more than two years.
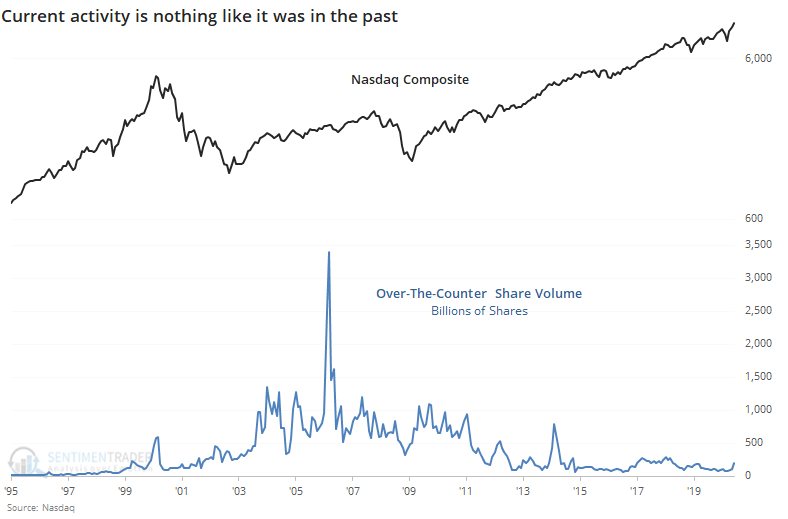
But when we zoom out, it's barely a blip.
Overall trading turnover rose in June as well. While volume on the Nasdaq relative to the S&P 500 is hitting record highs, when we look specifically at these so-called lottery-ticket stocks, it's still relatively subdued.
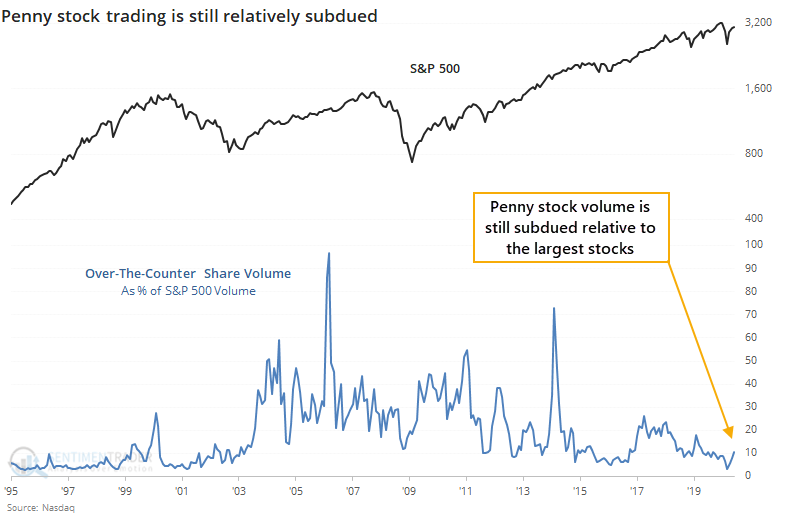
Penny stock trading has been an inconsistent indicator over the decades, so we don't put much weight on it. The fact that it's still somewhat subdued might be a very slight positive over the medium- to long-term. It's much more troubling that we're seeing a lot more - even historic - speculative activity in the leveraged, expiring options market.
BOTTOM LINE
Small businesses drive much of the U.S. economic engine, and some of these businesses are seeing an improved outlook on their sales. This reverses historic pessimism from April.
FORECAST / TIMEFRAME
None
|
The engine that drives the economy looks like it might be getting more fuel.
While huge stocks like Apple generate almost all financial media headlines, it's small businesses that should really be getting the attention, according to the Small Business Administration:
"Small businesses are the lifeblood of the U.S. economy: they create two-thirds of net new jobs and drive U.S. innovation and competitiveness. A new report shows that they account for 44 percent of U.S. economic activity."
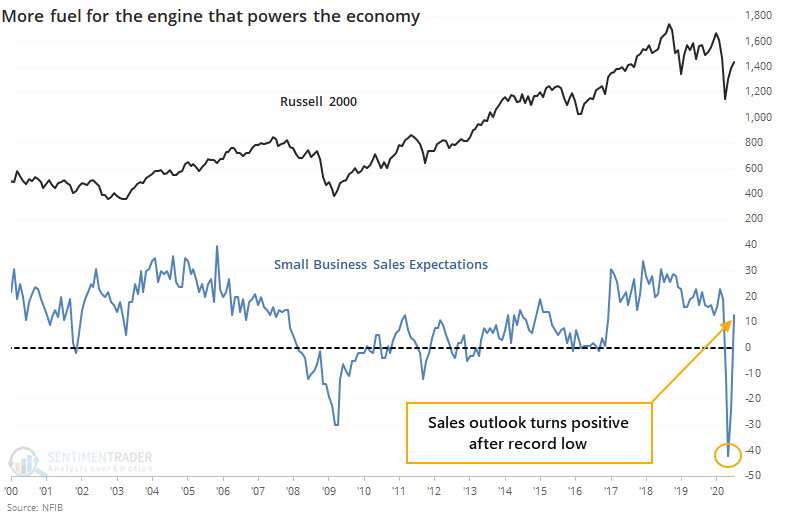
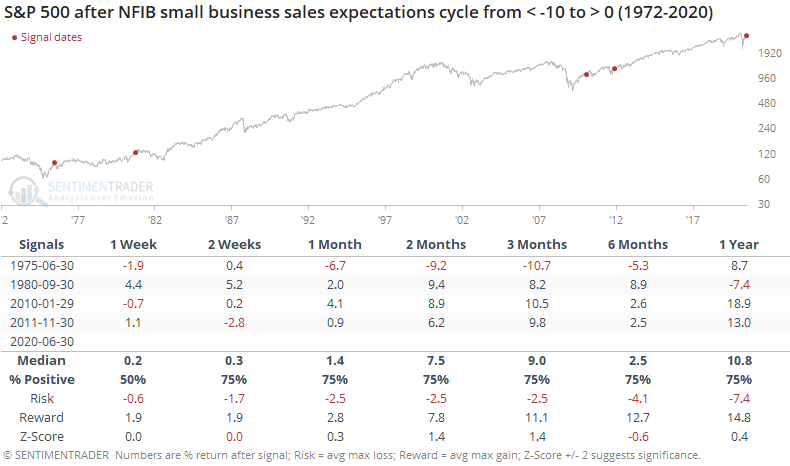
Small businesses can't create jobs if they don't expect to make a profit from their product, and they can't make a profit if they don't have any sales. If we consider that sales are the most important factor, then the latest survey from the National Federation of Independent Business (NFIB) should be a good sign.
Their latest poll of around 800 businesses showed a rebound in sales expectations, turning positive after a record low in April.
This has been a good sign for stocks, except in 1975. The survey was only quarterly then, so it was less sensitive then and is likely a less accurate precedent.
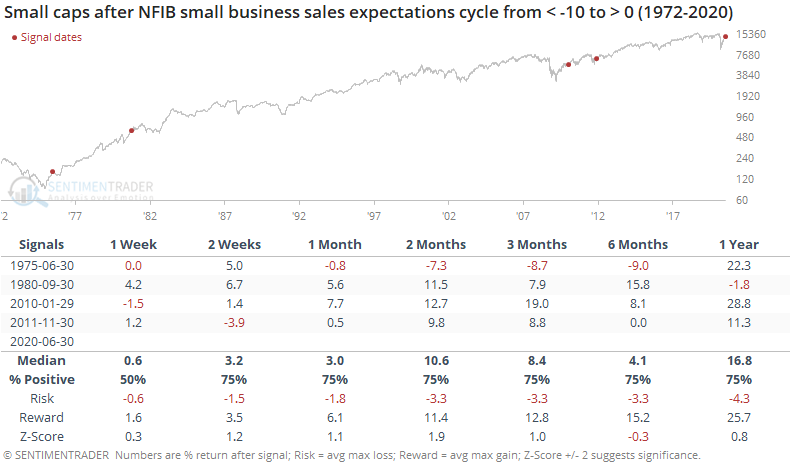
Small-caps (including the Russell 2000 since 1979) also did well. Again, there was that initial medium-term drop in 1975.
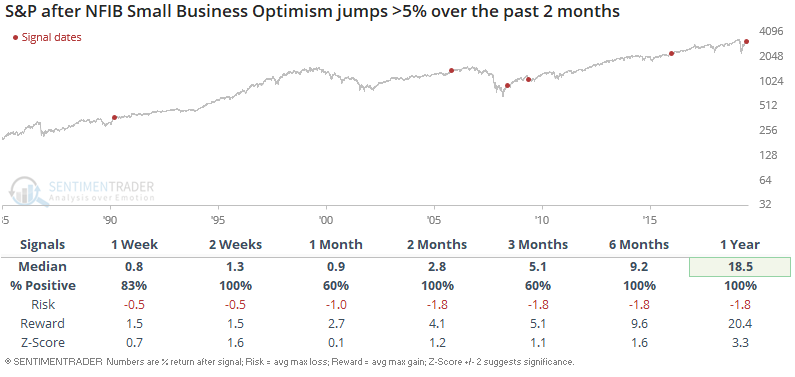
The overall level of optimism from small business, not just about sales but about all aspects of their business, rebounded to above 100, which is more than a 10% jump over the past two months. As Troy mentioned in a premium note, even 5% improvements in overall sentiment have preceded the most impressive gains over the next 6-12 months.
While there are certainly some yellow flags that have been waving for the medium-term since May, we've seen a number of longer-term indicators show impressive improvement from historic lows, and those bode well over a medium- to long-term time frame.
Active Studies
| Time Frame | Bullish | Bearish | | Short-Term | 0 | 0 | | Medium-Term | 8 | 7 | | Long-Term | 44 | 1 |
|
Indicators at Extremes
Portfolio
| Position | Weight % | Added / Reduced | Date | | Stocks | 29.8 | Reduced 9.1% | 2020-06-11 | | Bonds | 0.0 | Reduced 6.7% | 2020-02-28 | | Commodities | 5.2 | Added 2.4%
| 2020-02-28 | | Precious Metals | 0.0 | Reduced 3.6% | 2020-02-28 | | Special Situations | 0.0 | Reduced 31.9% | 2020-03-17 | | Cash | 65.0 | | |
|
Updates (Changes made today are underlined)
In the first months of the year, we saw manic trading activity. From big jumps in specific stocks to historic highs in retail trading activity to record highs in household confidence to almost unbelievable confidence among options traders. All of that came amid a market where the average stock couldn't keep up with their indexes. There were signs of waning momentum in stocks underlying the major averages, which started triggering technical warning signs in late January. After stocks bottomed on the 23rd, they enjoyed a historic buying thrust and retraced a larger amount of the decline than "just a bear market rally" tends to. Those thrusts are the most encouraging sign we've seen in years. Through early June, we were still seeing thrusts that have led to recoveries in longer-term breadth metrics. The longer-term prospects for stocks (6-12 months) still look decent given the above. On a short- to medium-term basis, it was getting harder to make that case. Dumb Money Confidence spiked and there were multiple signs of a historic level of speculation. This is likely the lowest I will go given what I still consider to be compelling positives over a longer time frame. There is not a slam-dunk case to be made for either direction, so it will seem like a mistake whether stocks keep dropping (why didn't I sell more?) or if they turn and head higher (why did I let short-term concerns prevail?). After nearly three decades of trading, I've learned to let go of the idea of perfection.
RETURN YTD: -4.6% 2019: 12.6%, 2018: 0.6%, 2017: 3.8%, 2016: 17.1%, 2015: 9.2%, 2014: 14.5%, 2013: 2.2%, 2012: 10.8%, 2011: 16.5%, 2010: 15.3%, 2009: 23.9%, 2008: 16.2%, 2007: 7.8%
|
|
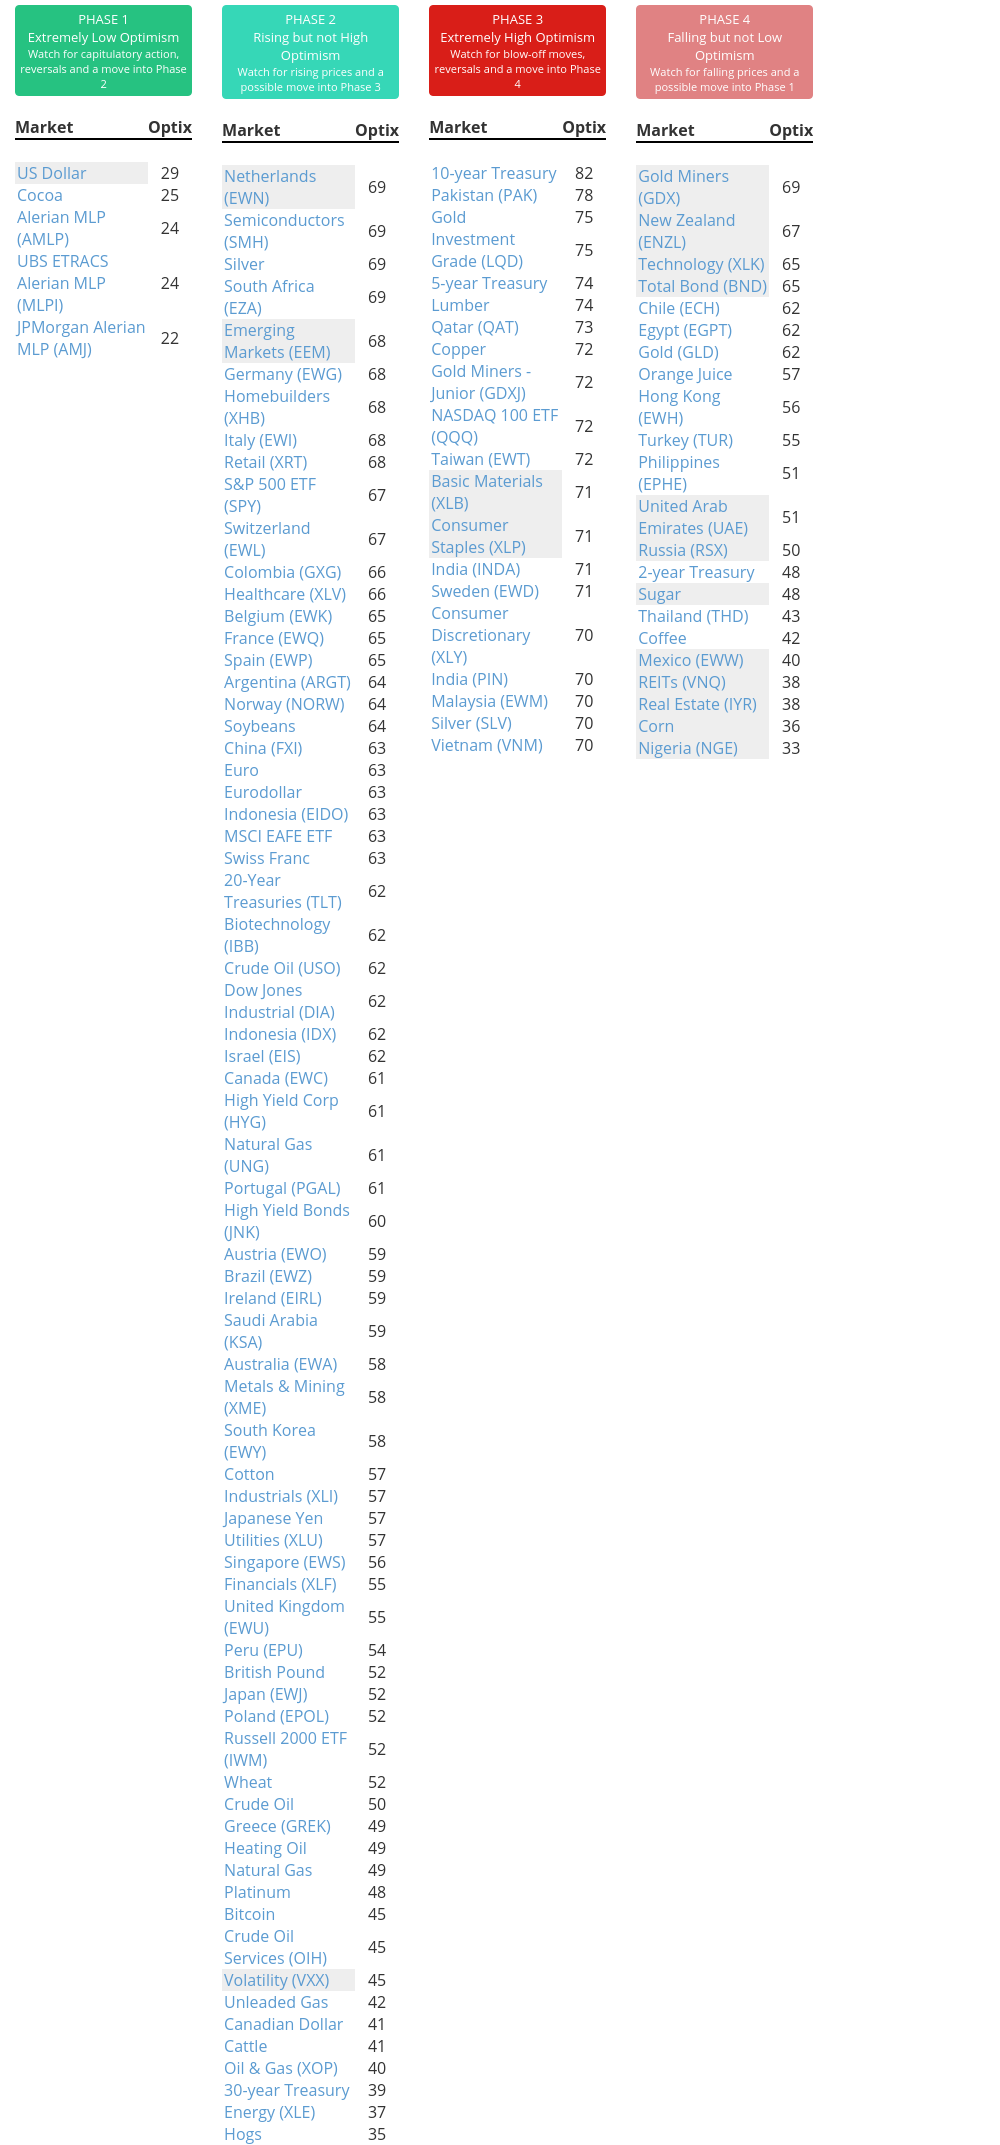
Phase Table
Ranks
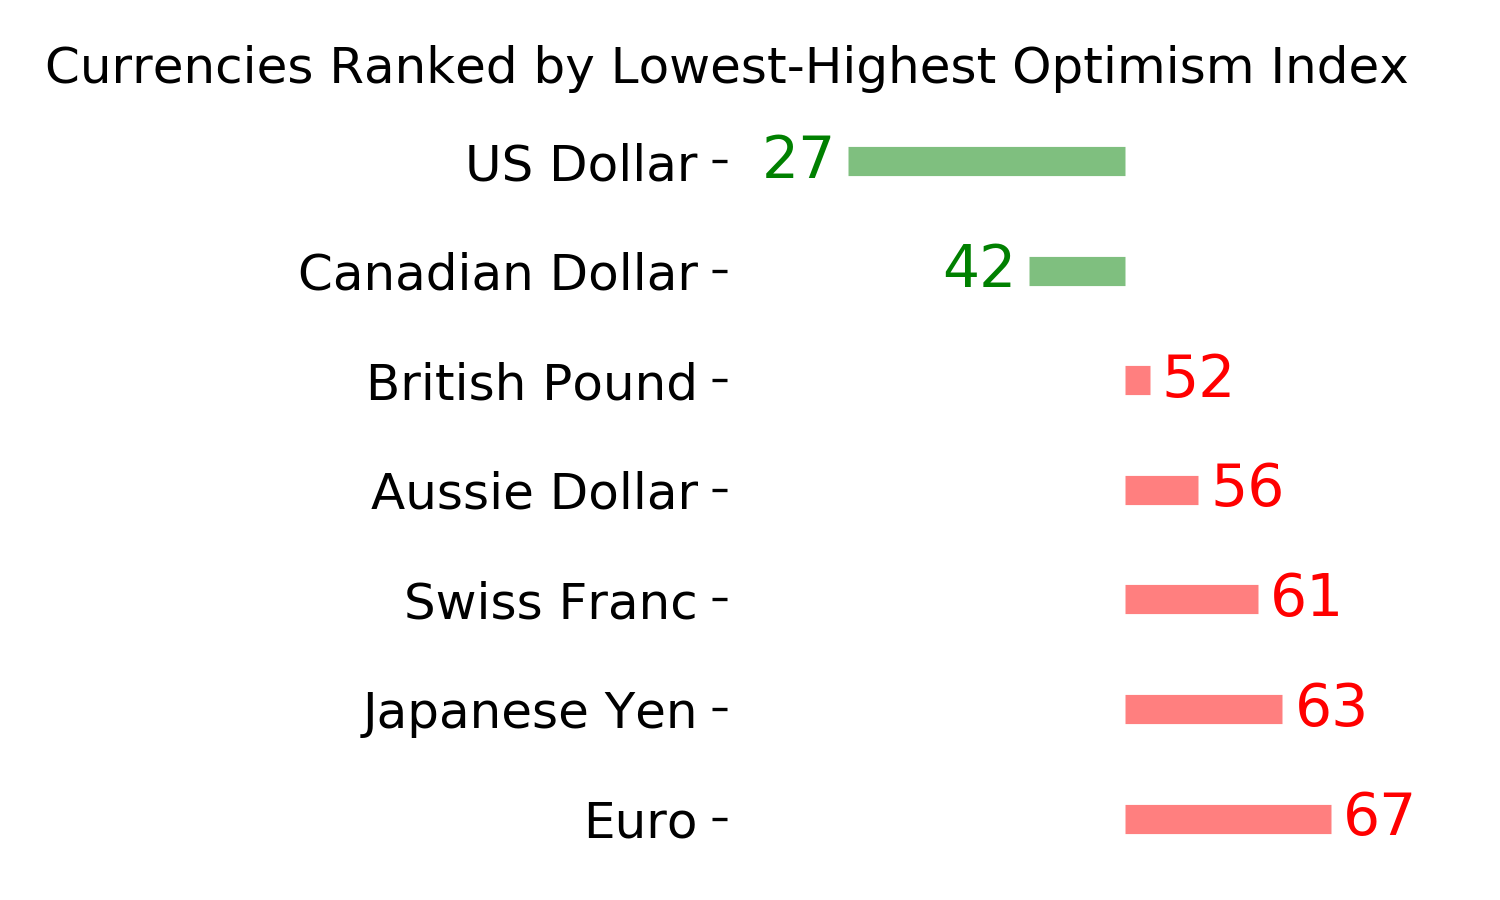
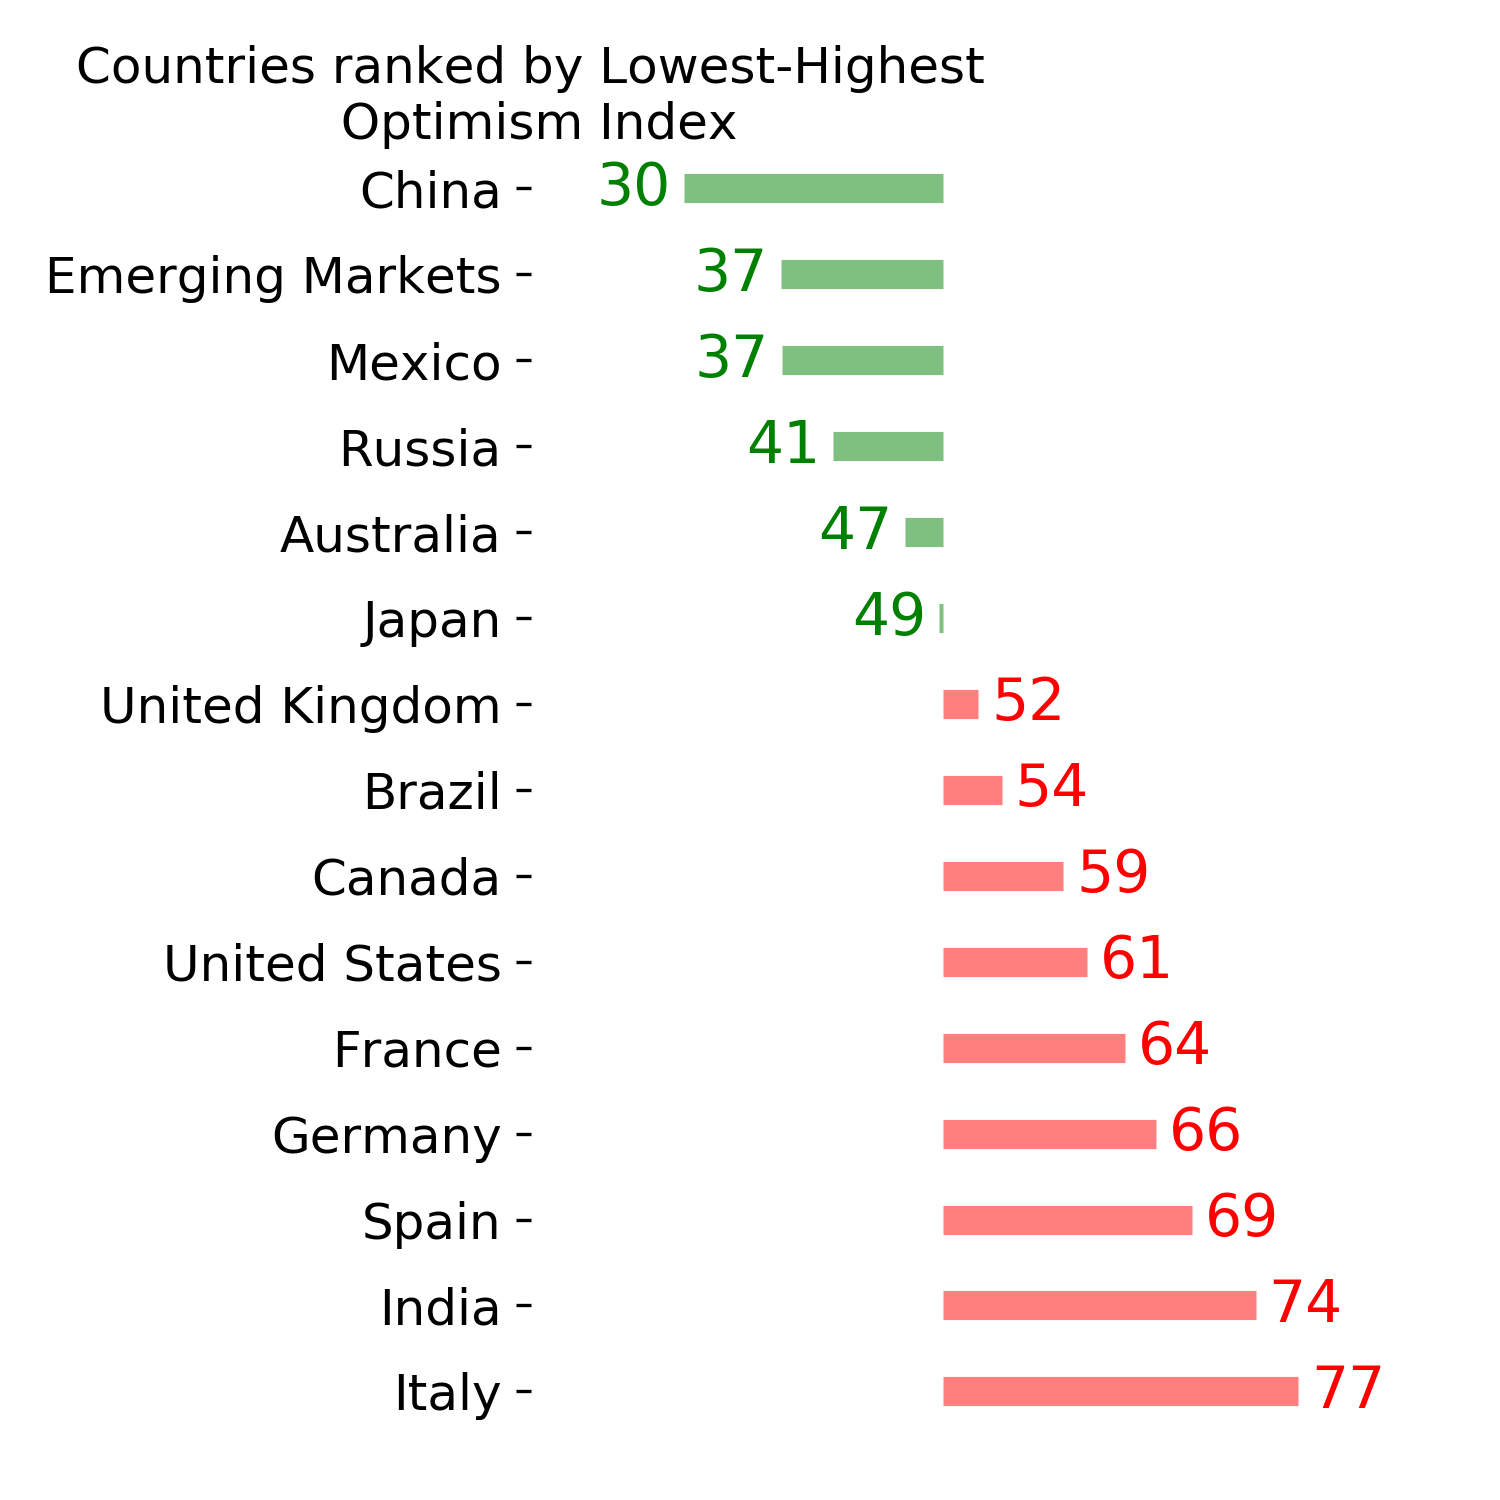
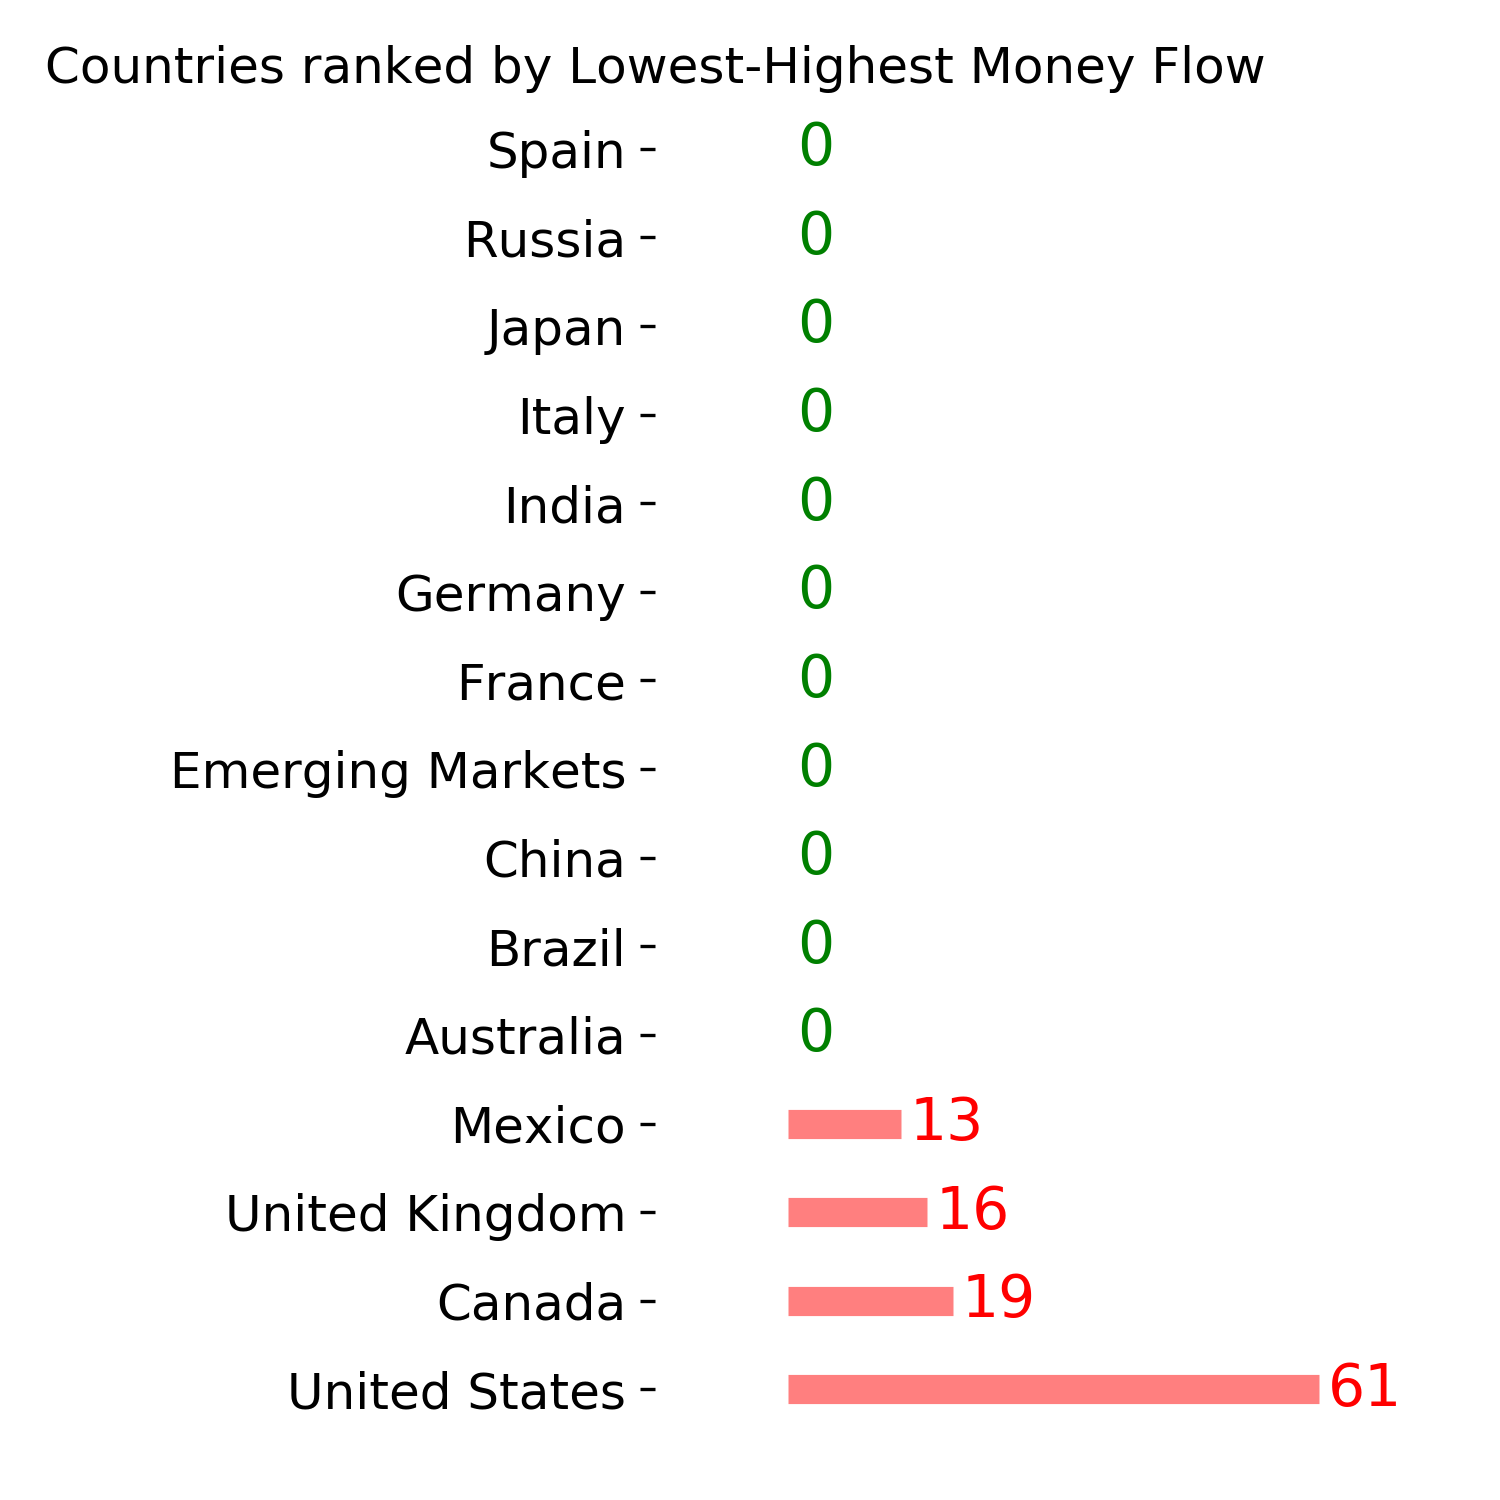
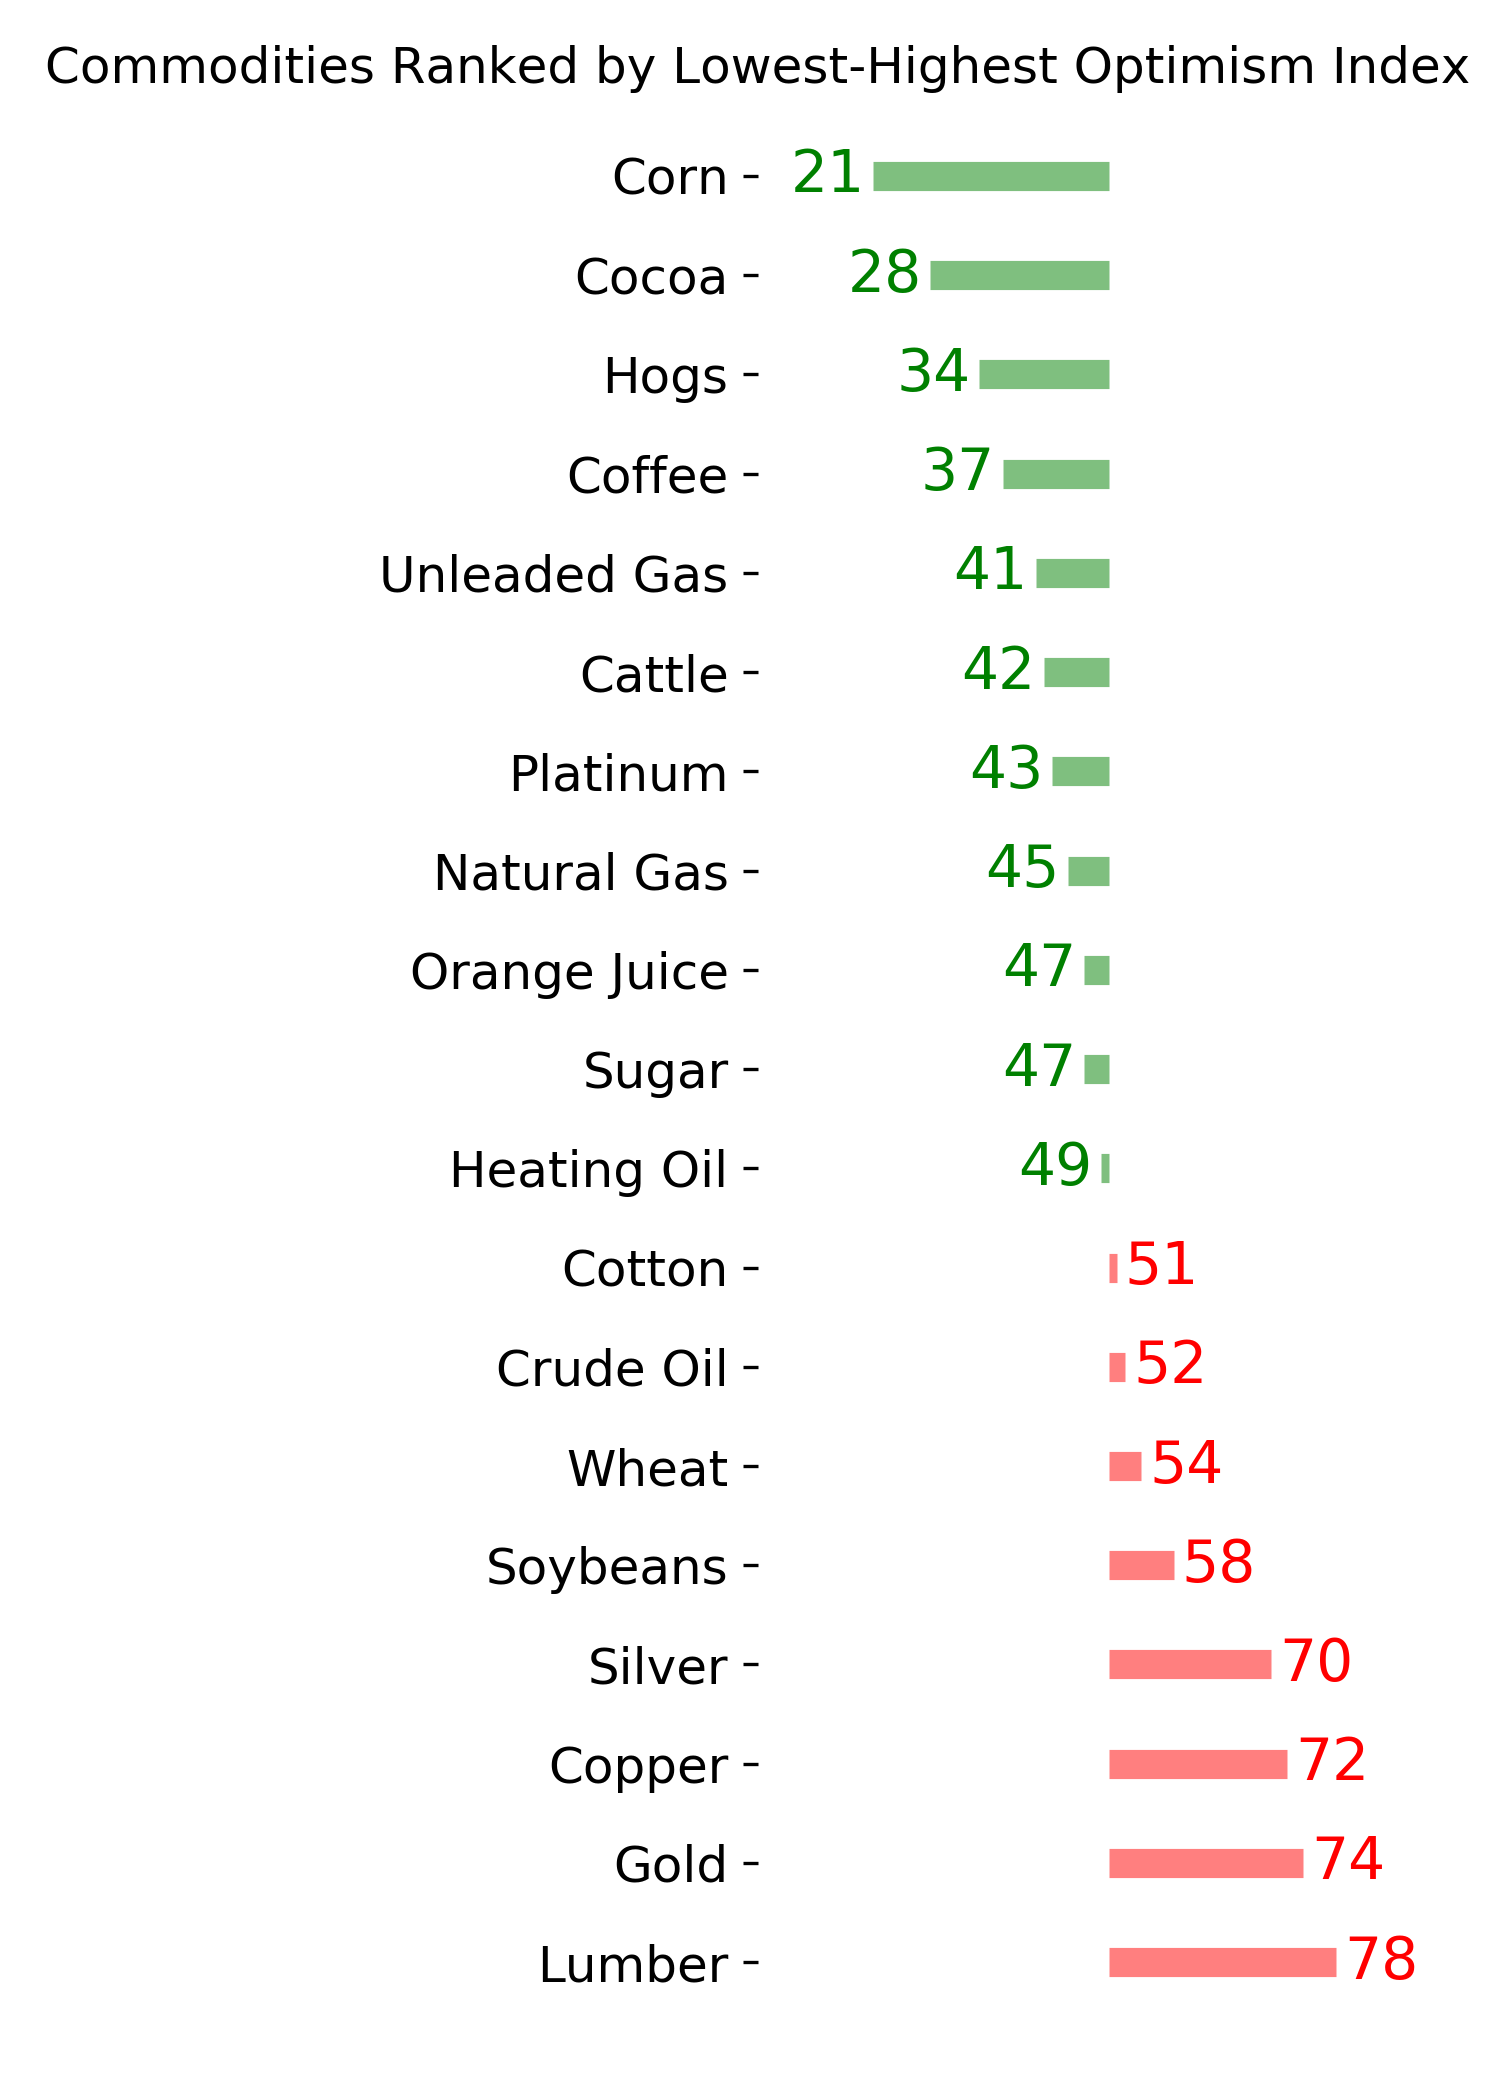
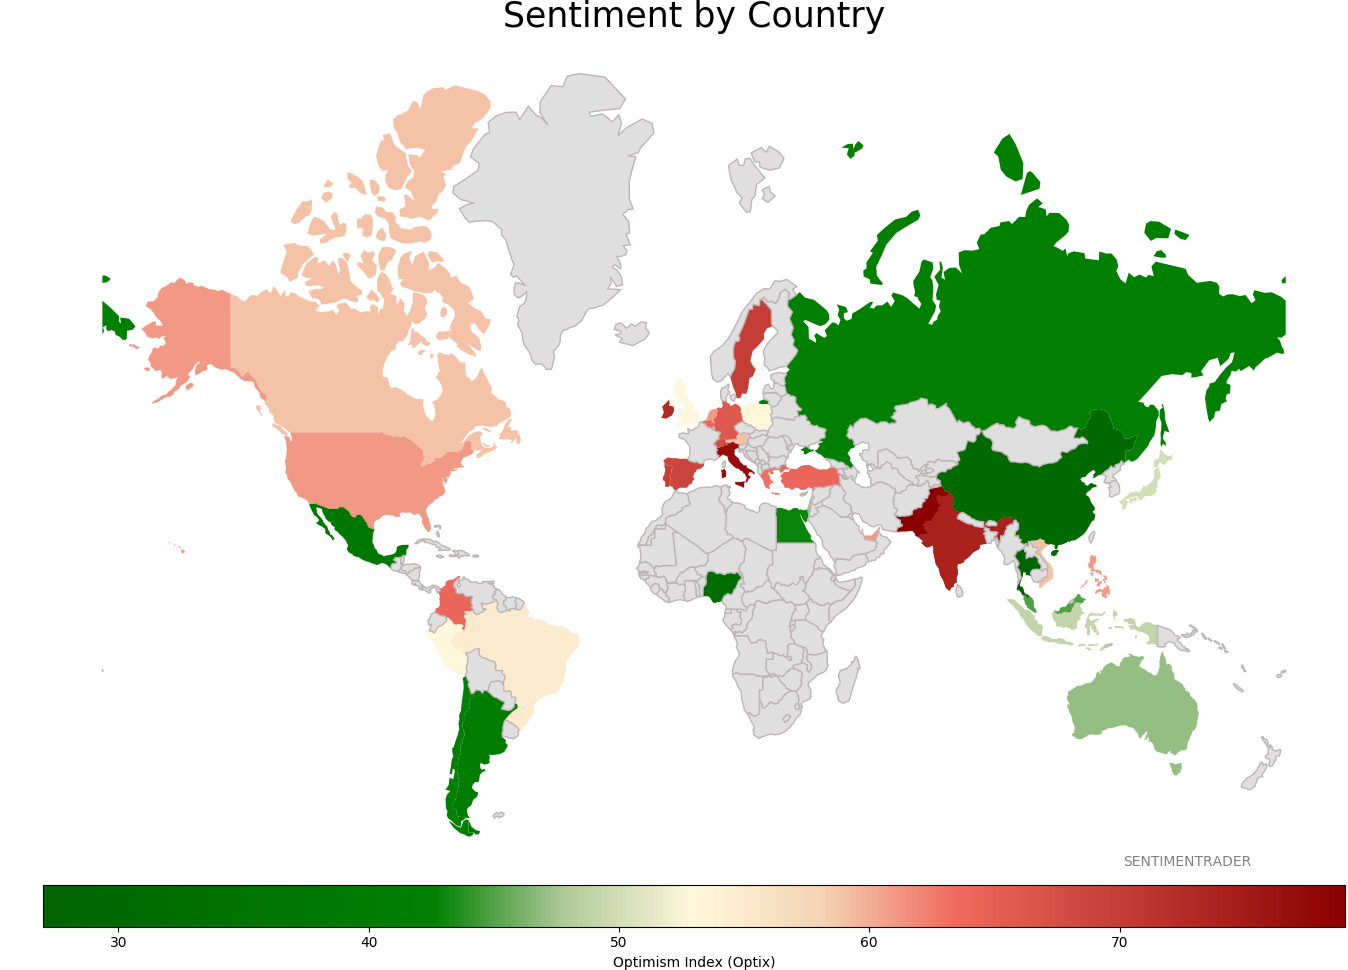
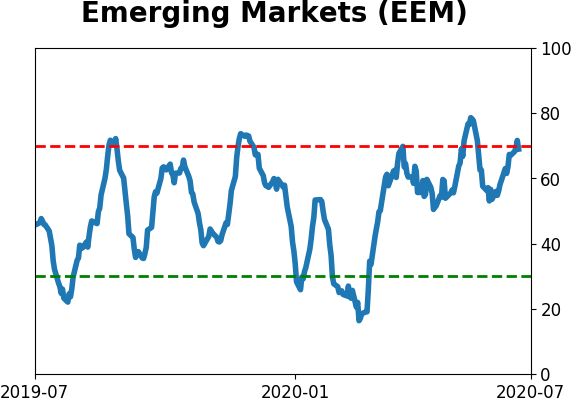
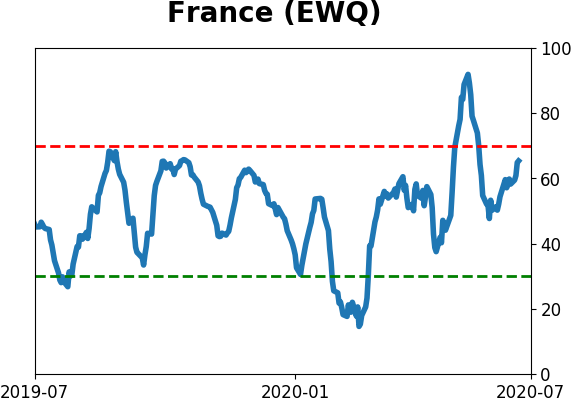
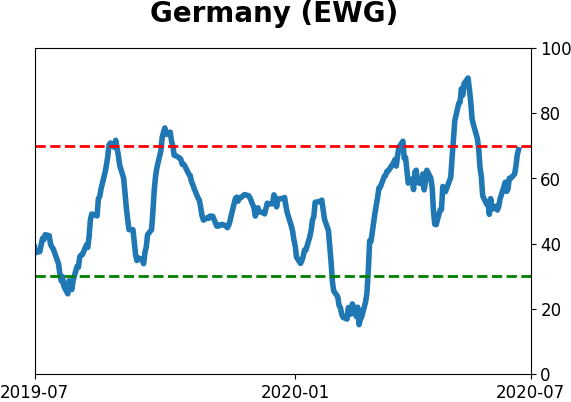
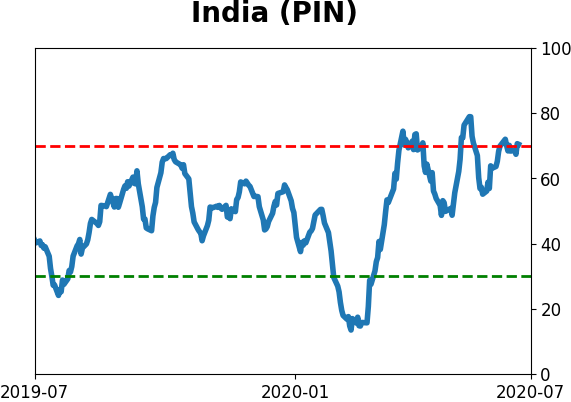
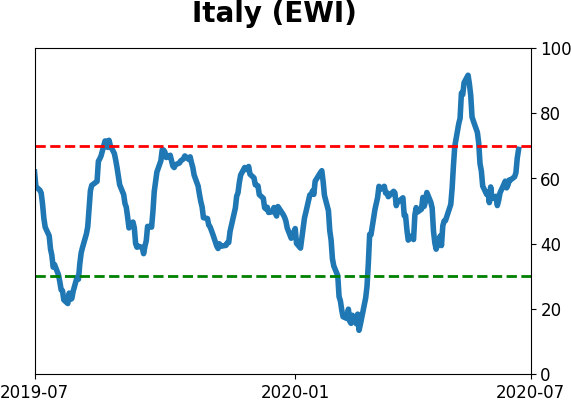
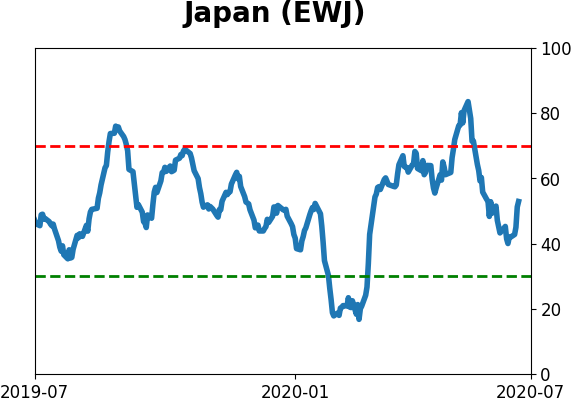
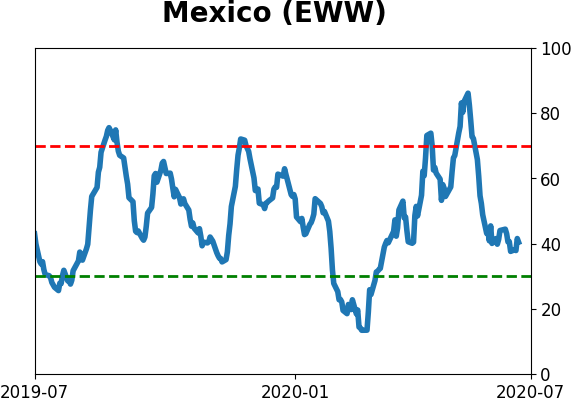
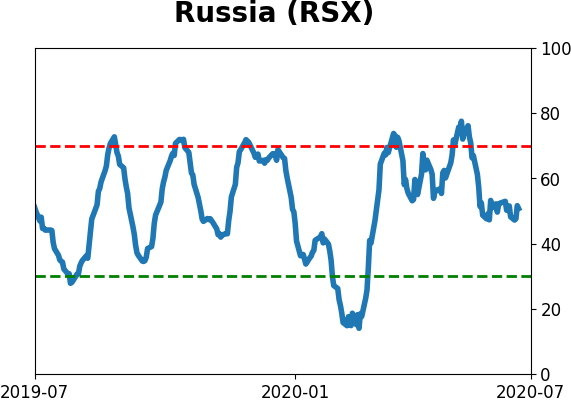
Sentiment Around The World
Optimism Index Thumbnails
|
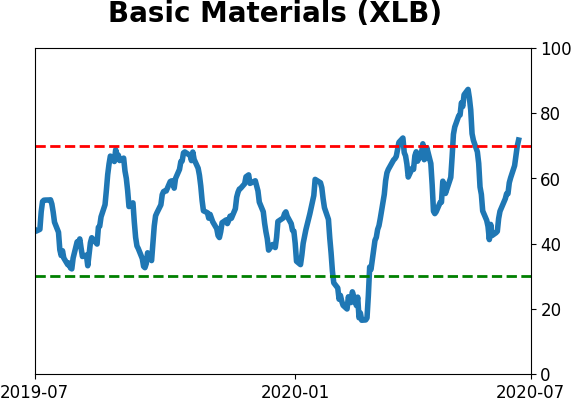
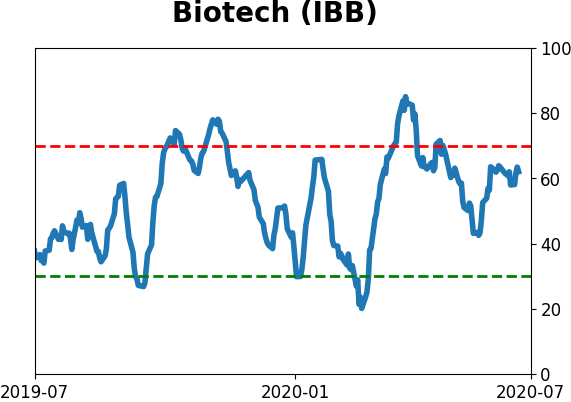
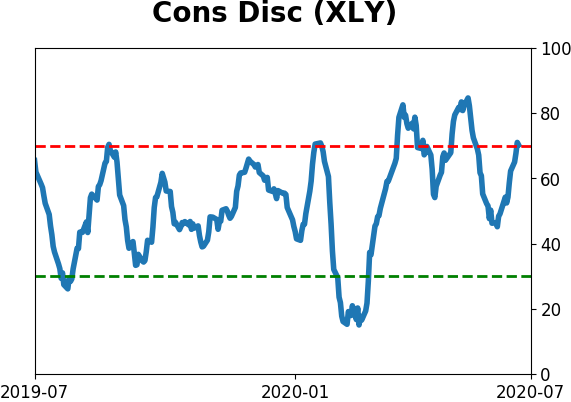
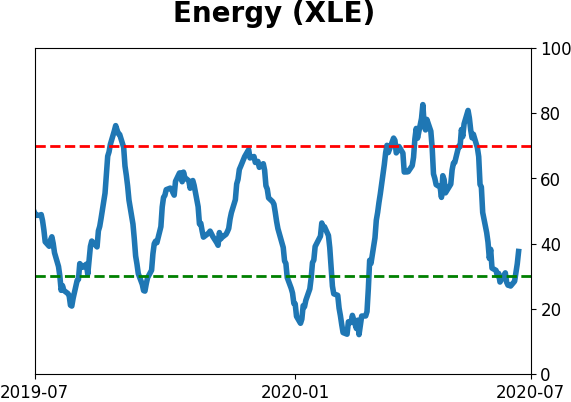
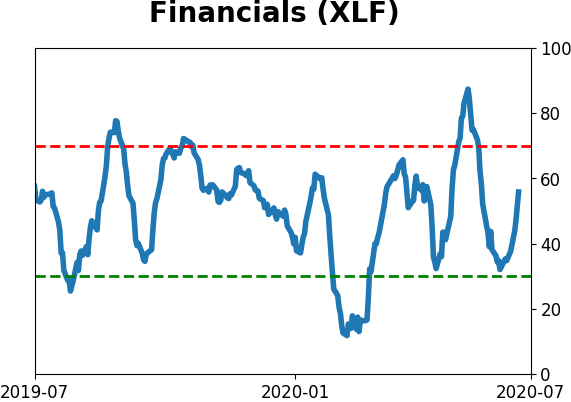
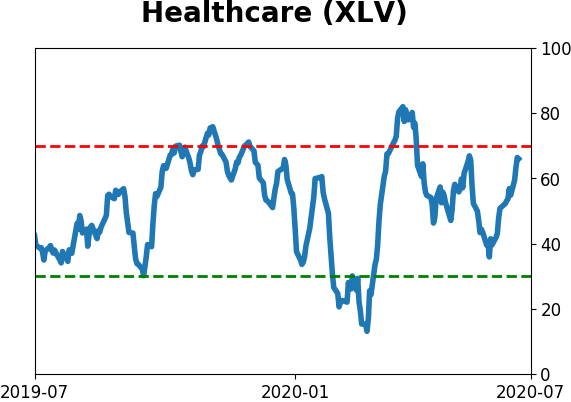
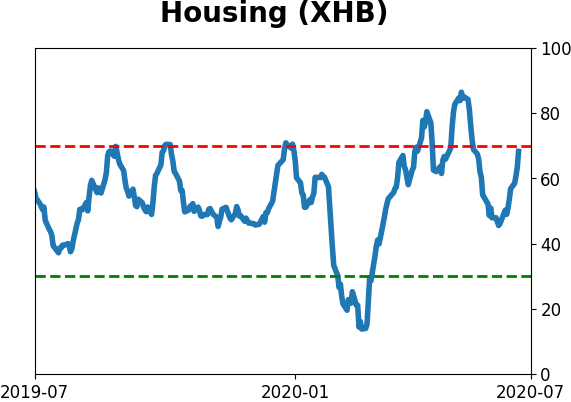
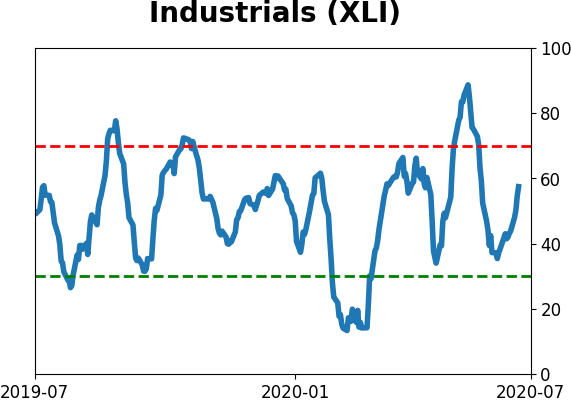
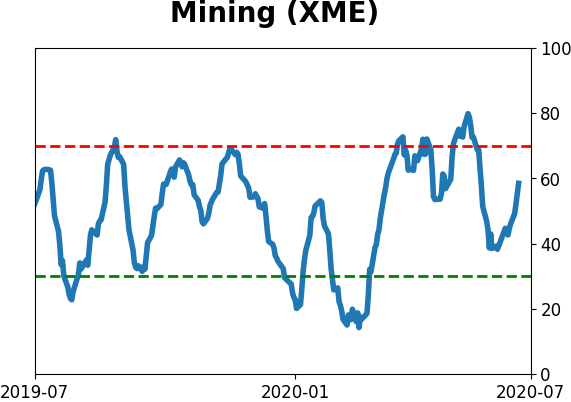
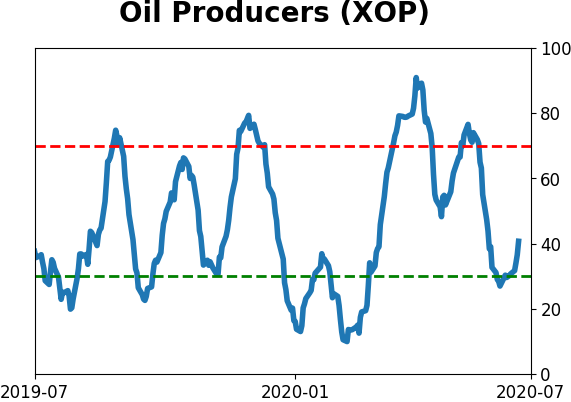
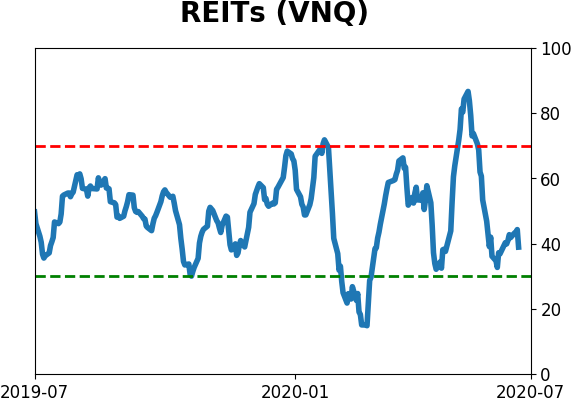
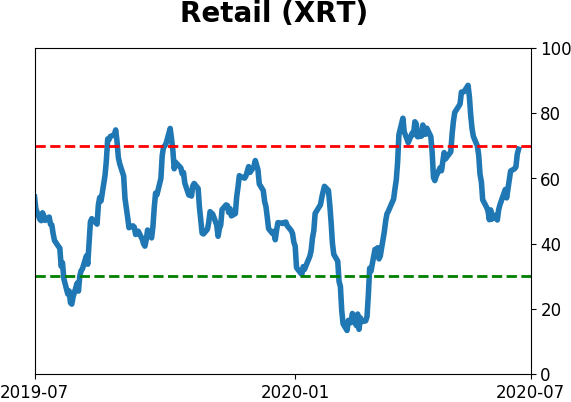
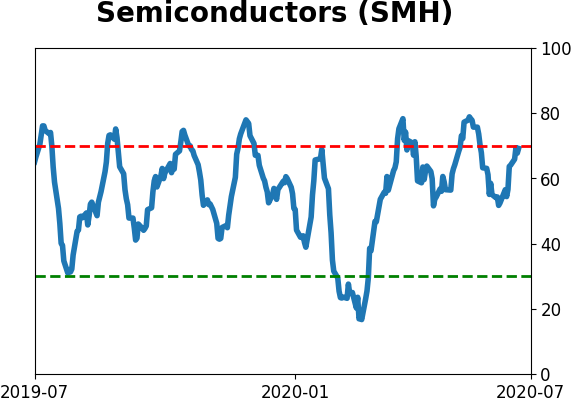
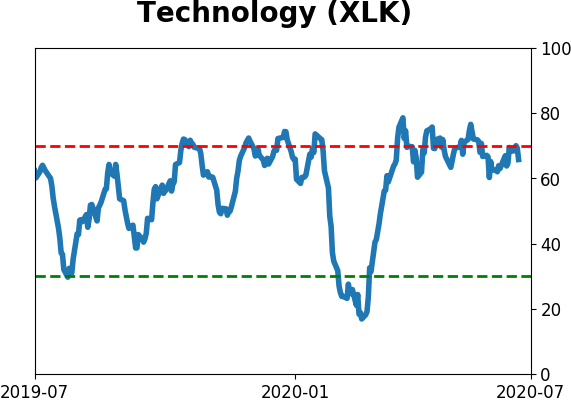
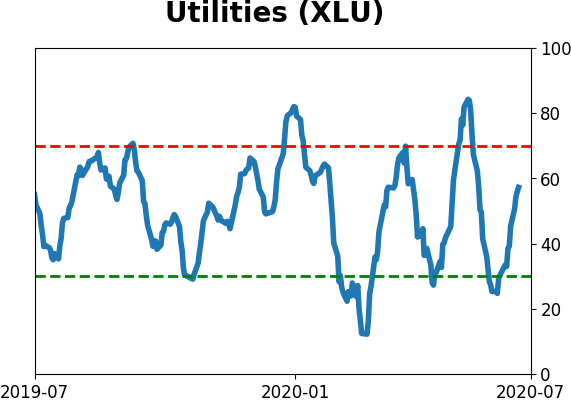
Sector ETF's - 10-Day Moving Average
|
|
|
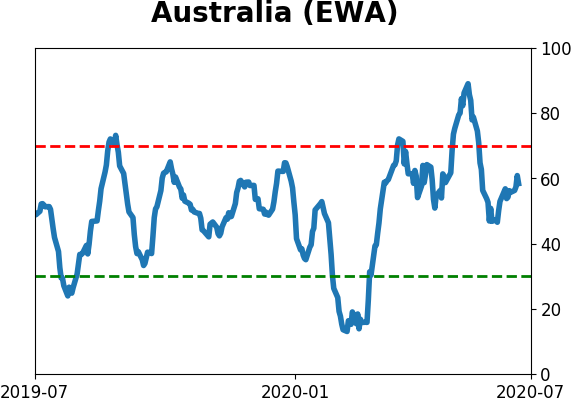
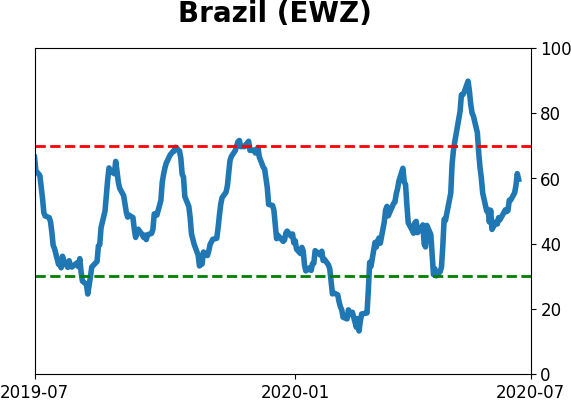
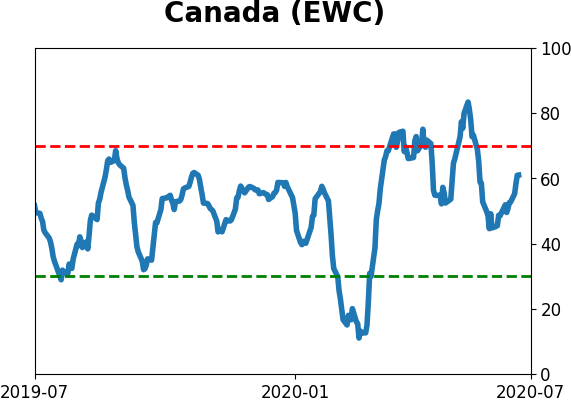
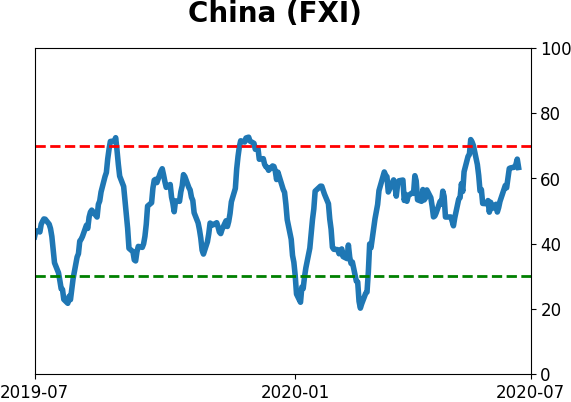
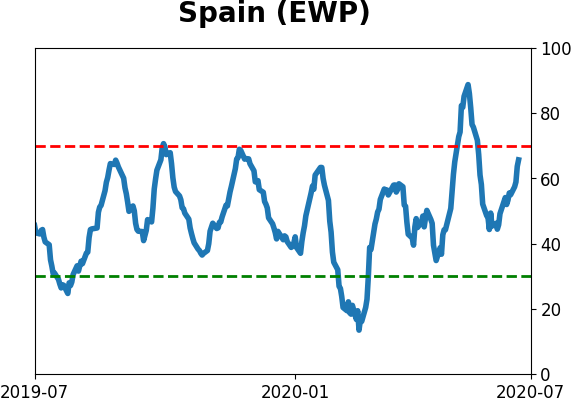
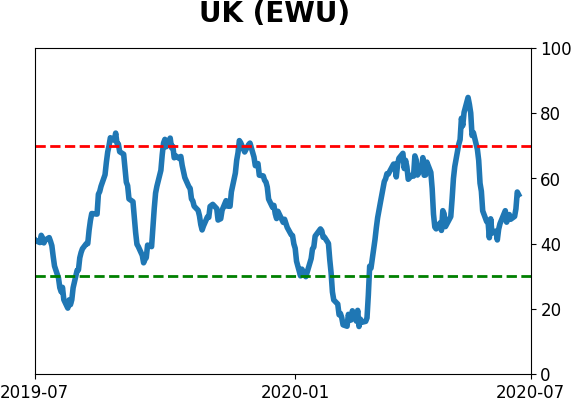
Country ETF's - 10-Day Moving Average
|
|
|
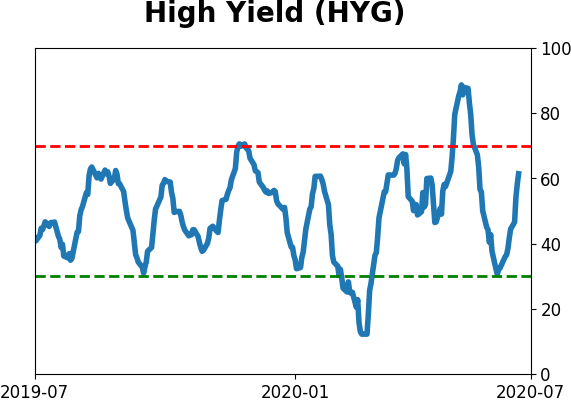
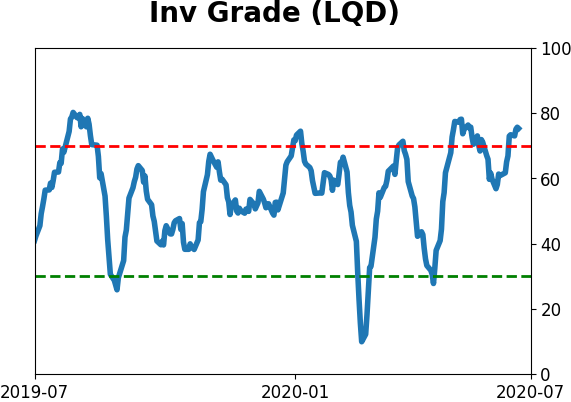
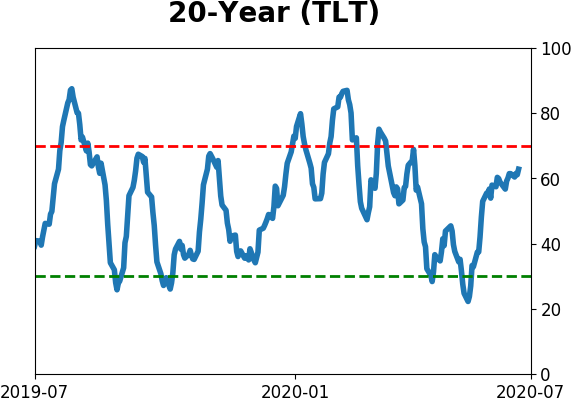
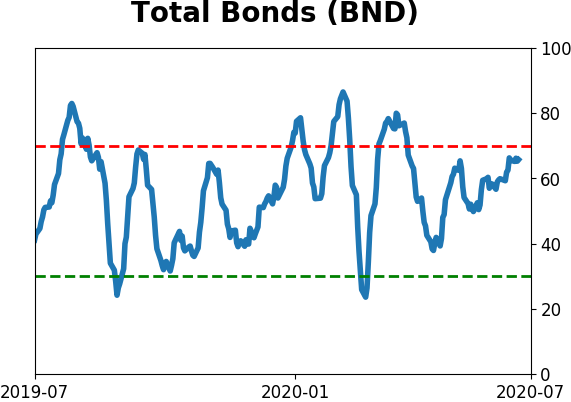
Bond ETF's - 10-Day Moving Average
|
|
|
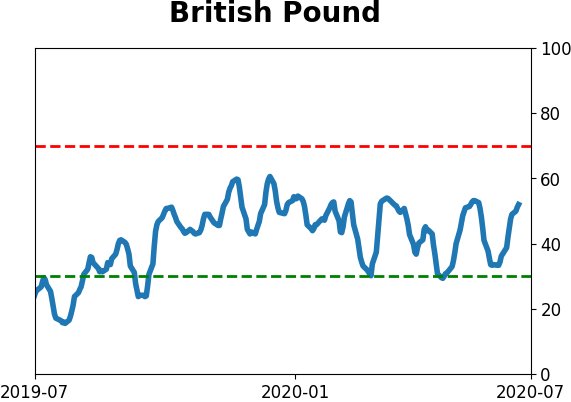
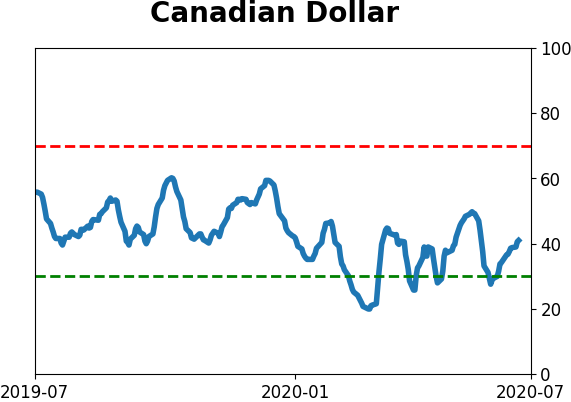
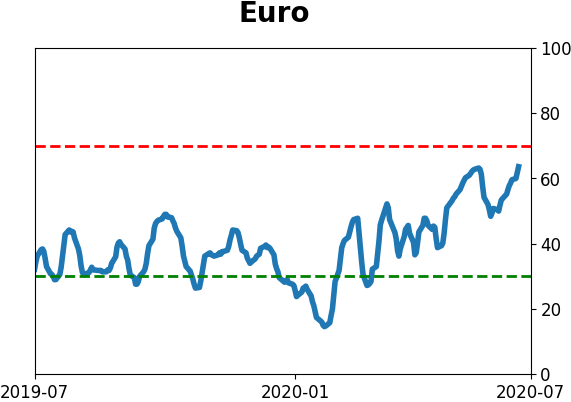
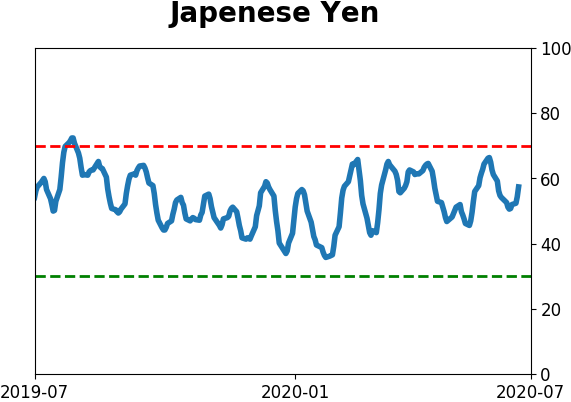
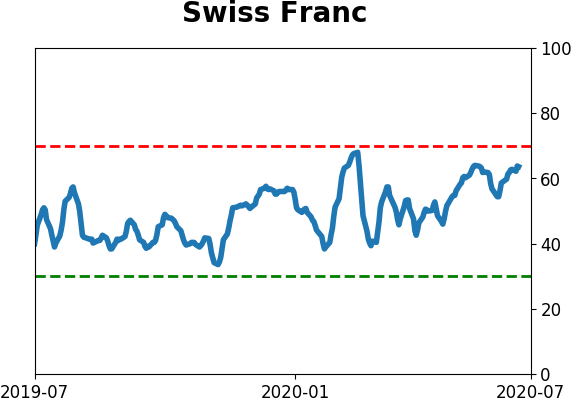
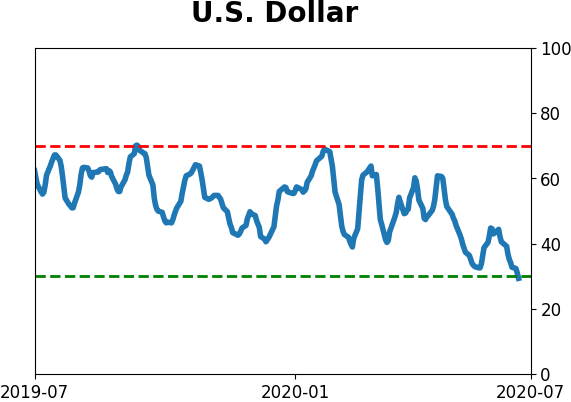
Currency ETF's - 5-Day Moving Average
|
|
|
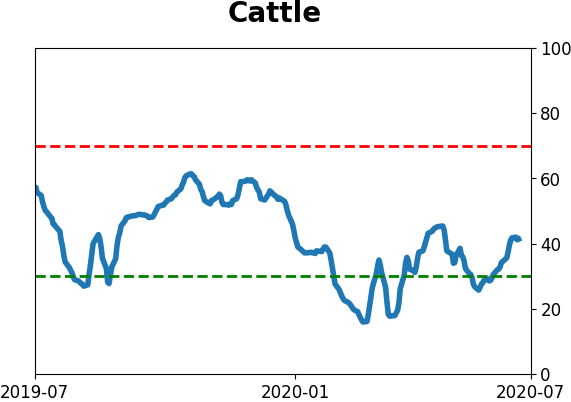
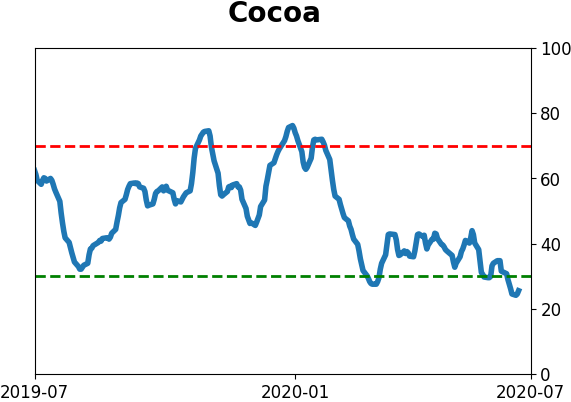
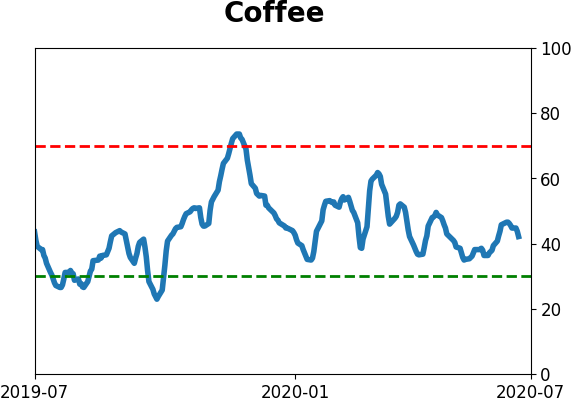
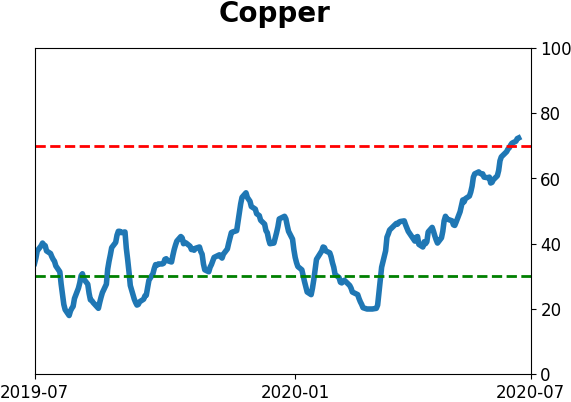
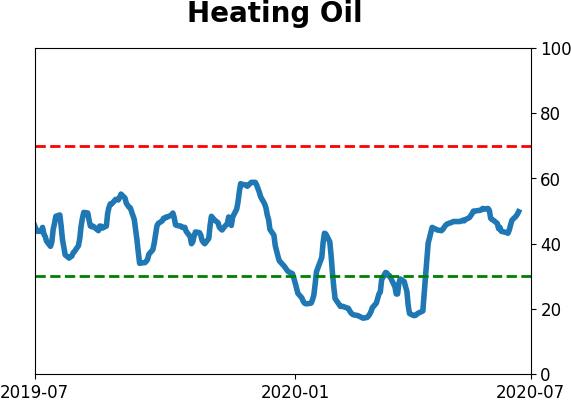
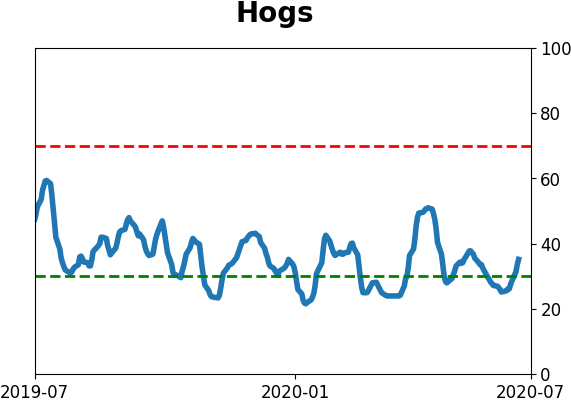
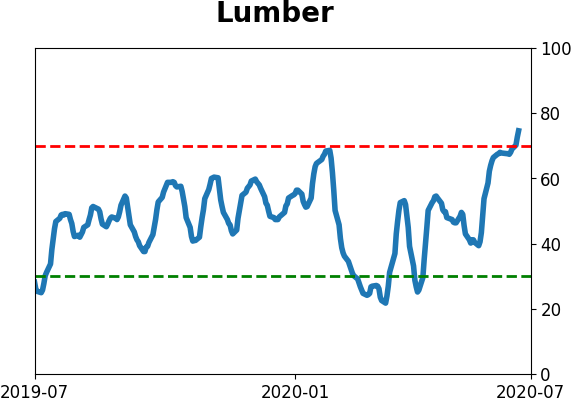
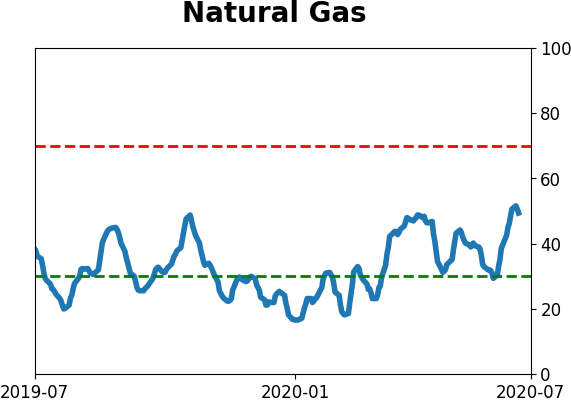
Commodity ETF's - 5-Day Moving Average
|
|