Headlines
|
|
Copper turns golden along with stocks:
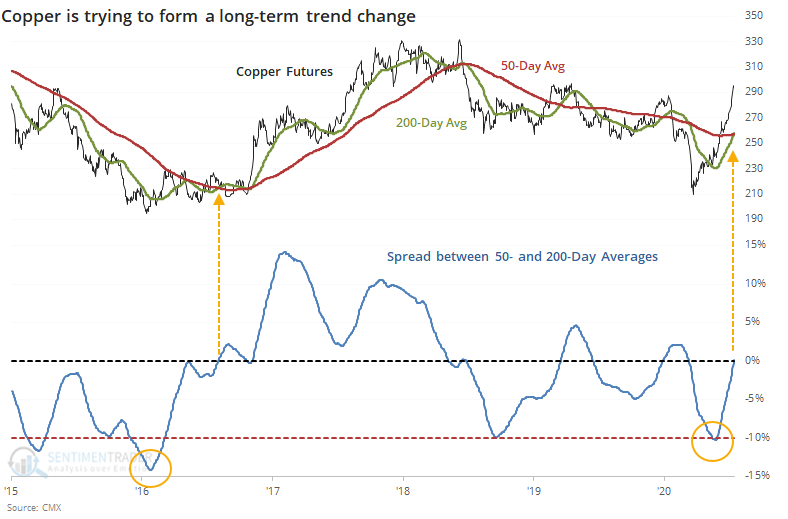
Copper is about to enjoy a Golden Cross as its 50-day moving average erases a large deficit against the 200-day average. This has rarely preceded meaningful trend changes, either in copper or in stocks. More than anything, it led to an increase in interest rates as bond prices declined, which was not a good sign for gold.
Bottom Line:
- Weight of the evidence has been suggesting flat/lower stock prices short- to medium-term, though that turned more neutral as stocks pulled back recently; still suggesting higher prices long-term
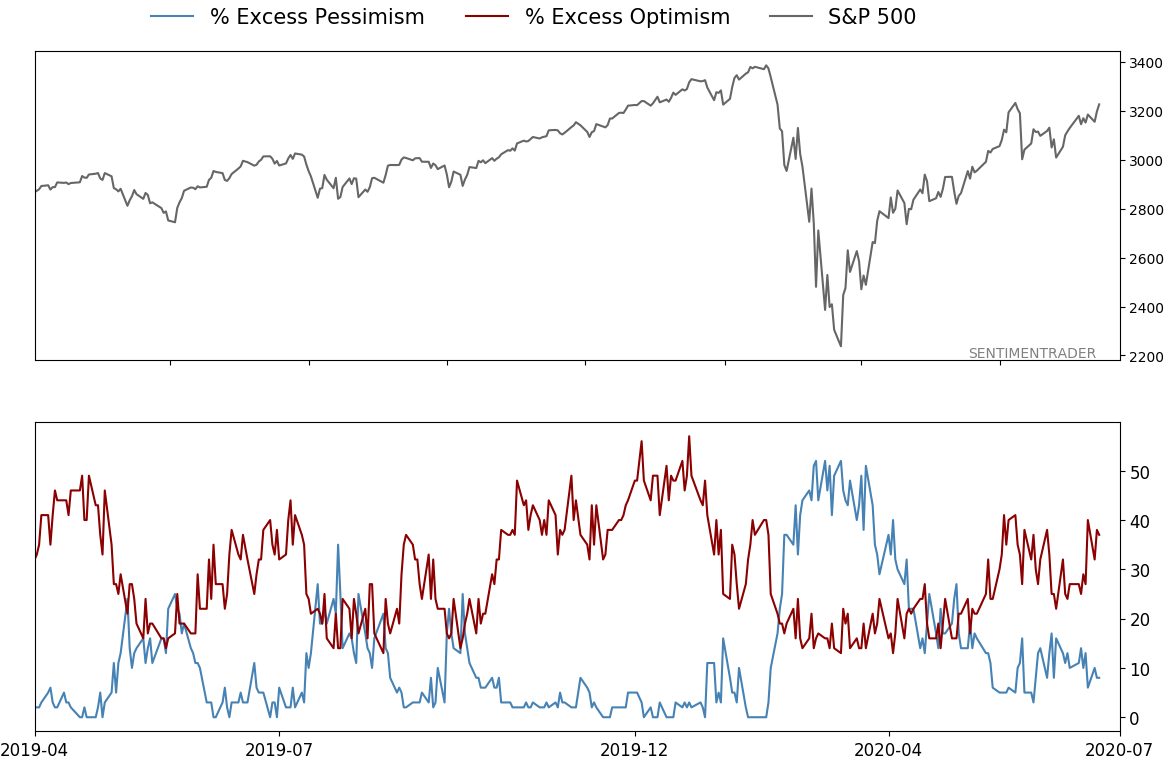
- Indicators show high and declining optimism, as Dumb Money Confidence neared 80% in early June with signs of reckless speculation, historic buying pressure, then even more speculation during what appears to be an unhealthy market environment
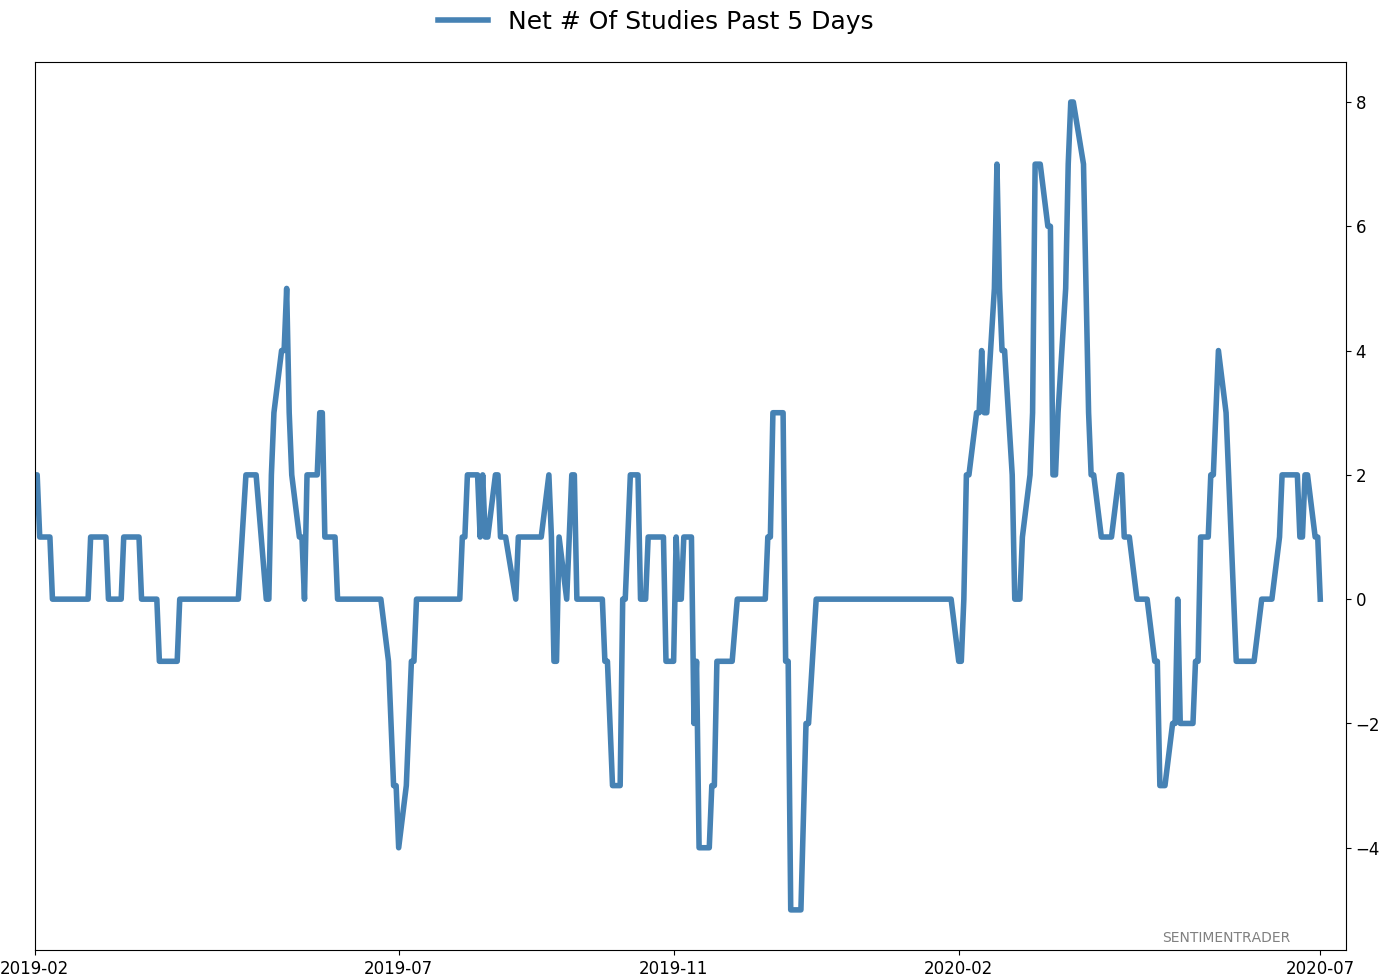
- Active Studies show a heavy positive skew over the medium- to long-term; breadth thrusts, recoveries, and trend changes have an almost unblemished record at preceding higher prices over a 6-12 month time frame
- Signs of extremely skewed preference for tech stocks nearing exhaustion, especially relative to industrials and financials (here and here)
- Indicators and studies for other markets are mixed with no strong conclusion, though it's not a great sign for Treasuries that hedgers are net short.
|
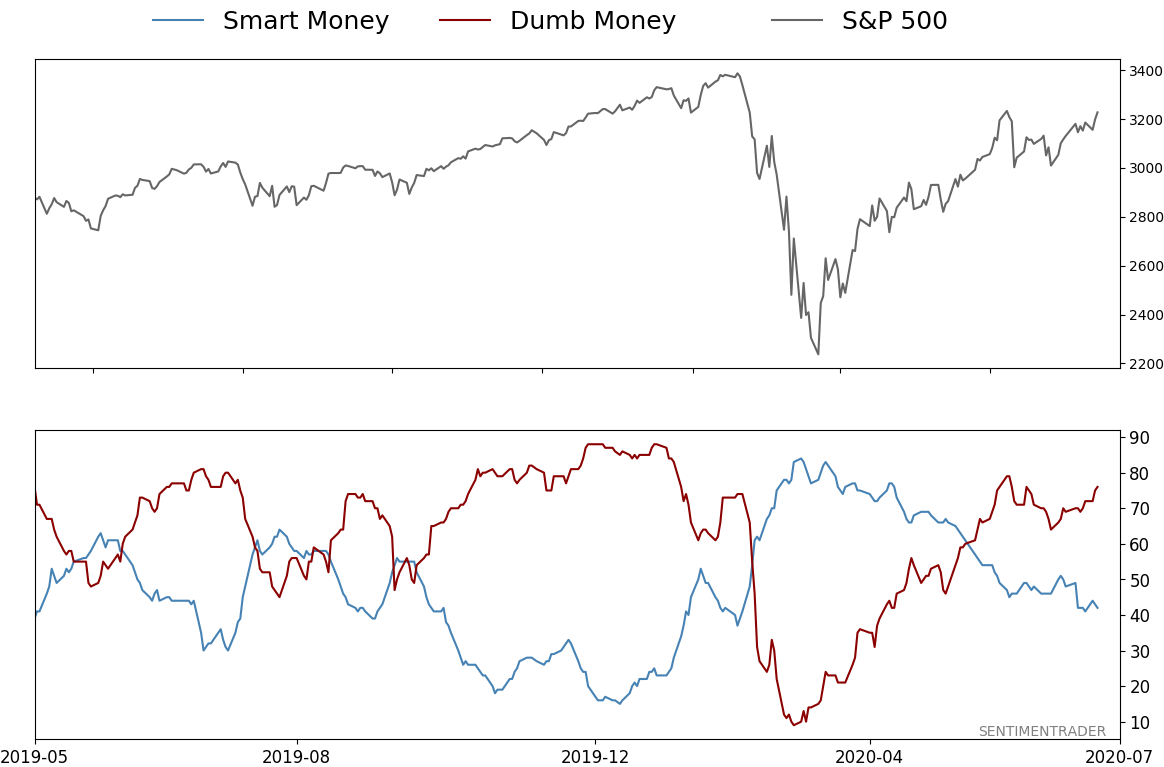
Smart / Dumb Money Confidence
|
Smart Money Confidence: 42%
Dumb Money Confidence: 76%
|
|
Risk Levels
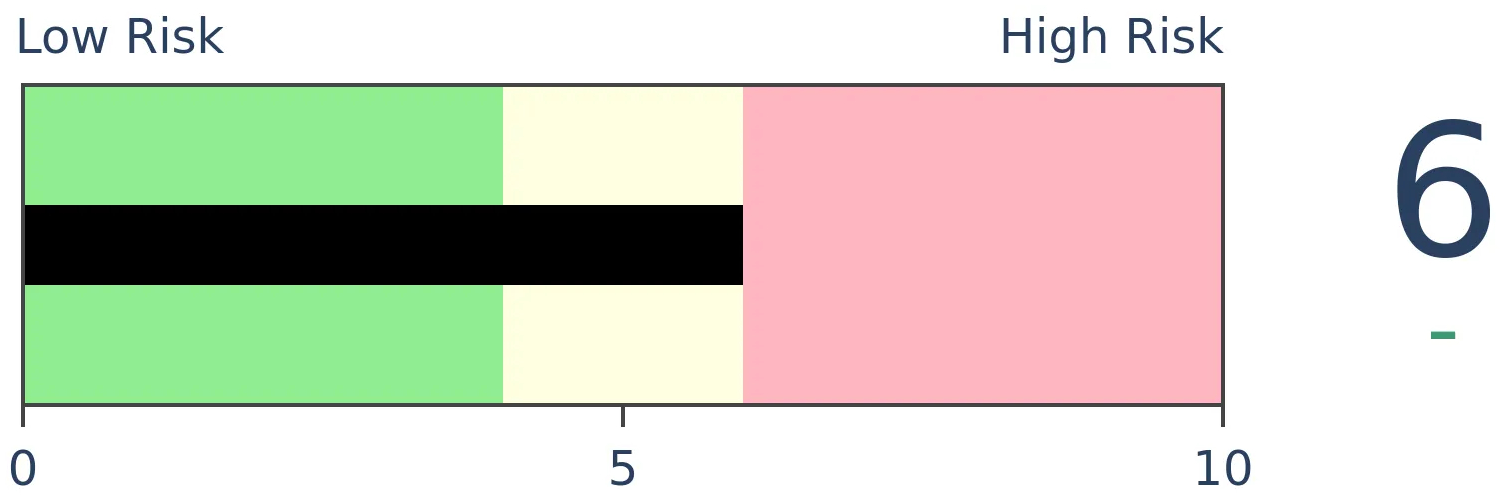
Stocks Short-Term
|
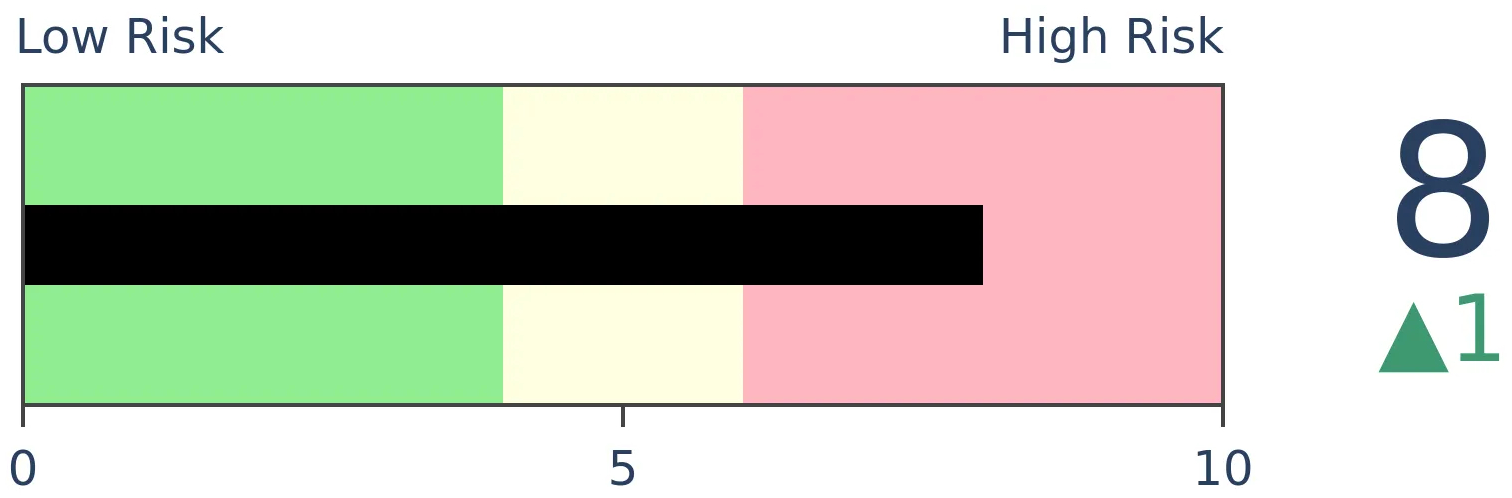
Stocks Medium-Term
|
|
Bonds

|
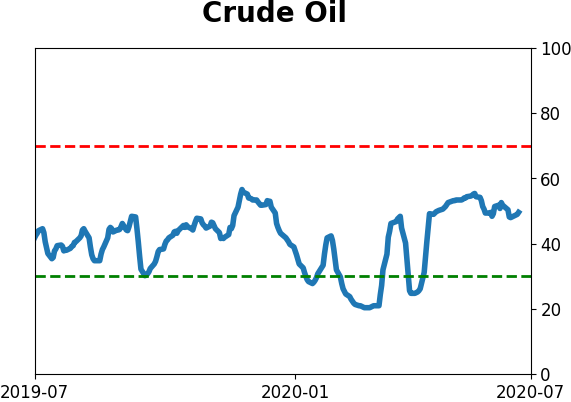
Crude Oil
|
|
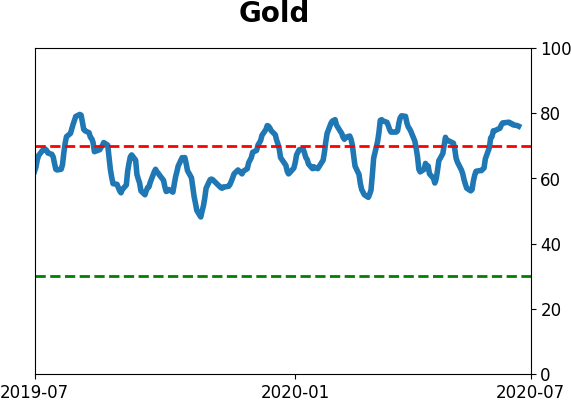
Gold

|
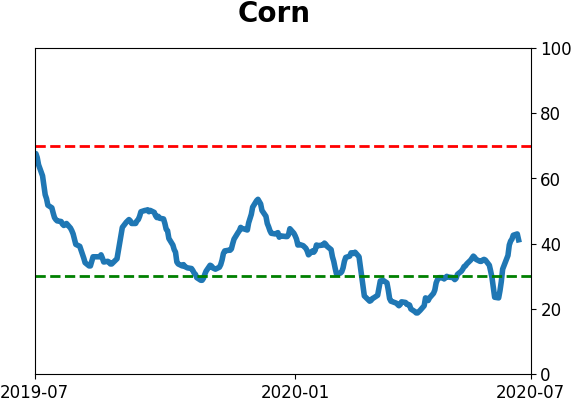
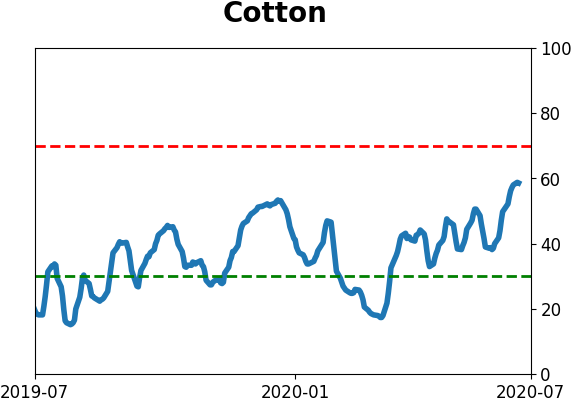
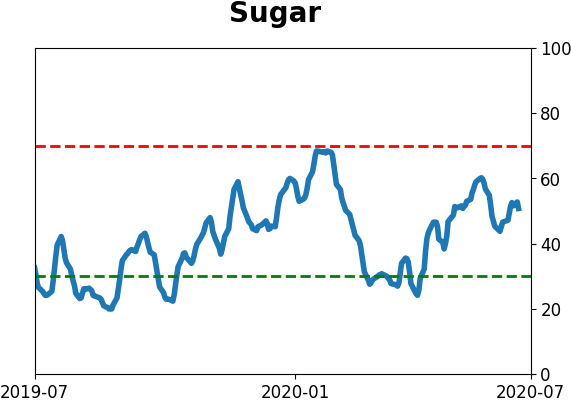
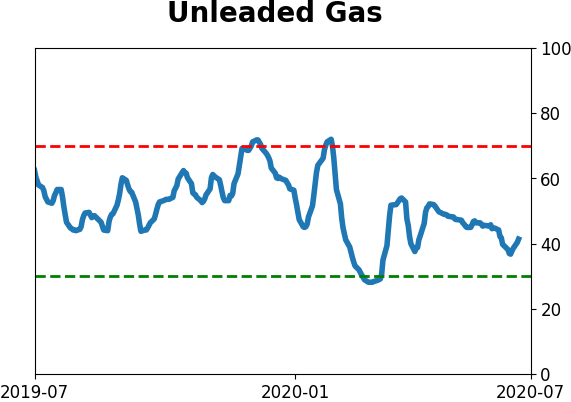
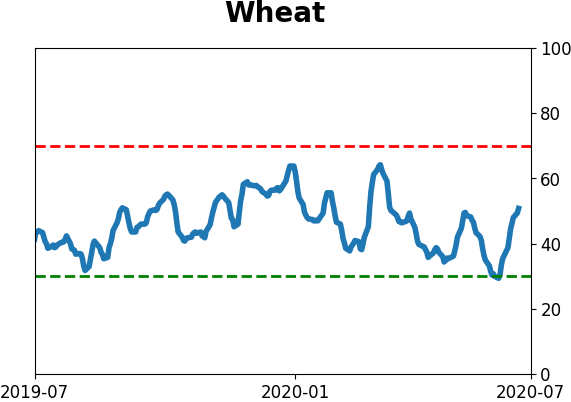
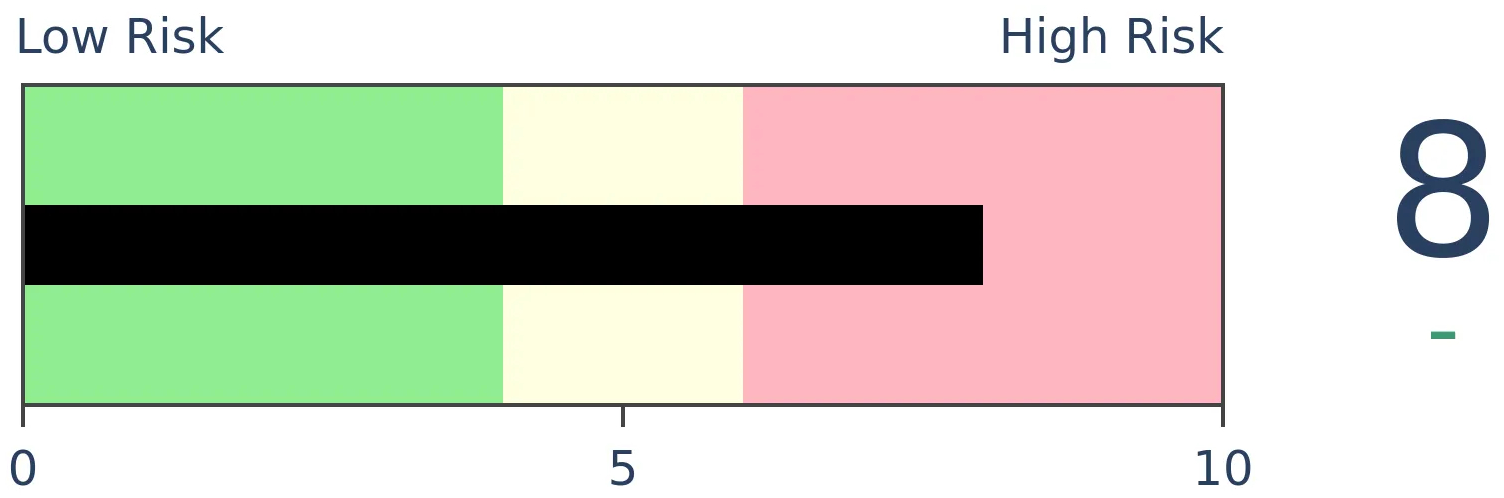
Agriculture

|
|
Research
BOTTOM LINE
Copper is about to enjoy a Golden Cross as its 50-day moving average erases a large deficit against the 200-day average. This has rarely preceded meaningful trend changes, either in copper or in stocks. More than anything, it led to an increase in interest rates as bond prices declined, which was not a good sign for gold.
FORECAST / TIMEFRAME
JJCTF -- Down, Medium-Term
|
Last week, the S&P 500's medium-term trend overtook its long-term trend for the first time in months. While the technical signal itself is suspect, the fact that the index erased such a wide spread between trends has been universally positive over the next 6-12 months in recent decades.
At about the same time, the dollar's trends were reversing to the downside. And now copper is joining the S&P with a Golden Cross after a wide negative spread between its 50- and 200-day moving averages. The last time it did this, the metal soared over the next year.
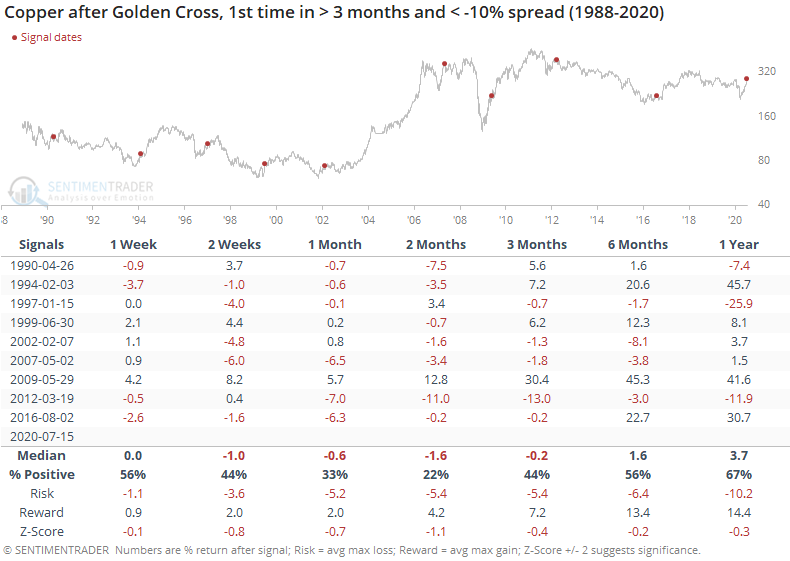
That trend change in 2016 was more the exception than the rule. The table below shows every time copper recovered from its 50-day average being at least 10% below its 200-day average. Only once, in 2009, did it equate with an immediate and sustained bull market. All of the other signals showed a loss either 2 or 3 months later.
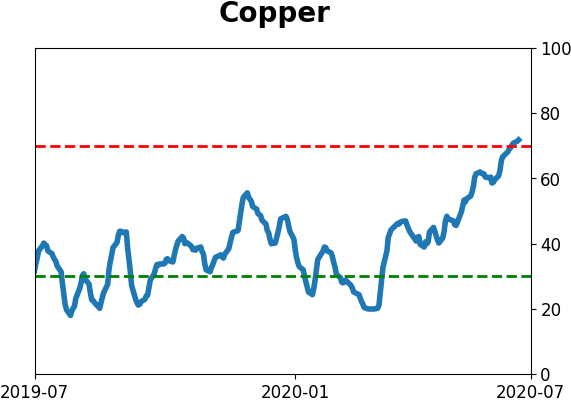
Because copper has done well in recent weeks, sentiment has become very positive, and the 10-day Optimism Index just rose above 70. The Backtest Engine shows that the metal has struggled to hold onto further gains when optimism is this high.
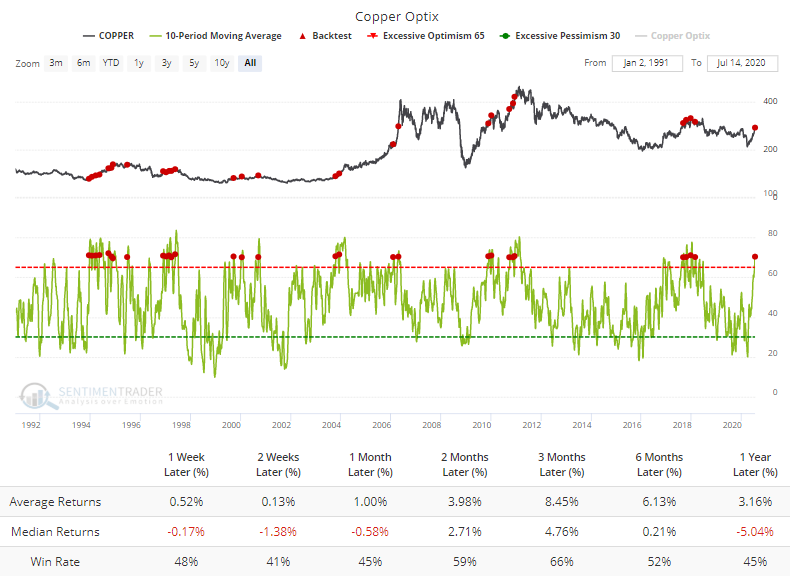
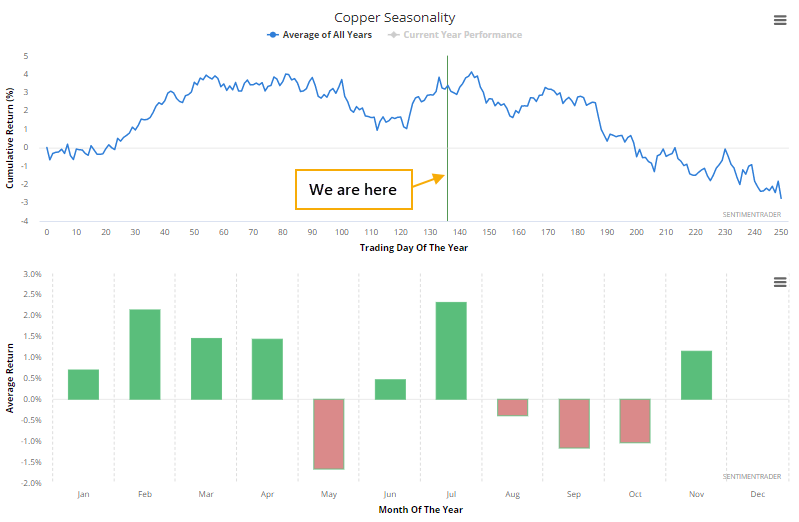
This optimism is hitting just as copper enters what has been its most challenging seasonal window.
As noted by the Wall Street Journal, a positive trend in copper is assumed to be a good sign for other assets as well, due to its industrial uses. For the S&P 500, it was a mixed blessing. It showed gains across most time frames, but there was an odd dip at the 3-month time frame. We wouldn't read too much into that, perhaps other than the idea that these signals in copper typically didn't lead to large, sustained advances in stocks, either.
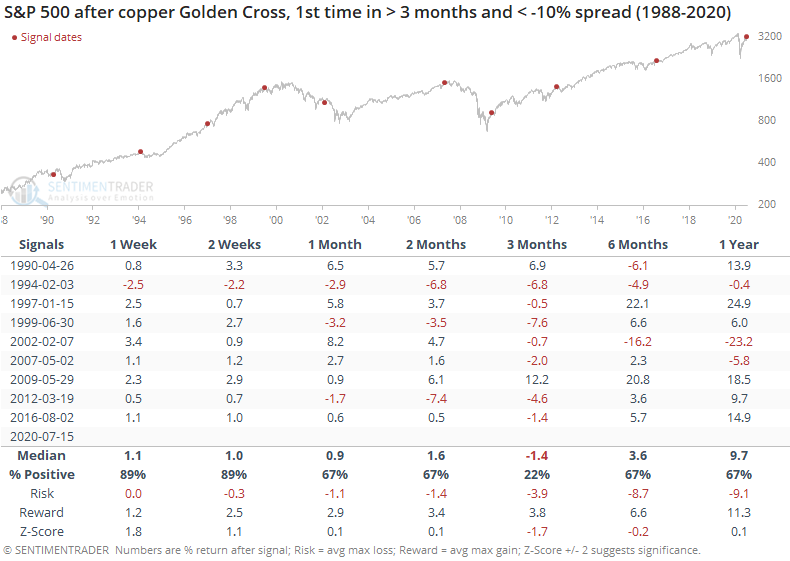
We try to limit the number of tables we show because after a little bit, readers' eyes just glaze over and numbers lose their meaning. But because some other markets showed such consistent returns after these signals in copper, we'll show them in full.
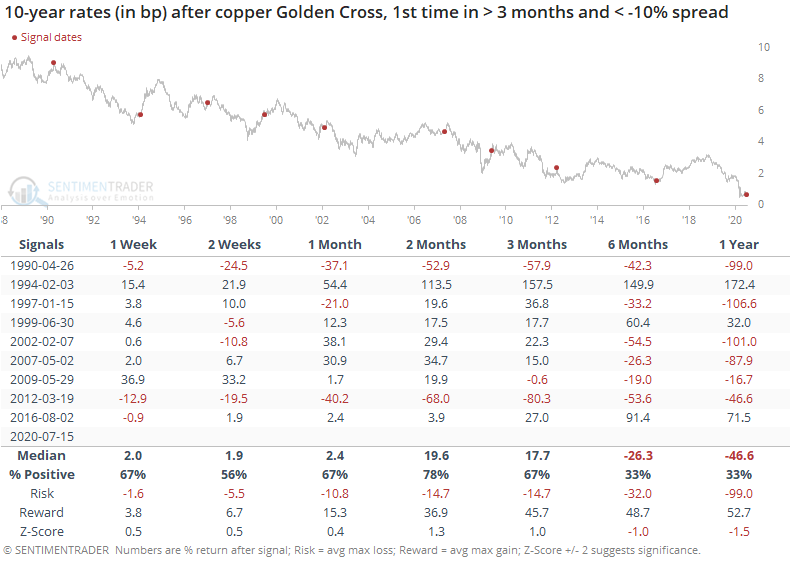
For 10-year Treasury note futures, these potential signs of a pickup in economic activity were not received well. Note futures consistently declined over the next 2-3 months.
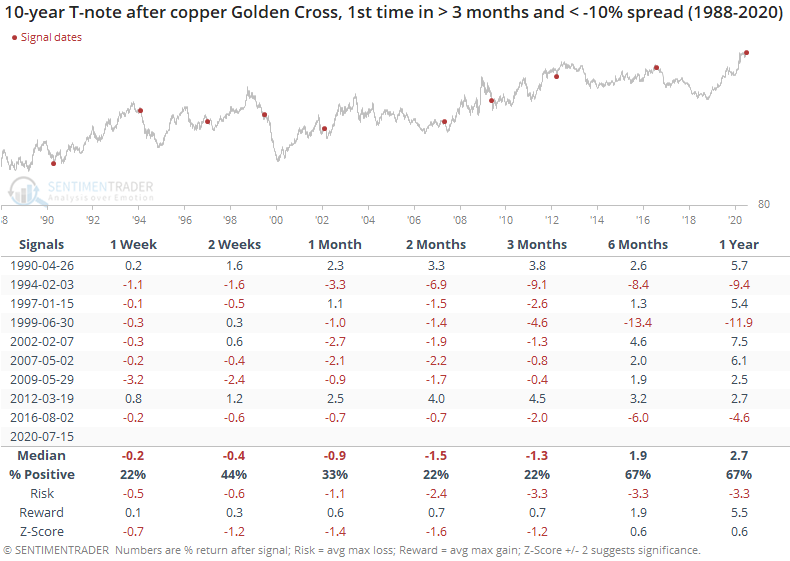
Because interest rates move opposite to bond prices, this meant that rates tended to rise over the medium-term.
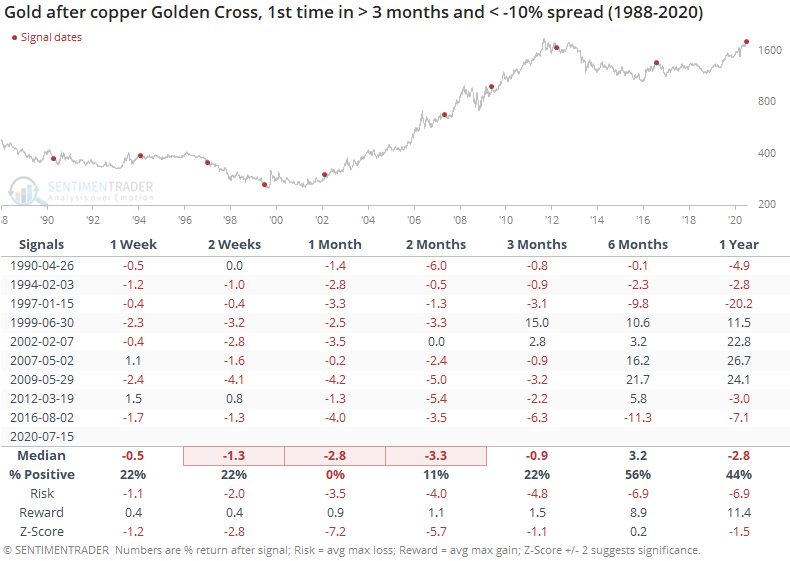
Because gold has to compete against rate-bearing instruments, it did not respond well to these upticks in interest rates. Up to two months later, gold was almost universally negative.
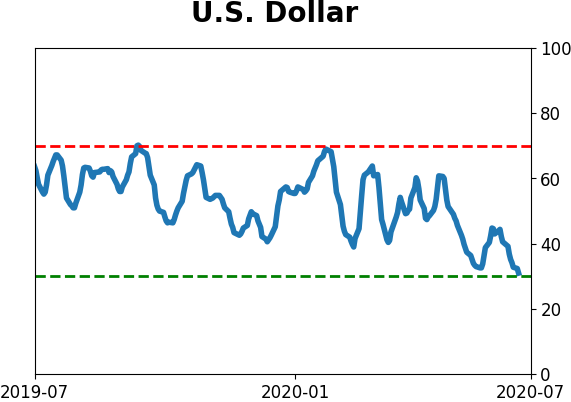
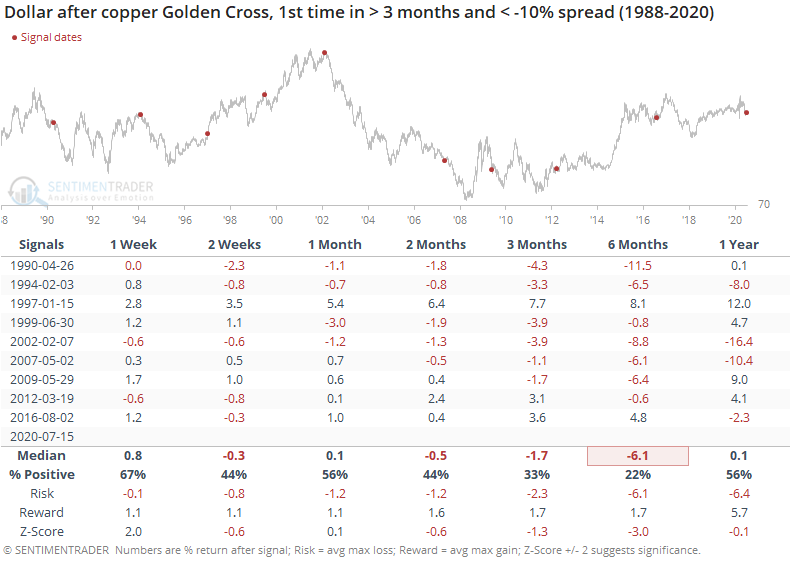
That was the case even though the dollar didn't rally consistently, either. Gold and the dollar usually have an inverse relationship.
Copper has had a heck of a run, showing the most relative strength in years, with enough near-term buying interest to invert its futures curve. There are all kinds of interesting and compelling fundamental theories for what these things mean for copper itself as well as other markets, but empirically those theories don't hold much water.
This Golden Cross has been another nice-sounding reason to become positive on the metal, but historically that didn't work out too often. More than anything, we'd suggest it's a positive sign for interest rates, with the associated negative implications for bonds and gold.
Active Studies
| Time Frame | Bullish | Bearish | | Short-Term | 0 | 0 | | Medium-Term | 8 | 7 | | Long-Term | 44 | 1 |
|
Indicators at Extremes
Portfolio
| Position | Weight % | Added / Reduced | Date | | Stocks | 29.8 | Reduced 9.1% | 2020-06-11 | | Bonds | 0.0 | Reduced 6.7% | 2020-02-28 | | Commodities | 5.2 | Added 2.4%
| 2020-02-28 | | Precious Metals | 0.0 | Reduced 3.6% | 2020-02-28 | | Special Situations | 0.0 | Reduced 31.9% | 2020-03-17 | | Cash | 65.0 | | |
|
Updates (Changes made today are underlined)
In the first months of the year, we saw manic trading activity. From big jumps in specific stocks to historic highs in retail trading activity to record highs in household confidence to almost unbelievable confidence among options traders. All of that came amid a market where the average stock couldn't keep up with their indexes. There were signs of waning momentum in stocks underlying the major averages, which started triggering technical warning signs in late January. After stocks bottomed on the 23rd, they enjoyed a historic buying thrust and retraced a larger amount of the decline than "just a bear market rally" tends to. Those thrusts are the most encouraging sign we've seen in years. Through early June, we were still seeing thrusts that have led to recoveries in longer-term breadth metrics. The longer-term prospects for stocks (6-12 months) still look decent given the above. On a short- to medium-term basis, it was getting harder to make that case. Dumb Money Confidence spiked and there were multiple signs of a historic level of speculation. This is likely the lowest I will go given what I still consider to be compelling positives over a longer time frame. There is not a slam-dunk case to be made for either direction, so it will seem like a mistake whether stocks keep dropping (why didn't I sell more?) or if they turn and head higher (why did I let short-term concerns prevail?). After nearly three decades of trading, I've learned to let go of the idea of perfection.
RETURN YTD: -4.4% 2019: 12.6%, 2018: 0.6%, 2017: 3.8%, 2016: 17.1%, 2015: 9.2%, 2014: 14.5%, 2013: 2.2%, 2012: 10.8%, 2011: 16.5%, 2010: 15.3%, 2009: 23.9%, 2008: 16.2%, 2007: 7.8%
|
|
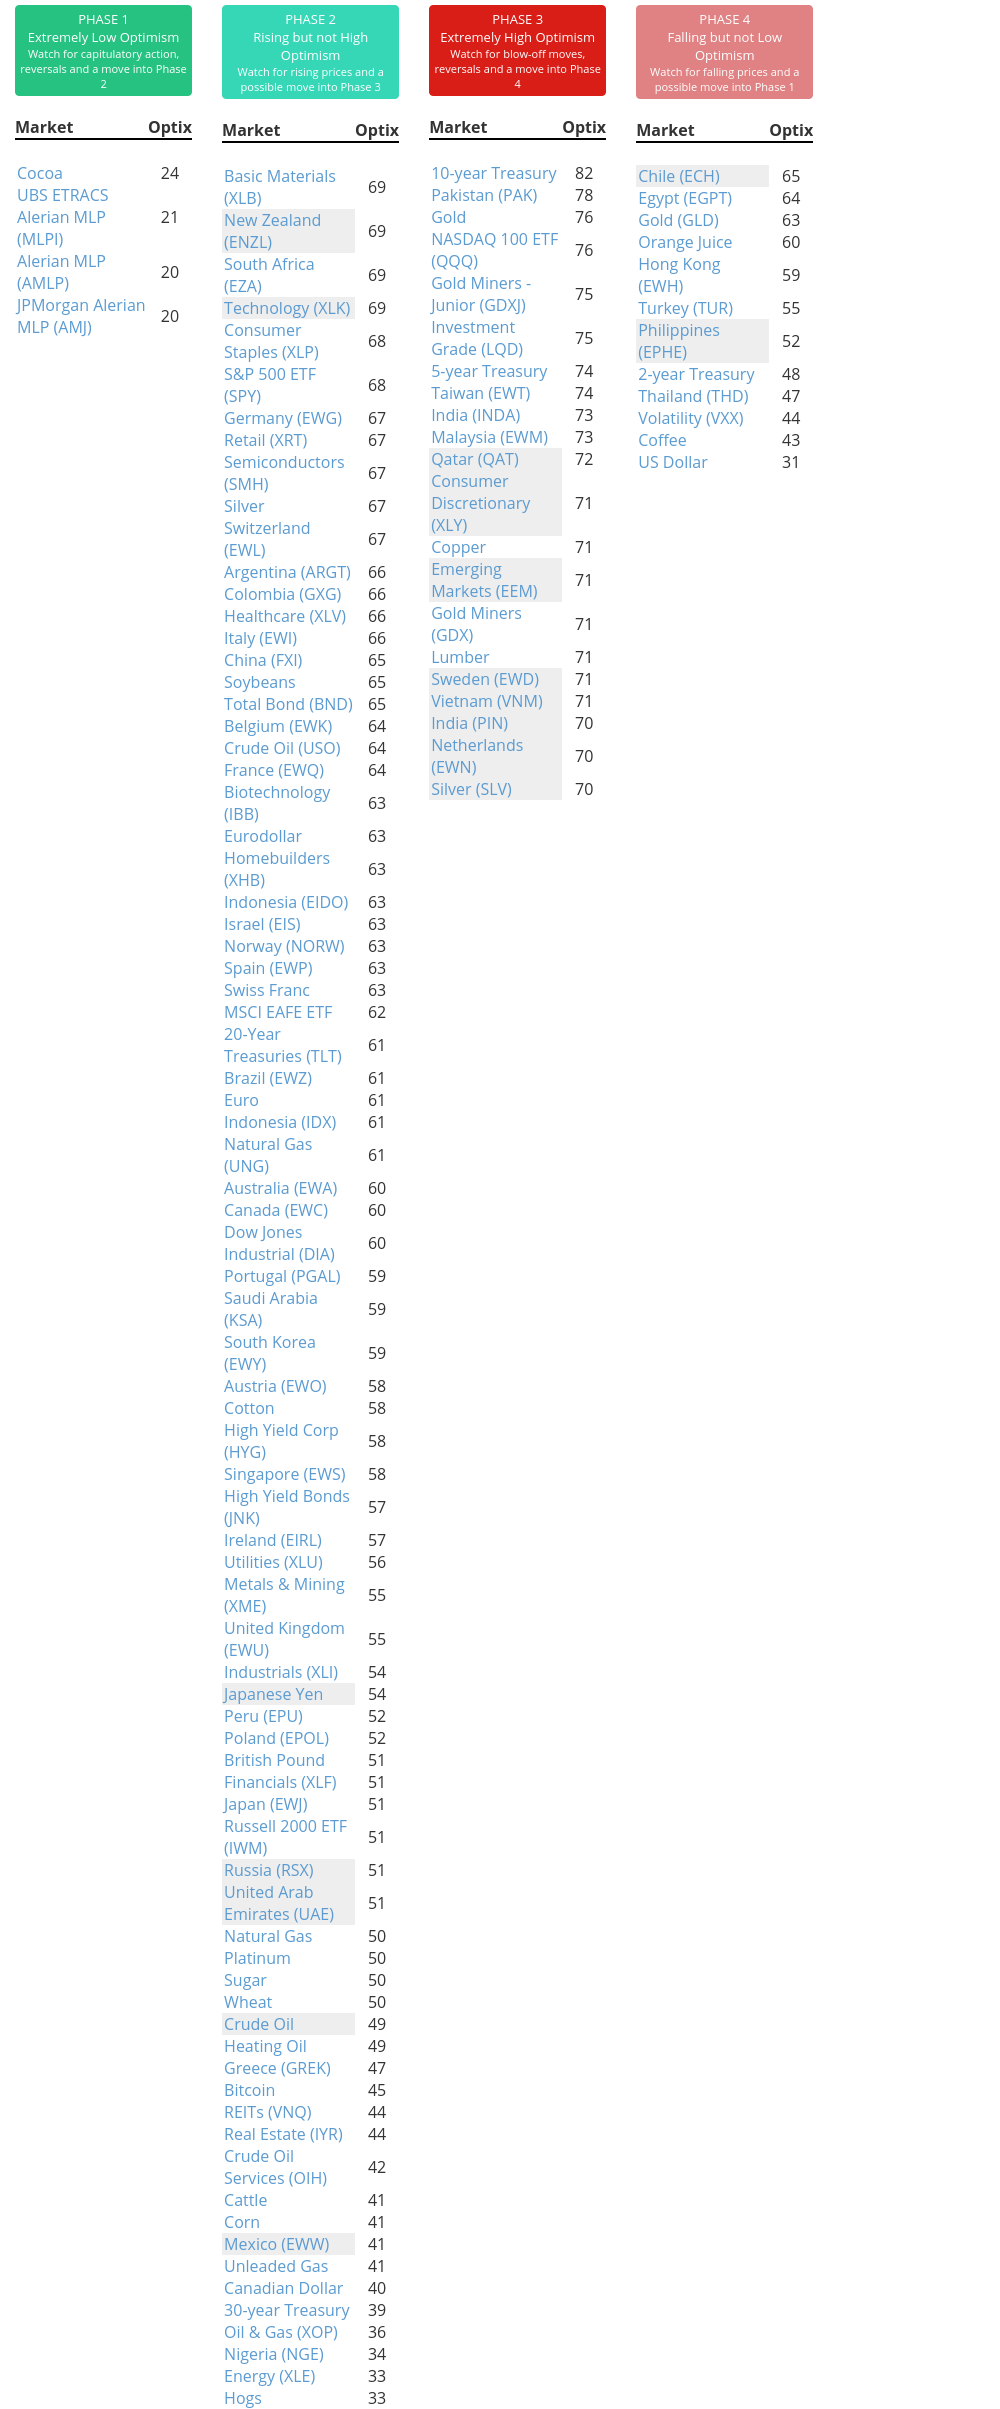
Phase Table
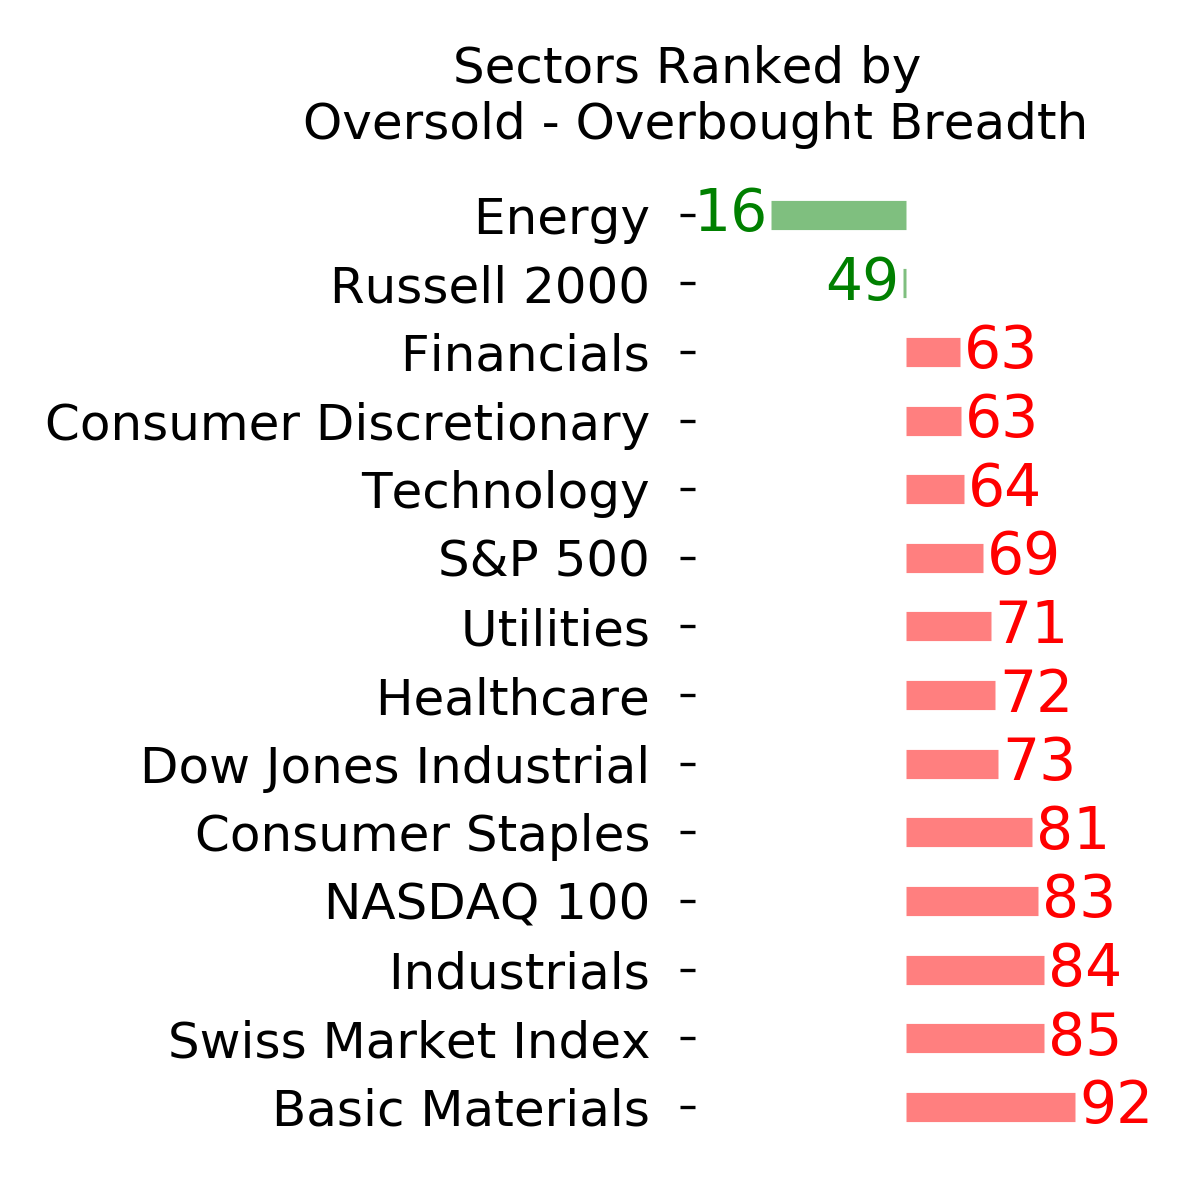
Ranks
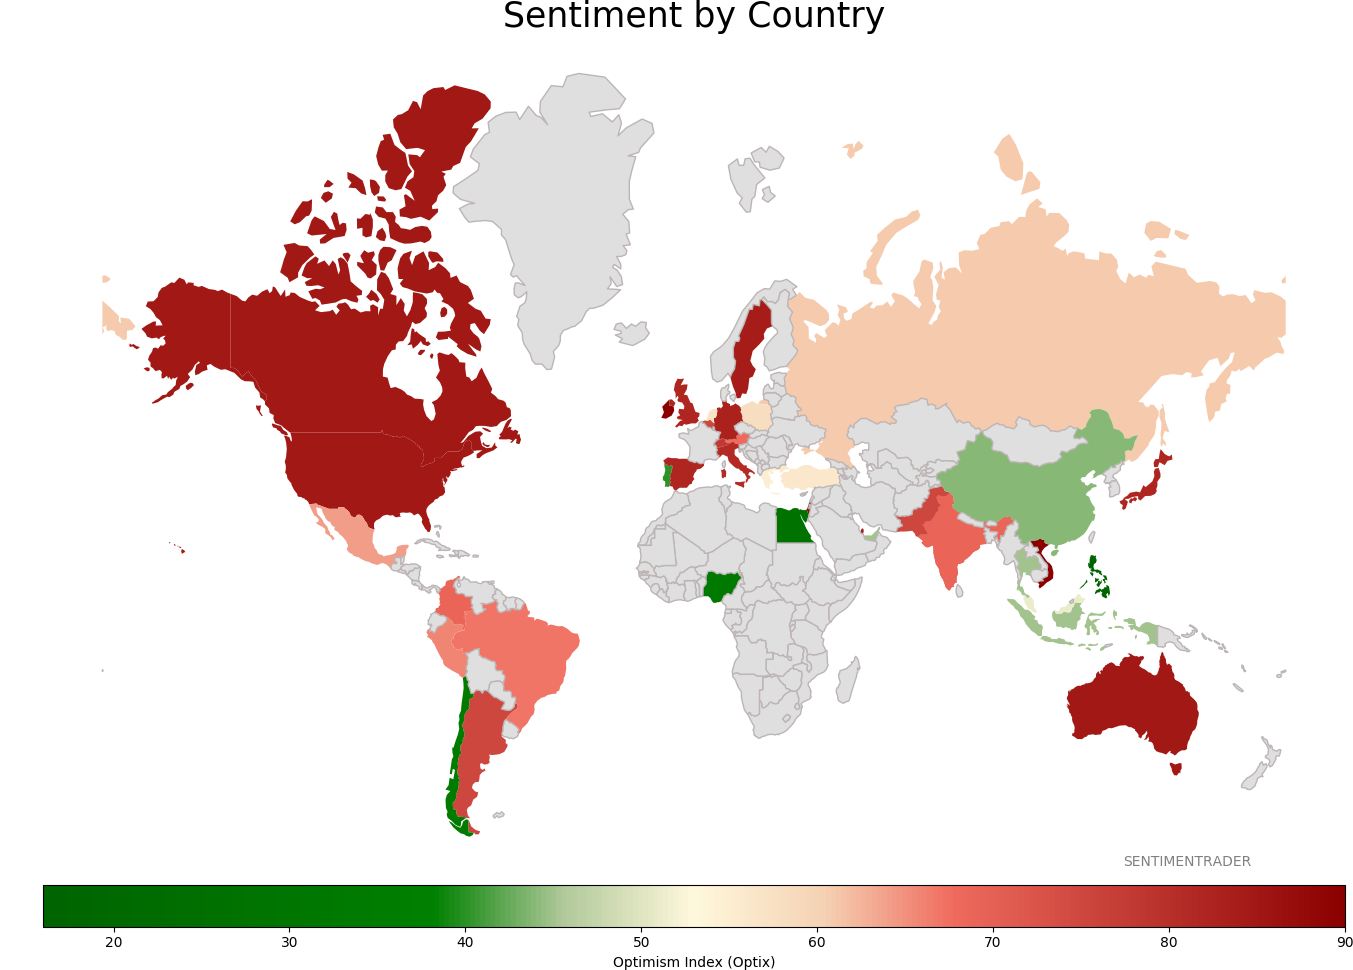
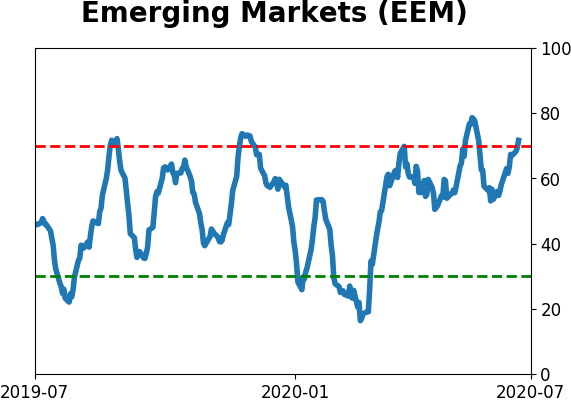
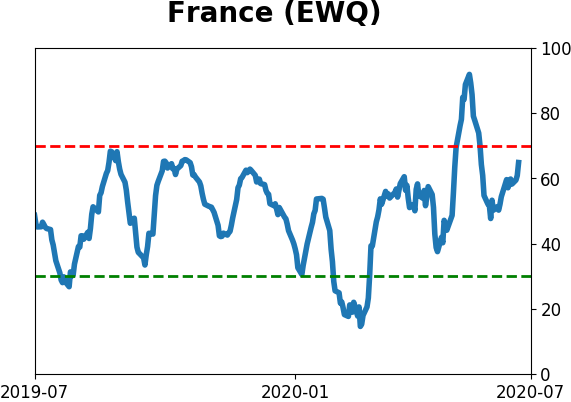
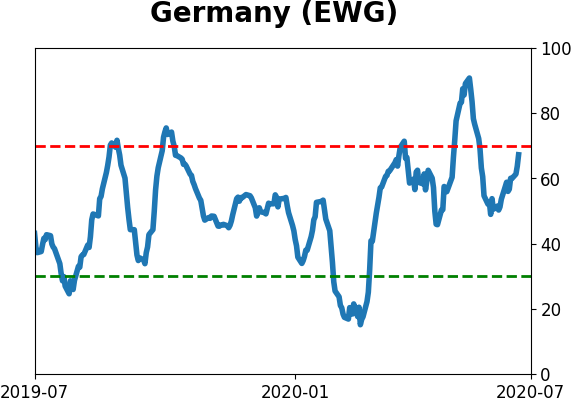
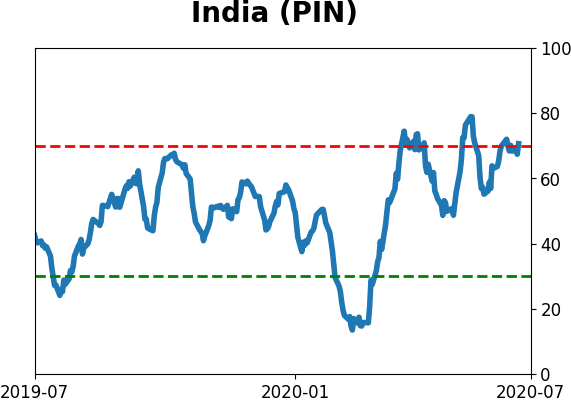
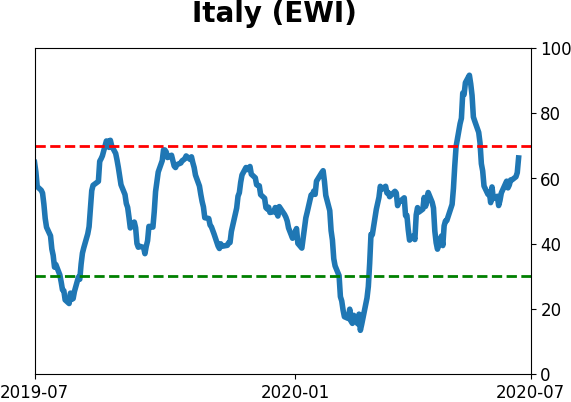
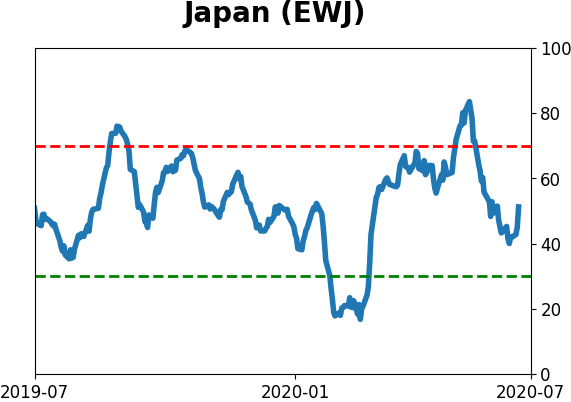
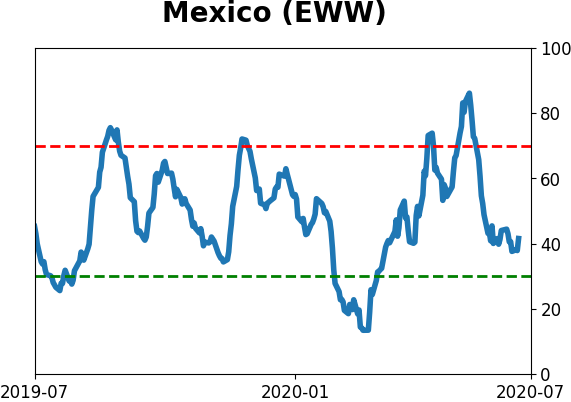
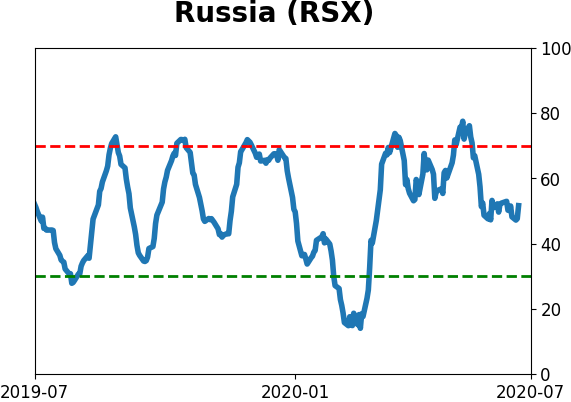
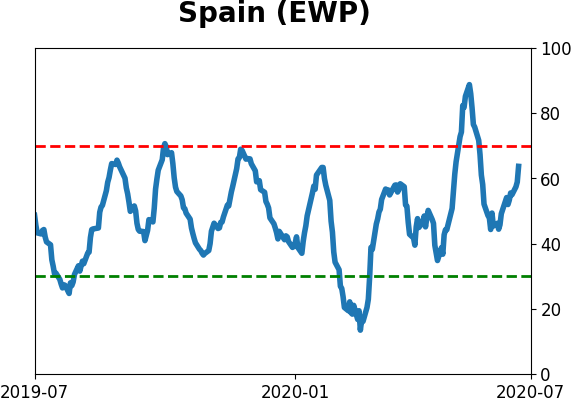
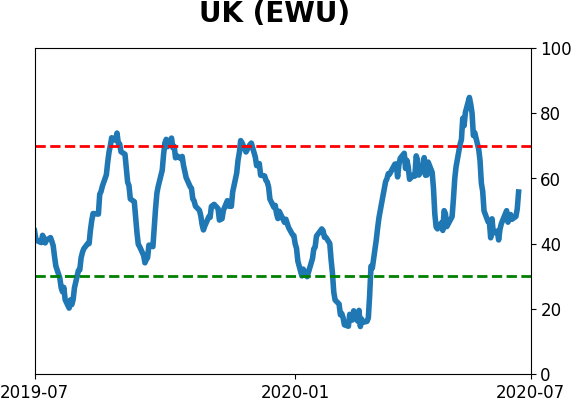
Sentiment Around The World
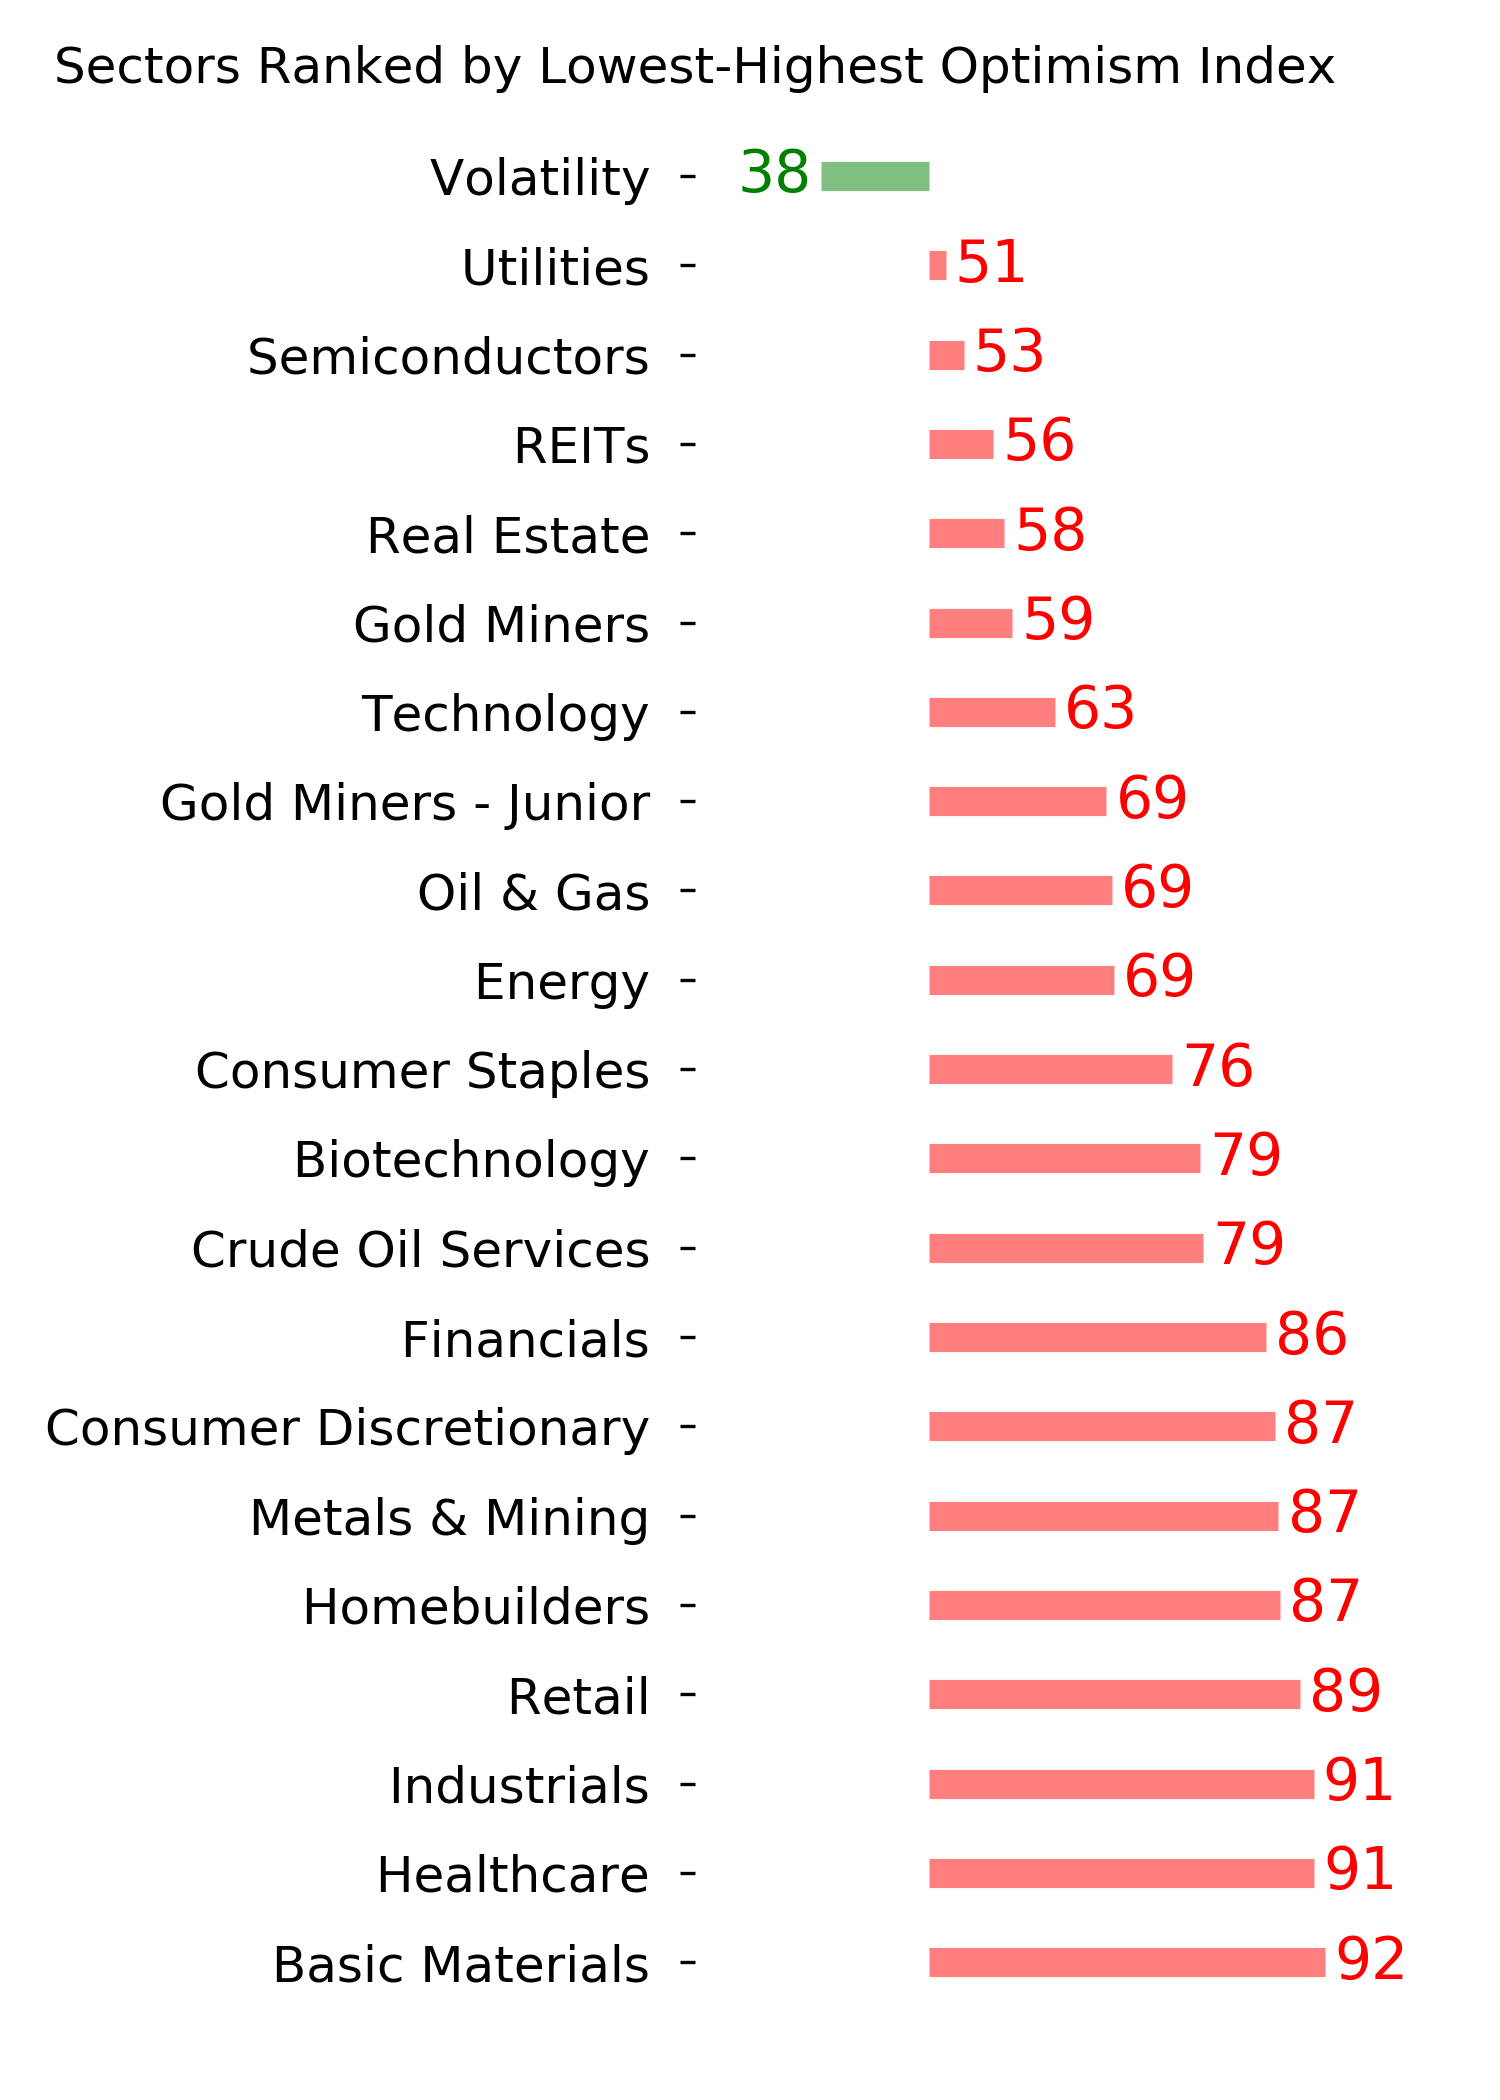
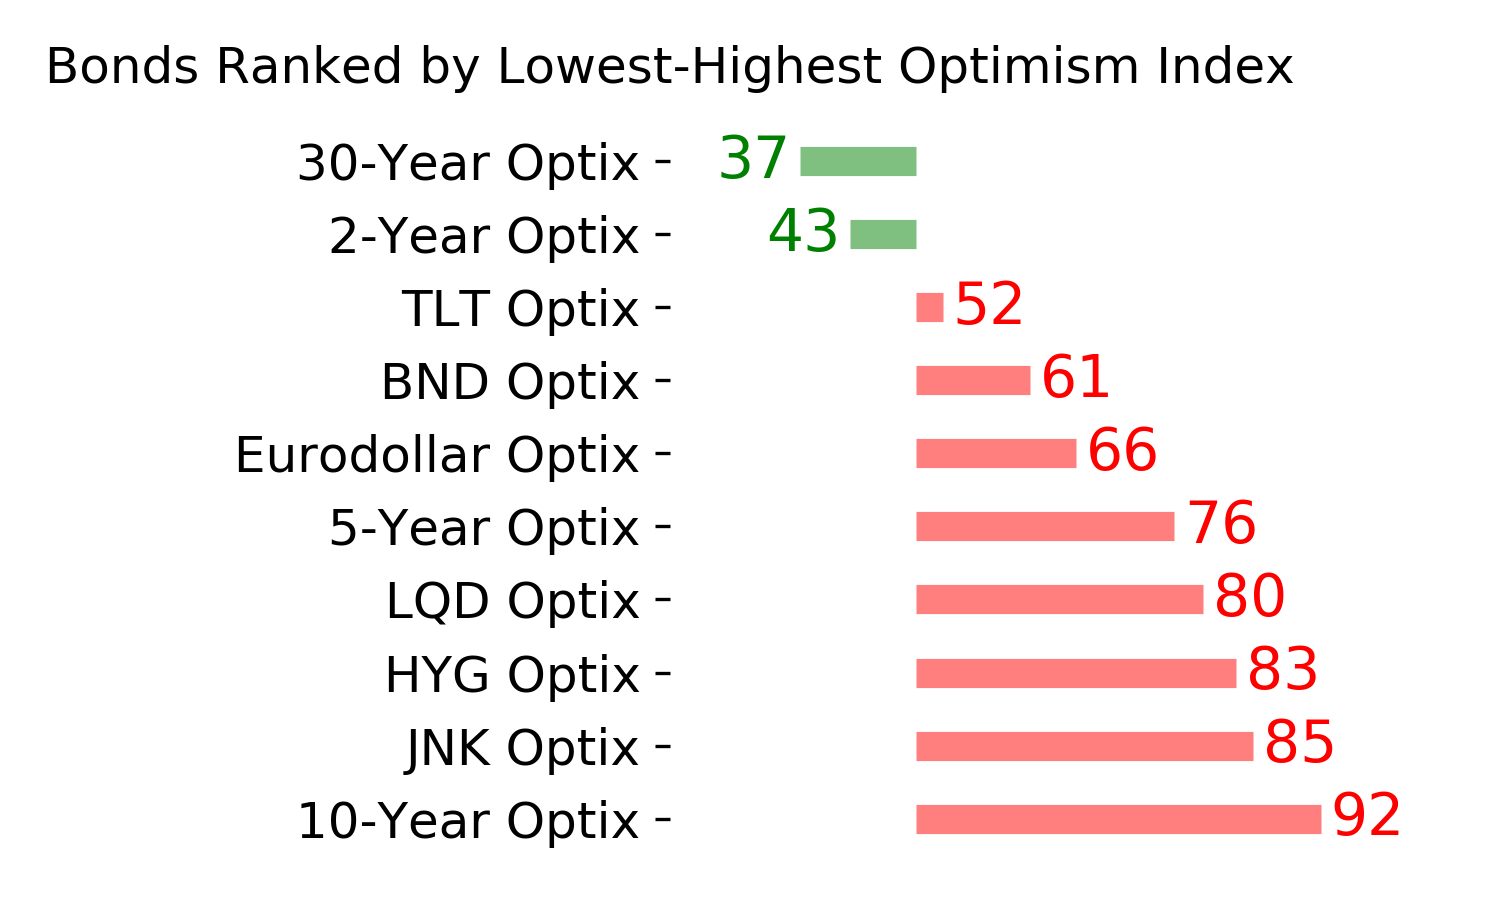
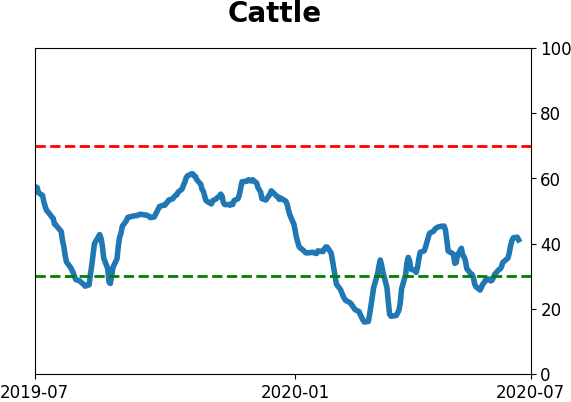
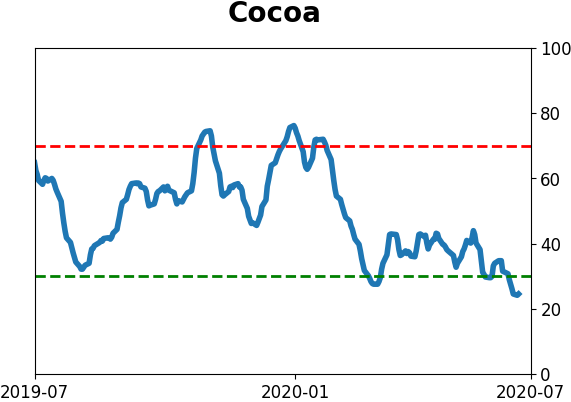
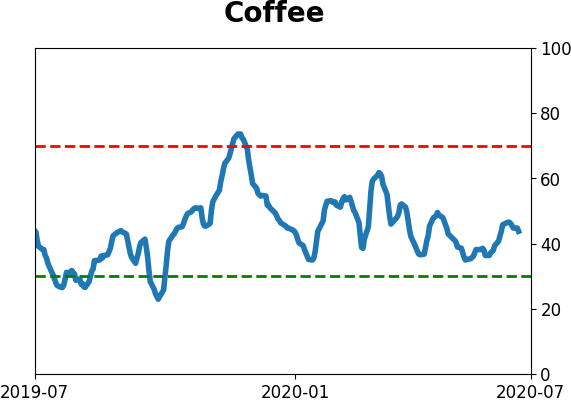
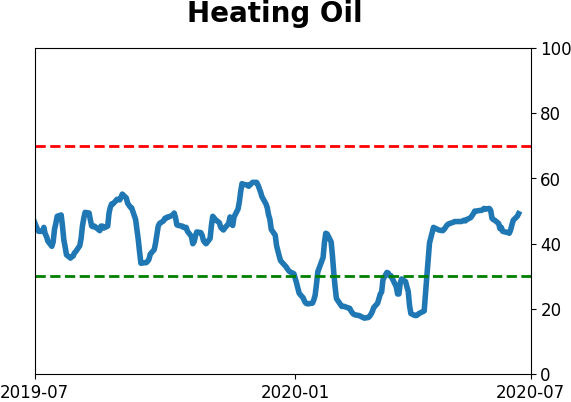
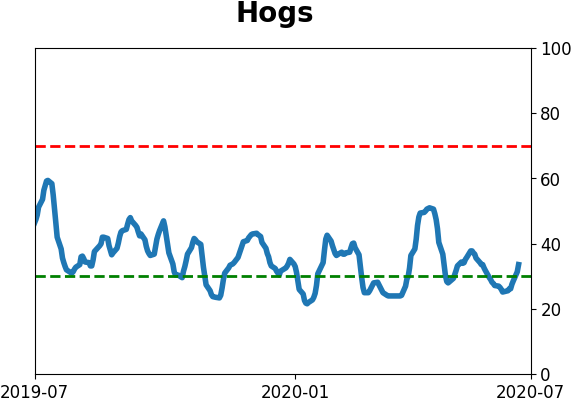
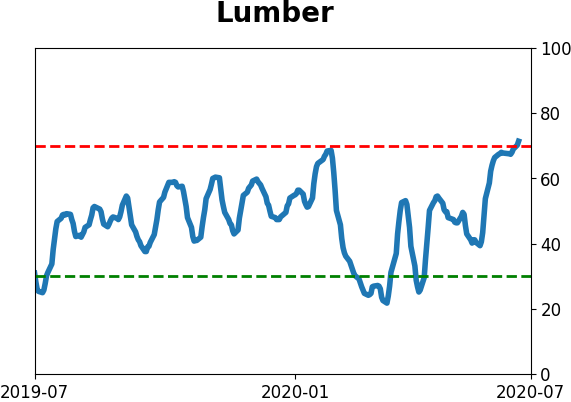
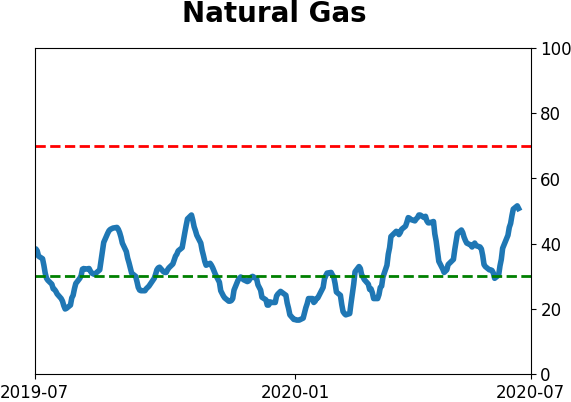
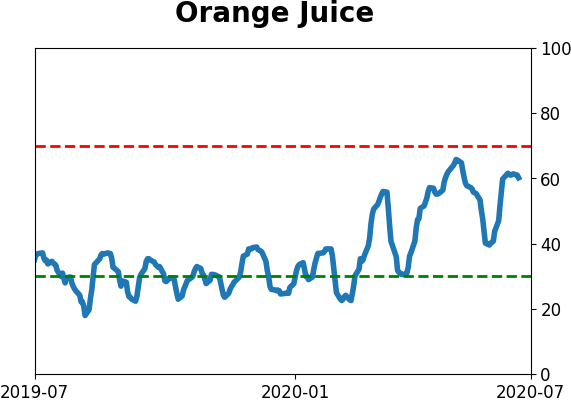
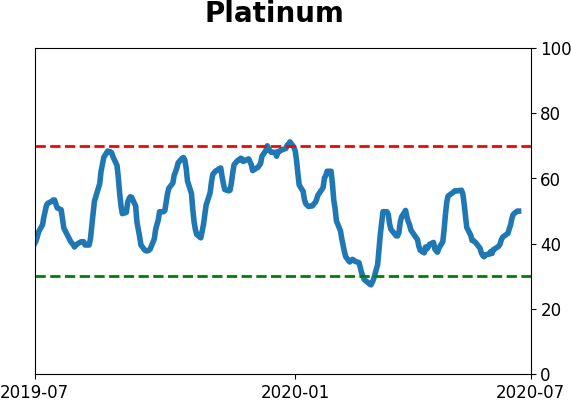
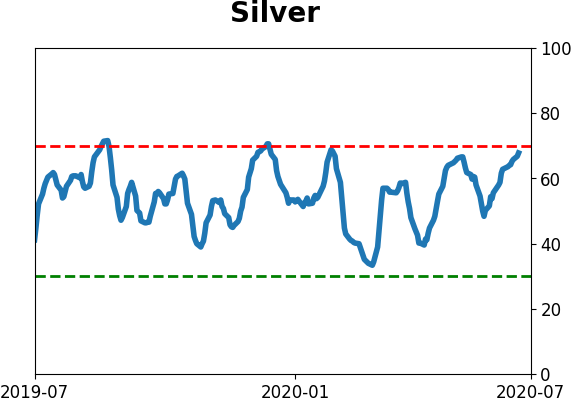
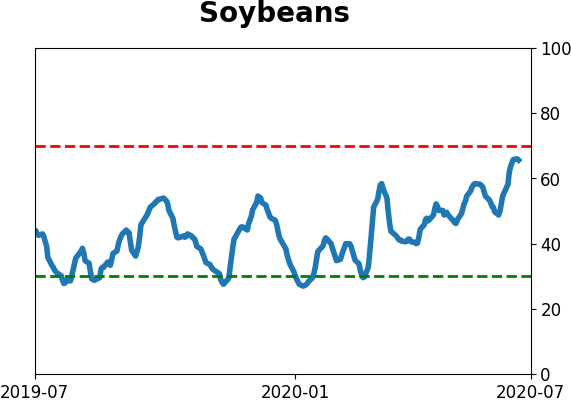
Optimism Index Thumbnails
|
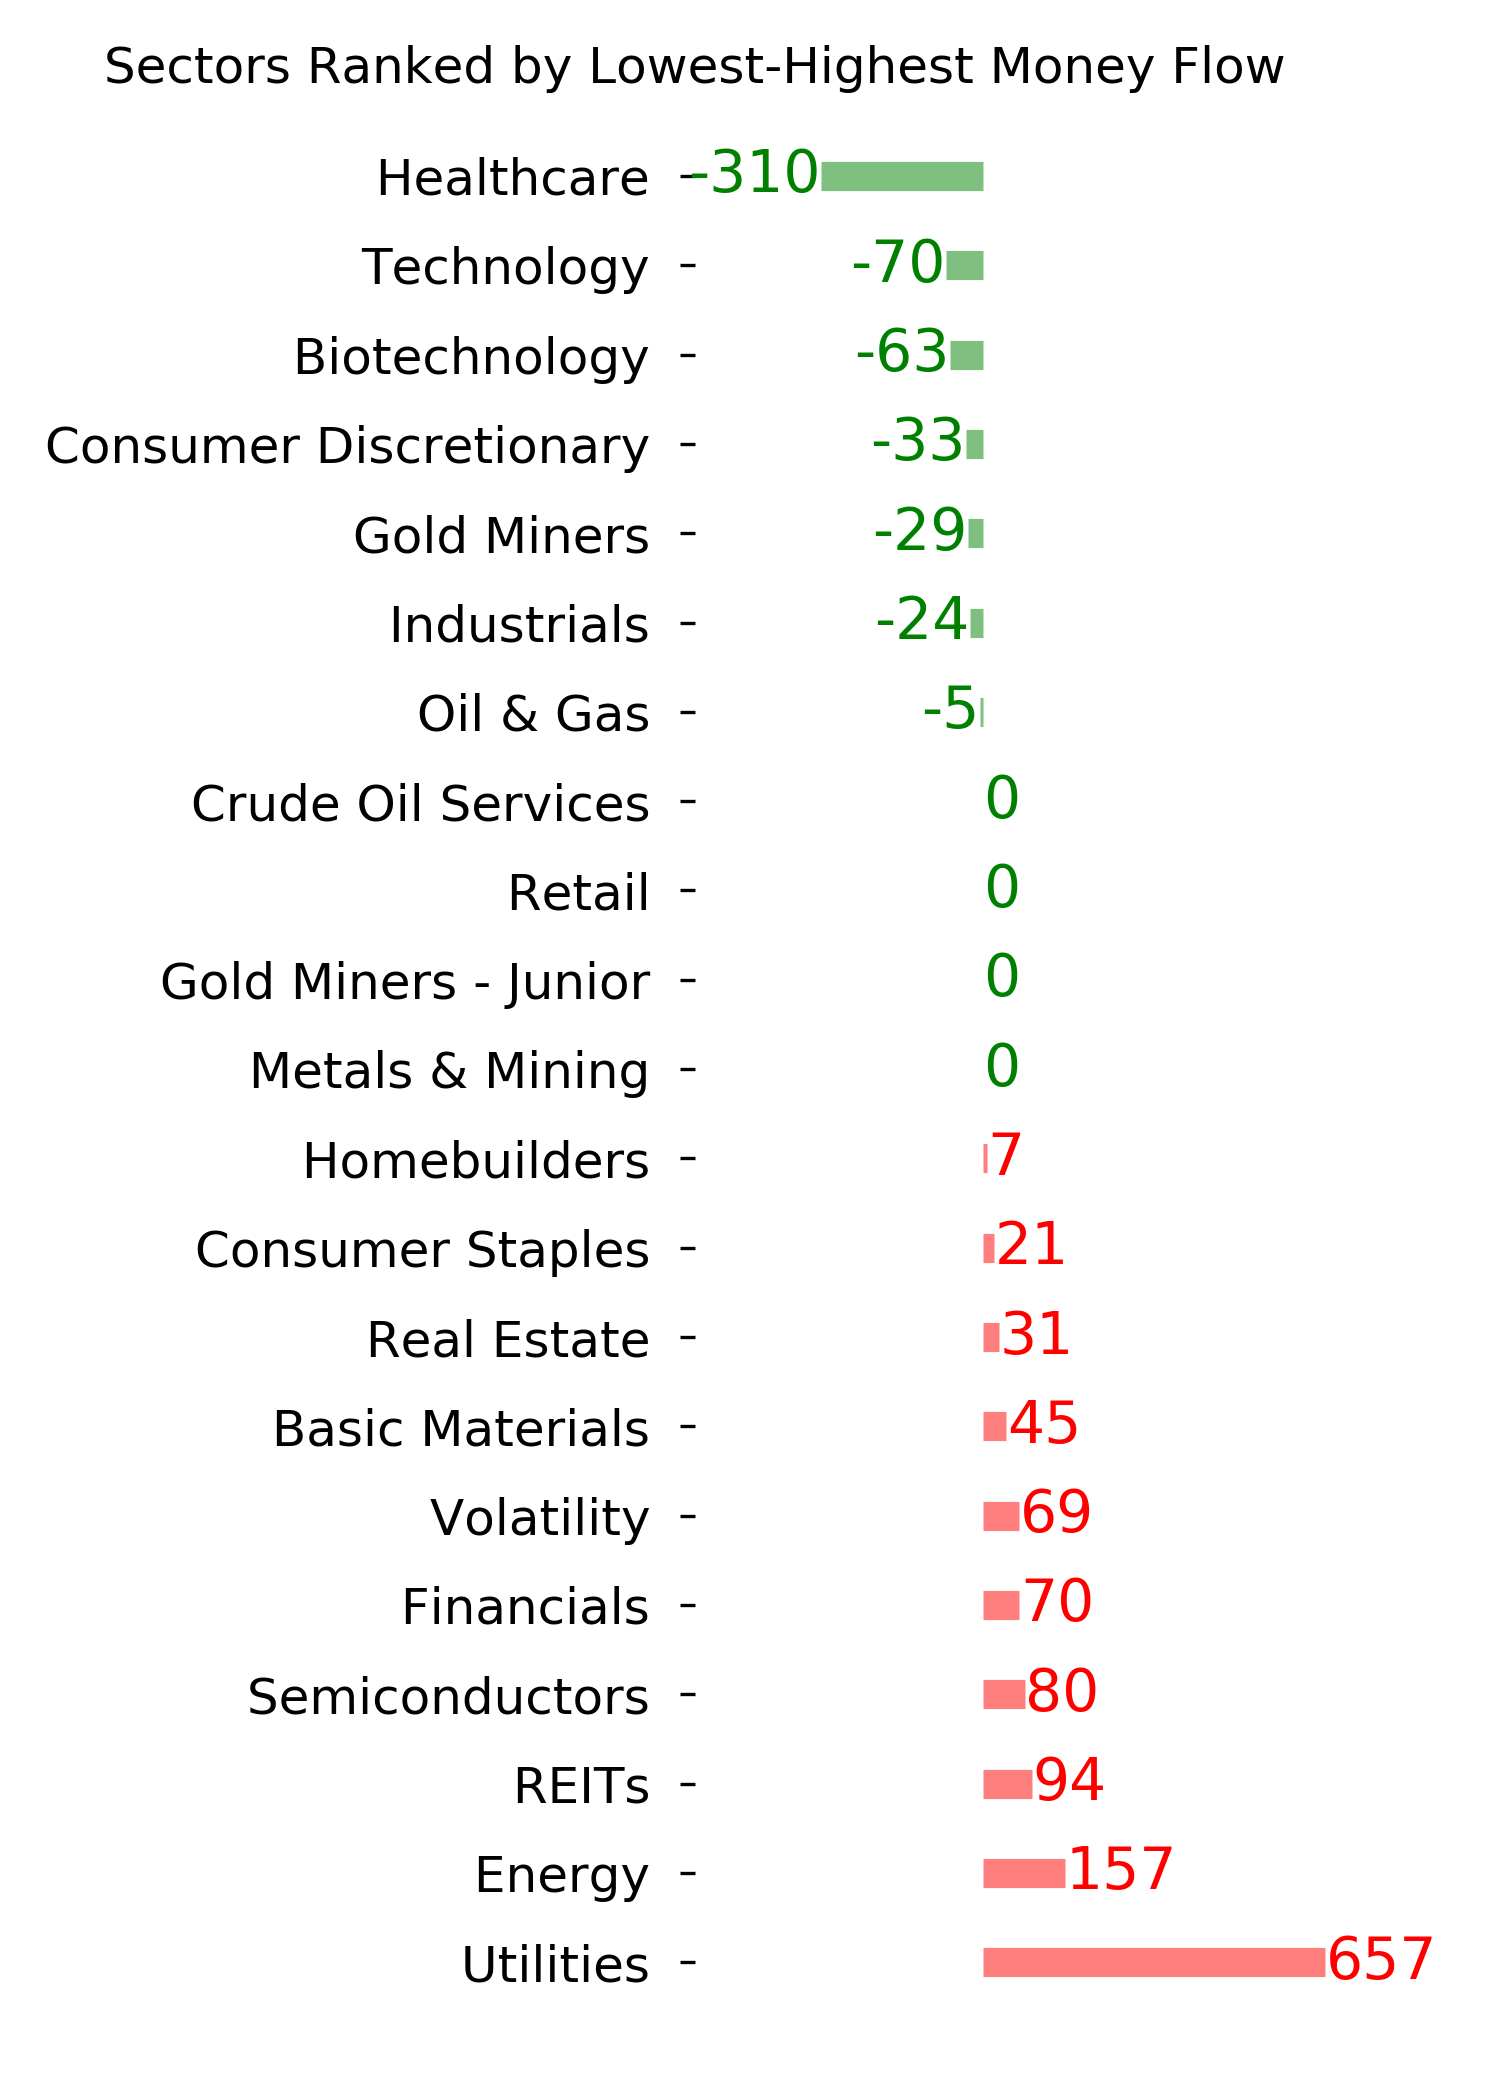
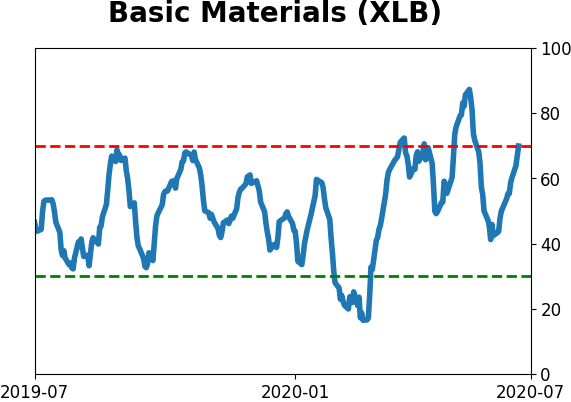
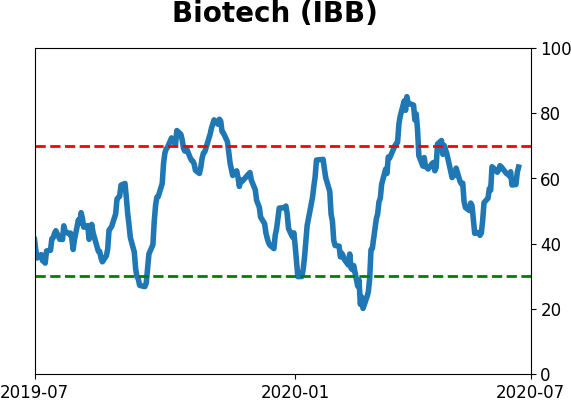
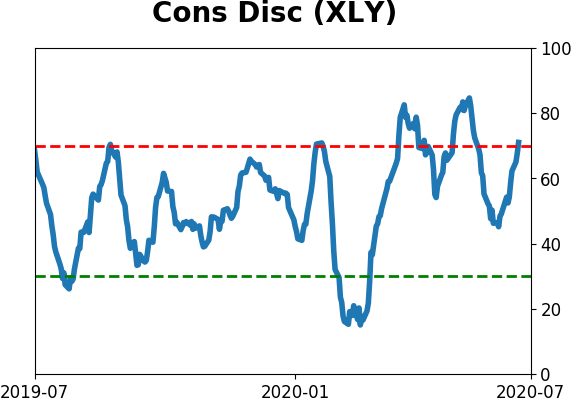
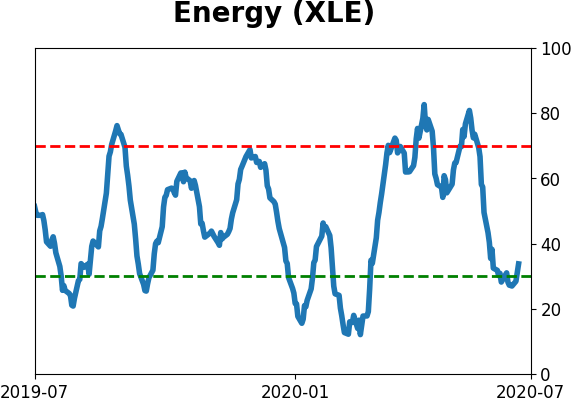
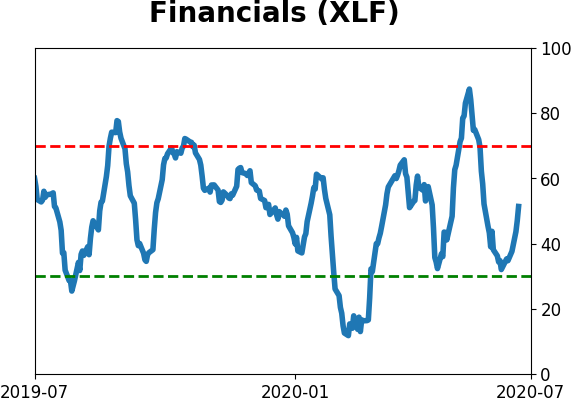
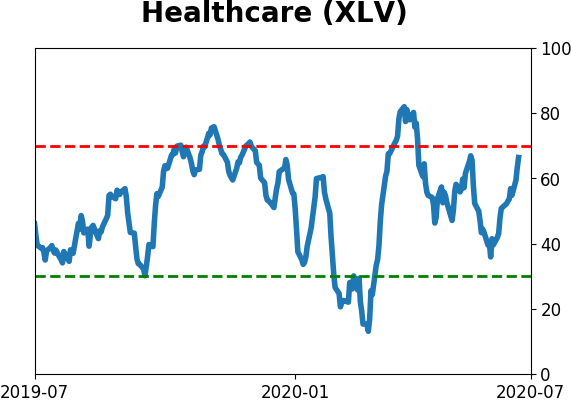
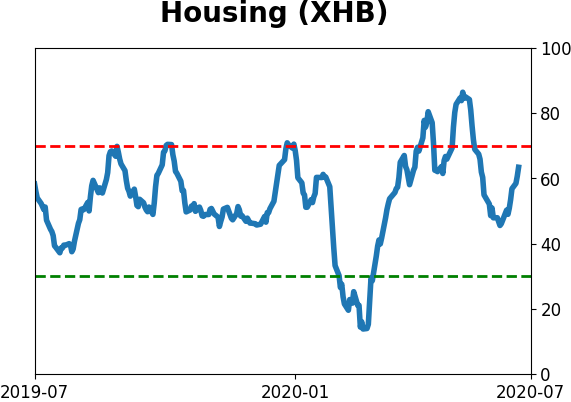
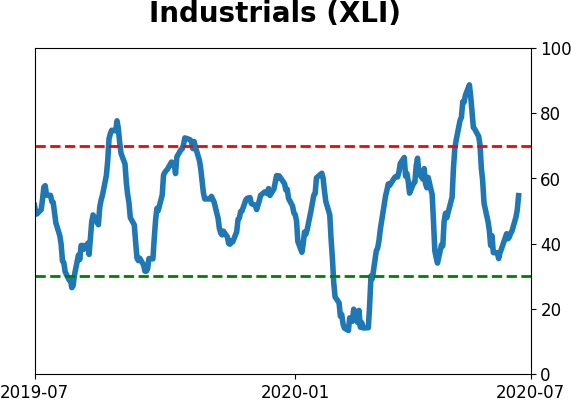
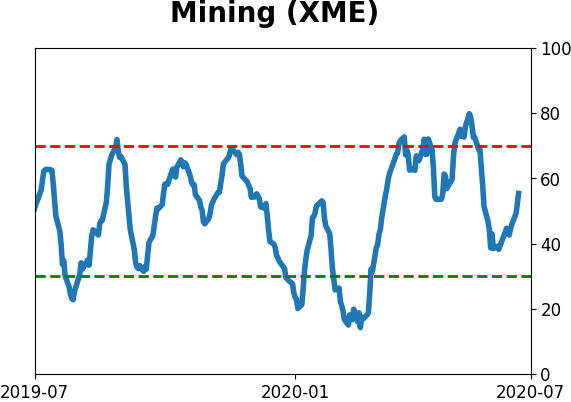
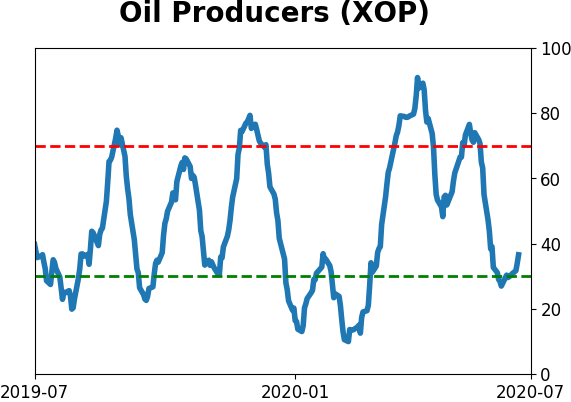
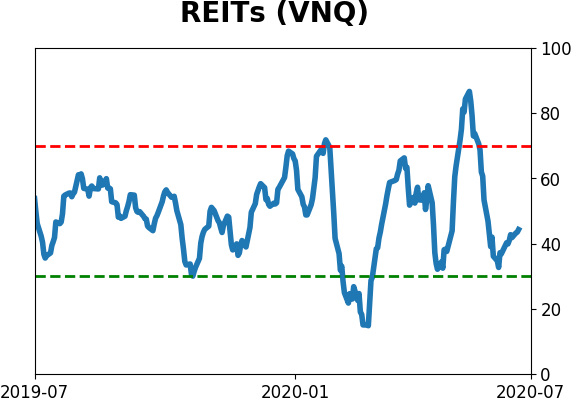
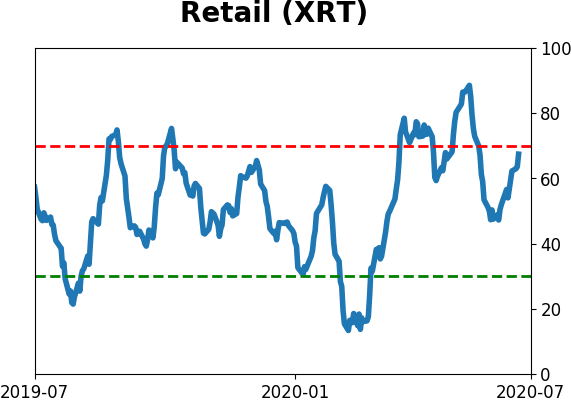
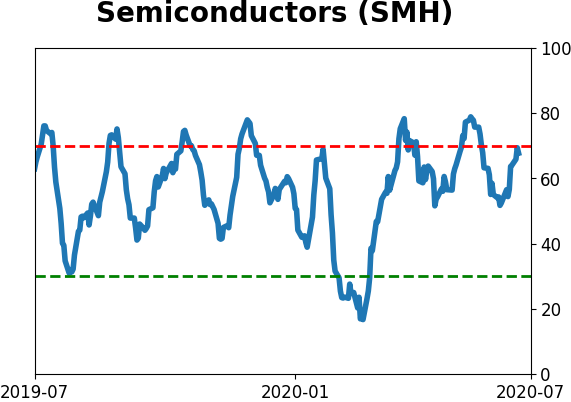
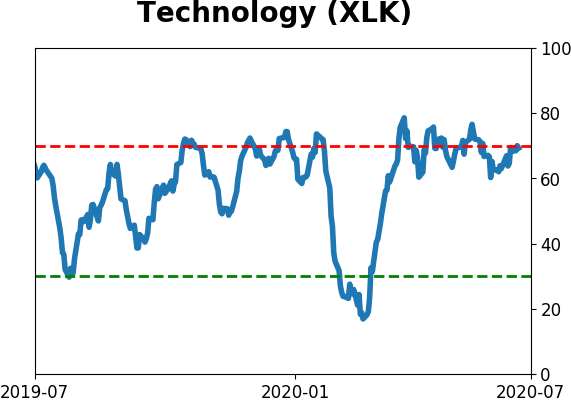
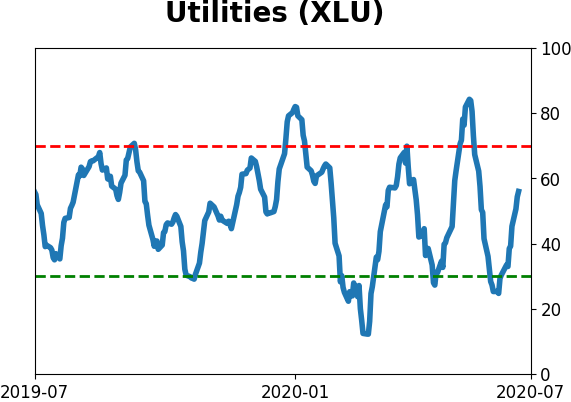
Sector ETF's - 10-Day Moving Average
|
|
|
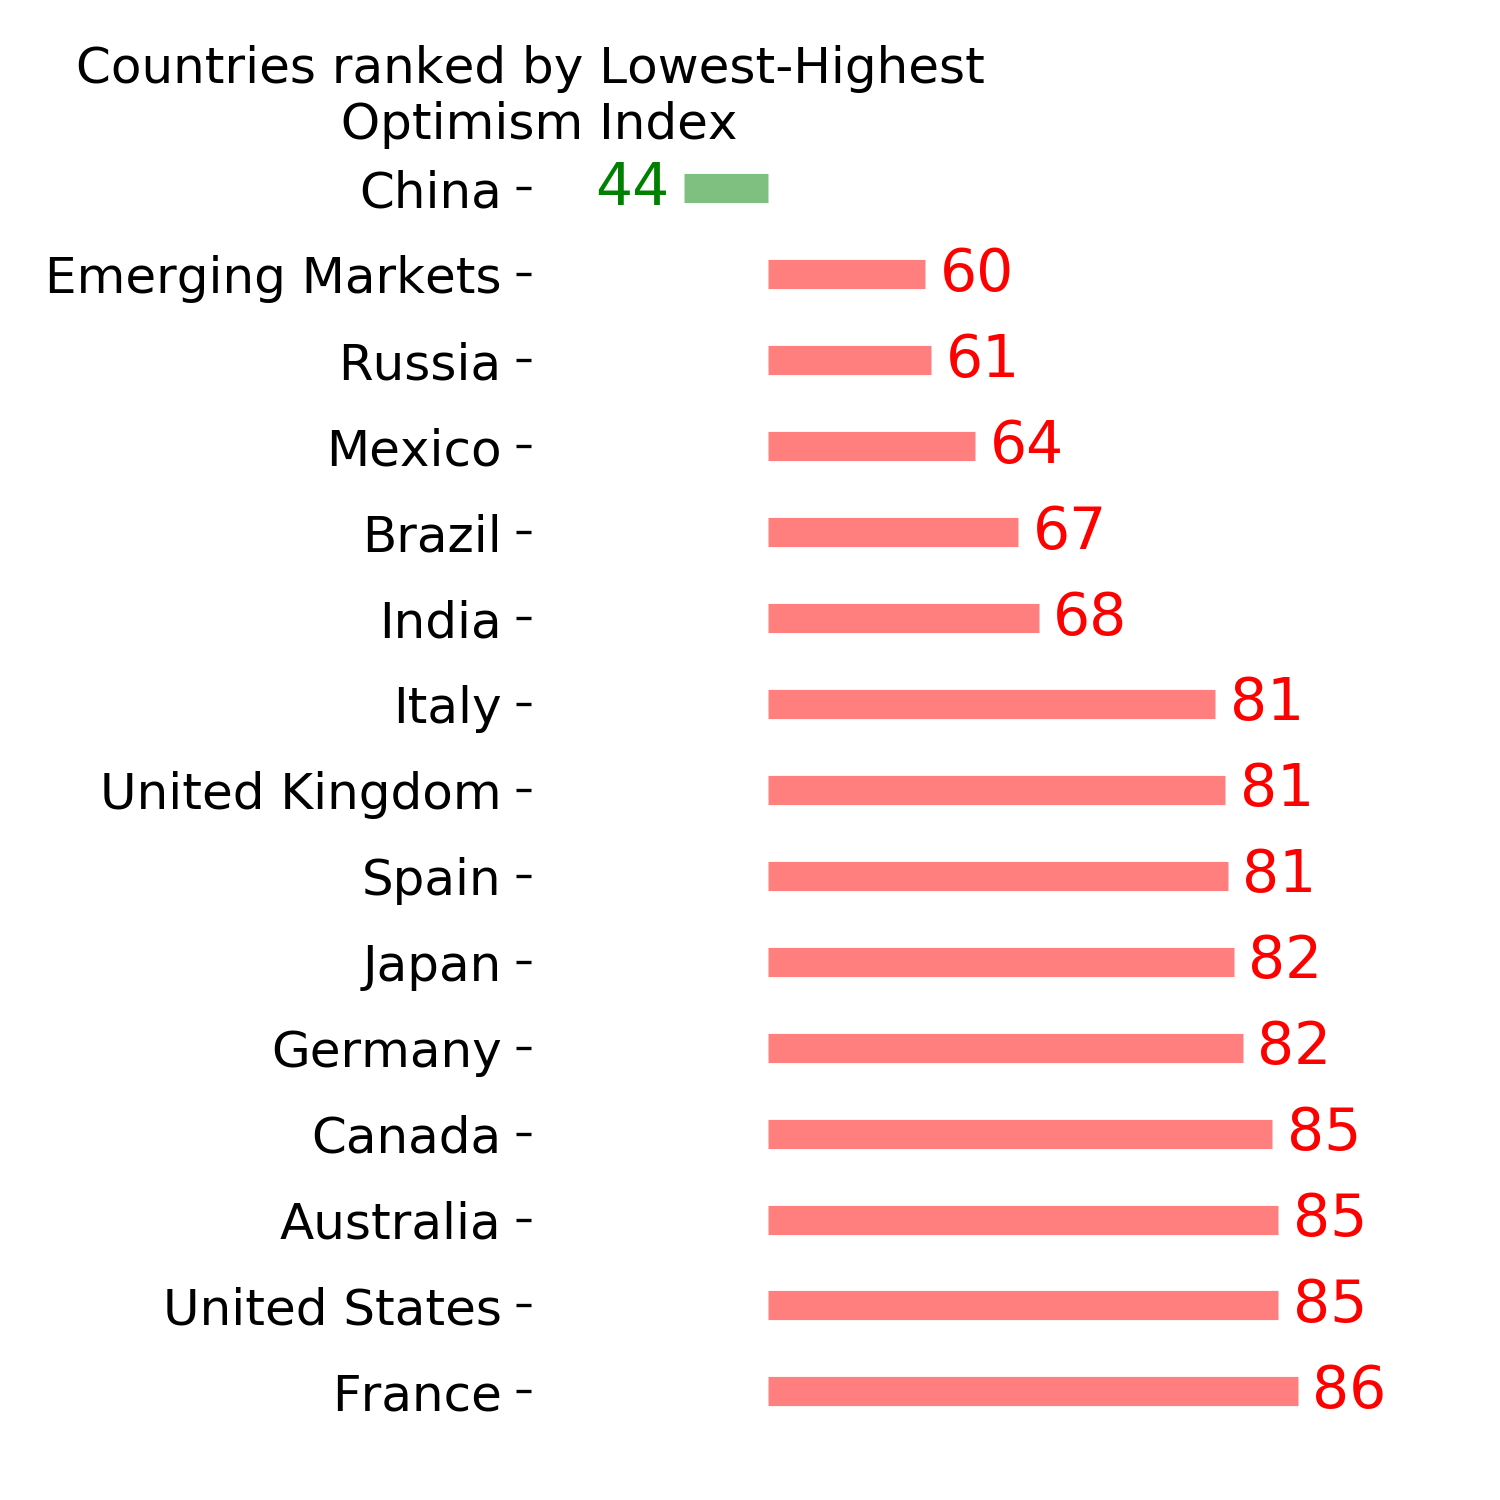
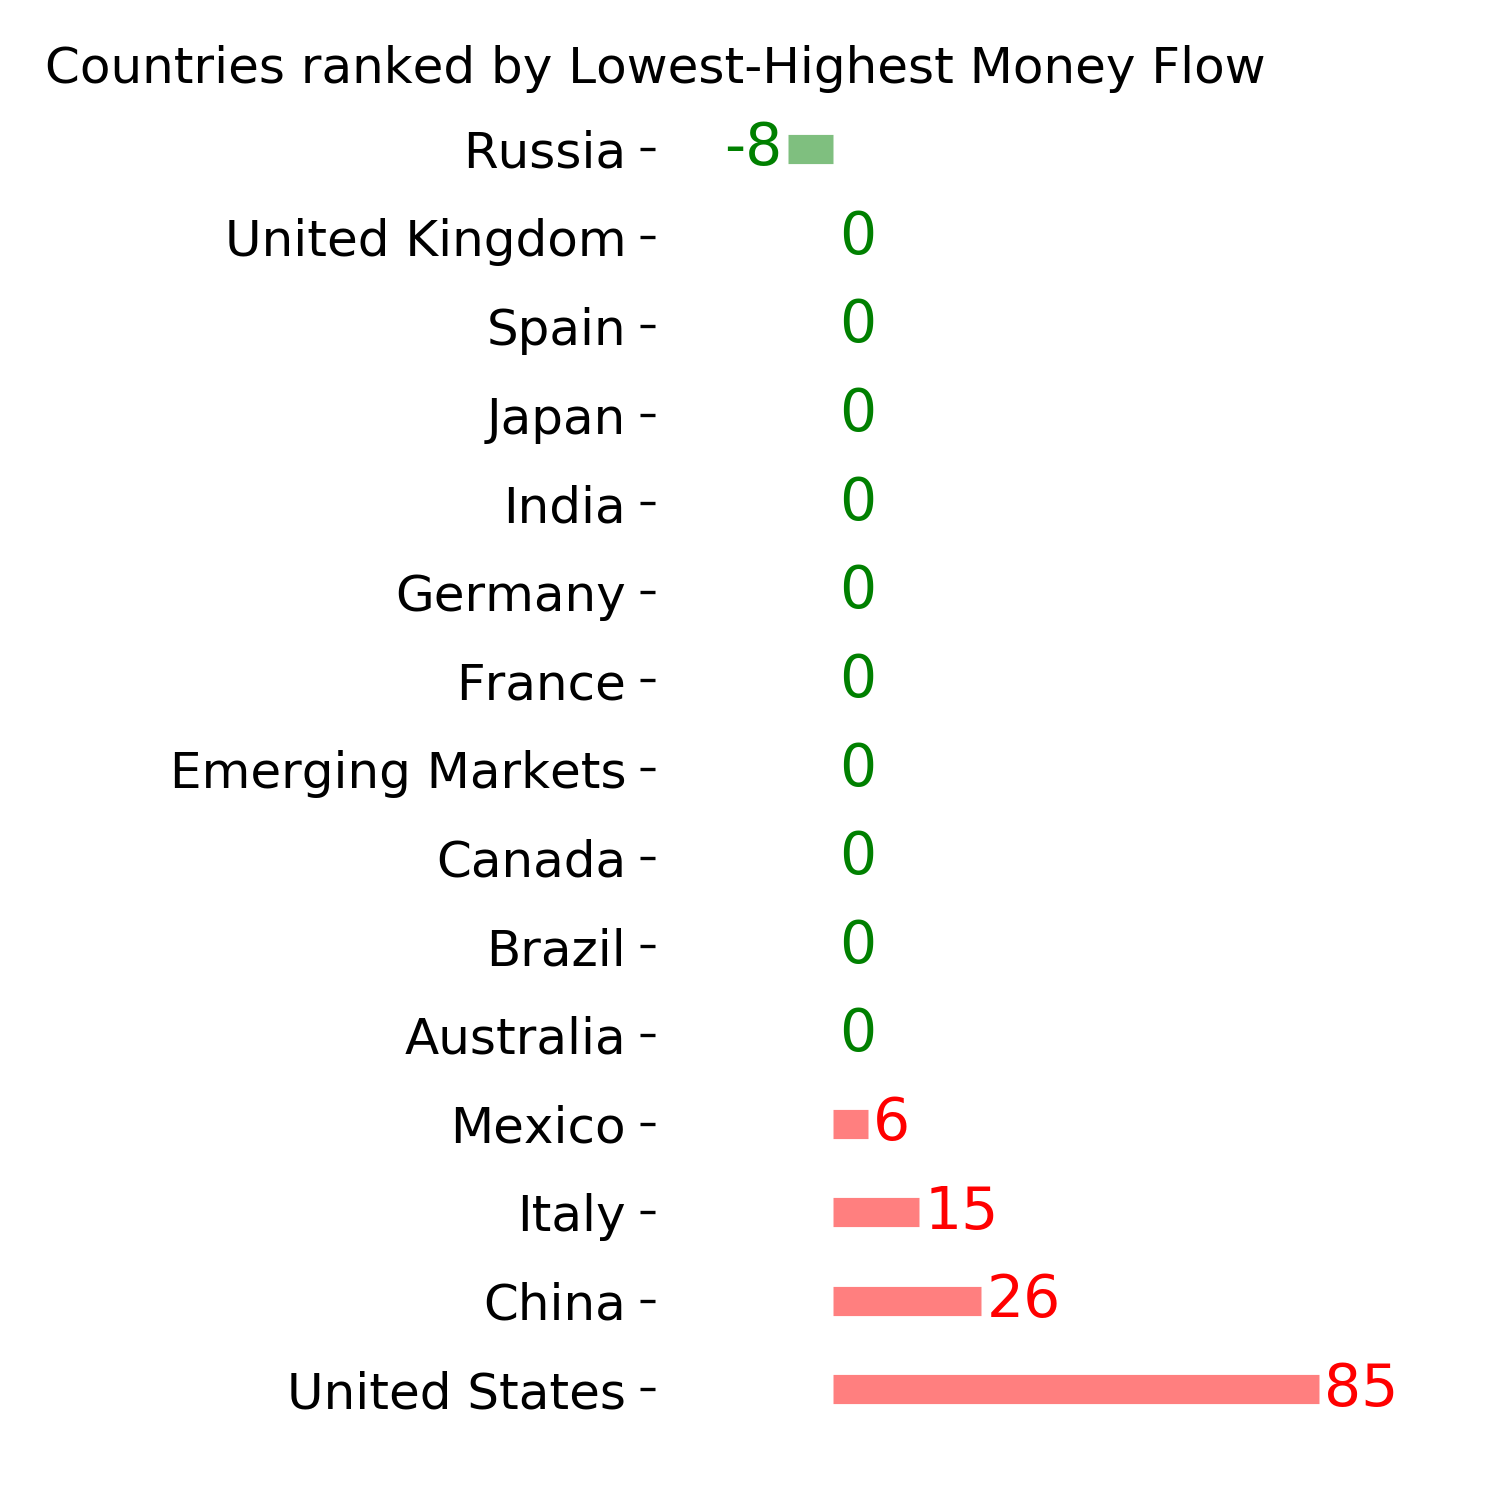
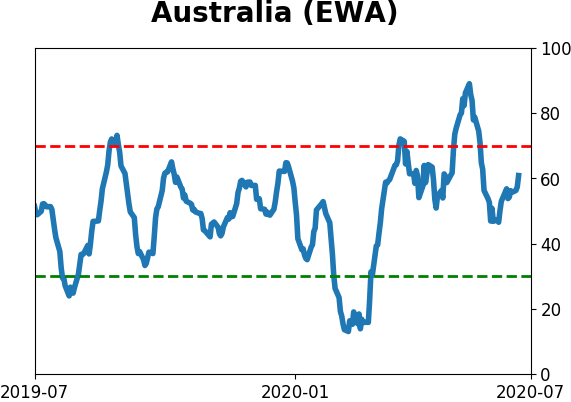
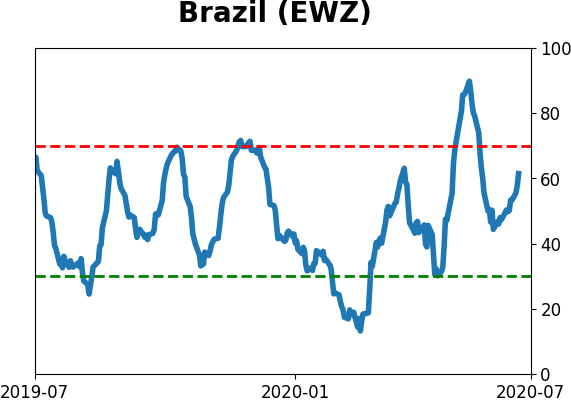
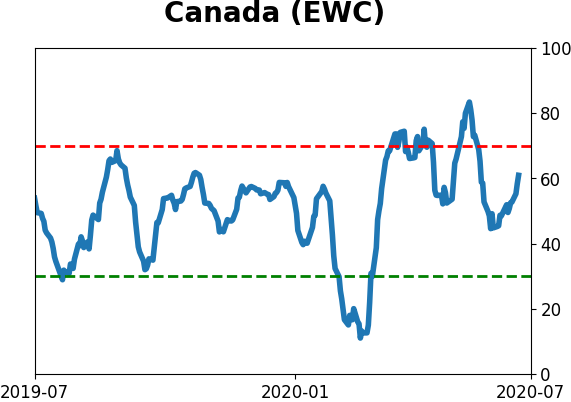
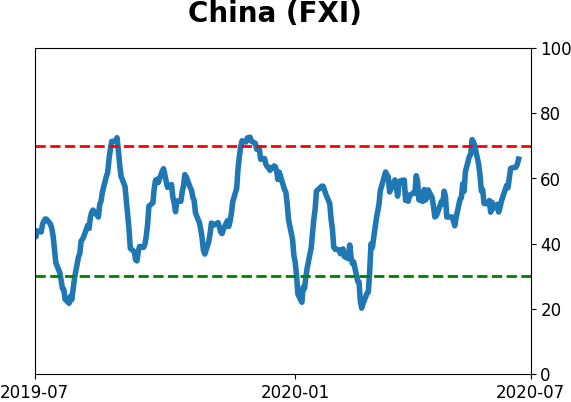
Country ETF's - 10-Day Moving Average
|
|
|
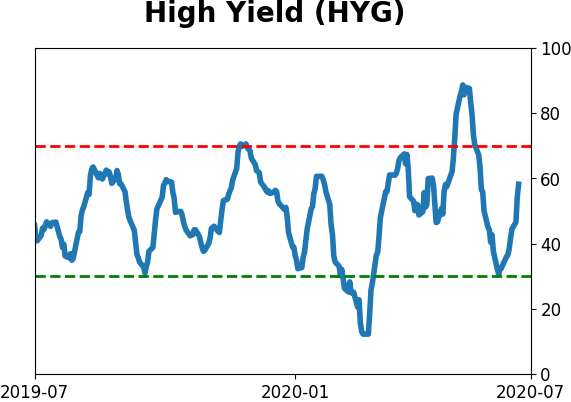
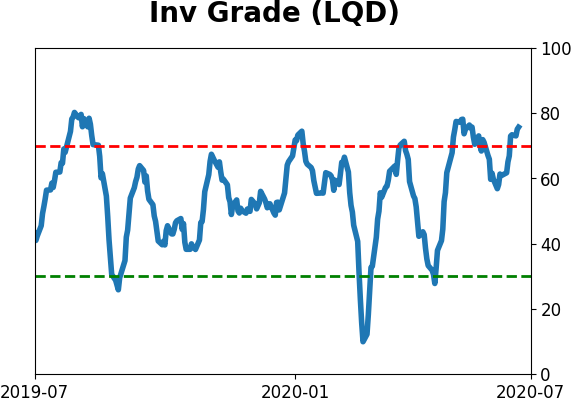
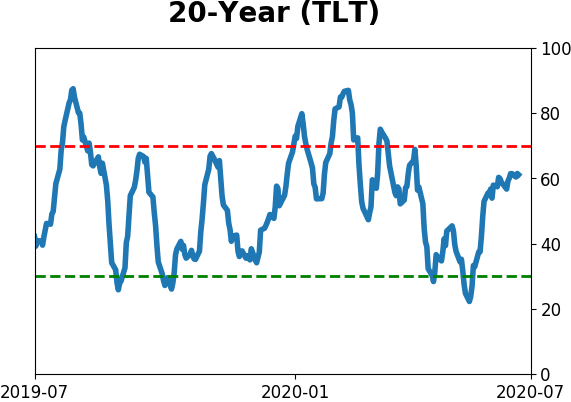
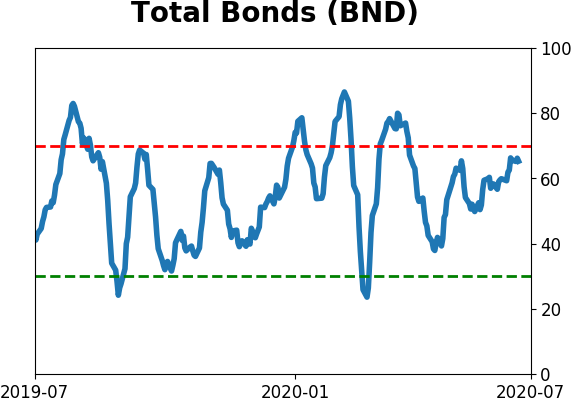
Bond ETF's - 10-Day Moving Average
|
|
|
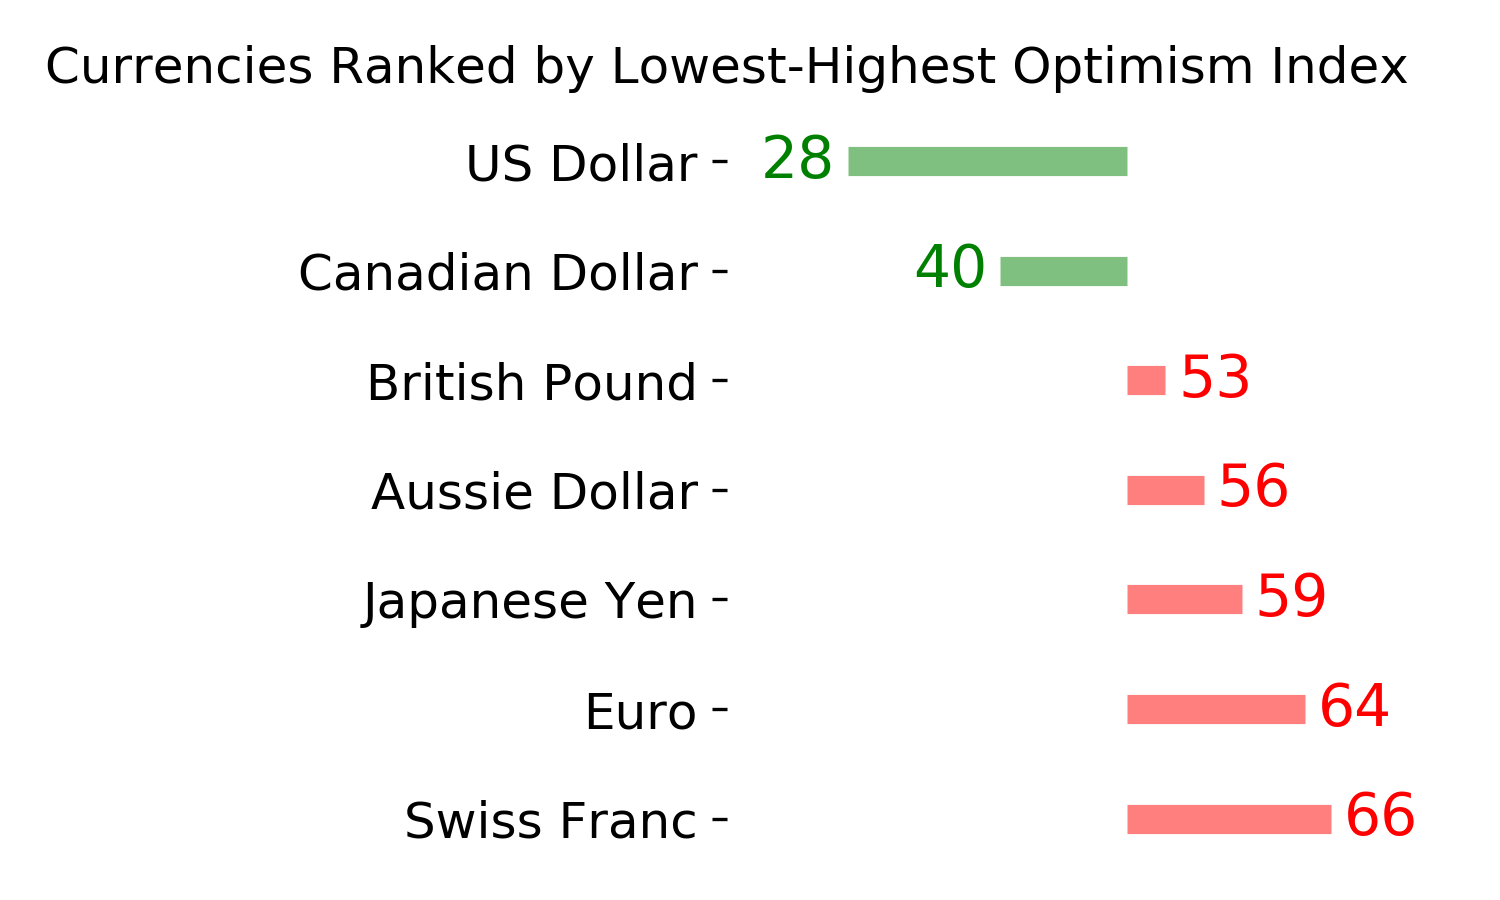
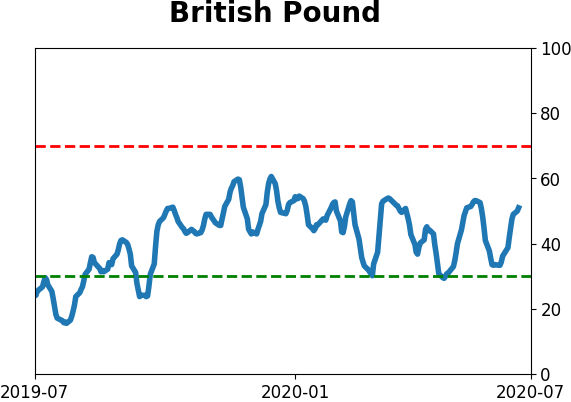
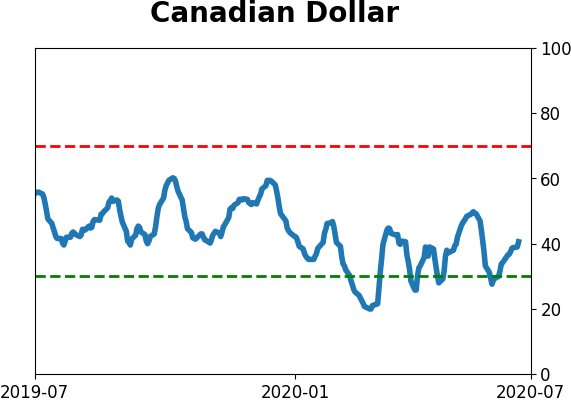
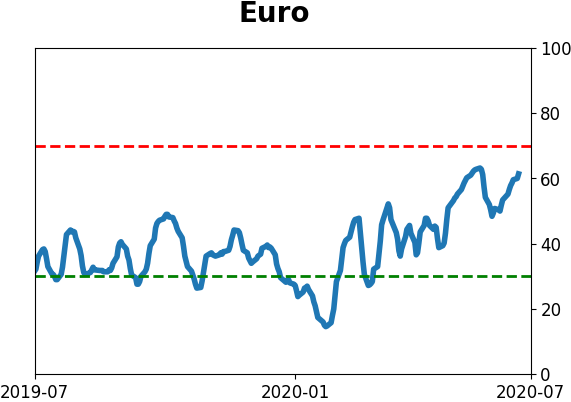
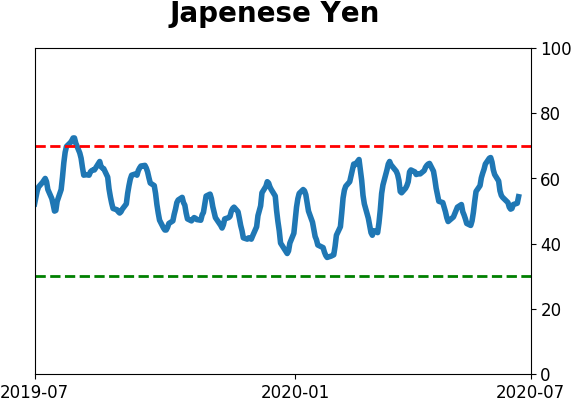
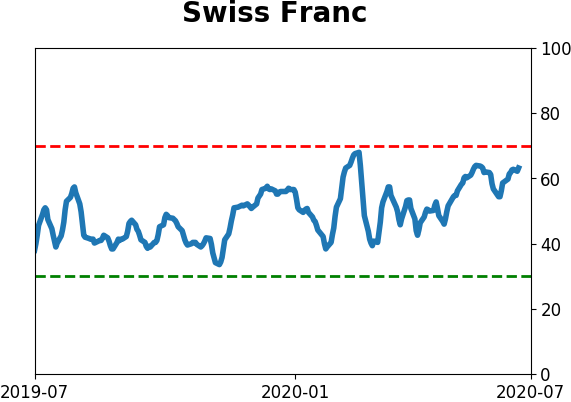
Currency ETF's - 5-Day Moving Average
|
|
|
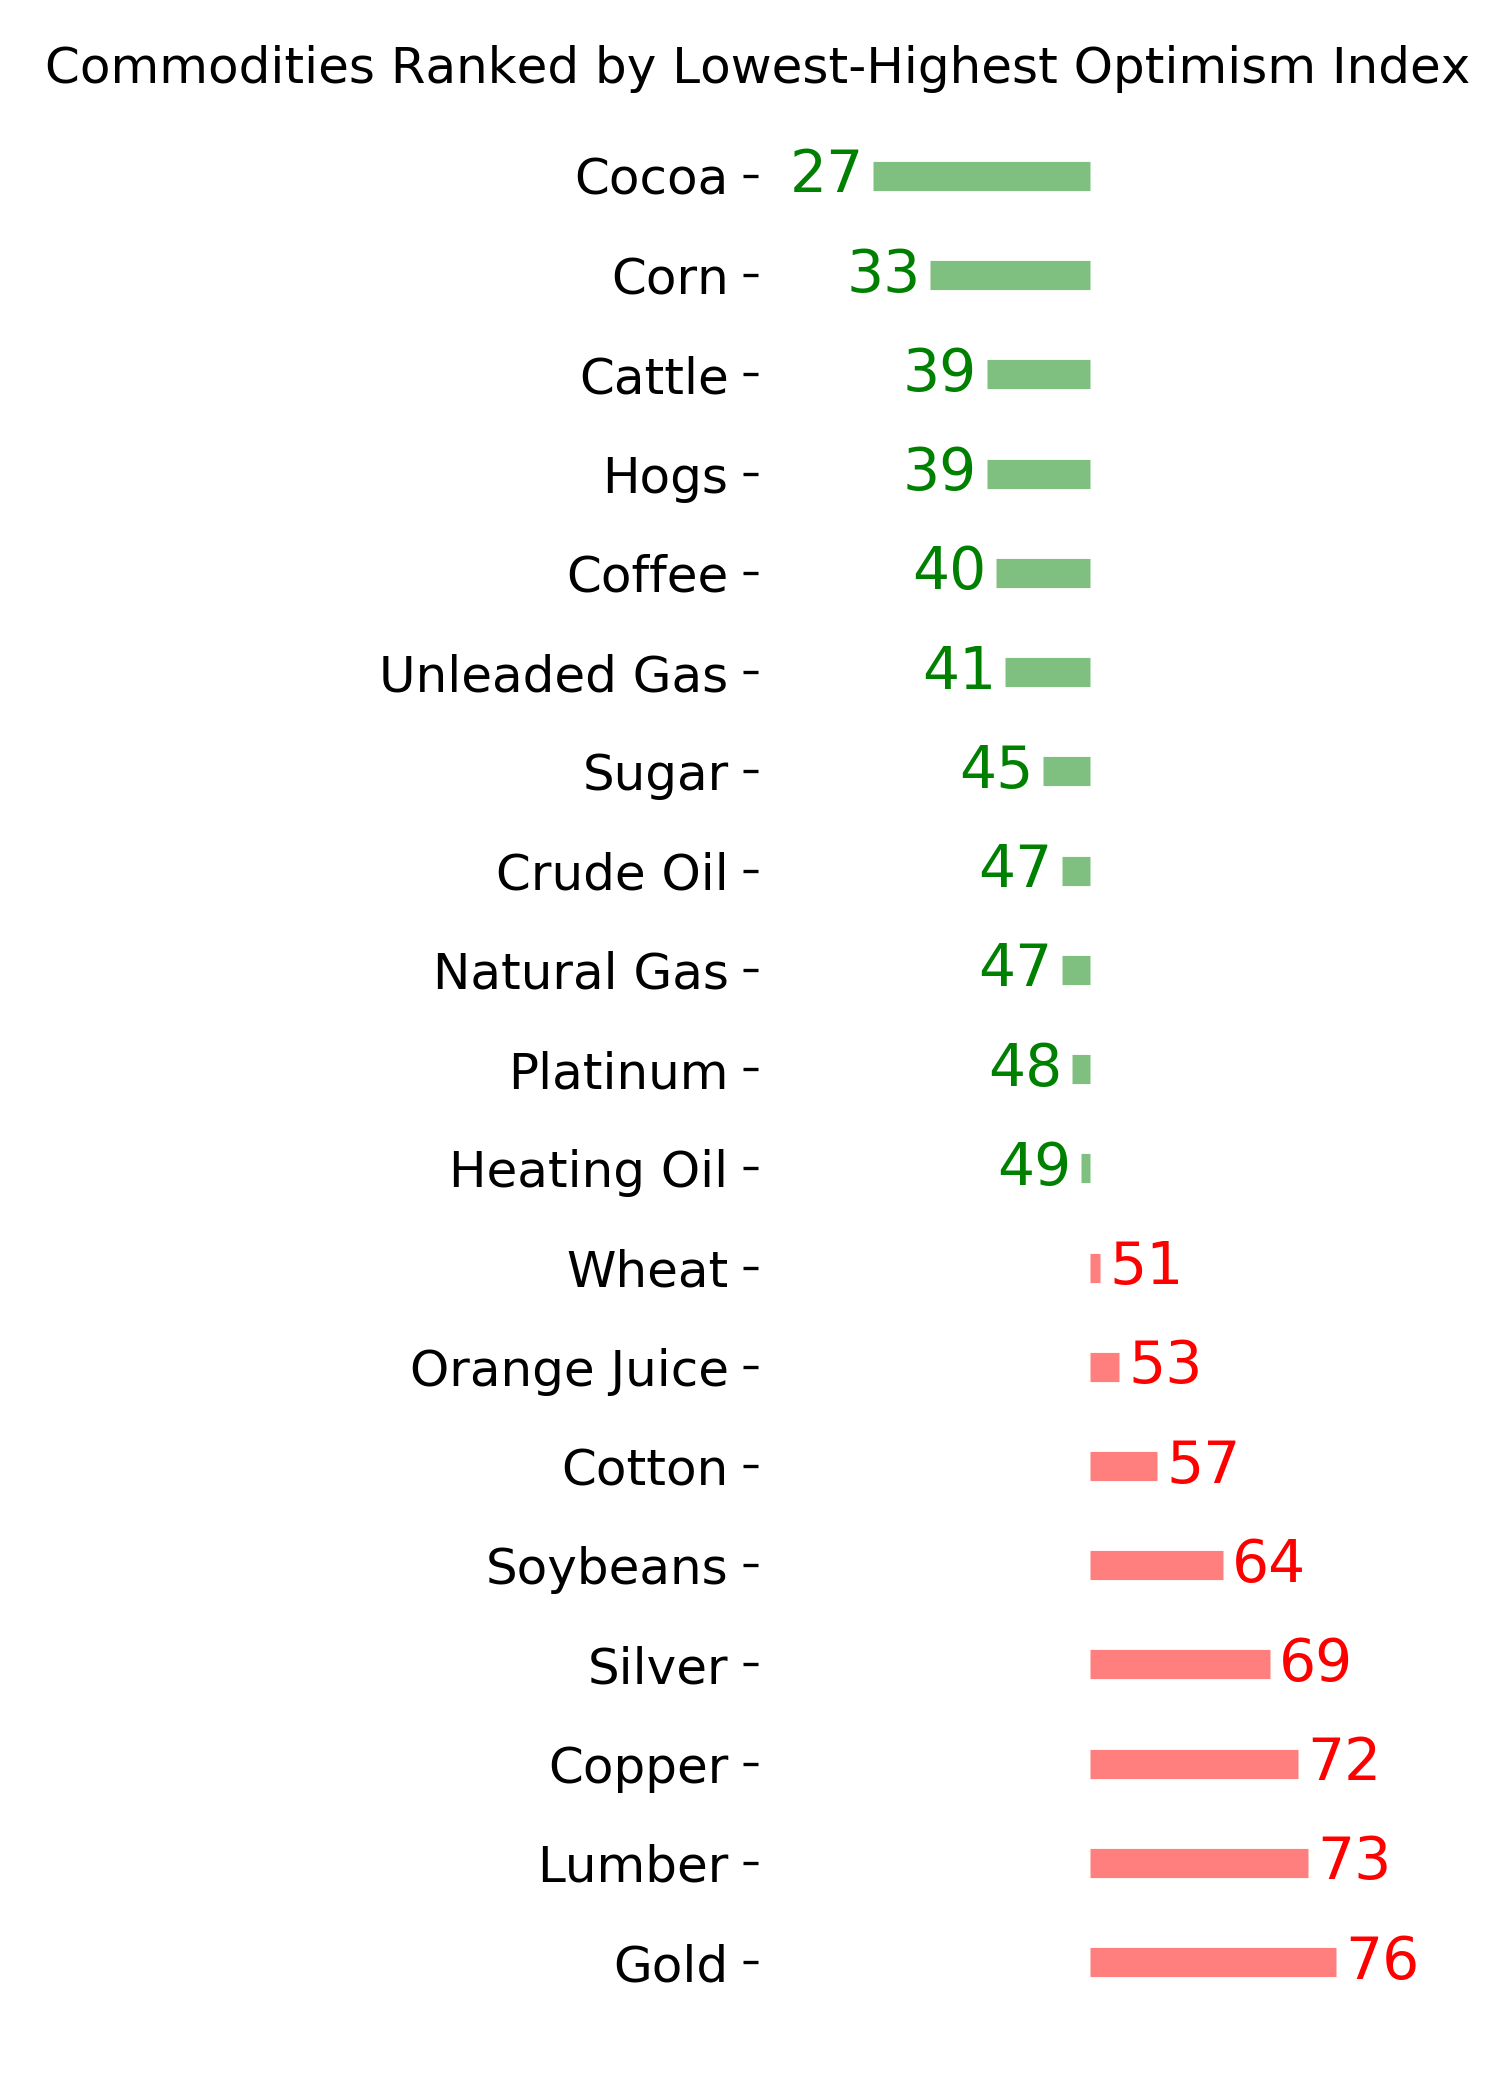
Commodity ETF's - 5-Day Moving Average
|
|