Headlines
|
|
Options traders keep setting new speculative records:
Last week, the smallest of options traders once again went on a speculative buying binge. Their net speculative activity is the most extreme since 2007, and when premiums are considered, it is by far the most extreme ever. All options traders spent 50% more on bullish strategies than bearish ones, among the highest amounts ever.
Financials hit hard as they start to report earnings:
As banks and other financials report Q2 earnings this week, they're trying to recover from still-heavy losses year-to-date. The S&P Financials sector is down more than 22%, one of their worst losses this far into a year. After other large losses this far into a year, when they start to report earnings, they have a tendency to show gains relative to the broader market. It should be a good sign that "smart money" hedgers are shorting Treasury notes, too.
Tech's tired: The Nasdaq 100, which has helped to embolden traders with a historic winning streak, rallied more than 2% intraday to set a record high, then reversed enough to close down by more than 1%. The only other day in its history to do that was March 7, 2000. If we look at "only" 1% intraday rallies that reversed, then there were 10 days. Of those, 8 of them saw a negative return either 2 or 3 months later. The dates were 1996-12-12,
1997-01-23, 1998-06-25, 1998-07-21, 1998-12-03, 1999-04-07, 1999-04-27, 2000-01-24, 2000-02-25, and 2000-03-07.
Bottom Line:
- Weight of the evidence has been suggesting flat/lower stock prices short- to medium-term, though that turned more neutral as stocks pulled back recently; still suggesting higher prices long-term
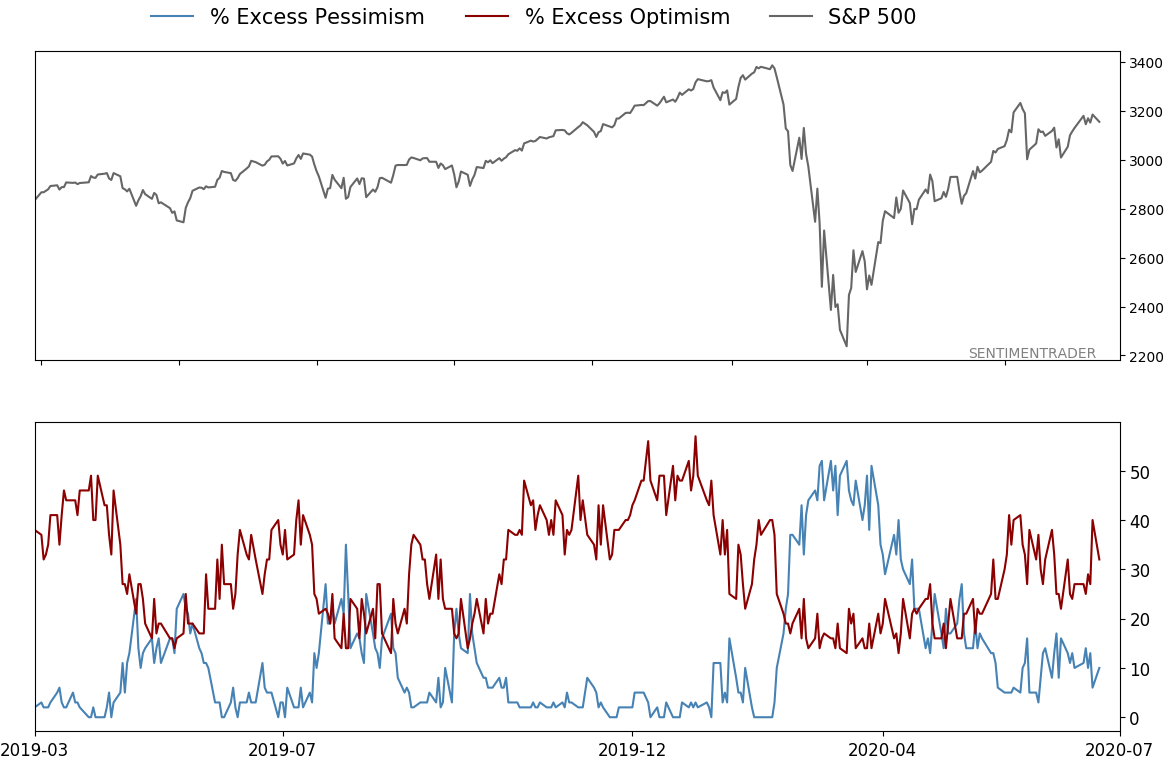
- Indicators show high and declining optimism, as Dumb Money Confidence neared 80% in early June with signs of reckless speculation, historic buying pressure, then even more speculation during what appears to be an unhealthy market environment
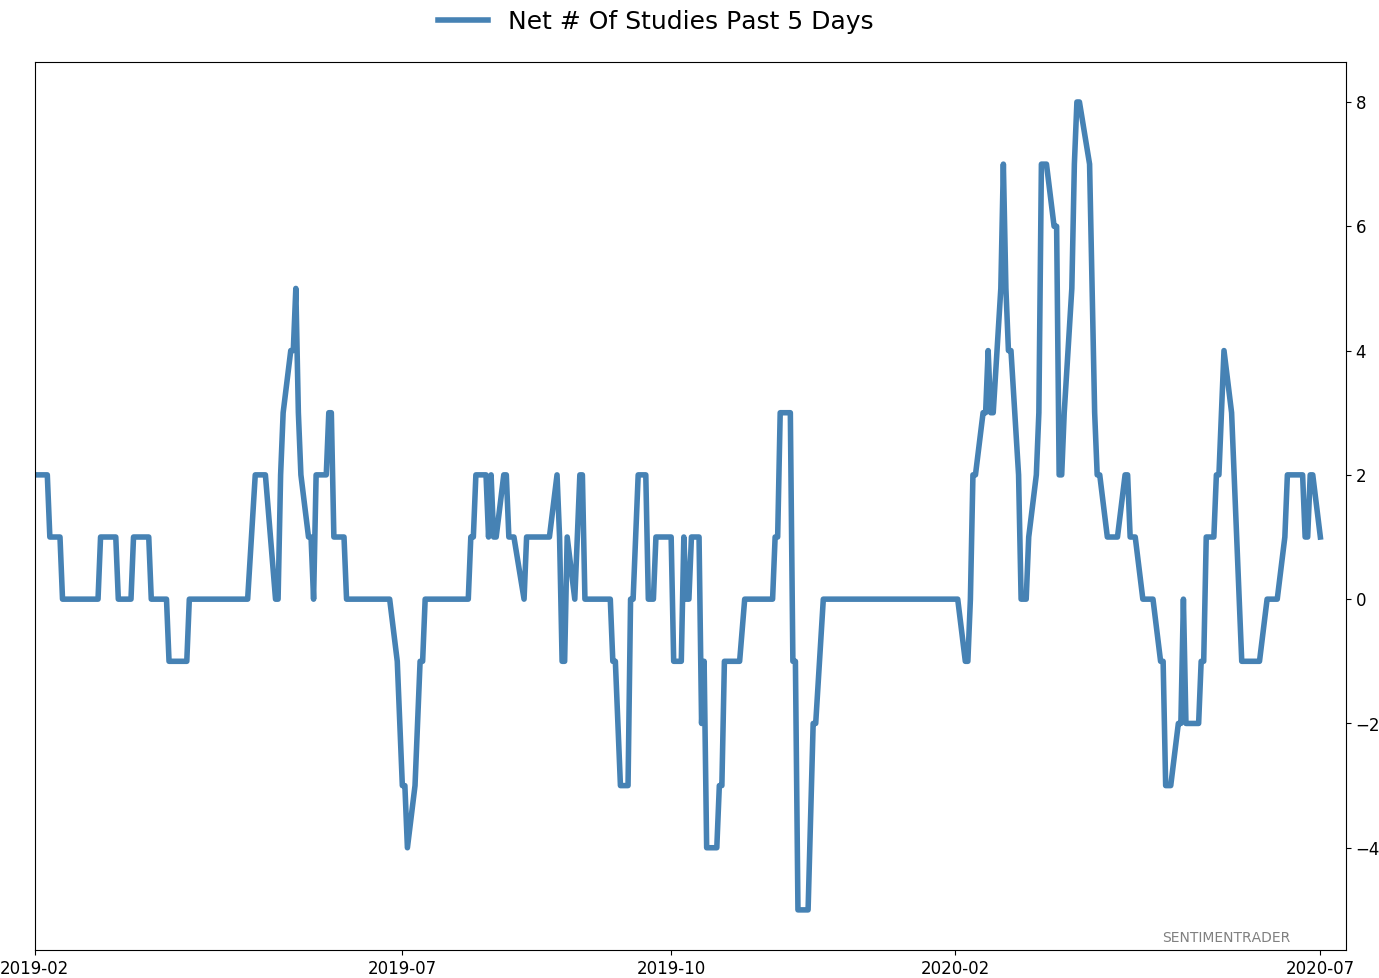
- Active Studies show a heavy positive skew over the medium- to long-term; breadth thrusts, recoveries, and trend changes have an almost unblemished record at preceding higher prices over a 6-12 month time frame
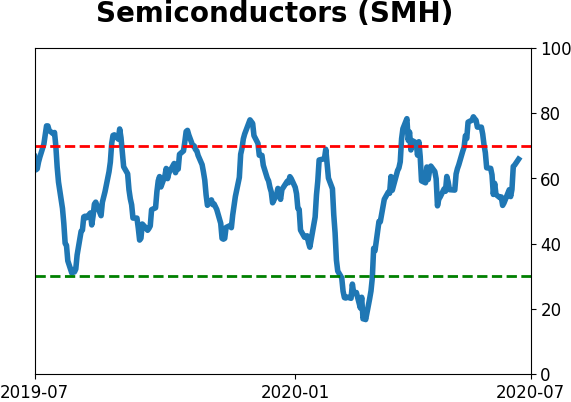
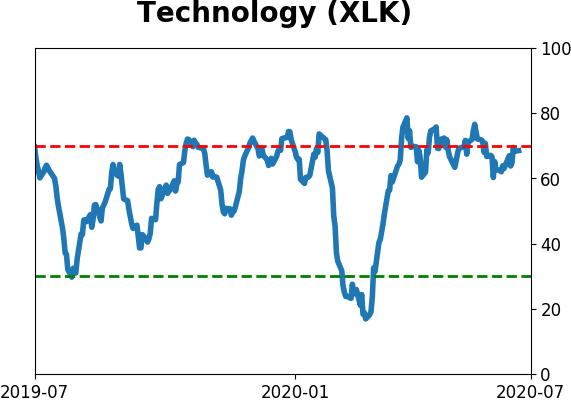
- Signs of extremely skewed preference for tech stocks nearing exhaustion, especially relative to industrials and financials (here and here)
- Indicators and studies for other markets are mixed with no strong conclusion, though it's not a great sign for Treasuries that hedgers are net short.
|
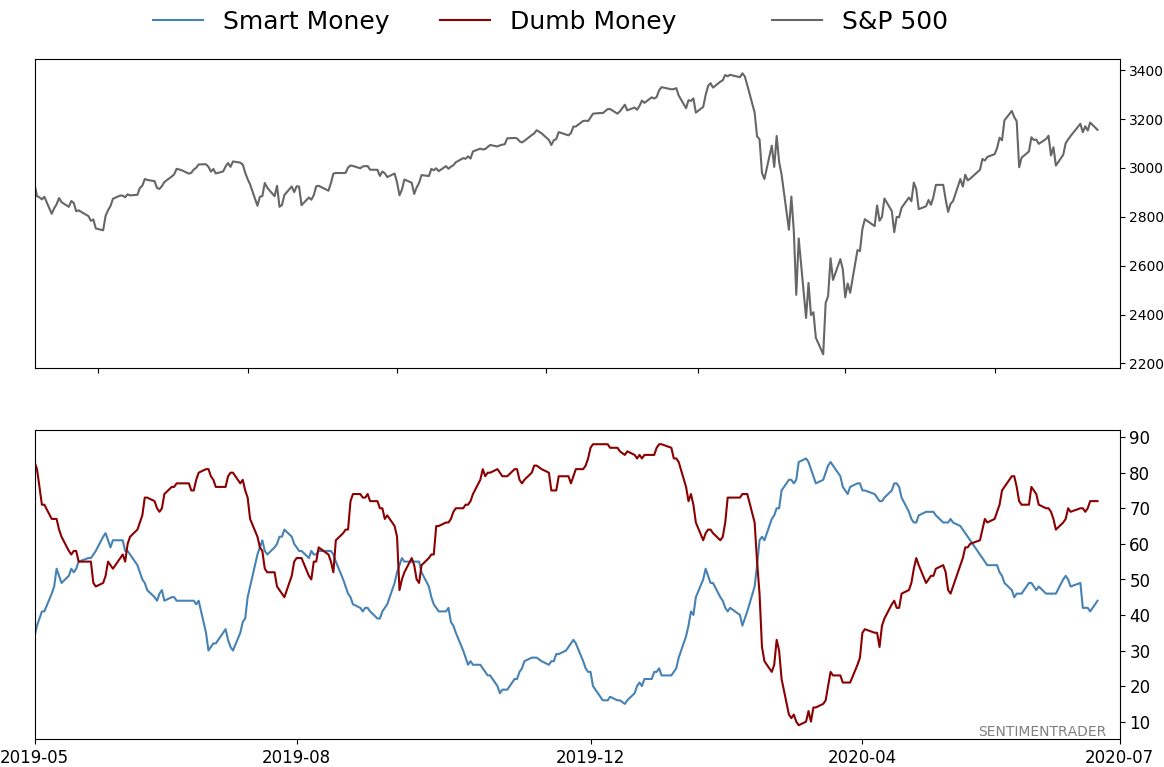
Smart / Dumb Money Confidence
|
Smart Money Confidence: 44%
Dumb Money Confidence: 72%
|
|
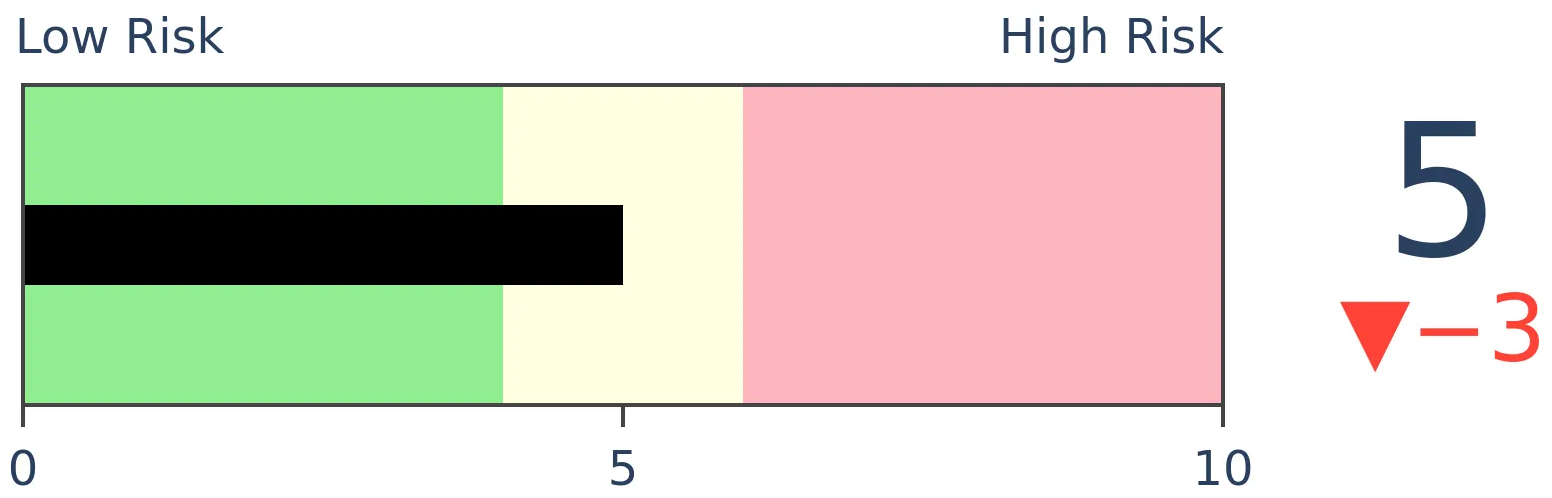
Risk Levels
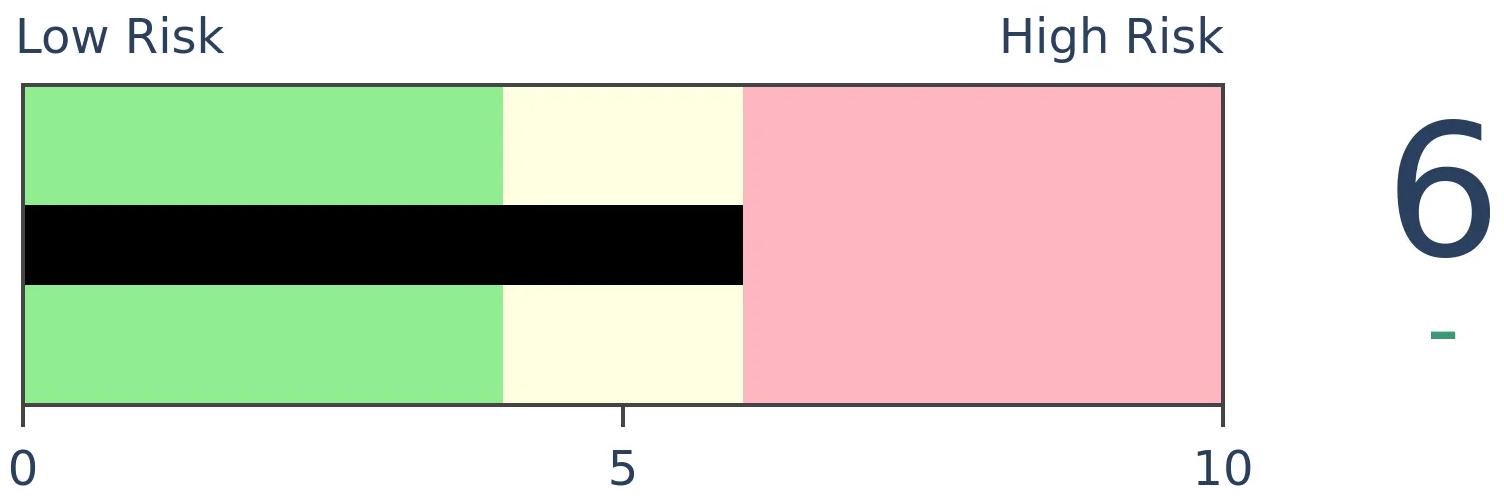
Stocks Short-Term
|
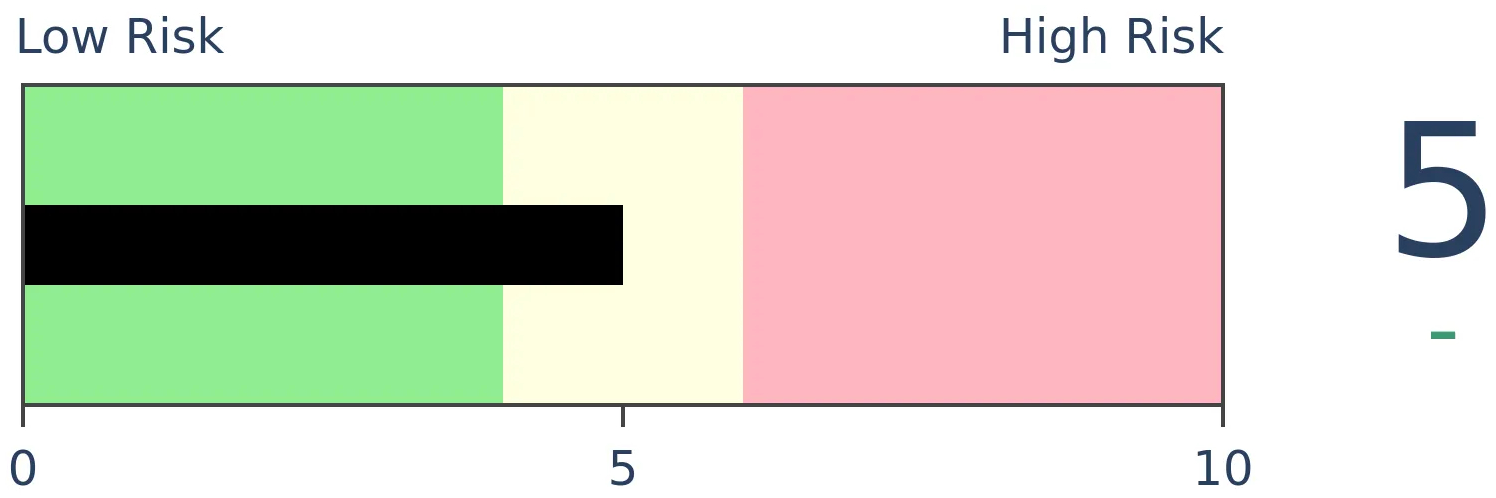
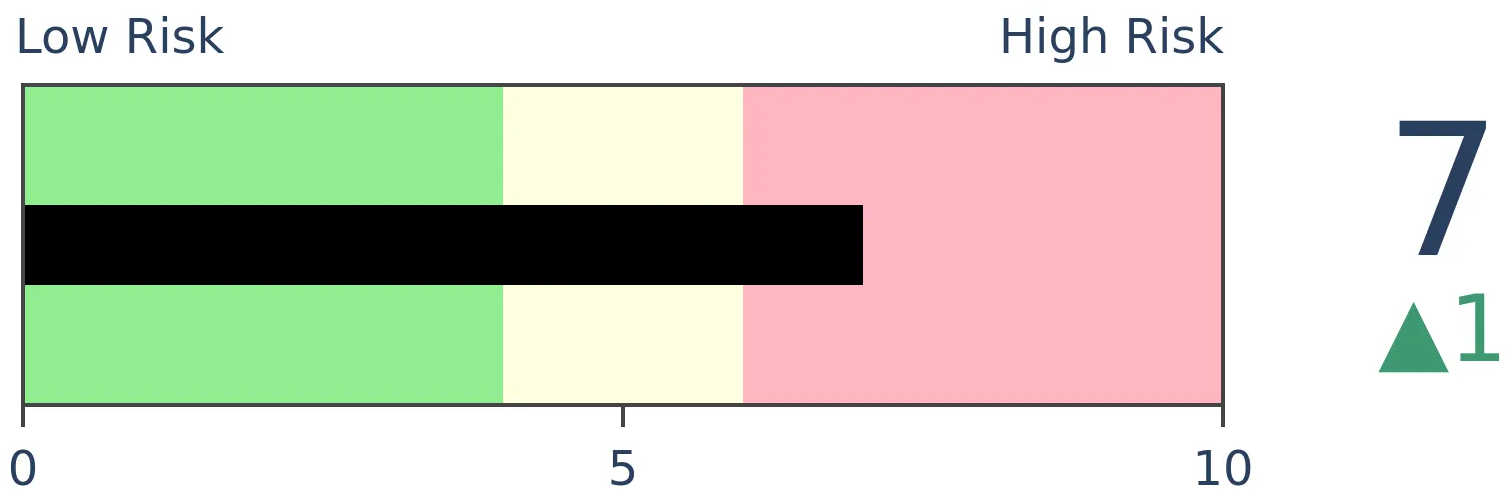
Stocks Medium-Term

|
|
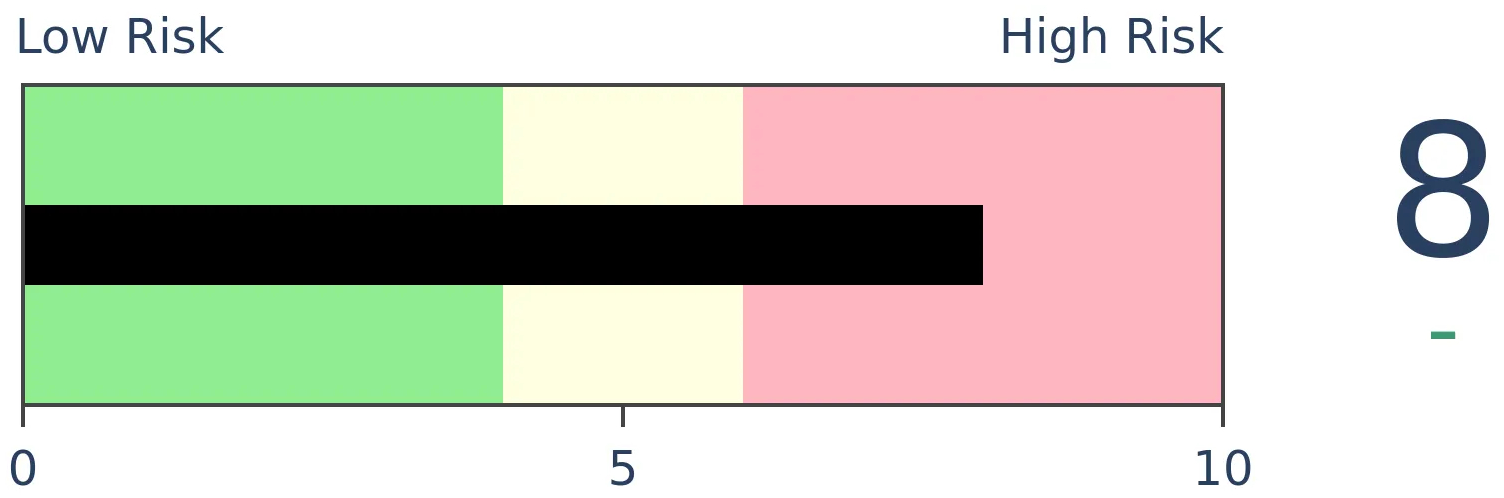
Bonds
|
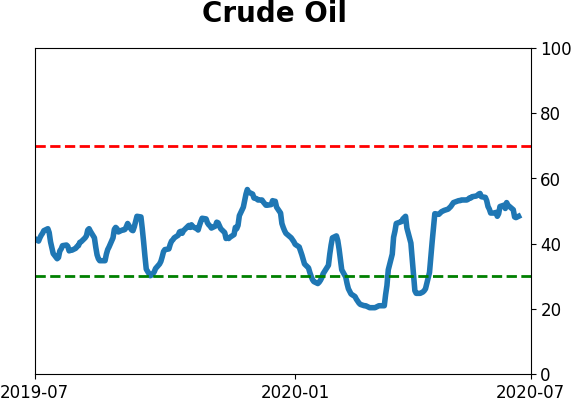
Crude Oil
|
|
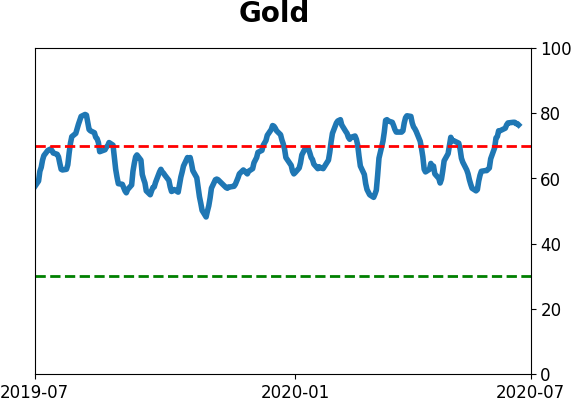
Gold
|
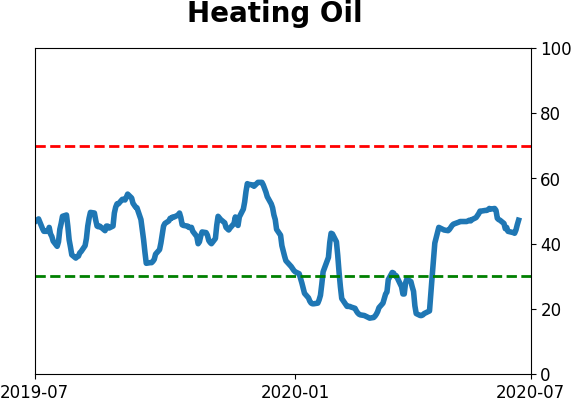
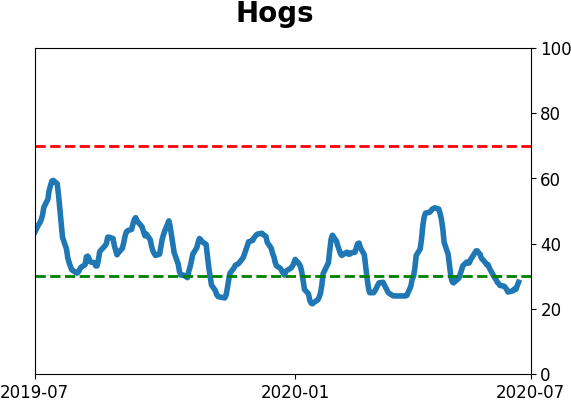
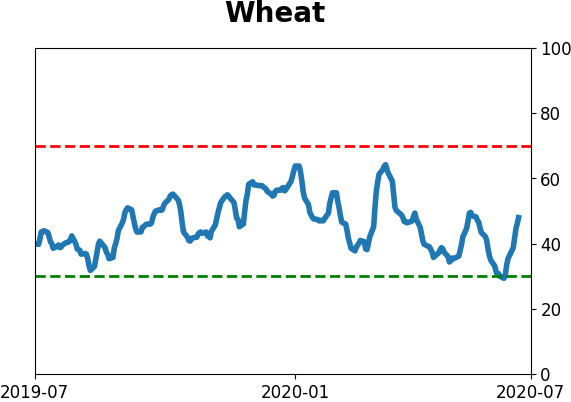
Agriculture
|
|
Research
BOTTOM LINE
Last week, the smallest of options traders once again went on a speculative buying binge. Their net speculative activity is the most extreme since 2007, and when premiums are considered, it is by far the most extreme ever. All options traders spent 50% more on bullish strategies than bearish ones, among the highest amounts ever.
FORECAST / TIMEFRAME
SPY -- Down, Medium-Term
|
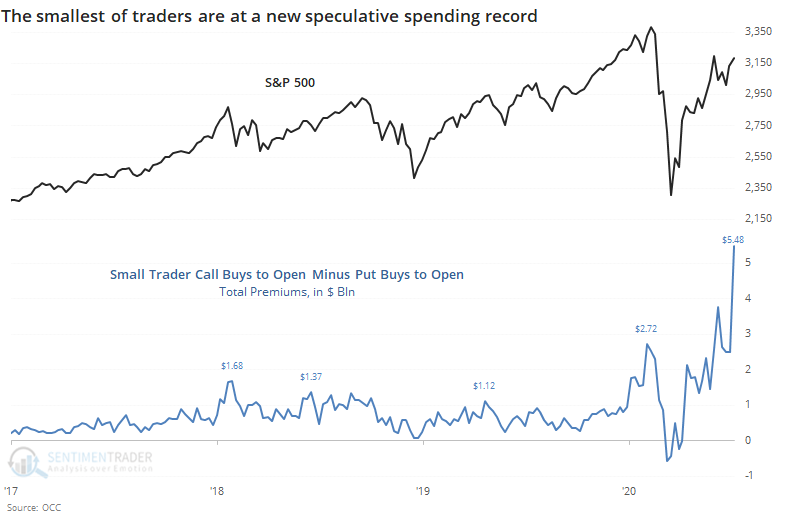
In mid-February, we saw that options traders were speculating heavily, a disturbing wrinkle in the positive momentum that markets were enjoying at the time. The pandemic slapped that speculation out of them. For a while.
They returned in force, and by early June surpassed any previous speculative record. The rocky market (outside of tech stocks) over the past month alleviated some of that, but this past week they returned.
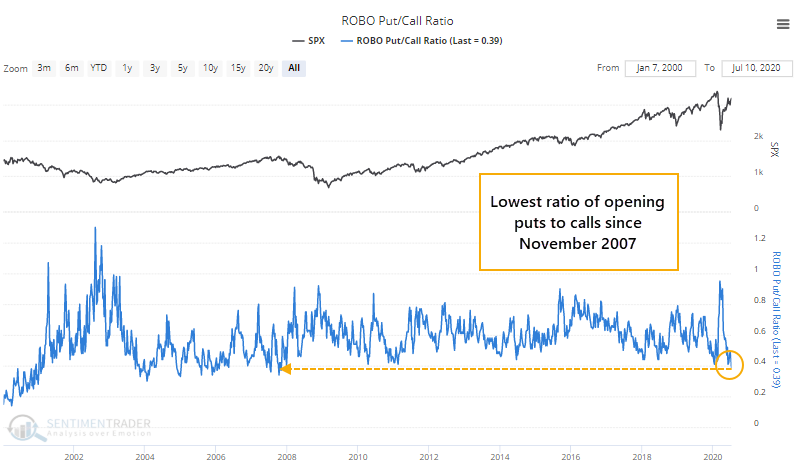
It was enough to push the ROBO Put/Call Ratio to the lowest level since November 2007. This ratio calculates the total number of put options that small traders bought to open versus the number of speculative call options they bought to open. The lower the ratio, the less hedging (and more speculating) that they're doing.
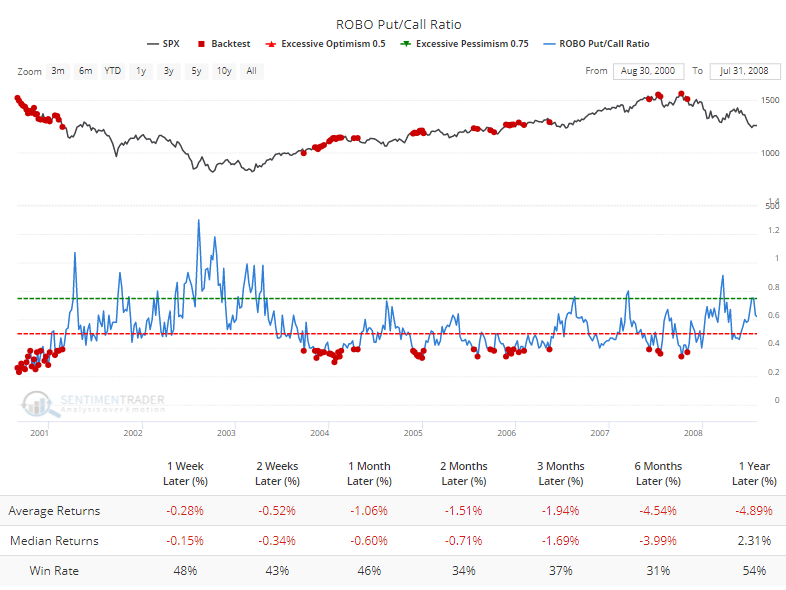
Since 2000, the only weeks when the ratio was lower were in 2000 and several from 2004 - 2007. The Backtest Engine shows that future returns were ugly.
Even more stunning is the absolute dollar amount that small traders are spending on these speculative trades.
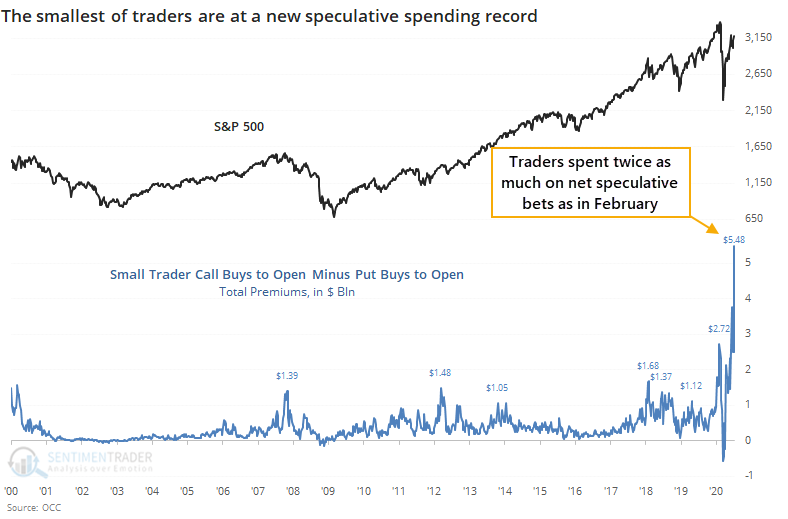
If we look at total premiums spent on opening call transactions minus opening puts, for a net speculative dollar commitment, then we can see that last week's total of $5.5 billion has far surpassed the prior record from early June and is more than twice as much as the peak in February.
Prior to this year, these traders had never spent more than $1.7 billion on net speculative trades.
When we zoom out and look at the past 20 years, then the current frenzy is brought into stark relief.
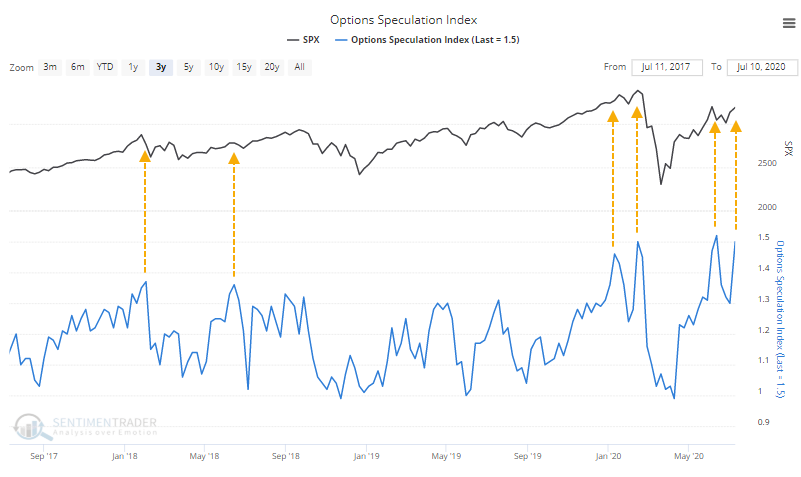
Among all traders, the Options Speculation Index gives us a very good view of the distribution of speculative versus hedging activity on all U.S. exchanges. Once again, it's above 50%, meaning that they opened 50% more bullish contracts than bearish ones.
We put a lot of weight on options data because it ticks all the boxes:
- It reflects real money, not surveys
- There is little to no delay in the data
- We know (pretty much) who is doing (pretty much) what
- They are leveraged, expiring contracts, which increases emotional responses
Given these factors, this new speculative record is once again a primary concern for the short- to medium-term. It doesn't say much about the long-term, only that risk is high in the interim.
BOTTOM LINE
As banks and other financials report Q2 earnings this week, they're trying to recover from still-heavy losses year-to-date. The S&P Financials sector is down more than 22%, one of their worst losses this far into a year. After other large losses this far into a year, when they start to report earnings, they have a tendency to show gains relative to the broader market. It should be a good sign that "smart money" hedgers are shorting Treasury notes, too.
FORECAST / TIMEFRAME
None
|
This week is going to be a big one for banks. If share prices are based primarily on earnings power, and analysts have been left in the dark over the past quarter, then ostensibly these reports will be the most important in at least a decade.
More than a quarter of members in the S&P 500 Financials sector are reporting this week, including the largest ones.
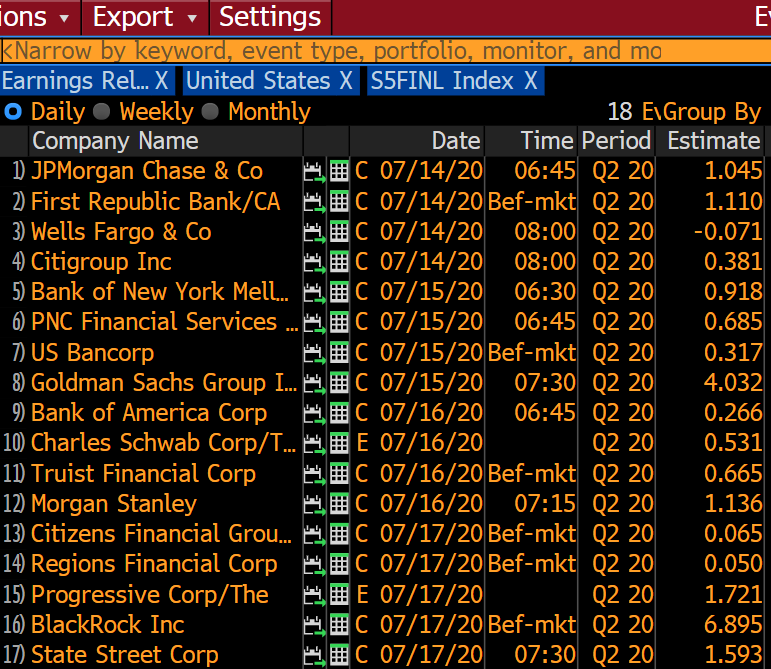
The sector is one of the worst-performing so far this year, down more than 22% year-to-date, which is second only to energy among the laggards.
The table below shows every year since 1950 when financials were down 10% or more through the 9th trading day of July, which is roughly when banks start to report their Q2 earnings results.
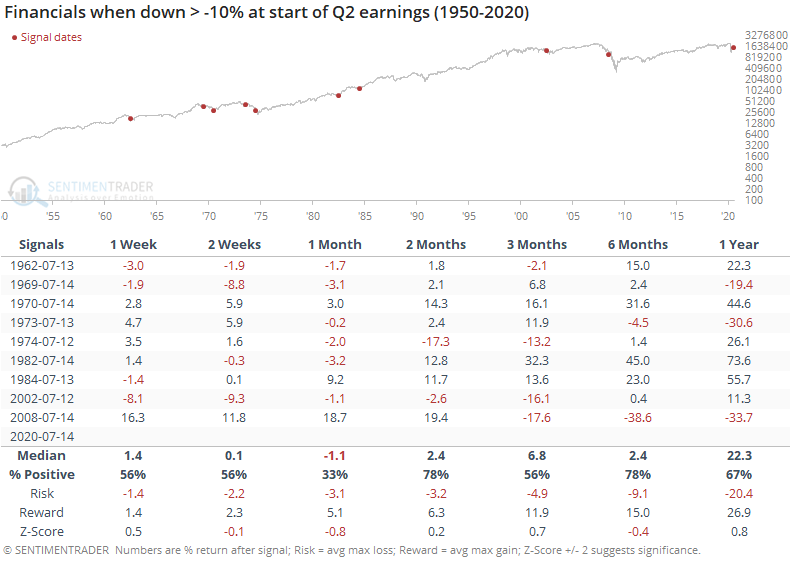
The next month wasn't great, even though they bounced hard in 2008 before failing. The next 2-6 months were more consistently positive, though there were large losses in 1975 and 2008.
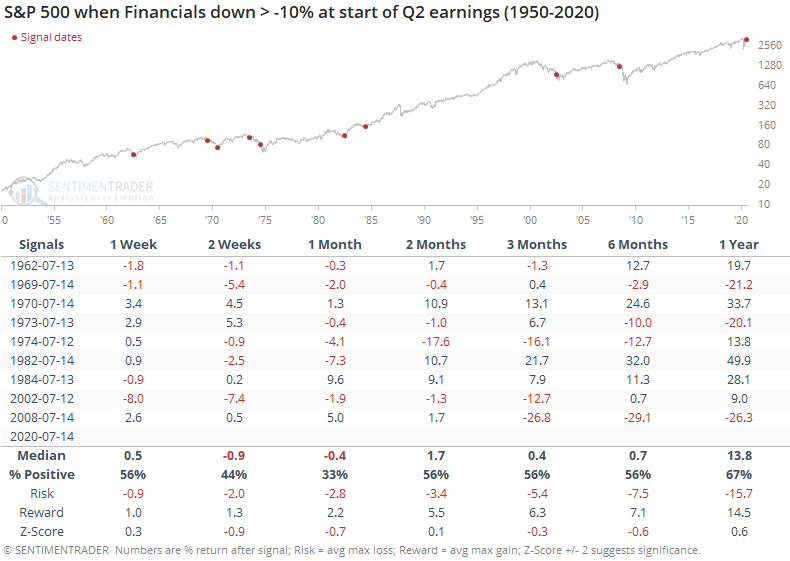
For the broader market, it was more troubling, with the S&P 500 failing to bounce back as often as financials themselves.
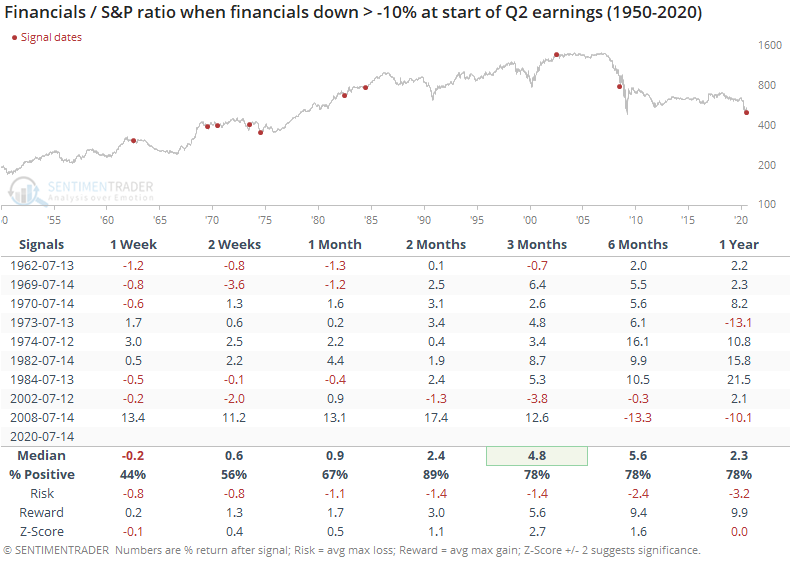
That means the ratio between them tended to rise. Over the medium-term, financials consistently outperformed the broader market, with only one or two small exceptions.
If we look at the opposite scenario, when financials rallied hard into Q2 earnings season, then the sector had less of a tendency to outperform the market going forward.
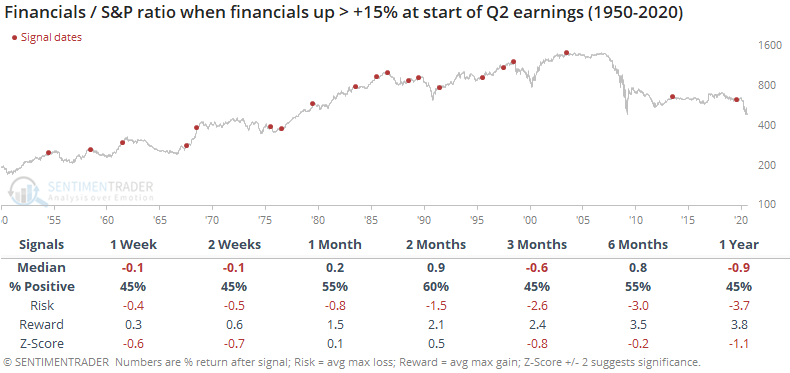
Trend persistence can be a powerful force, and sometimes there are fundamental factors that overwhelm anything and everything else. Maybe this is one of those times. Historically, though, when this particular sector was hit hard through mid-year, this is about when it started to pick up again relative to other sectors.
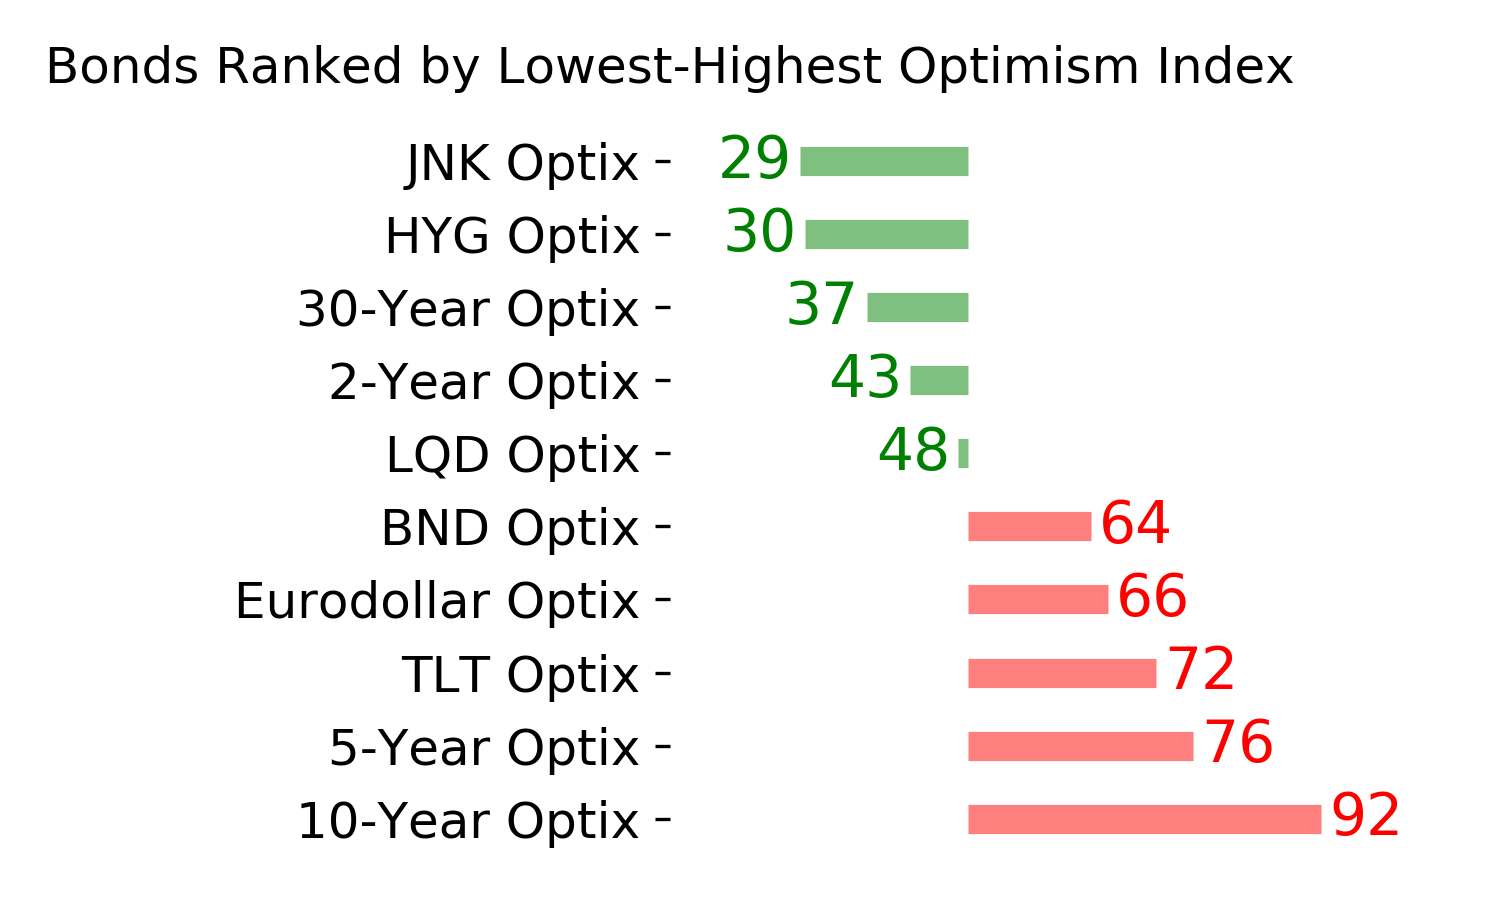
It's interesting to note that "smart money" hedgers have now established a net short position against 10-year Treasury note futures. Over the past decade, this has preceded losses in funds like TLT as interest rates rose.
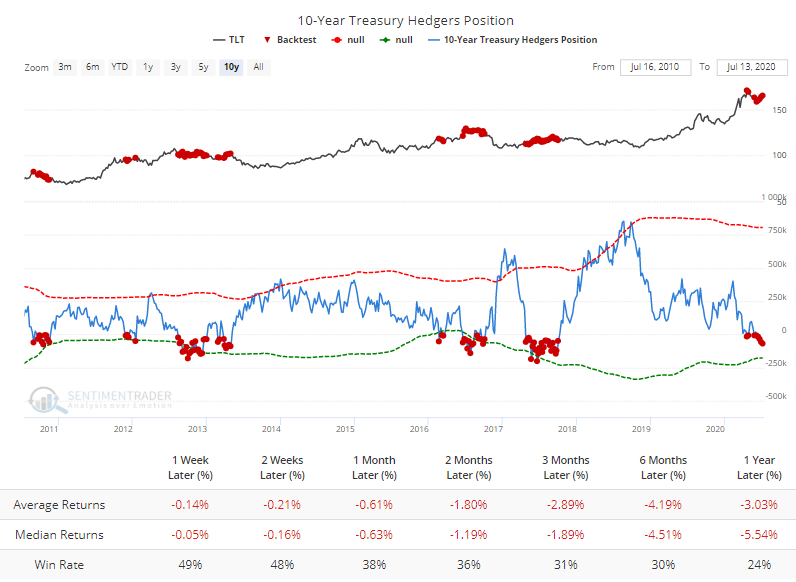
The Backtest Engine shows us that what was bad for bond funds was good for financial funds, like XLF.
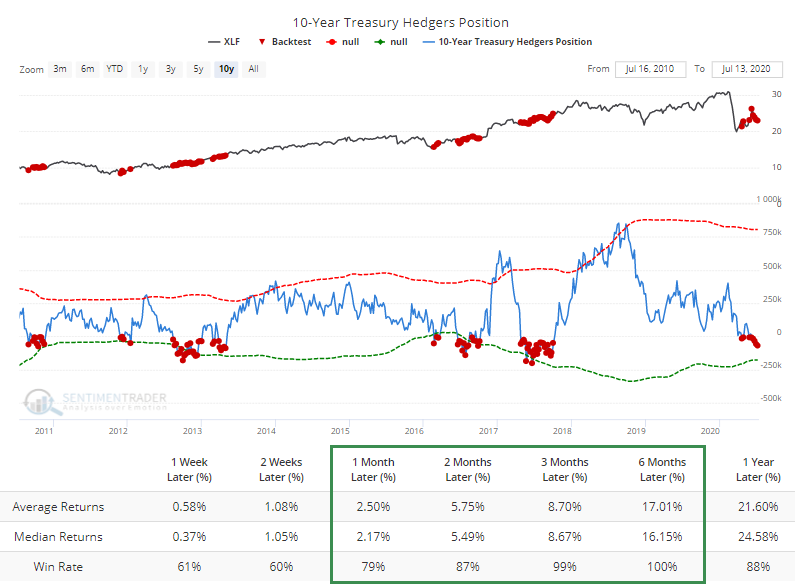
While not a major factor, these bets on rising rates should be good for banks in the months ahead.
Active Studies
| Time Frame | Bullish | Bearish | | Short-Term | 0 | 0 | | Medium-Term | 8 | 7 | | Long-Term | 44 | 1 |
|
Indicators at Extremes
Portfolio
| Position | Weight % | Added / Reduced | Date | | Stocks | 29.8 | Reduced 9.1% | 2020-06-11 | | Bonds | 0.0 | Reduced 6.7% | 2020-02-28 | | Commodities | 5.2 | Added 2.4%
| 2020-02-28 | | Precious Metals | 0.0 | Reduced 3.6% | 2020-02-28 | | Special Situations | 0.0 | Reduced 31.9% | 2020-03-17 | | Cash | 65.0 | | |
|
Updates (Changes made today are underlined)
In the first months of the year, we saw manic trading activity. From big jumps in specific stocks to historic highs in retail trading activity to record highs in household confidence to almost unbelievable confidence among options traders. All of that came amid a market where the average stock couldn't keep up with their indexes. There were signs of waning momentum in stocks underlying the major averages, which started triggering technical warning signs in late January. After stocks bottomed on the 23rd, they enjoyed a historic buying thrust and retraced a larger amount of the decline than "just a bear market rally" tends to. Those thrusts are the most encouraging sign we've seen in years. Through early June, we were still seeing thrusts that have led to recoveries in longer-term breadth metrics. The longer-term prospects for stocks (6-12 months) still look decent given the above. On a short- to medium-term basis, it was getting harder to make that case. Dumb Money Confidence spiked and there were multiple signs of a historic level of speculation. This is likely the lowest I will go given what I still consider to be compelling positives over a longer time frame. There is not a slam-dunk case to be made for either direction, so it will seem like a mistake whether stocks keep dropping (why didn't I sell more?) or if they turn and head higher (why did I let short-term concerns prevail?). After nearly three decades of trading, I've learned to let go of the idea of perfection.
RETURN YTD: -5.1% 2019: 12.6%, 2018: 0.6%, 2017: 3.8%, 2016: 17.1%, 2015: 9.2%, 2014: 14.5%, 2013: 2.2%, 2012: 10.8%, 2011: 16.5%, 2010: 15.3%, 2009: 23.9%, 2008: 16.2%, 2007: 7.8%
|
|
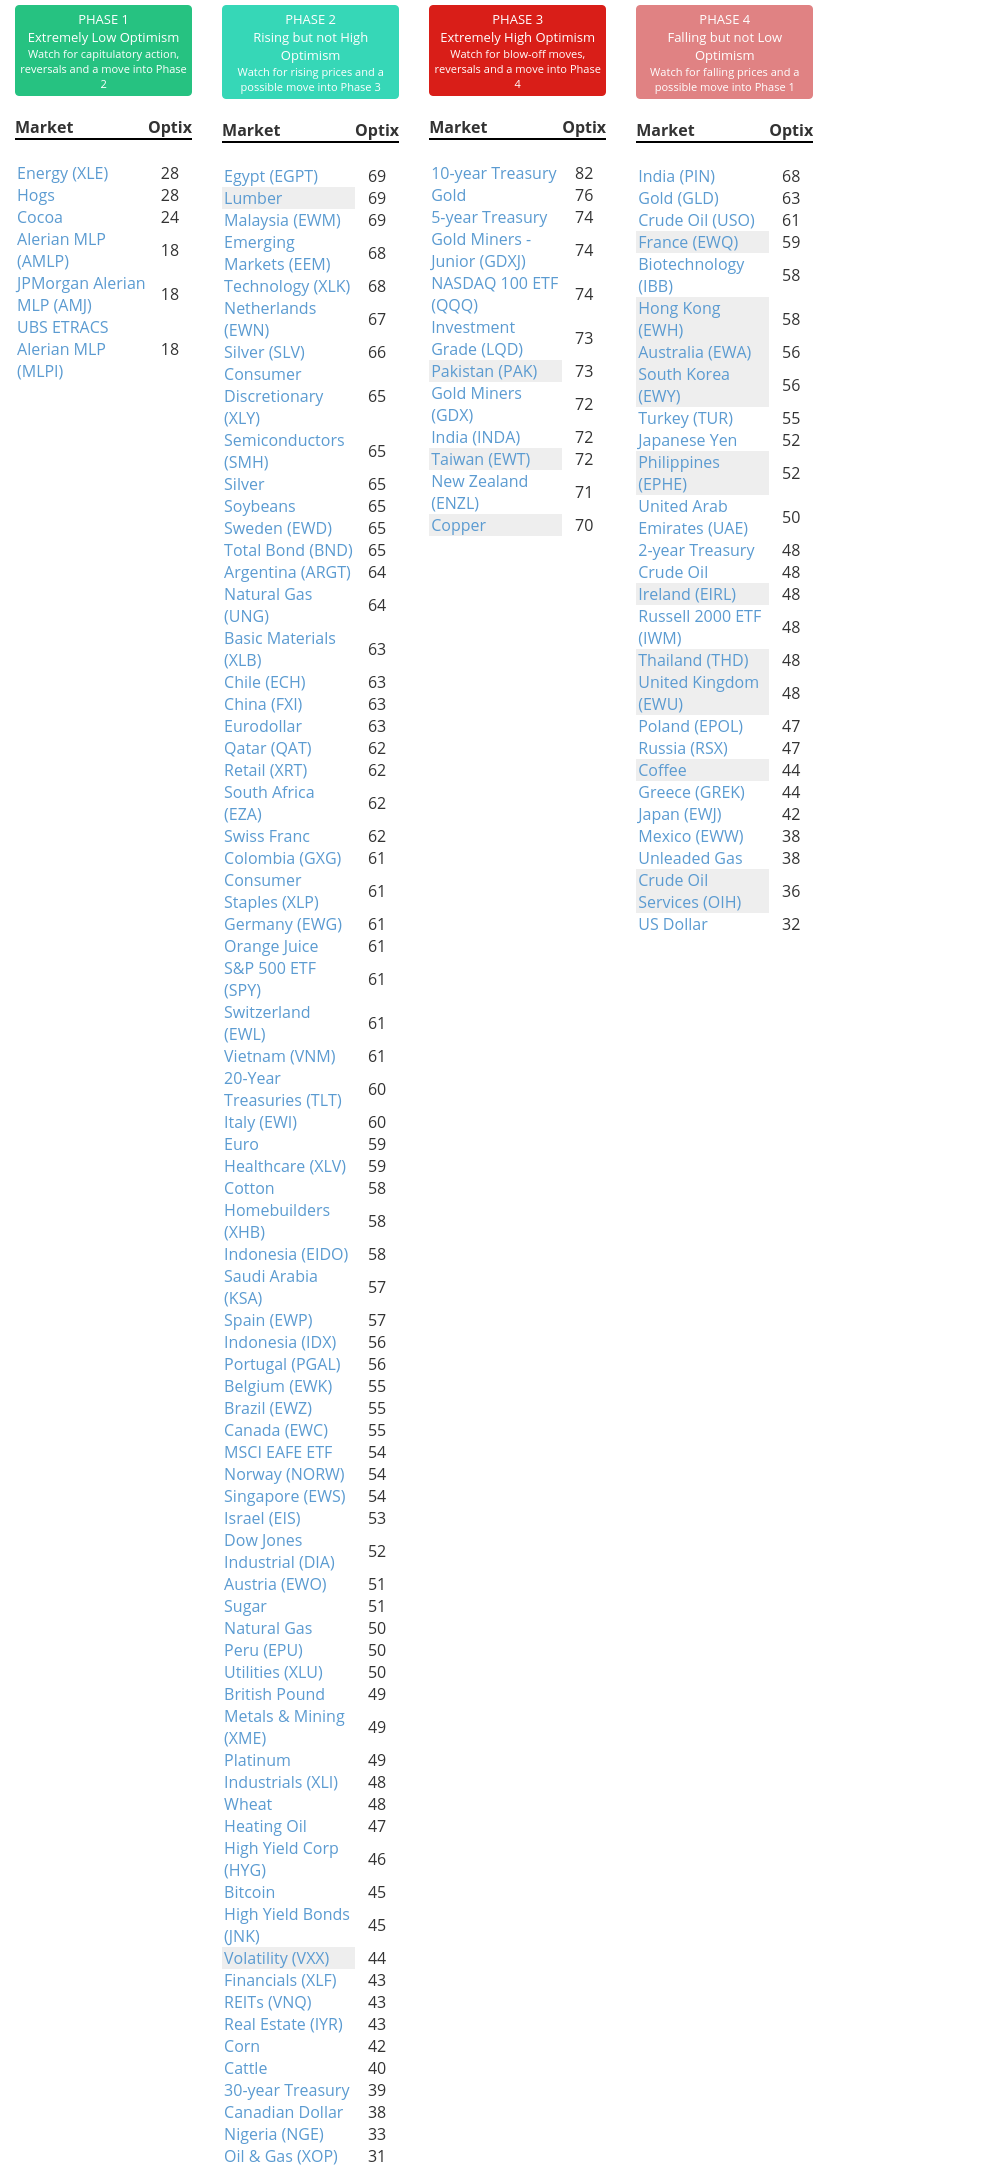
Phase Table
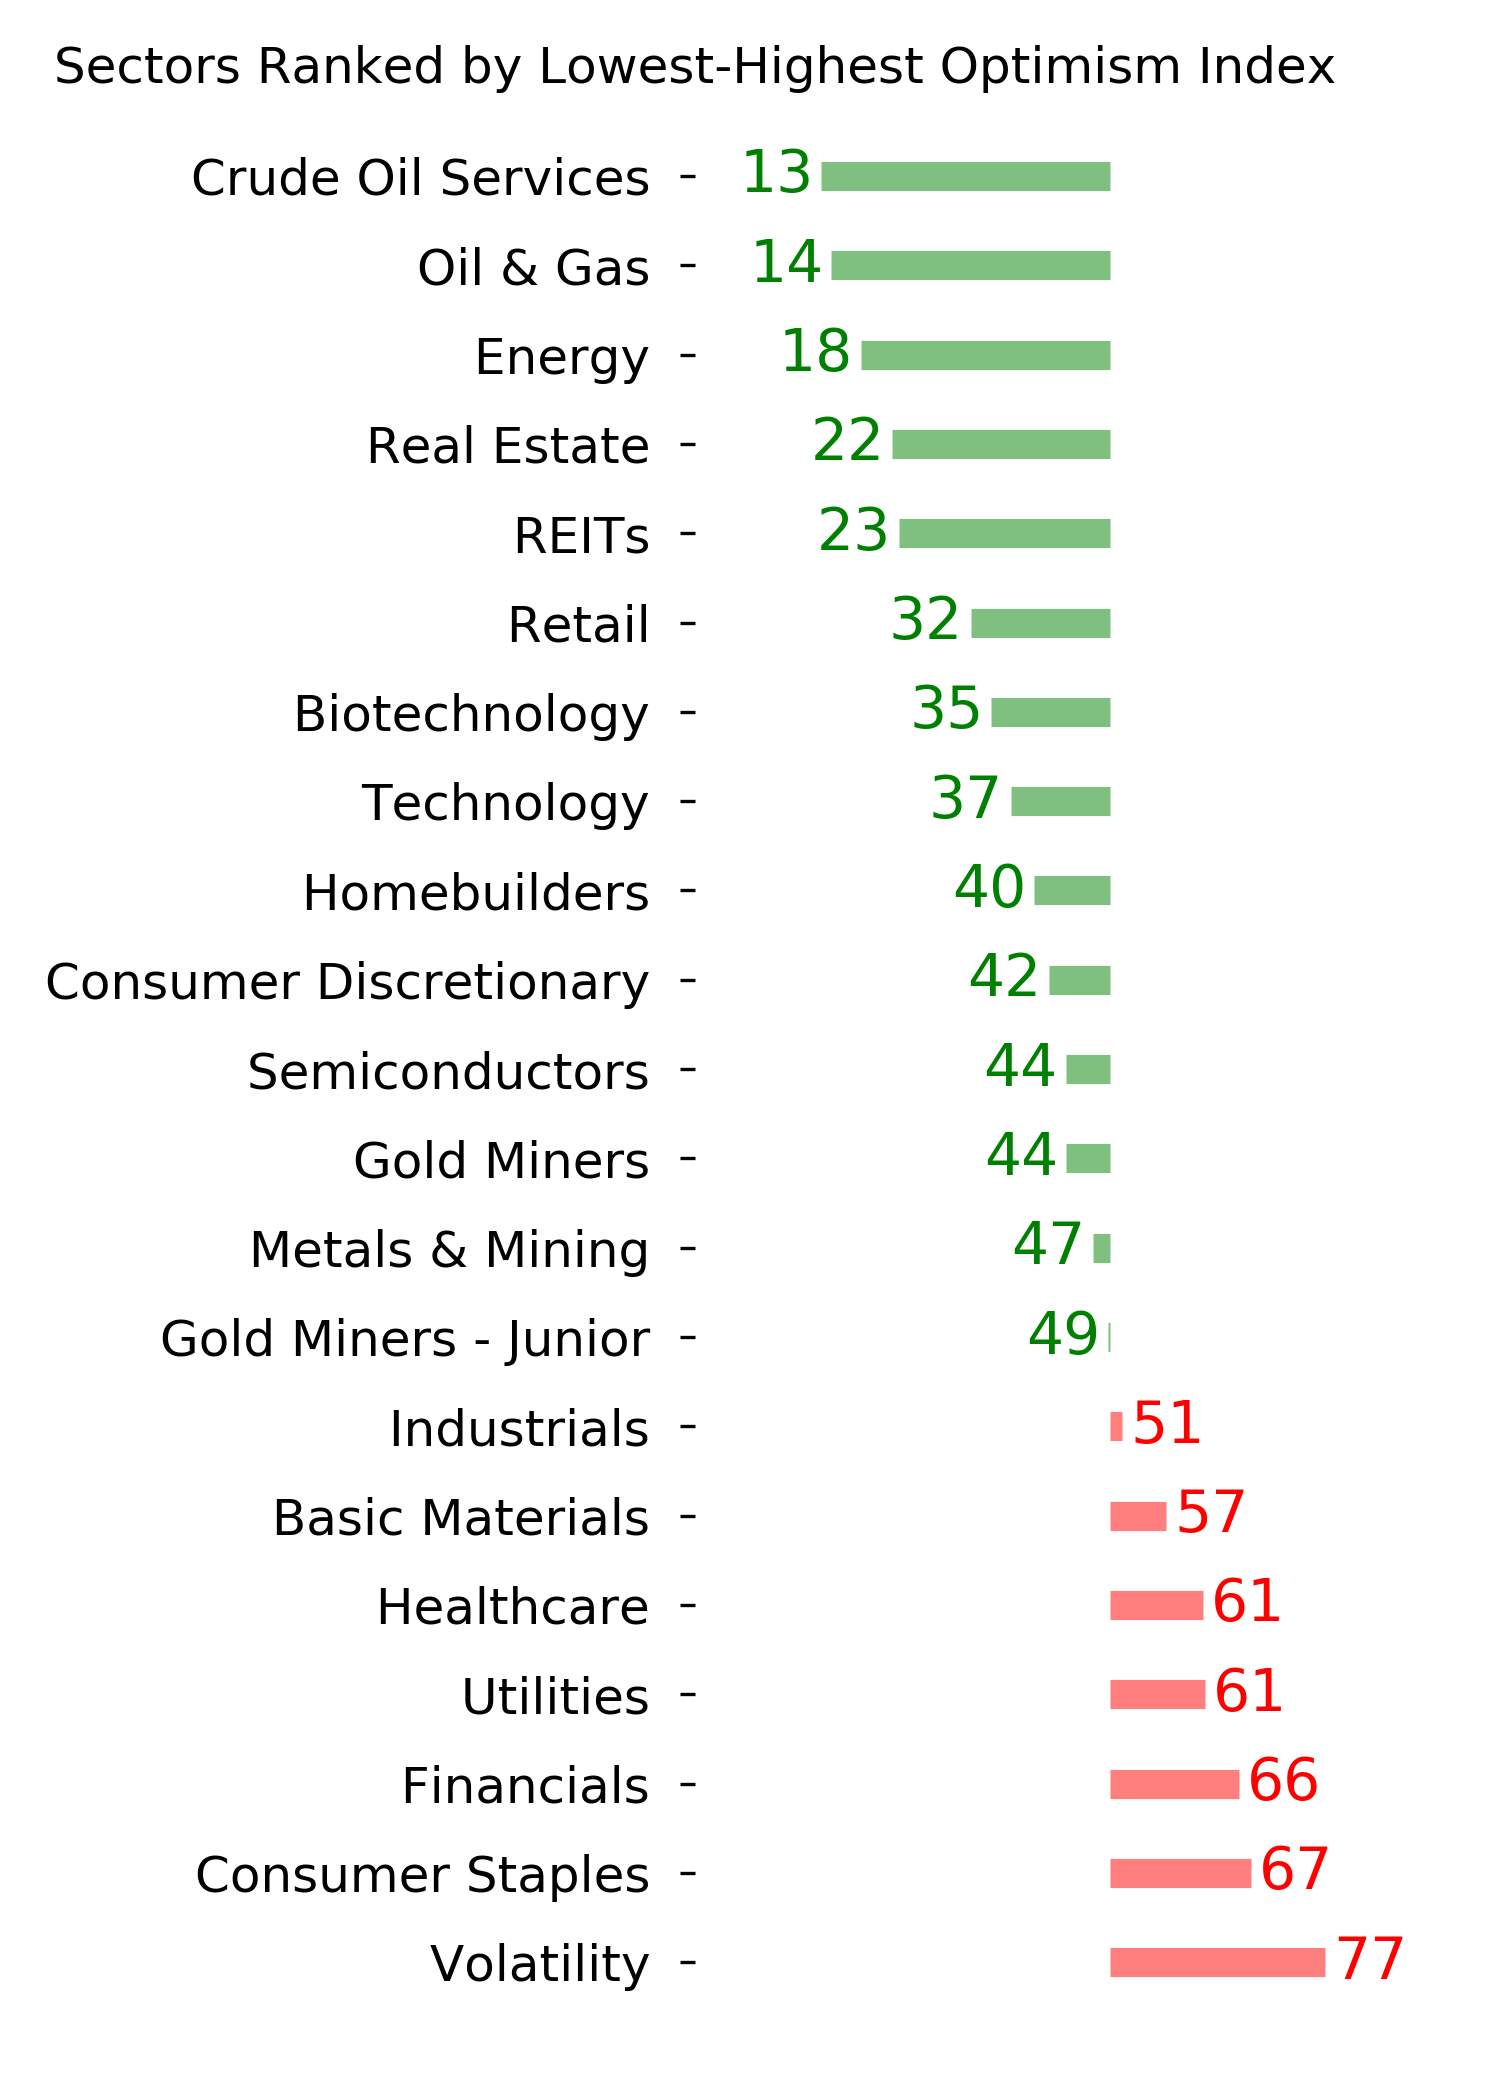
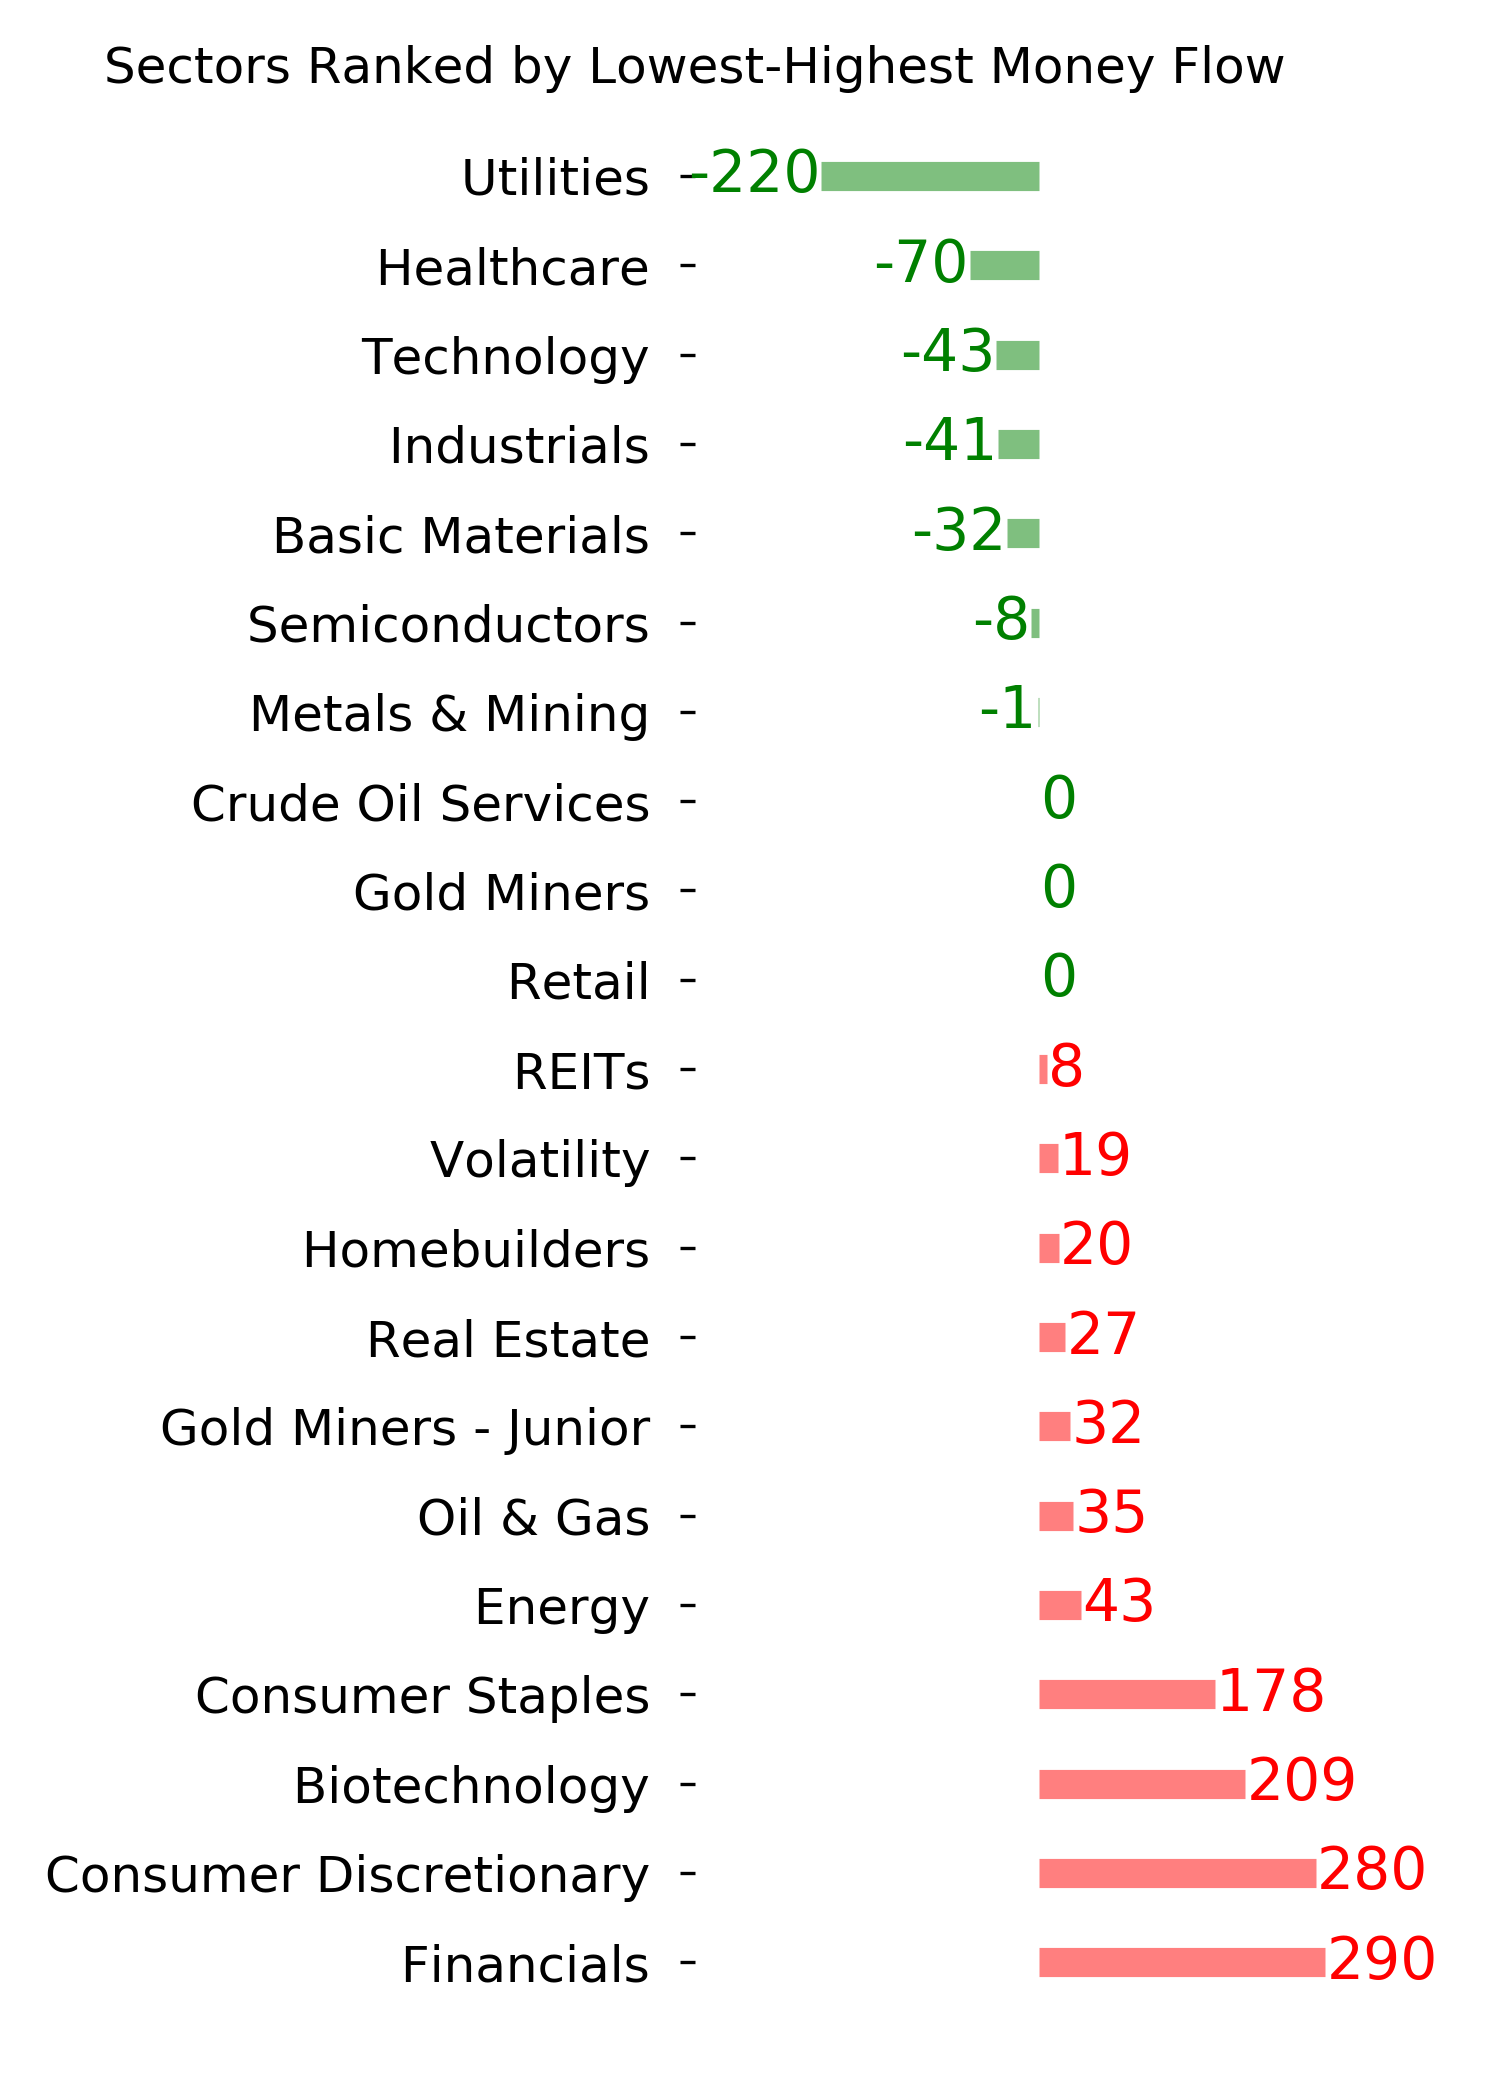
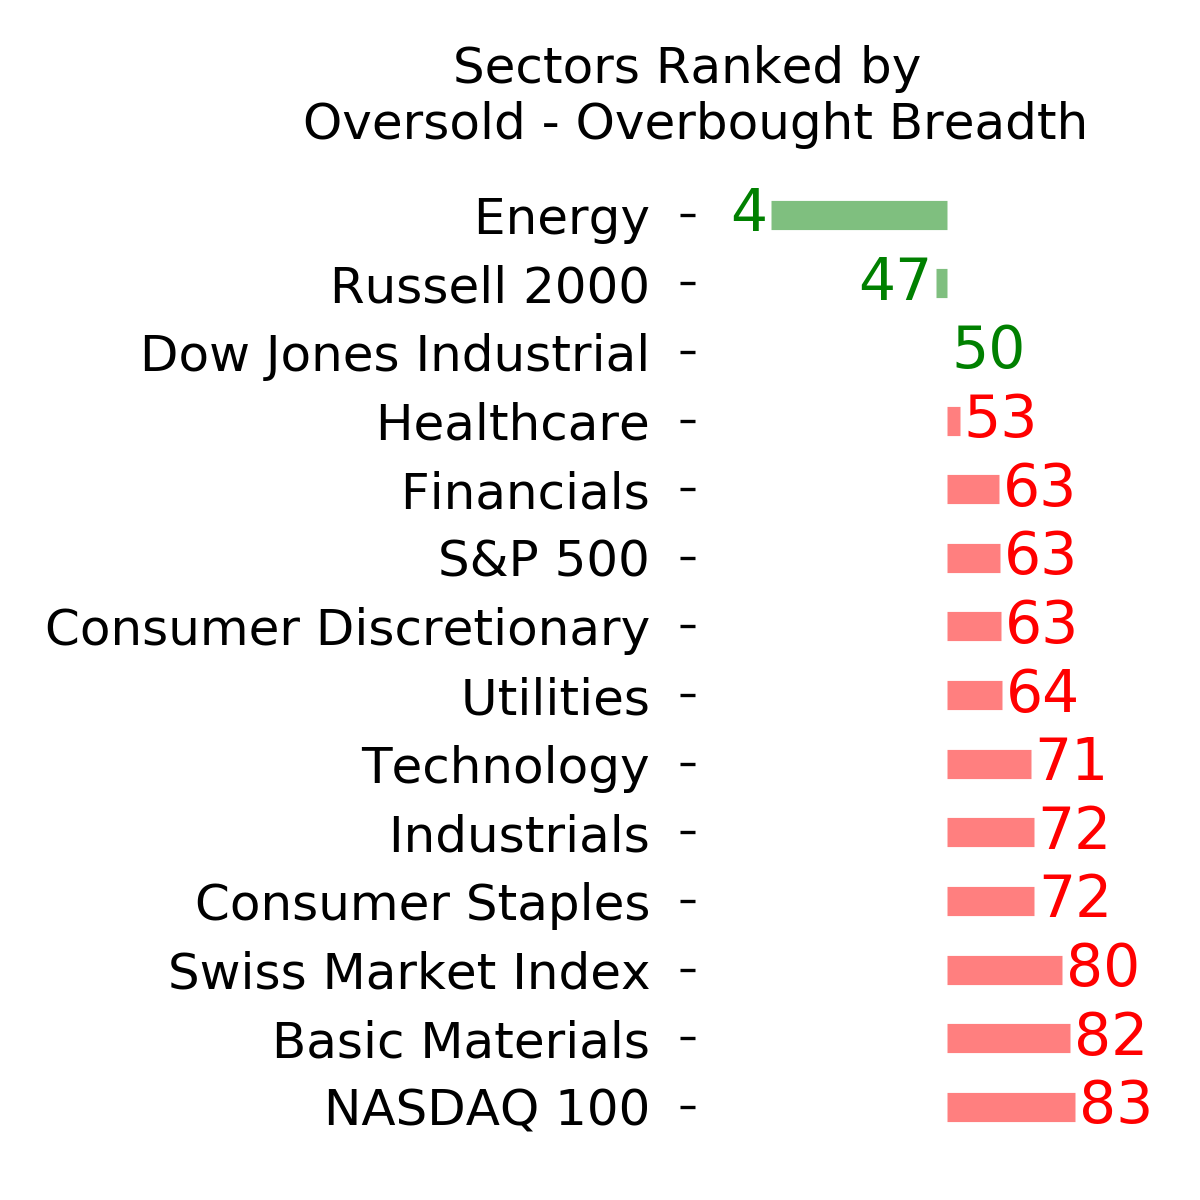
Ranks
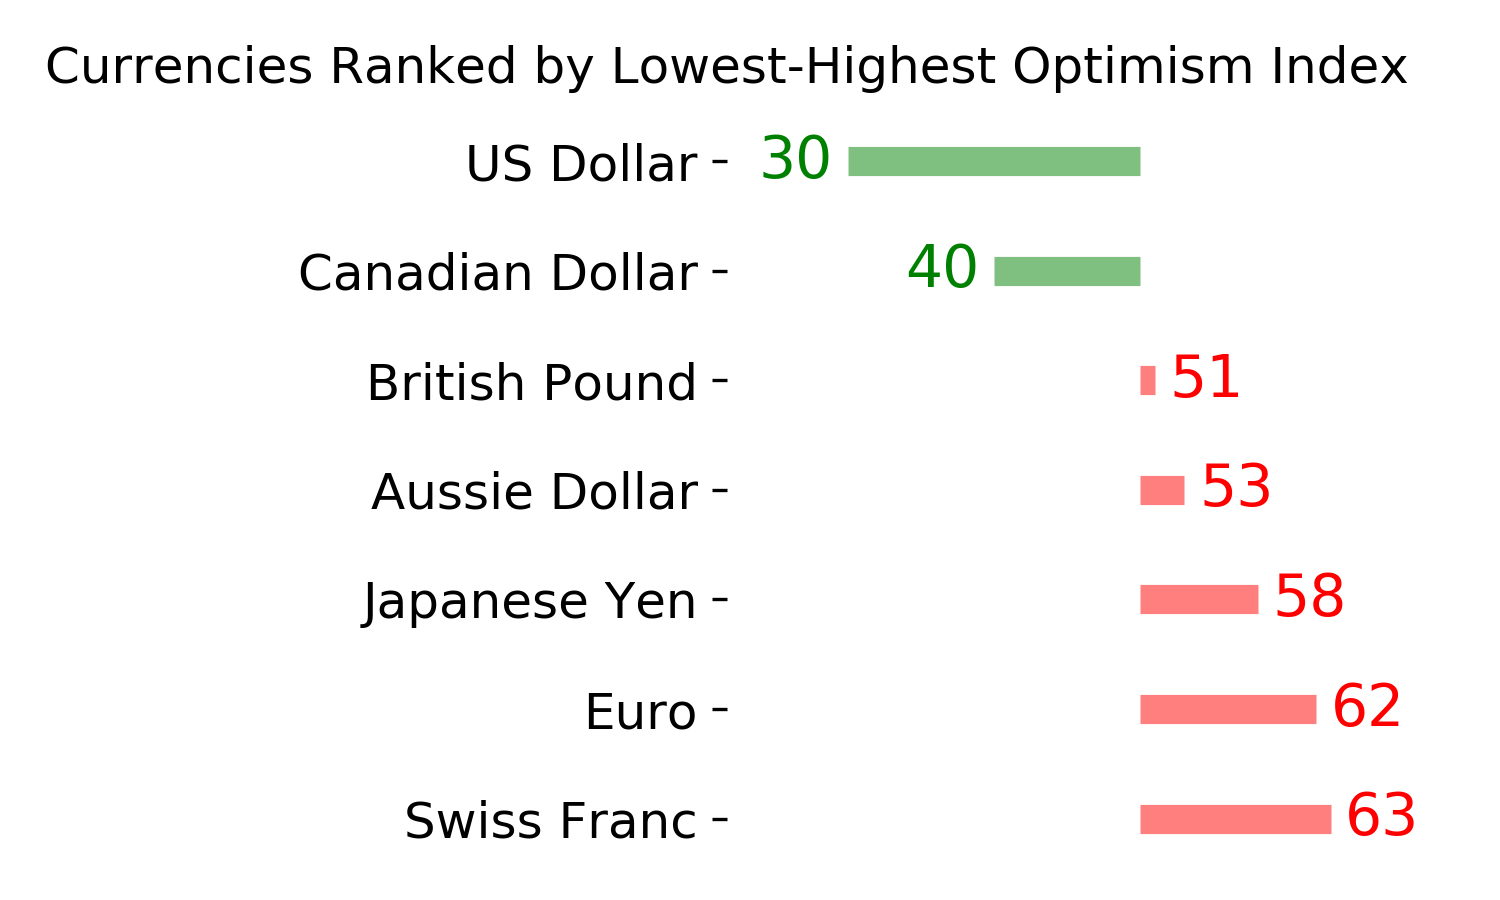
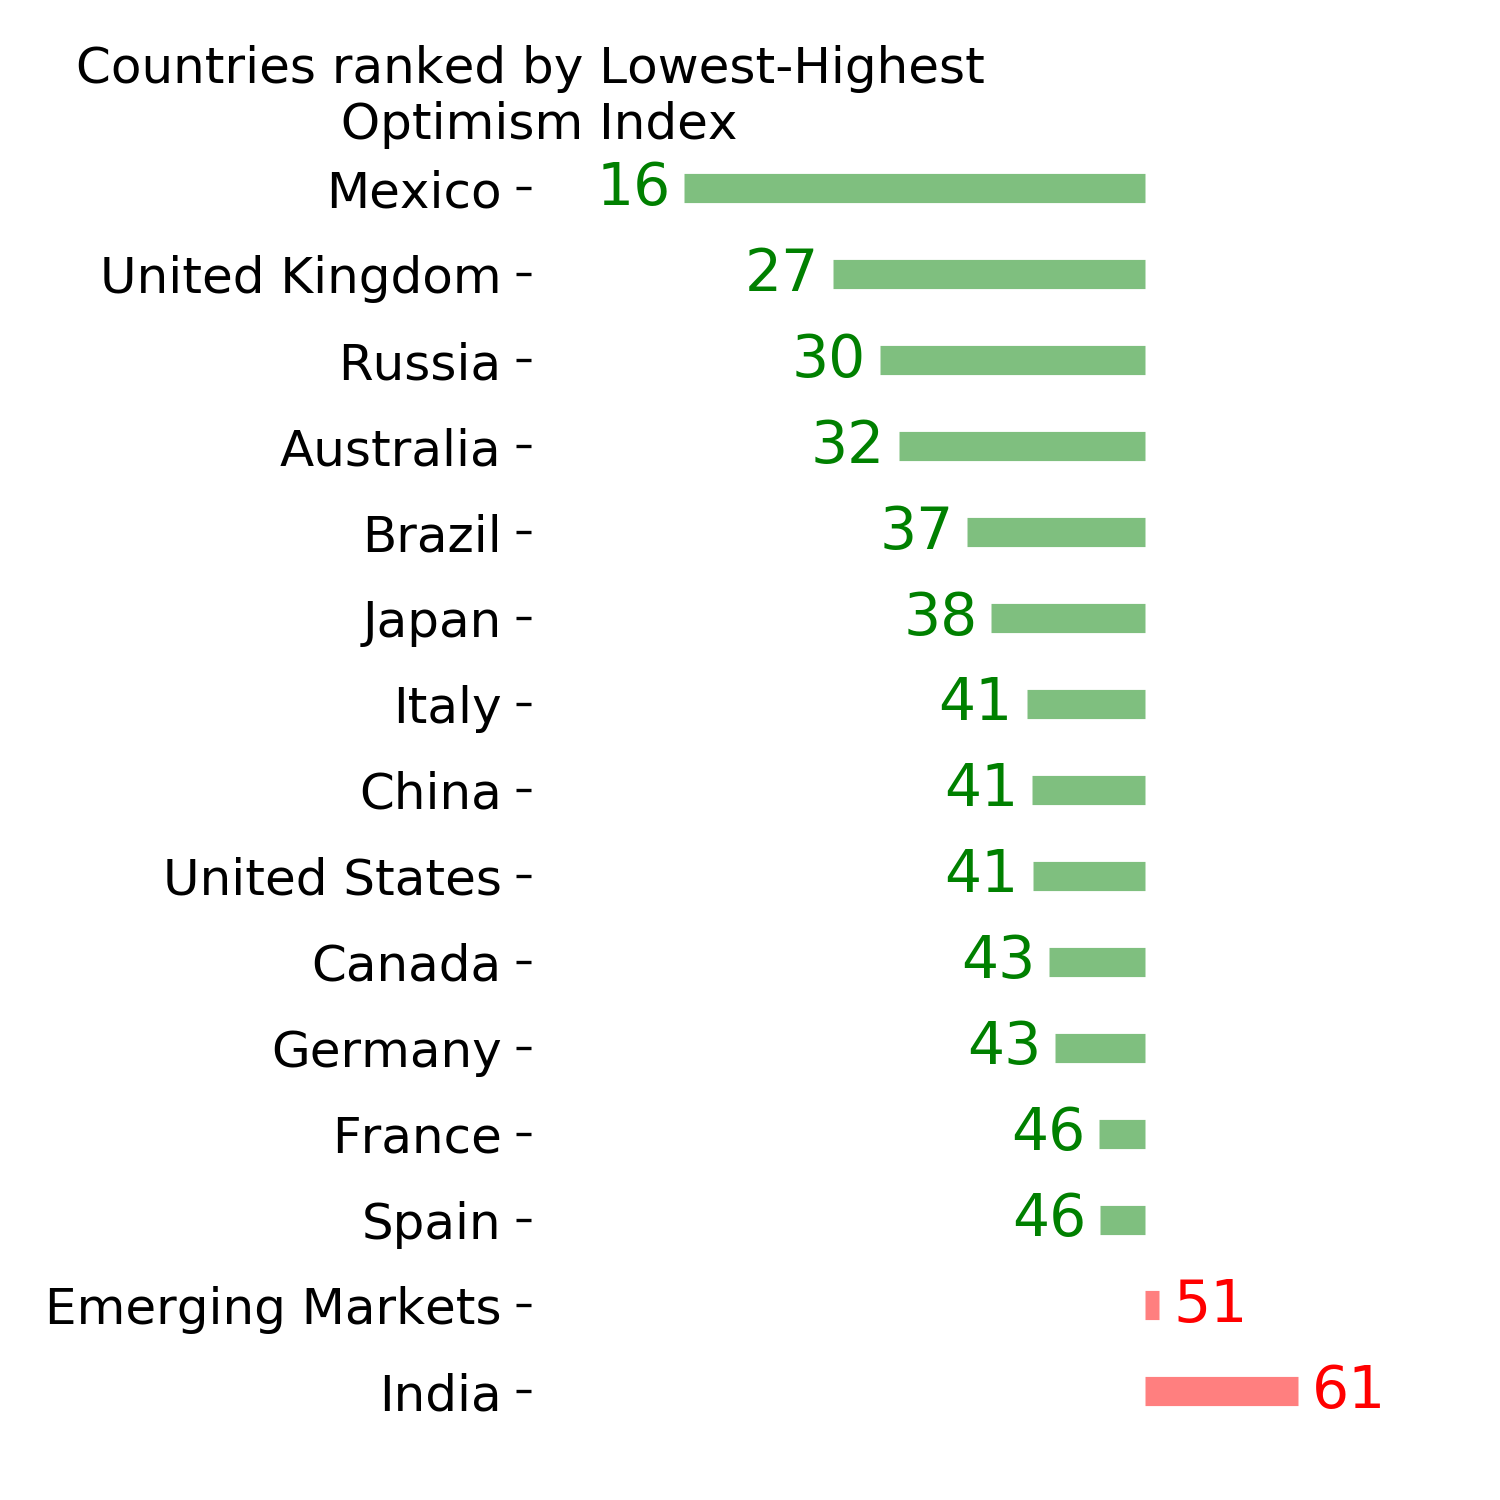
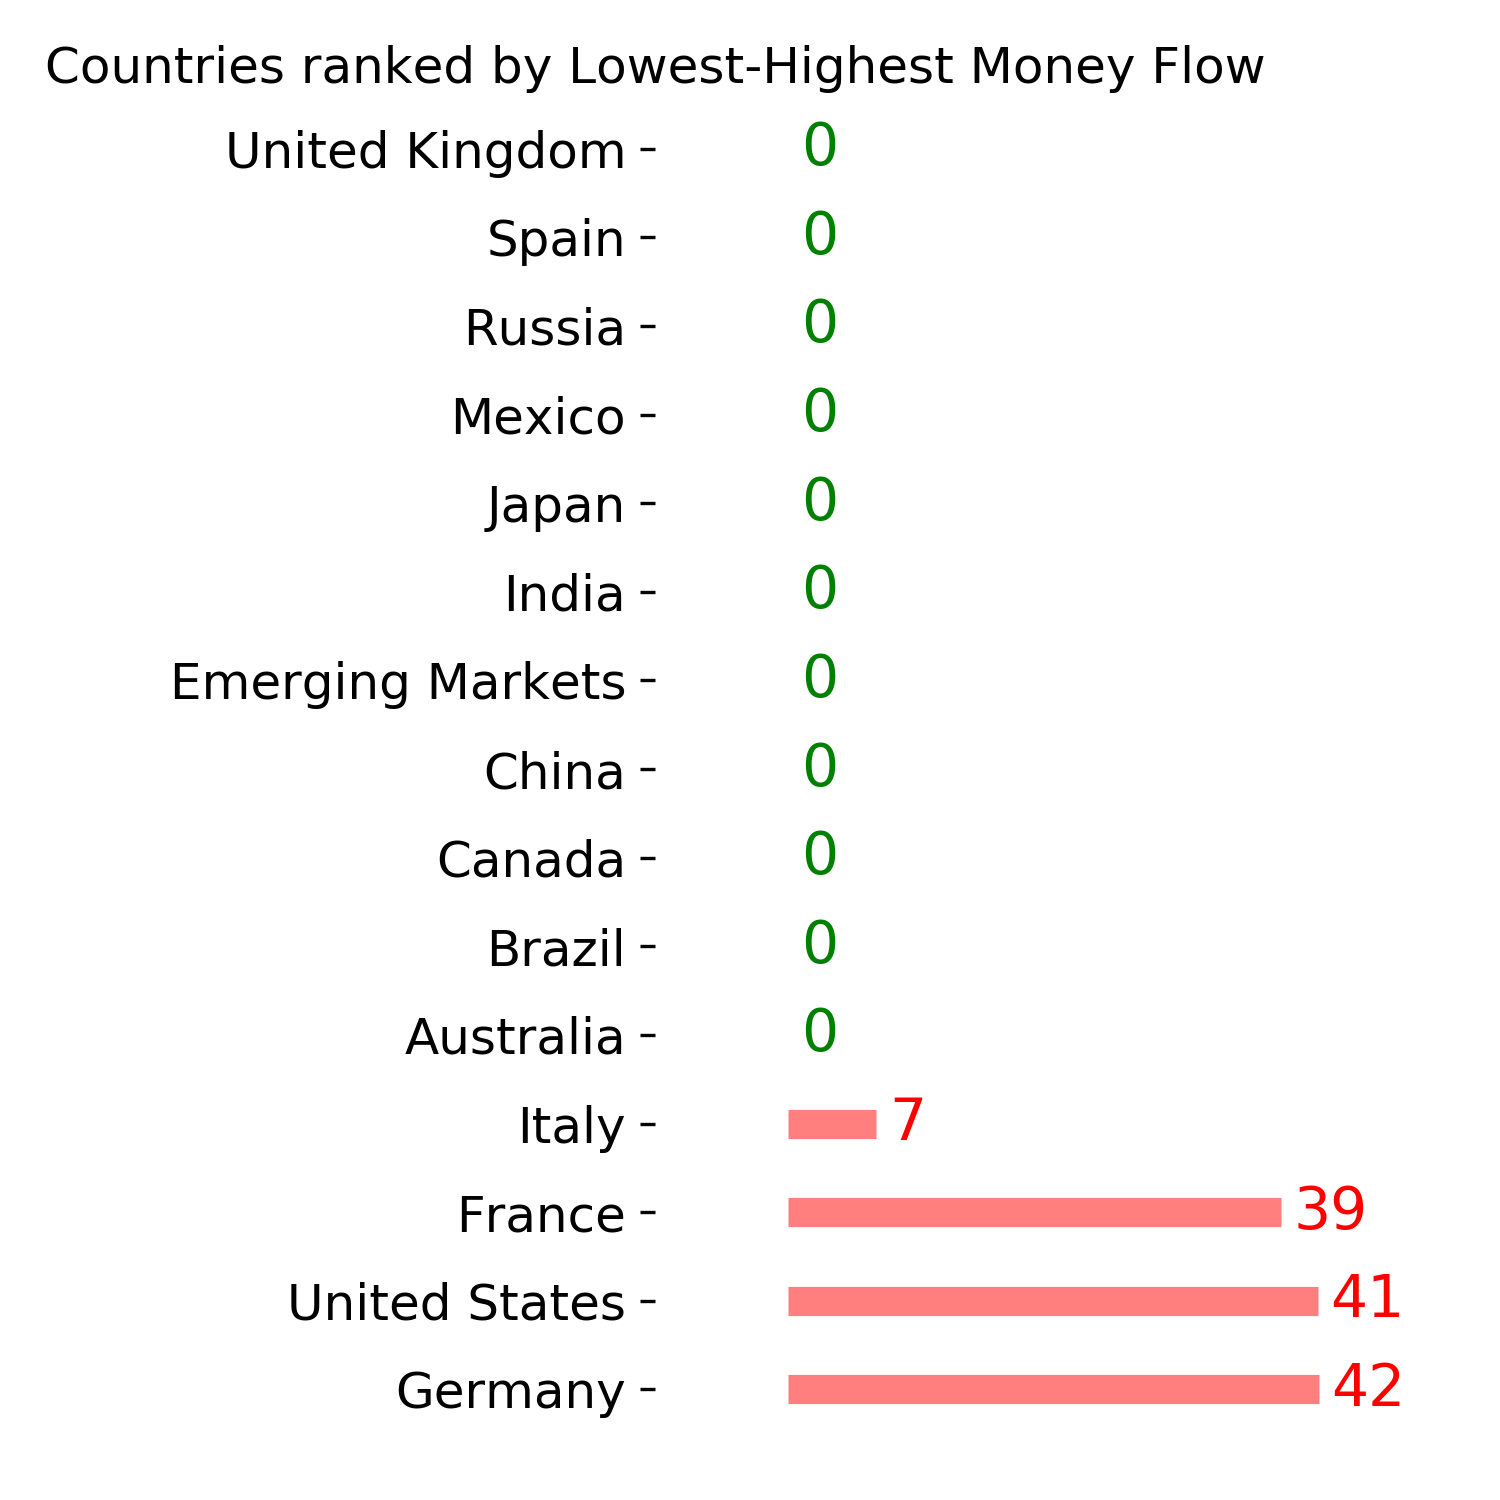
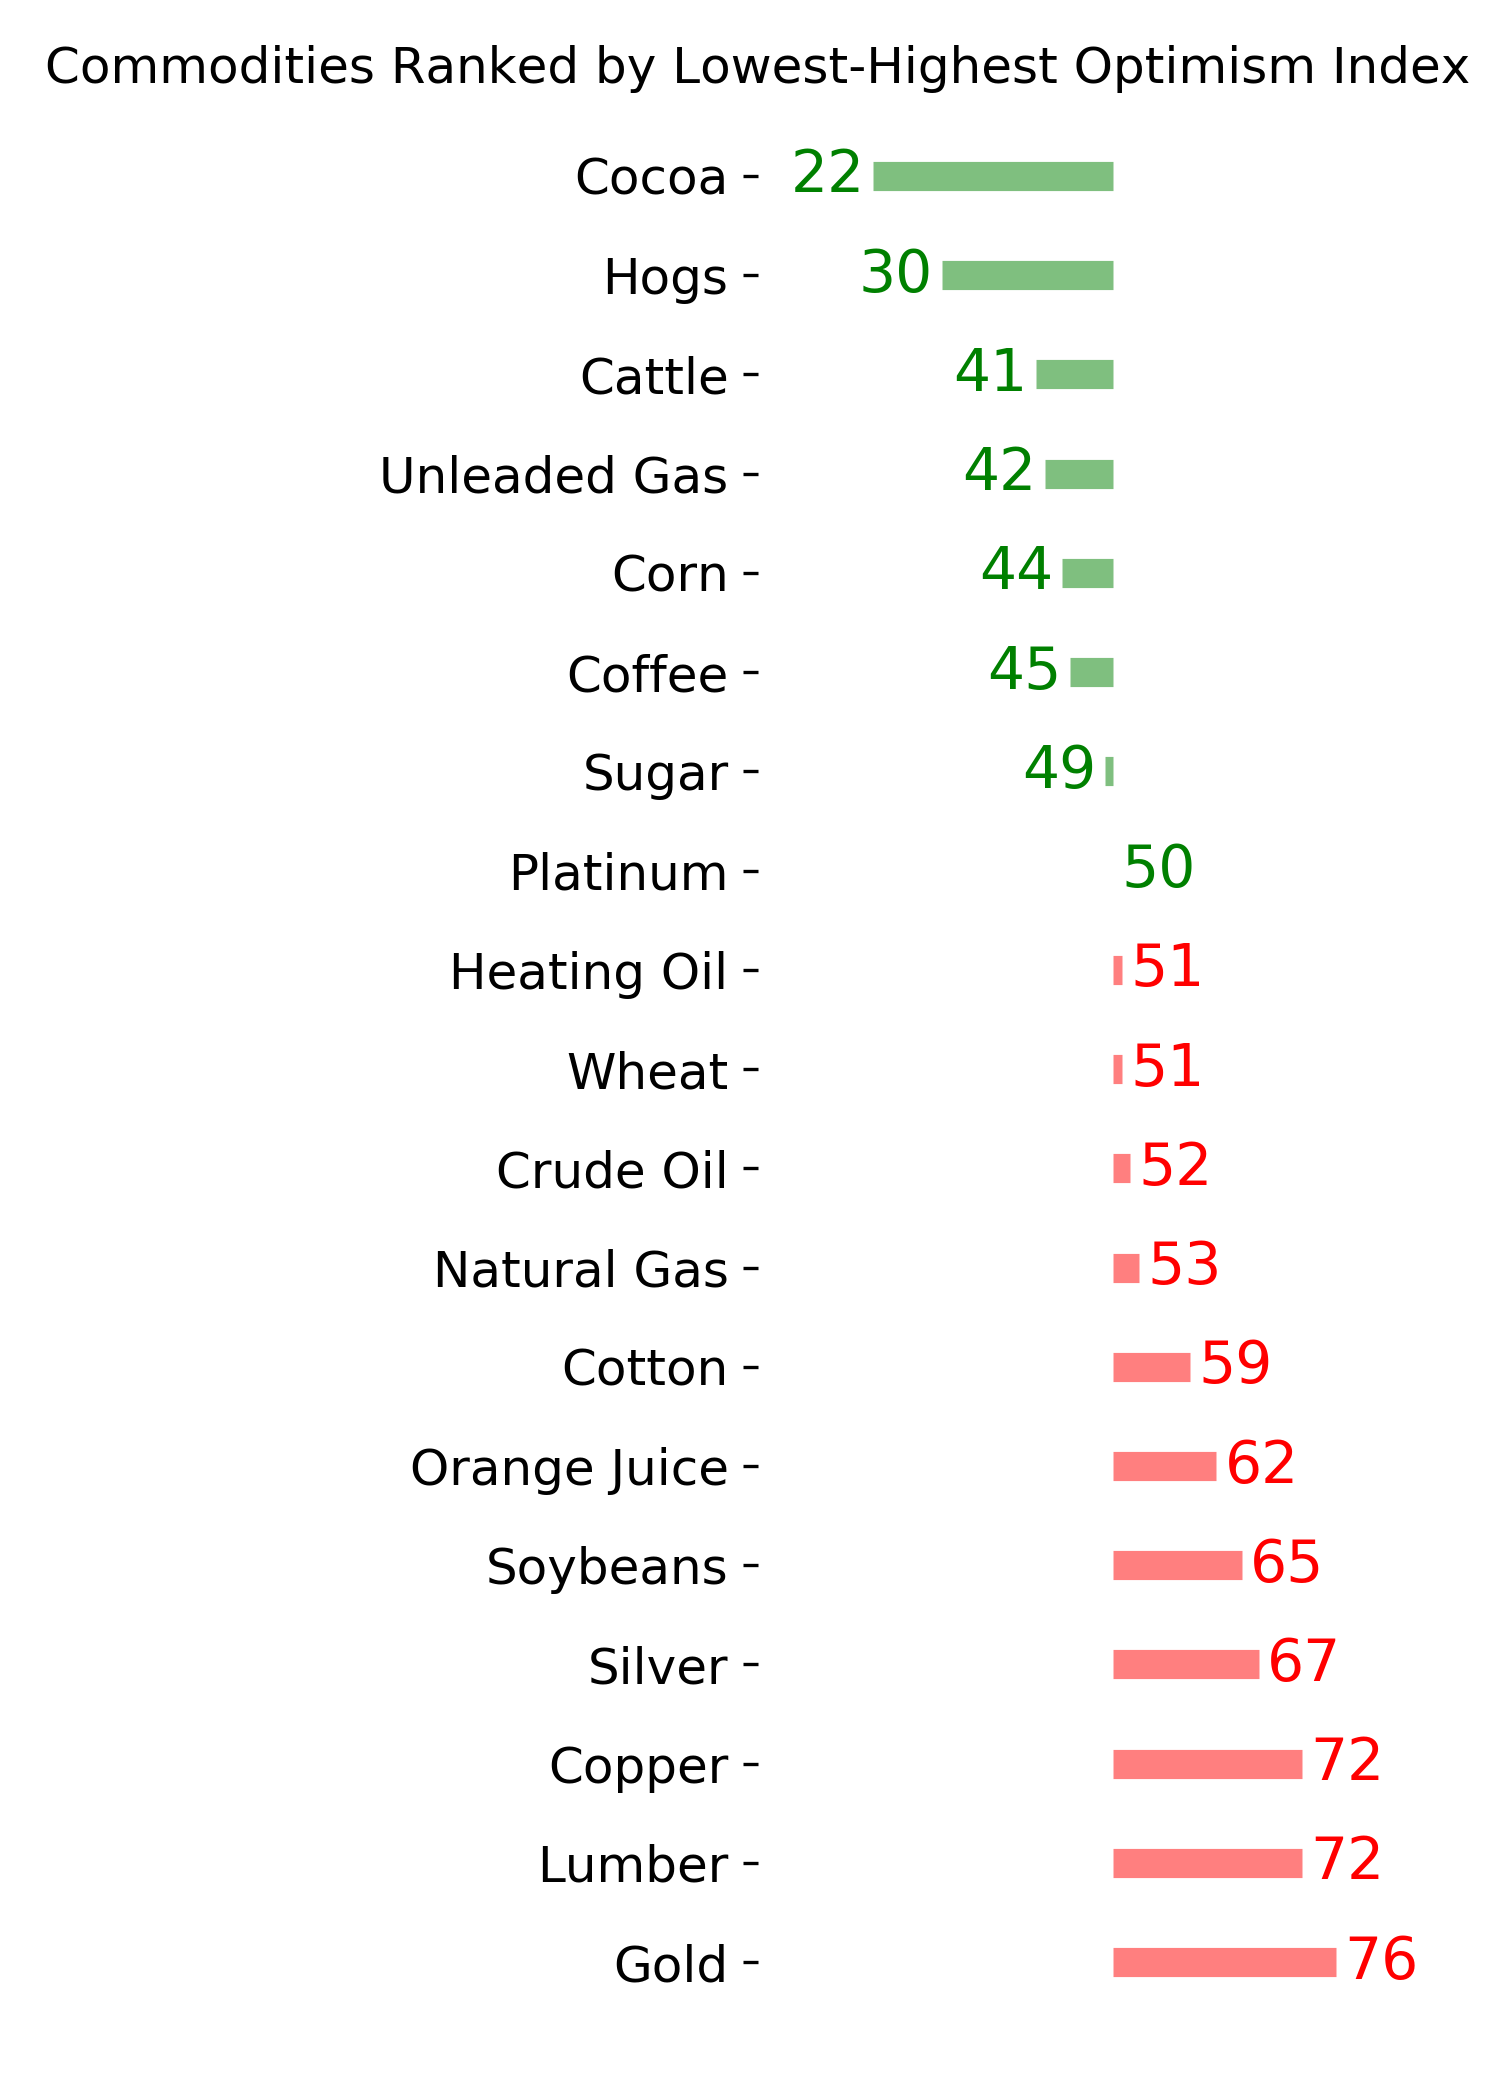
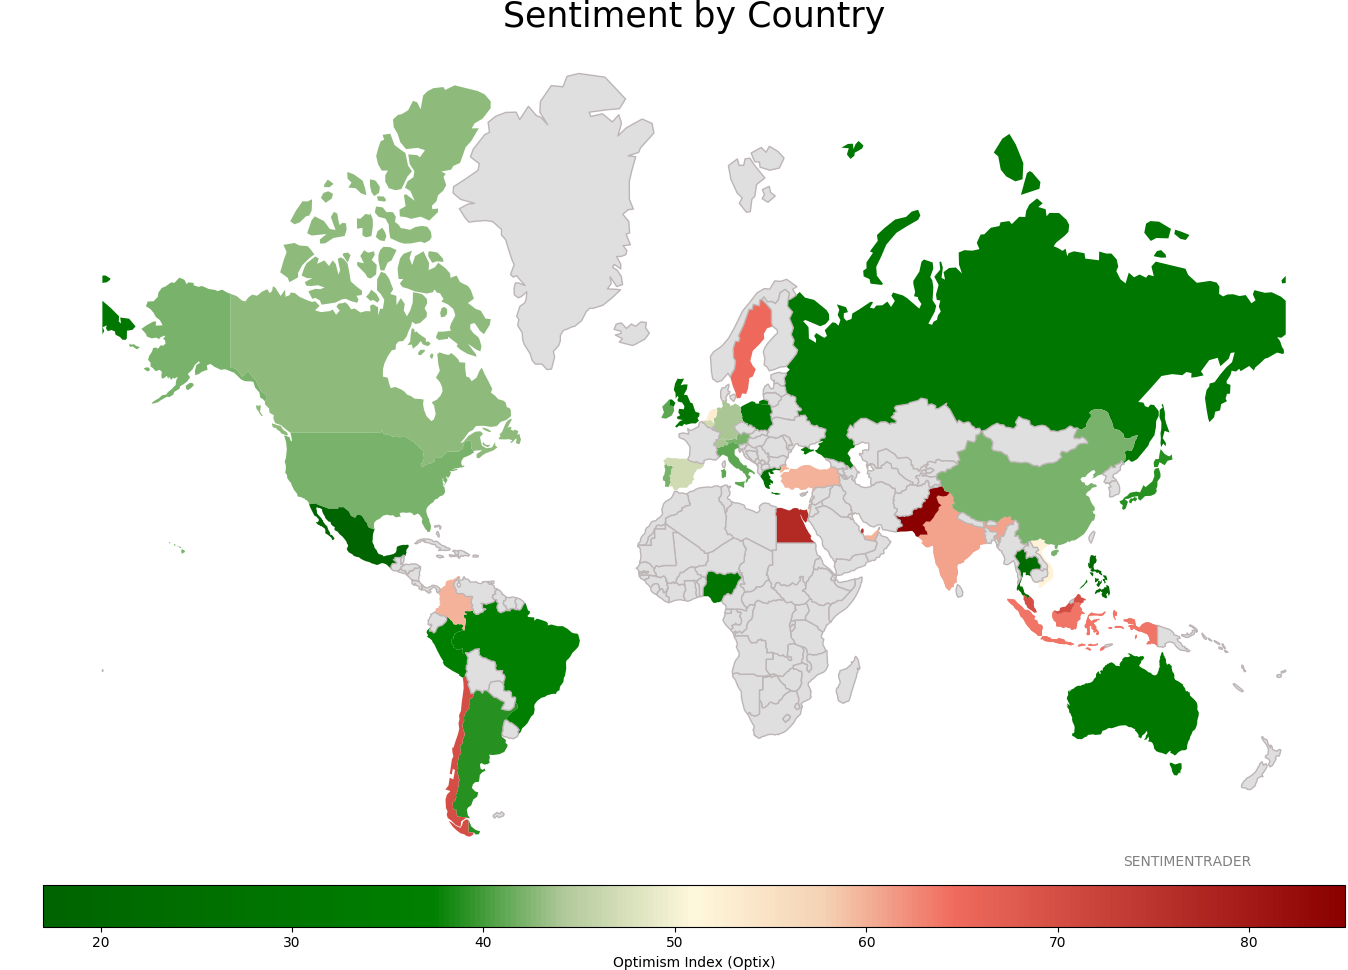
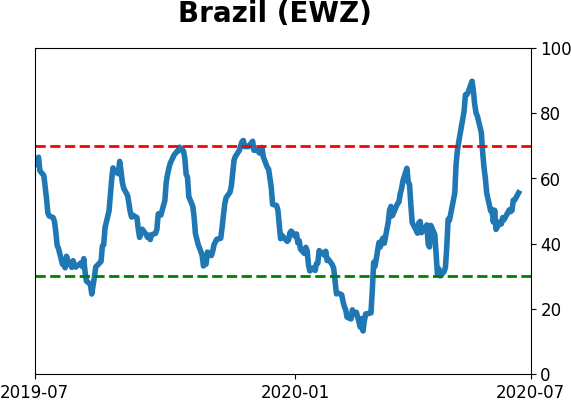
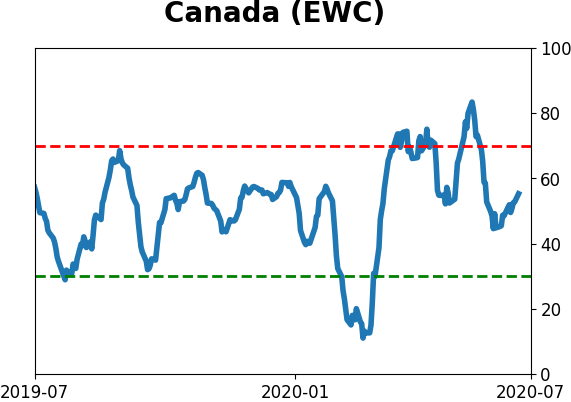
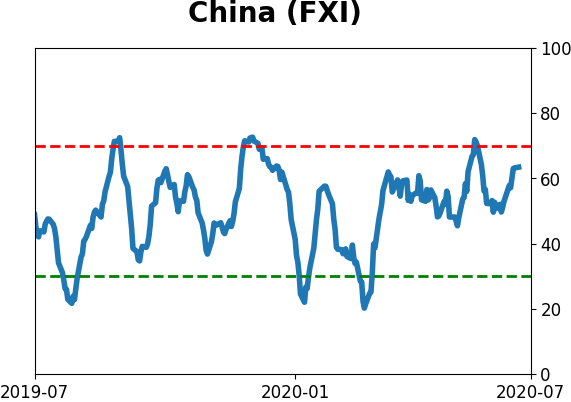
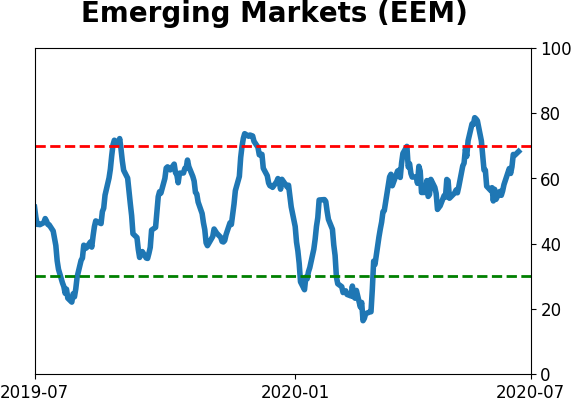
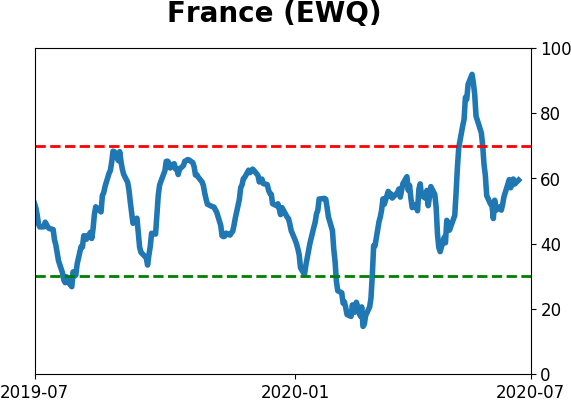
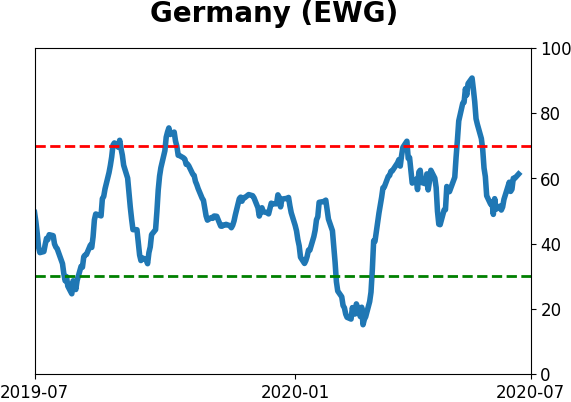
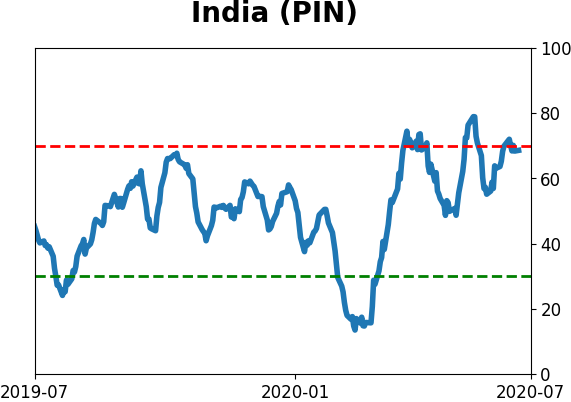
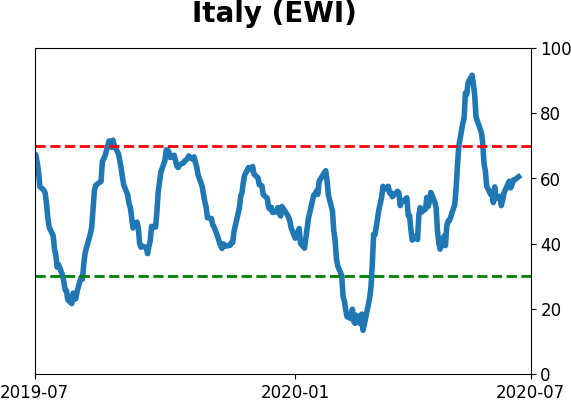
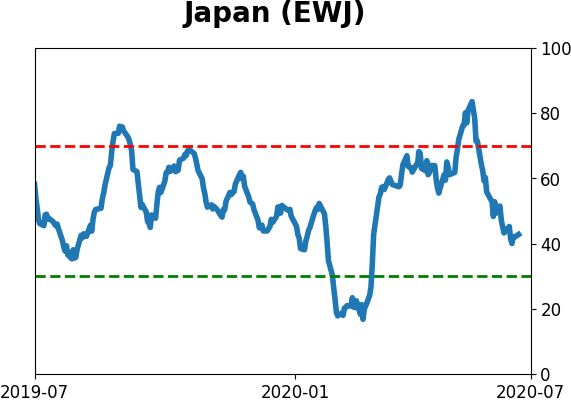
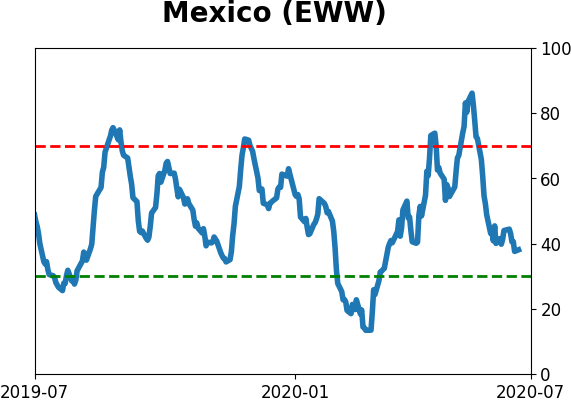
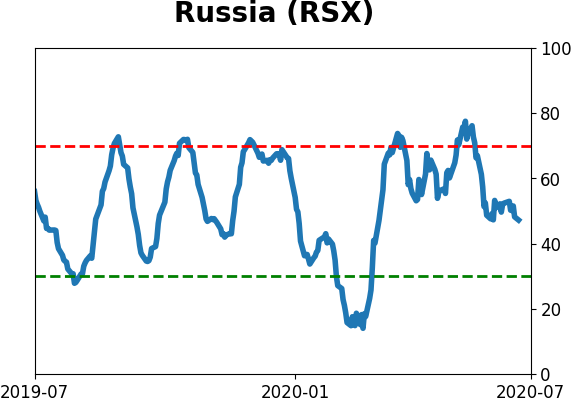
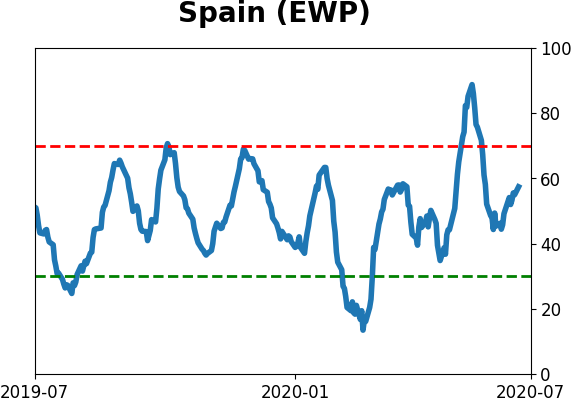
Sentiment Around The World
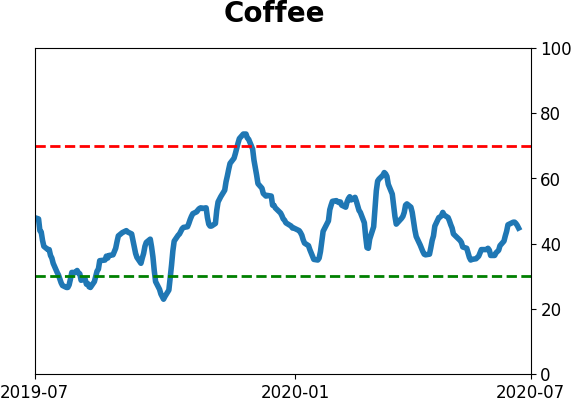
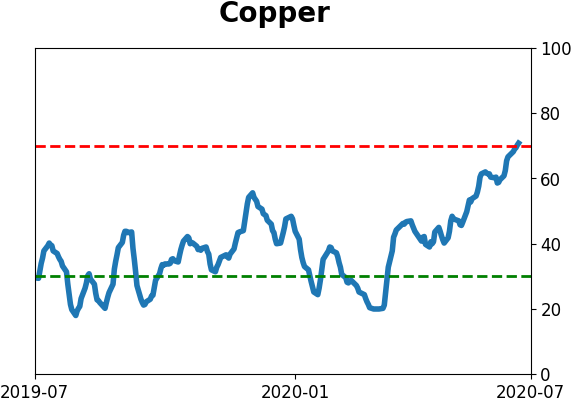
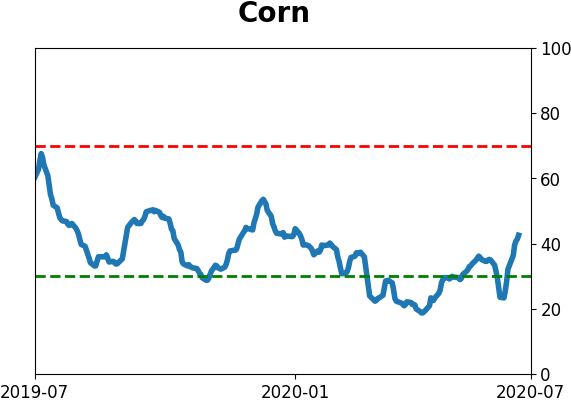
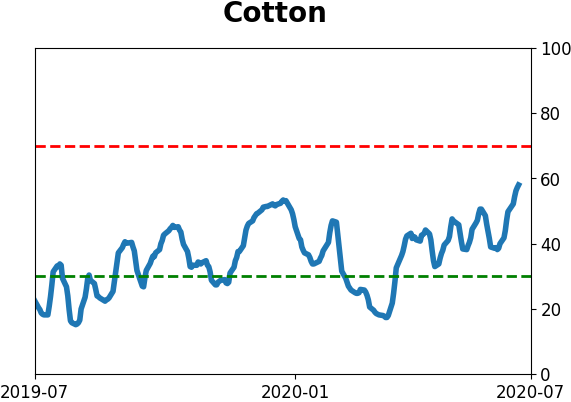
Optimism Index Thumbnails
|
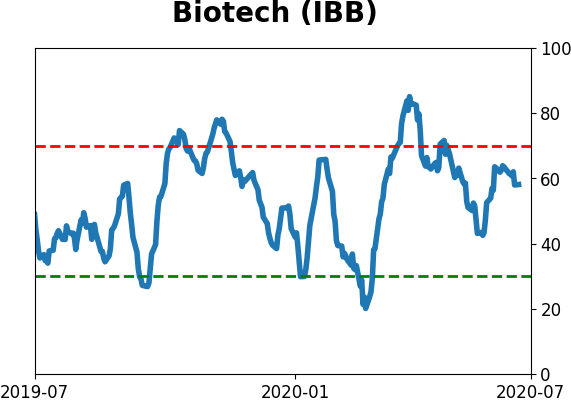
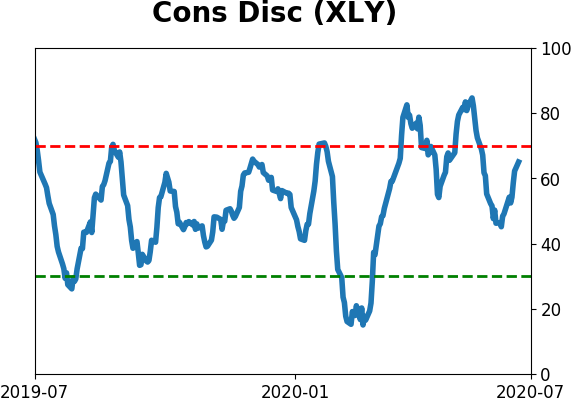
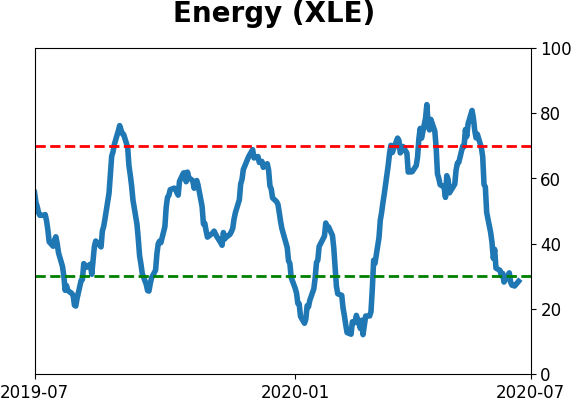
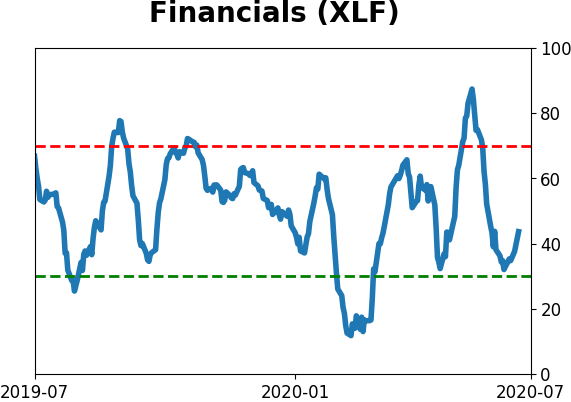
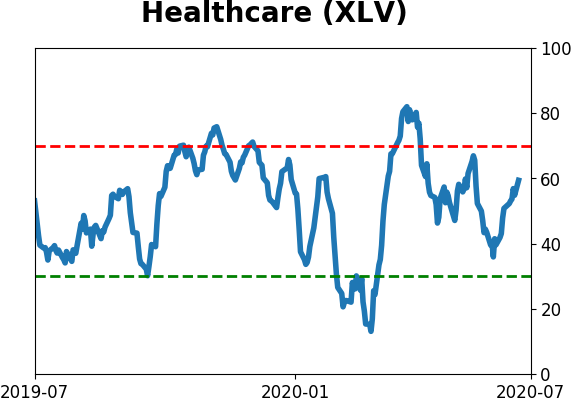
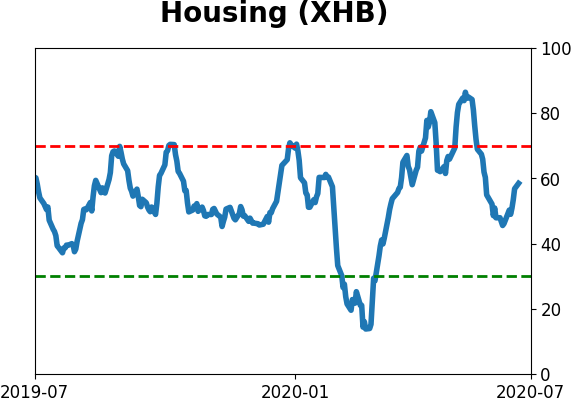
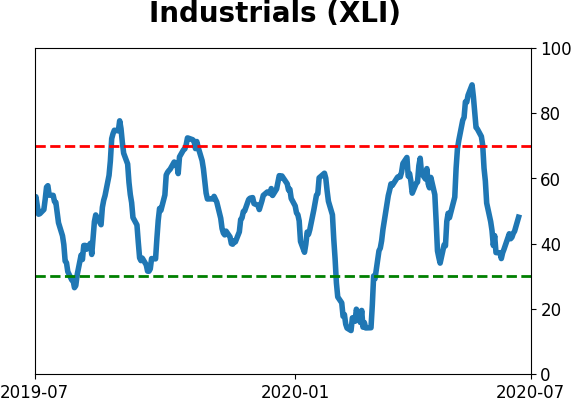
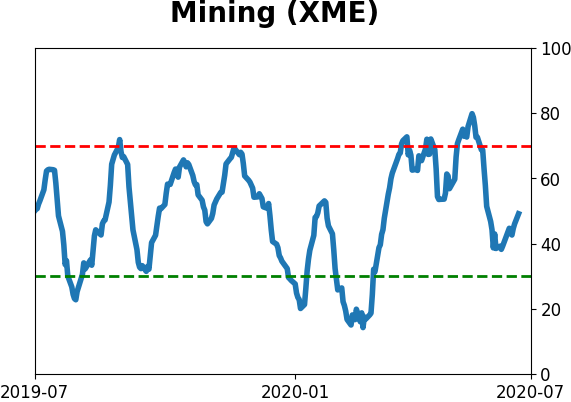
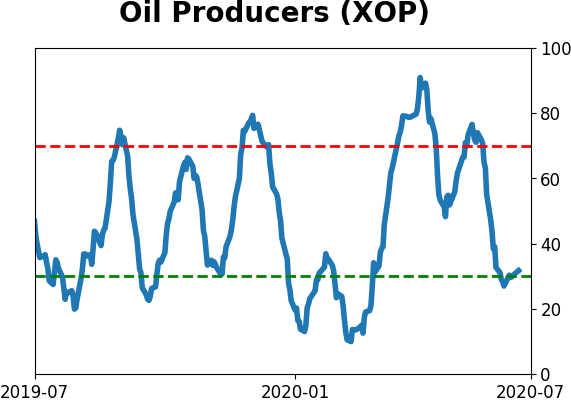
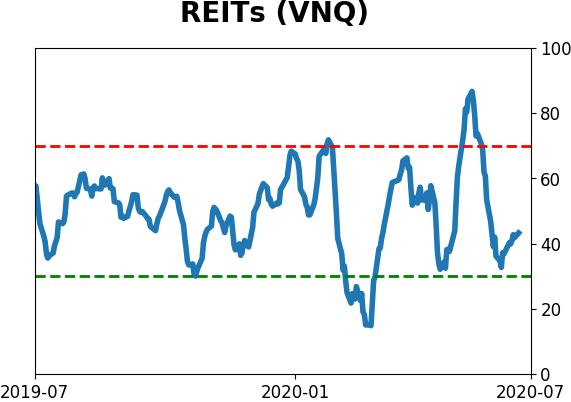
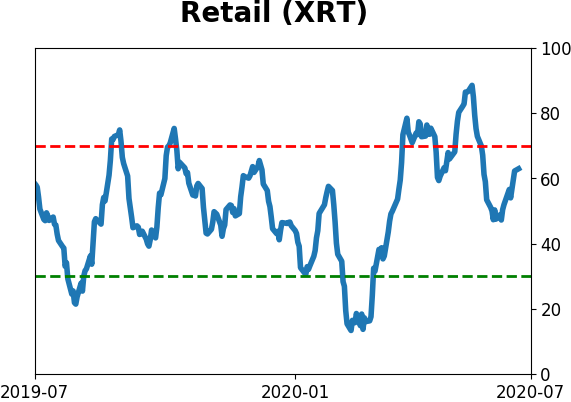
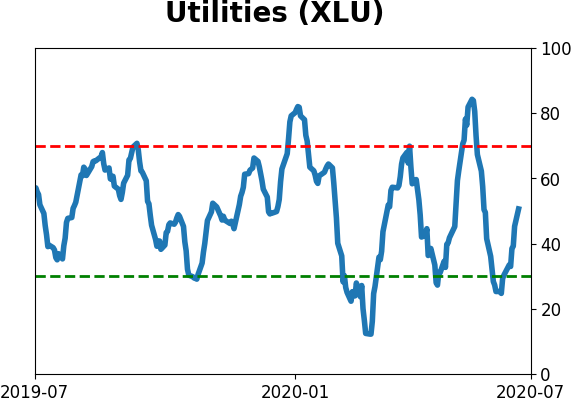
Sector ETF's - 10-Day Moving Average
|
|
|
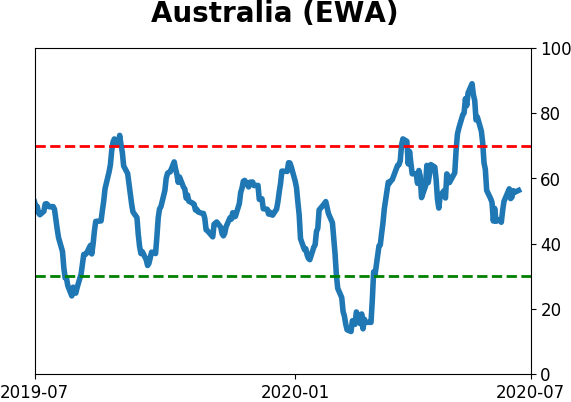
Country ETF's - 10-Day Moving Average
|
|
|
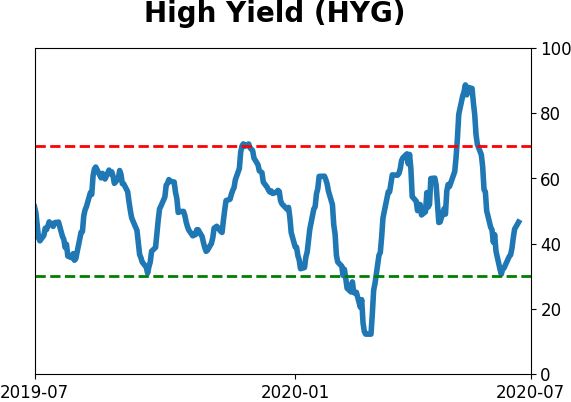
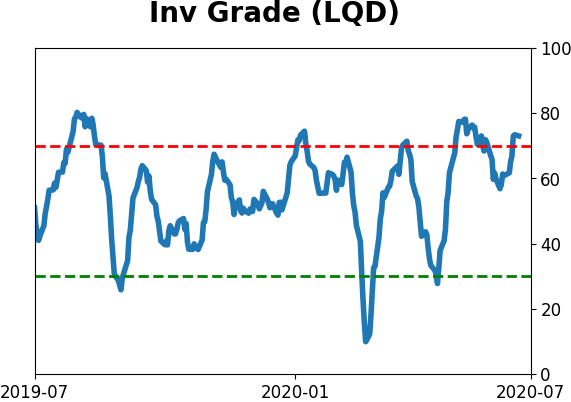
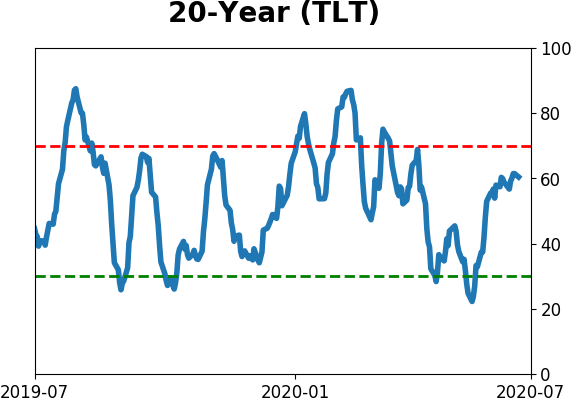
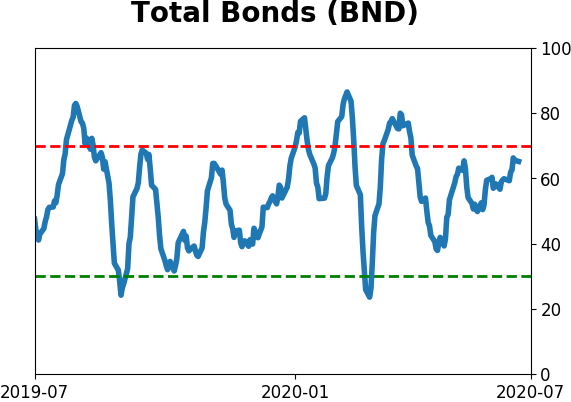
Bond ETF's - 10-Day Moving Average
|
|
|
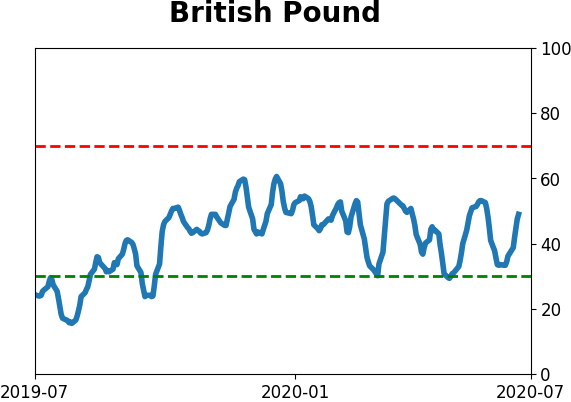
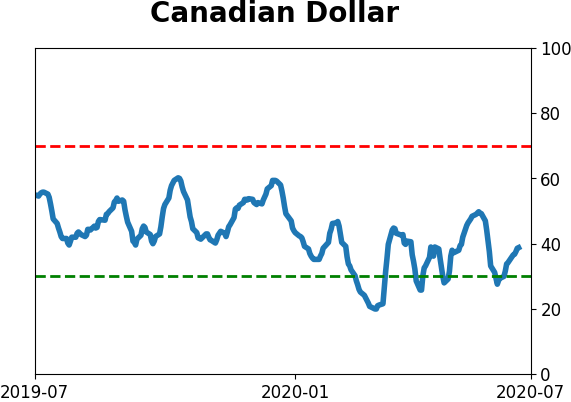
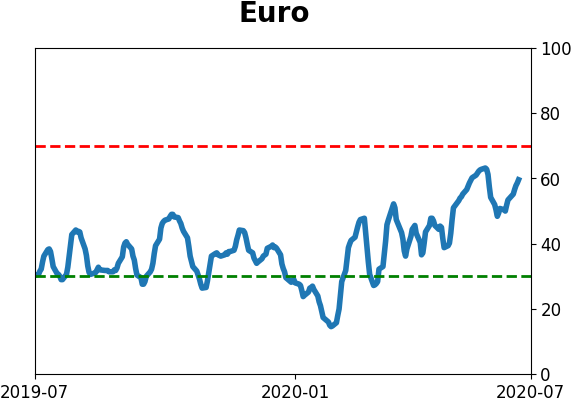
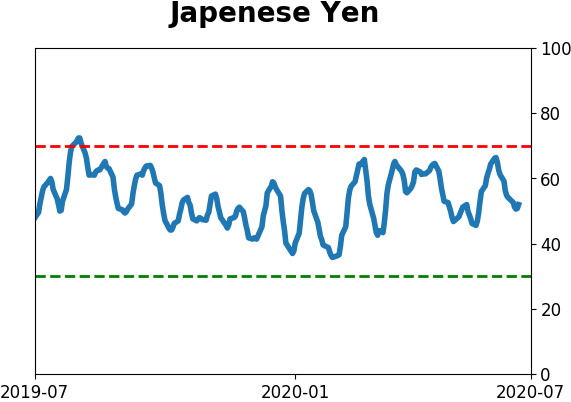
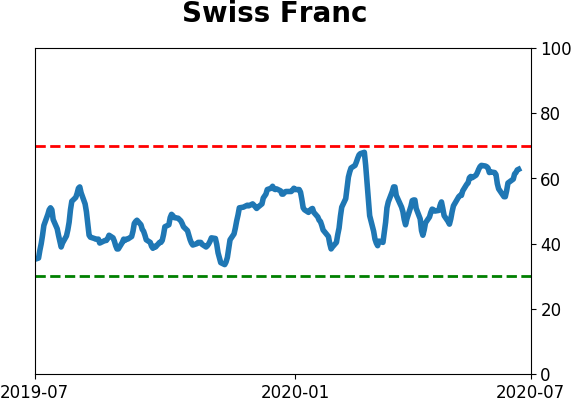
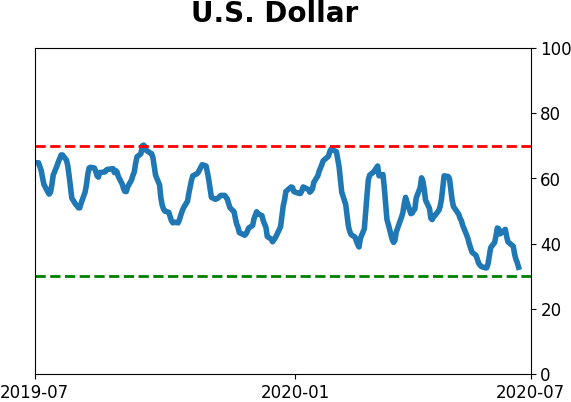
Currency ETF's - 5-Day Moving Average
|
|
|
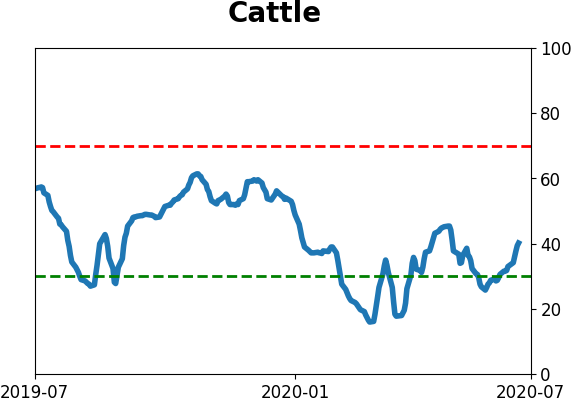
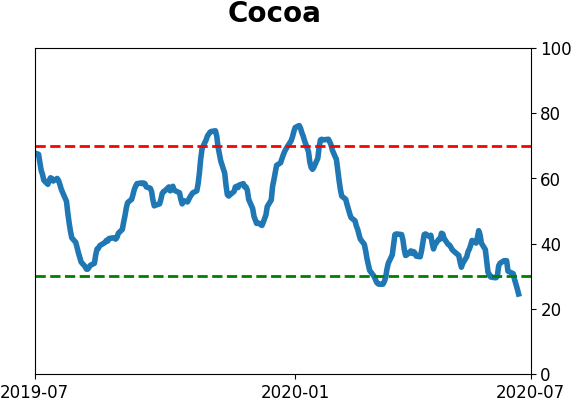
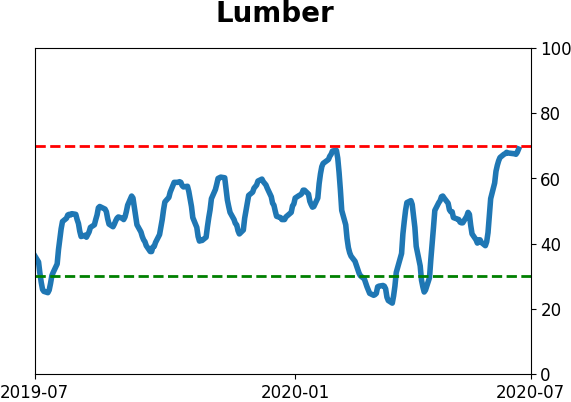
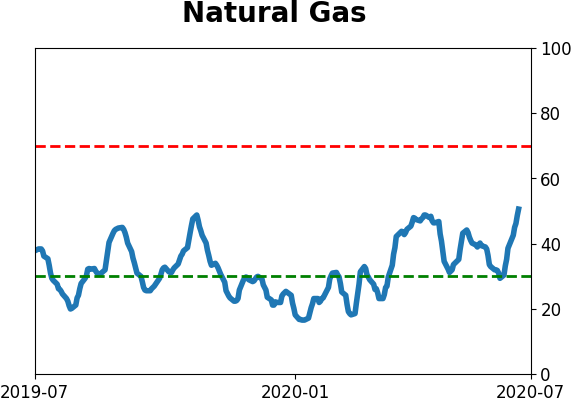
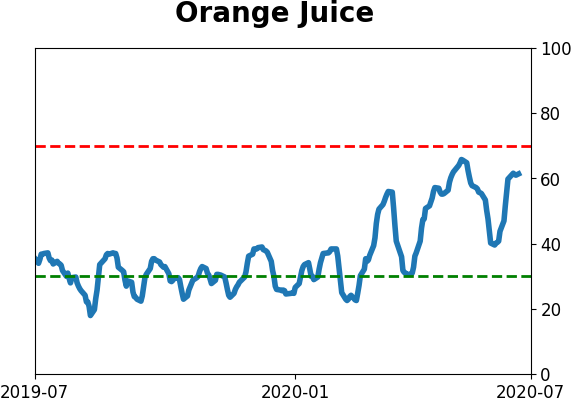
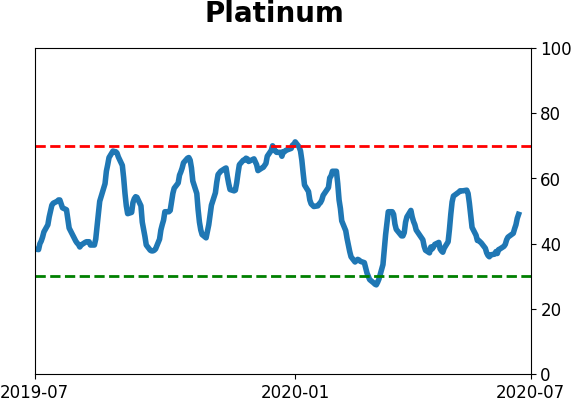
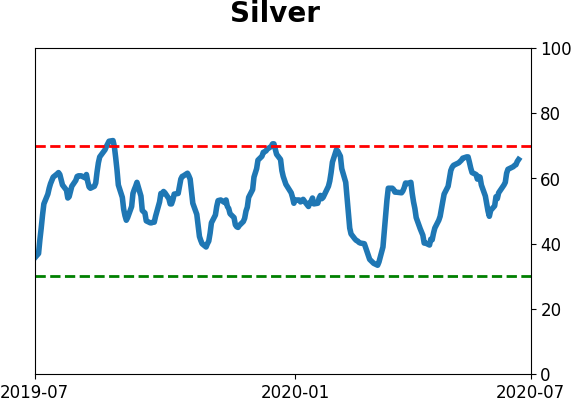
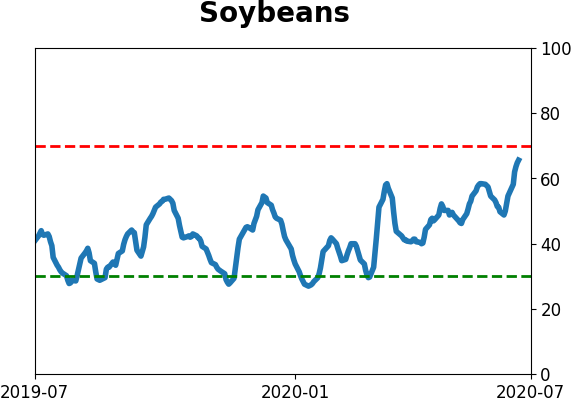
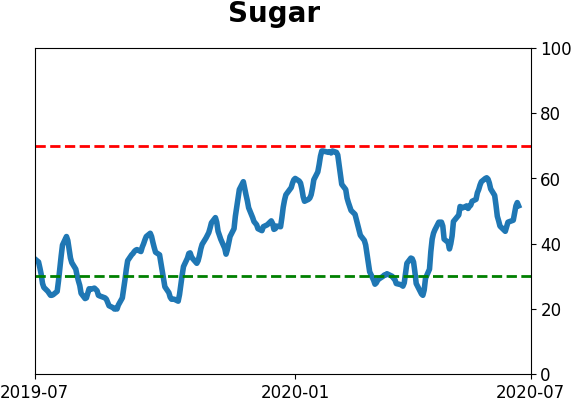
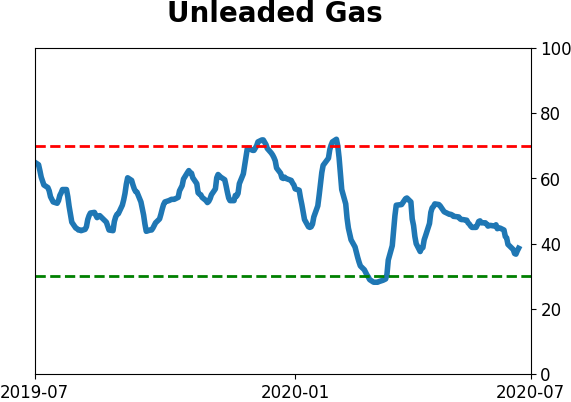
Commodity ETF's - 5-Day Moving Average
|
|