Headlines
|
|
All equity funds are showing negative flows:
Again this week, investors yanked money from equity funds. This is the fourth consecutive week, totaling more than $40 billion in outflows.
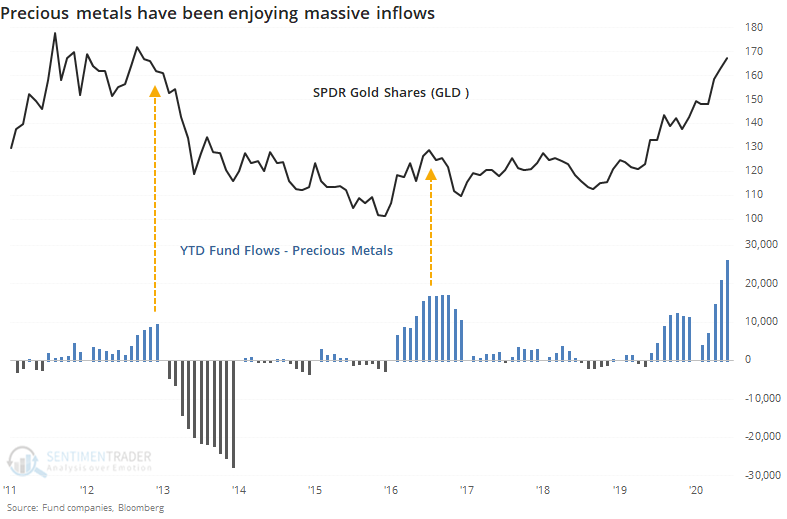
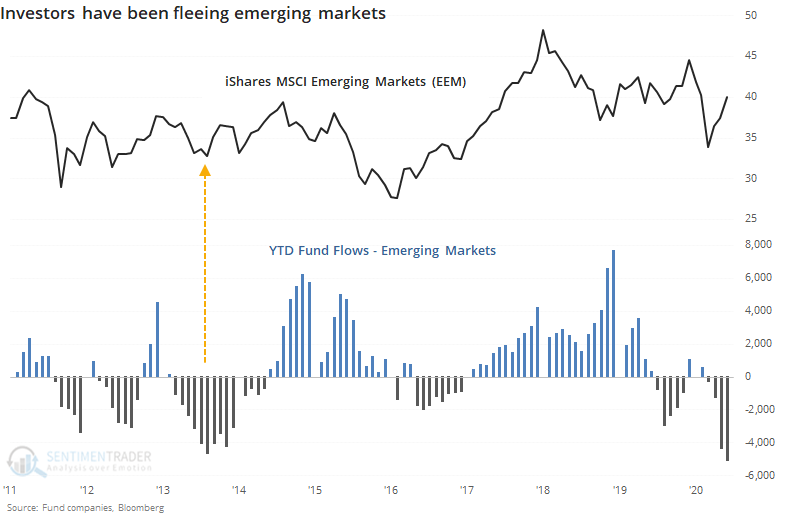
Investors flood into precious metals, flee emerging markets:
Investors have been flooding into precious metals funds in 2020, with record inflows. At the same time, they're leaving emerging market equity funds, which are showing the largest year-to-date outflows on record.
Bottom Line:
- Weight of the evidence has been suggesting flat/lower stock prices short- to medium-term, though that turned more neutral as stocks pulled back recently; still suggesting higher prices long-term
- Indicators show high and declining optimism, as Dumb Money Confidence neared 80% in early June with signs of reckless speculation and historic buying pressure, during what appears to be an unhealthy market environment
- Active Studies show a heavy positive skew over the medium- to long-term; breadth thrusts, recoveries, and trend changes have an almost unblemished record at preceding higher prices over a 6-12 month time frame
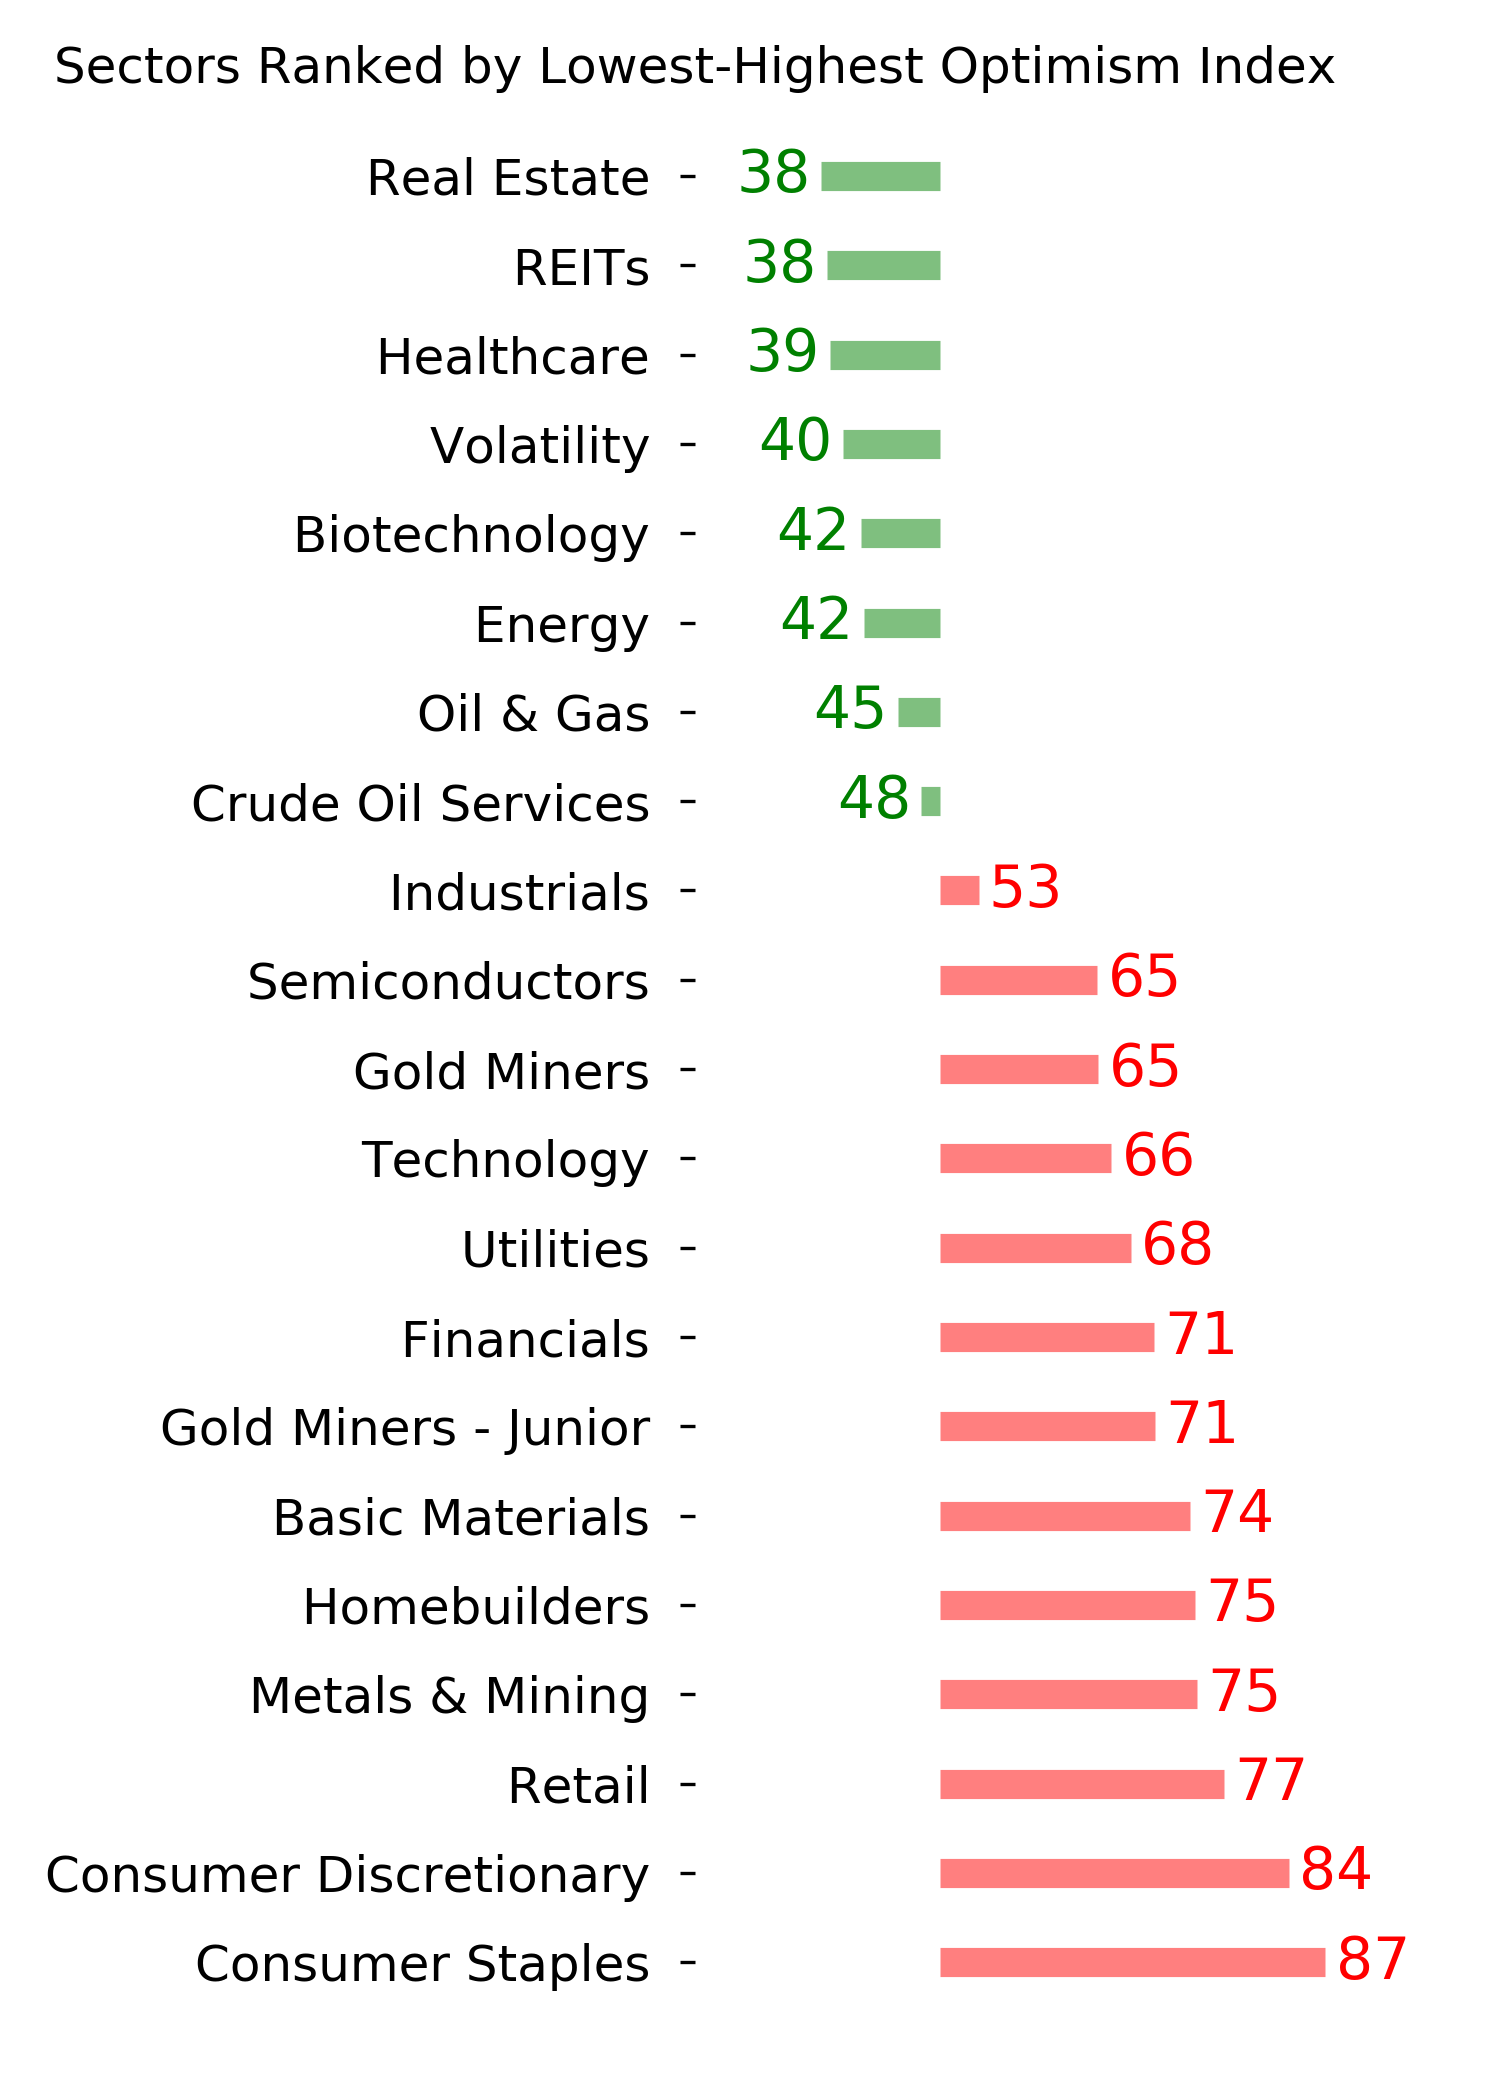
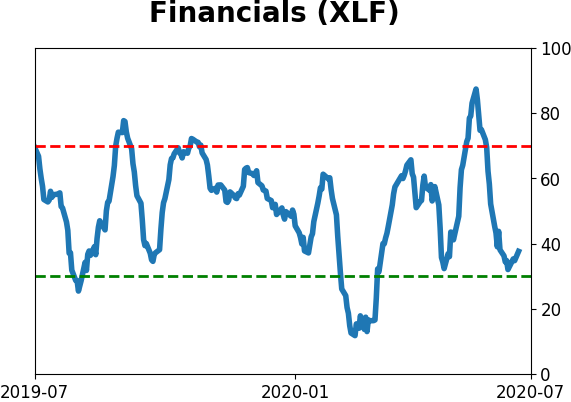
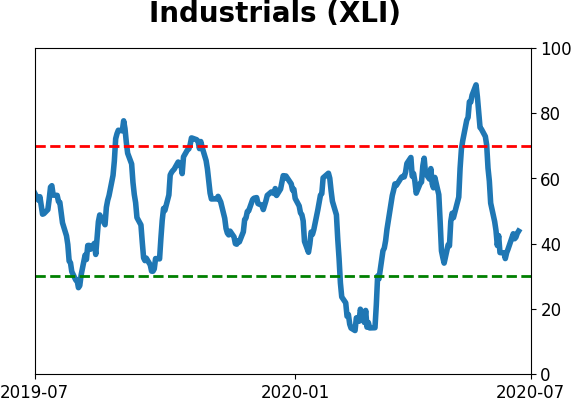
- Signs of extremely skewed preference for tech stocks nearing exhaustion, especially relative to industrials and financials (here and here)
- Indicators and studies for other markets are mixed with no strong conclusion
|
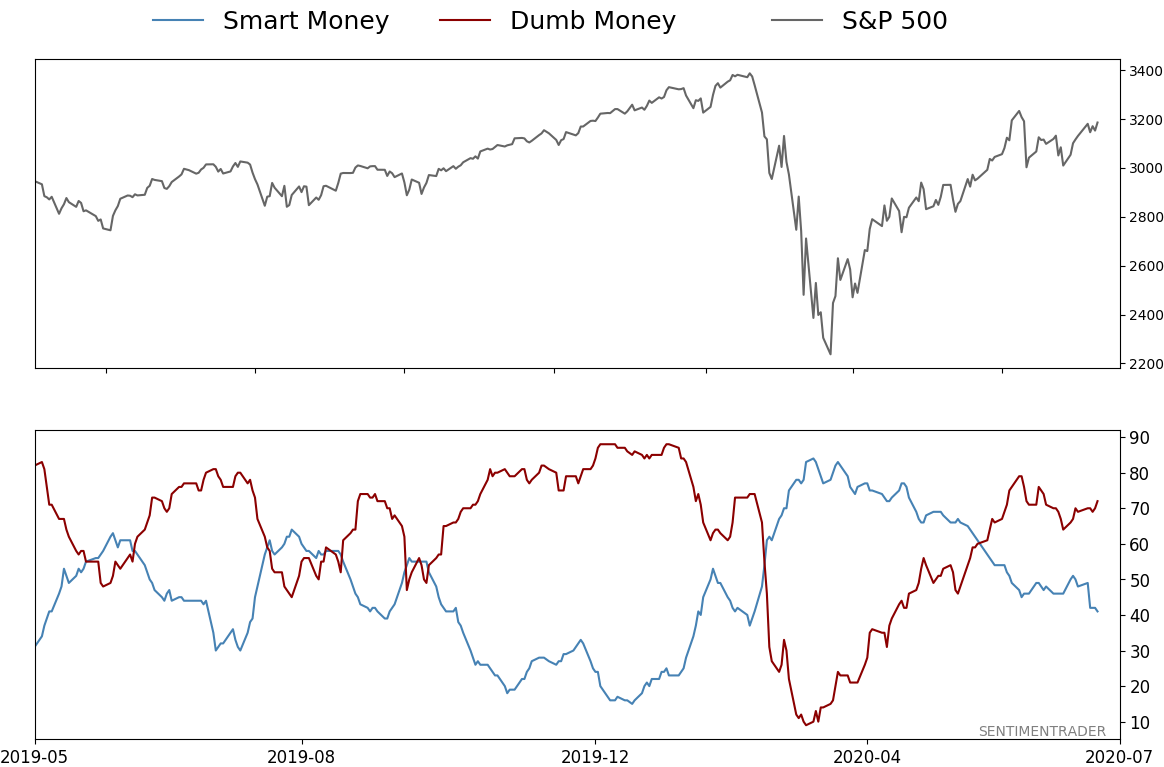
Smart / Dumb Money Confidence
|
Smart Money Confidence: 41%
Dumb Money Confidence: 72%
|
|
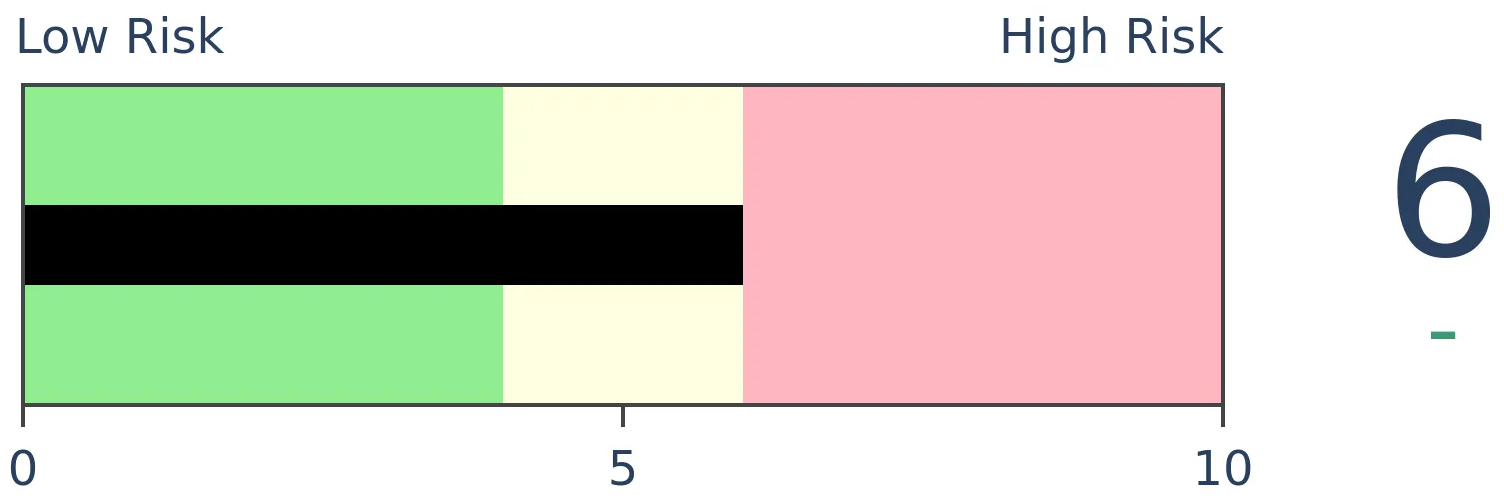
Risk Levels
Stocks Short-Term
|
Stocks Medium-Term

|
|
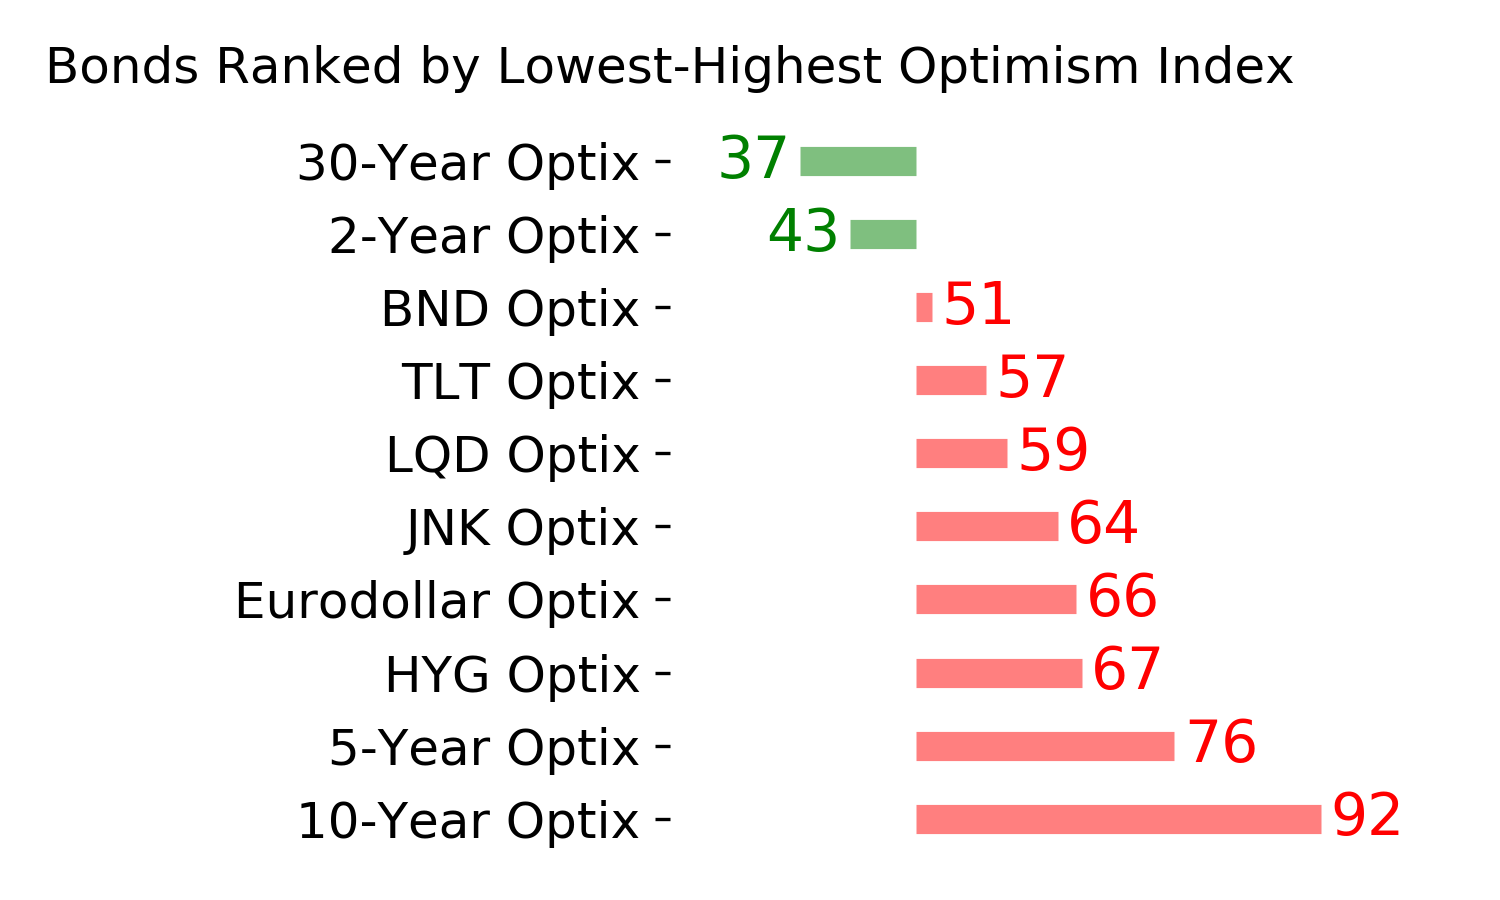
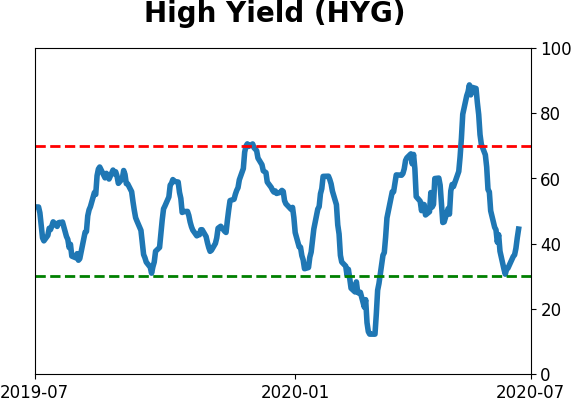
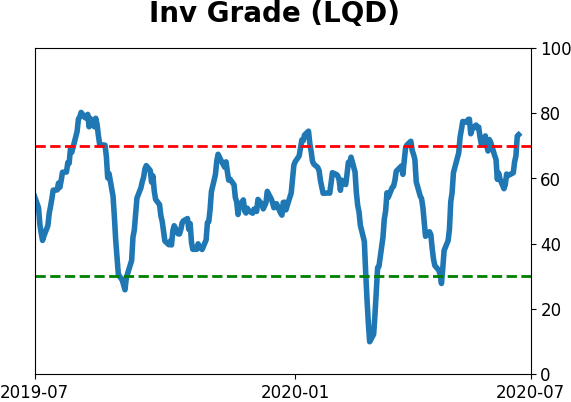
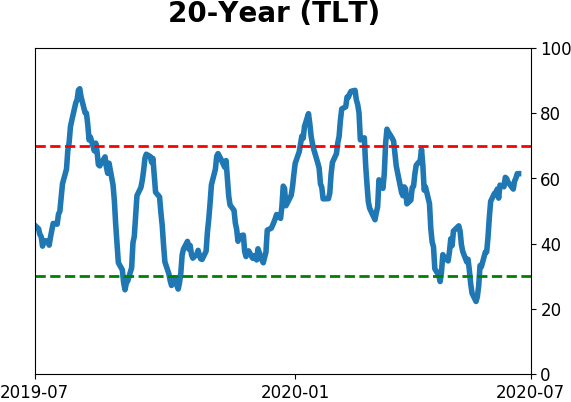
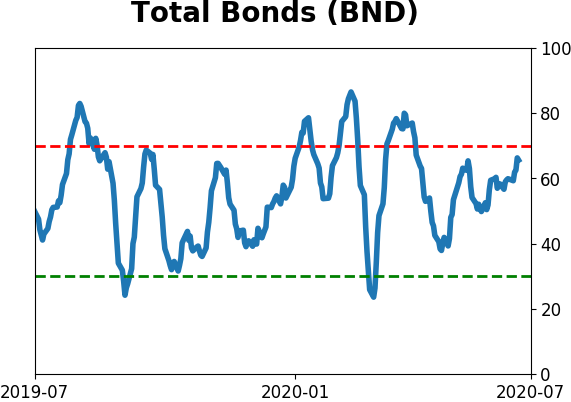
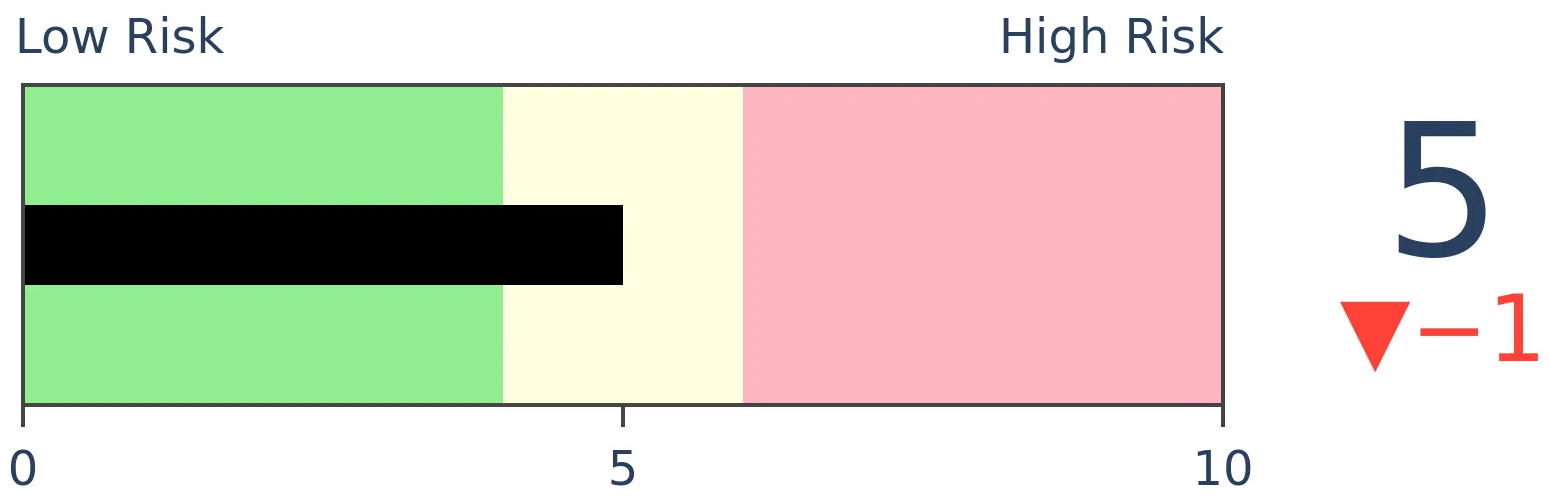
Bonds
|
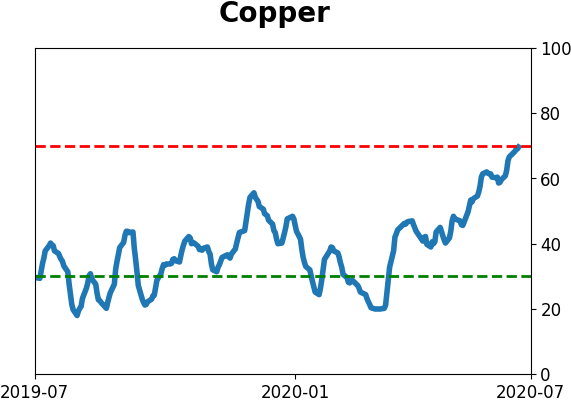
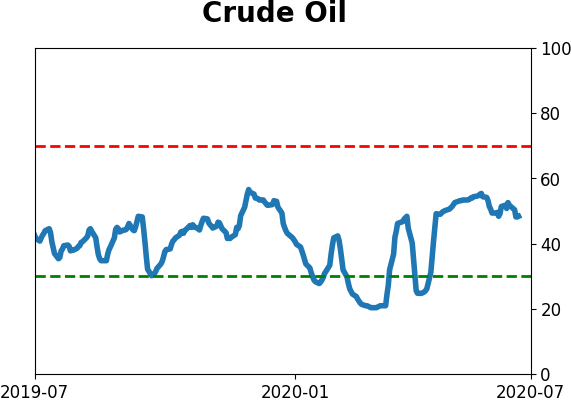
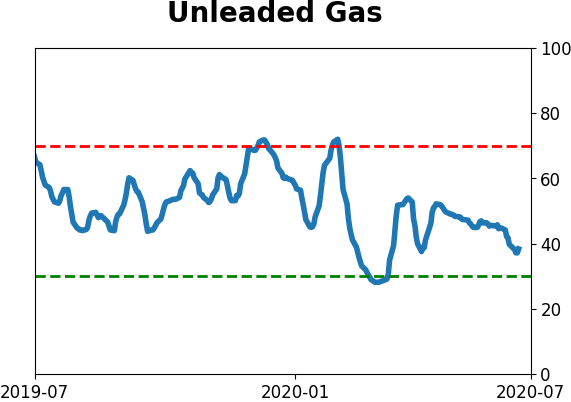
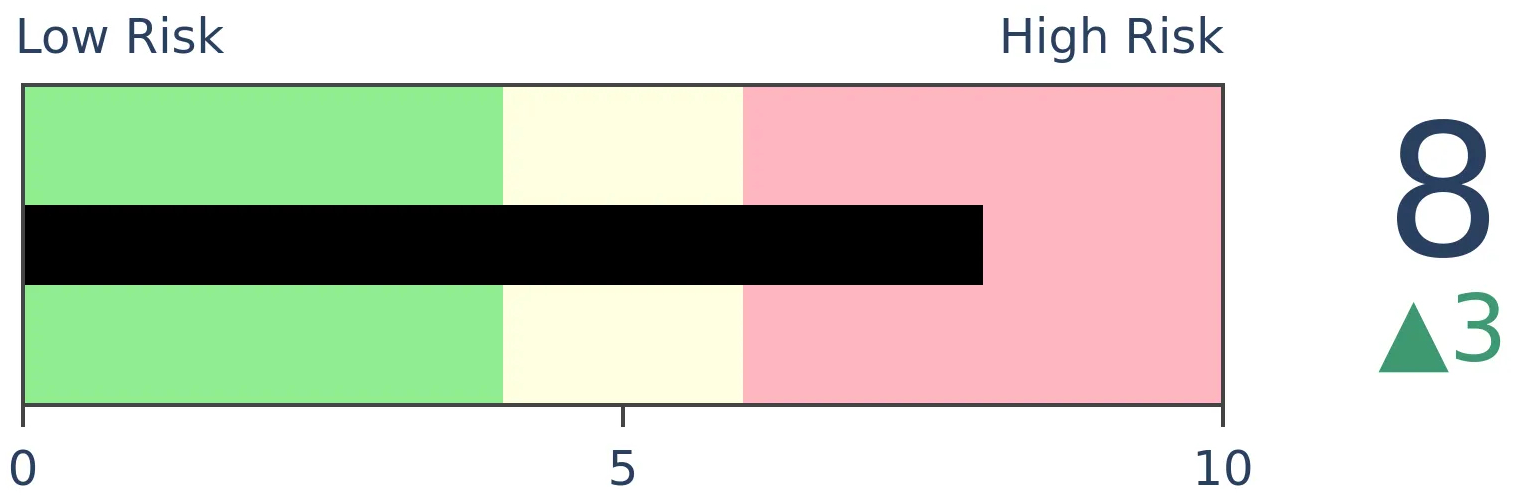
Crude Oil
|
|
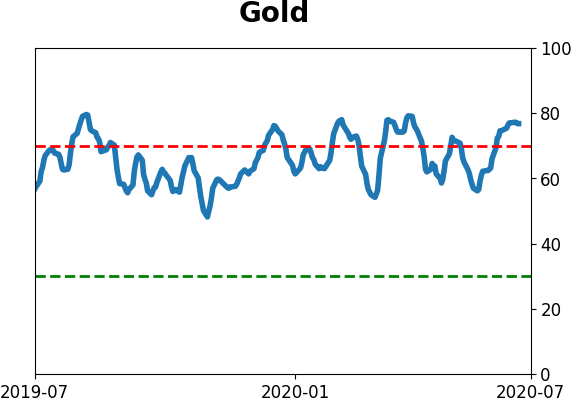
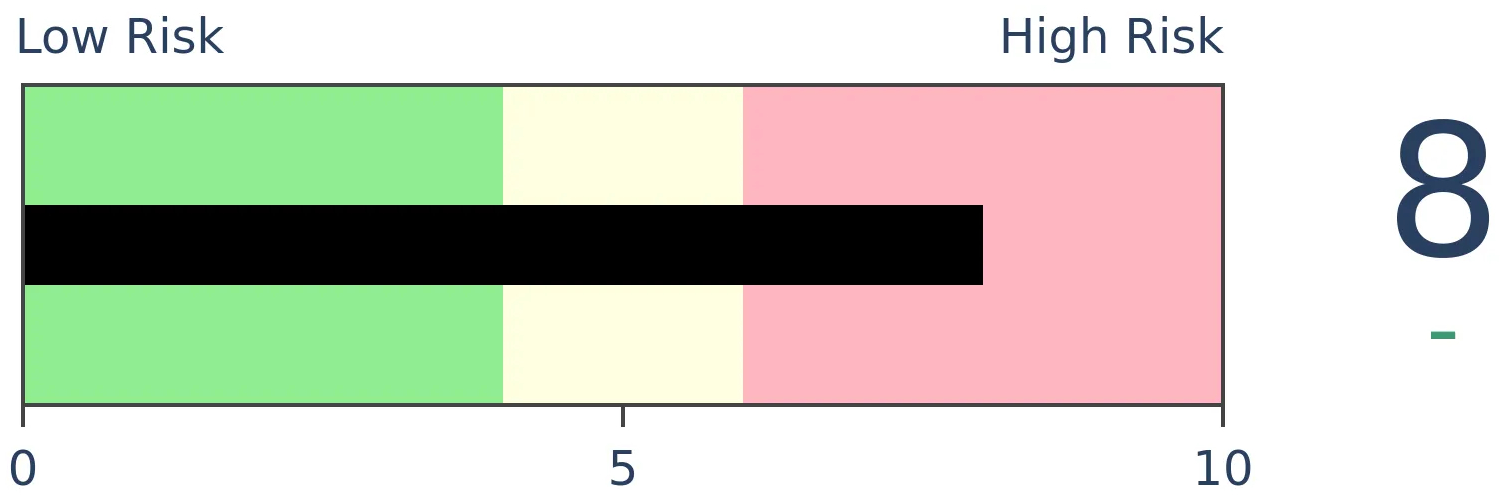
Gold

|
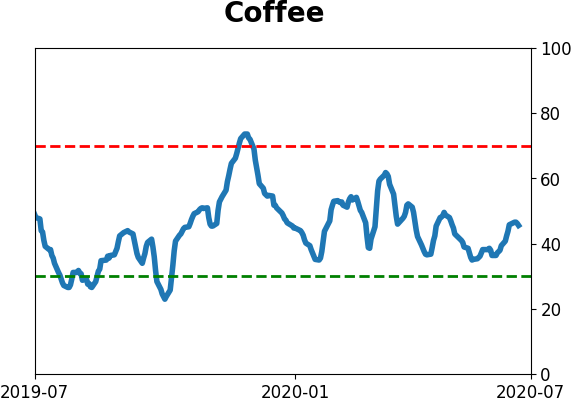
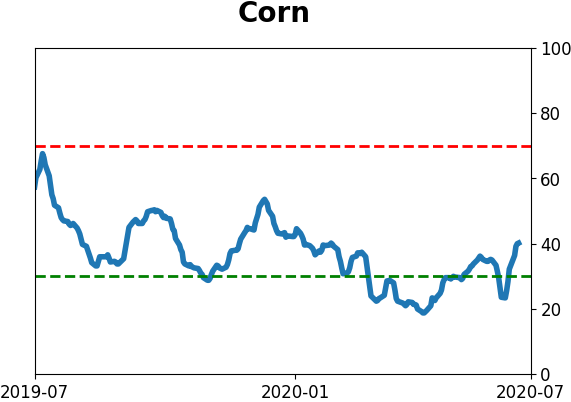
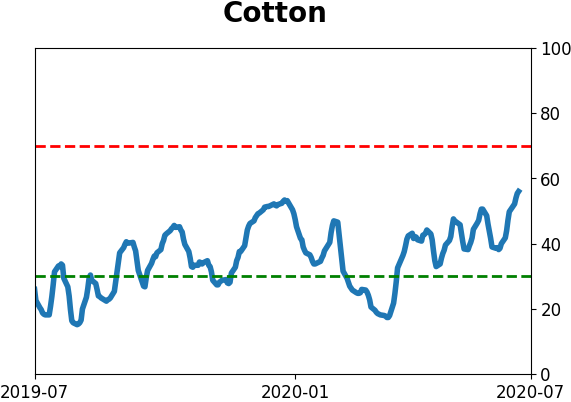
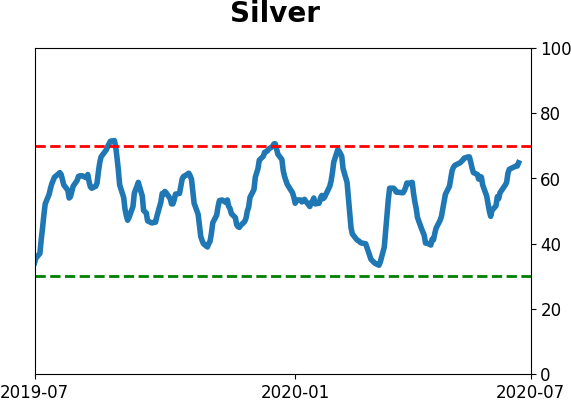
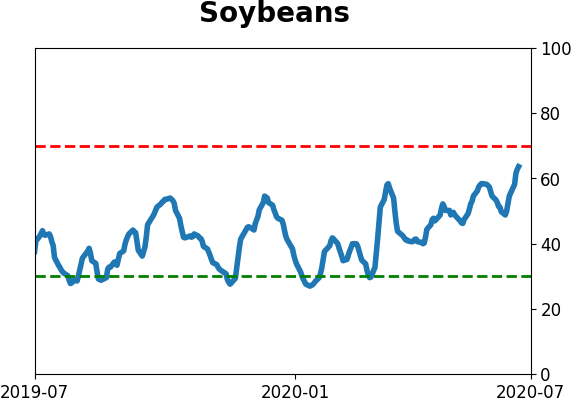
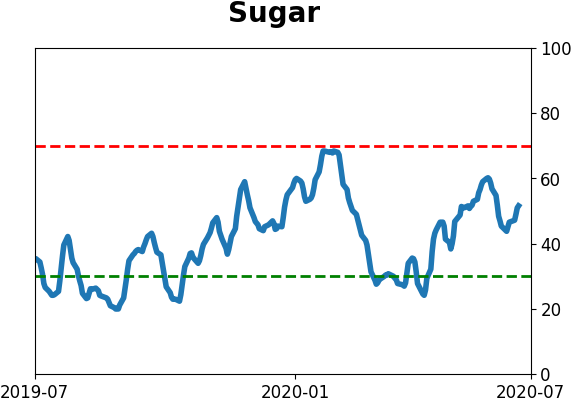
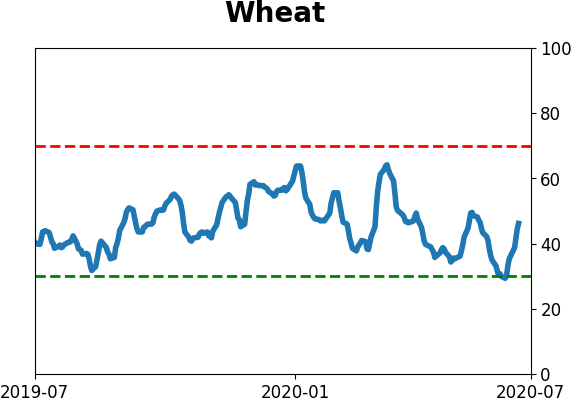
Agriculture
|
|
Research
BOTTOM LINE
Again this week, investors yanked money from equity funds. This is the fourth consecutive week, totaling more than $40 billion in outflows.
FORECAST / TIMEFRAME
None
|
What's it going to take for investors to embrace equity funds again?
They're leaving emerging markets funds, overseas funds, and inexplicably even domestic ones. Lipper reported another outflow of more than a billion dollars from all equity funds this week, the 4th consecutive outflow. The total outflow over the four weeks is over $40 billion, ranking among the largest in nearly 20 years. That's quite remarkable given how resilient parts of the equity market have been.
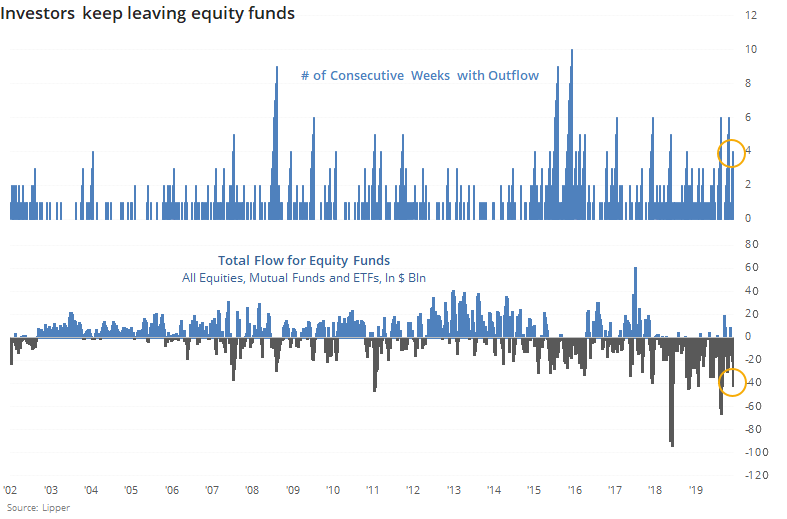
Generally, big outflows are a decent contrary indicator. Below, we can see every date when there were four straight weeks of outflows, totaling at least $10 billion.
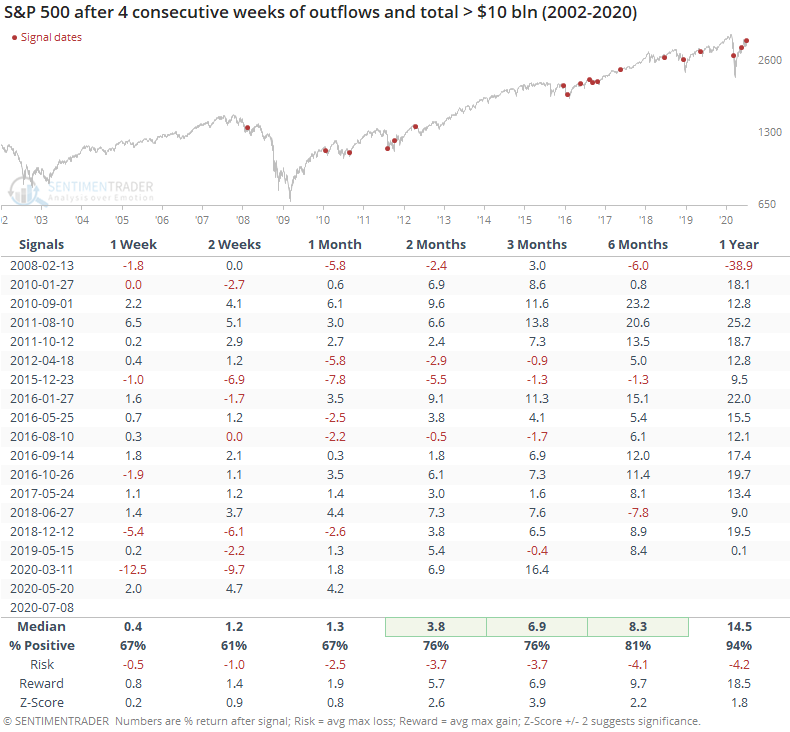
While fund flows don't move perfectly in step with prices, we usually see inflows during rallies and outflows during declines. This year, not so much, and that's a moderately positive sign for stocks over the medium- to long-term.
There are certainly some conflicting data points when it comes to sentiment. We're seeing outflows like this, and insiders are buying. Yet there have also been pockets of historic speculation. Ultimately, these contrasting indicators are washed out in models like Smart and Dumb Money Confidence, where the spread has been hanging around -25%.
On the Dashboard, we calculate every combination of the two models and show what the S&P's median return over (or under) a random return has been over the next two months given where the models close that day.
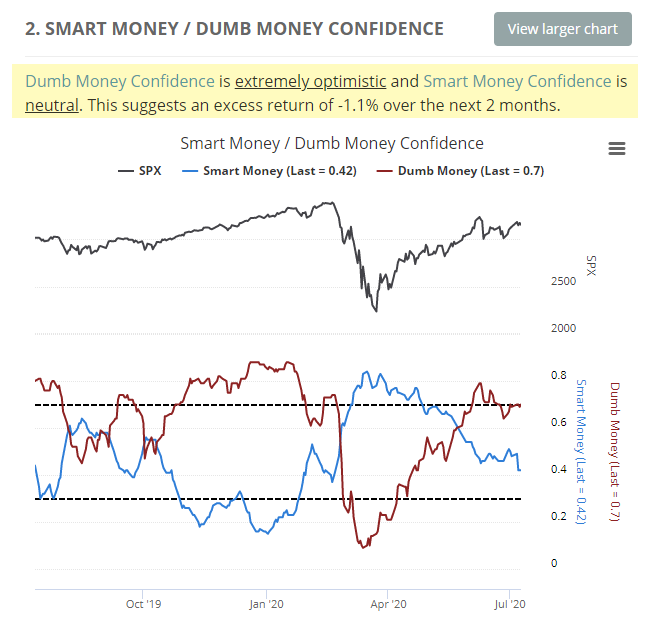
With the current levels of the models where they are, the S&P has under-performed a random return by 1.1% over the next couple of months since 1999. So the few positives among the indicators we follow haven't been enough to offset the multitude of negatives.
The most positive aspects of this market have been the thrusts, recoveries, and trend changes that have an almost unblemished record at preceding higher prices over a 6-12 month time frame. It's the short- to medium-term that has been more of an issue since late May.
BOTTOM LINE
Investors have been flooding into precious metals funds in 2020, with record inflows. At the same time, they're leaving emerging market equity funds, which are showing the largest year-to-date outflows on record.
FORECAST / TIMEFRAME
None
|
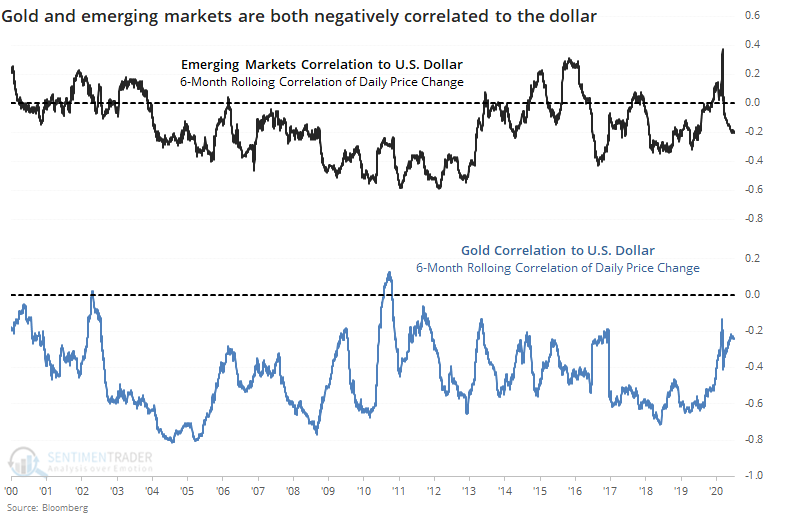
Investors have been loving precious metals. Emerging markets not so much.
Both markets tend to move with the dollar, so it seems odd that investors would favor one so highly over the other. Over the past 30 years, both markets show a consistent negative correlation to the dollar. Generally, the correlations move together - if the dollar is influencing emerging markets, then it's usually influencing gold, too.
Even though both gold and emerging markets have been on a tear, so far this year, precious metals funds have taken in more than $25 billion, a decade-long high.
The flow into emerging markets is at a record low. Halfway through the year, the outflow from these funds has already surpassed the worst year-to-date flow from 2013.
If we combine the flows and look at a ratio of GLD to EEM, then we see the following.
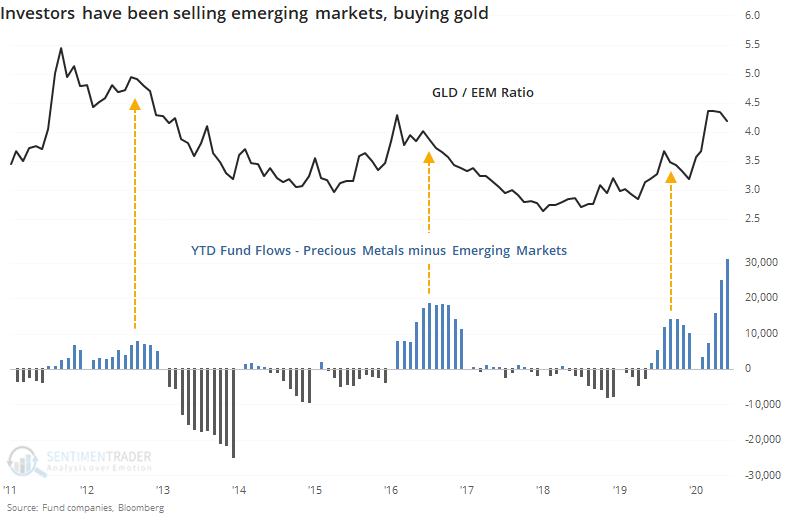
Because flows into precious metals fund swamp those in emerging markets, the spread is much more heavily influenced by the former. Still, we can see the spread has never been higher - investors have never plowed so much money into gold relative to emerging markets.
The big question is whether it matters. The other times there was a large spread between flows into the two markets, the ratio of GLD to EEM fell back in the months ahead. When there was a large flow out of metals and into emerging markets, then the ratio rebounded. While history is short and precedents are few, it's a modest suggestion that investors may have tipped too far toward metals when the dollar is likely to influence both to some degree.
Active Studies
| Time Frame | Bullish | Bearish | | Short-Term | 0 | 0 | | Medium-Term | 8 | 6 | | Long-Term | 44 | 1 |
|
Indicators at Extremes
Portfolio
| Position | Weight % | Added / Reduced | Date | | Stocks | 29.8 | Reduced 9.1% | 2020-06-11 | | Bonds | 0.0 | Reduced 6.7% | 2020-02-28 | | Commodities | 5.2 | Added 2.4%
| 2020-02-28 | | Precious Metals | 0.0 | Reduced 3.6% | 2020-02-28 | | Special Situations | 0.0 | Reduced 31.9% | 2020-03-17 | | Cash | 65.0 | | |
|
Updates (Changes made today are underlined)
In the first months of the year, we saw manic trading activity. From big jumps in specific stocks to historic highs in retail trading activity to record highs in household confidence to almost unbelievable confidence among options traders. All of that came amid a market where the average stock couldn't keep up with their indexes. There were signs of waning momentum in stocks underlying the major averages, which started triggering technical warning signs in late January. After stocks bottomed on the 23rd, they enjoyed a historic buying thrust and retraced a larger amount of the decline than "just a bear market rally" tends to. Those thrusts are the most encouraging sign we've seen in years. Through early June, we were still seeing thrusts that have led to recoveries in longer-term breadth metrics. The longer-term prospects for stocks (6-12 months) still look decent given the above. On a short- to medium-term basis, it was getting harder to make that case. Dumb Money Confidence spiked and there were multiple signs of a historic level of speculation. This is likely the lowest I will go given what I still consider to be compelling positives over a longer time frame. There is not a slam-dunk case to be made for either direction, so it will seem like a mistake whether stocks keep dropping (why didn't I sell more?) or if they turn and head higher (why did I let short-term concerns prevail?). After nearly three decades of trading, I've learned to let go of the idea of perfection.
RETURN YTD: -4.8% 2019: 12.6%, 2018: 0.6%, 2017: 3.8%, 2016: 17.1%, 2015: 9.2%, 2014: 14.5%, 2013: 2.2%, 2012: 10.8%, 2011: 16.5%, 2010: 15.3%, 2009: 23.9%, 2008: 16.2%, 2007: 7.8%
|
|
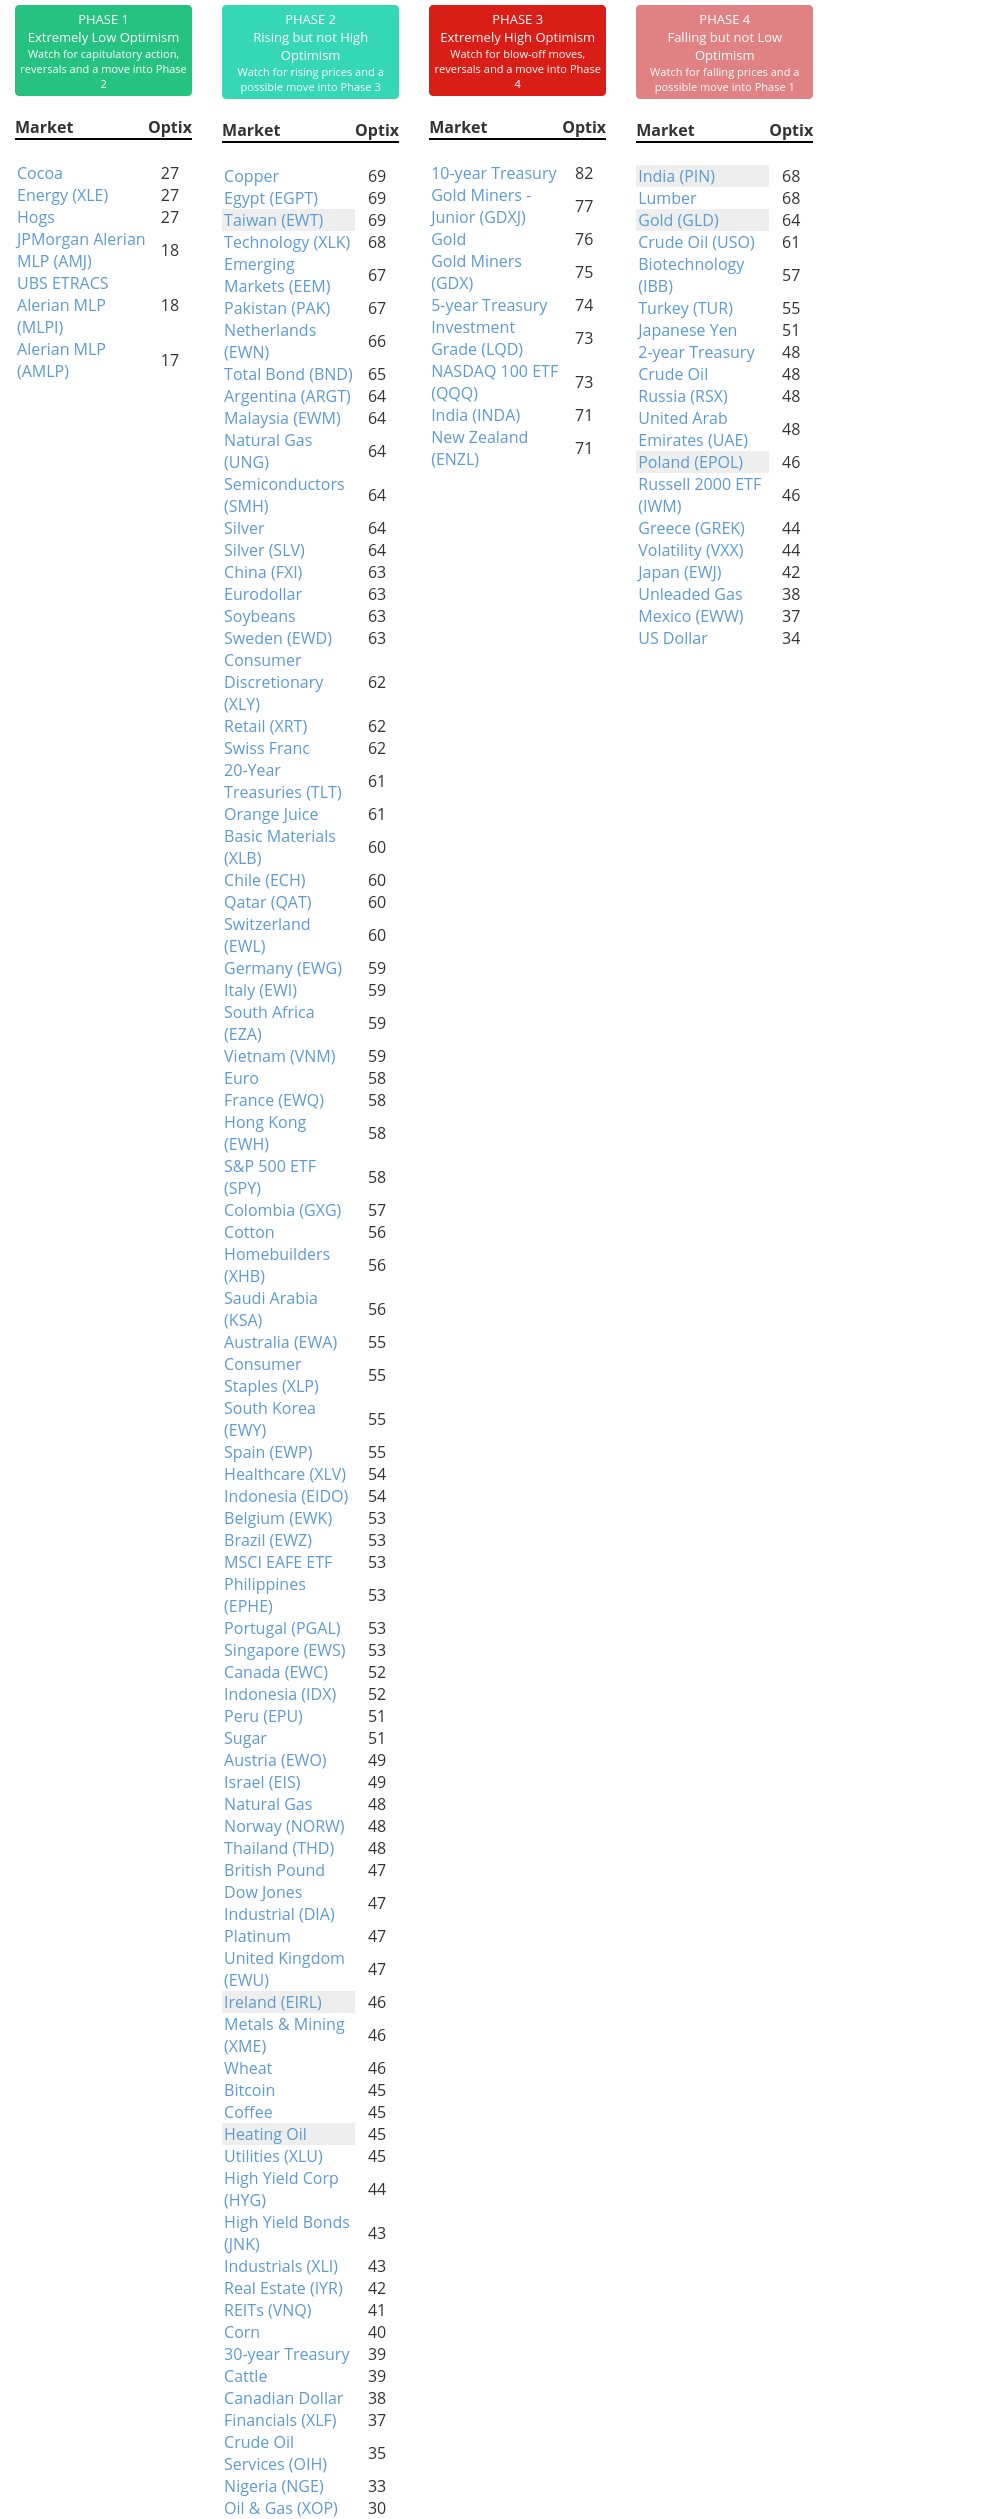
Phase Table
Ranks
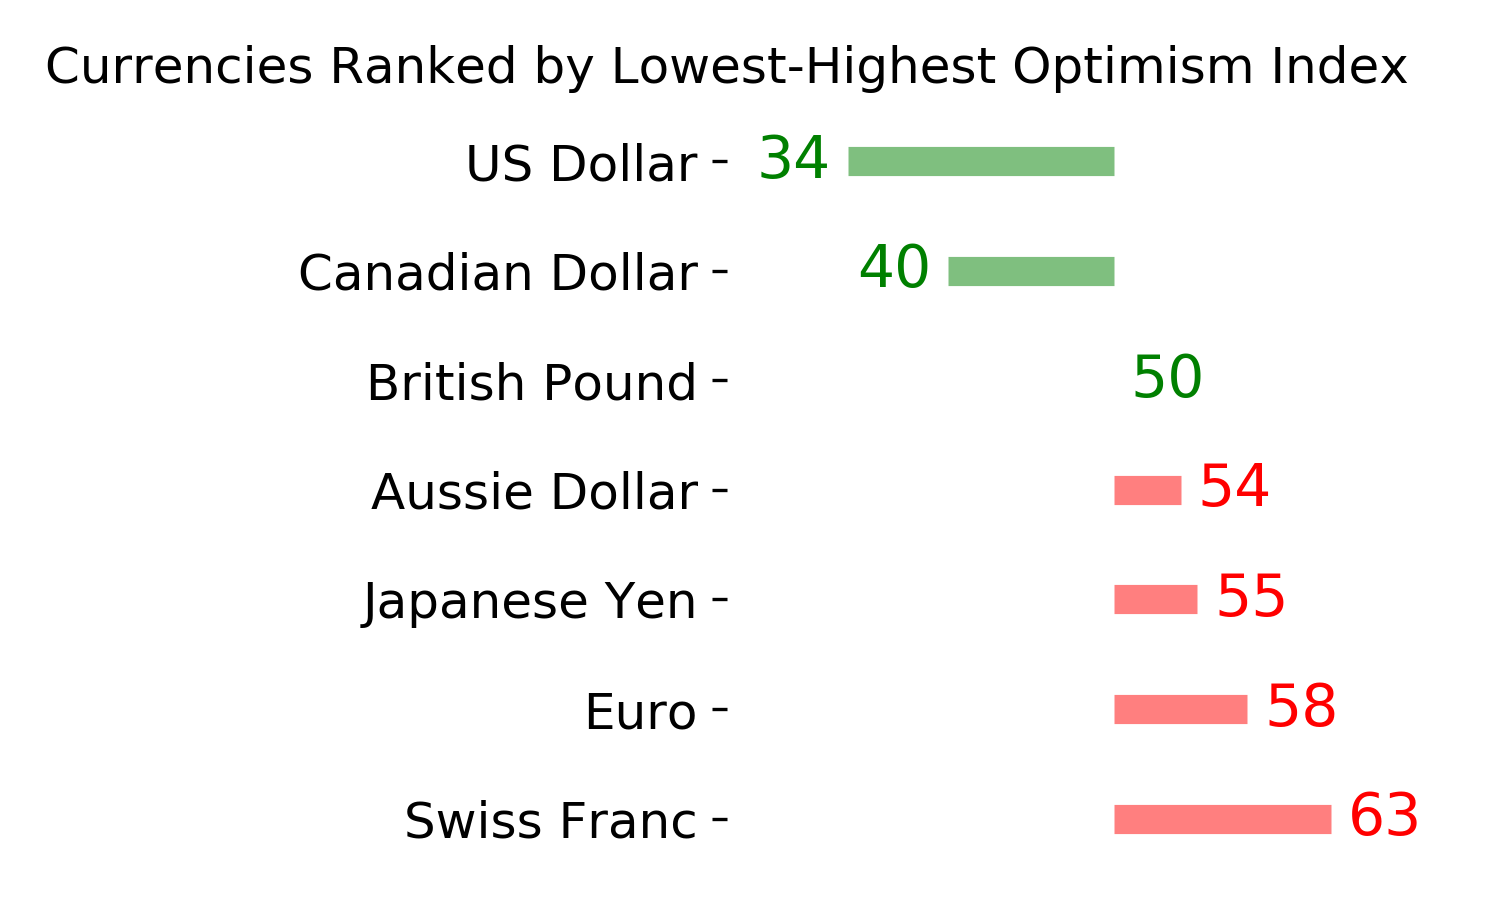
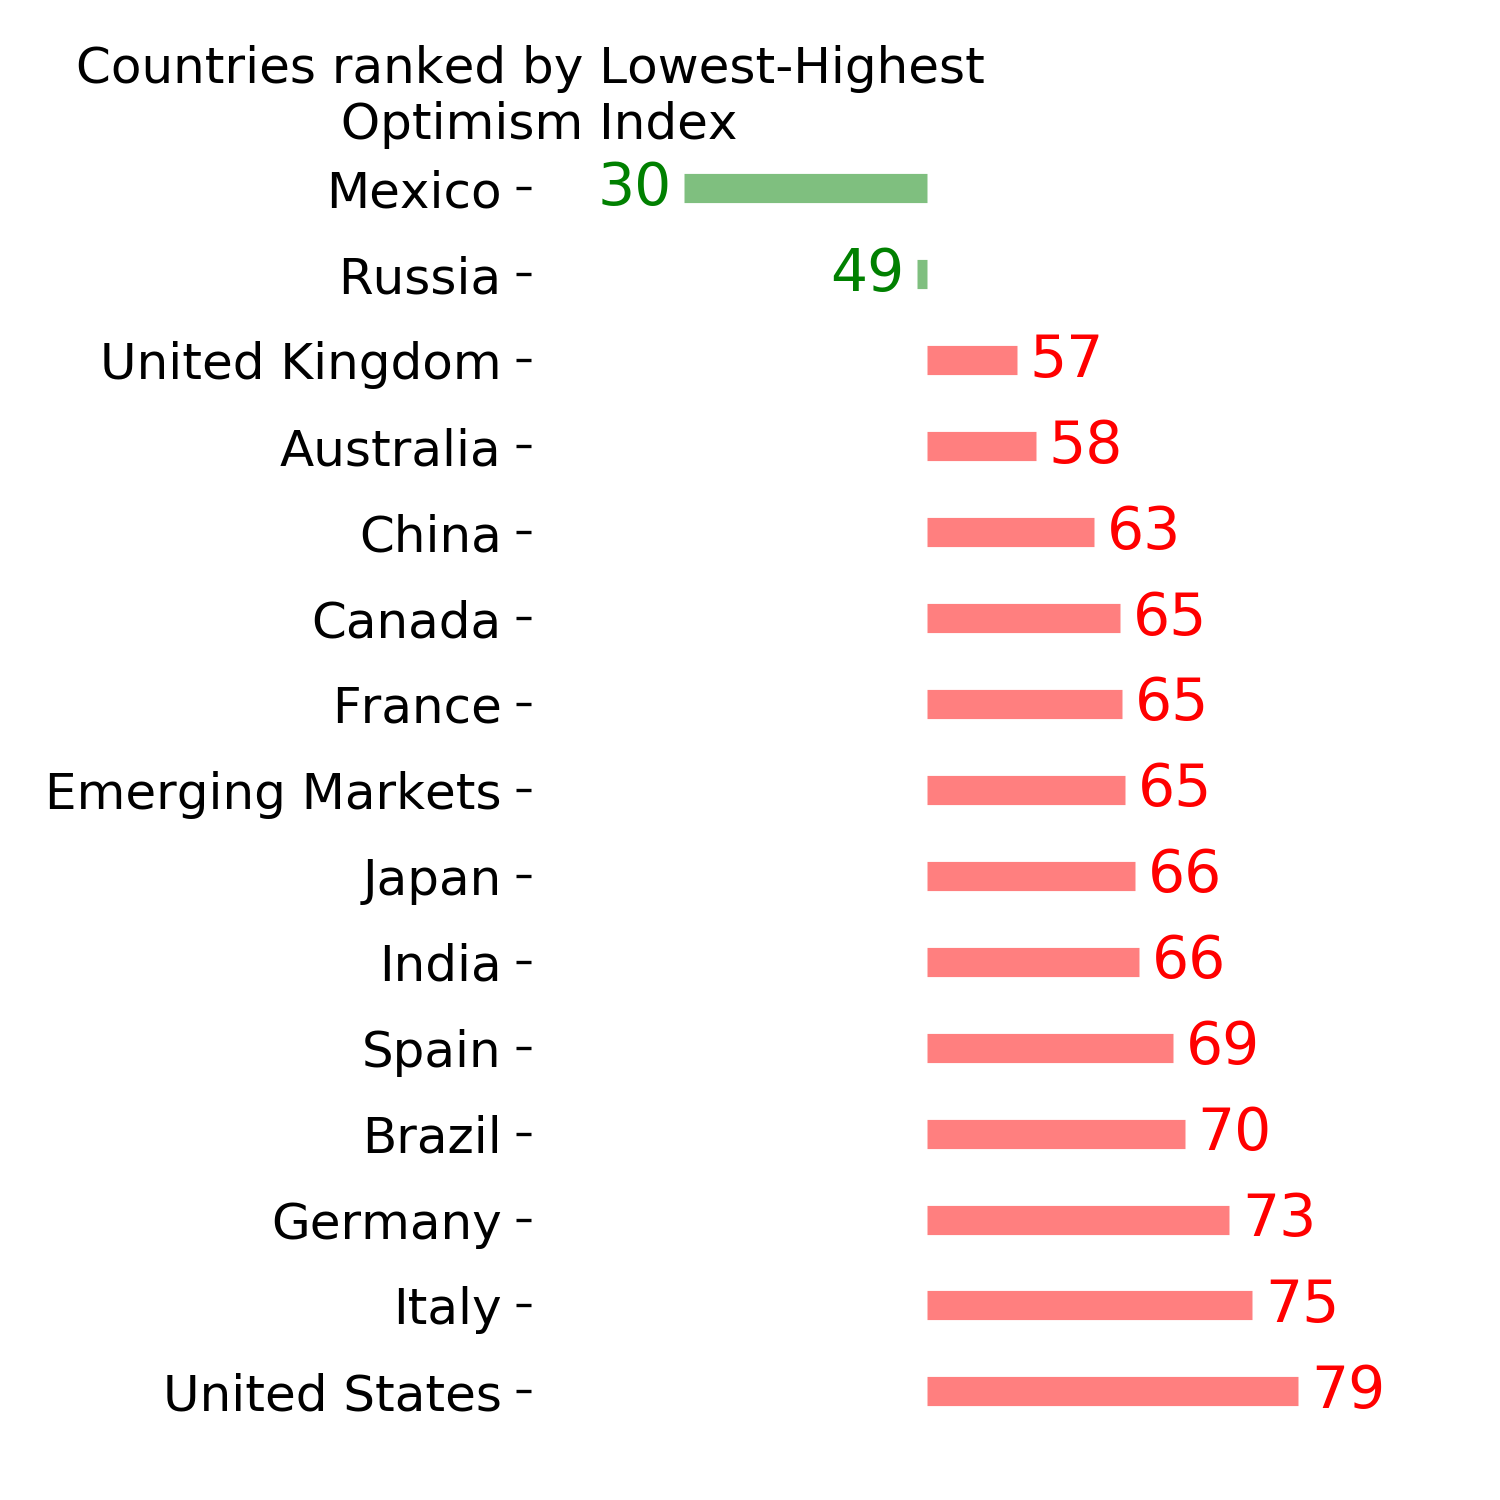
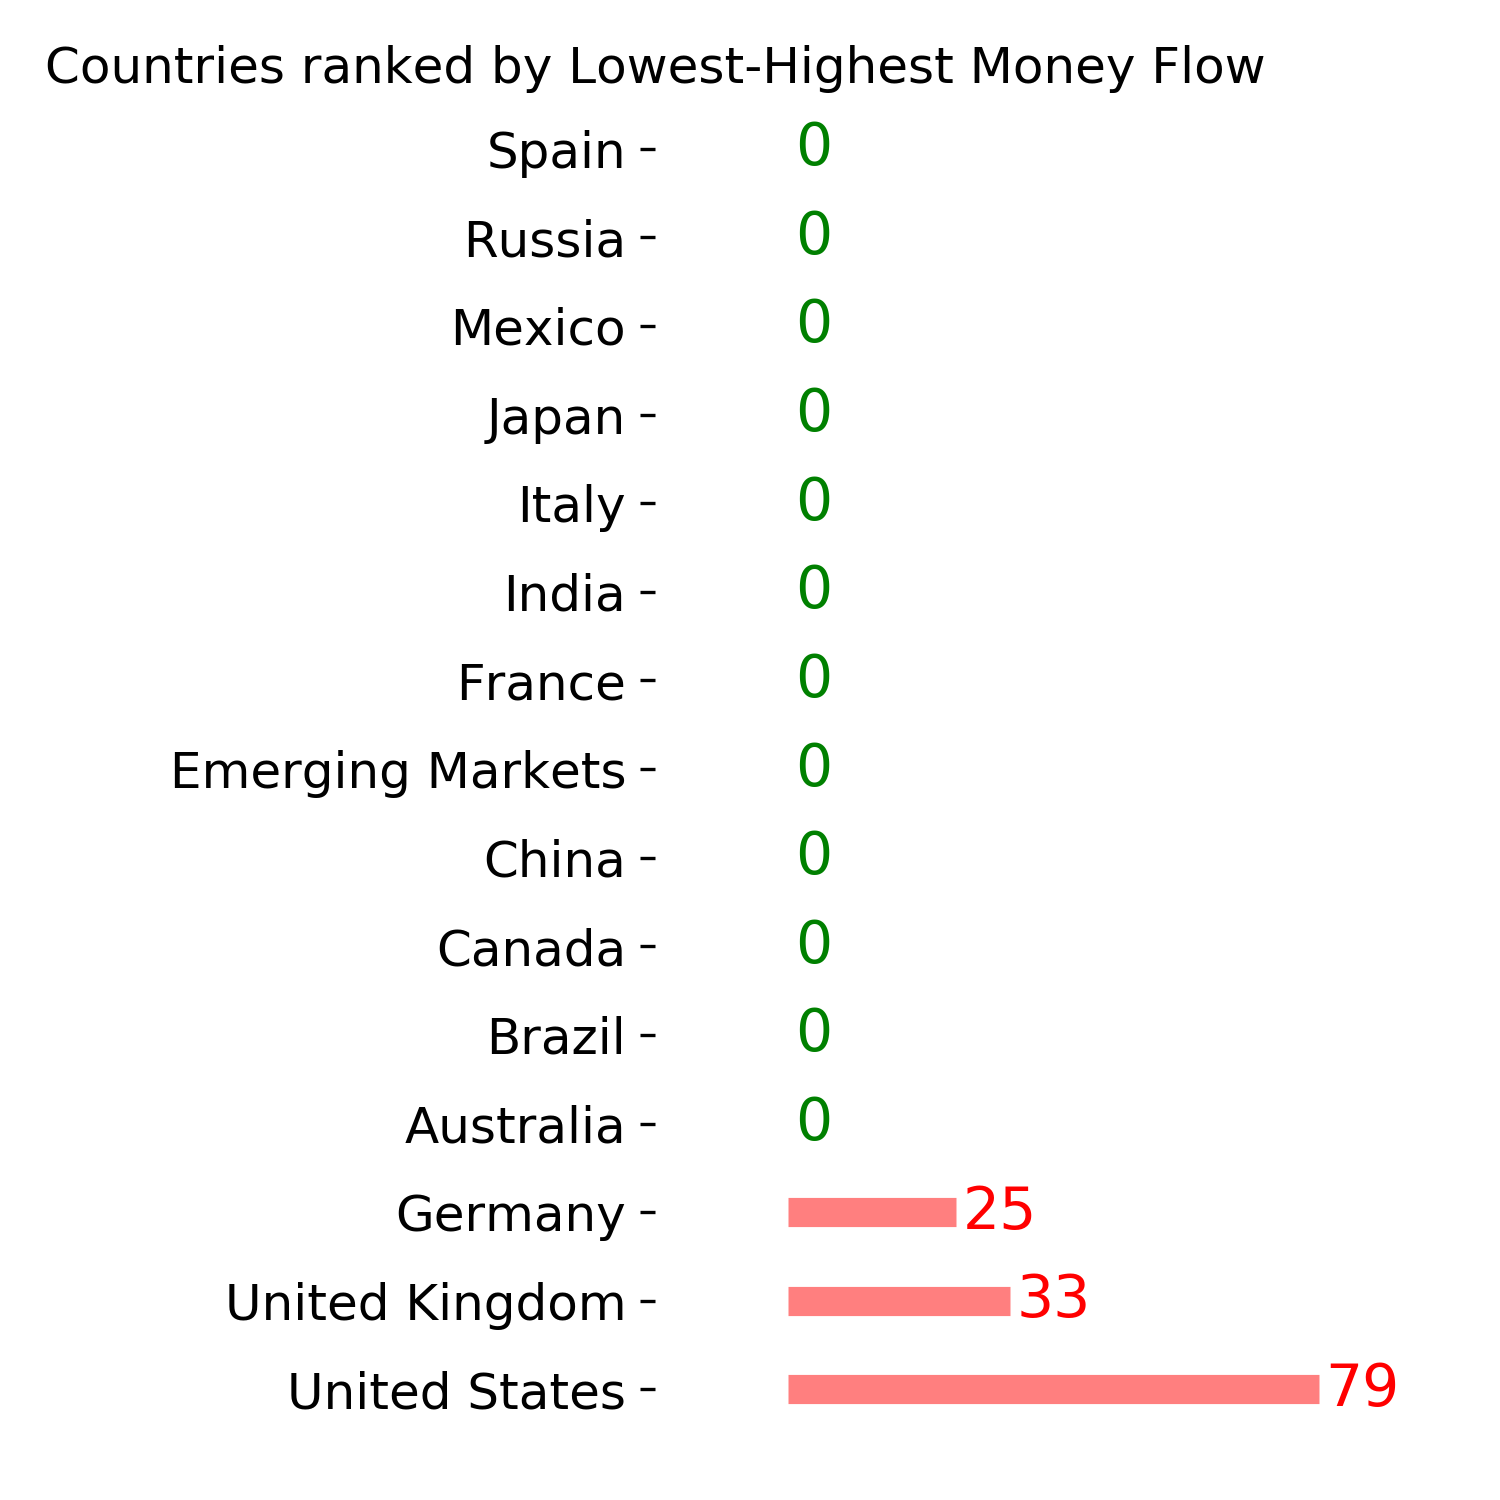
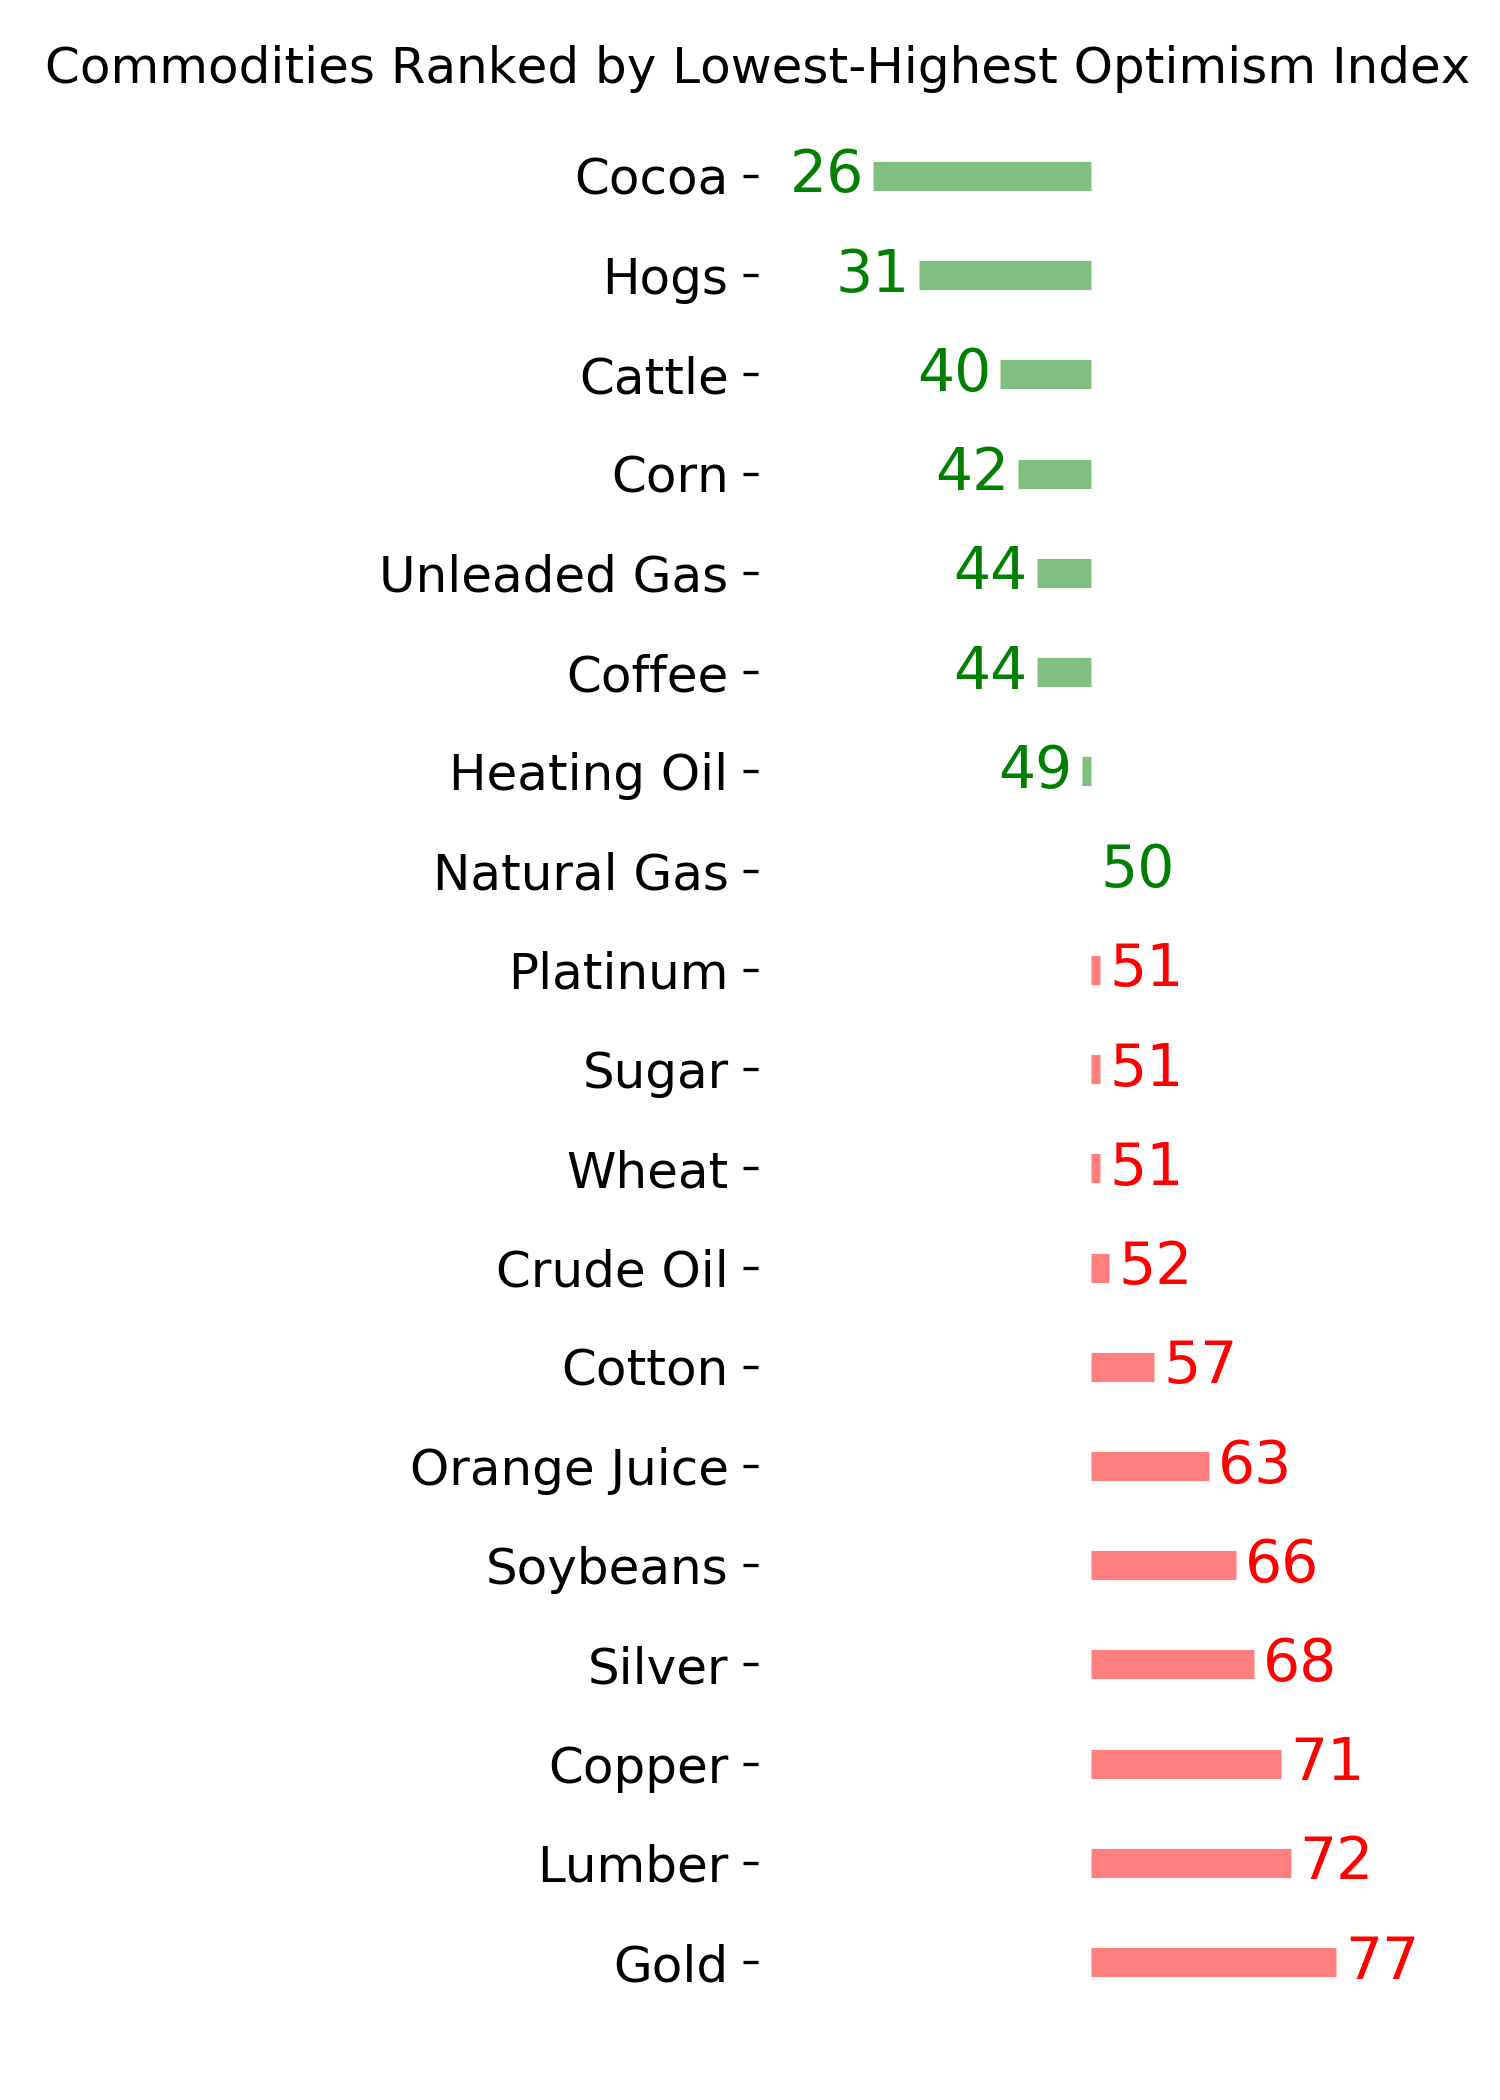
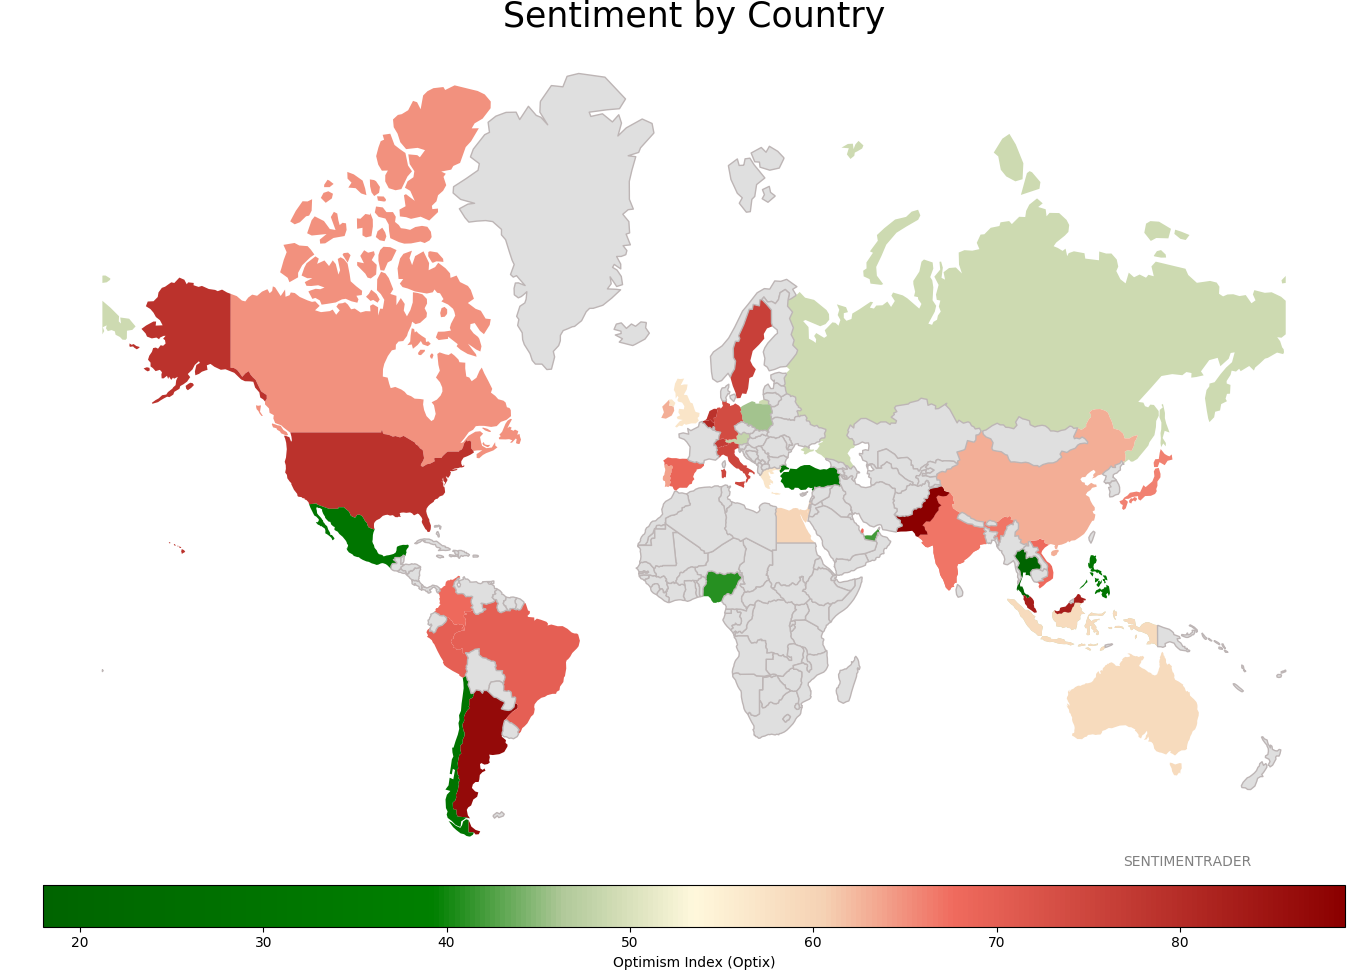
Sentiment Around The World
Optimism Index Thumbnails
|
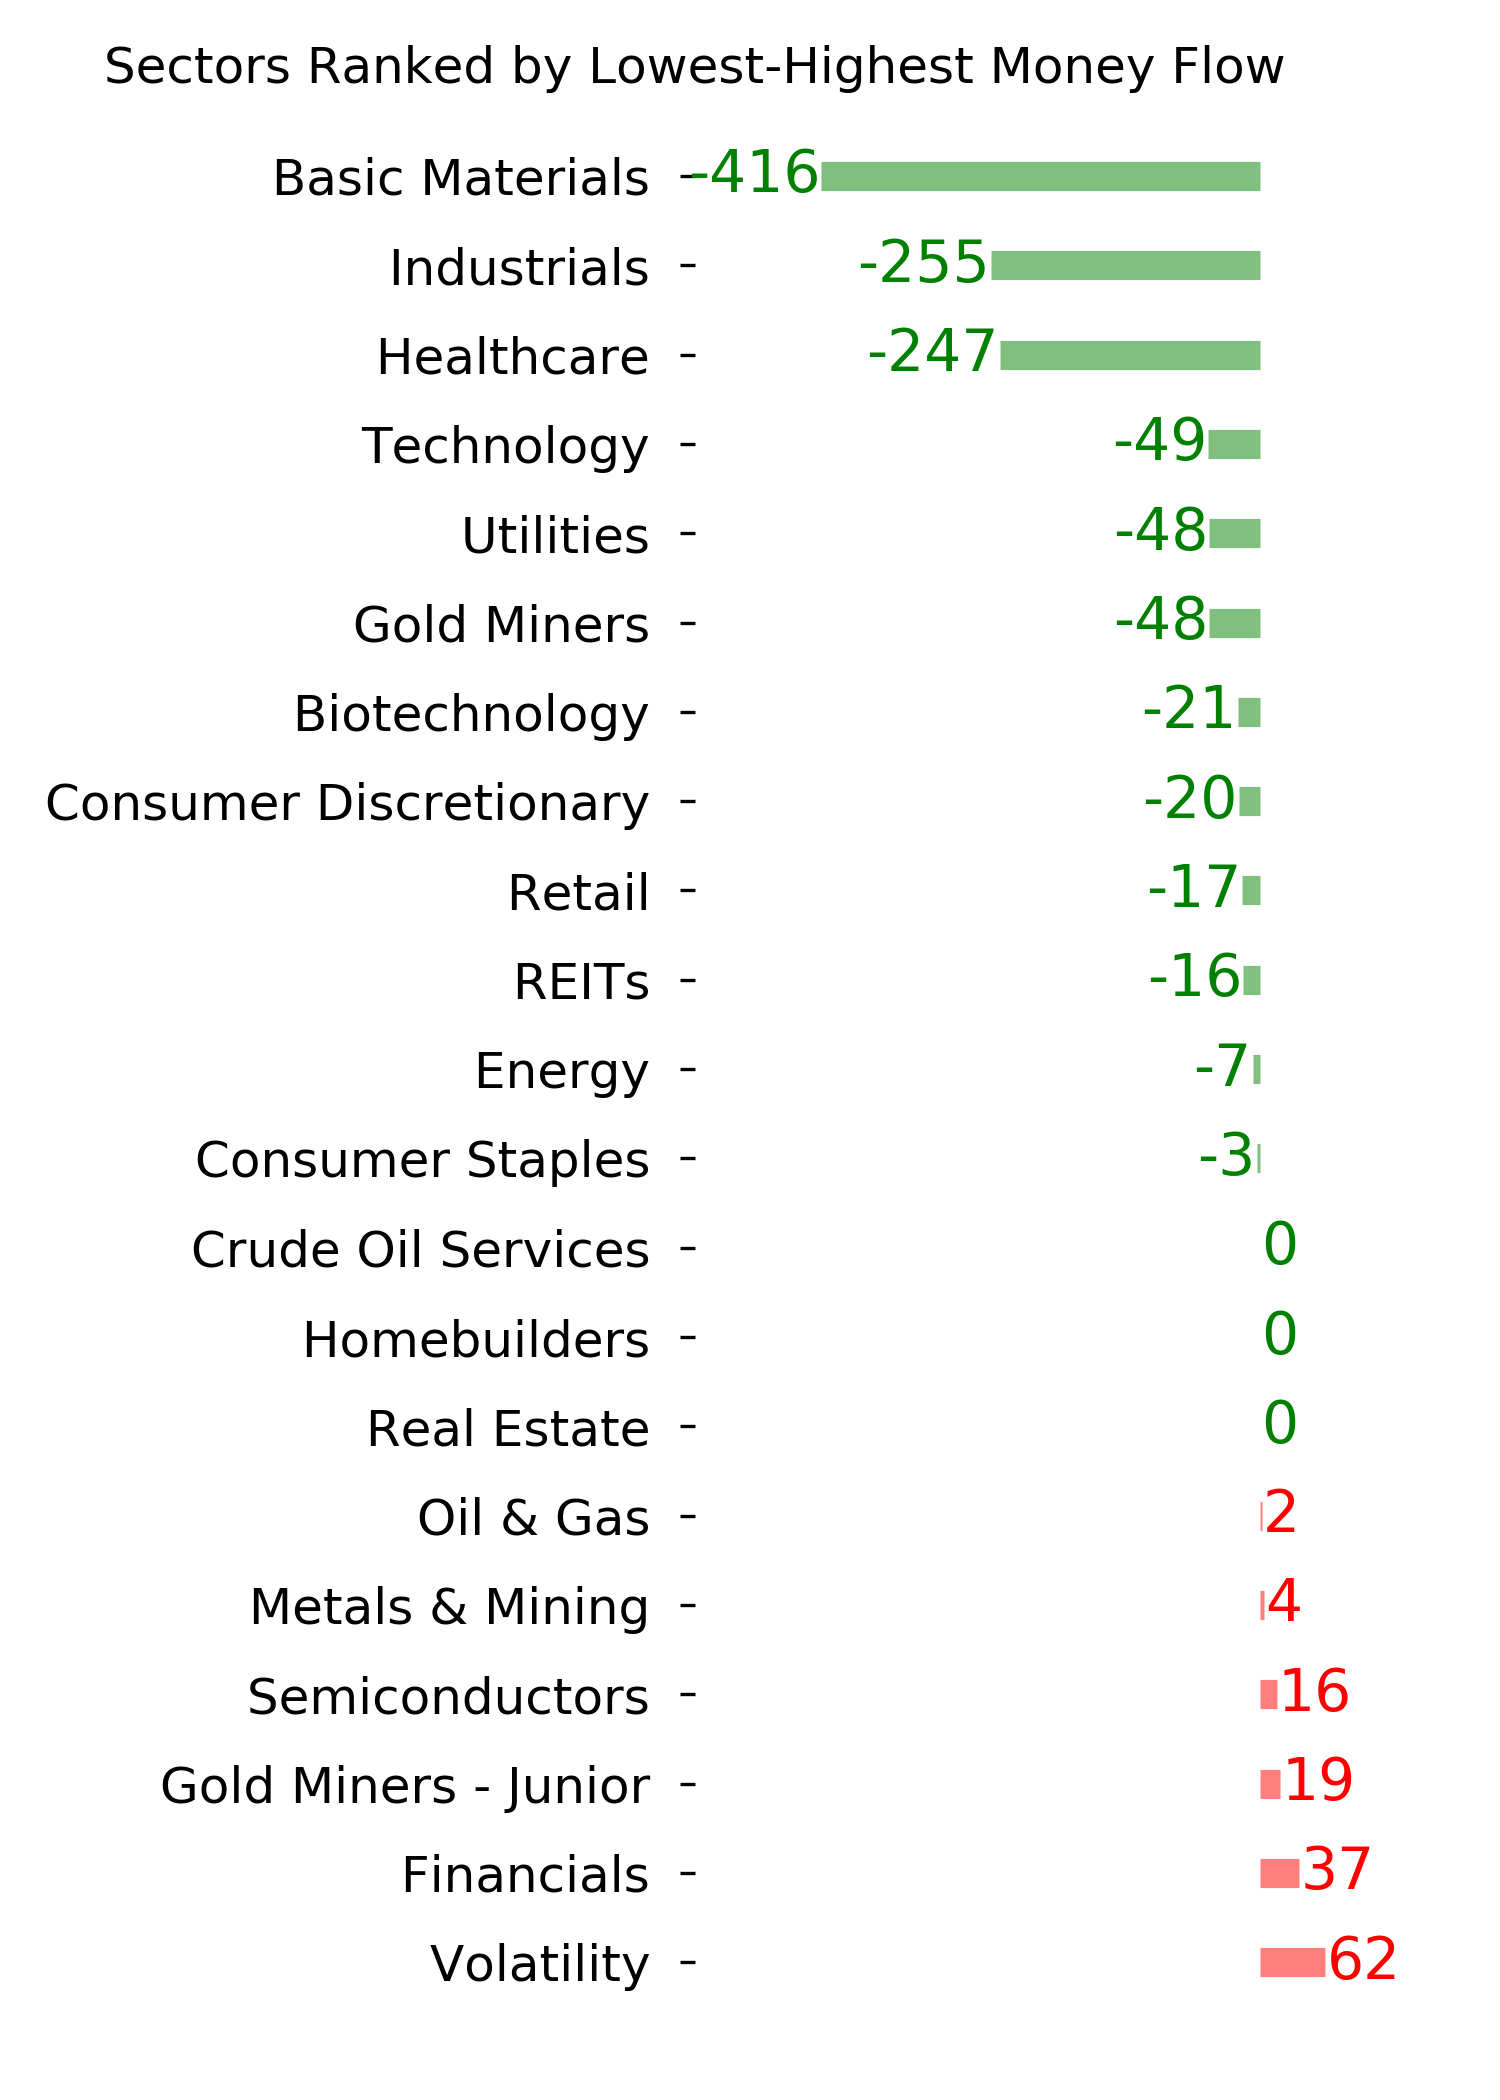
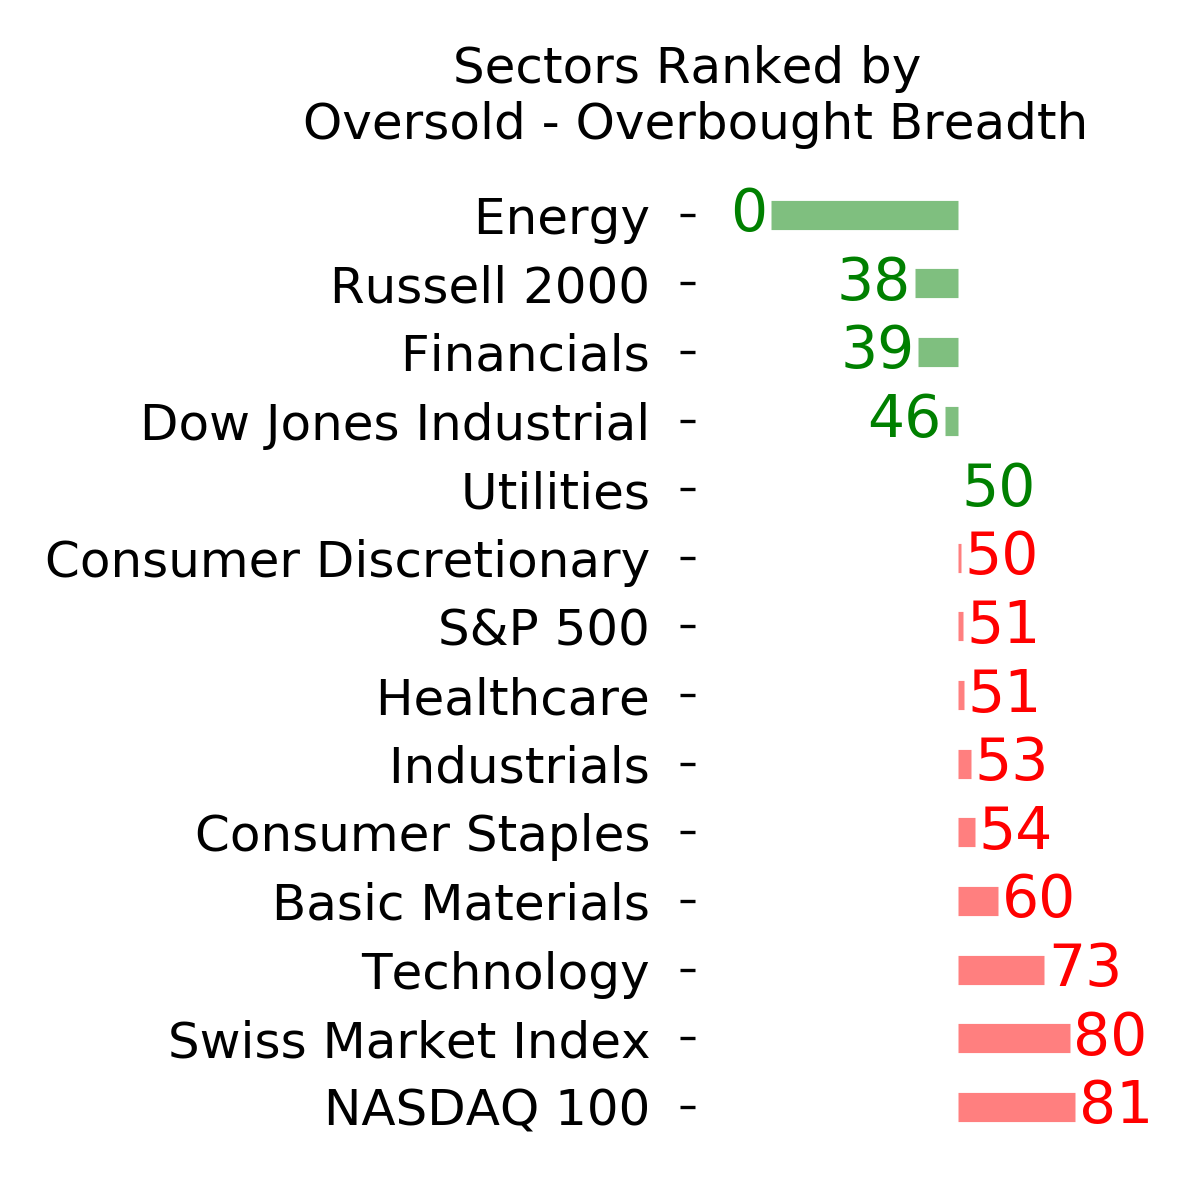
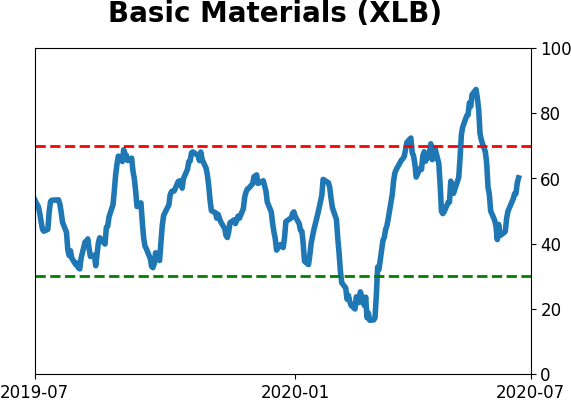
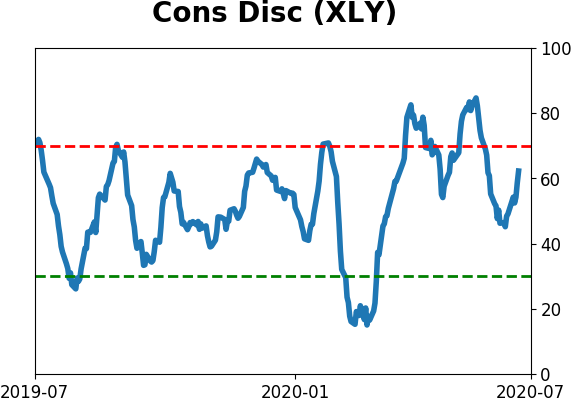
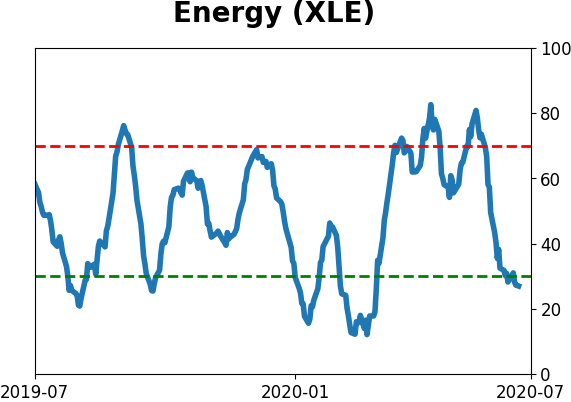
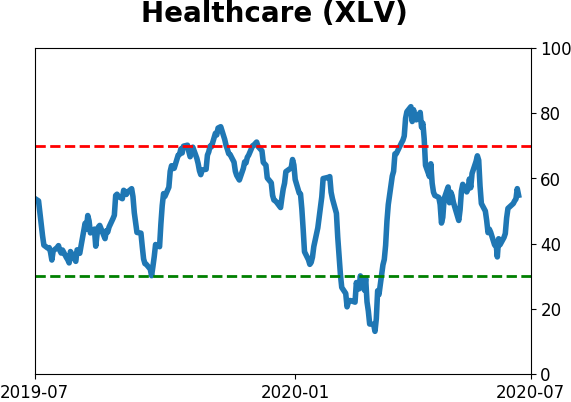
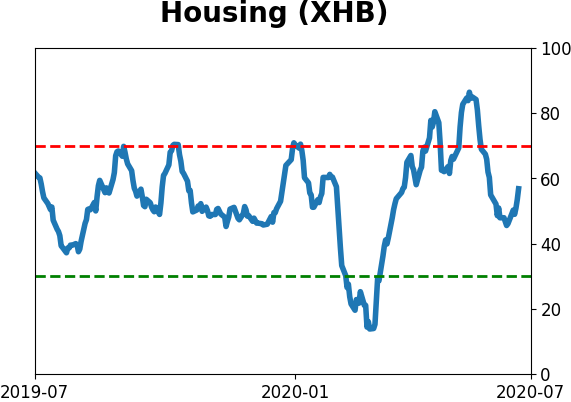
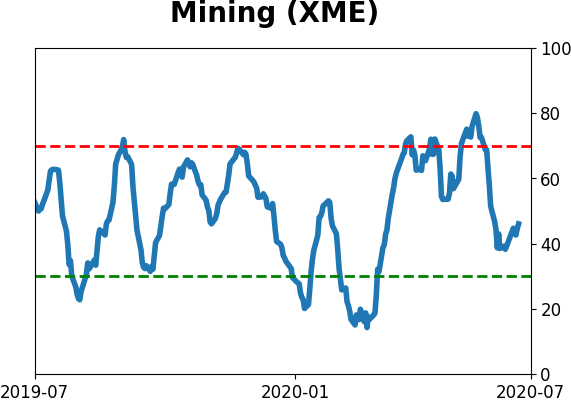
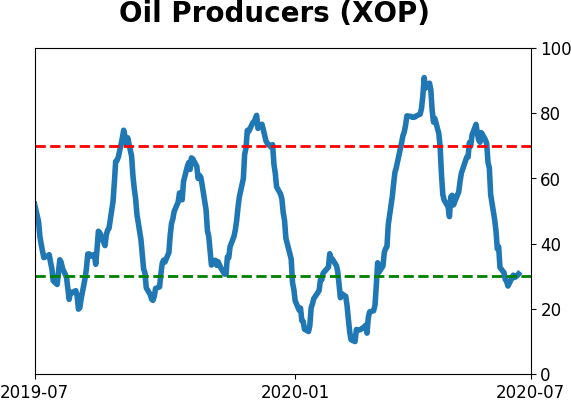
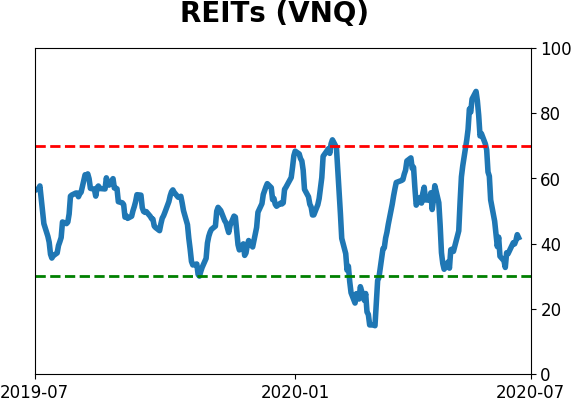
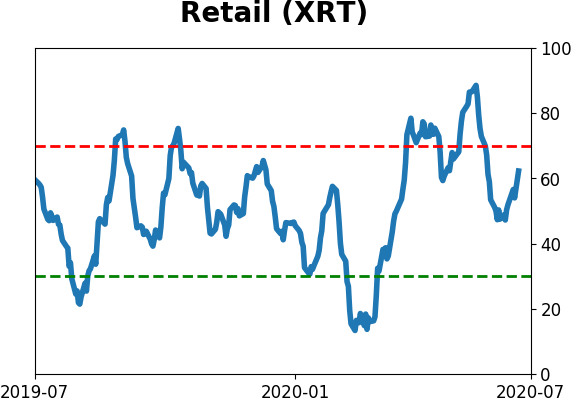
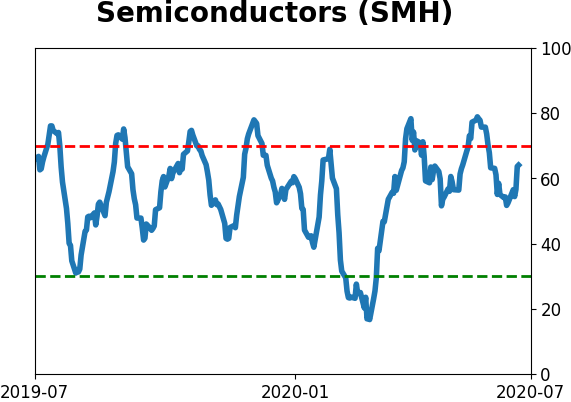
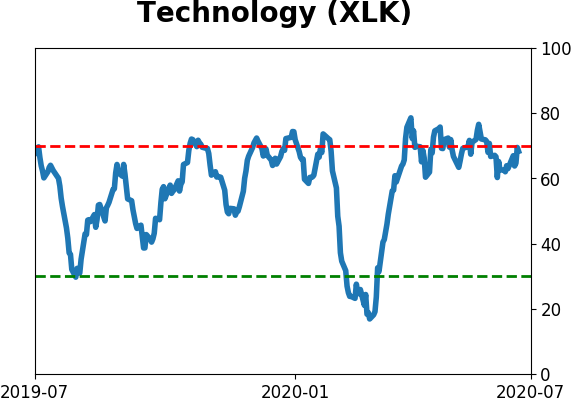
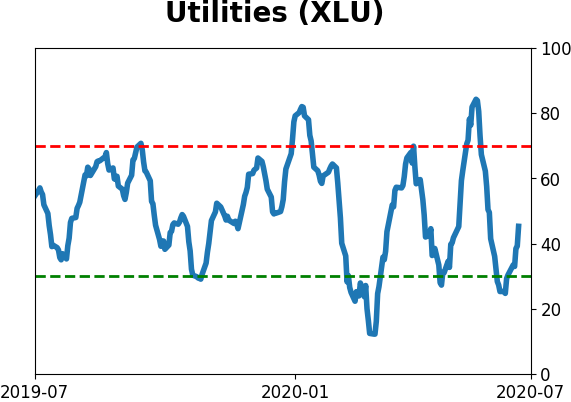
Sector ETF's - 10-Day Moving Average
|
|
|
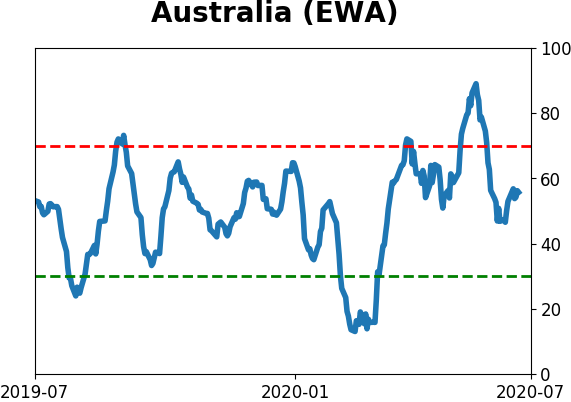
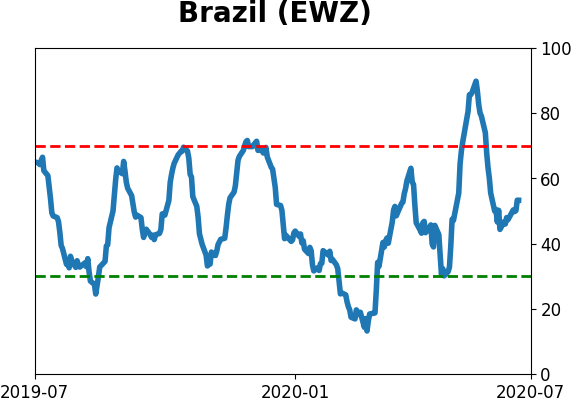
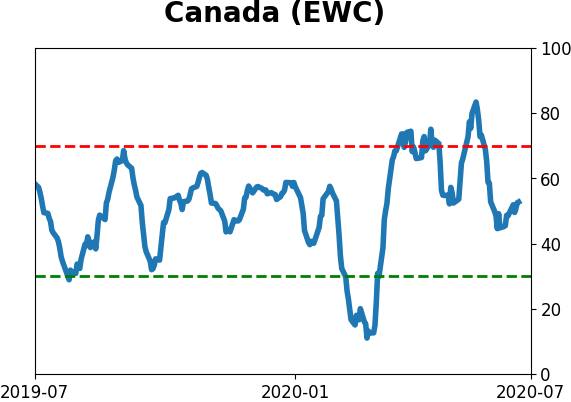
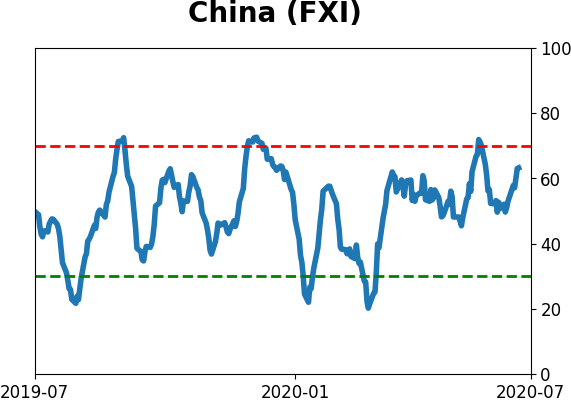
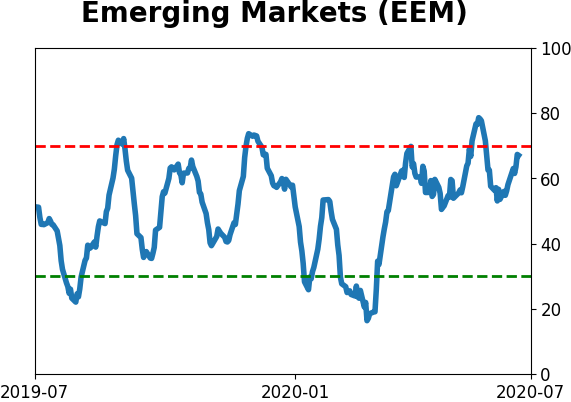
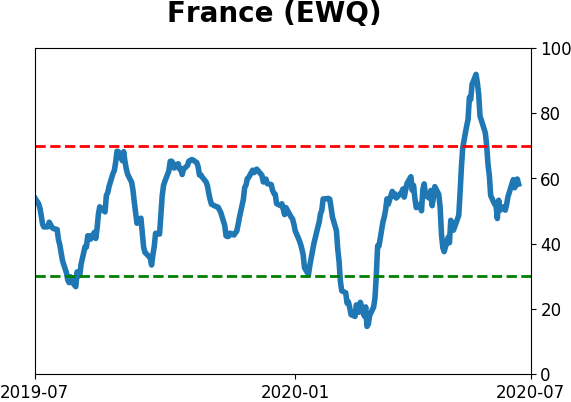
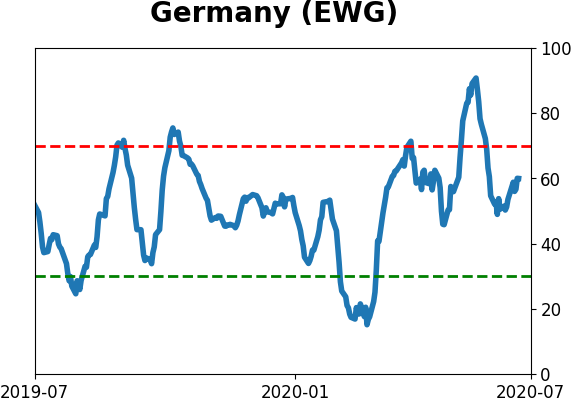
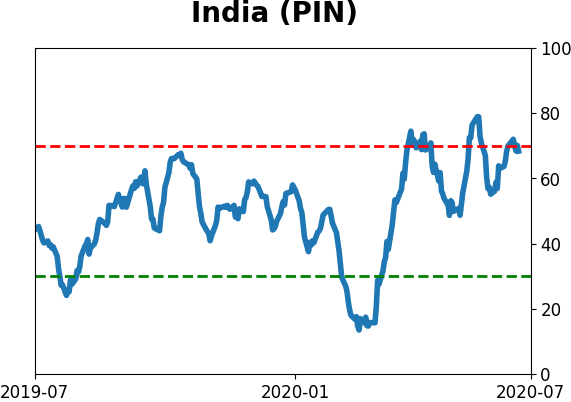
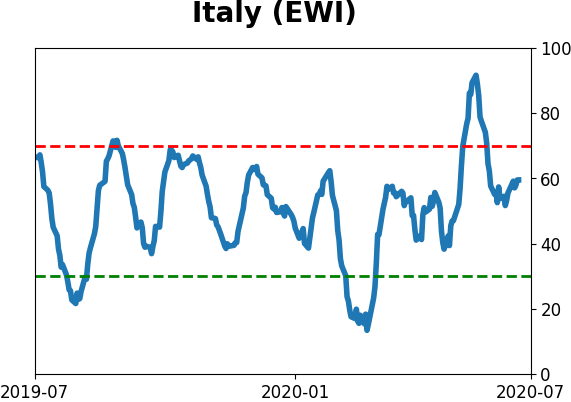
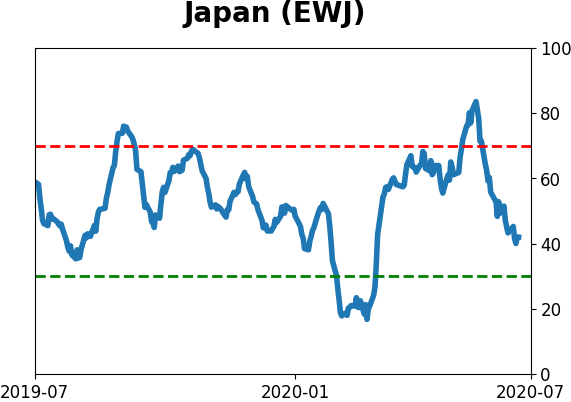
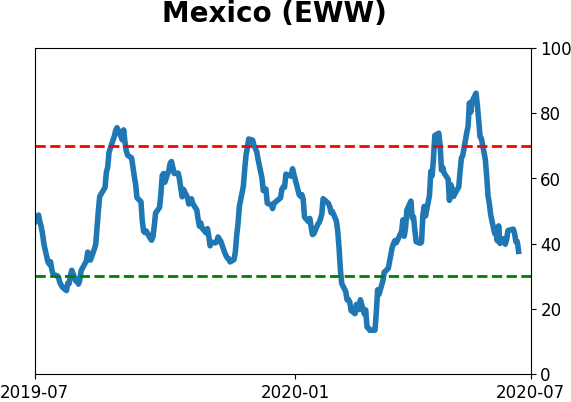
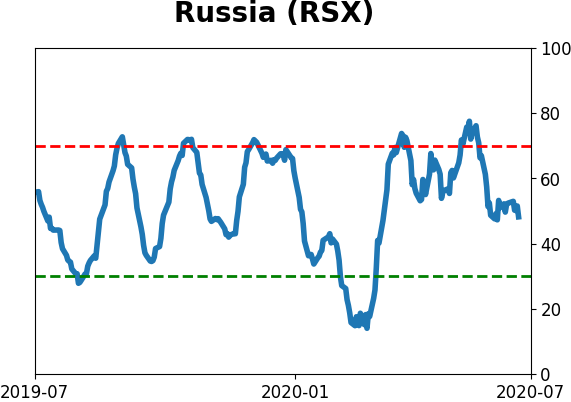
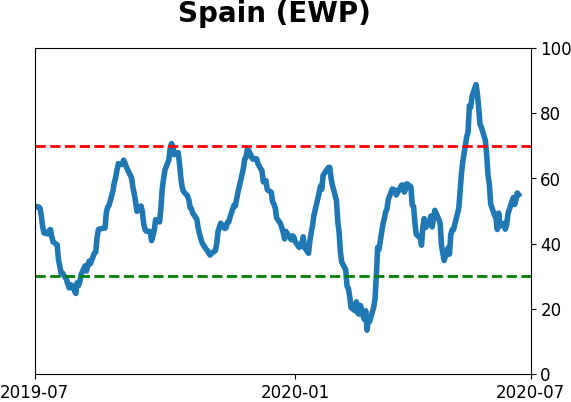
Country ETF's - 10-Day Moving Average
|
|
|
Bond ETF's - 10-Day Moving Average
|
|
|
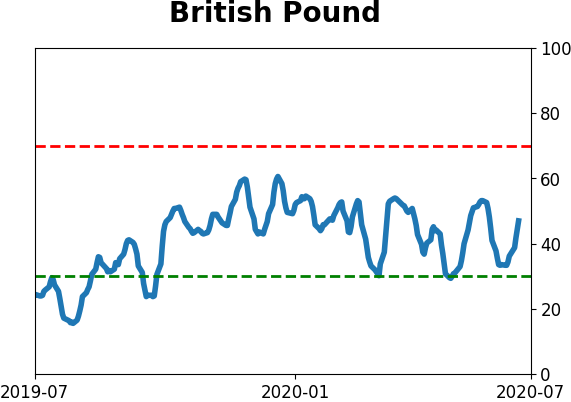
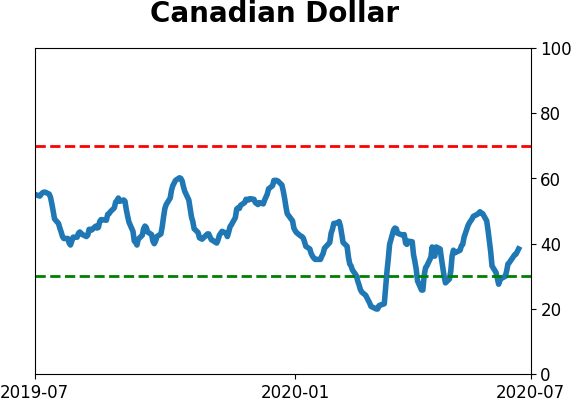
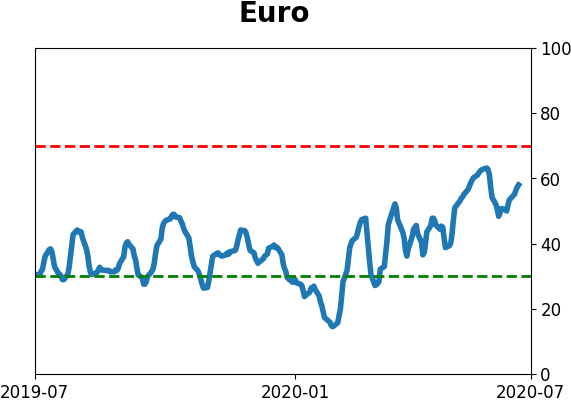
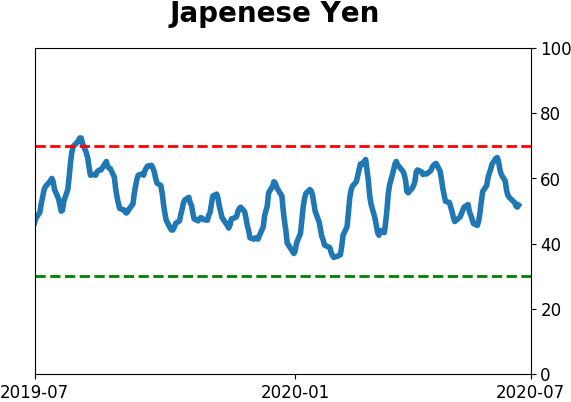
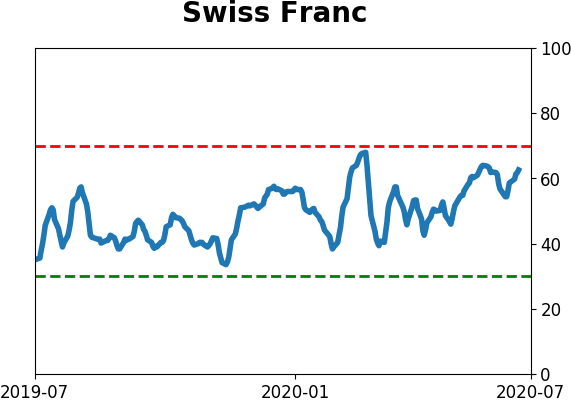
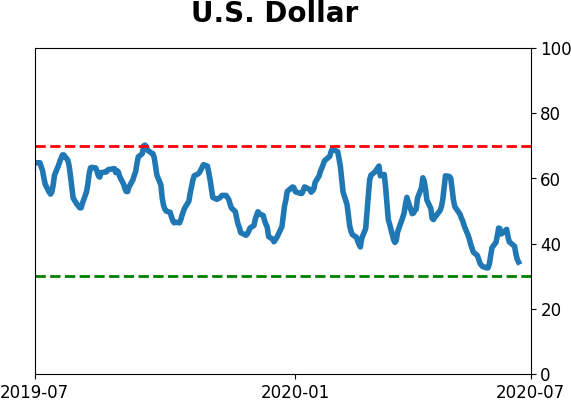
Currency ETF's - 5-Day Moving Average
|
|
|
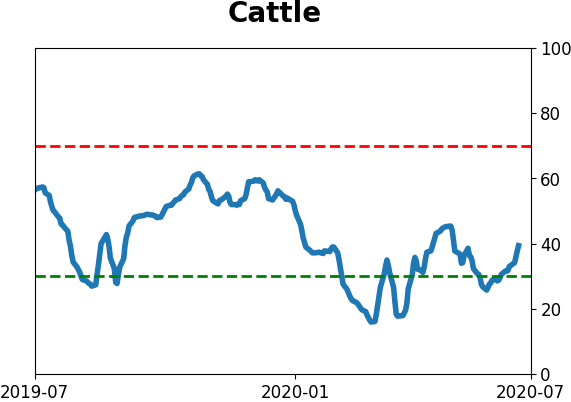
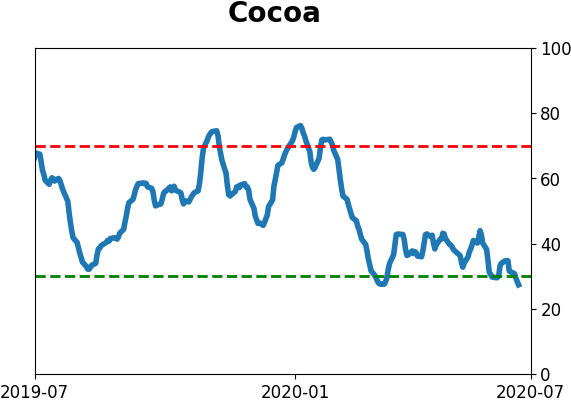
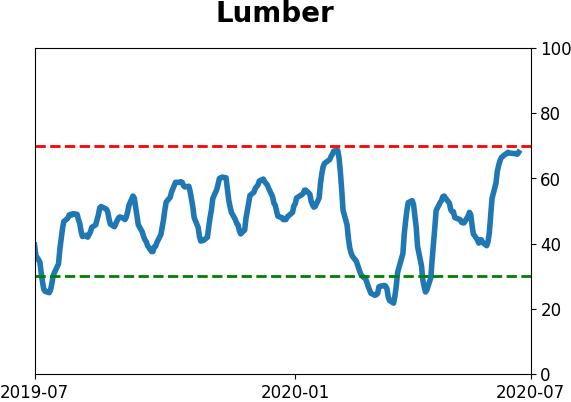
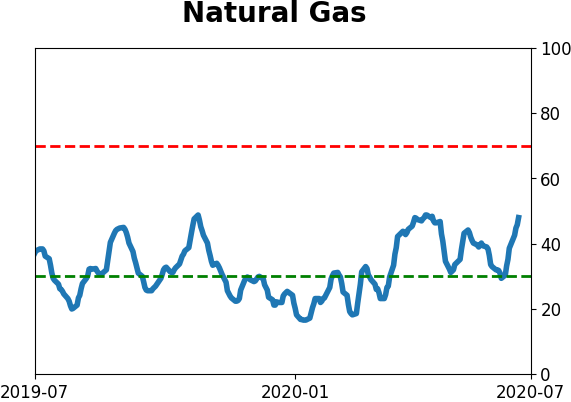
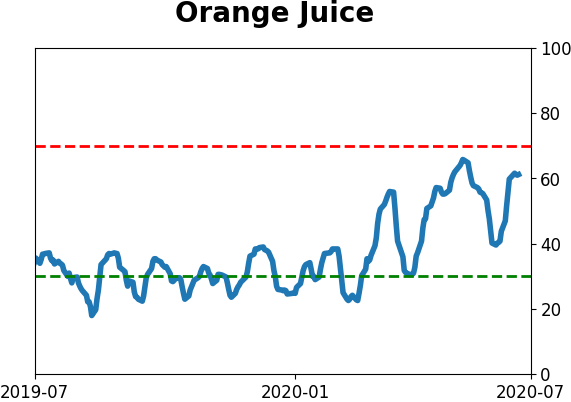
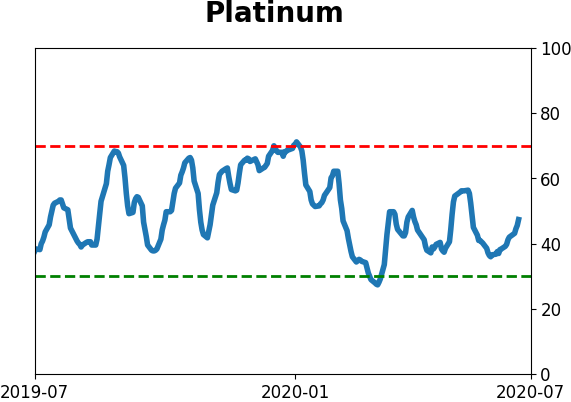
Commodity ETF's - 5-Day Moving Average
|
|