Headlines
|
|
The S&P 500 and dollar undergo trend changes:
The S&P 500 has triggered a Golden Cross, with its 50-day average crossing above its 200-day average. That in itself isn't much of a signal, but this has reversed what had been a very negative spread between the 50- and 200-day averages. When this happened since 1950, it coincided with the end of every major bear market. At the same time, the dollar suffered a Death Cross.
As tech indexes rally, participation starts to wane:
Most major technology stock indexes have been hitting new highs in recent days. A small warning is popping up in the percentage of members of these indexes that are holding above their 50-day averages, which has been declining over the past month. This kind of divergence has preceded some rocky markets for tech over the next 1-3 months.
UnQQQuenchable: Buyers were enthused enough to push the QQQ Nasdaq 100 fund to a large opening gain, then an early selloff showed a modest intraday loss before un-quenchable buyers returned. This pattern of > 0.5% open, < -0.5% intraday loss, and > 0.5% closing gain to a 52-week high hasn't been seen often in the fund. The only times in its history were during 1999 and 2000. The dates were 1999-11-12, 1999-12-10, 2000-01-03, 2000-02-03, 2000-02-24, 2000-03-06, and 2000-03-24.
Bottom Line:
- Weight of the evidence has been suggesting flat/lower stock prices short- to medium-term, though that turned more neutral as stocks pulled back recently; still suggesting higher prices long-term
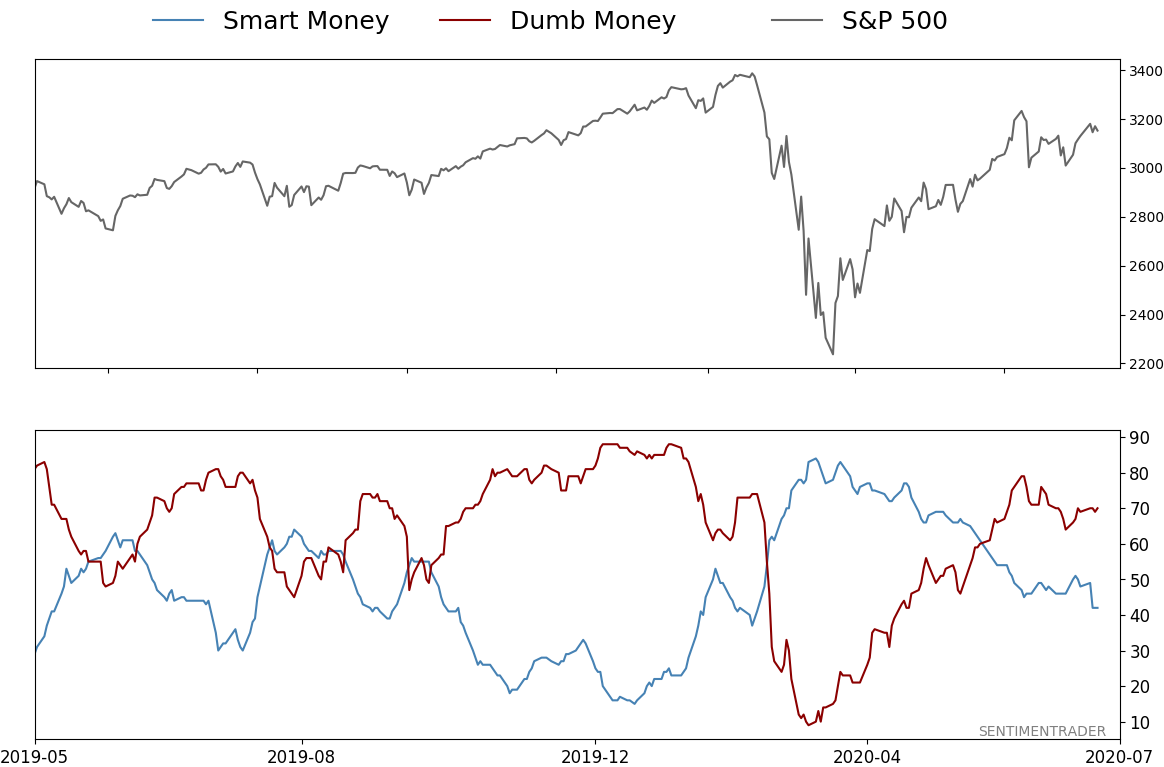
- Indicators show high and declining optimism, as Dumb Money Confidence neared 80% in early June with signs of reckless speculation and historic buying pressure, during what appears to be an unhealthy market environment
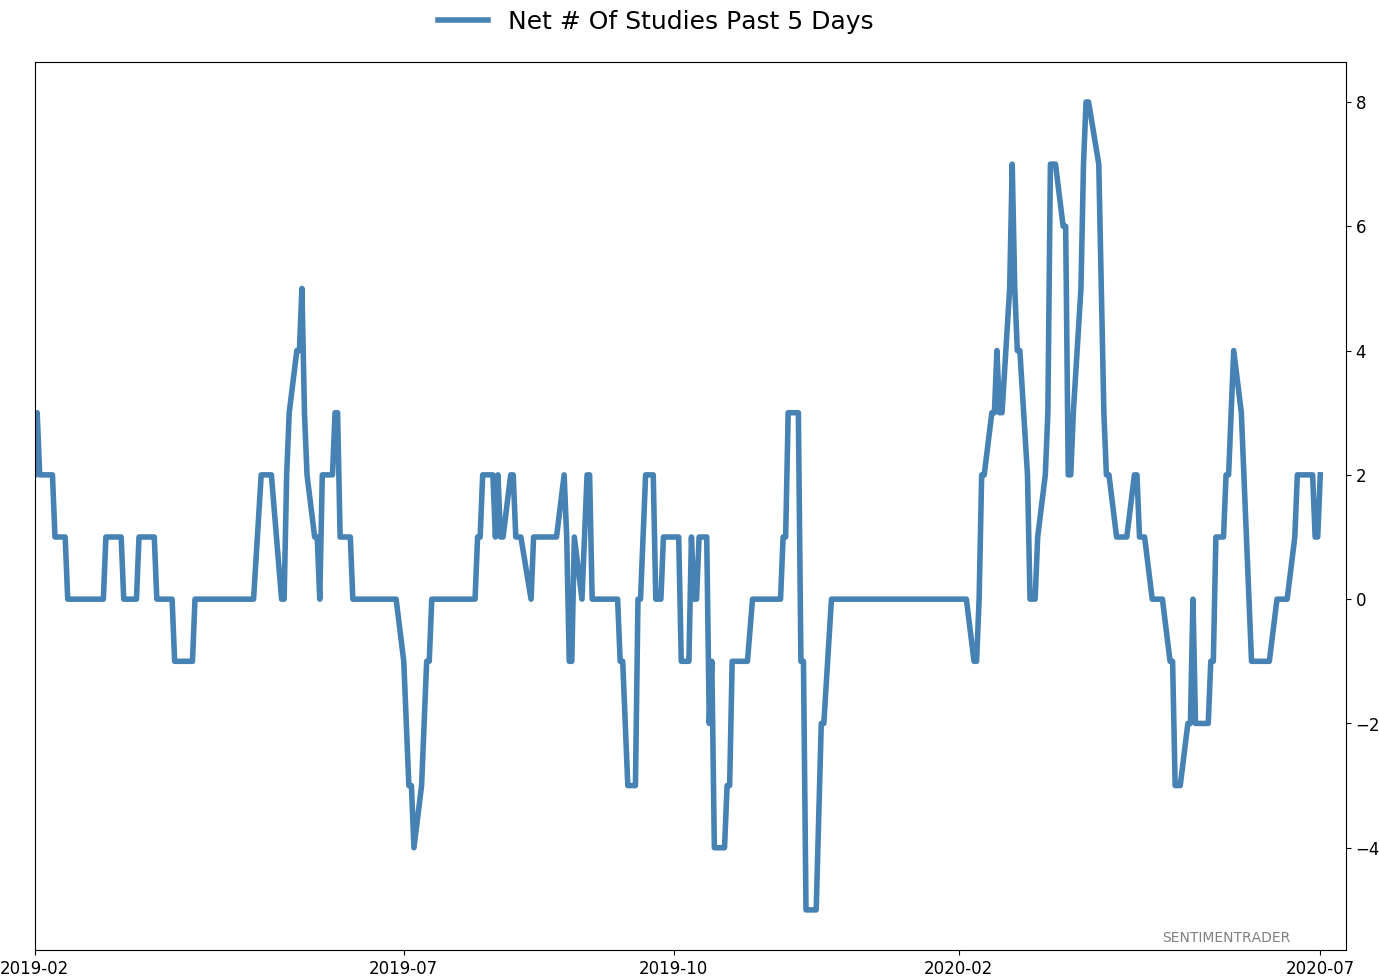
- Active Studies show a heavy positive skew over the medium- to long-term; breadth thrusts, recoveries, and trend changes have an almost unblemished record at preceding higher prices over a 6-12 month time frame
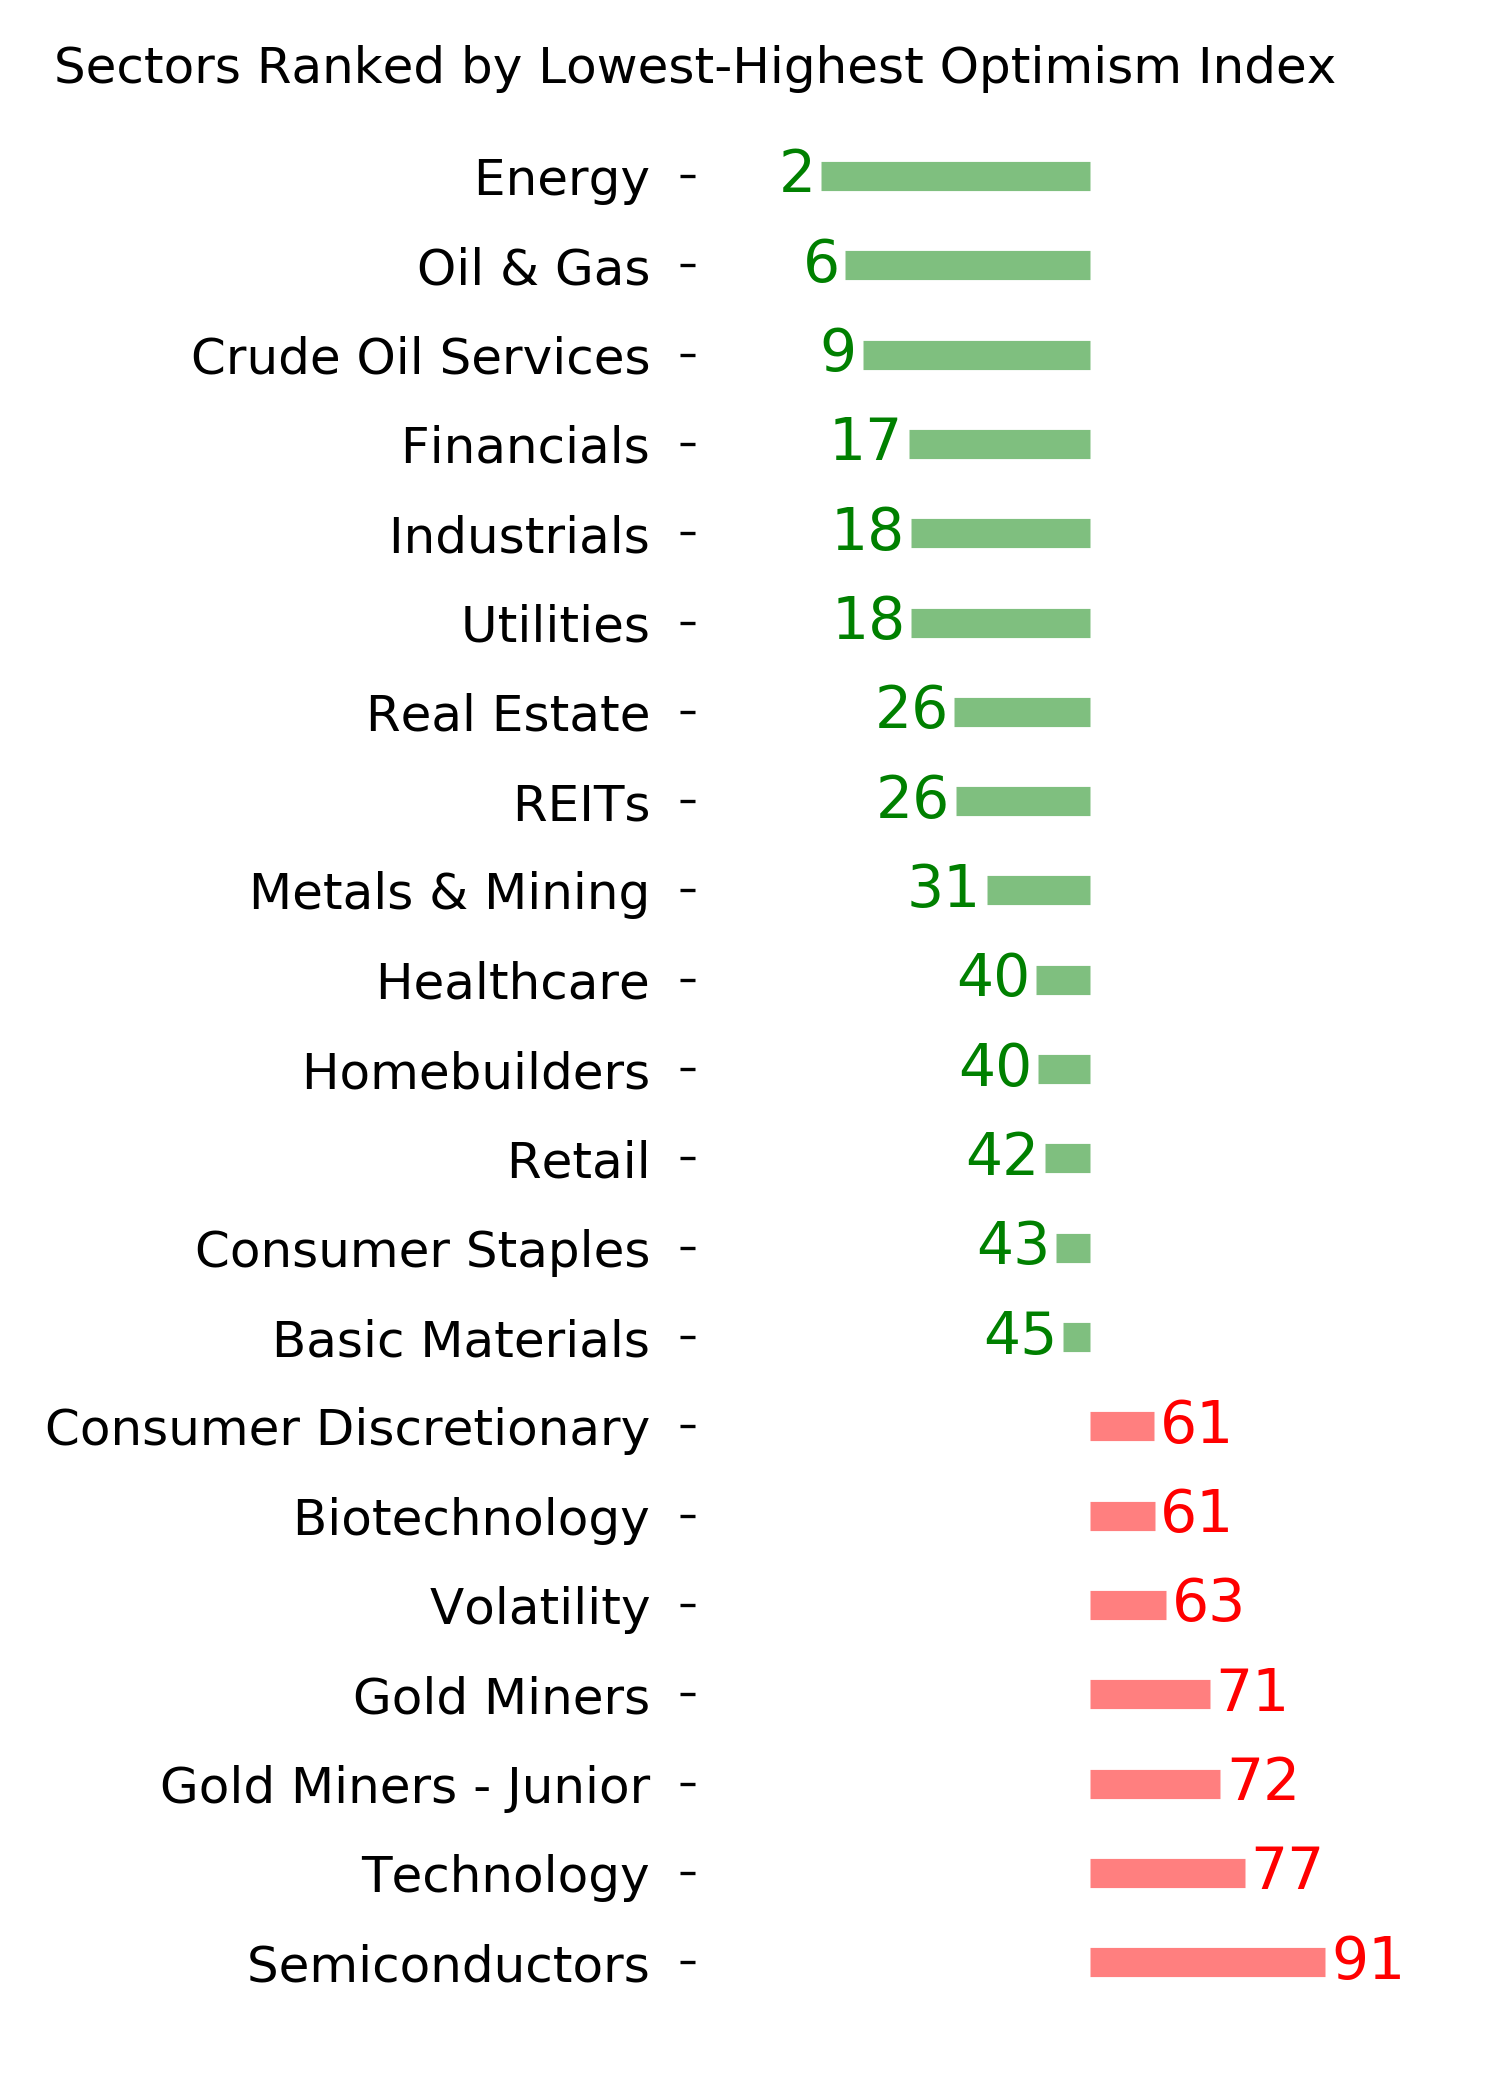
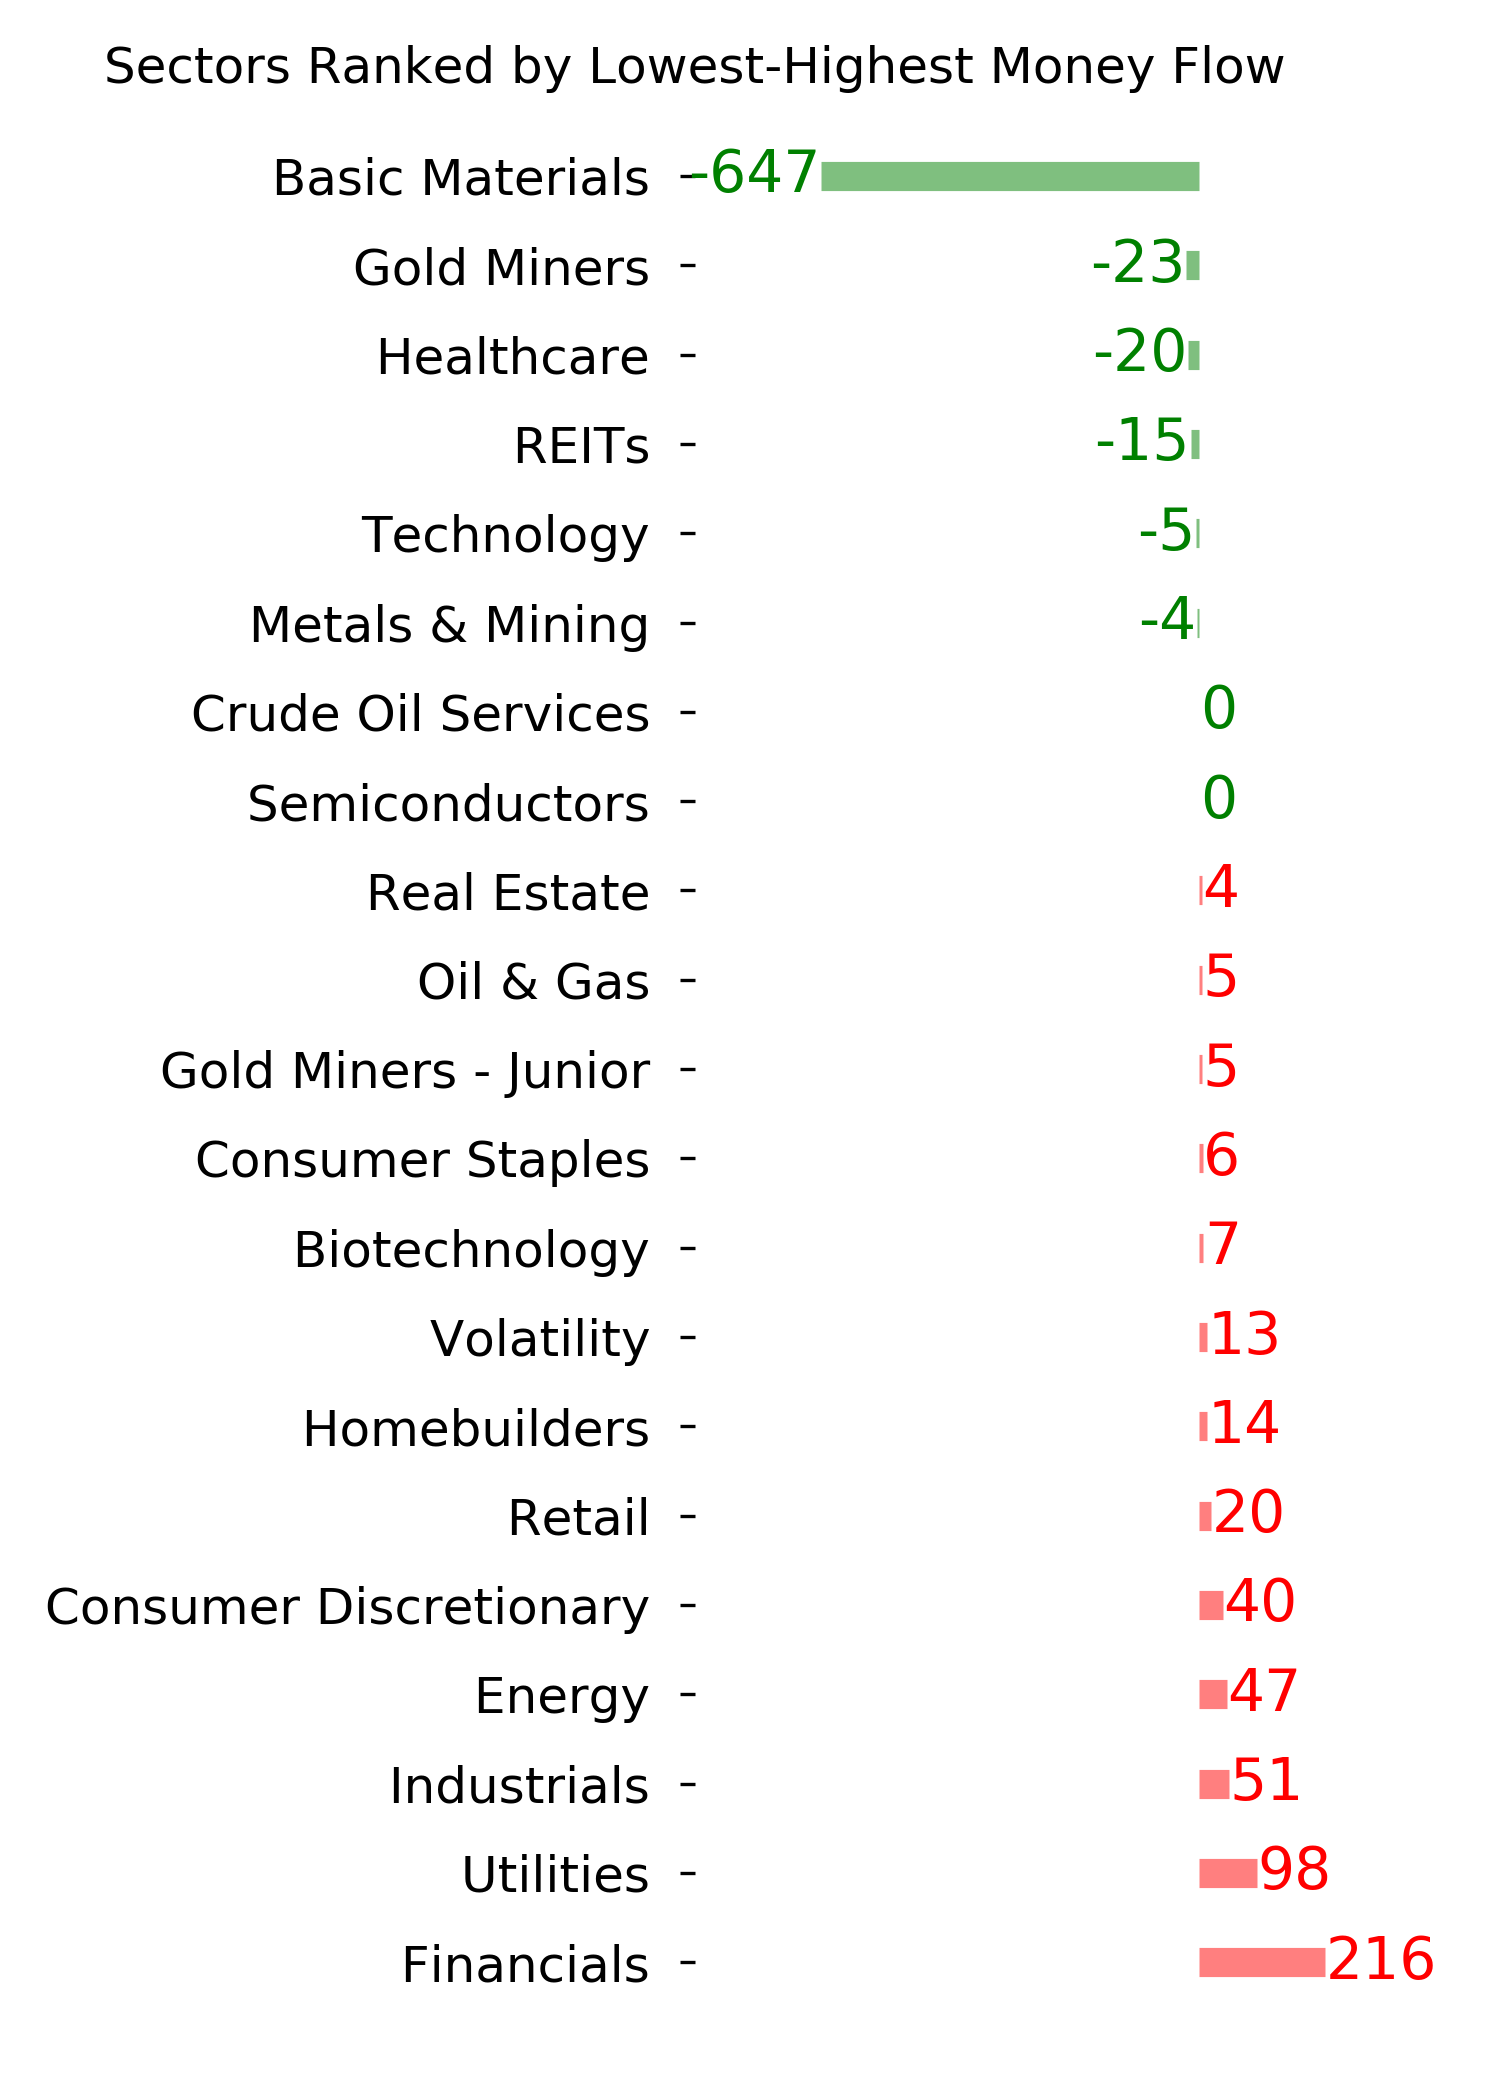
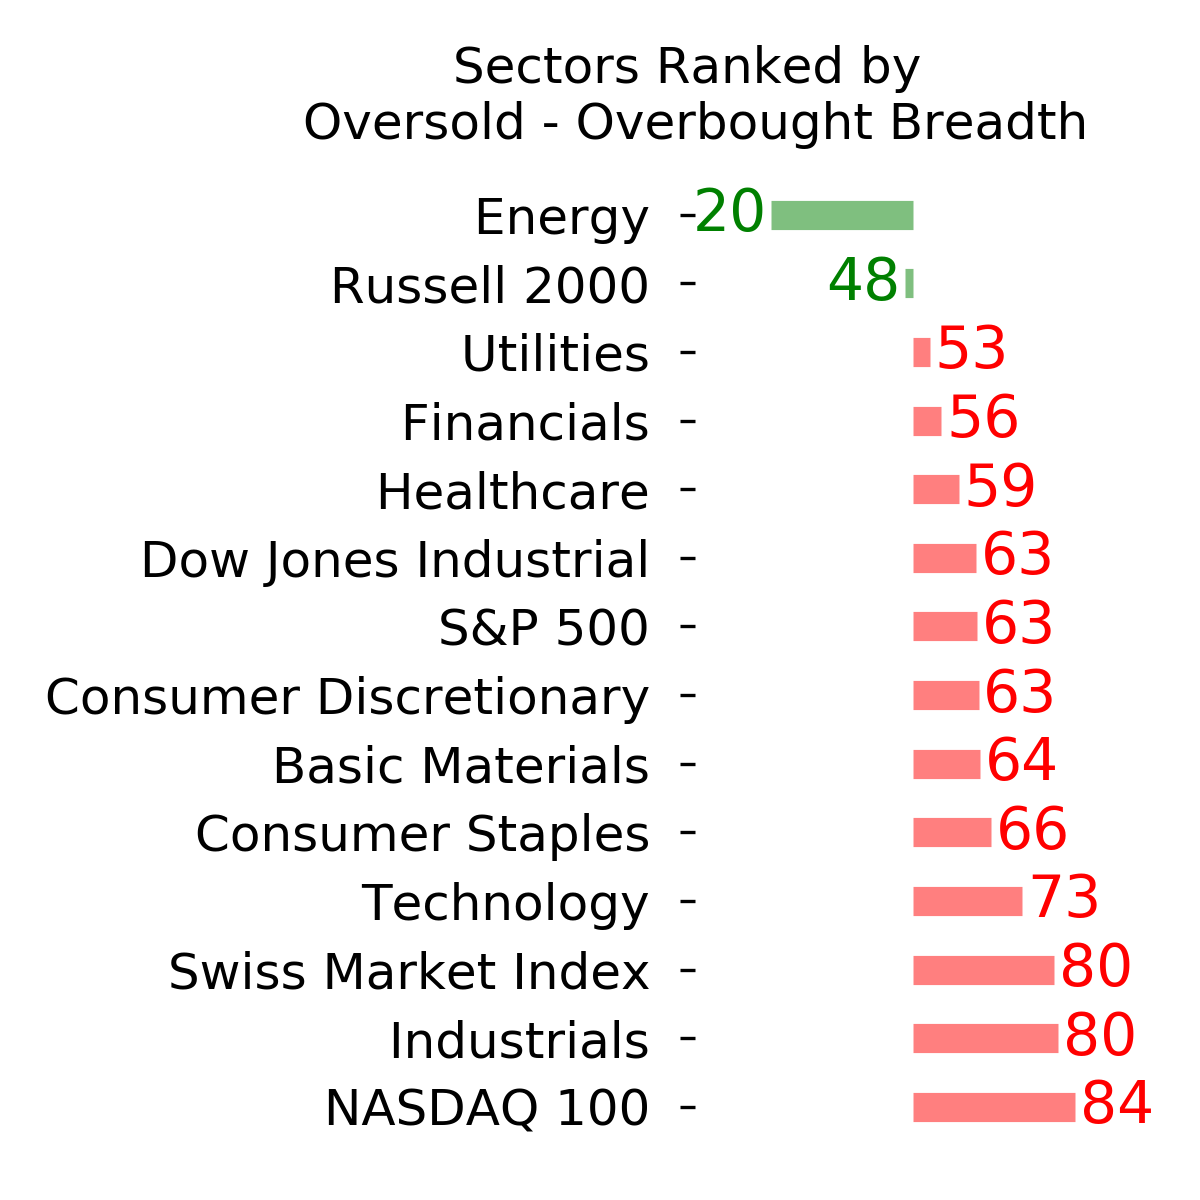
- Signs of extremely skewed preference for tech stocks nearing exhaustion, especially relative to industrials and financials (here and here)
- Indicators and studies for other markets are mixed with no strong conclusion
|
Smart / Dumb Money Confidence
|
Smart Money Confidence: 42%
Dumb Money Confidence: 70%
|
|
Risk Levels
Stocks Short-Term
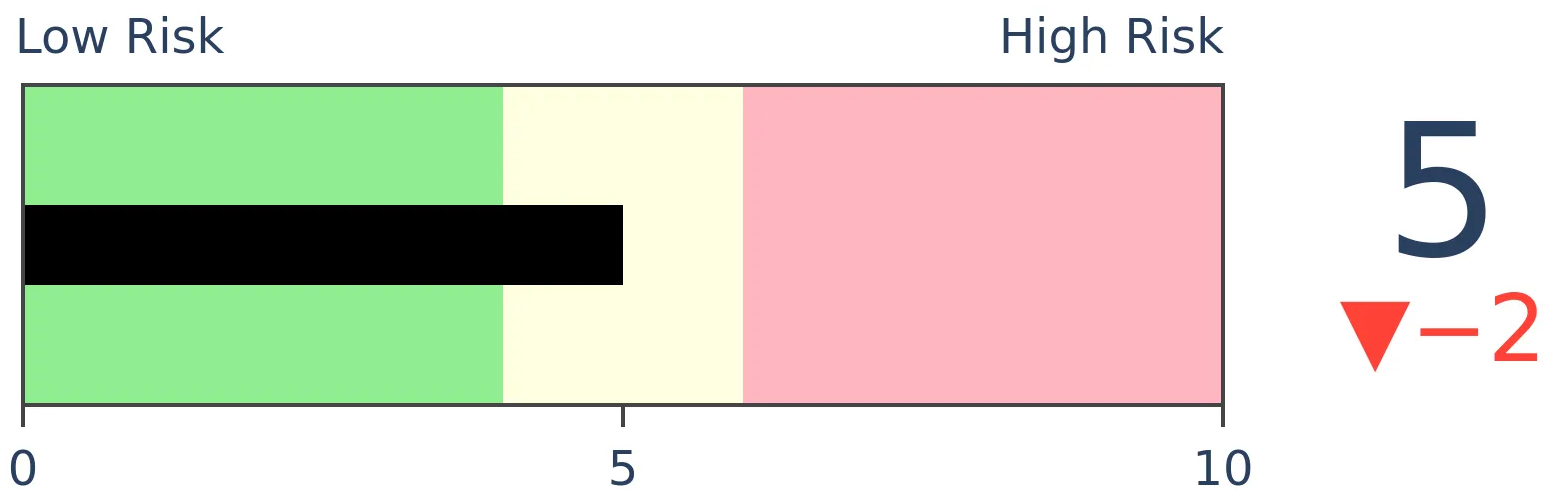
|
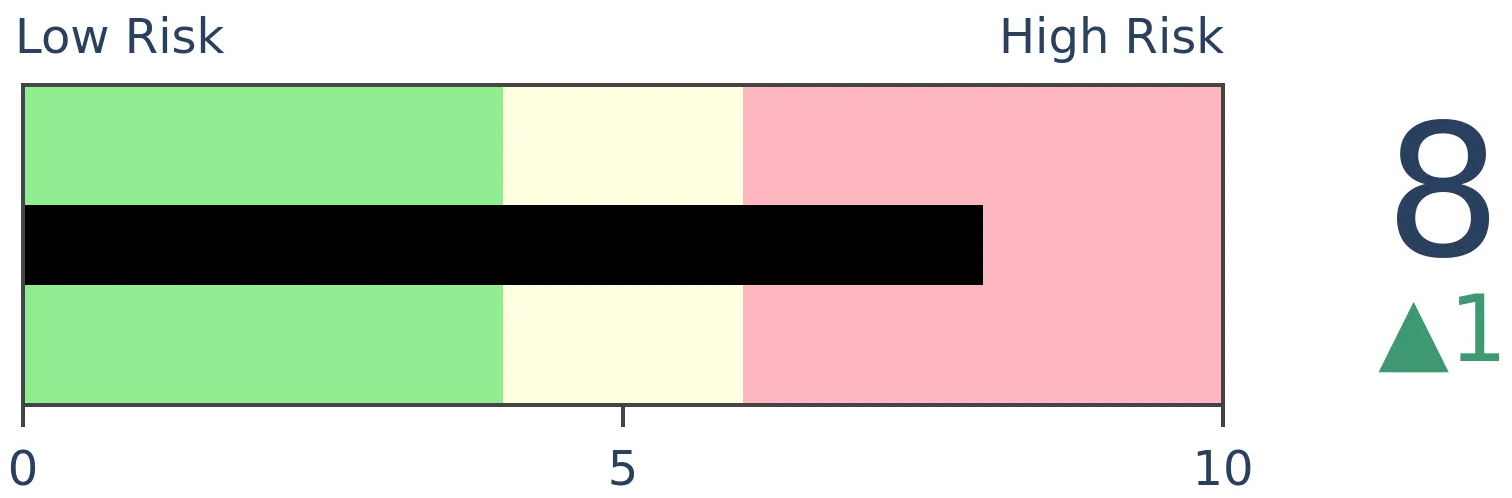
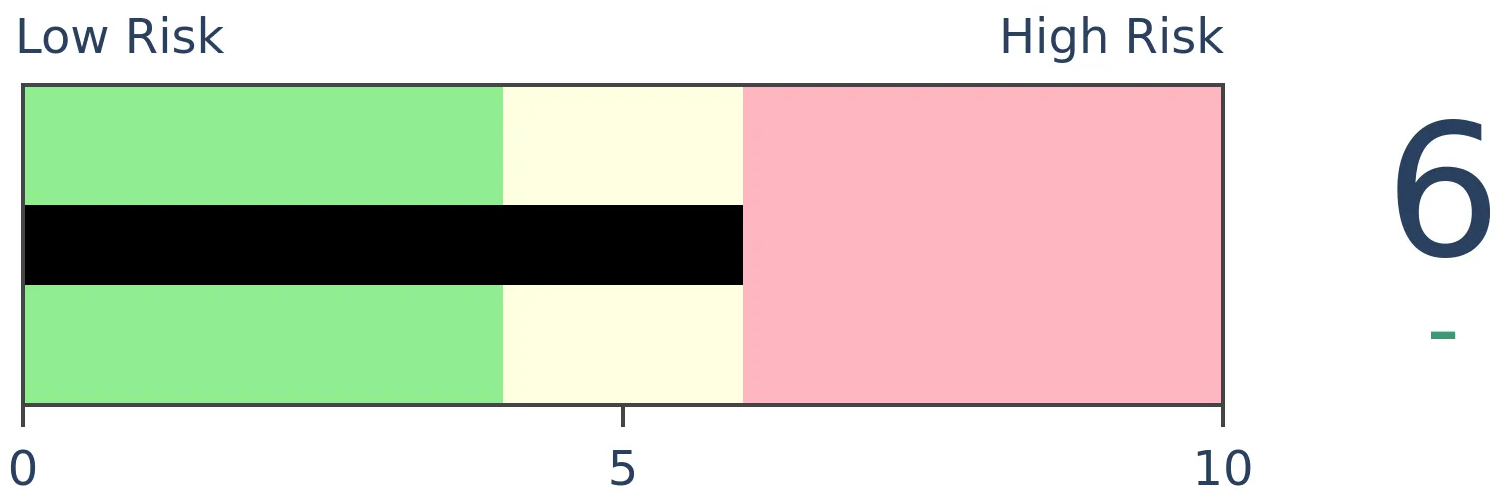
Stocks Medium-Term

|
|
Bonds

|
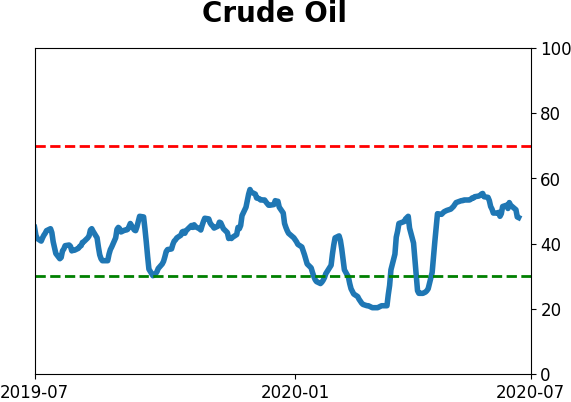
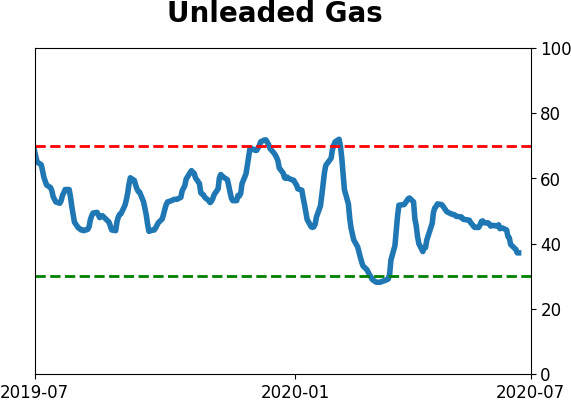
Crude Oil
|
|
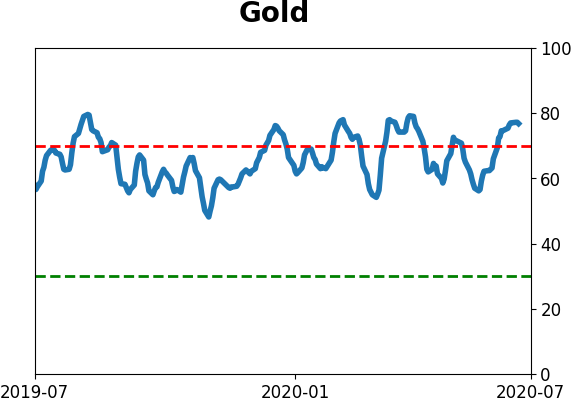
Gold
|
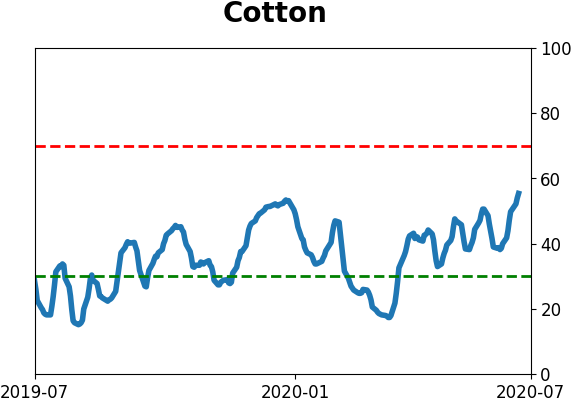
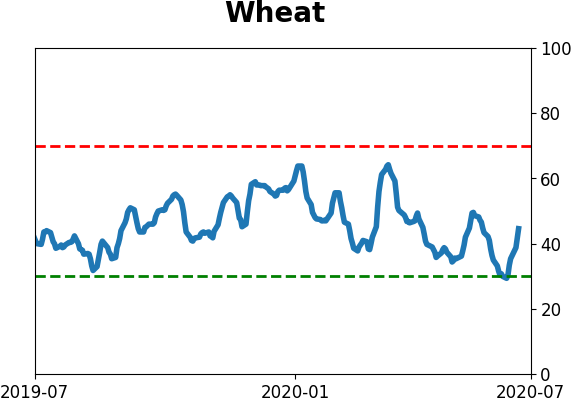
Agriculture

|
|
Research
BOTTOM LINE
The S&P 500 has triggered a Golden Cross, with its 50-day average crossing above its 200-day average. That in itself isn't much of a signal, but this has reversed what had been a very negative spread between the 50- and 200-day averages. When this happened since 1950, it coincided with the end of every major bear market. At the same time, the dollar suffered a Death Cross.
FORECAST / TIMEFRAME
SPY -- Up, Long-Term
|
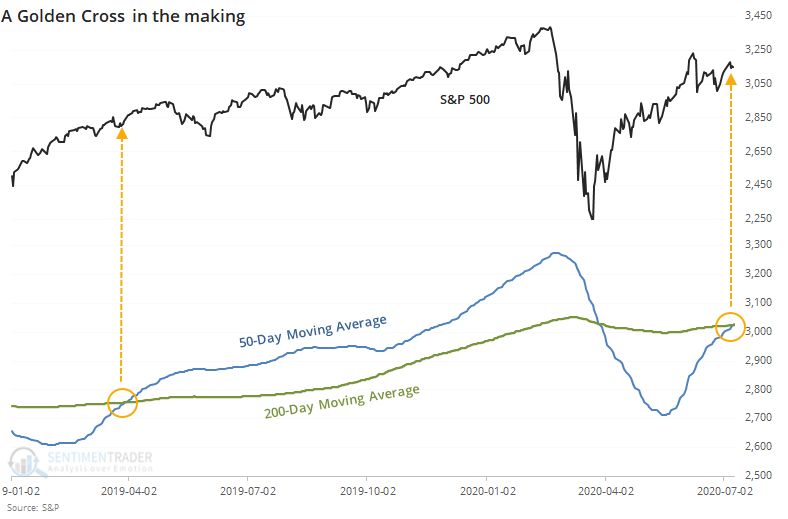
Barring some kind of disaster on Thursday, the S&P 500 will enjoy a Golden Cross, where the 50-day average moves above the 200-day average.
This interpretation is kind of a bastardized version of the averages that ostensibly originated in ancient Japan, but Americans, in particular, have an affinity for round numbers, and these two have become the standard.
We've looked at these kinds of technical signals across markets for decades, with the grudging conclusion that they're barely useful. When this triggered in 2019, stocks rallied...then gave it all back, so whether it was successful or not depends on one's time frame.
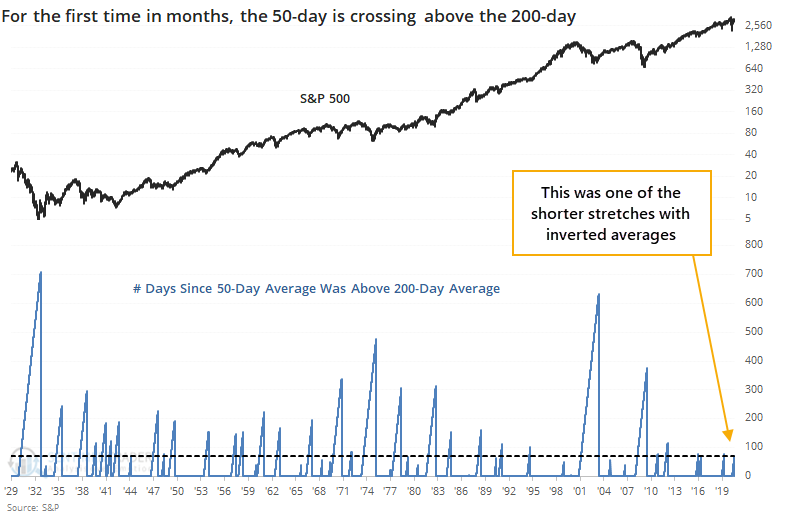
As streaks go, this was one of the shorter ones. The 50-day average was below the 200-day for only 70 sessions. The worst declines saw this go for 500 days or longer.
If we further stipulate that both moving averages must be rising, then the table below shows every signal since 1928 when the 50-day was below the 200-day for anywhere between 30 and 90 days.
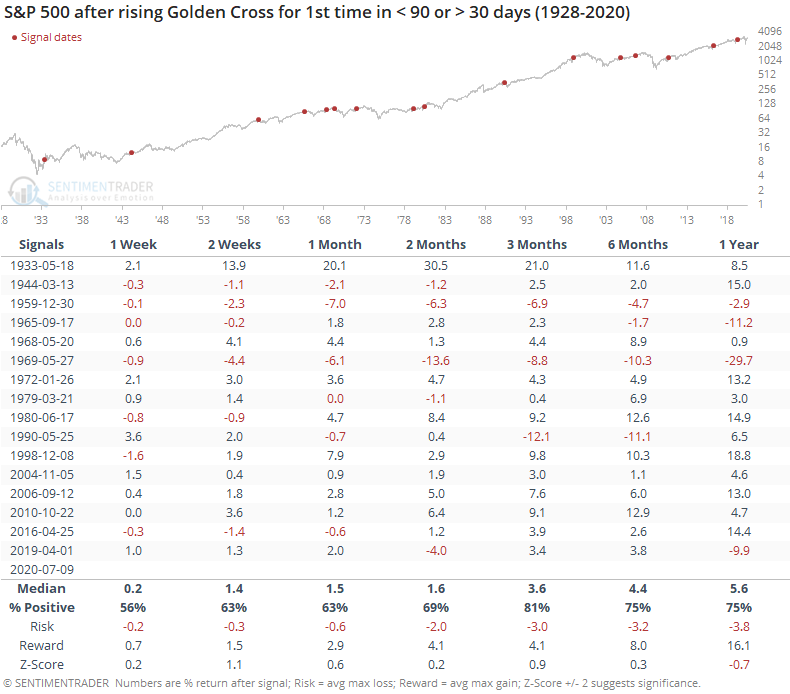
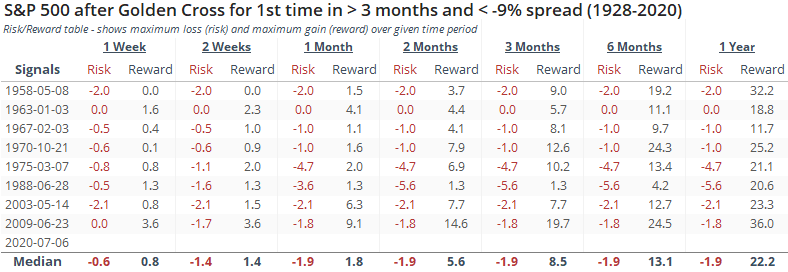
Future returns were okay. Median returns were about in line with random, and while reward was higher than risk, it wasn't positively skewed enough to consider it a big edge.
This one might be notable for another reason - it reversed what had been a very negative spread between the two averages. The S&P's 50-day average had dropped more than 9% below the 200-day average before reversing.
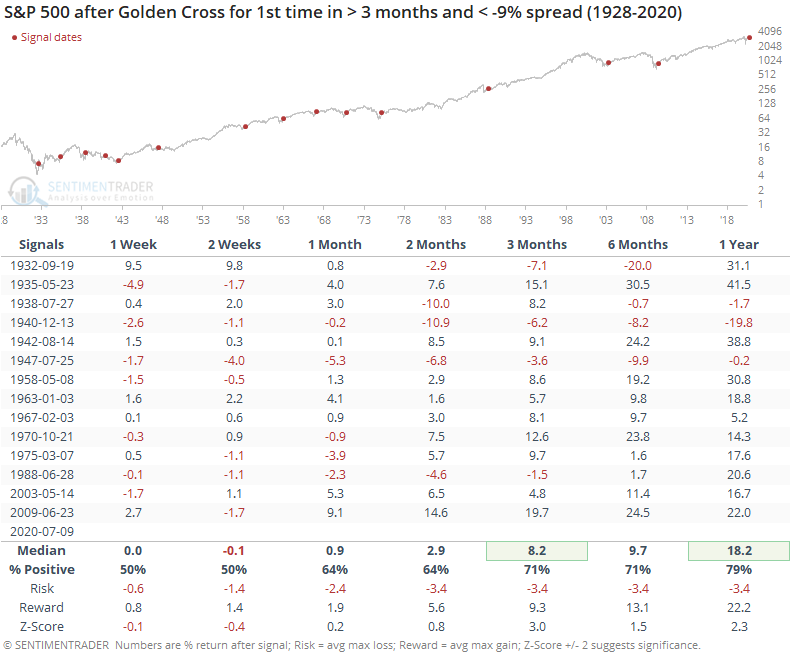
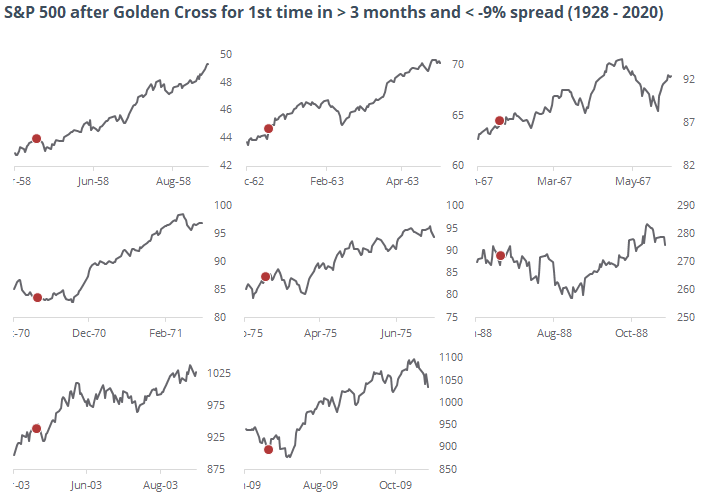
Shorter-term returns were sketchy, but from three months and beyond, mostly positive. This has been particularly positive since 1950, with extremely small risk relative to reward.
We wouldn't put a lot of faith in the Golden Cross by itself. The biggest reason for optimism is that it has reversed what had been a very negative medium- vs long-term trend, and that has led to big gains over the next 6-12 months every time over the past 70 years. During modern times, these signals marked the end of every major bear market.
EDIT: The following thumbnail chart was added after this post was originally published.
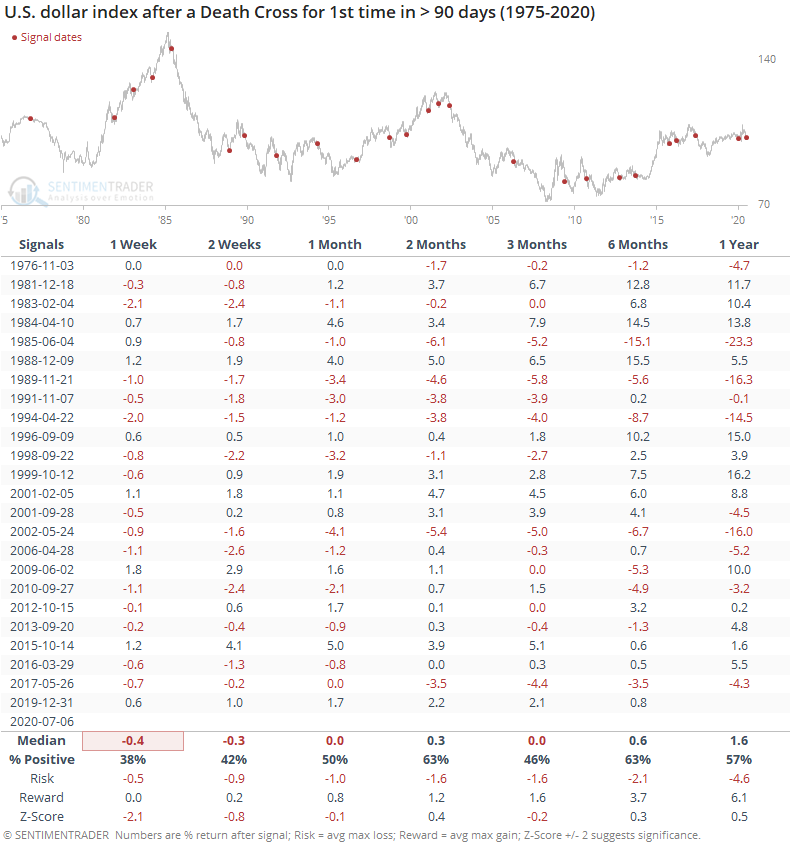
At the same time that the S&P's trend is turning positive, the U.S. dollar's is turning negative. The 50-day average just crossed below the 200-day average.
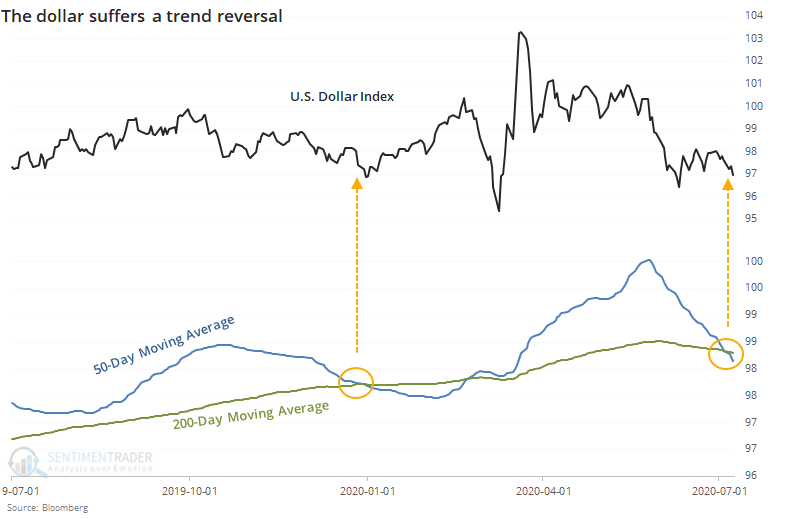
When this happened for the first time in at least 90 days, the buck had trouble regaining a positive trend.
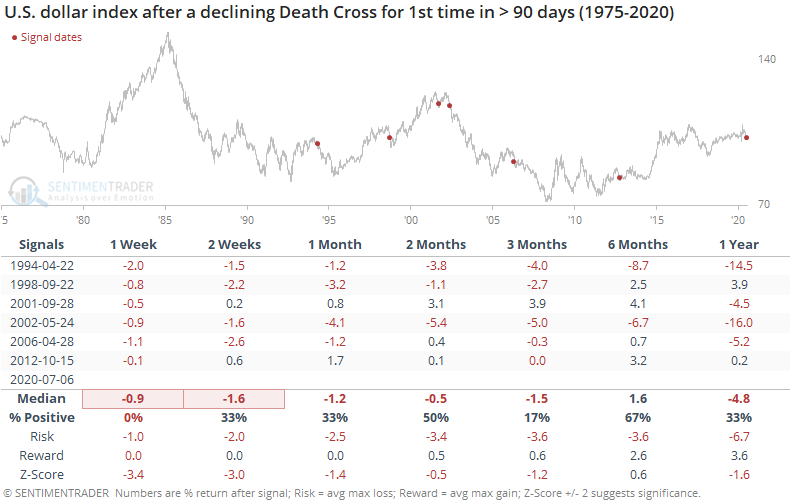
That was especially true if both moving averages were declining at the time of the cross, as they are now.
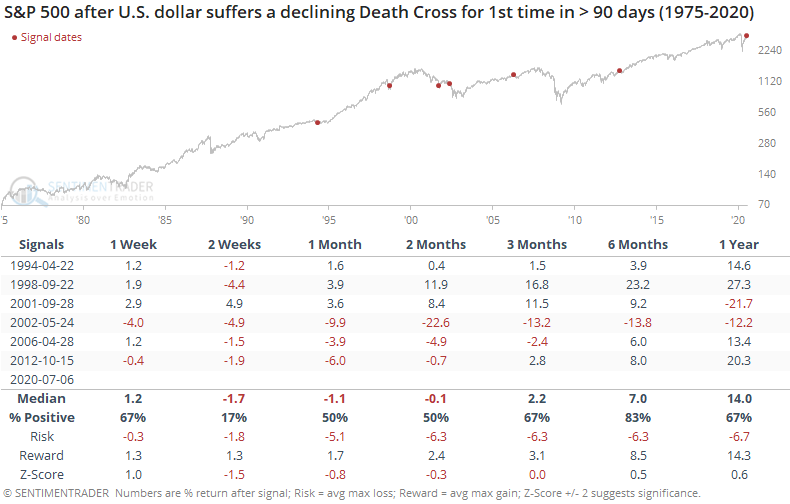
These signals preceded some short-term heartburn for the S&P 500, but not much beyond the first couple of months.
Surprisingly, gold didn't benefit that much from further declines in the dollar in the months ahead.
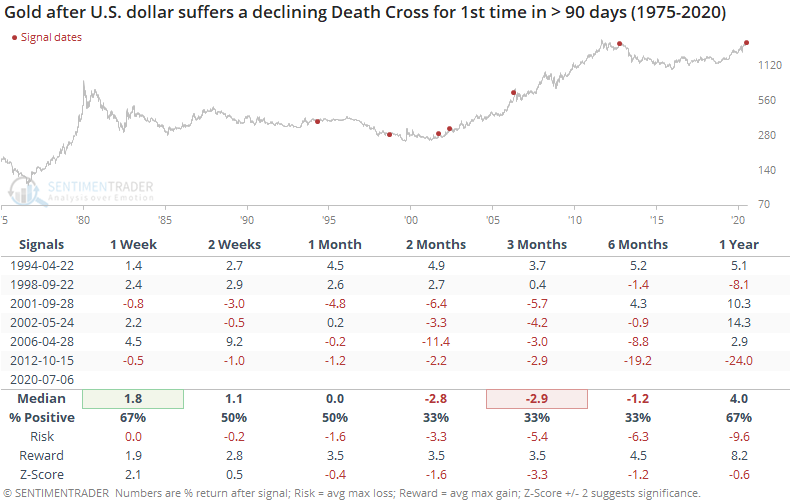
We'd take this potential trend change more as a bad sign for the dollar than as a good (or bad) sign for stocks or gold.
BOTTOM LINE
Most major technology stock indexes have been hitting new highs in recent days. A small warning is popping up in the percentage of members of these indexes that are holding above their 50-day averages, which has been declining over the past month. This kind of divergence has preceded some rocky markets for tech over the next 1-3 months.
FORECAST / TIMEFRAME
None
|
Finding fault with the rally in tech has been difficult, as it has powered higher with decent participation (shorter-term, anyway). About the only warning signs have come from "too far, too fast" types of measures, and even those haven't been consistent warning signs.
As pointed out on Twitter, though, there are some emerging signs that participation among these stocks is lagging. We saw on Wednesday that when looking at an equal-weight index of the largest tech stocks, their relative performance just hit a new low.
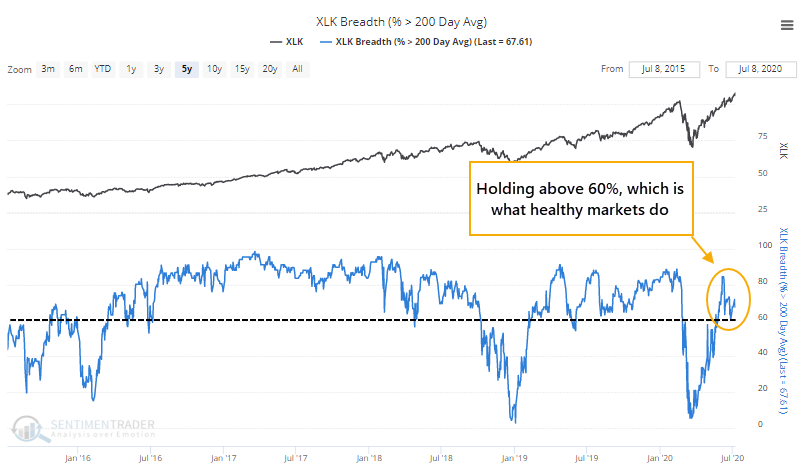
On the plus side, while the broader market continues to show signs of being unhealthy longer-term, that's not evident in tech. More than 60% of these stocks are holding above their long-term 200-day moving averages, which is what we see during healthy market environments.
The potential trouble is over the medium-term. Despite new highs virtually every day in funds like XLK, the percentage of members in the tech sector that are holding above their 50-day averages is dropping and is well of the highs.
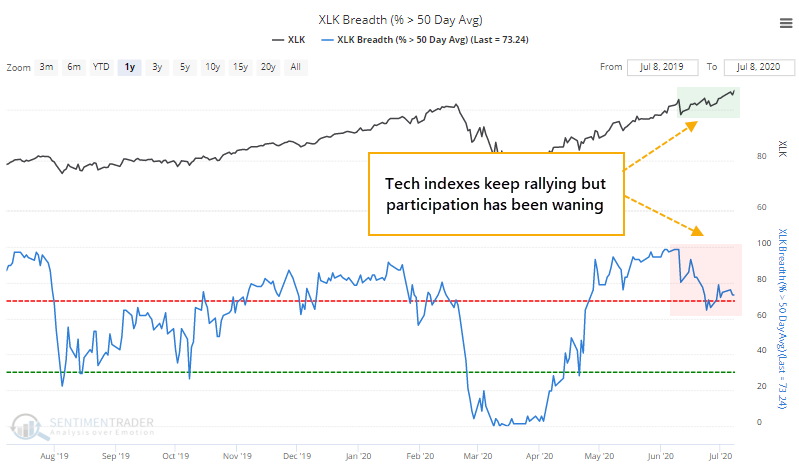
More than 95% of tech stocks were above their 50-day averages a month ago, and now fewer than 75% of them are.
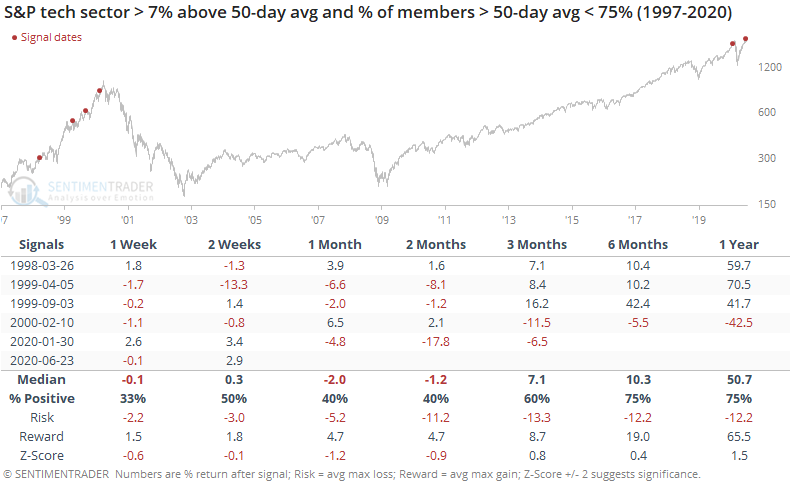
When the tech sector hit a 52-week high and the percentage of its members above their 50-day average was more than 20% below the peak, we can see what happened going forward in the table below.
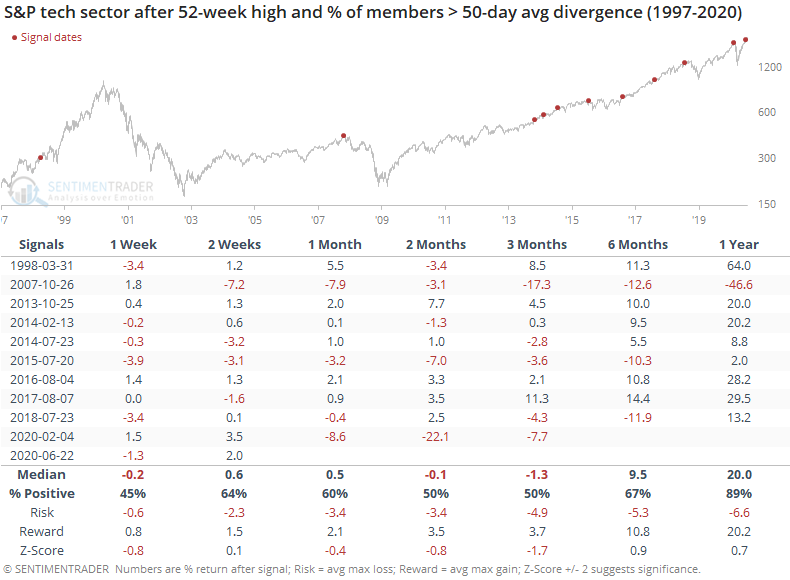
This was an effective warning sign at a few peaks (2007, 2015, 2018, 2020), which would have saved us from pretty drastic declines in the months ahead. Unfortunately, it also failed as a warning multiple times. About the worst we can say is that 7 out of the 10 signals showed a negative return in tech stocks somewhere between 1 - 3 months later.
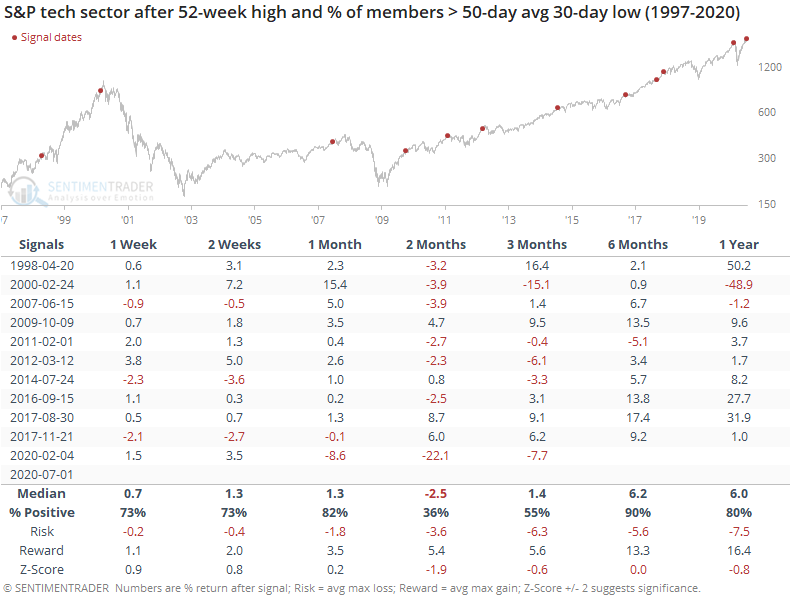
The percentage of members above their 50-day average has been dropping for a while, and the 10-day average of this indicator has hit a 30-day low. Again, this kind of divergence has preceded some troubles over the next couple of months.
It's also notable that tech stock indexes are nearly 10% above their 50-day averages, and yet fewer than 75% of members are above their own averages by any amount. This kind of stark difference was rare, only triggering during the lead-up to the bubble peak, and again in January of this year.
There is certainly a chance that tech can shrug off this potential warning in the weeks ahead. Maybe participation will turn around and further fuel the rally. Historically, that has not happened, and the major tech indexes have dropped in order to catch up with the declining participation of the stocks. We'd consider this a minor warning here.
Active Studies
| Time Frame | Bullish | Bearish | | Short-Term | 0 | 0 | | Medium-Term | 8 | 6 | | Long-Term | 44 | 1 |
|
Indicators at Extremes
Portfolio
| Position | Weight % | Added / Reduced | Date | | Stocks | 29.8 | Reduced 9.1% | 2020-06-11 | | Bonds | 0.0 | Reduced 6.7% | 2020-02-28 | | Commodities | 5.2 | Added 2.4%
| 2020-02-28 | | Precious Metals | 0.0 | Reduced 3.6% | 2020-02-28 | | Special Situations | 0.0 | Reduced 31.9% | 2020-03-17 | | Cash | 65.0 | | |
|
Updates (Changes made today are underlined)
In the first months of the year, we saw manic trading activity. From big jumps in specific stocks to historic highs in retail trading activity to record highs in household confidence to almost unbelievable confidence among options traders. All of that came amid a market where the average stock couldn't keep up with their indexes. There were signs of waning momentum in stocks underlying the major averages, which started triggering technical warning signs in late January. After stocks bottomed on the 23rd, they enjoyed a historic buying thrust and retraced a larger amount of the decline than "just a bear market rally" tends to. Those thrusts are the most encouraging sign we've seen in years. Through early June, we were still seeing thrusts that have led to recoveries in longer-term breadth metrics. The longer-term prospects for stocks (6-12 months) still look decent given the above. On a short- to medium-term basis, it was getting harder to make that case. Dumb Money Confidence spiked and there were multiple signs of a historic level of speculation. This is likely the lowest I will go given what I still consider to be compelling positives over a longer time frame. There is not a slam-dunk case to be made for either direction, so it will seem like a mistake whether stocks keep dropping (why didn't I sell more?) or if they turn and head higher (why did I let short-term concerns prevail?). After nearly three decades of trading, I've learned to let go of the idea of perfection.
RETURN YTD: -5.1% 2019: 12.6%, 2018: 0.6%, 2017: 3.8%, 2016: 17.1%, 2015: 9.2%, 2014: 14.5%, 2013: 2.2%, 2012: 10.8%, 2011: 16.5%, 2010: 15.3%, 2009: 23.9%, 2008: 16.2%, 2007: 7.8%
|
|
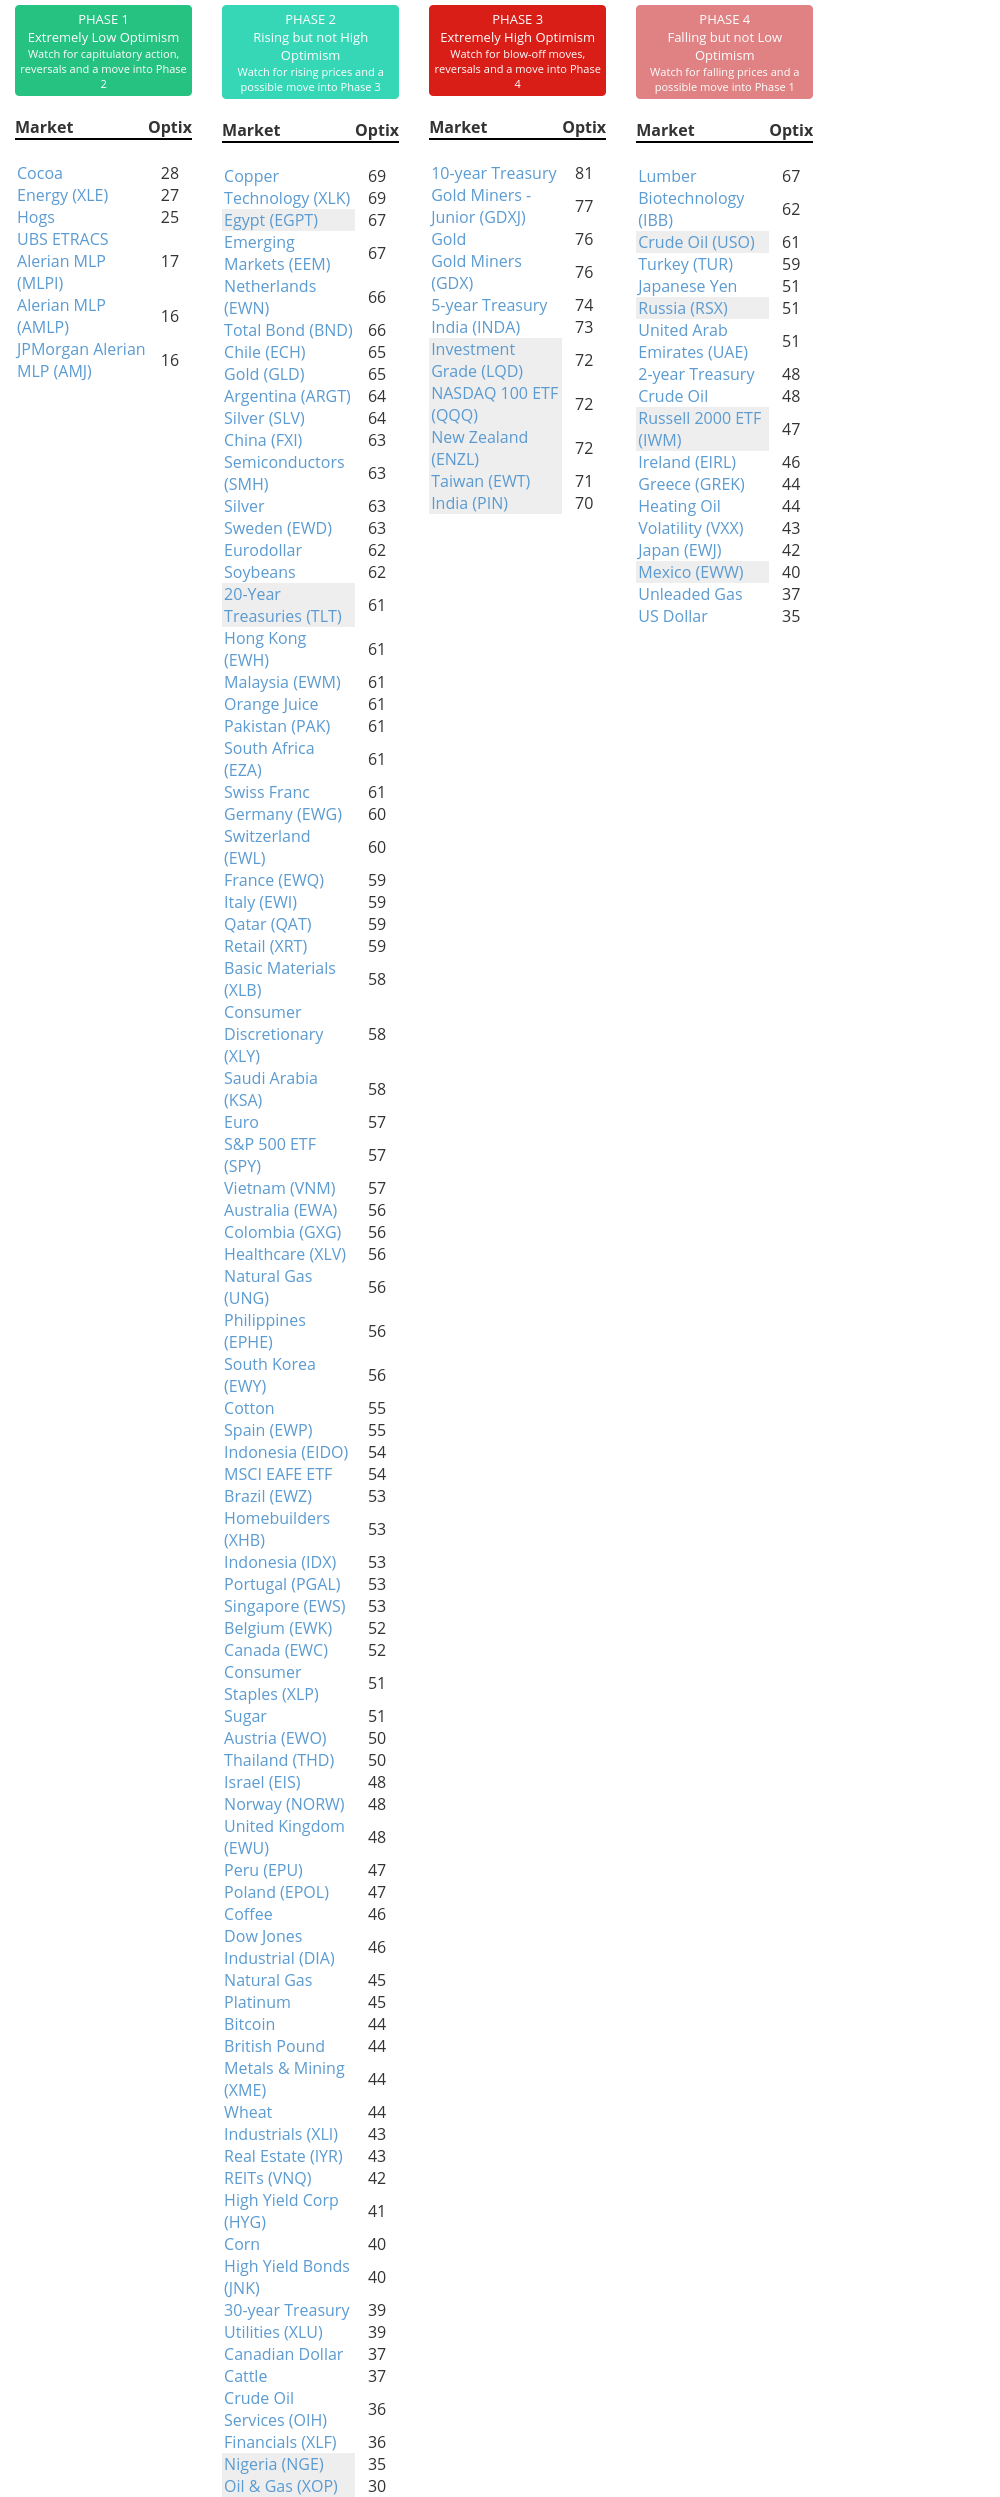
Phase Table
Ranks
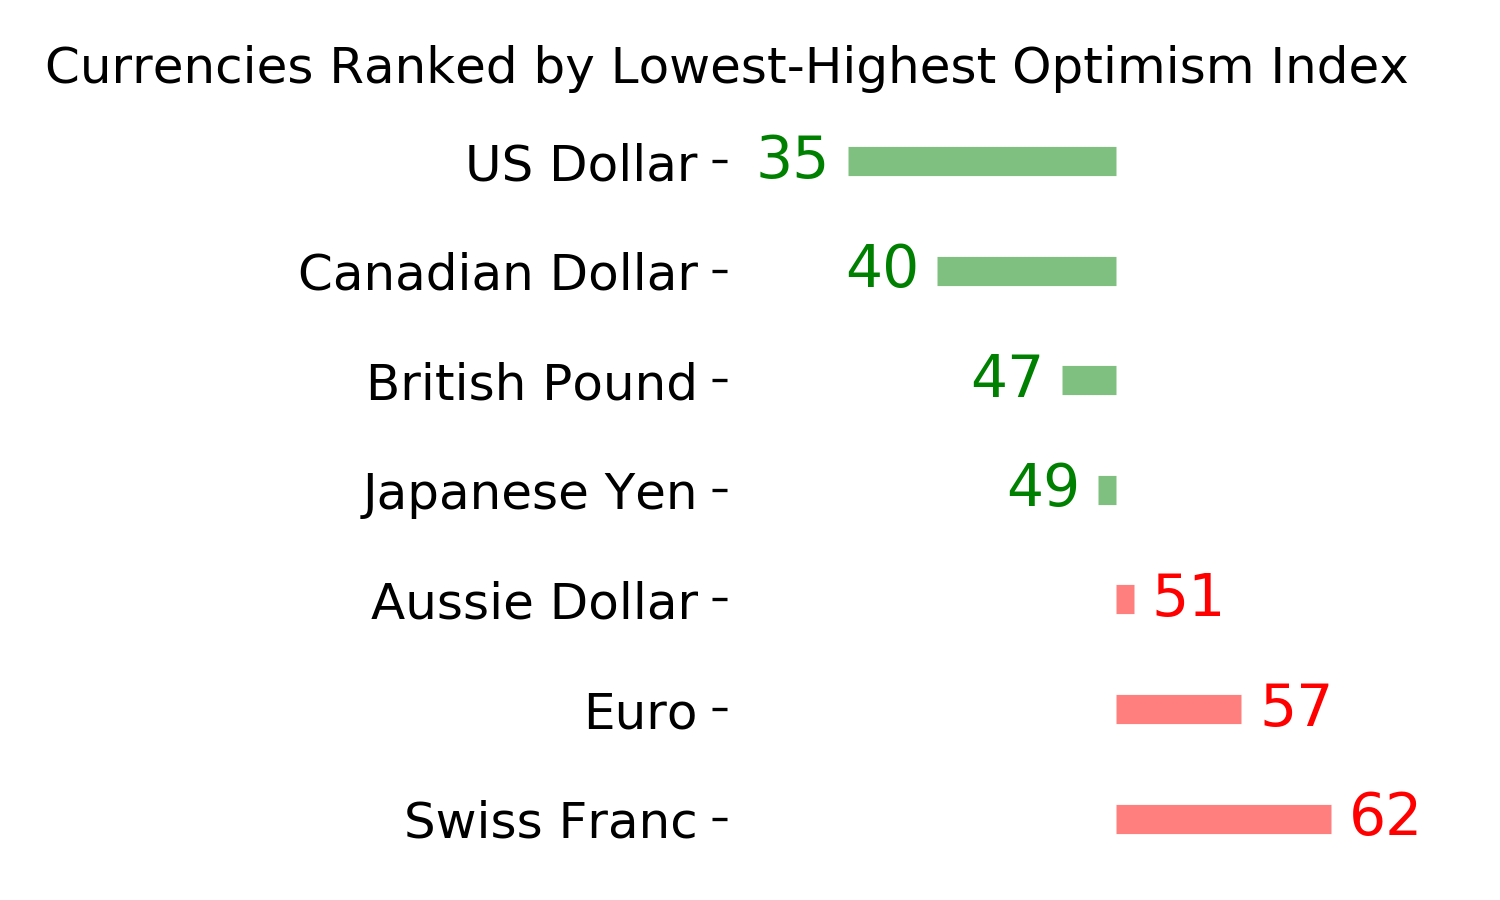
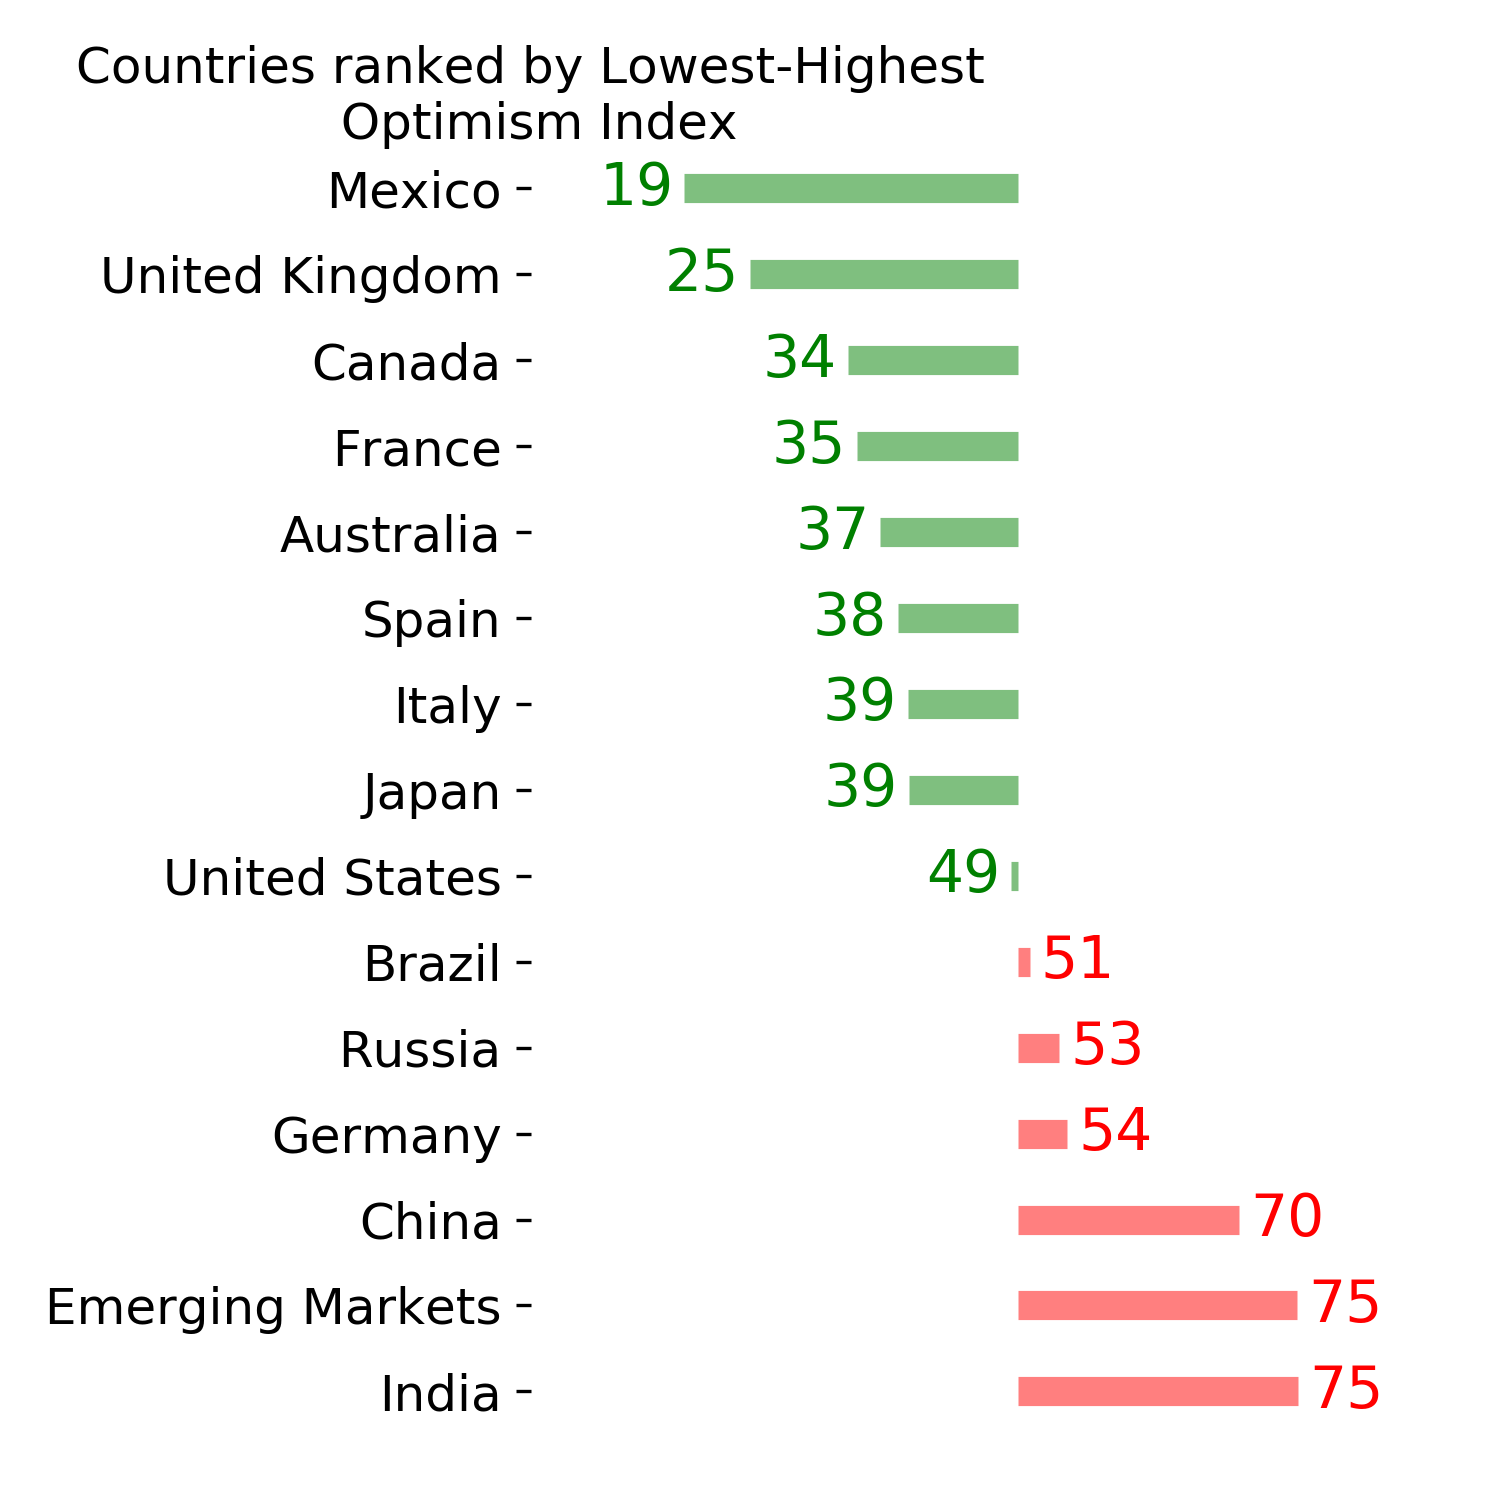
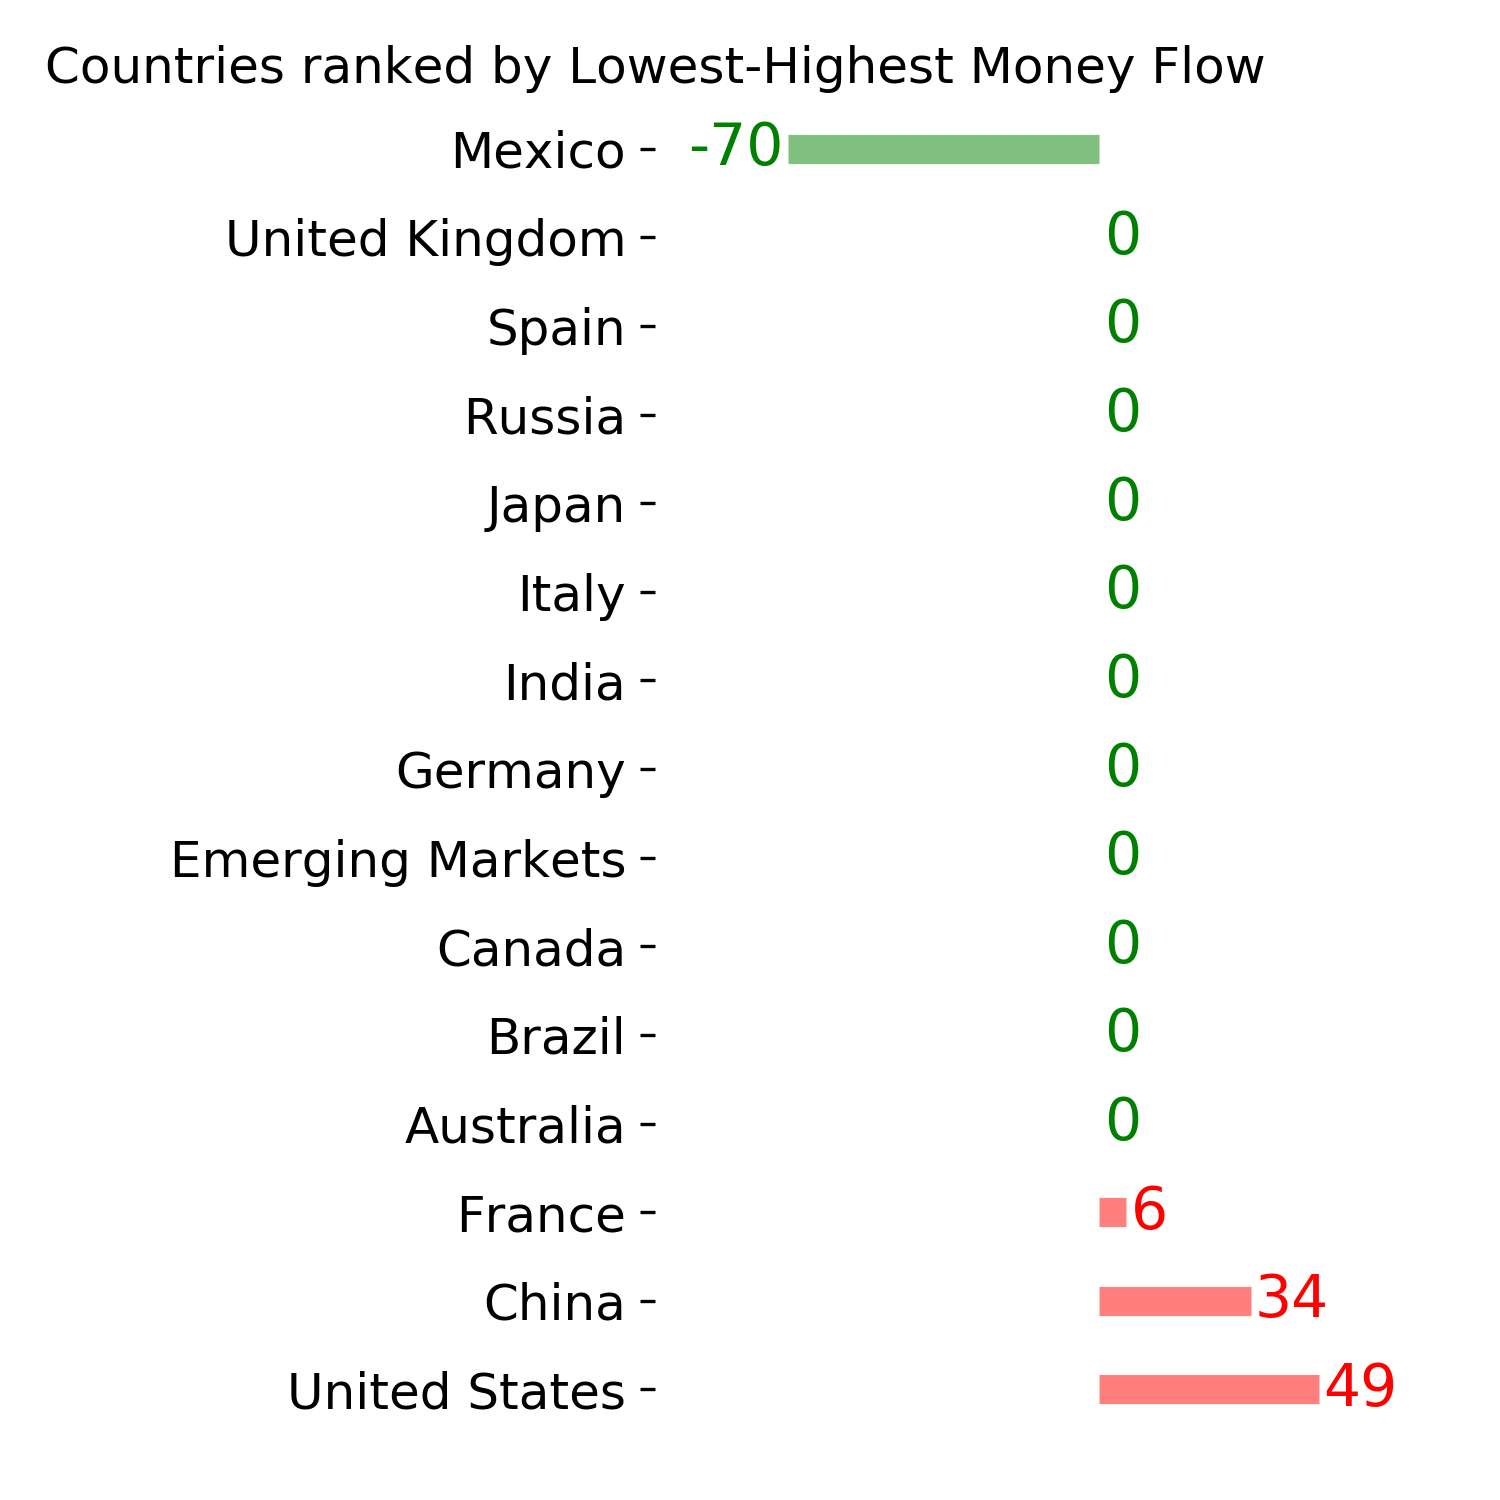
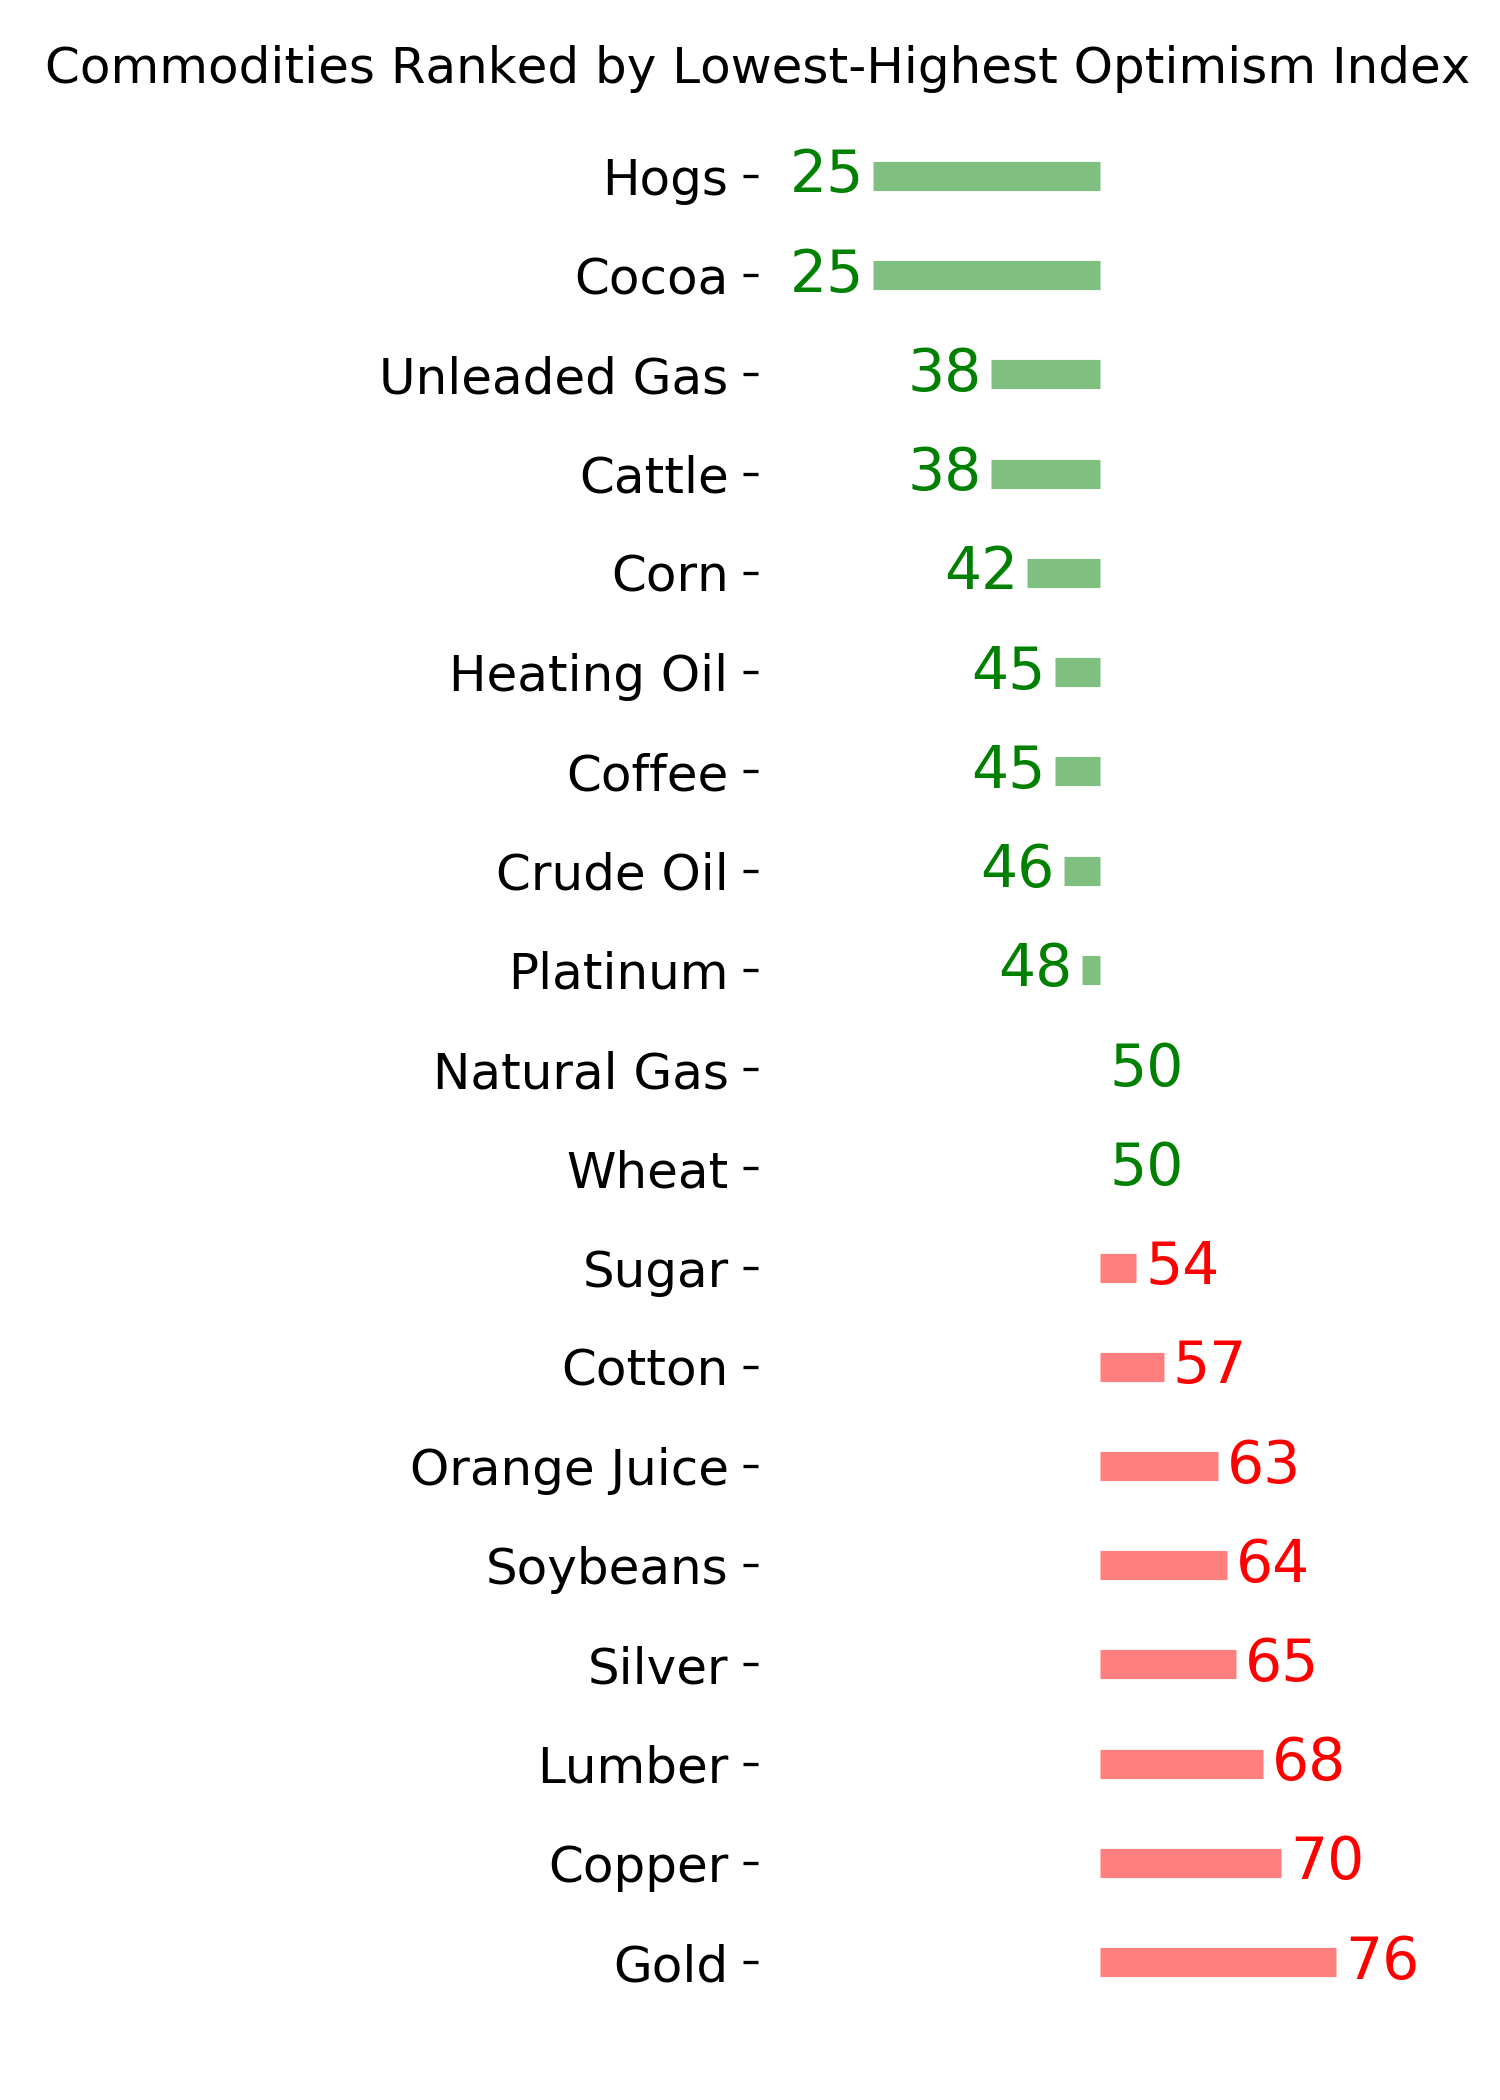
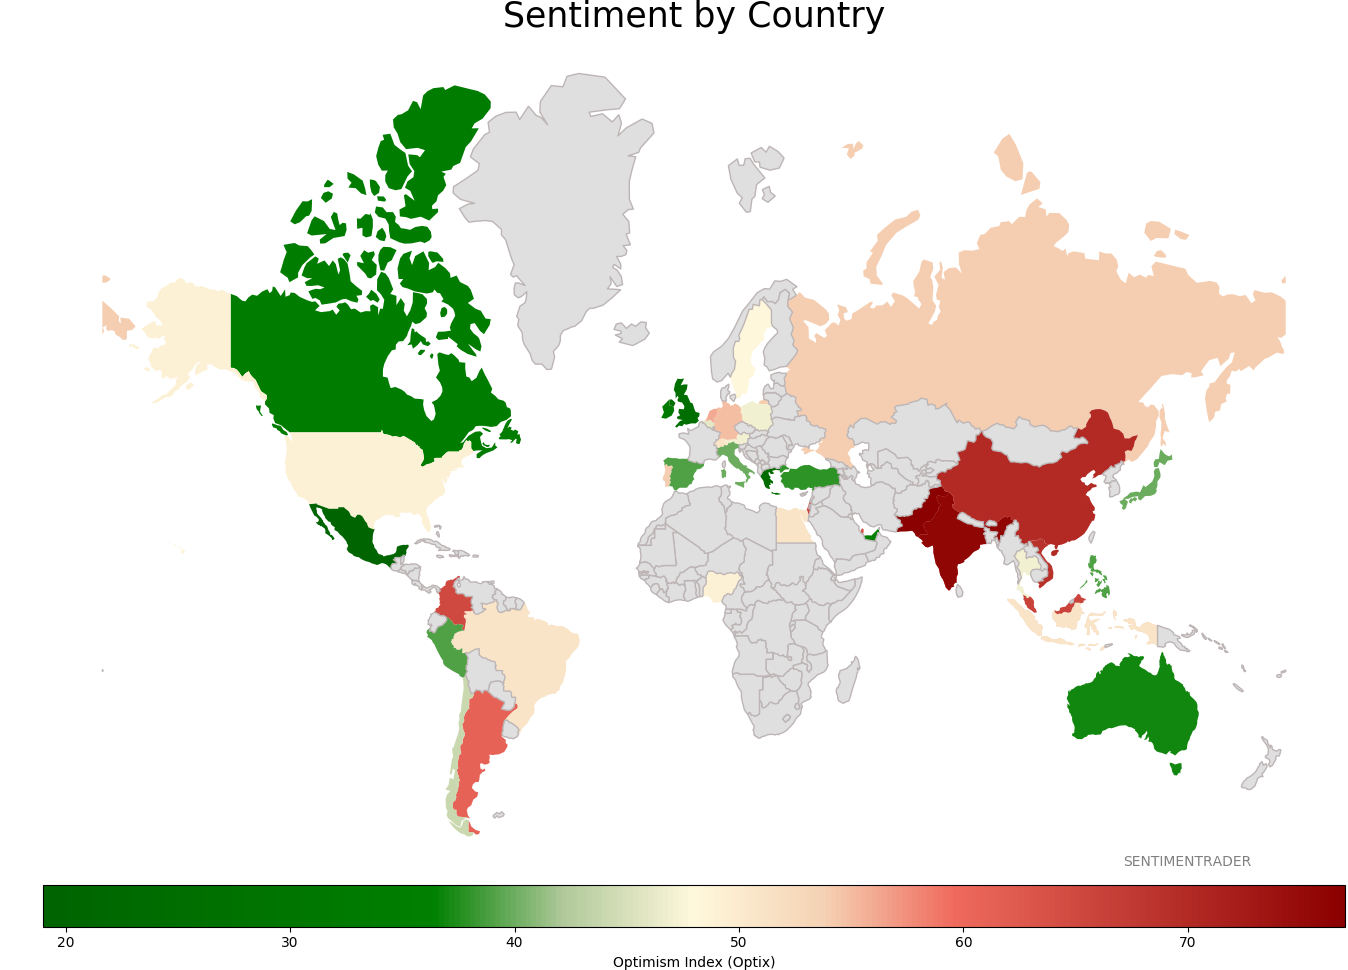
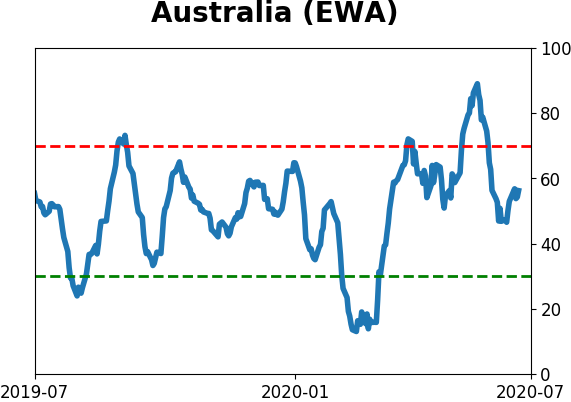
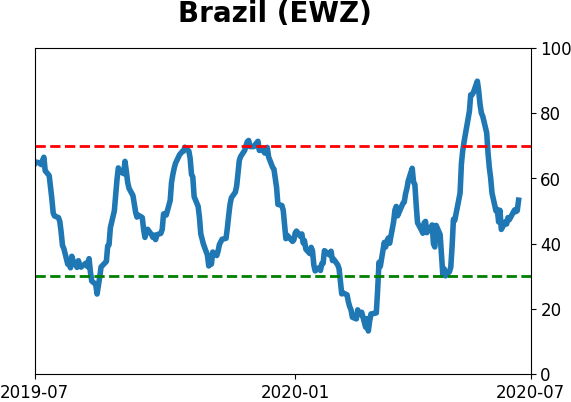
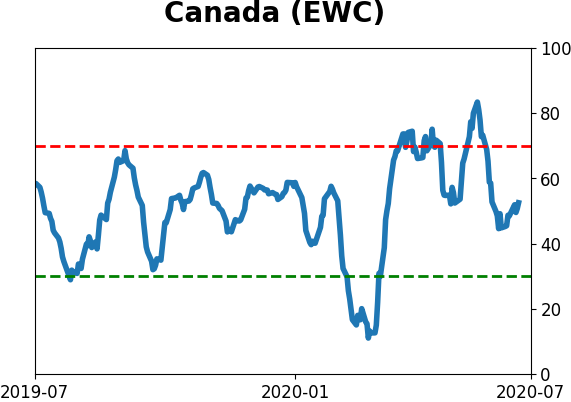
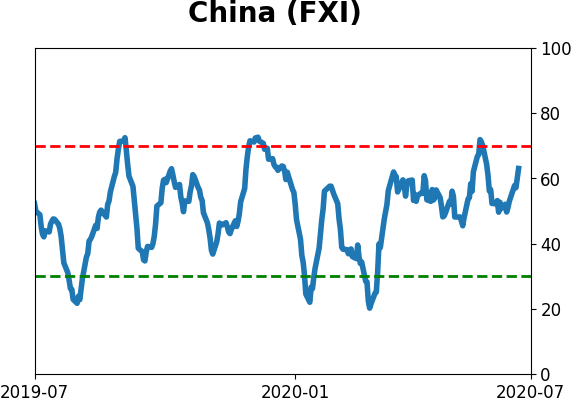
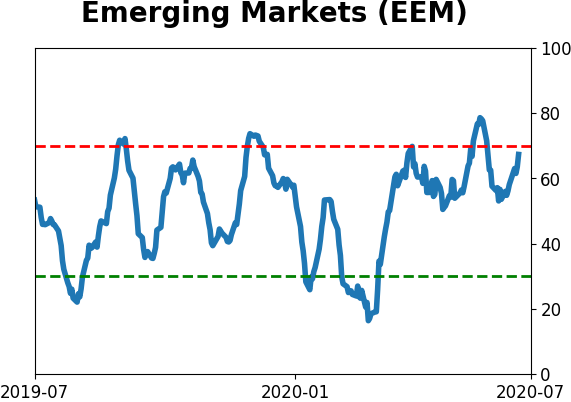
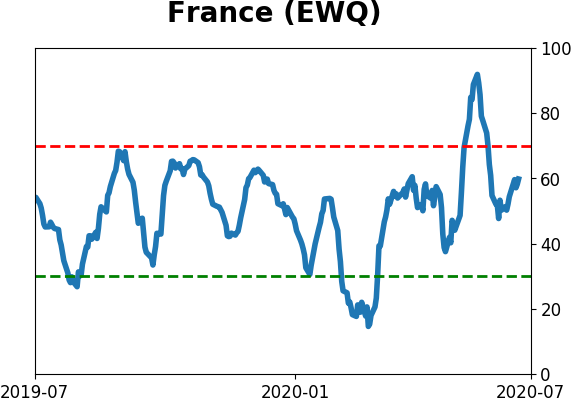
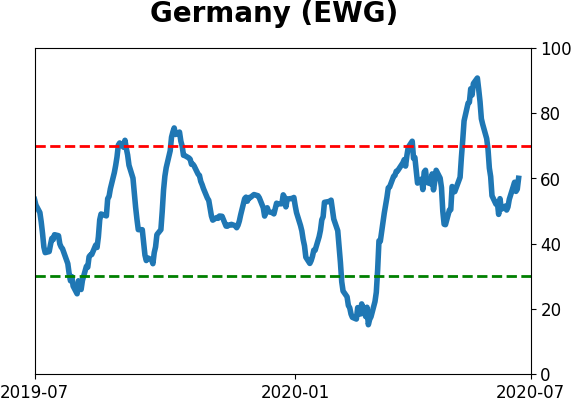
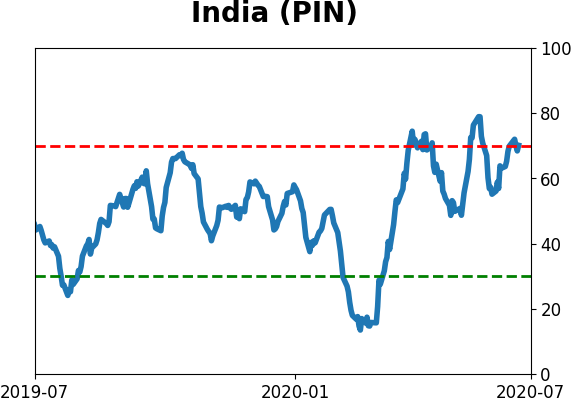
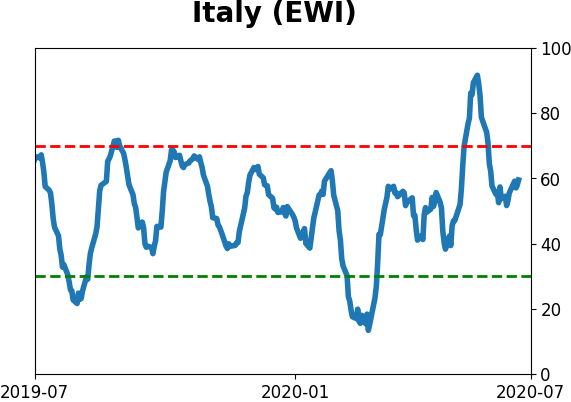
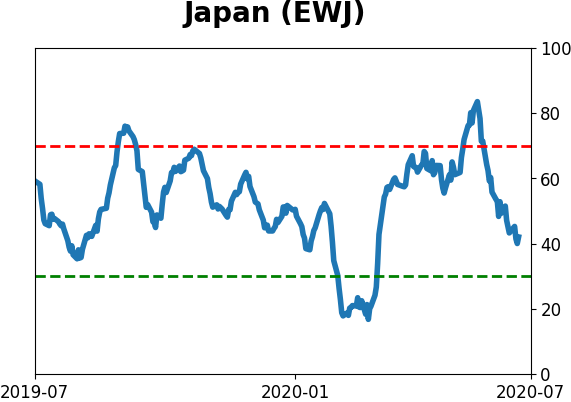
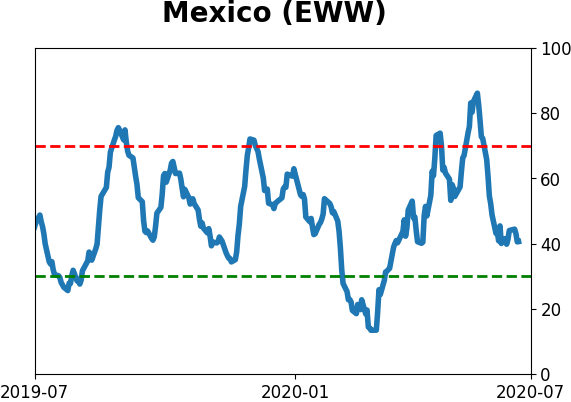
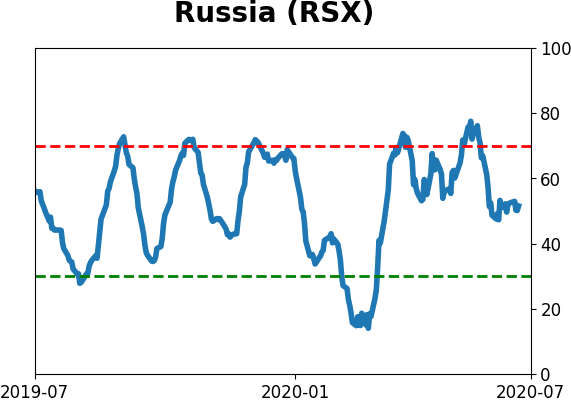
Sentiment Around The World
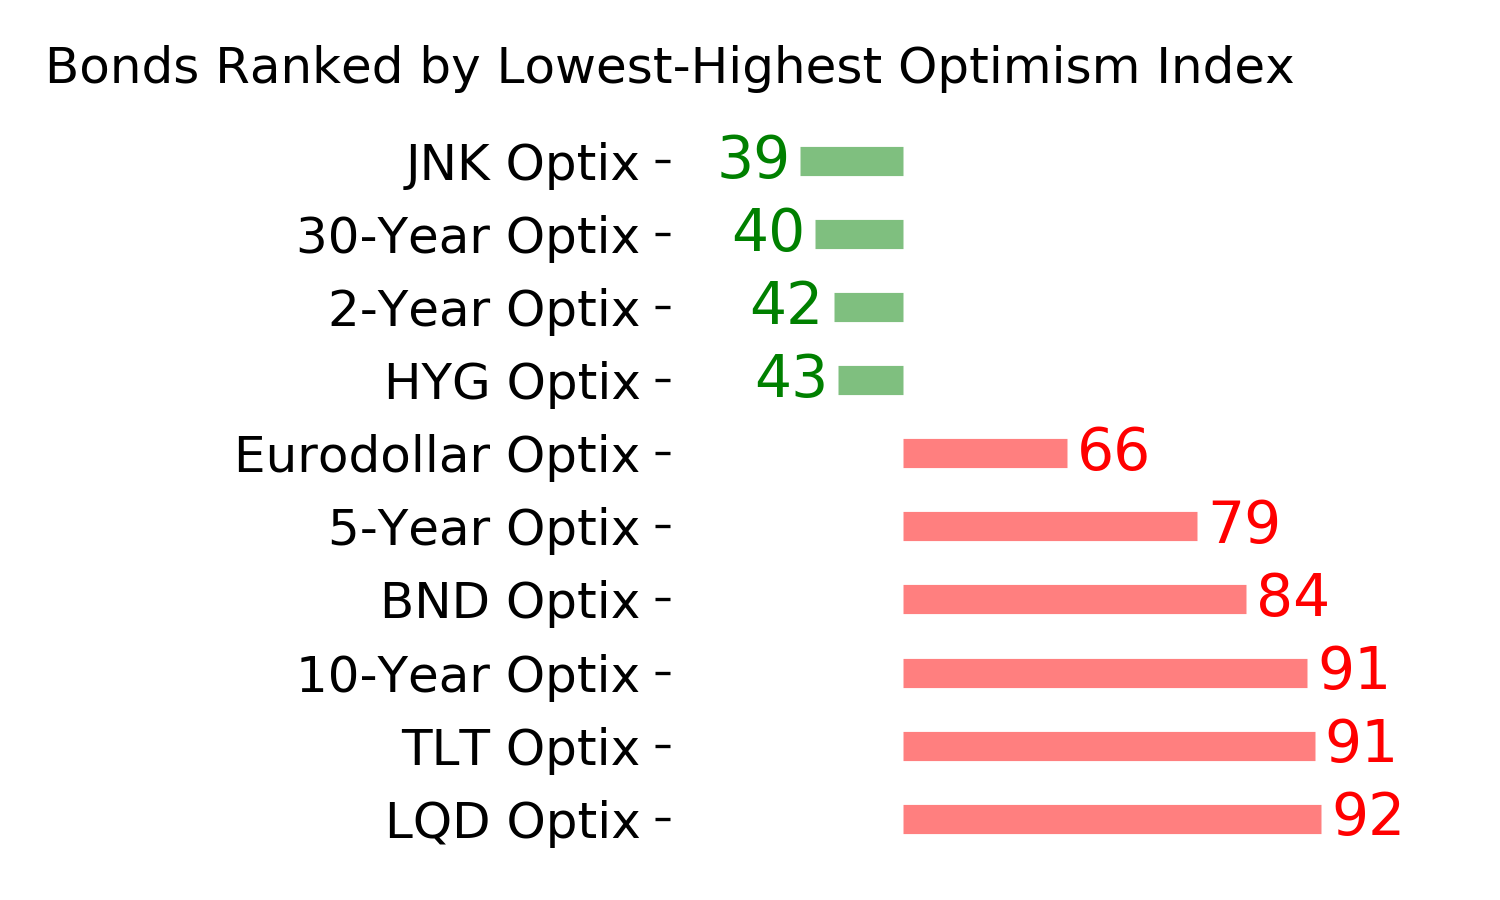
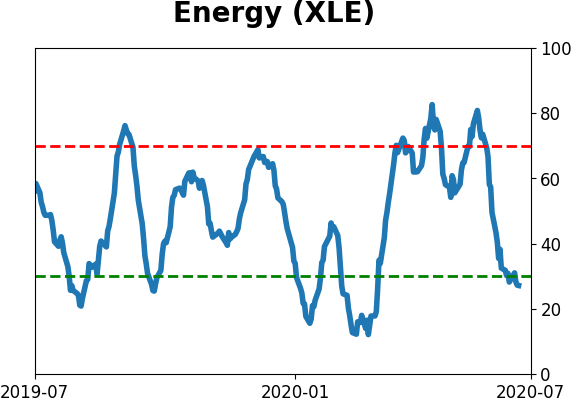
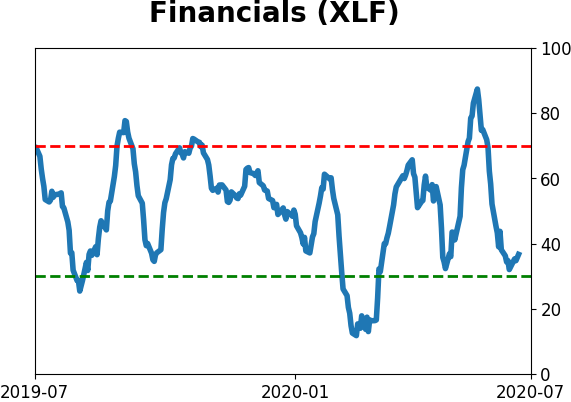
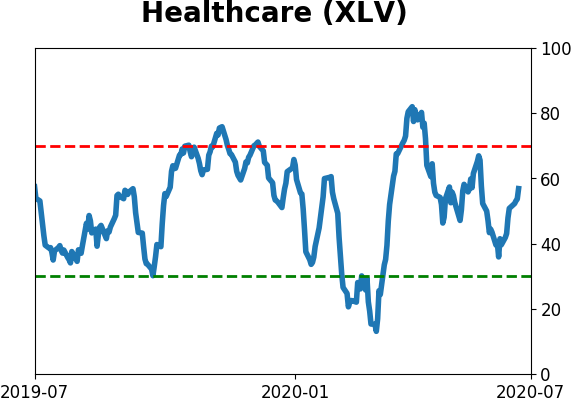
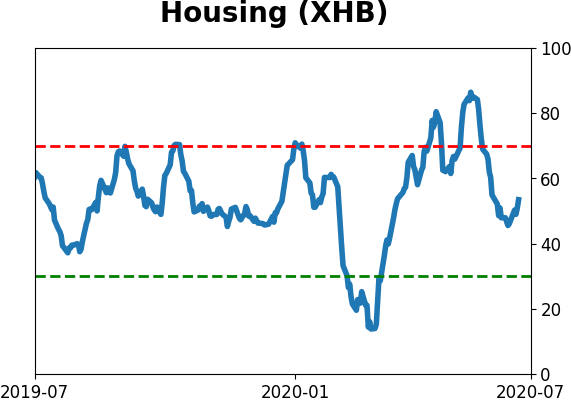
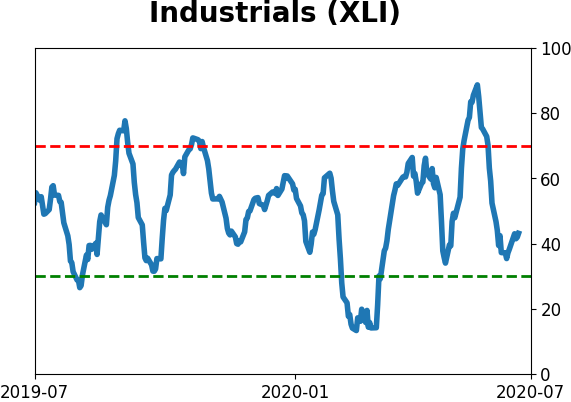
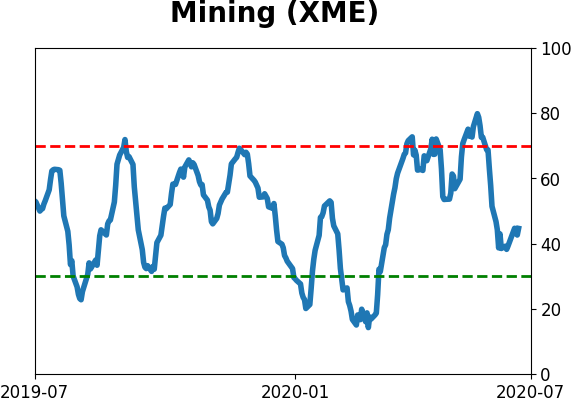
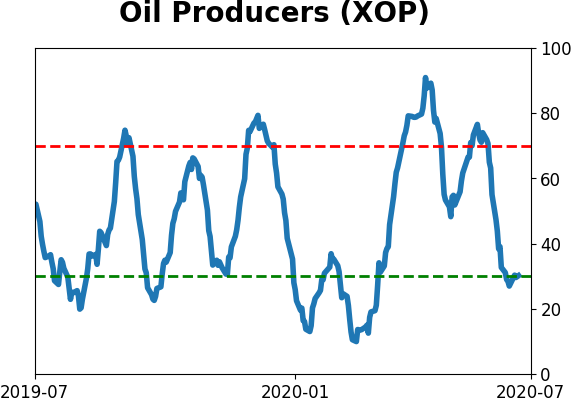
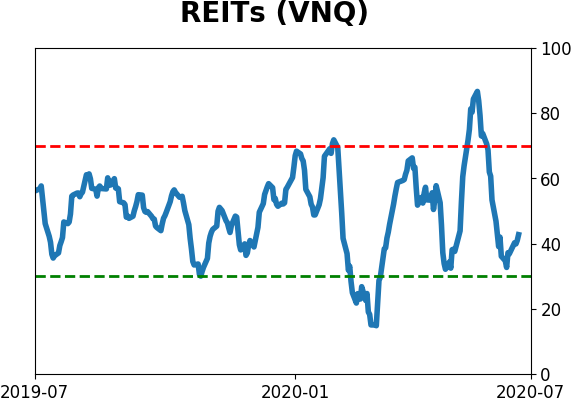
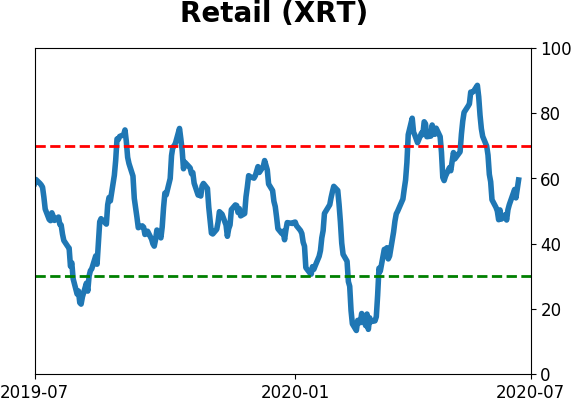
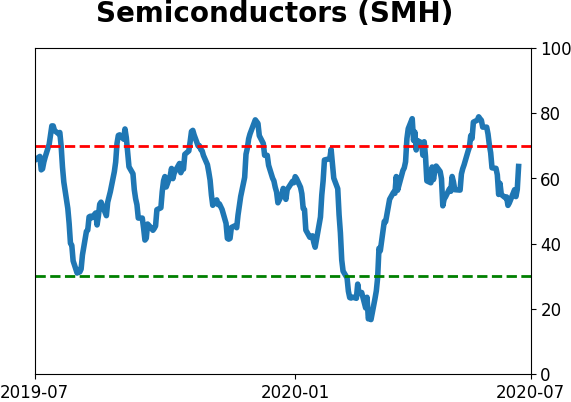
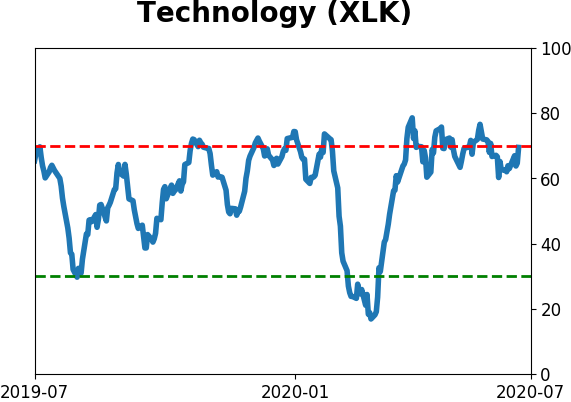
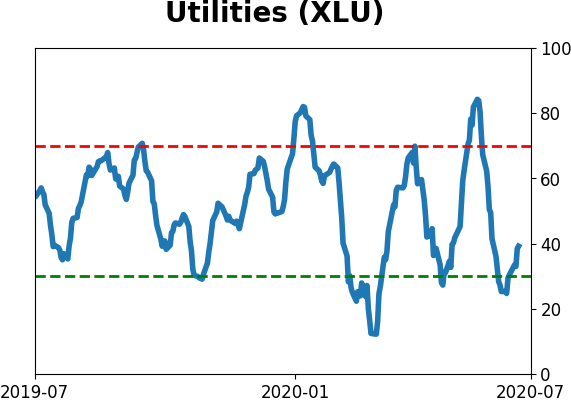
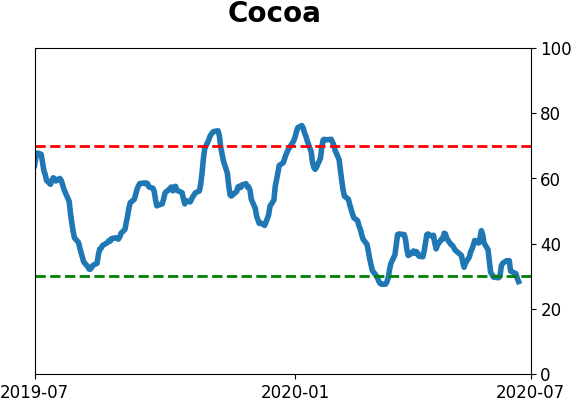
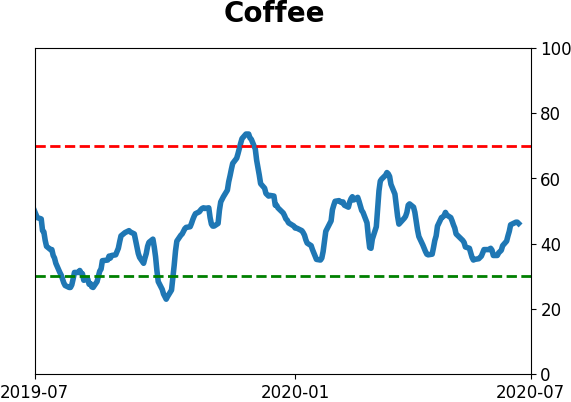
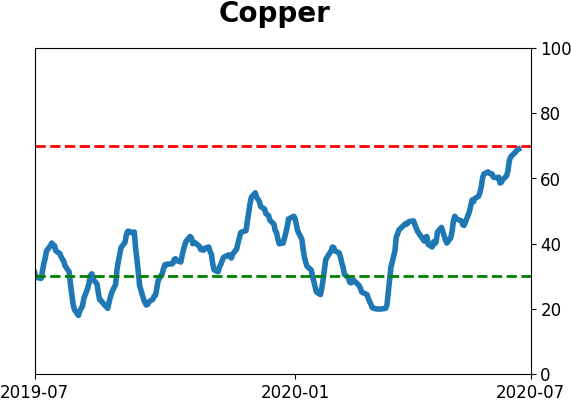
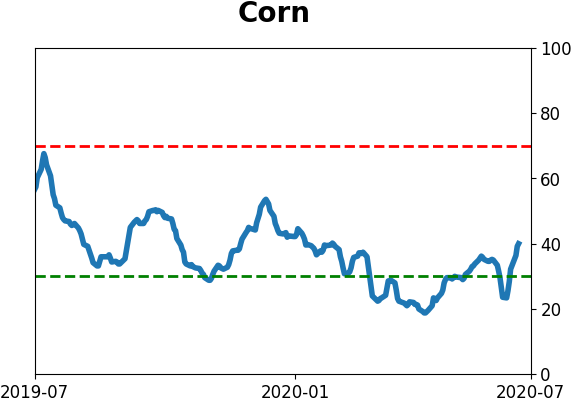
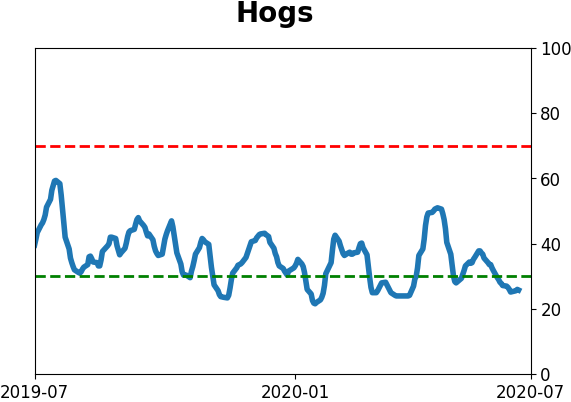
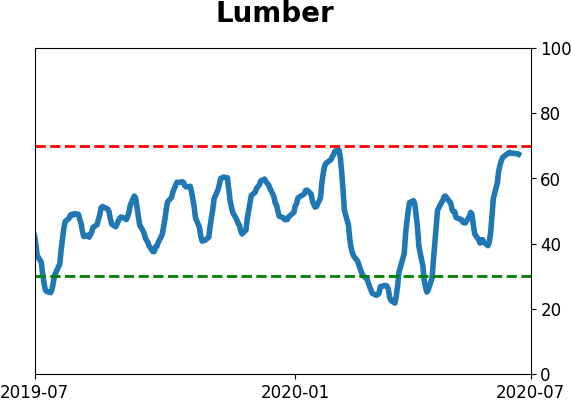
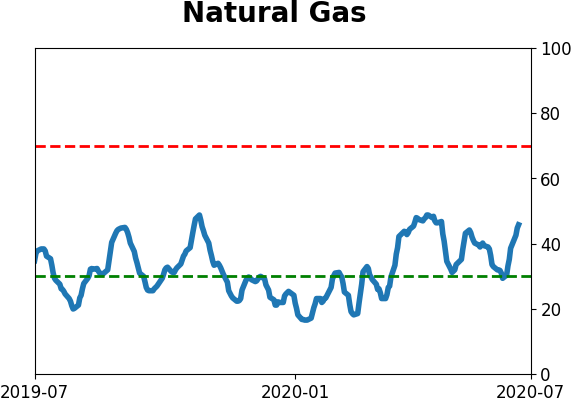
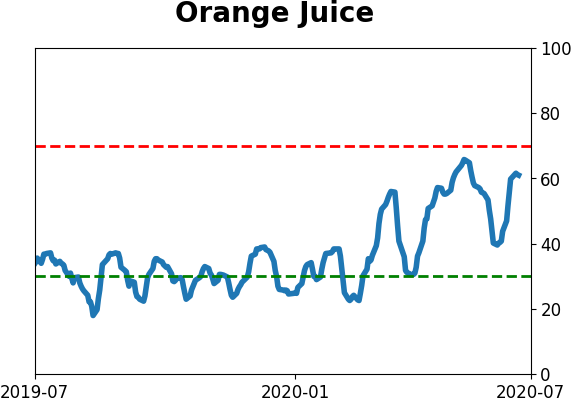
Optimism Index Thumbnails
|
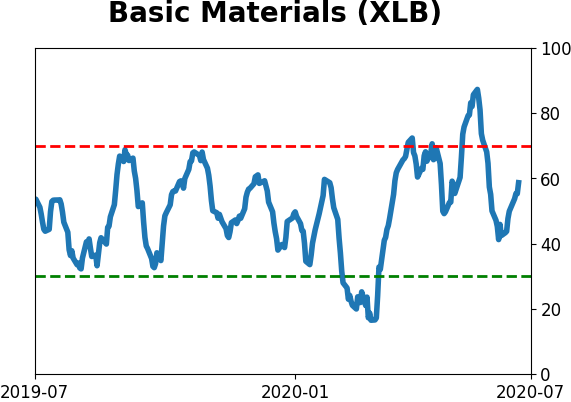
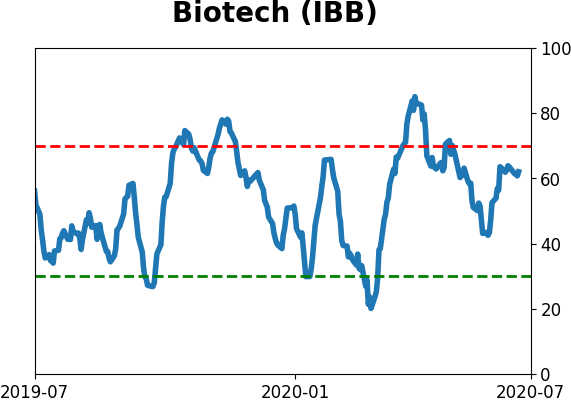
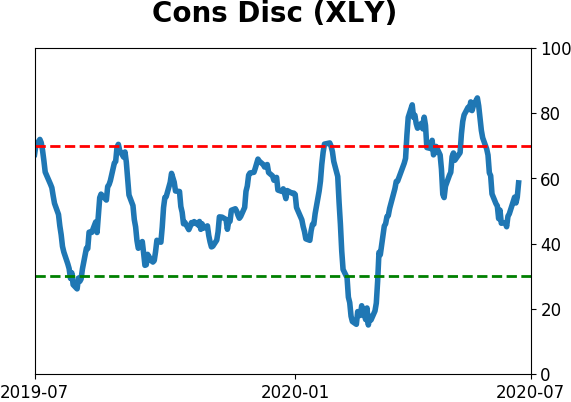
Sector ETF's - 10-Day Moving Average
|
|
|
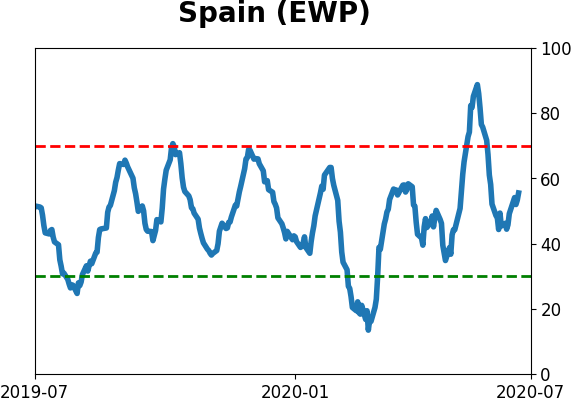
Country ETF's - 10-Day Moving Average
|
|
|
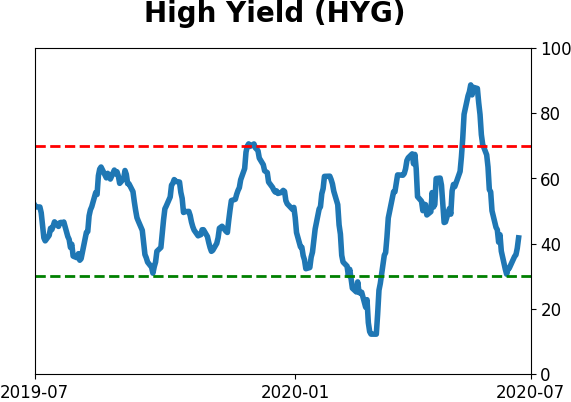
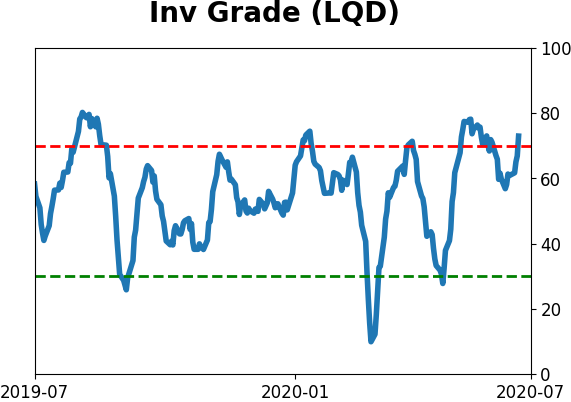
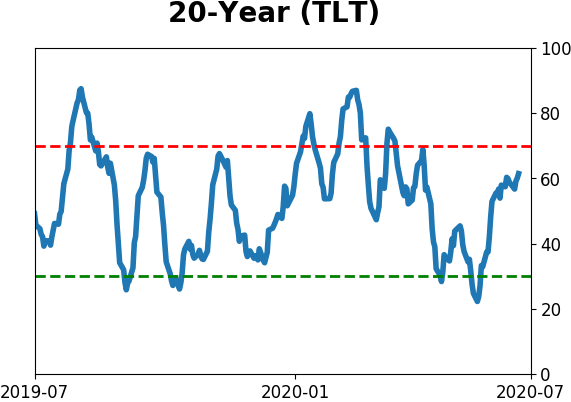
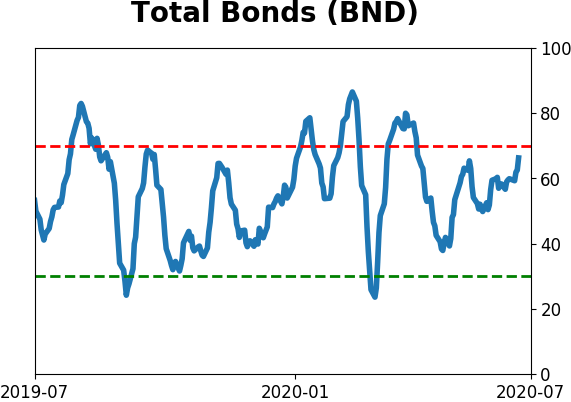
Bond ETF's - 10-Day Moving Average
|
|
|
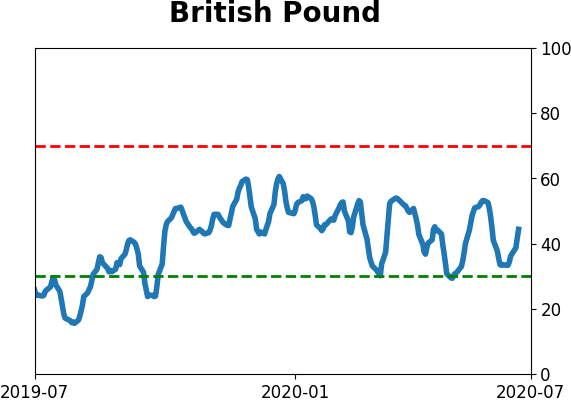
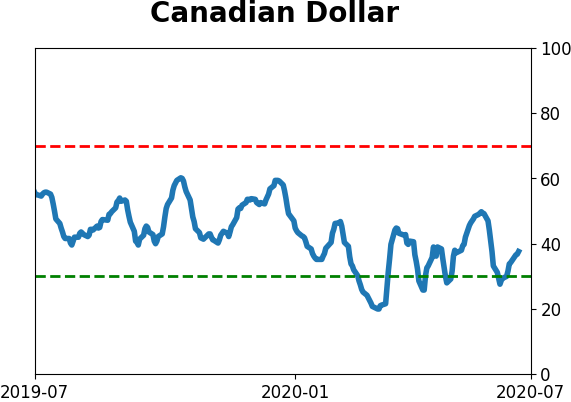
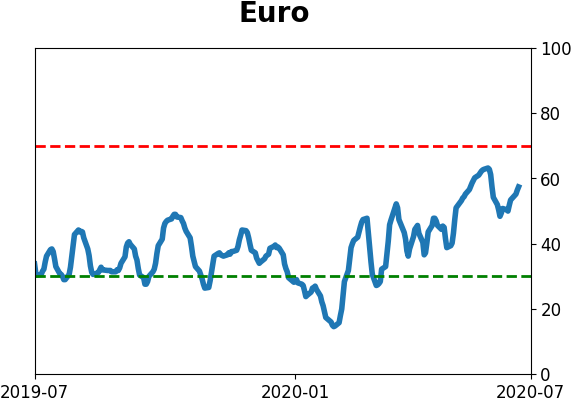
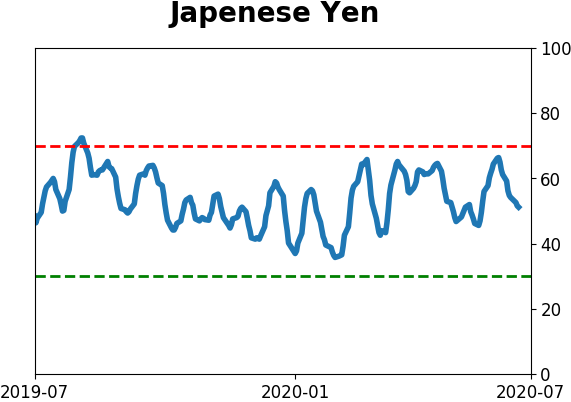
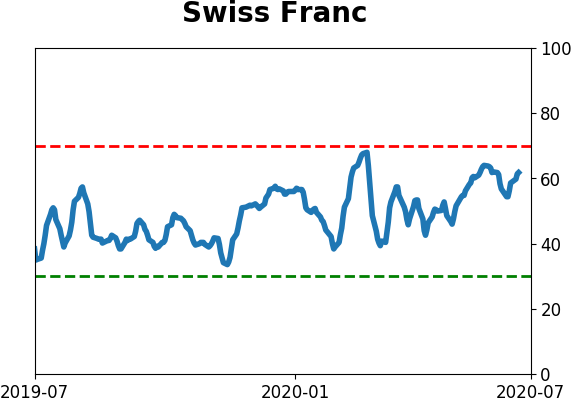
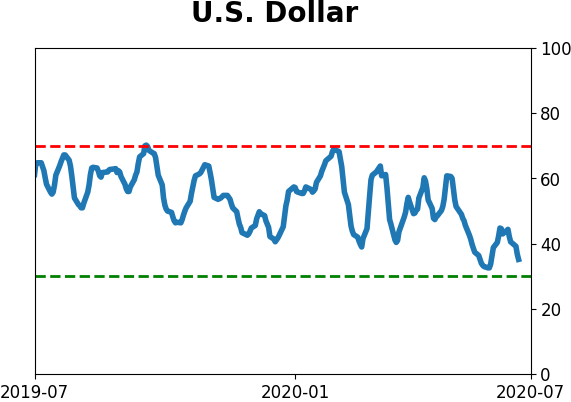
Currency ETF's - 5-Day Moving Average
|
|
|
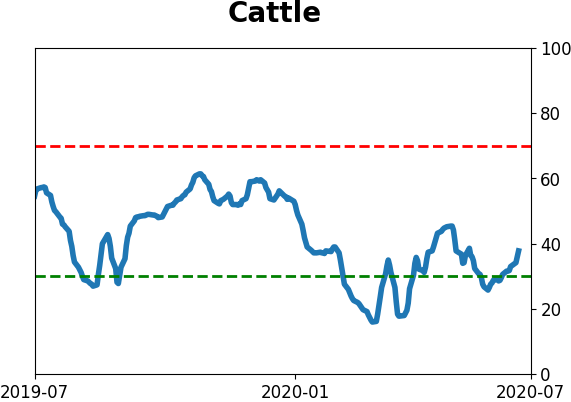
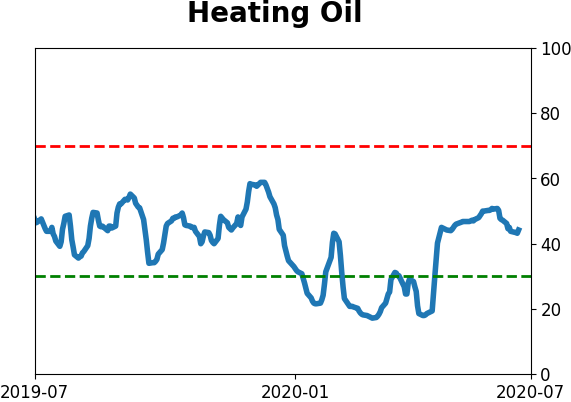
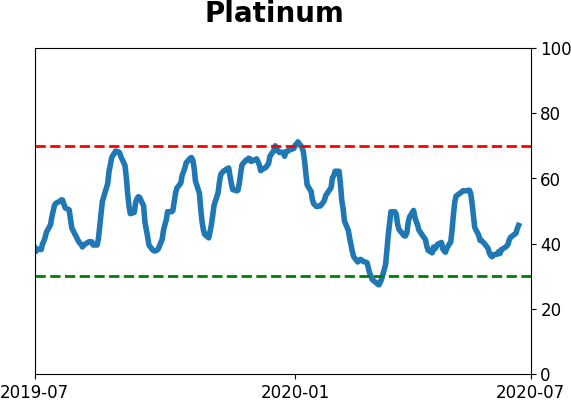
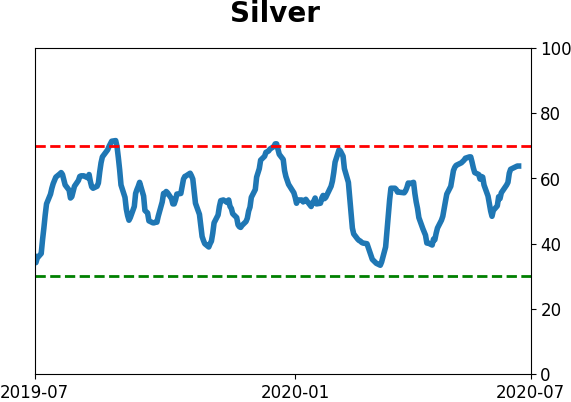
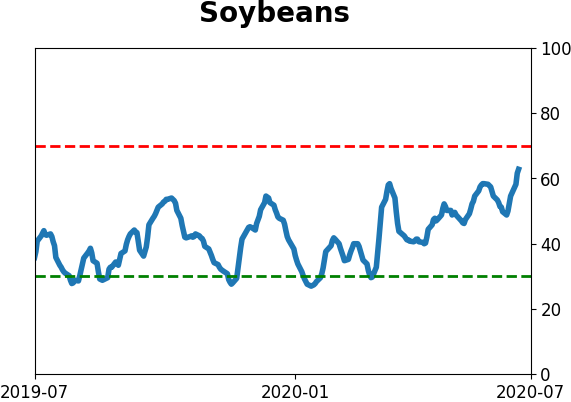
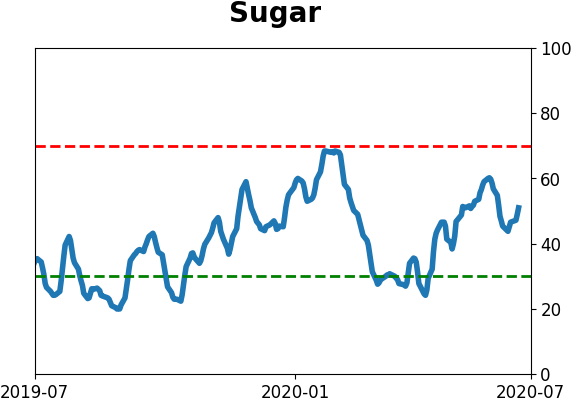
Commodity ETF's - 5-Day Moving Average
|
|