Headlines
|
|
Stocks have enjoyed a historic rally, and volatility remains high:
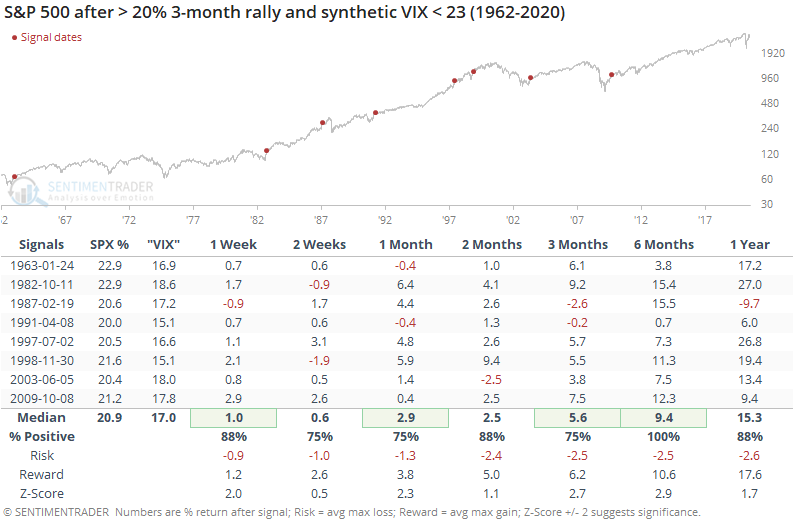
Over the past 3 months, the S&P 500 has enjoyed a historic rally. Even so, options traders are still pricing in a relatively high amount of volatility. Using a synthetic VIX back to 1962, we can see that big rallies accompanied by high volatility had a consistent tendency to lead to even-higher prices over the medium- to long-term.
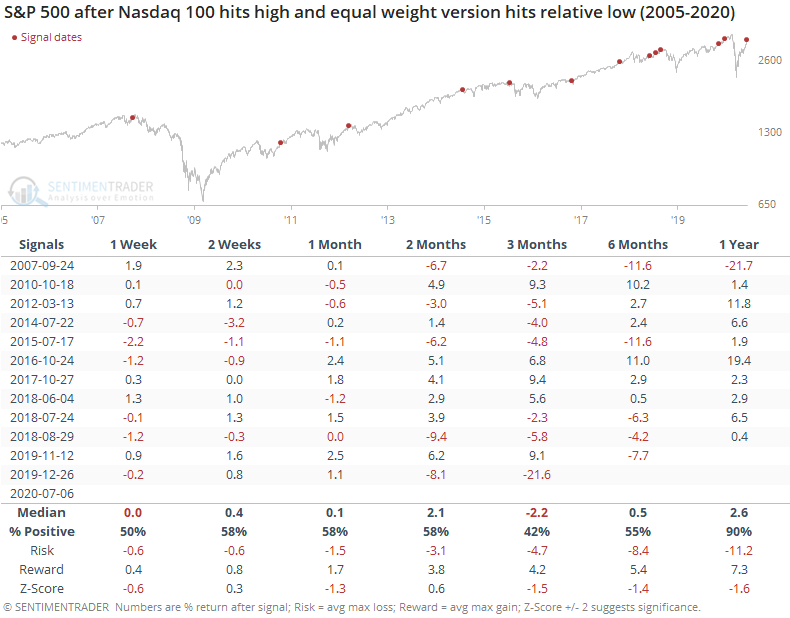
Big stocks continue to power the Nasdaq higher:
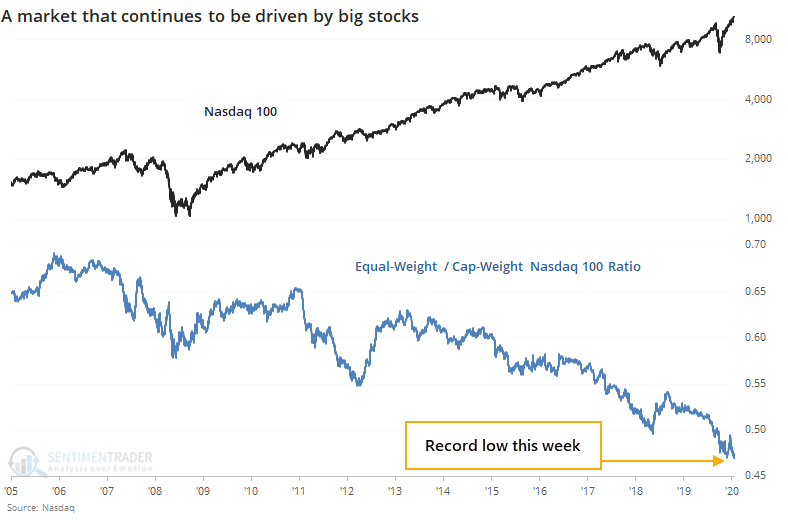
Even as the Nasdaq 100 powers to new highs, it is being driven by the largest stocks. The equal-weight version of the index just hit a new low relative to the cap-weight version.
The S&P is golden: The S&P 500's 50-day moving average should cross above its 200-day average for the first time in months. That will fully erase a decline when the 50-day was more than 9% below the 200-day. While the "Golden Cross" has been only a moderately useful technical signal, when it erased a spread this wide since 1950, the S&P lost a maximum of only -5.6% at any point over the next year out of 8 signals. On average, its maximum reward was more than 22%, so this has been a very good sign during modern markets.
Bottom Line:
- Weight of the evidence has been suggesting flat/lower stock prices short- to medium-term, though that turned more neutral as stocks pulled back recently; still suggesting higher prices long-term
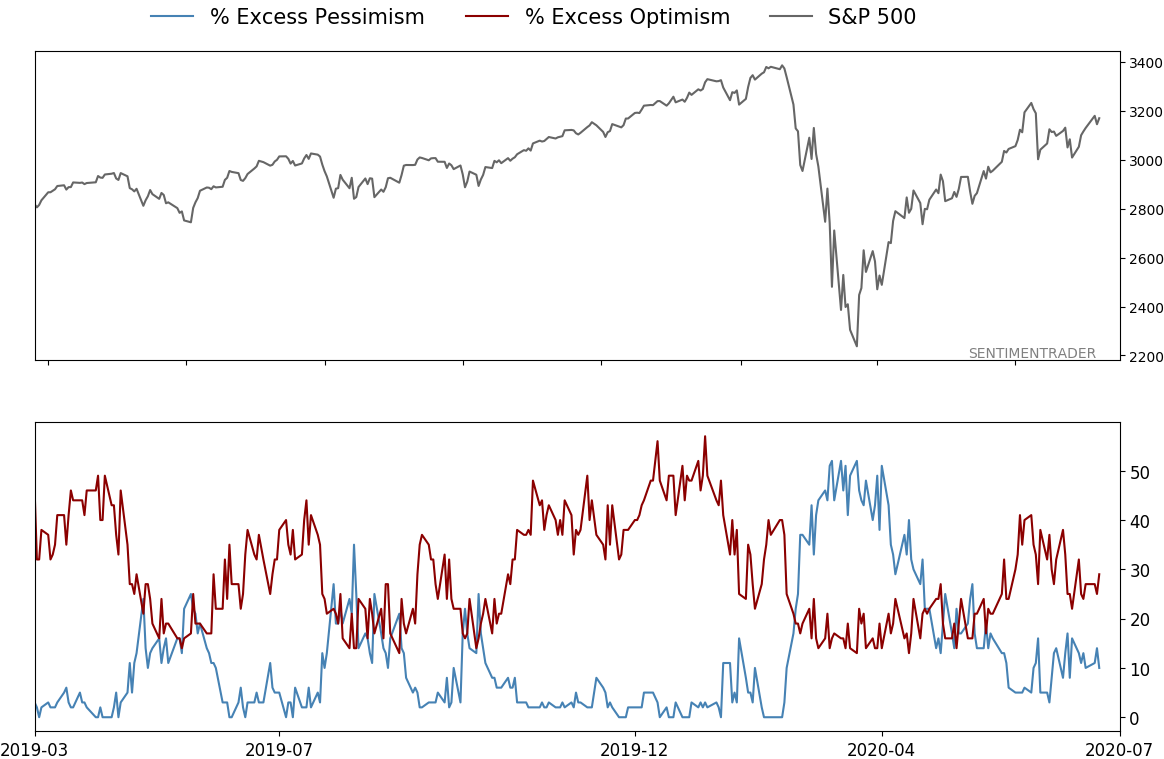
- Indicators show high and declining optimism, as Dumb Money Confidence neared 80% in early June with signs of reckless speculation and historic buying pressure, during what appears to be an unhealthy market environment
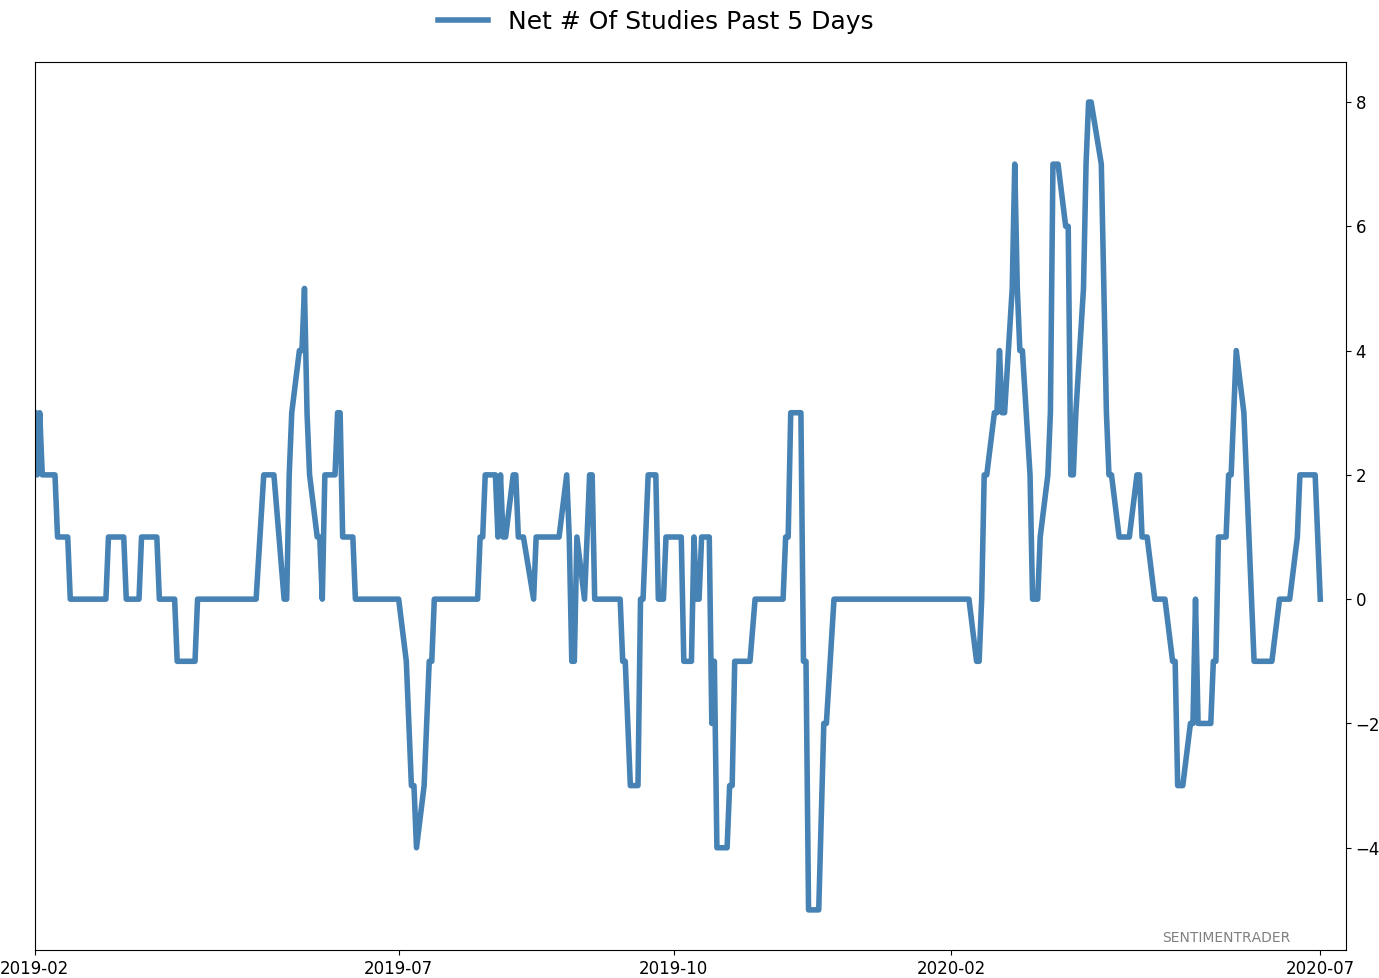
- Active Studies show a heavy positive skew over the medium- to long-term; breadth thrusts and recoveries have an almost unblemished record at preceding higher prices over a 6-12 month time frame
- Signs of extremely skewed preference for tech stocks nearing exhaustion, especially relative to industrials and financials (here and here)
- Indicators and studies for other markets are mixed with no strong conclusion
|
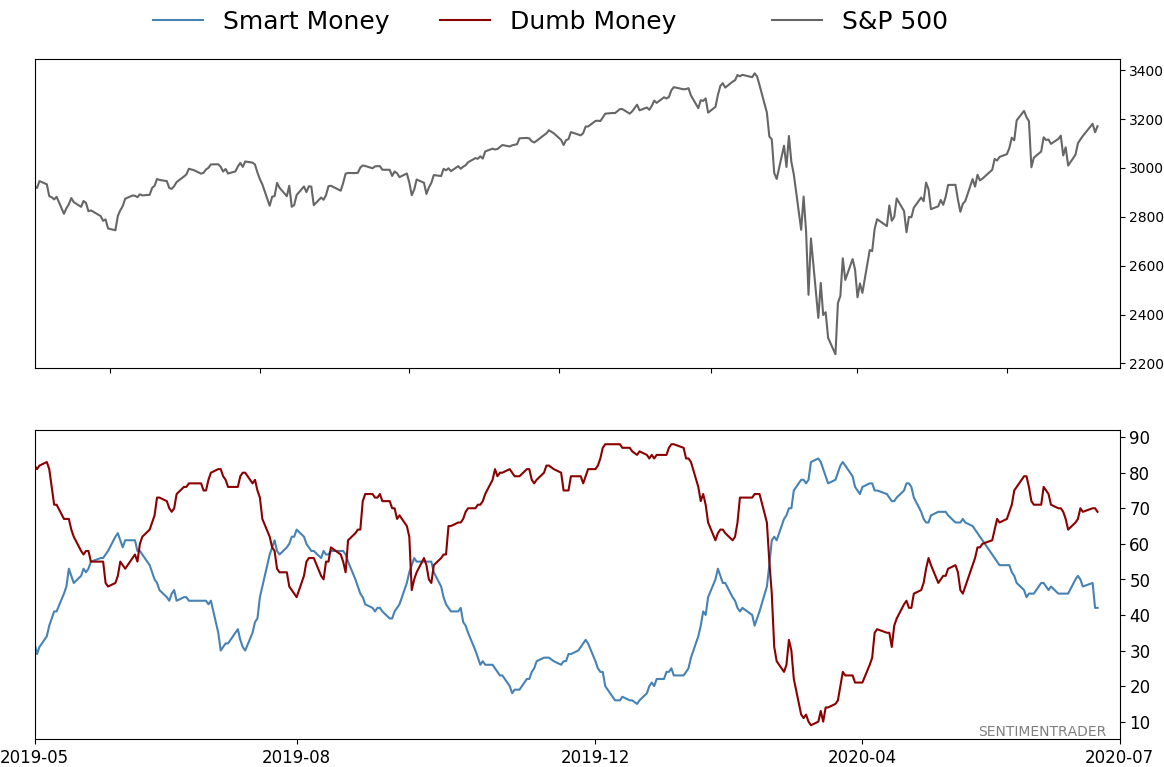
Smart / Dumb Money Confidence
|
Smart Money Confidence: 42%
Dumb Money Confidence: 69%
|
|
Risk Levels
Stocks Short-Term
|
Stocks Medium-Term

|
|
Bonds
|
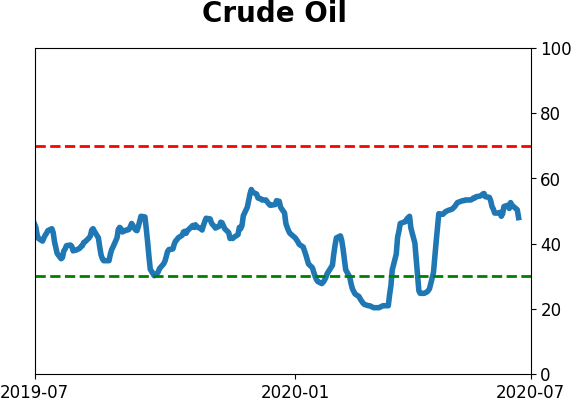
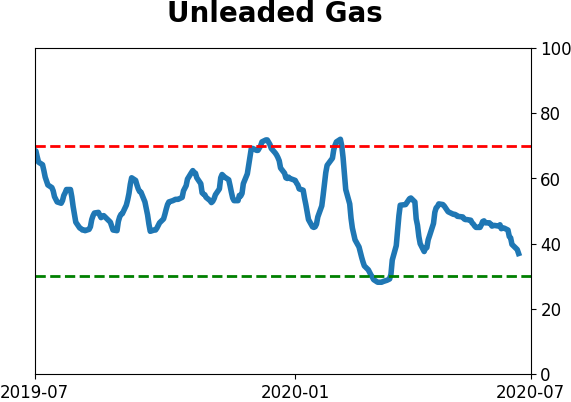
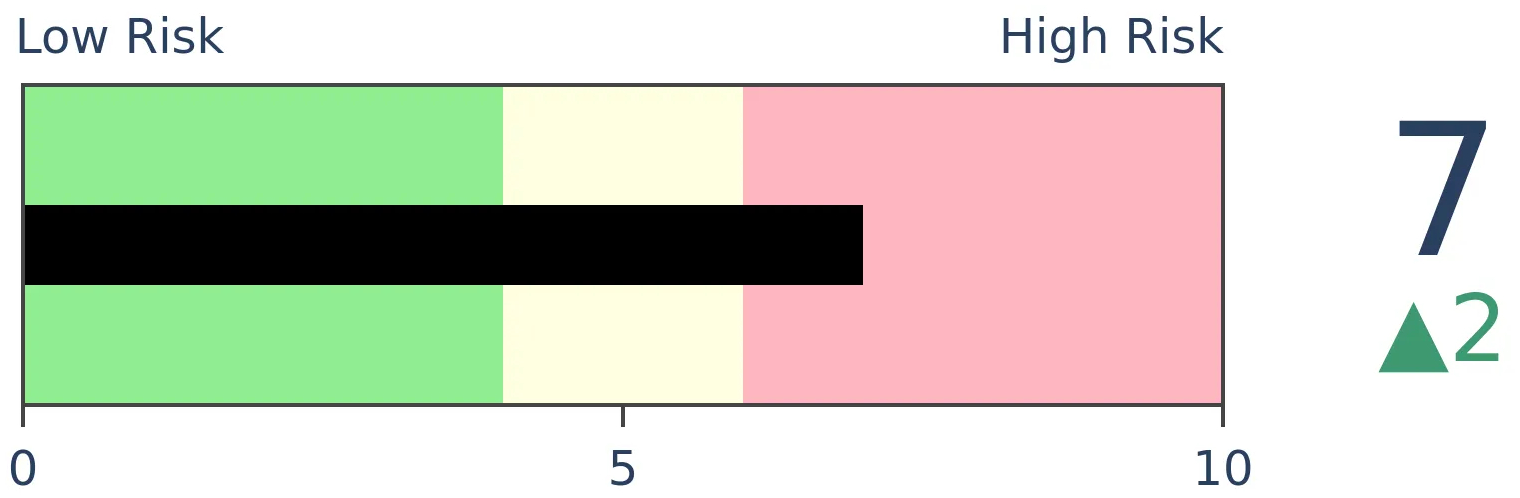
Crude Oil

|
|
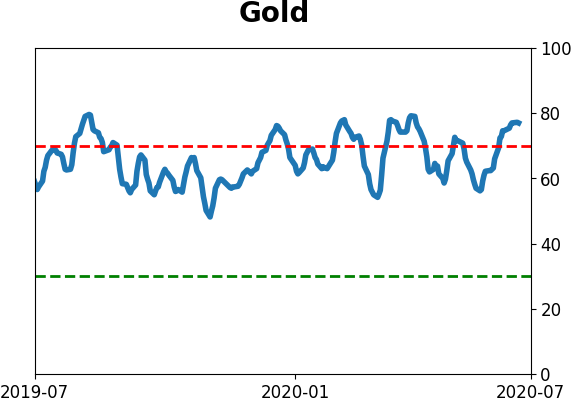
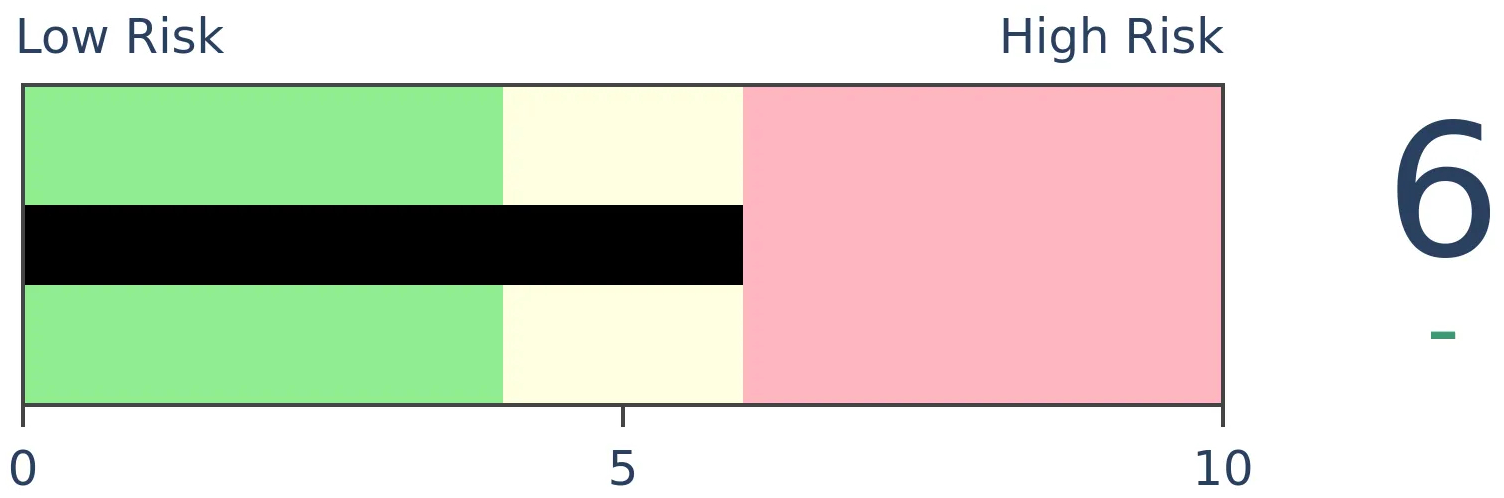
Gold

|
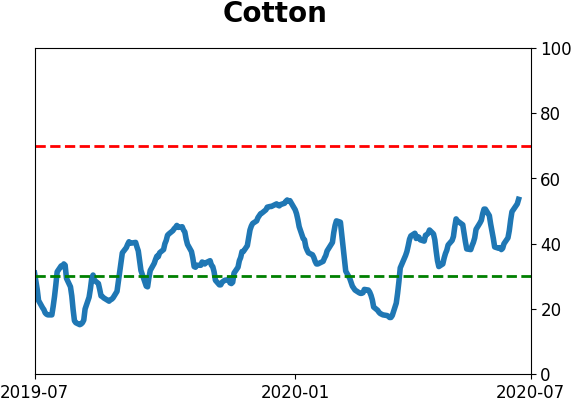
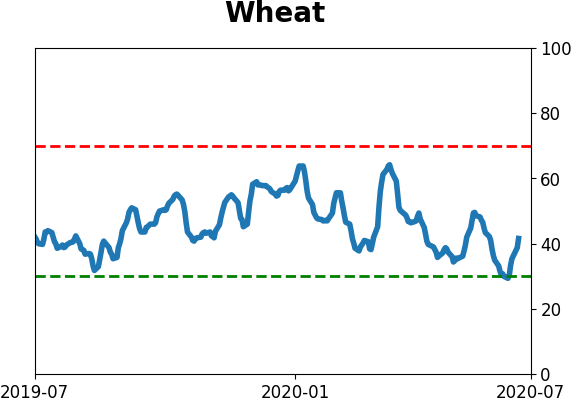
Agriculture

|
|
Research
BOTTOM LINE
Over the past 3 months, the S&P 500 has enjoyed a historic rally. Even so, options traders are still pricing in a relatively high amount of volatility. Using a synthetic VIX back to 1962, we can see that big rallies accompanied by high volatility had a consistent tendency to lead to even-higher prices over the medium- to long-term.
FORECAST / TIMEFRAME
SPY -- Up, Long-Term
|
Stocks have enjoyed a historic rally over the last quarter, and yet options traders still seem relatively nervous.
As noted by Bloomberg, the S&P 500 has rallied strongly over several months, but the VIX "fear gauge" is higher than it typically would be given such a large rise in prices.
"Typically when stocks rise, the VIX falls as traders look forward to less turbulence ahead, and vice versa. Yet the likes of Goldman Sachs Group Inc. consider the gap between the gauge and S&P 500 returns one of the largest on record, thanks in part to the dizzying speed of the cash-equity rally."
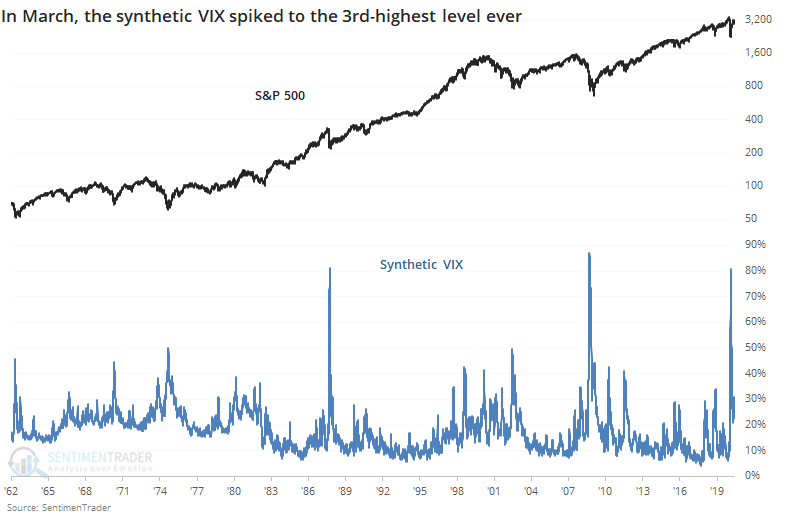
If we use the calculation for a synthetic VIX that we've used in the past, then we can see that we're still coming down from a historic spike, the 3rd-highest since 1962.
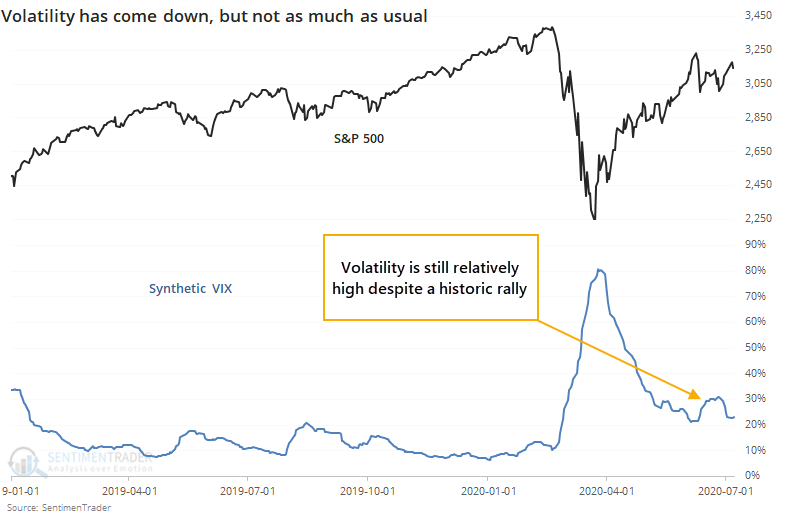
In recent months, stocks have rallied hard, and the synthetic VIX has declined significantly but still remains well above 20%.
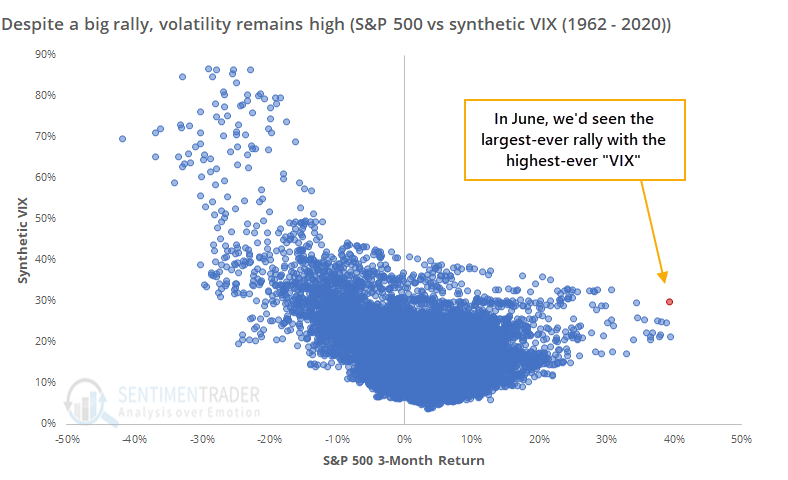
When we plot the S&P's 3-month return against the level of the synthetic VIX, then we can see the outliers (especially in June), confirming the note by Goldman Sachs.
The biggest question, as always, is "so what?" Let's check to see if this has any bearing on future returns.
The table below shows every date since 1962 when the S&P 500 rallied at least 20% over a 3-month period, and yet the synthetic VIX remained above 23%.
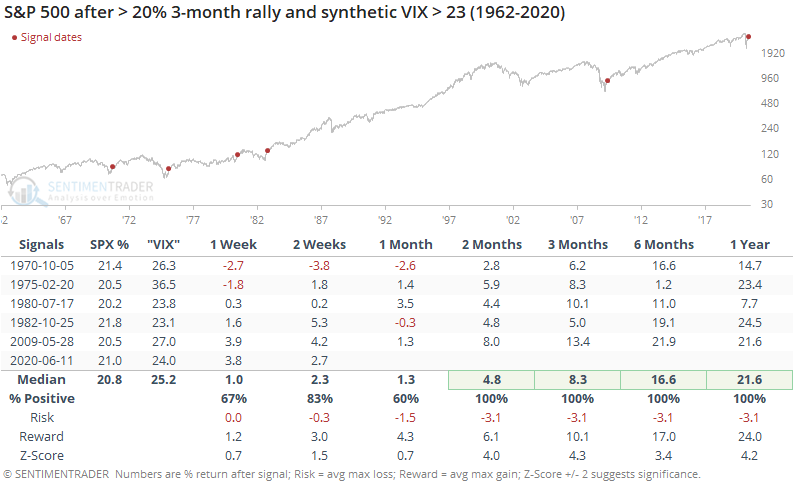
This triggered nearly a month ago and remains in effect, even as the S&P's rate of growth has slowed. The prior signals did not show that it was a worry that volatility remained elevated even during a major rally.
From two months and beyond, the S&P continued its rally all 5 times, enjoying a heavily skewed risk/reward ratio. Every one of them triggered after major corrections when volatility spiked so much that it was still high months after stocks rallied strongly.
Now, let's check the other scenario when stocks rallied hard but the synthetic VIX fell to a lower level.
This wasn't a major worry, either. Shorter-term returns were better than when the synthetic VIX stayed high, but longer-term returns were lower.
The biggest takeaways are that:
- Extremely high levels of volatility like we saw in March almost universally lead to higher 6-12 month prices in stocks
- Very large 3-month rallies in stocks tend to lead to even-higher prices over the medium- to long-term
- Elevated volatility in spite of a large rally in stocks has not been a reason for worry
BOTTOM LINE
Even as the Nasdaq 100 powers to new highs, it is being driven by the largest stocks. The equal-weight version of the index just hit a new low relative to the cap-weight version.
FORECAST / TIMEFRAME
None
|
The major indexes continue to be driven by big stocks. That's not a new insight, but it's also not changing.
Yet again this week, the Nasdaq 100 (NDX) has hit new highs. The NDX is a modified capitalization-weighted index, so the largest stocks can drive returns in the index, up to a point.
While it doesn't have much history, there is also a version of the NDX that weights each of the stocks equally. While the NDX we all watch has been hitting new highs, the equal-weight version of the index has been doing okay, too. It's just not doing as well, and it has declined to a new low relative to the cap-weighted version.
For the main NDX, this has been a mixed sign, though with below-average returns over the medium-term. The risk/reward was poor across all time frames. The table below shows every time the NDX closed at a 52-week high and the ratio of the equal-weight to cap-weight versions of the index closed at a 52-week low.
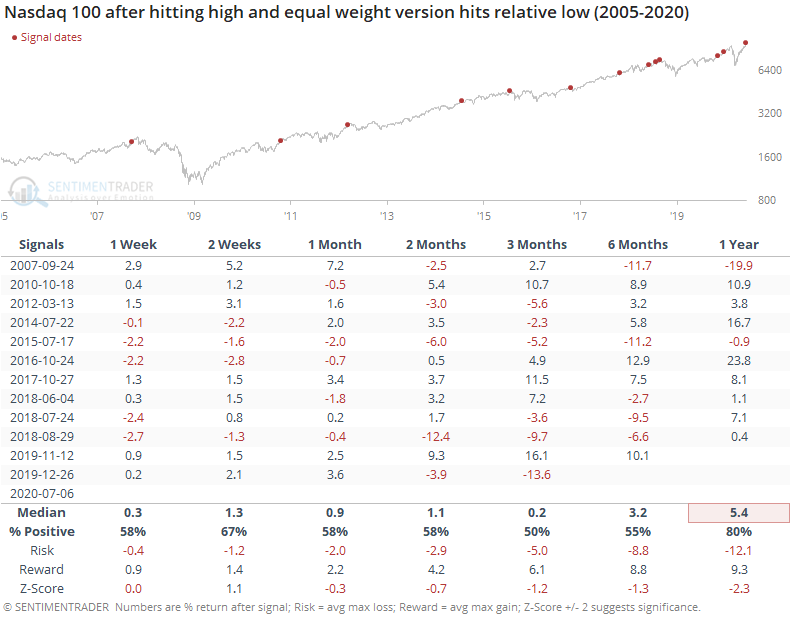
The rise of big stocks has been almost incessant over the past 15 years, so the ratio of the equal-weight to cap-weight index never really had much of a consistent chance to outperform even after big divergences like this.
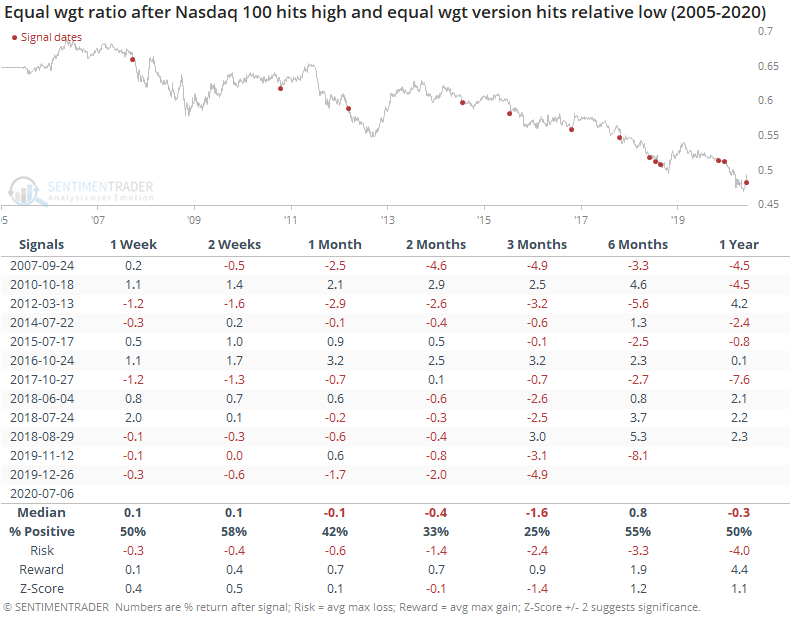
It wasn't a great sign for the broader market, either, with poor returns in the S&P 500 over the next three months in particular. It wasn't terribly consistent, though, and the failed warnings led to large gains.
The equal-weight version of the S&P 500 index is also closing in on its lows but hasn't quite made it there. We'll revisit if that happens in the days ahead. When we've looked at divergences like this in the past, between equal-weight and cap-weight versions of an index, it hasn't been a major warning, just a minor headwind, and typically it has not been a consistent reason to expect the big stocks to stop outperforming.
Active Studies
| Time Frame | Bullish | Bearish | | Short-Term | 0 | 0 | | Medium-Term | 8 | 6 | | Long-Term | 43 | 1 |
|
Indicators at Extremes
Portfolio
| Position | Weight % | Added / Reduced | Date | | Stocks | 29.8 | Reduced 9.1% | 2020-06-11 | | Bonds | 0.0 | Reduced 6.7% | 2020-02-28 | | Commodities | 5.2 | Added 2.4%
| 2020-02-28 | | Precious Metals | 0.0 | Reduced 3.6% | 2020-02-28 | | Special Situations | 0.0 | Reduced 31.9% | 2020-03-17 | | Cash | 65.0 | | |
|
Updates (Changes made today are underlined)
In the first months of the year, we saw manic trading activity. From big jumps in specific stocks to historic highs in retail trading activity to record highs in household confidence to almost unbelievable confidence among options traders. All of that came amid a market where the average stock couldn't keep up with their indexes. There were signs of waning momentum in stocks underlying the major averages, which started triggering technical warning signs in late January. After stocks bottomed on the 23rd, they enjoyed a historic buying thrust and retraced a larger amount of the decline than "just a bear market rally" tends to. Those thrusts are the most encouraging sign we've seen in years. Through early June, we were still seeing thrusts that have led to recoveries in longer-term breadth metrics. The longer-term prospects for stocks (6-12 months) still look decent given the above. On a short- to medium-term basis, it was getting harder to make that case. Dumb Money Confidence spiked and there were multiple signs of a historic level of speculation. This is likely the lowest I will go given what I still consider to be compelling positives over a longer time frame. There is not a slam-dunk case to be made for either direction, so it will seem like a mistake whether stocks keep dropping (why didn't I sell more?) or if they turn and head higher (why did I let short-term concerns prevail?). After nearly three decades of trading, I've learned to let go of the idea of perfection.
RETURN YTD: -4.9% 2019: 12.6%, 2018: 0.6%, 2017: 3.8%, 2016: 17.1%, 2015: 9.2%, 2014: 14.5%, 2013: 2.2%, 2012: 10.8%, 2011: 16.5%, 2010: 15.3%, 2009: 23.9%, 2008: 16.2%, 2007: 7.8%
|
|
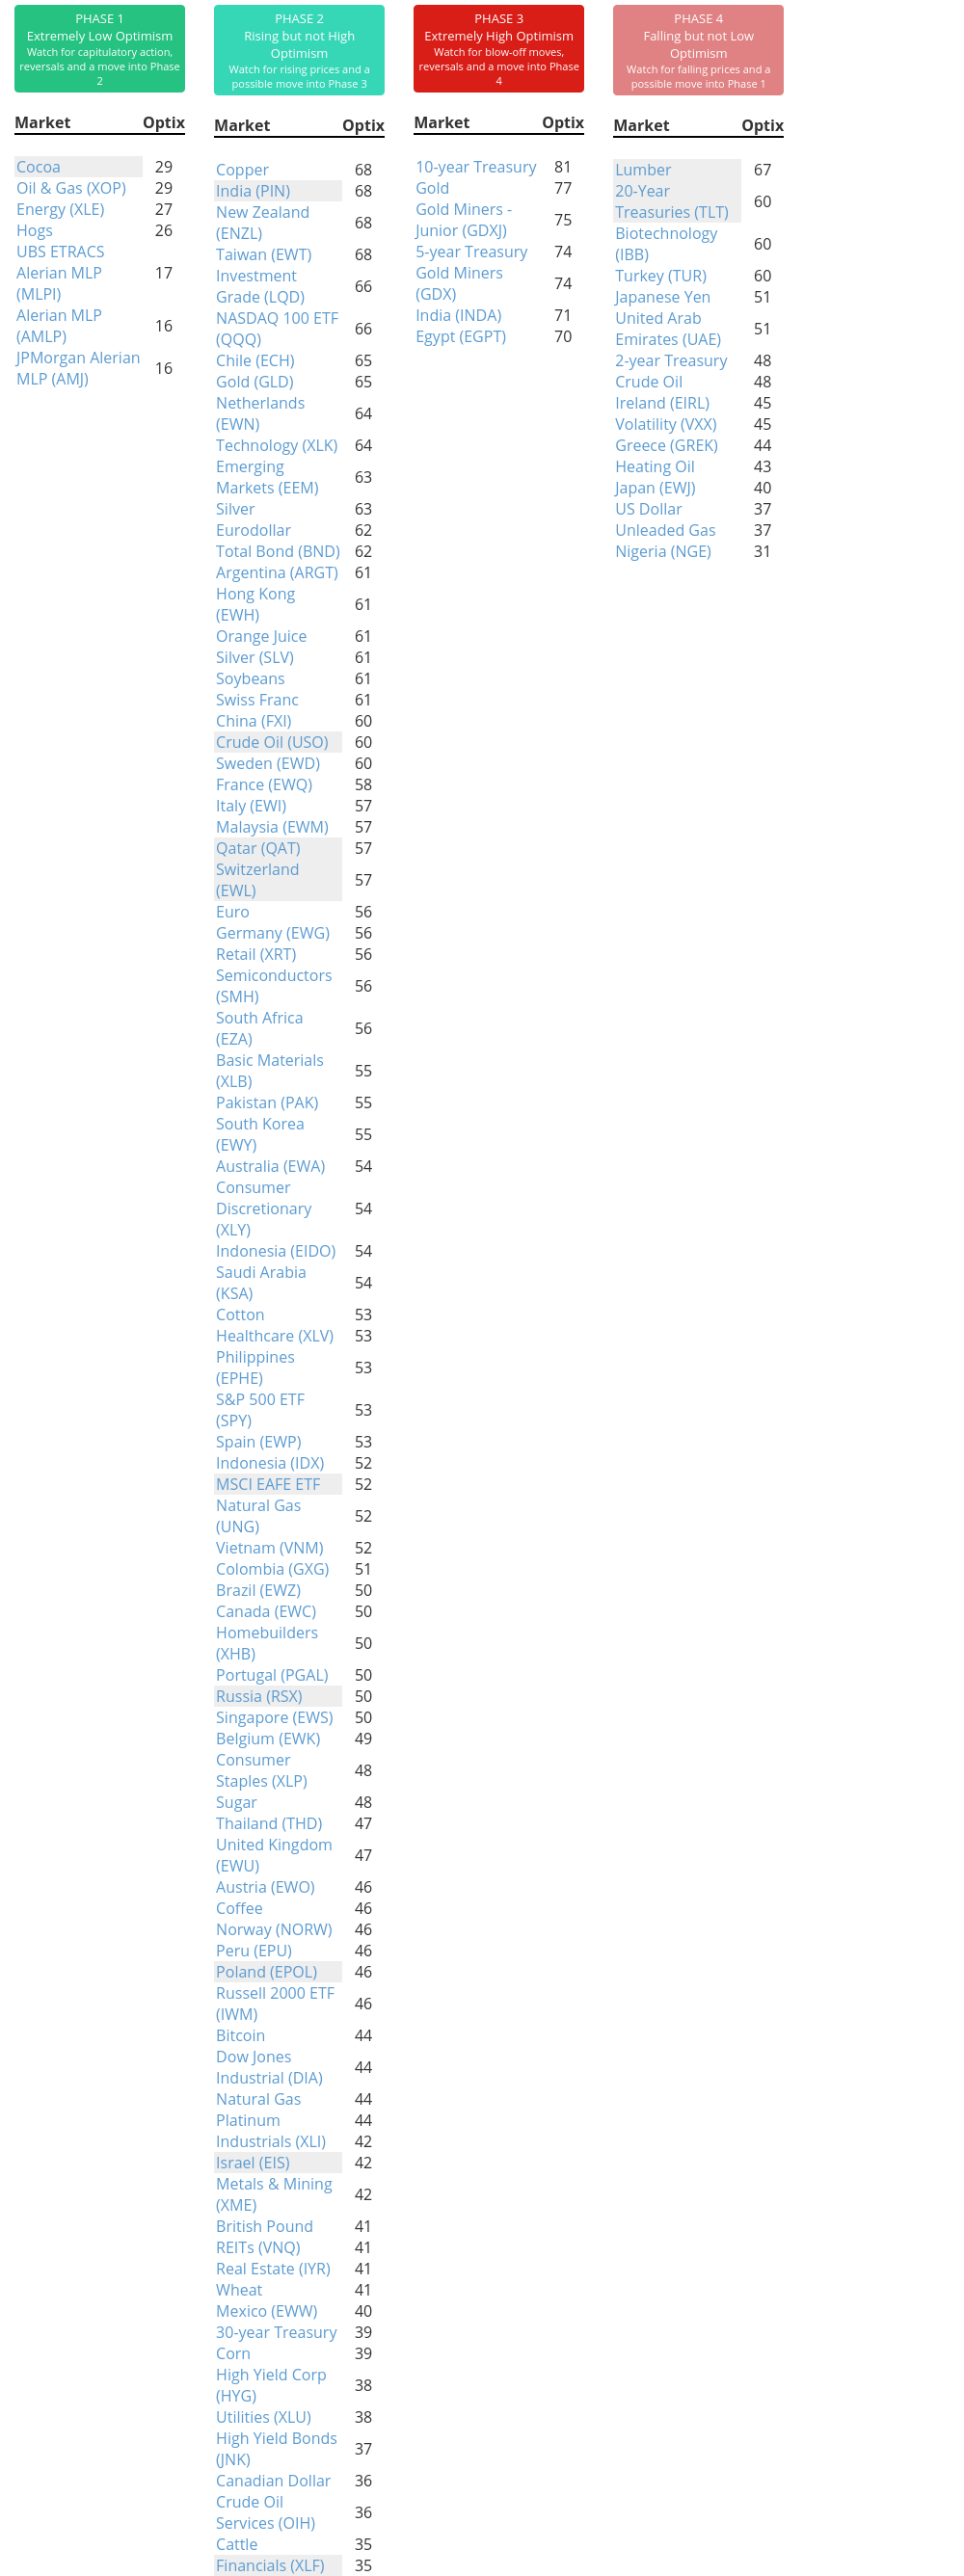
Phase Table
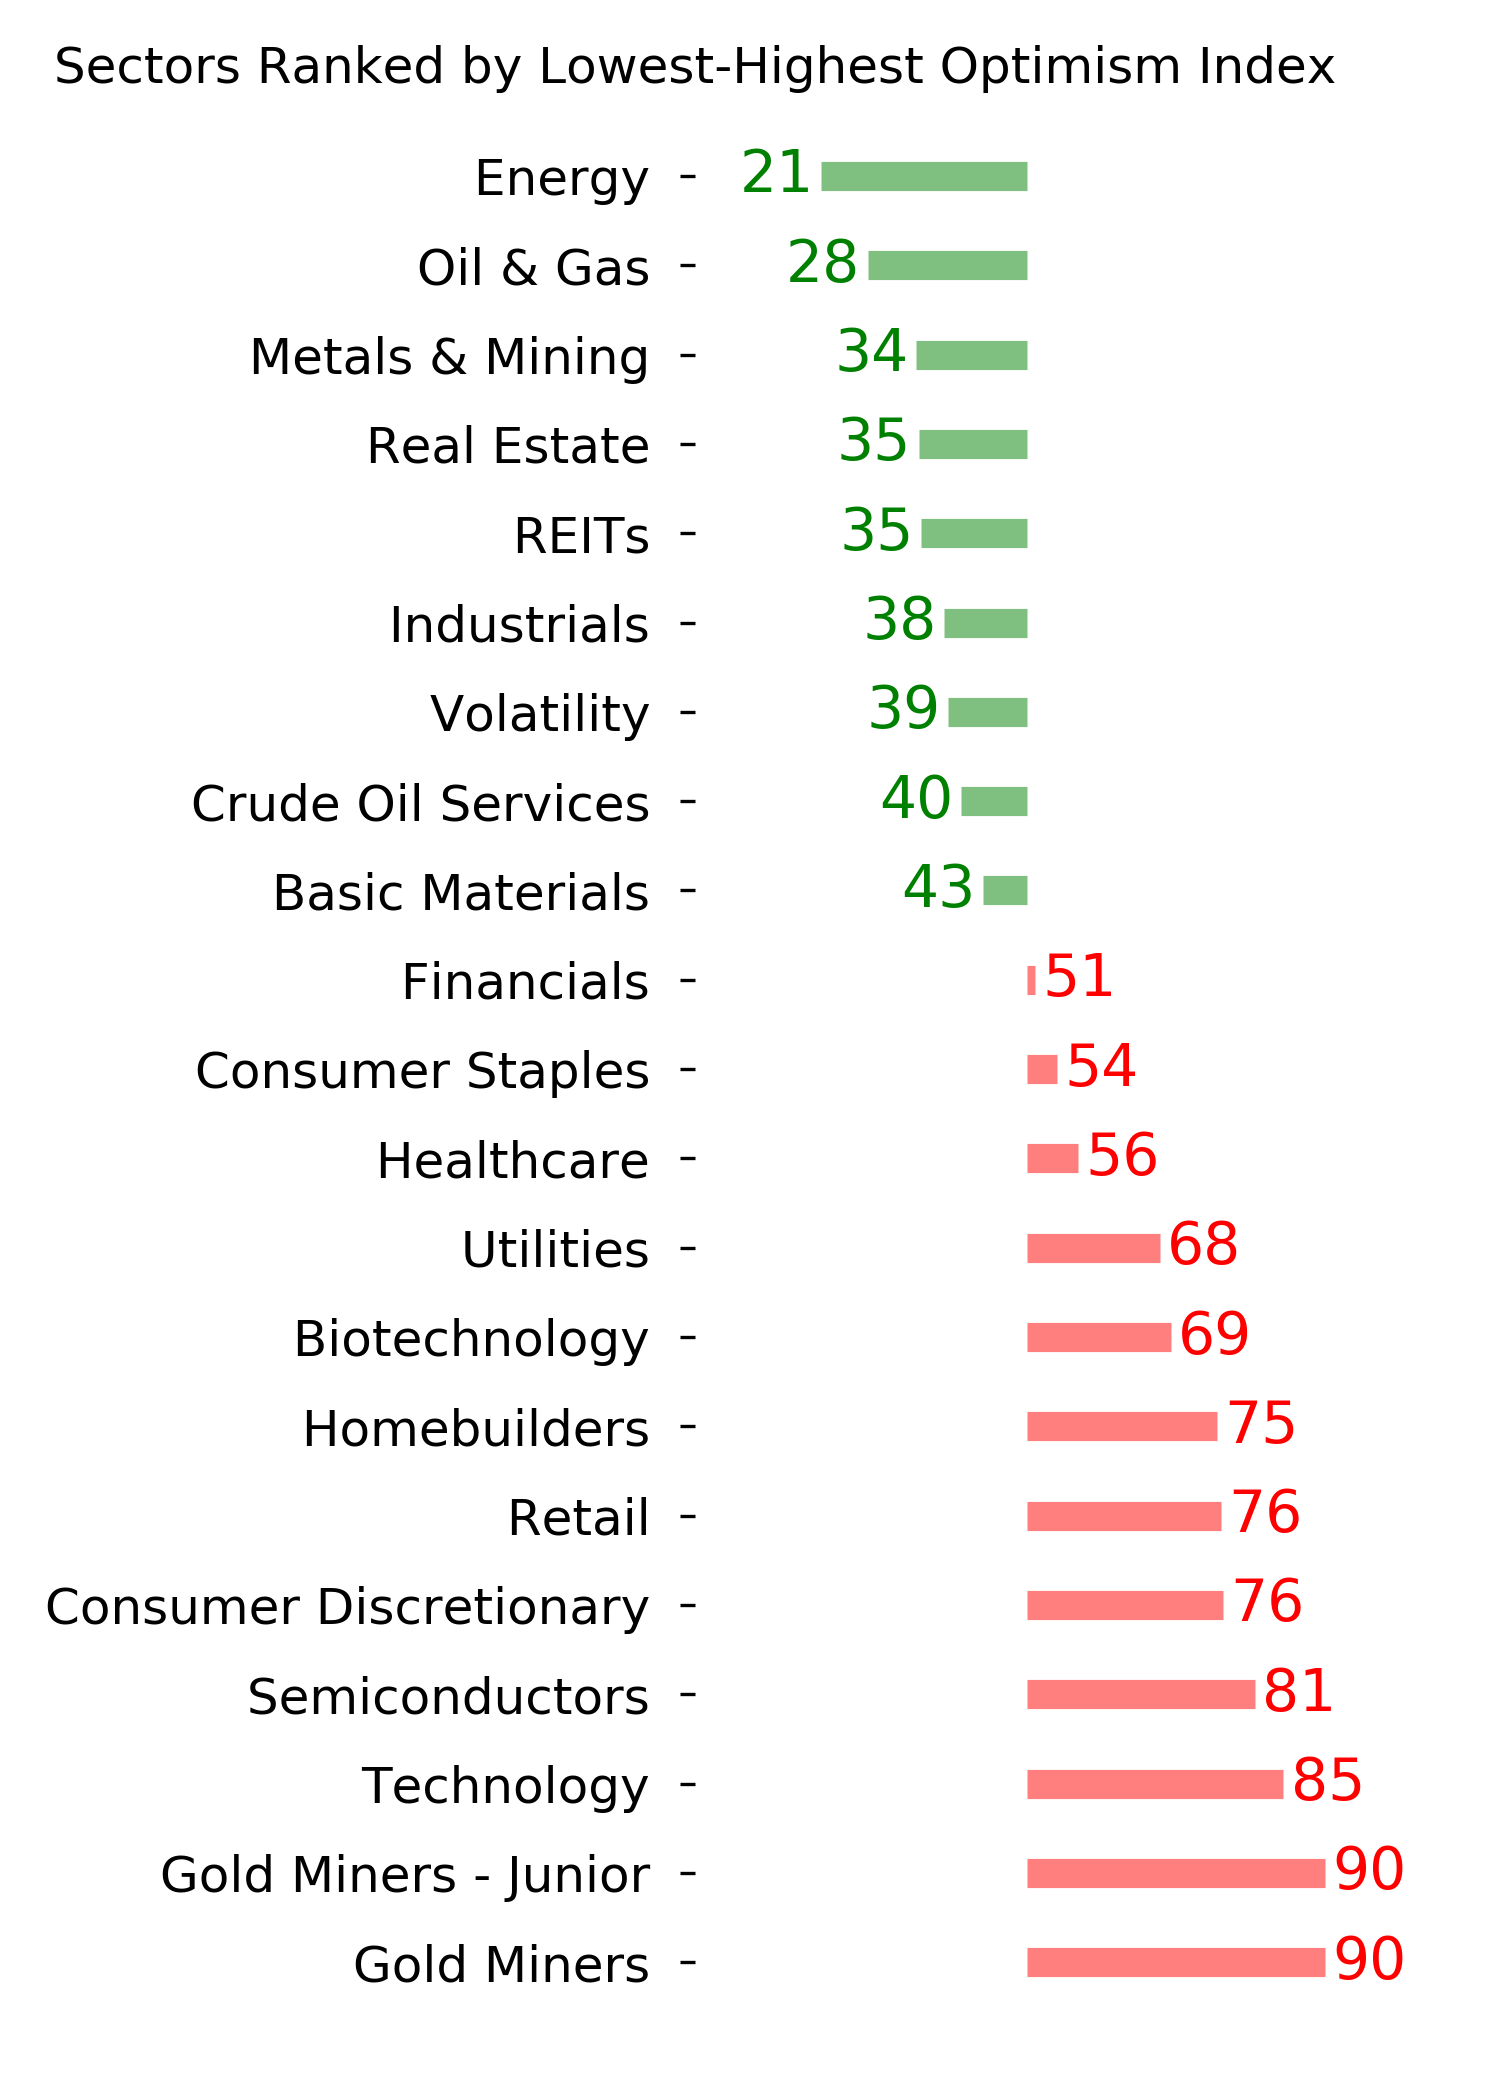
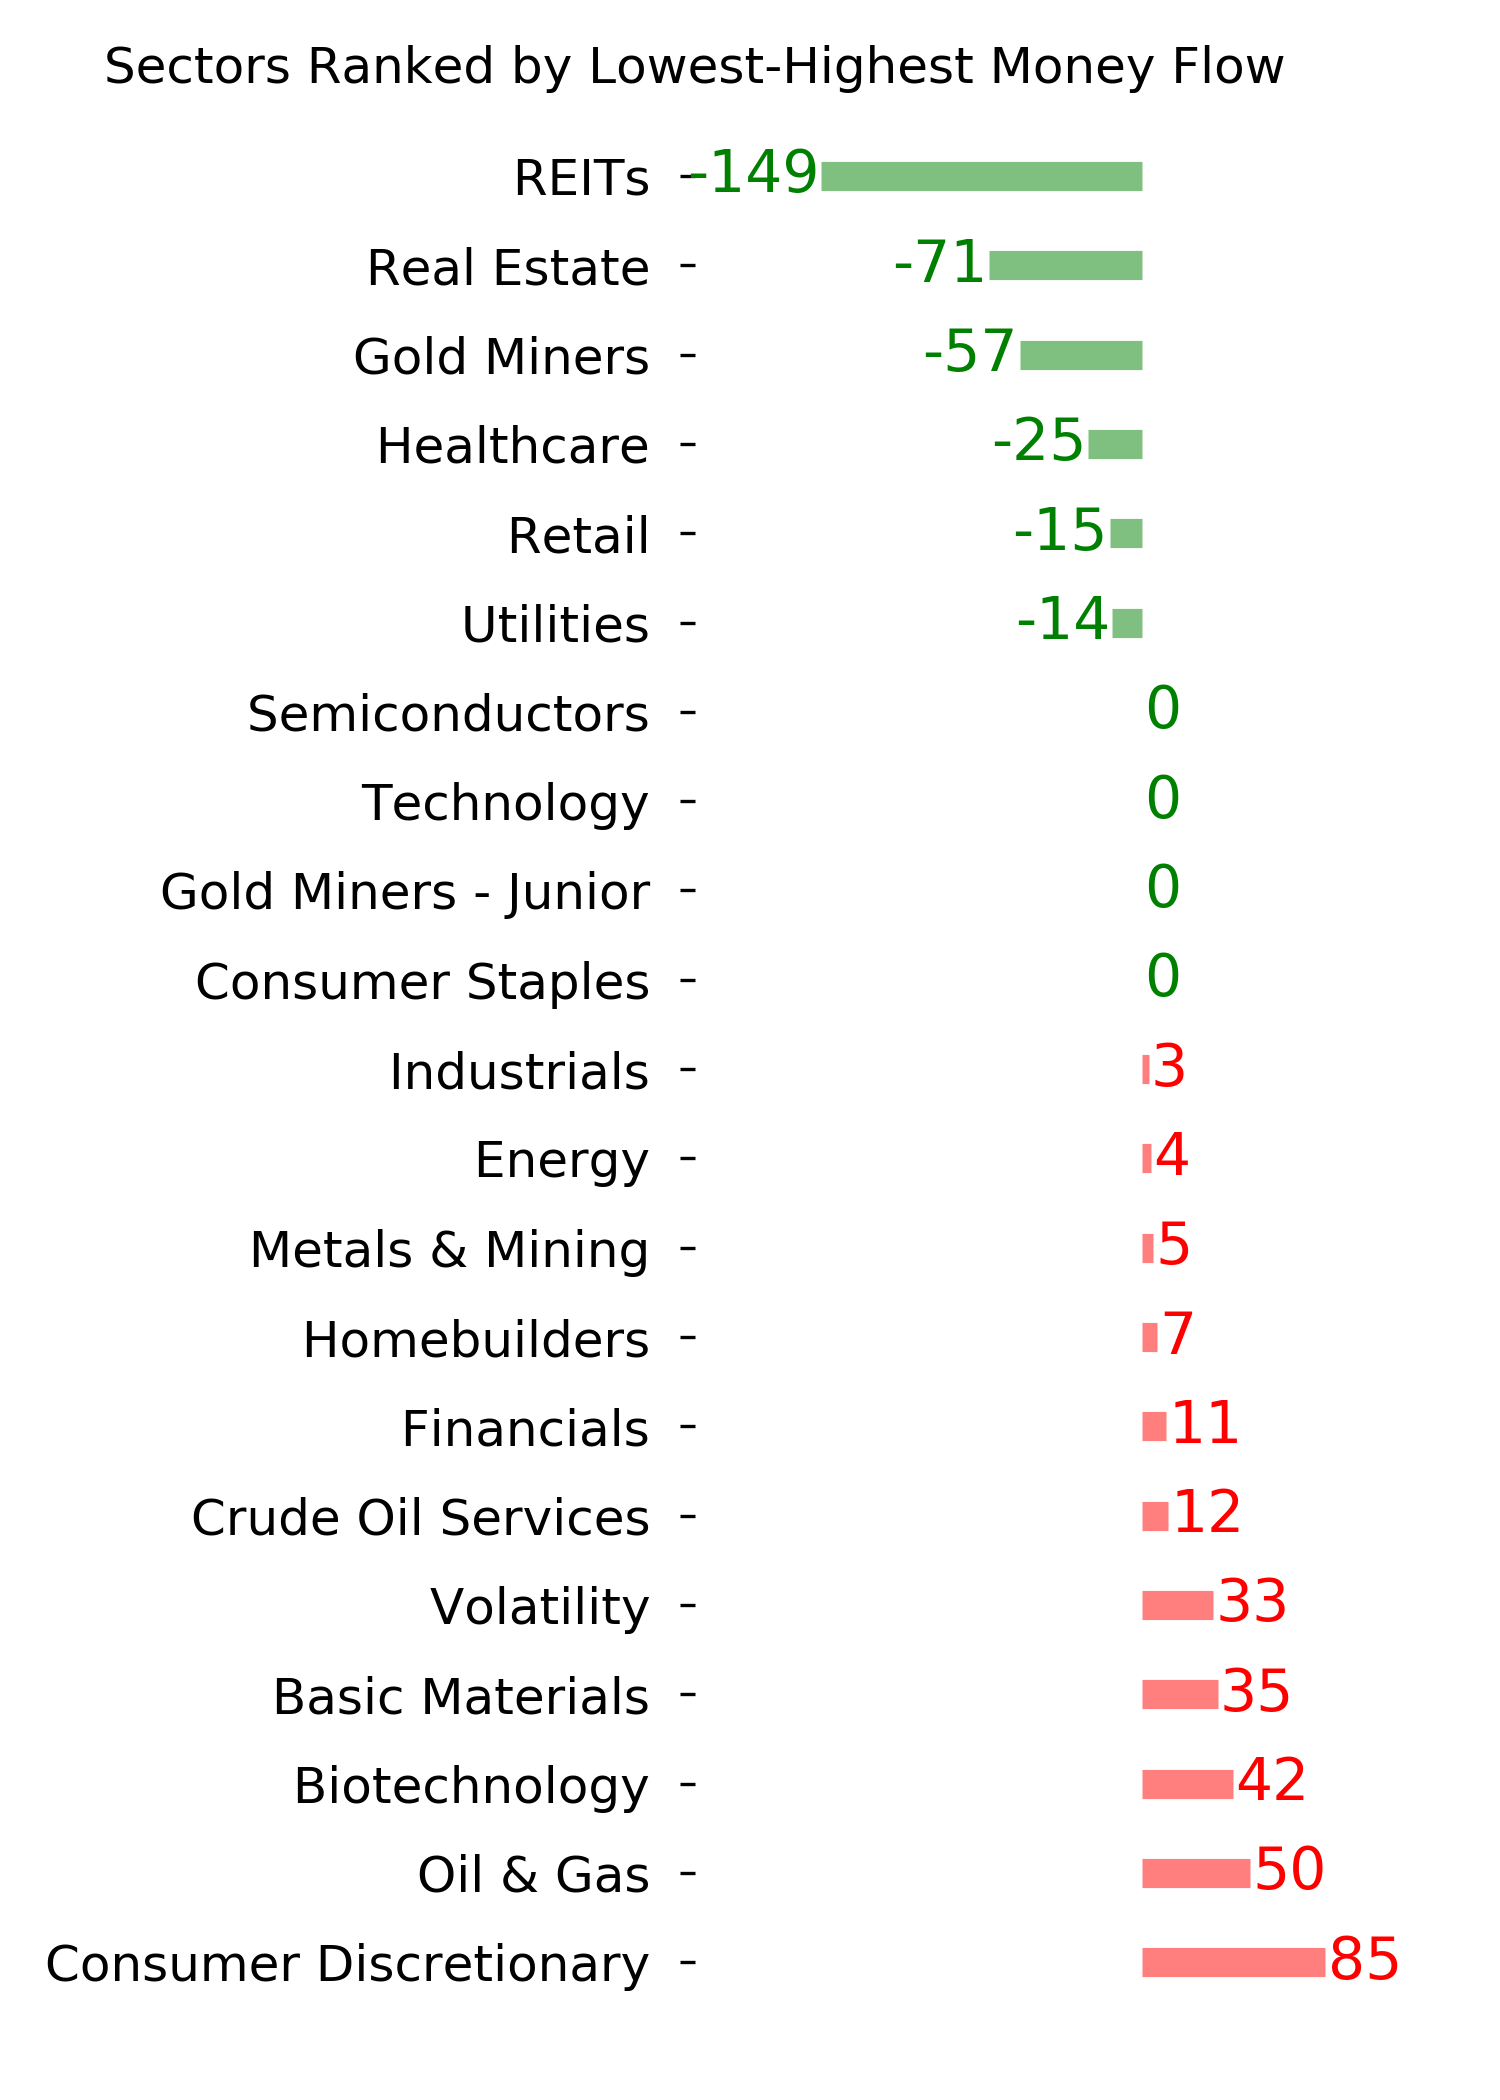
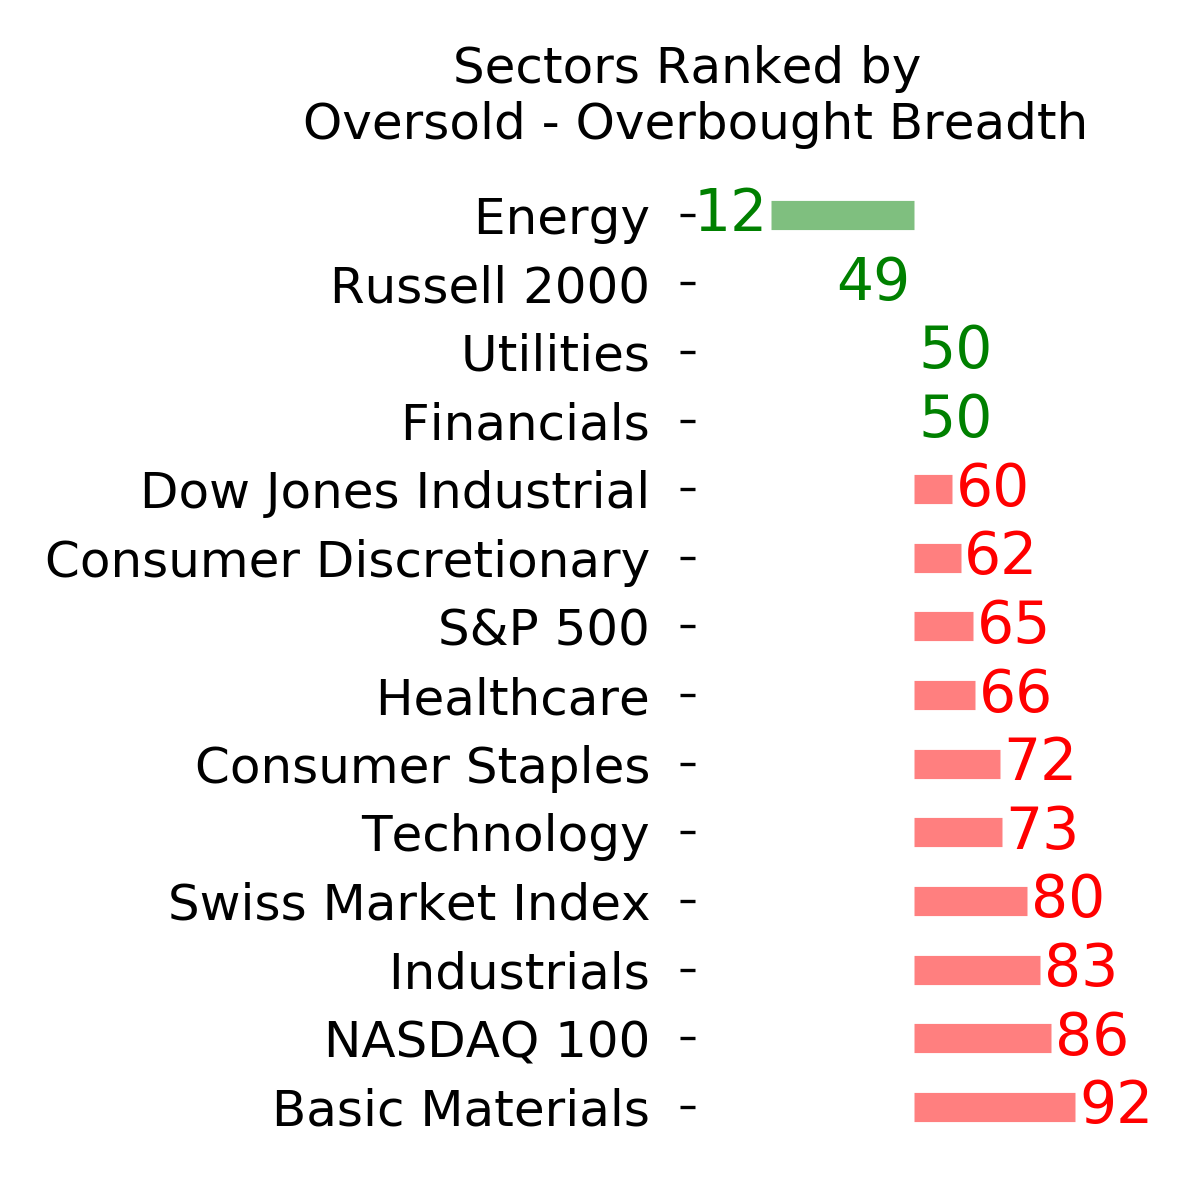
Ranks
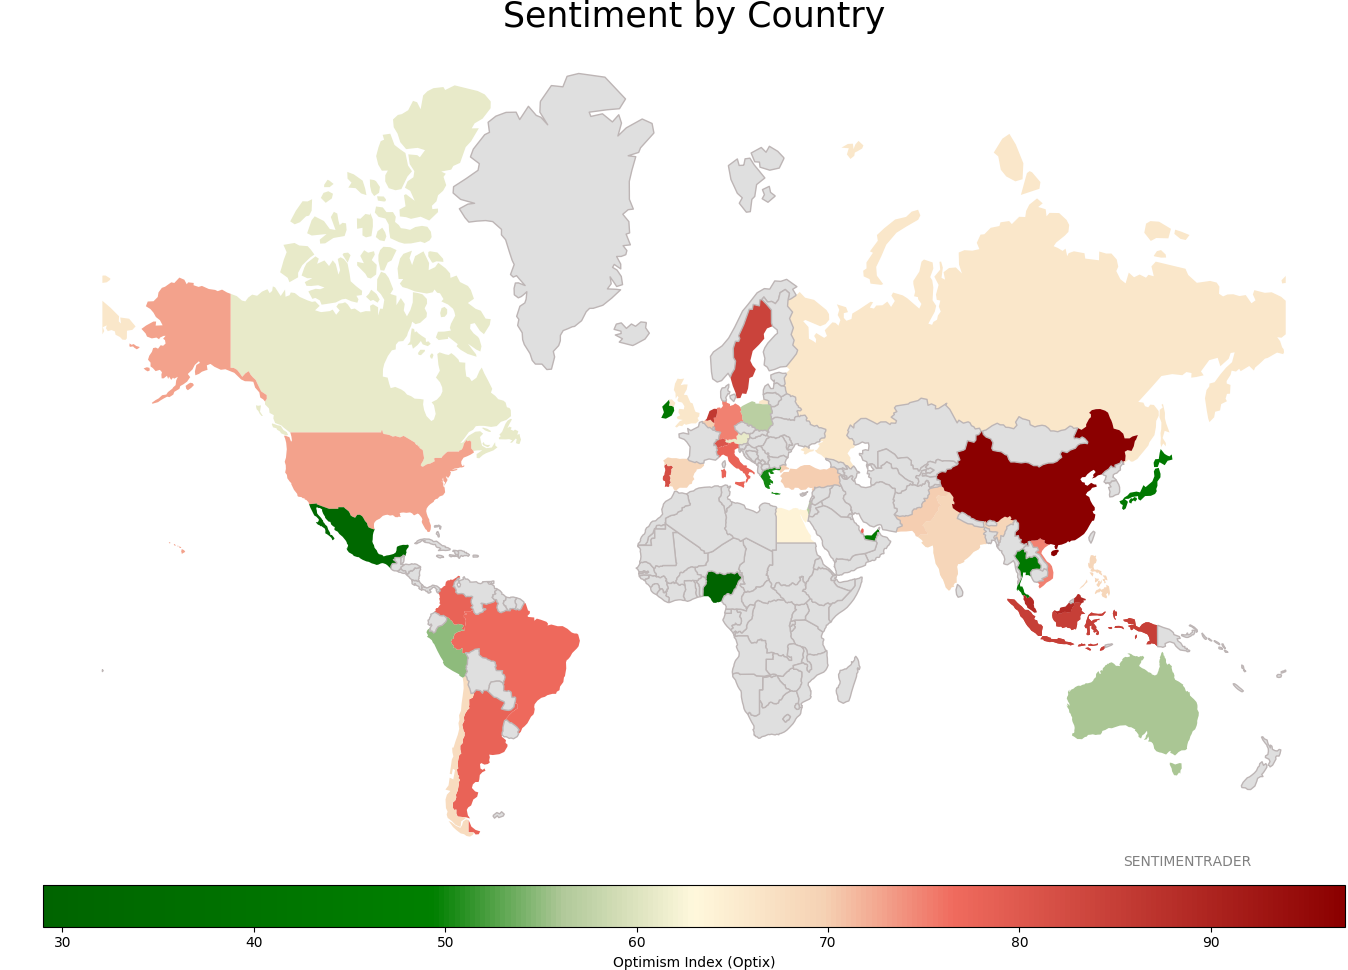
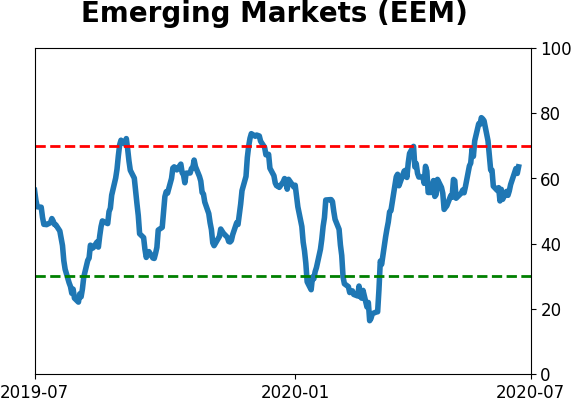
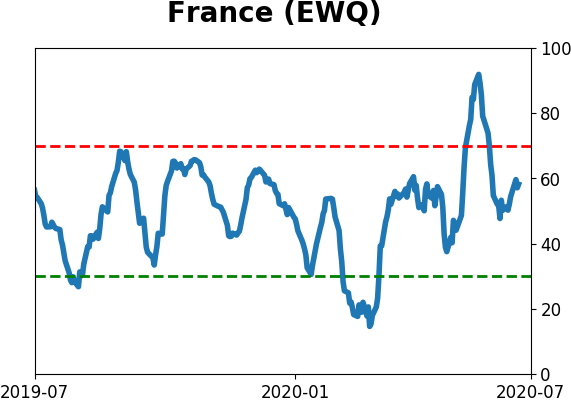
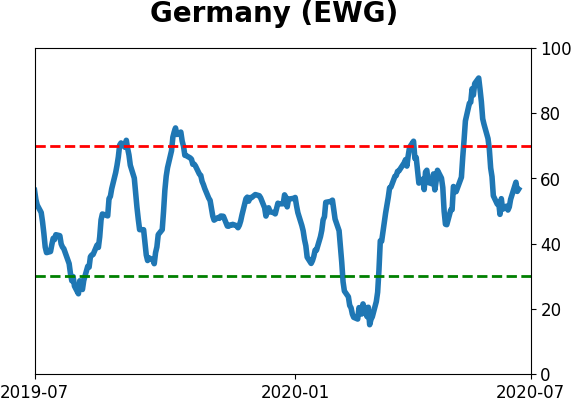
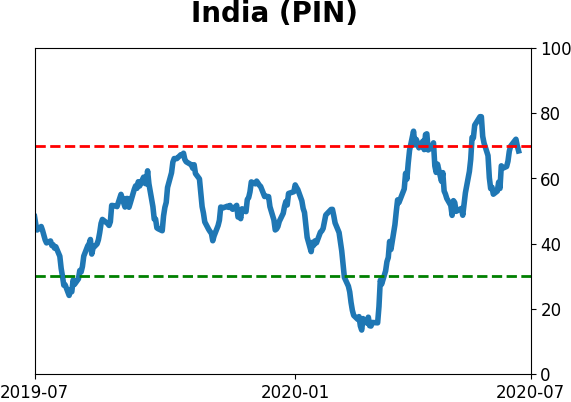
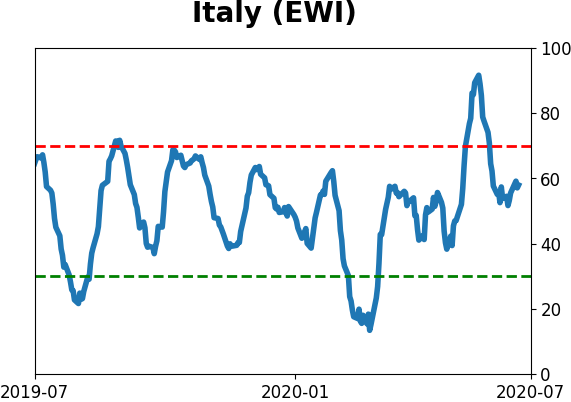
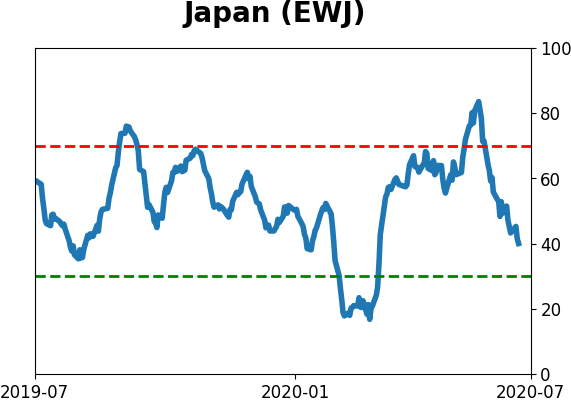
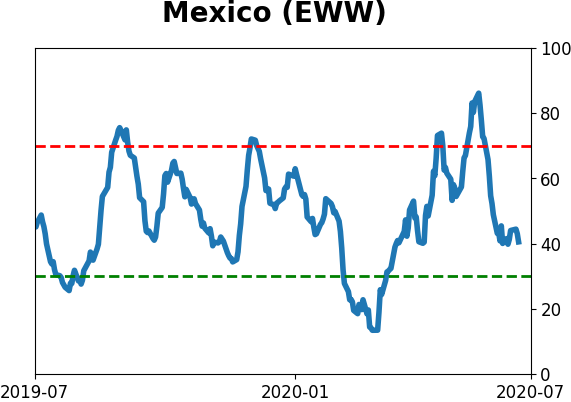
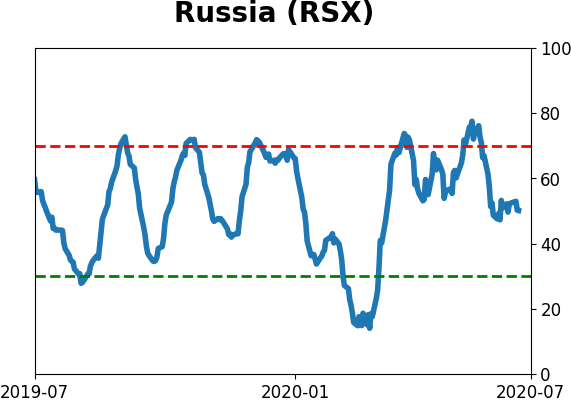
Sentiment Around The World
Optimism Index Thumbnails
|
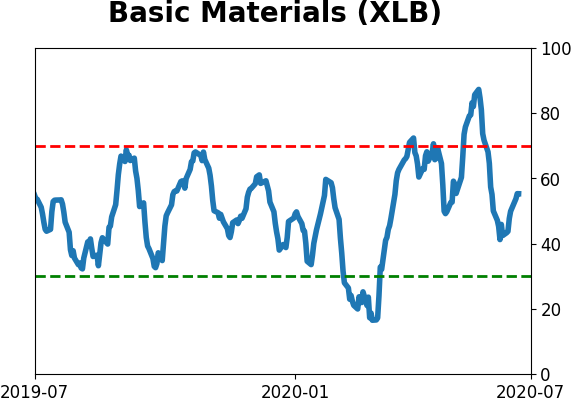
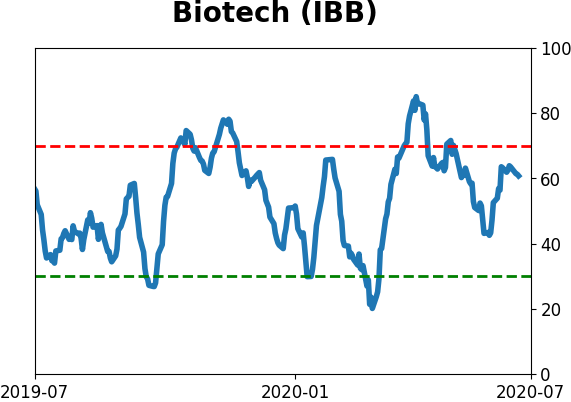
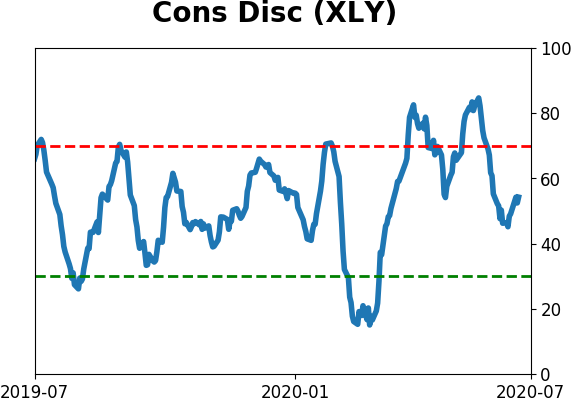
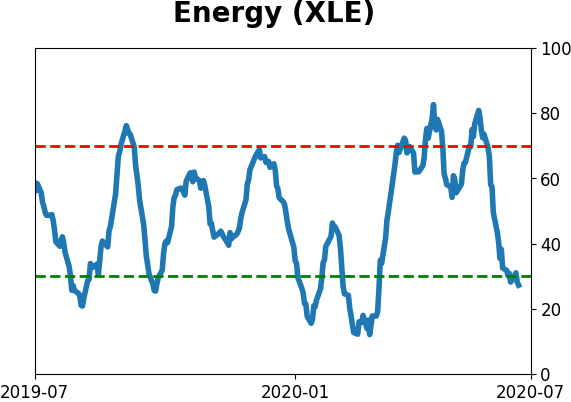
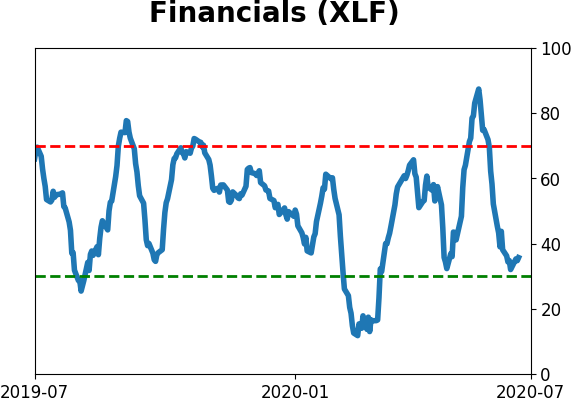
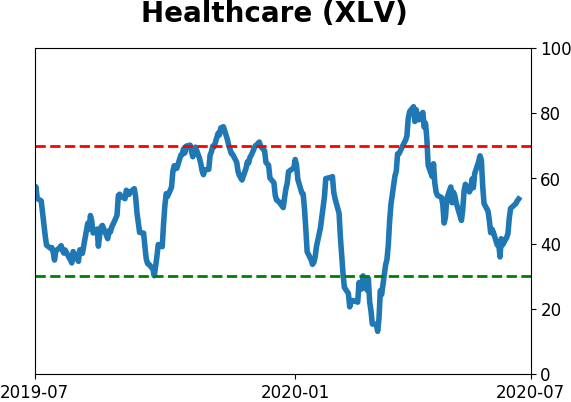
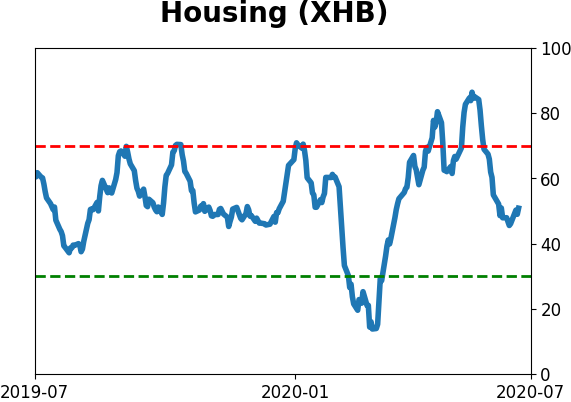
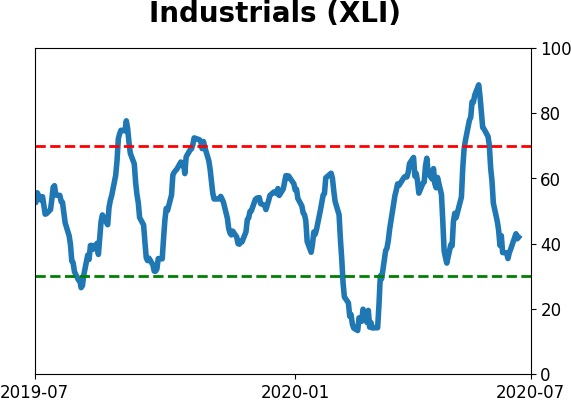
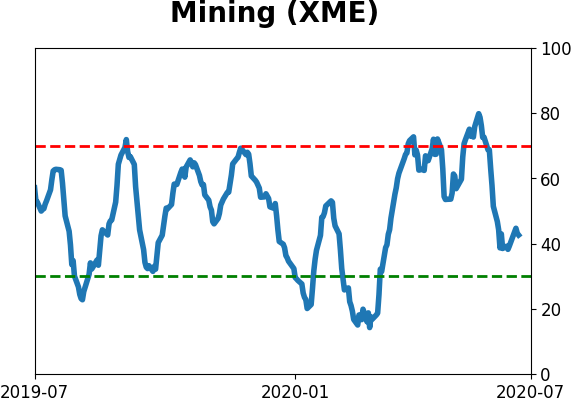
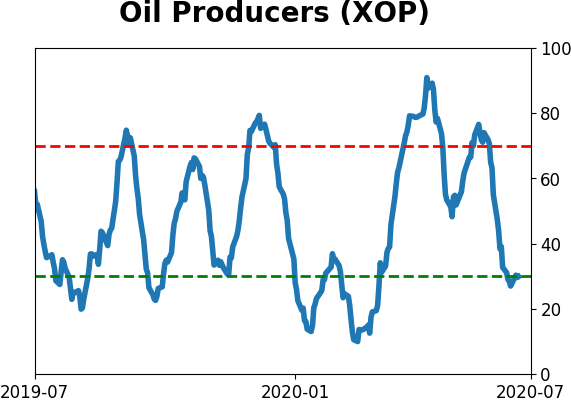
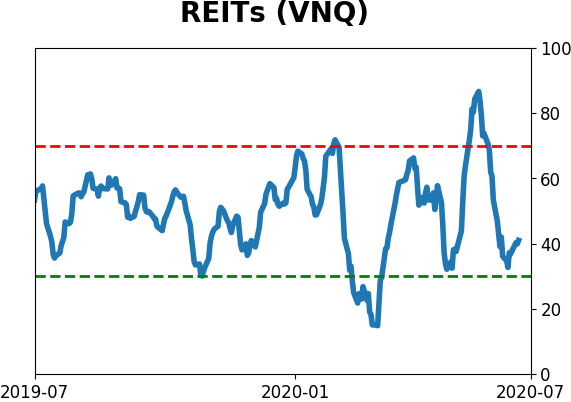
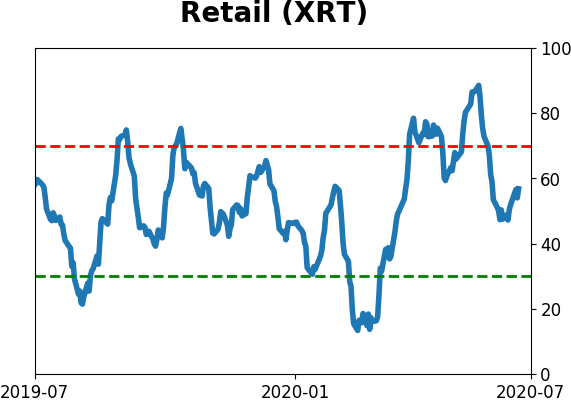
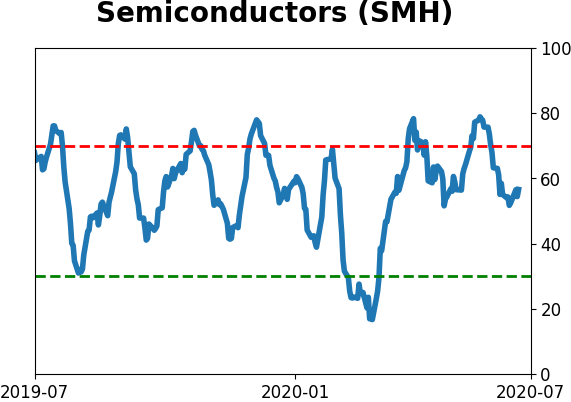
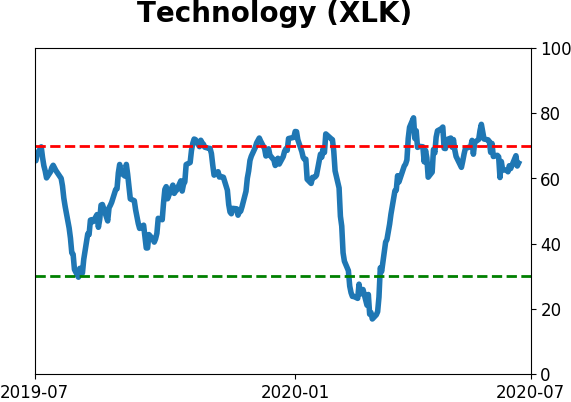
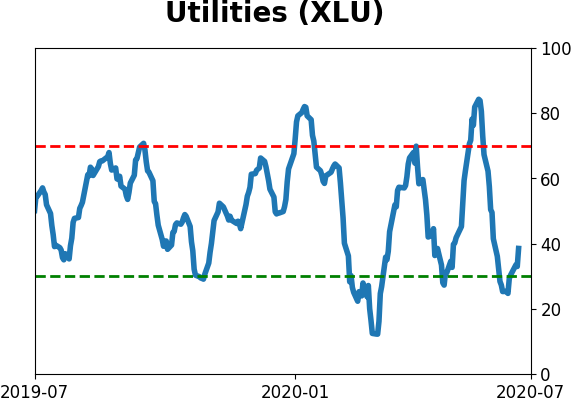
Sector ETF's - 10-Day Moving Average
|
|
|
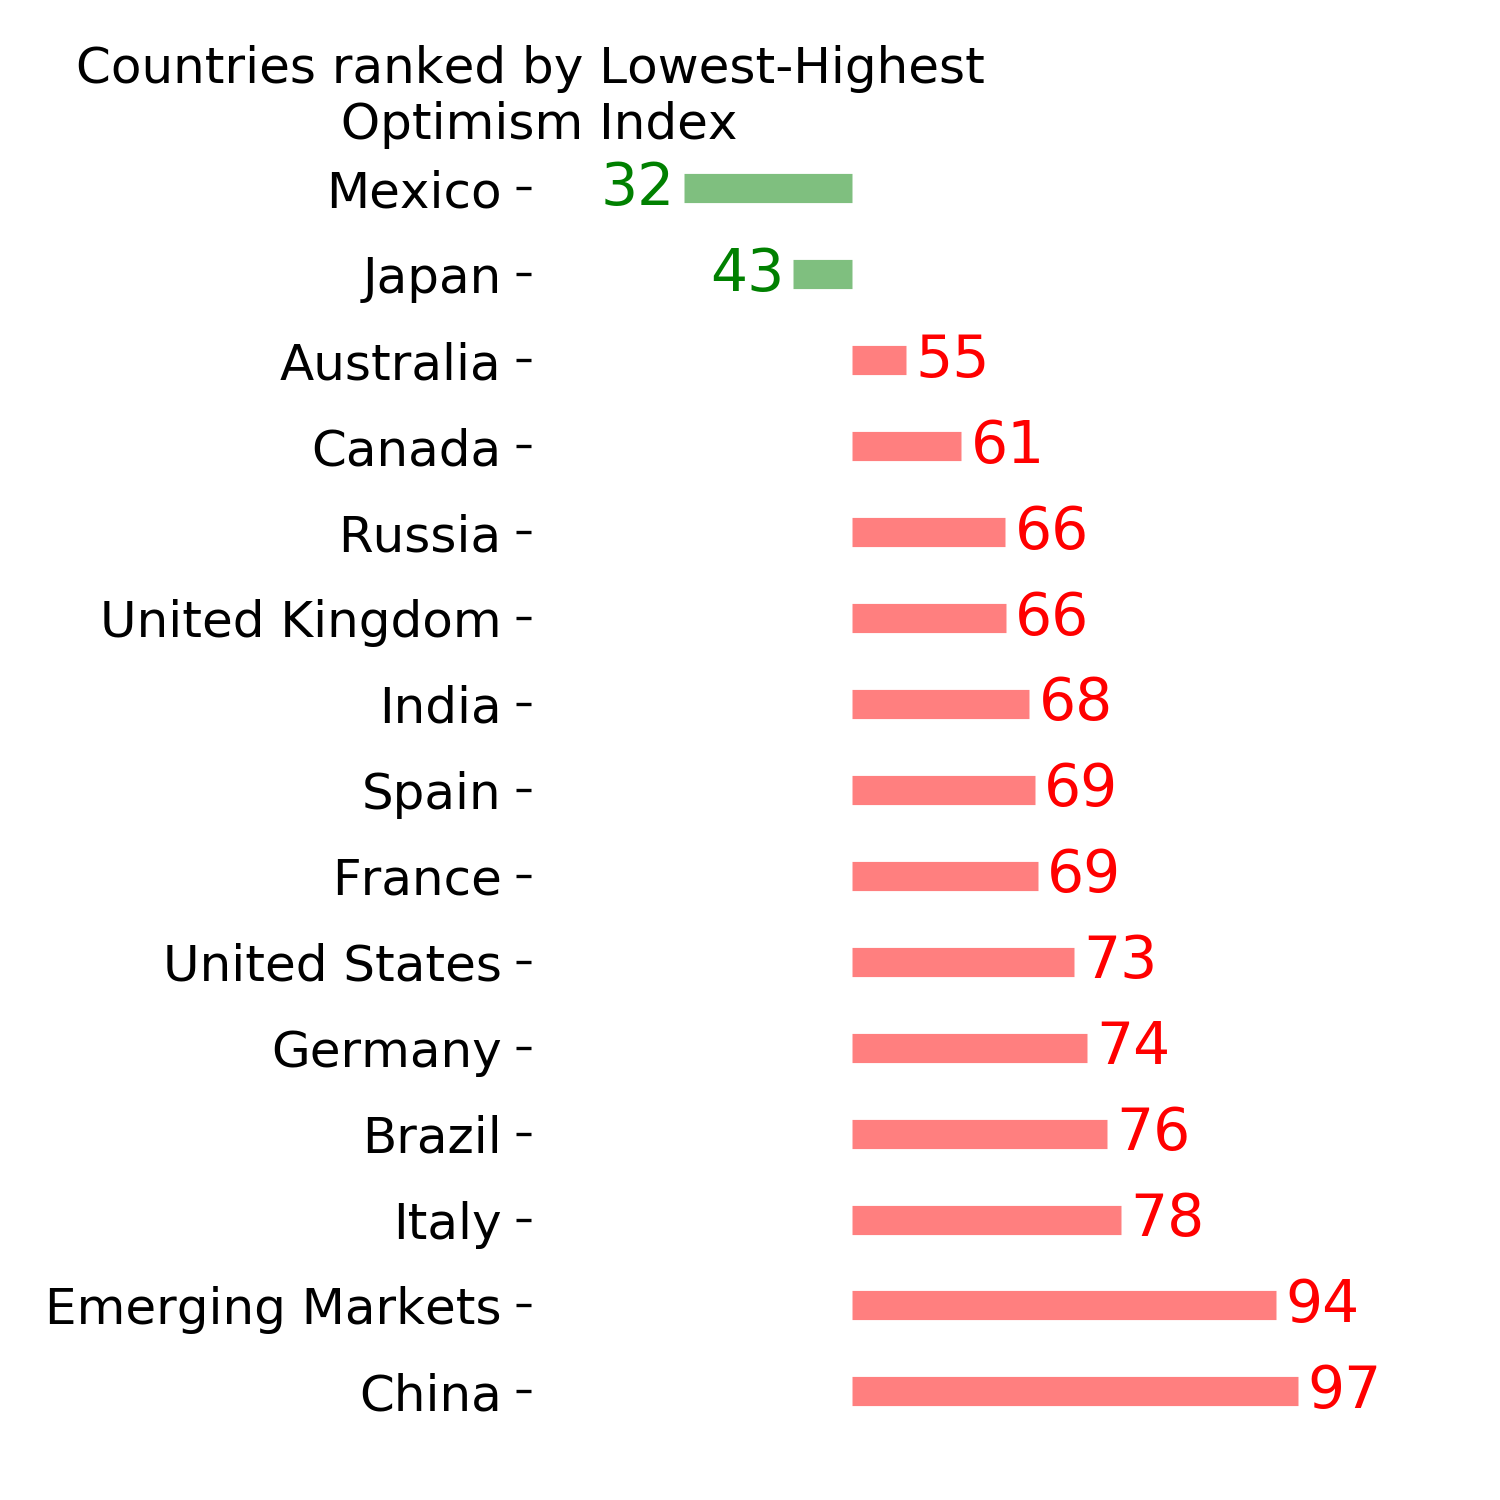
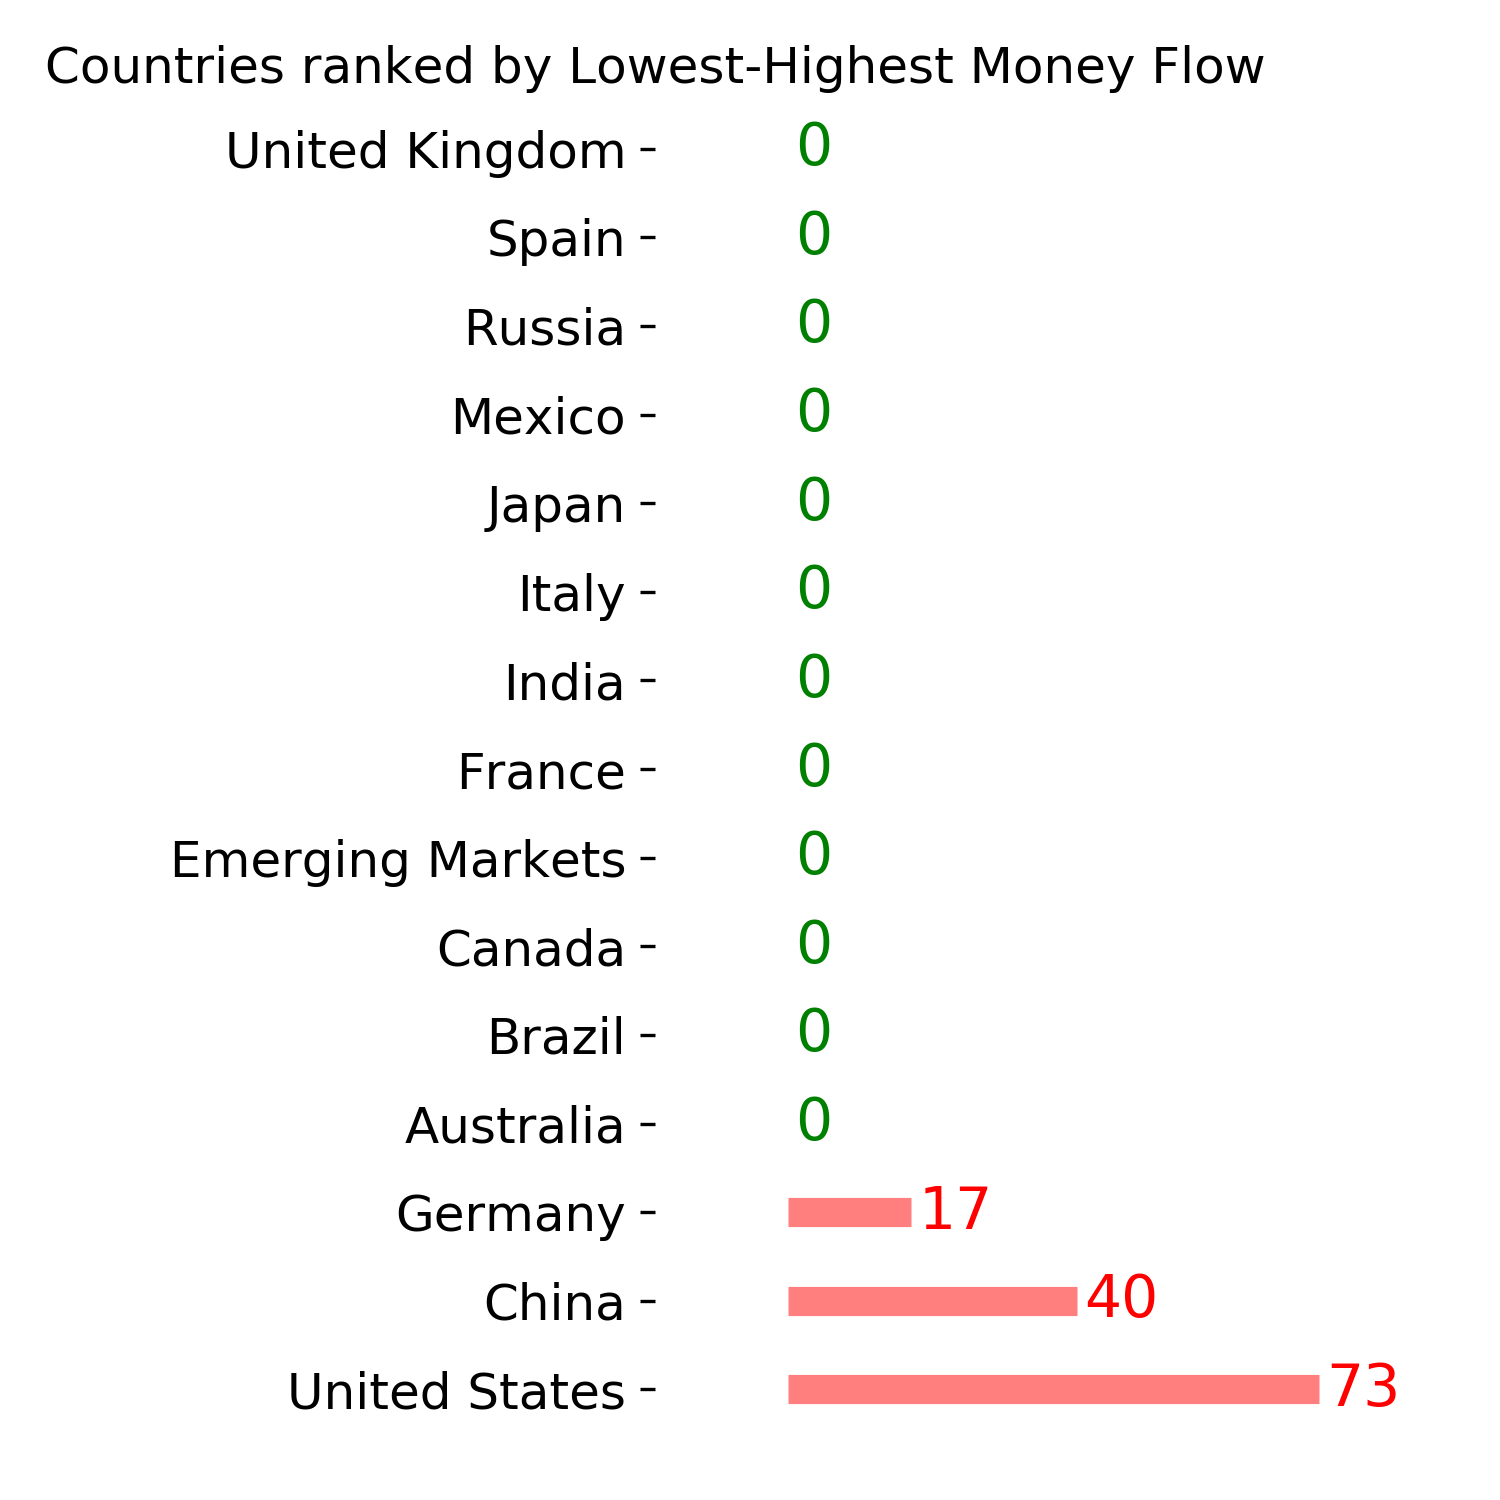
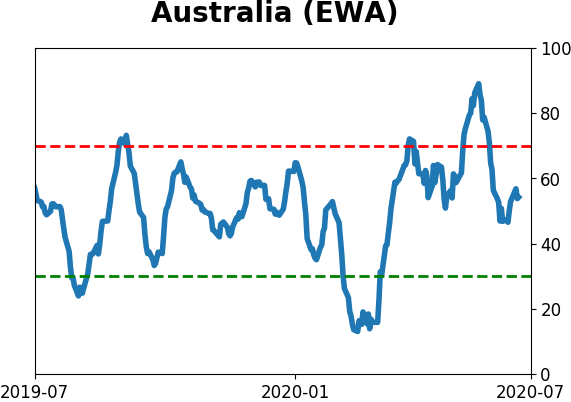
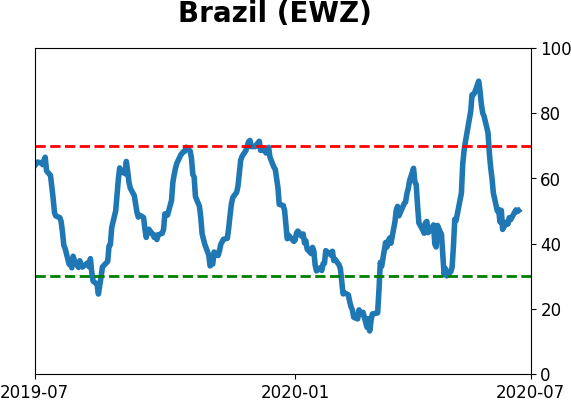
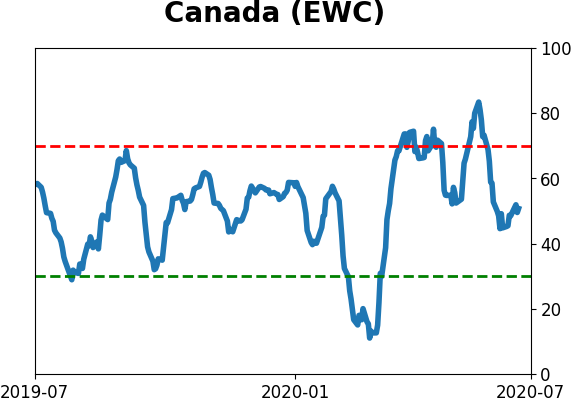
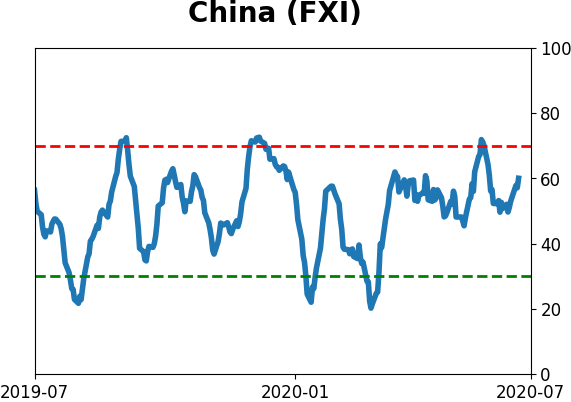
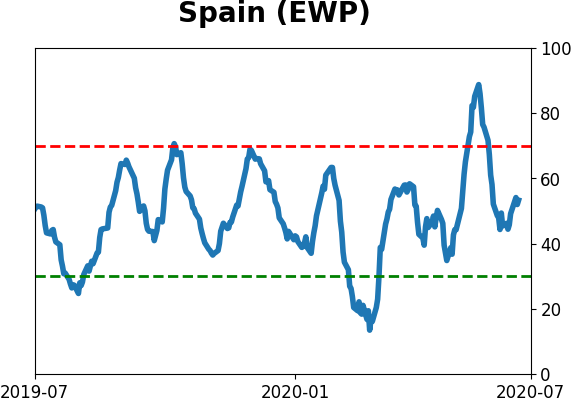
Country ETF's - 10-Day Moving Average
|
|
|
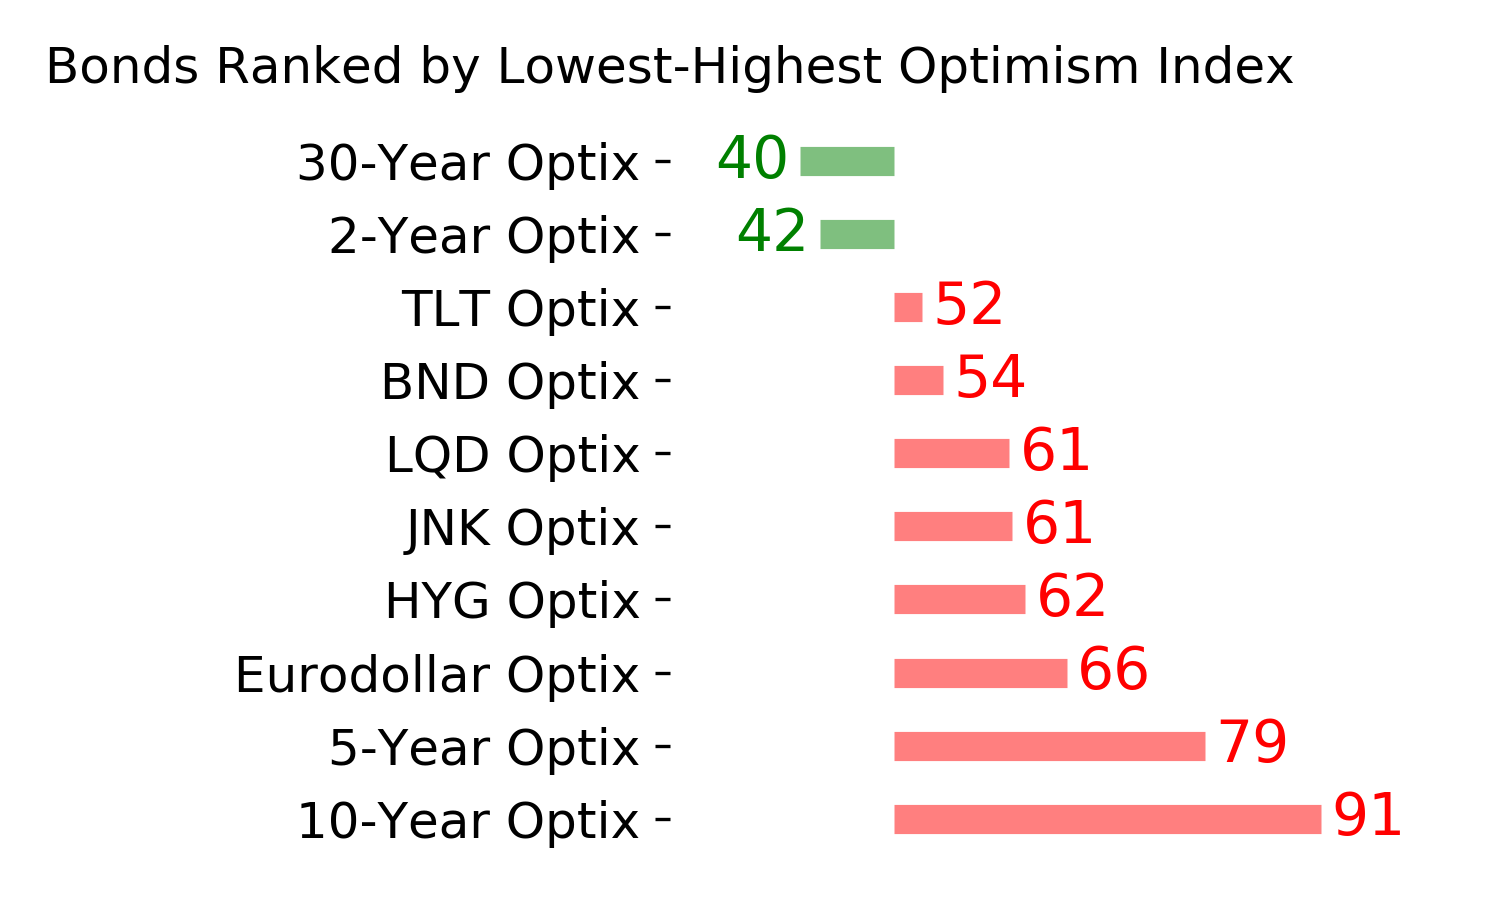
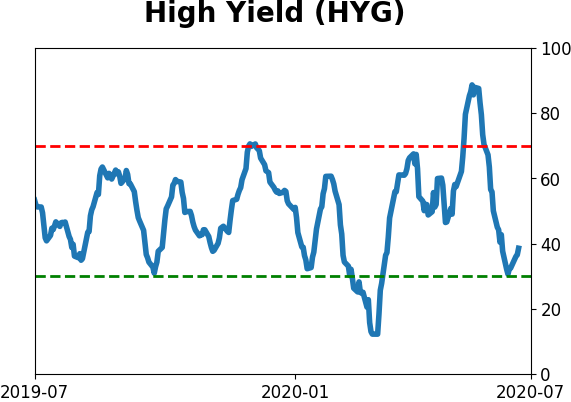
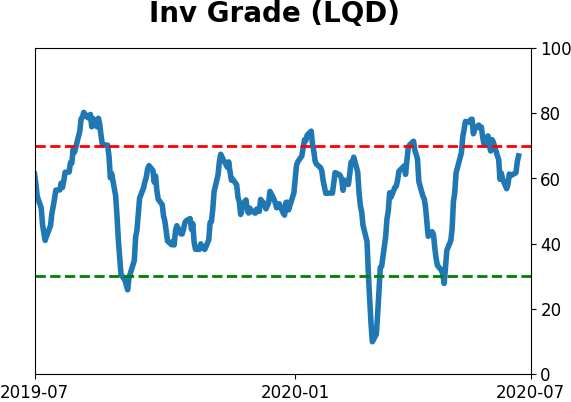
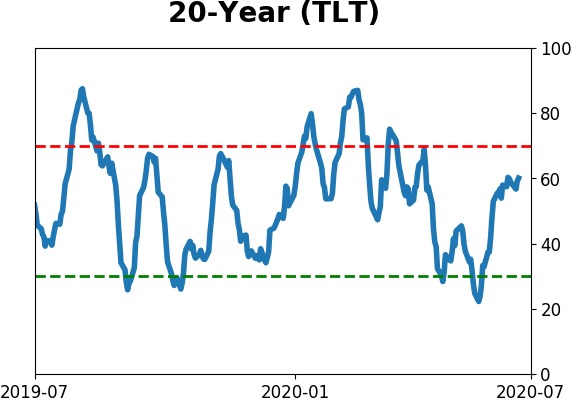
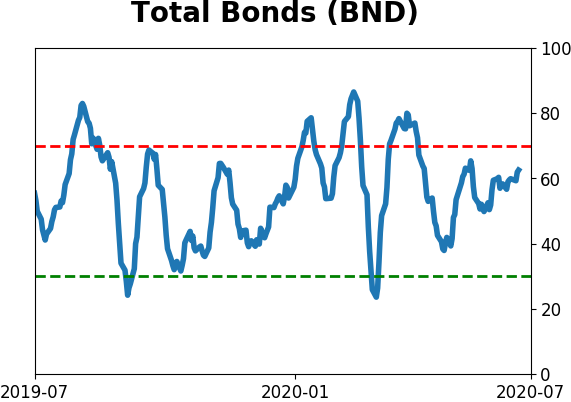
Bond ETF's - 10-Day Moving Average
|
|
|
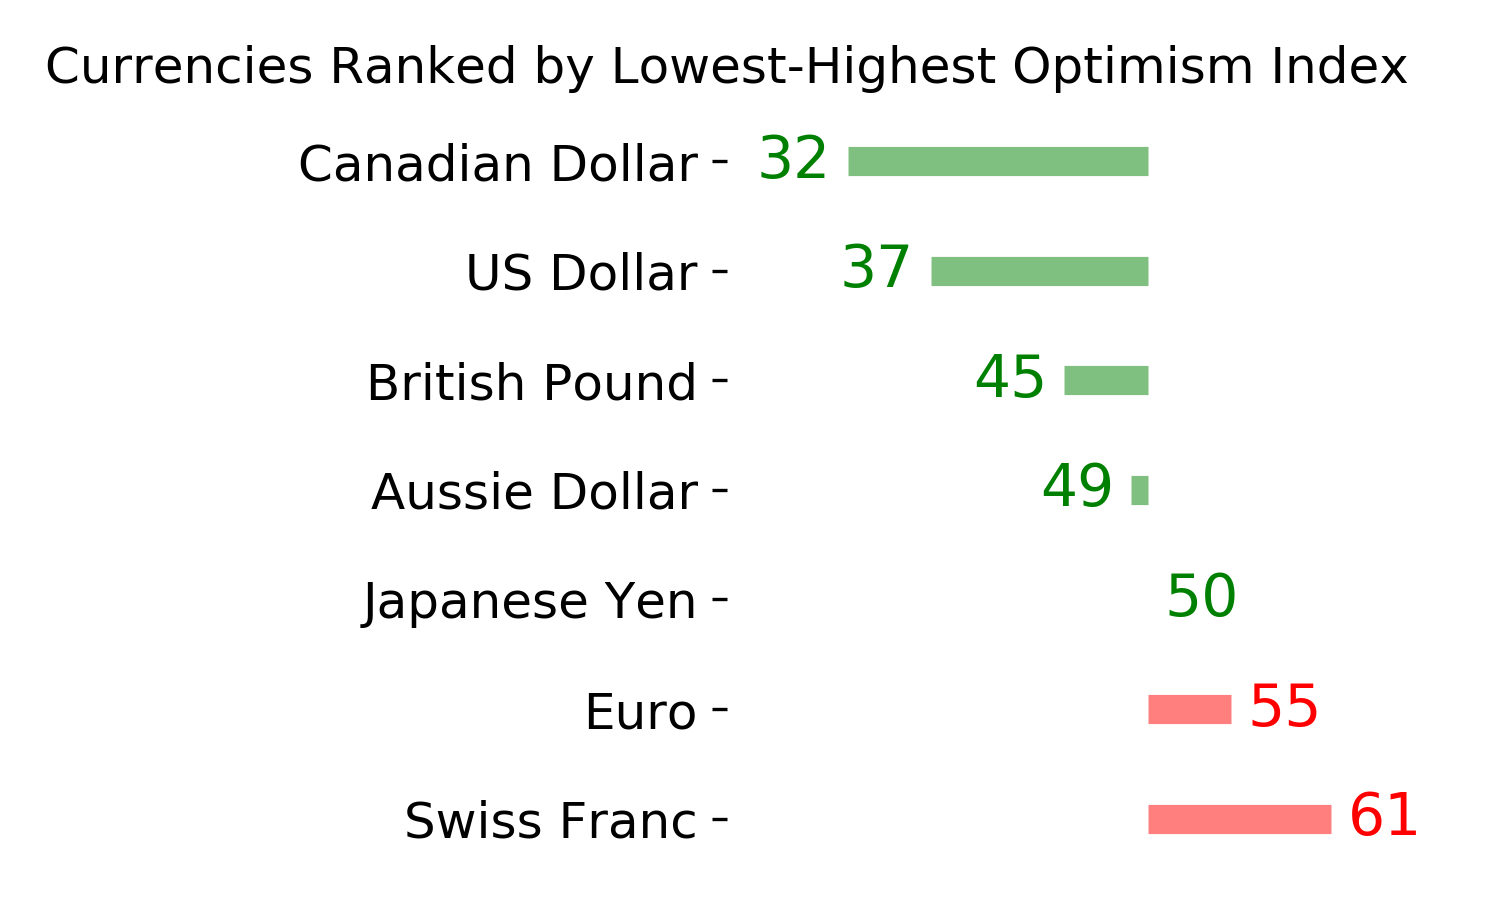
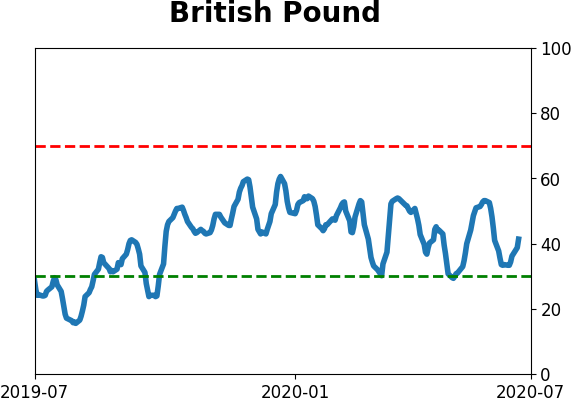
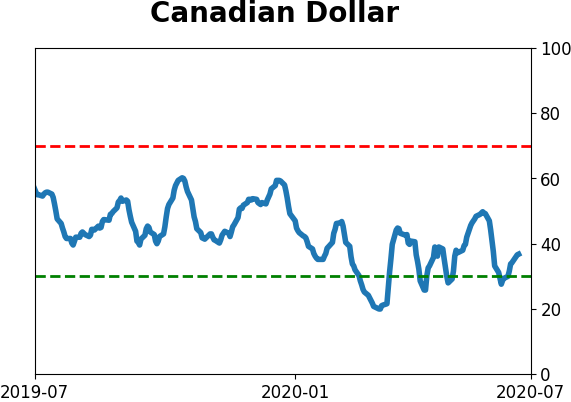
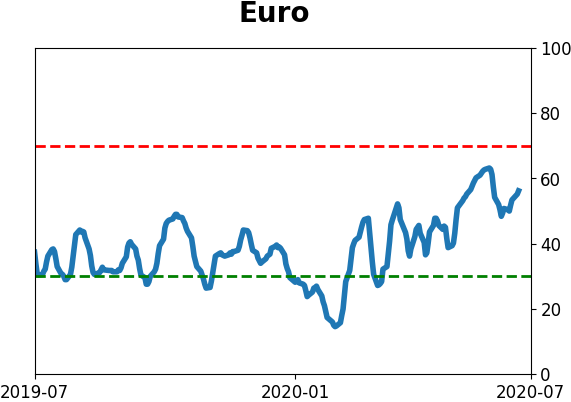
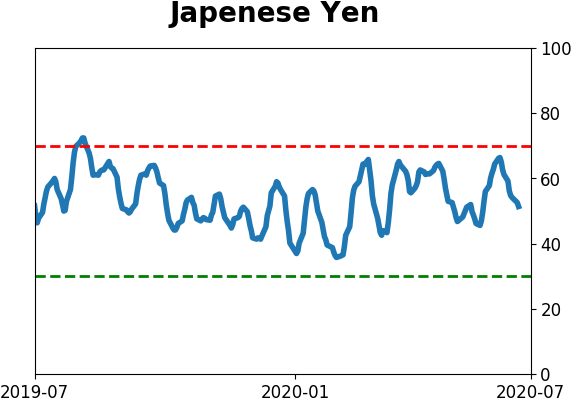
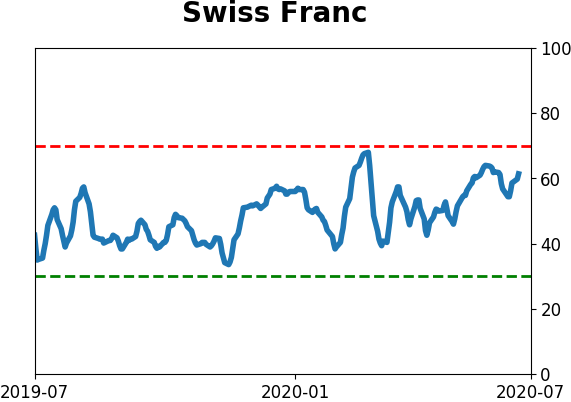
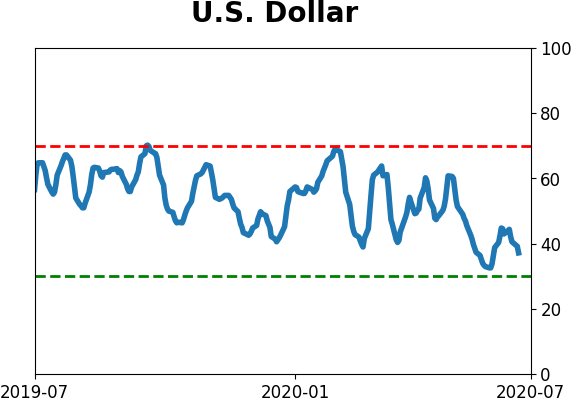
Currency ETF's - 5-Day Moving Average
|
|
|
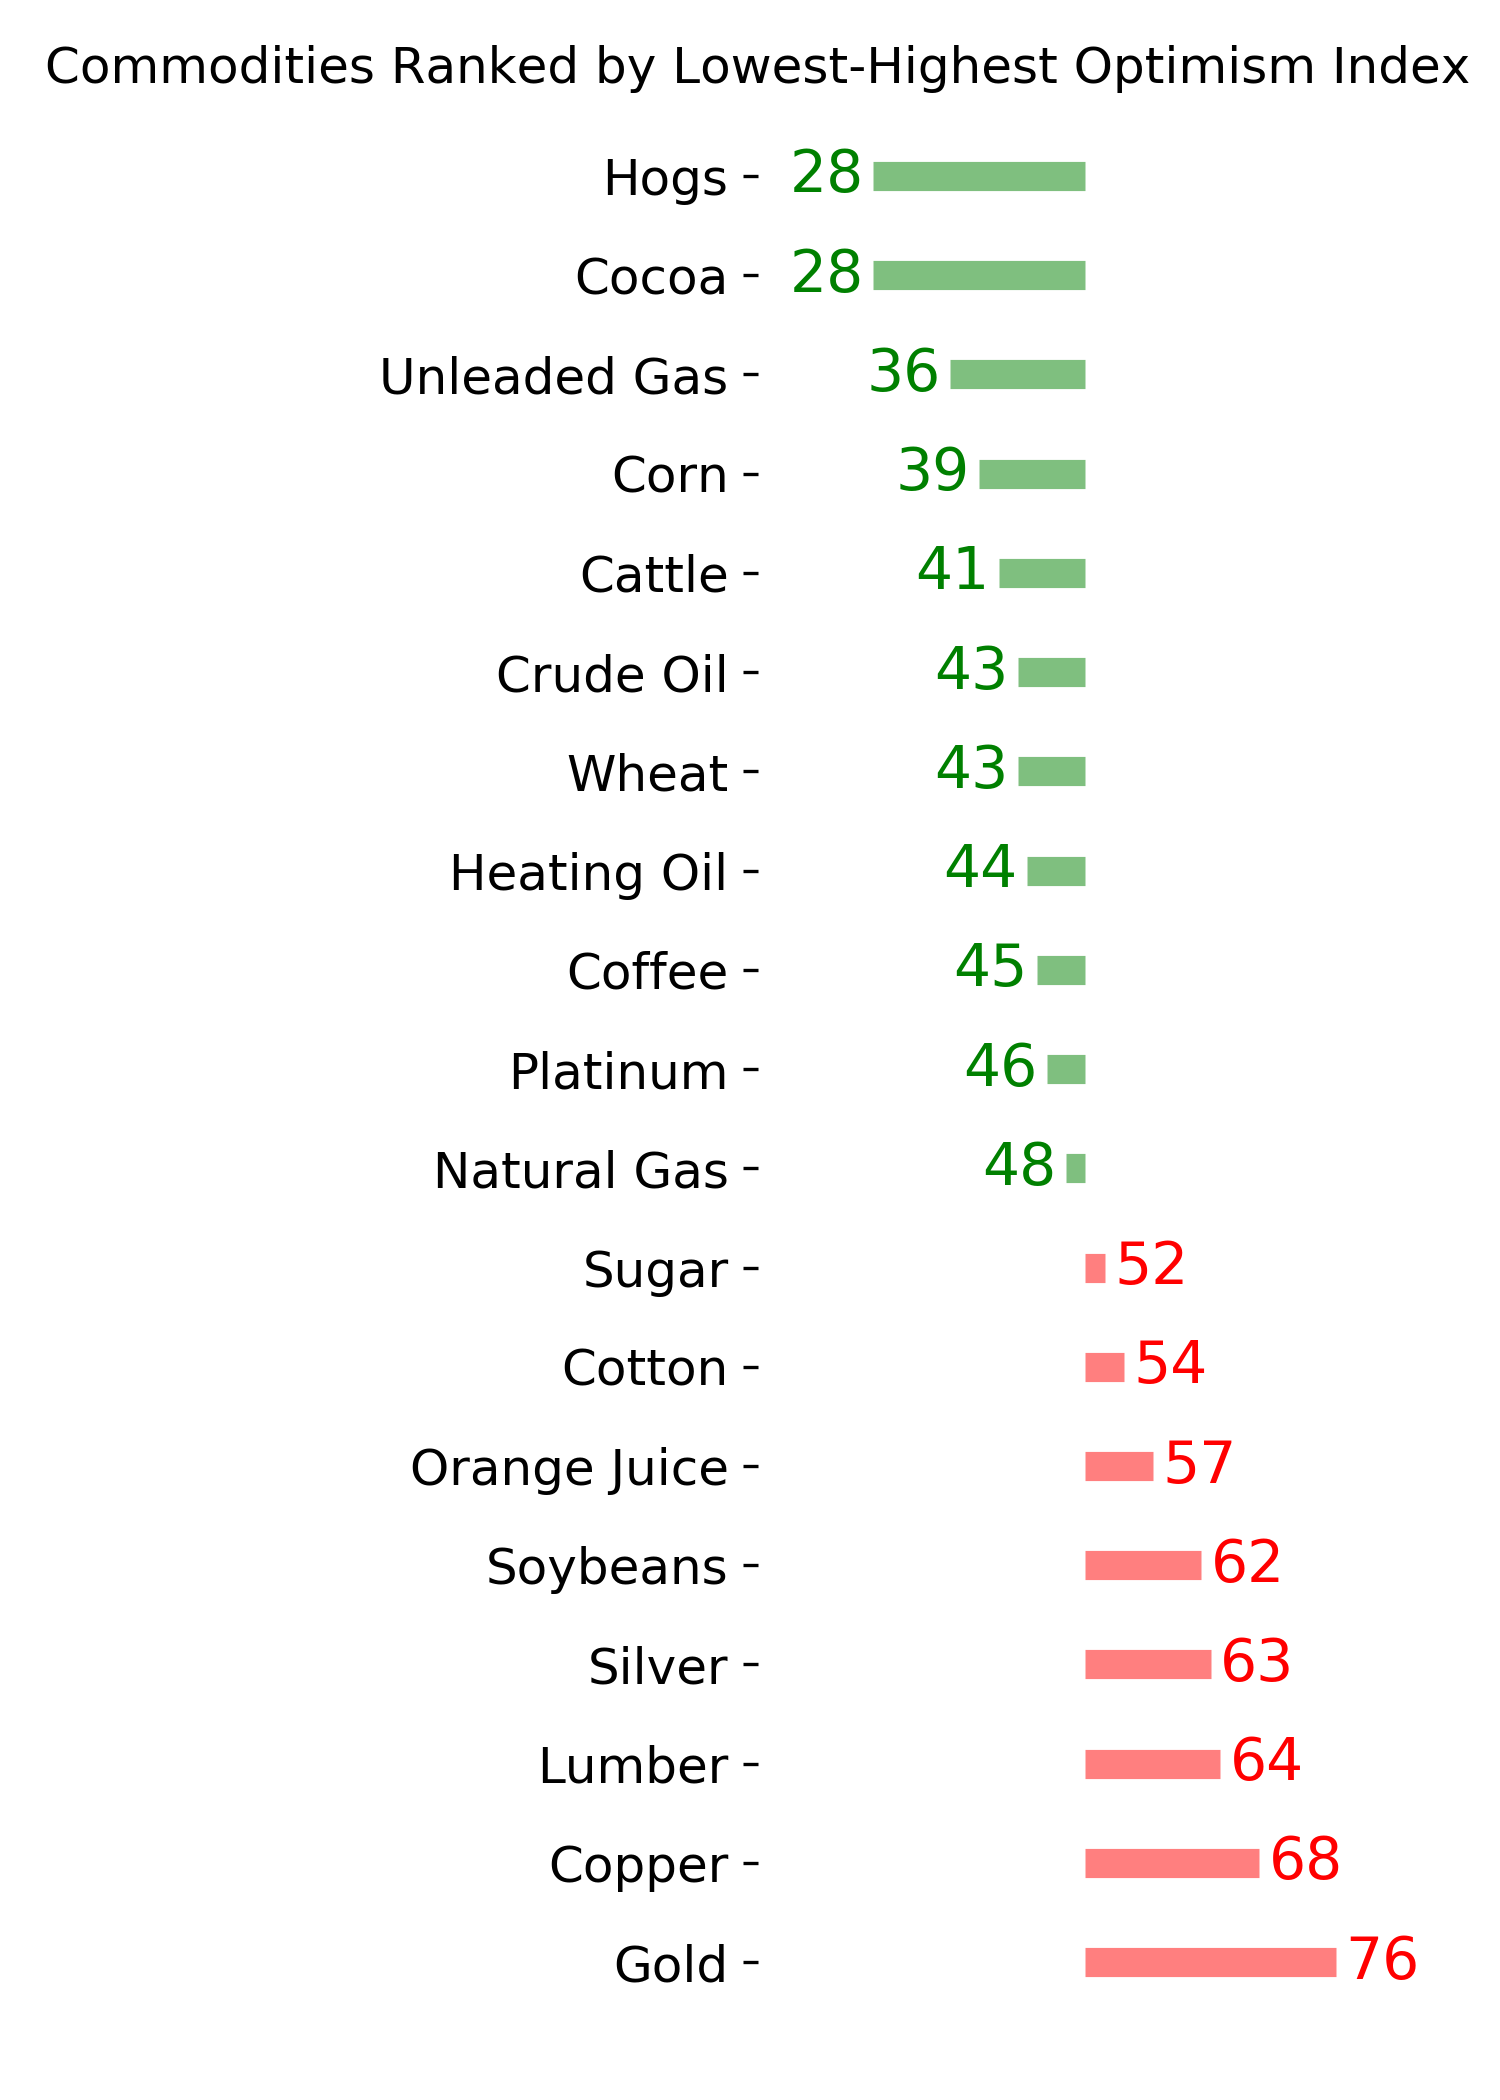
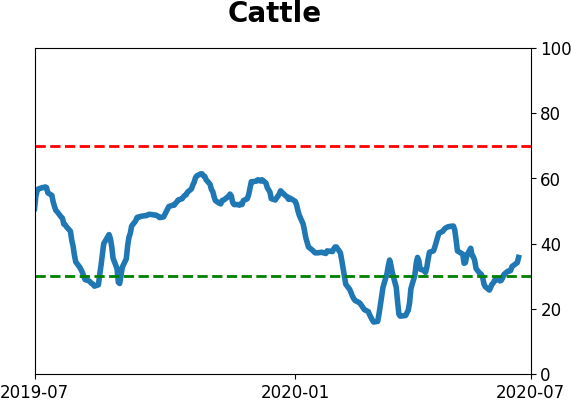
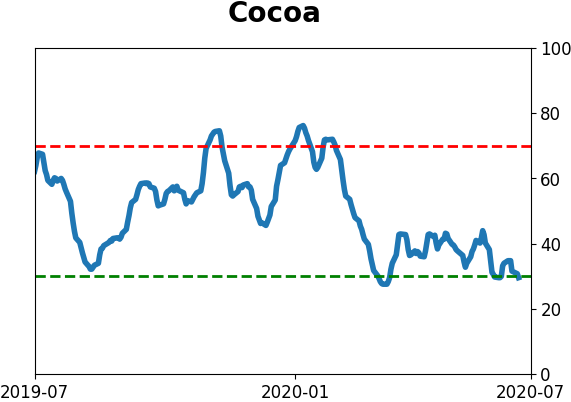
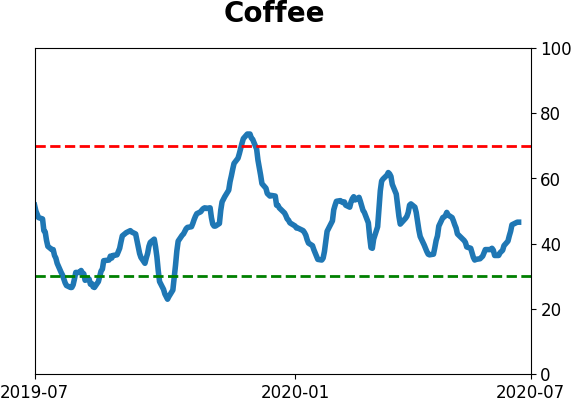
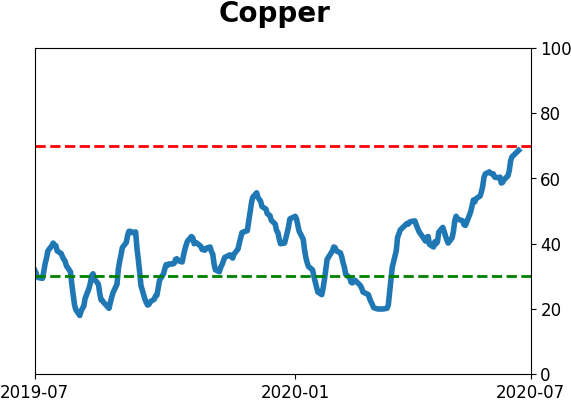
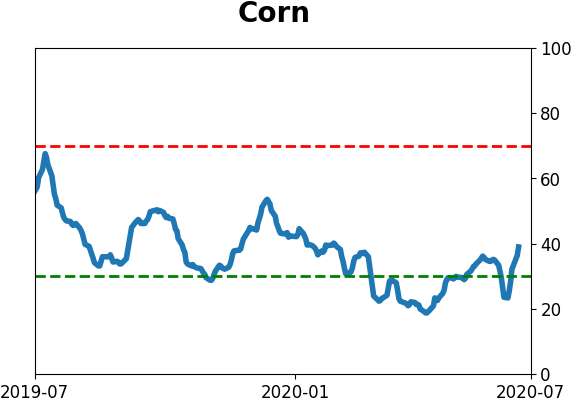
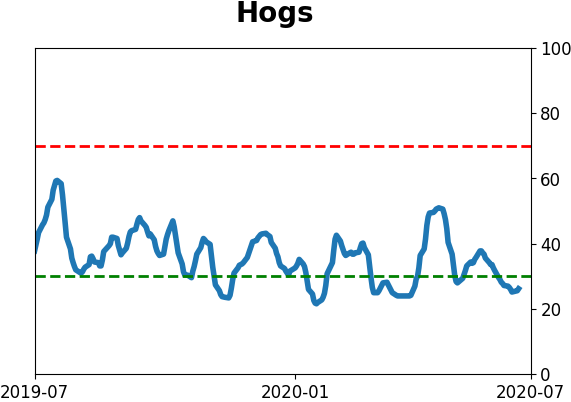
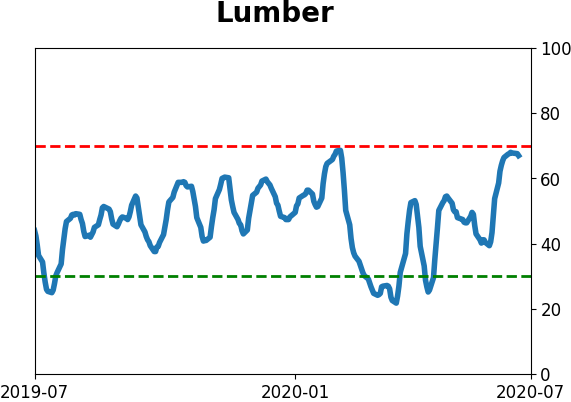
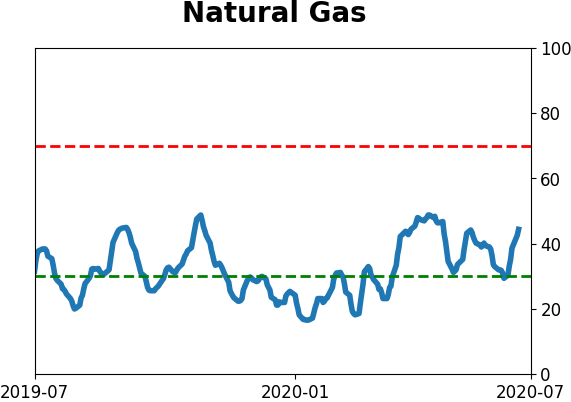
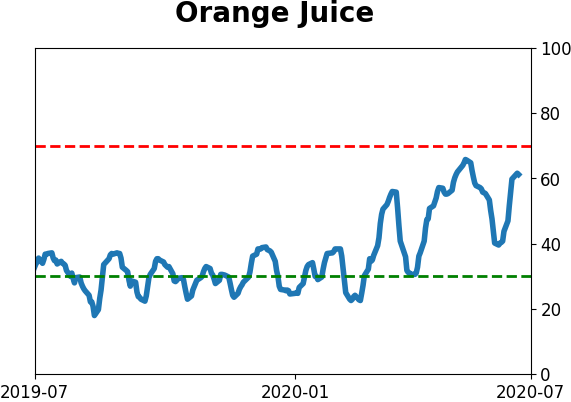
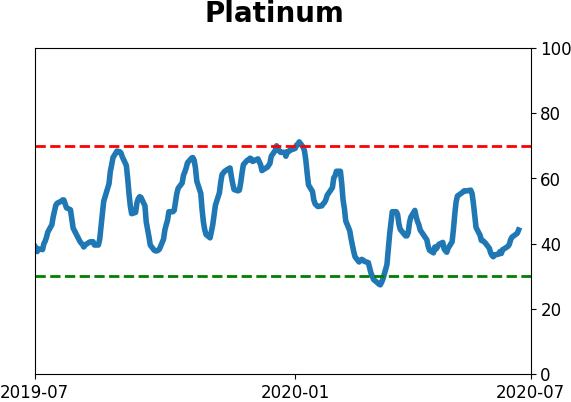
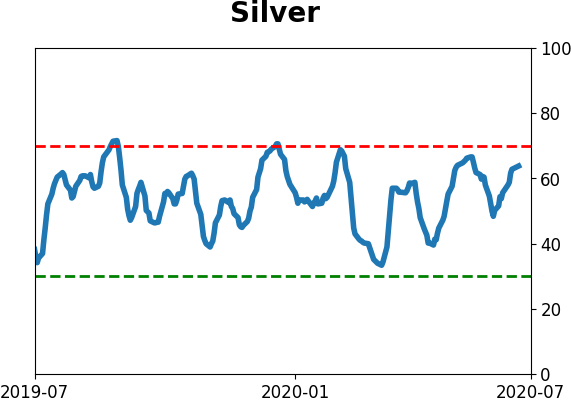
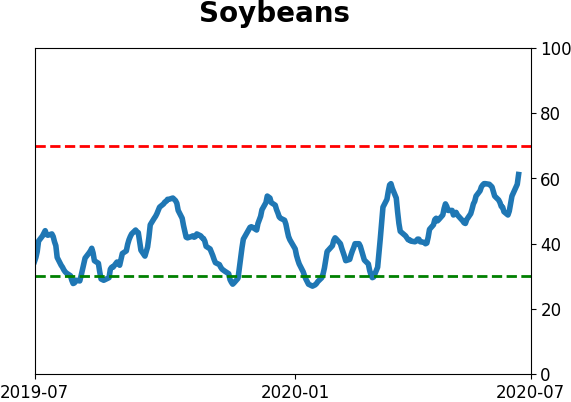
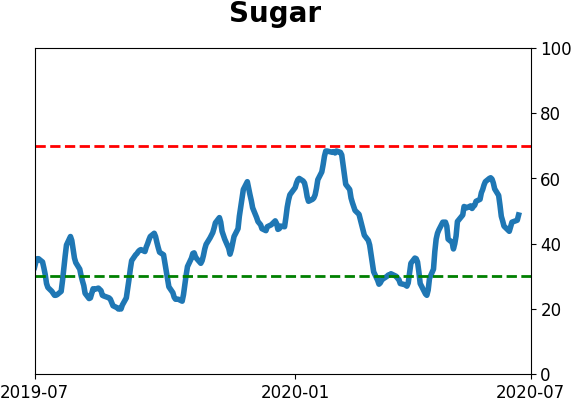
Commodity ETF's - 5-Day Moving Average
|
|