Headlines
|
|
Signs of smart money buying in futures, sectors:
Smart money and dumb money confidence typically move inverse to each other. Lately, dumb money confidence has rebounded strongly while smart money confidence has not dropped as much. That is mostly due to continued buying in index futures, and corporate insiders buying shares, especially in financials and energy.
Companies and Wall Street are raising outlooks:
U.S. companies have been raising their profit outlooks over the past month, in some respects to a record degree. Wall Street analysts have been upwardly revising their earnings estimates and price targets, too.
NOTE: There will be no Daily Report published on Thursday, July 2, or Friday, July 3. Here's wishing you a healthy and safe break!
Bottom line: - Weight of the evidence has been suggesting flat/lower stock prices short- to medium-term, though that turned more neutral as stocks pulled back recently; still suggesting higher prices long-term
- Indicators showed high and declining optimism, as Dumb Money Confidence was recently near 80% with isolated signs of reckless speculation, during what appears to be an unhealthy market environment
- Active Studies show a heavy positive skew over the medium- to long-term; breadth thrusts and recoveries have an almost unblemished record at preceding higher prices over a 6-12 month time frame
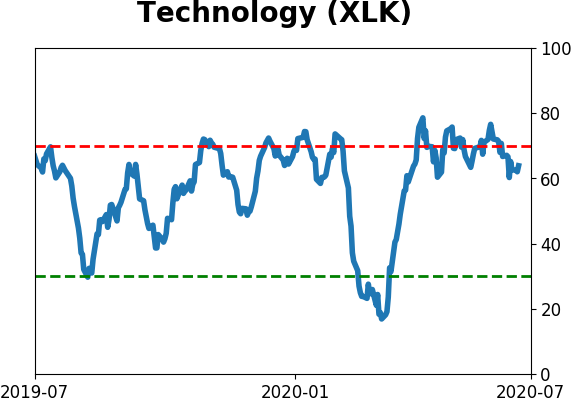
- Signs of extremely skewed preference for tech stocks nearing exhaustion, especially relative to industrials and financials (here and here)
- Indicators and studies for other markets are mixed with no strong conclusion
|
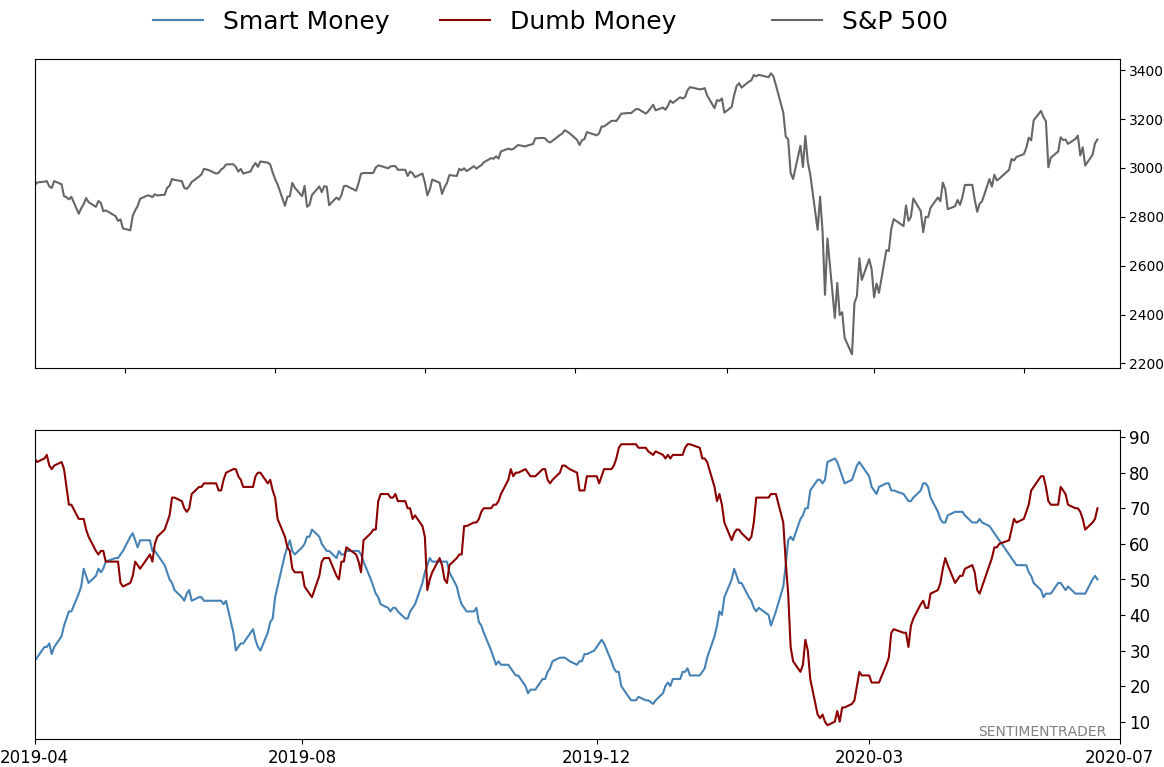
Smart / Dumb Money Confidence
|
Smart Money Confidence: 50%
Dumb Money Confidence: 70%
|
|
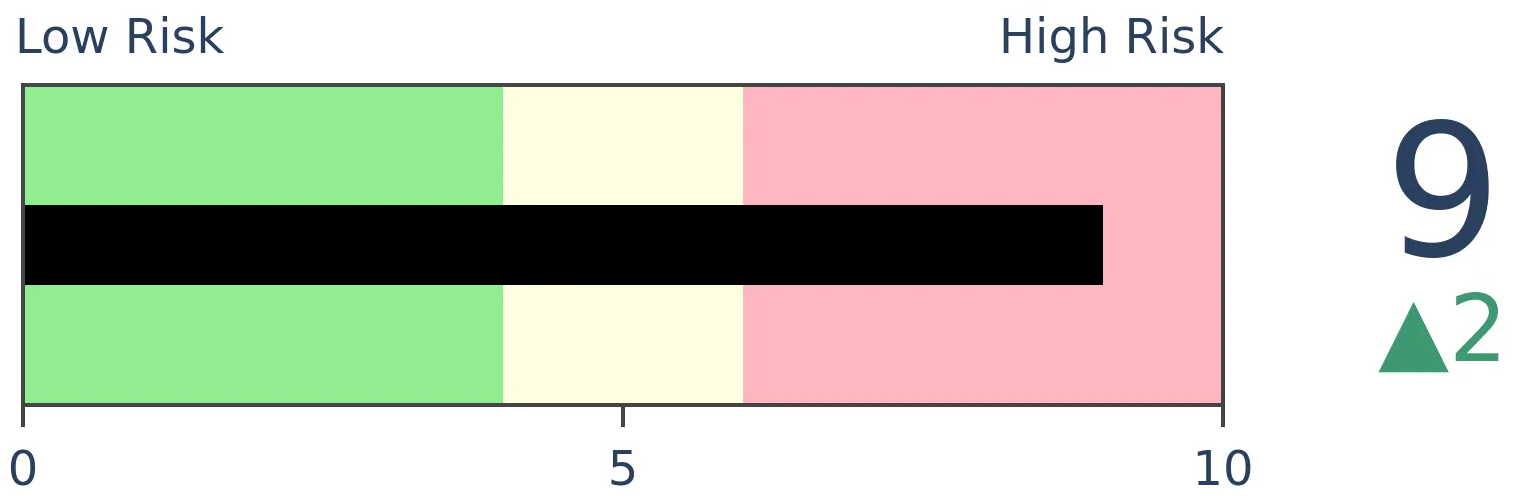
Risk Levels
Stocks Short-Term

|
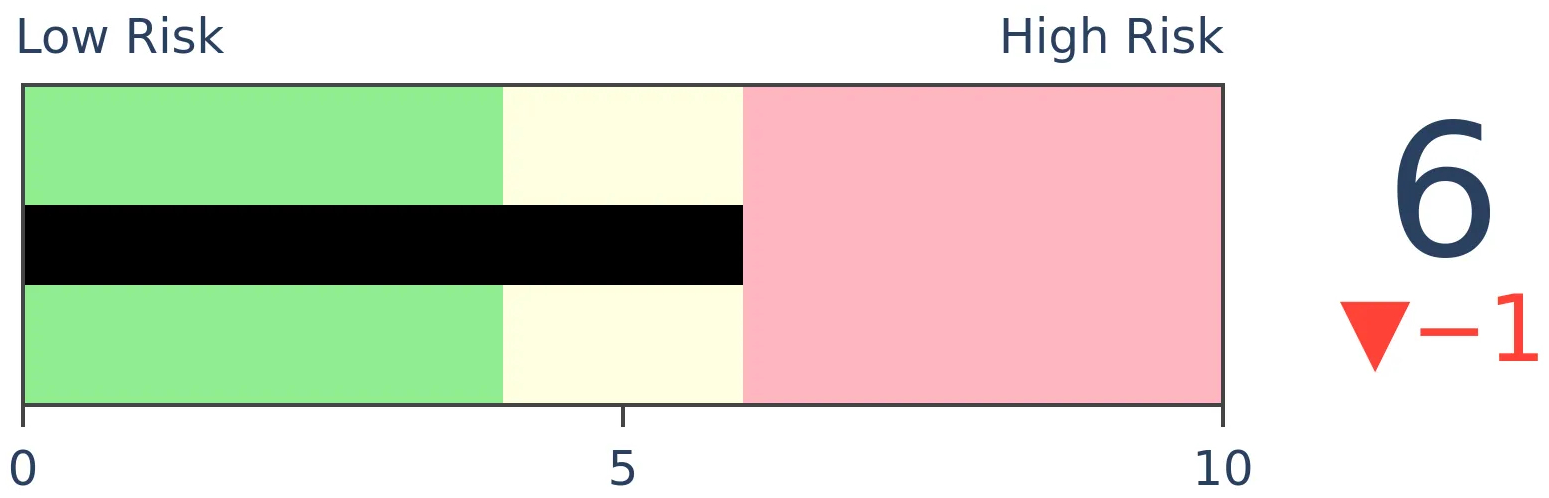
Stocks Medium-Term
|
|
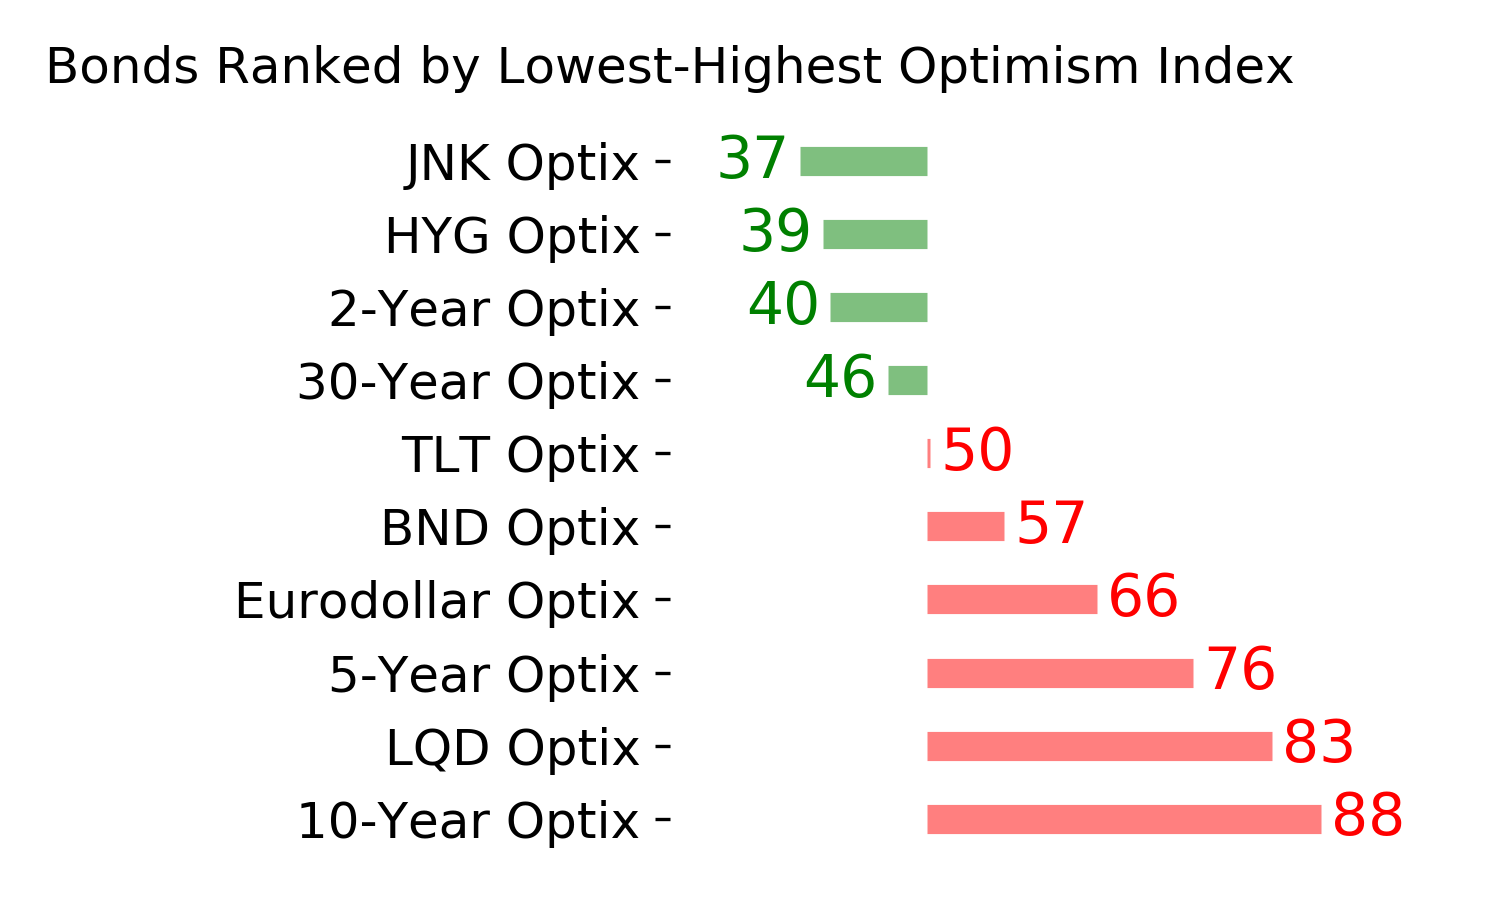
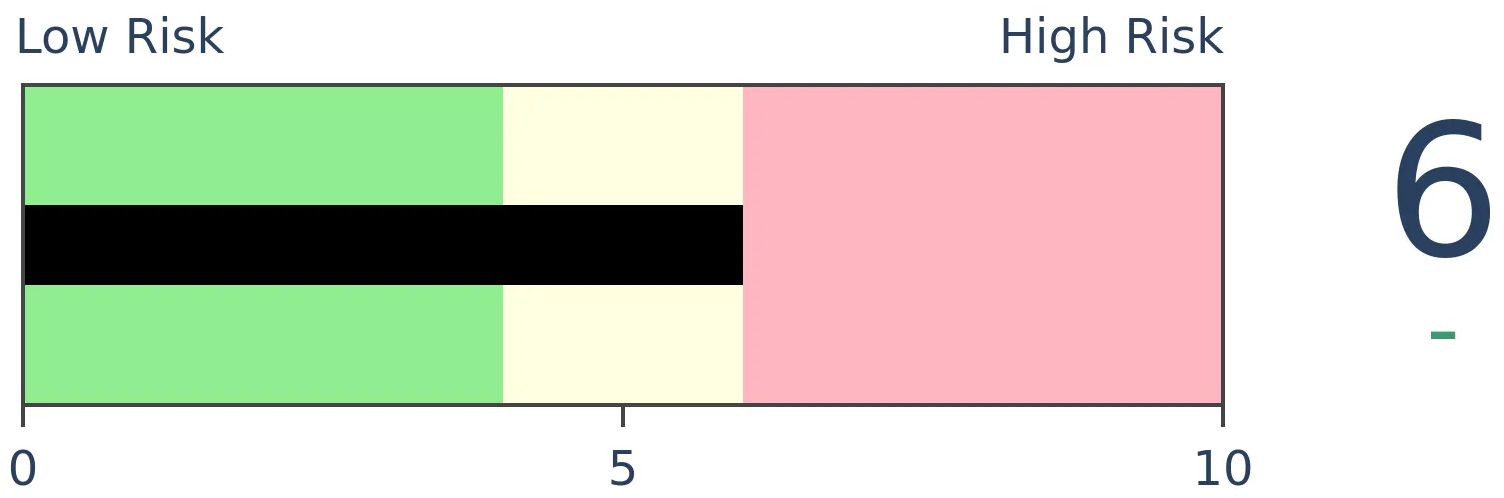
Bonds
|
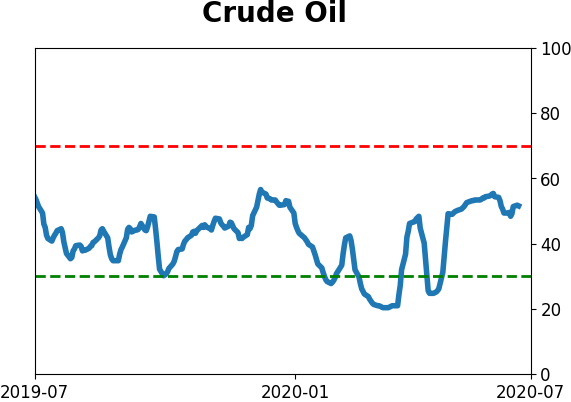
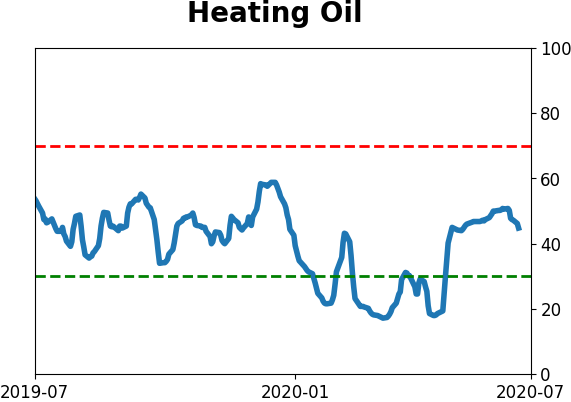
Crude Oil
|
|
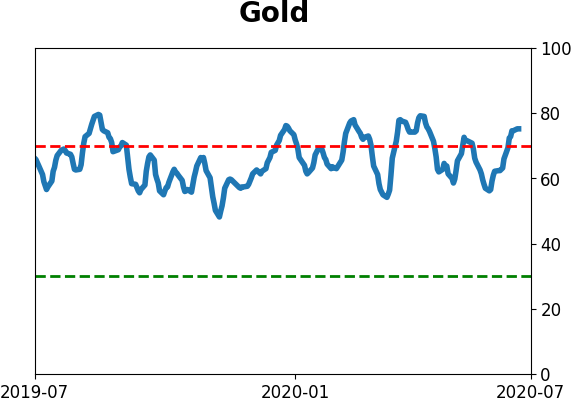
Gold
|
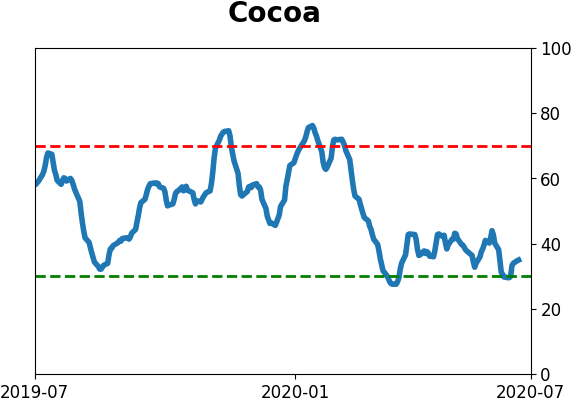
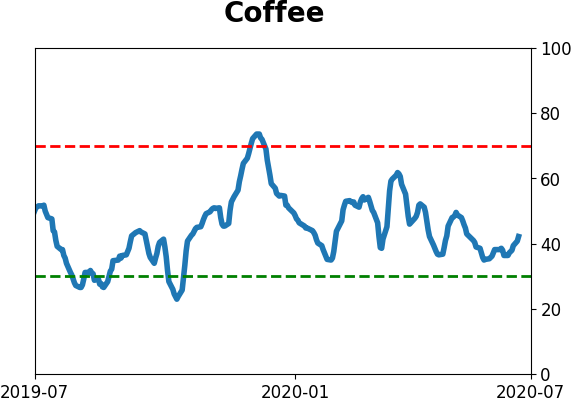
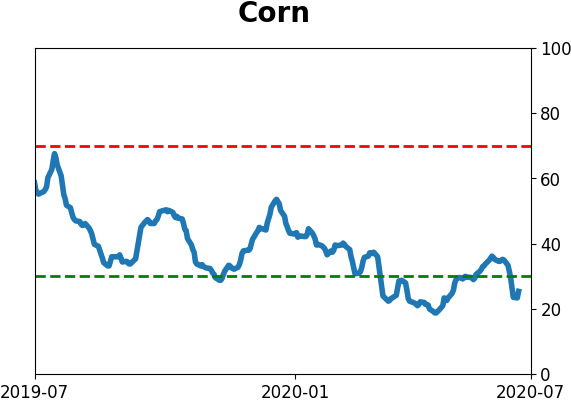
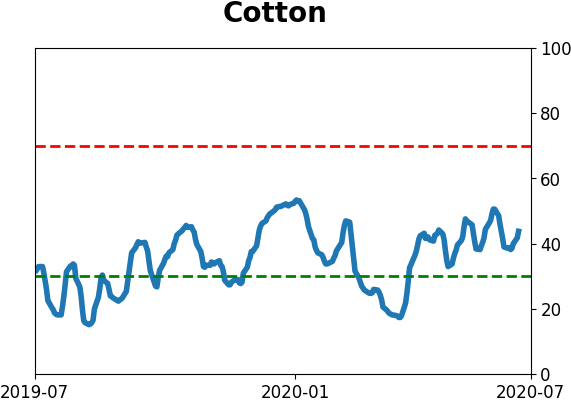
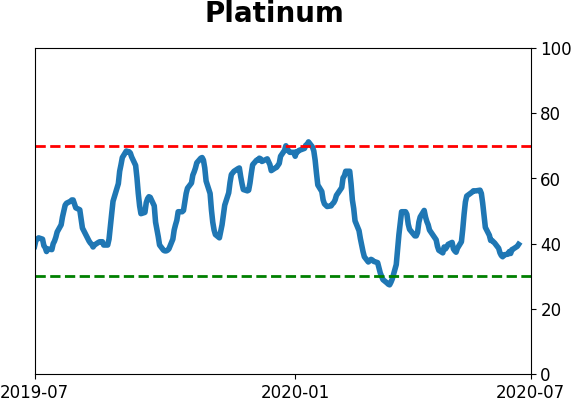
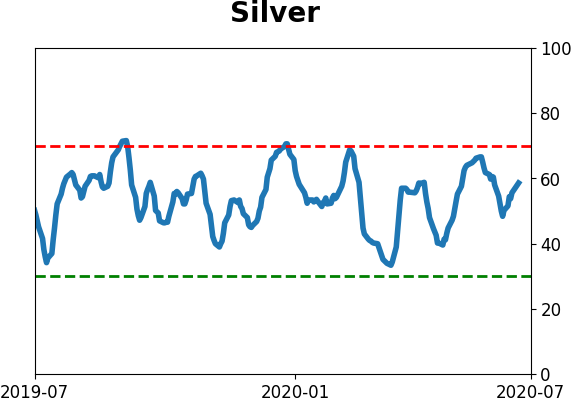
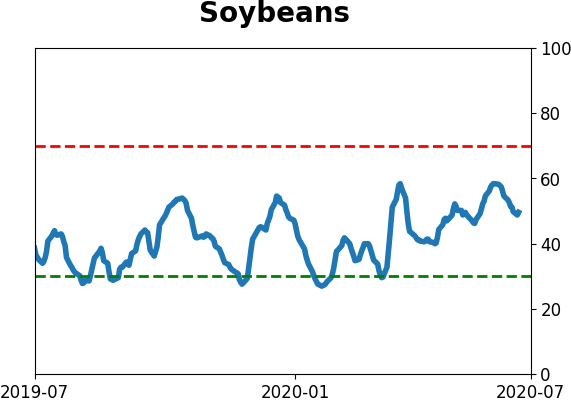
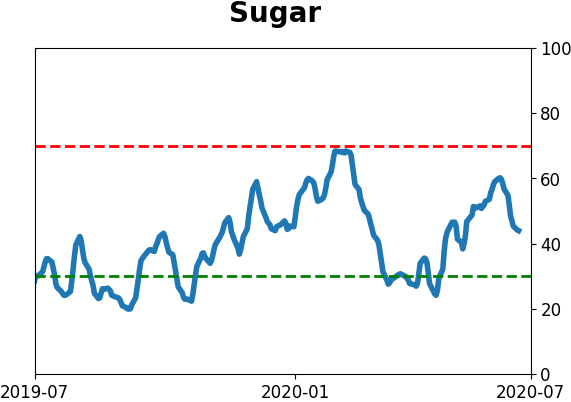
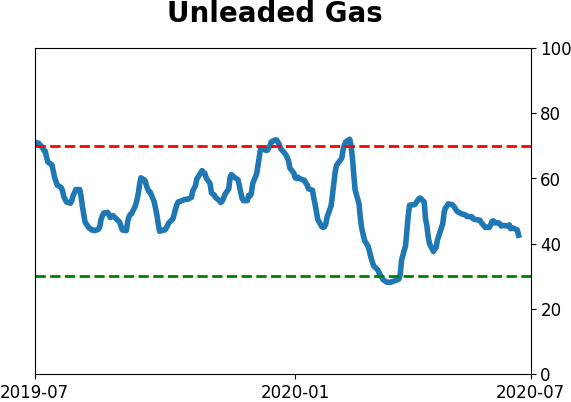
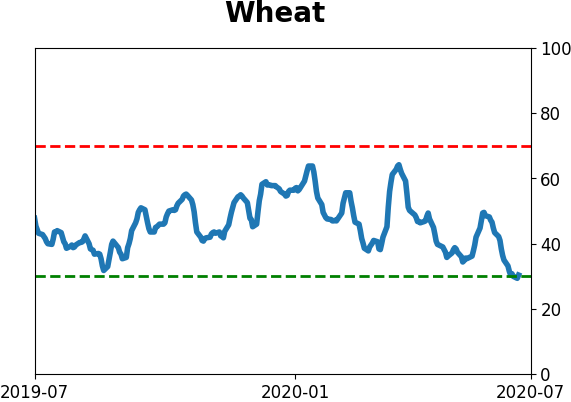
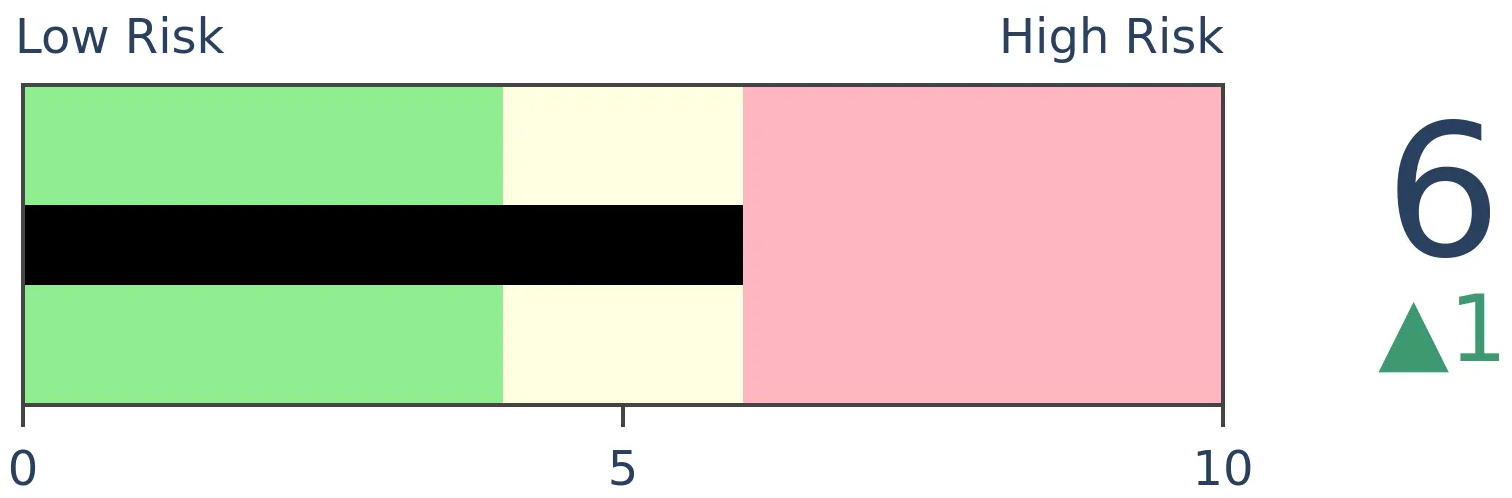
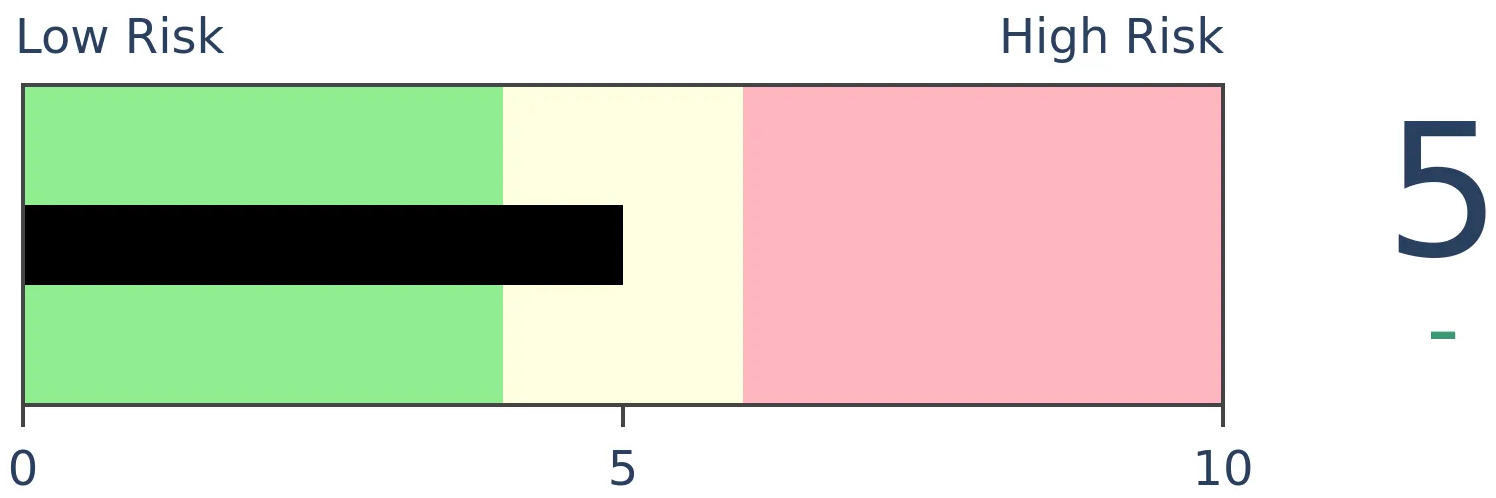
Agriculture
|
|
Research
BOTTOM LINE
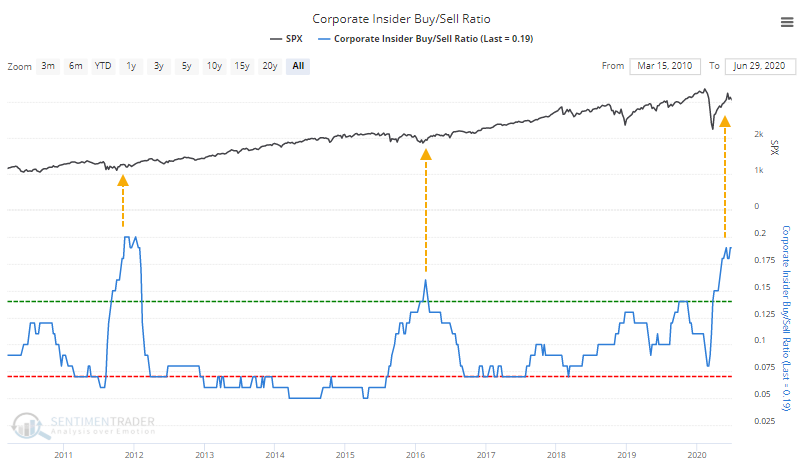
Smart money and dumb money confidence typically move inverse to each other. Lately, dumb money confidence has rebounded strongly while smart money confidence has not dropped as much. That is mostly due to continued buying in index futures, and corporate insiders buying shares, especially in financials and energy.
FORECAST / TIMEFRAME
None
|
By mid-March, Dumb Money Confidence was nearing record lows, and Smart Money Confidence a 5-year high. While the former has rebounded along with prices, the latter hasn't come down by much, which is surprising.
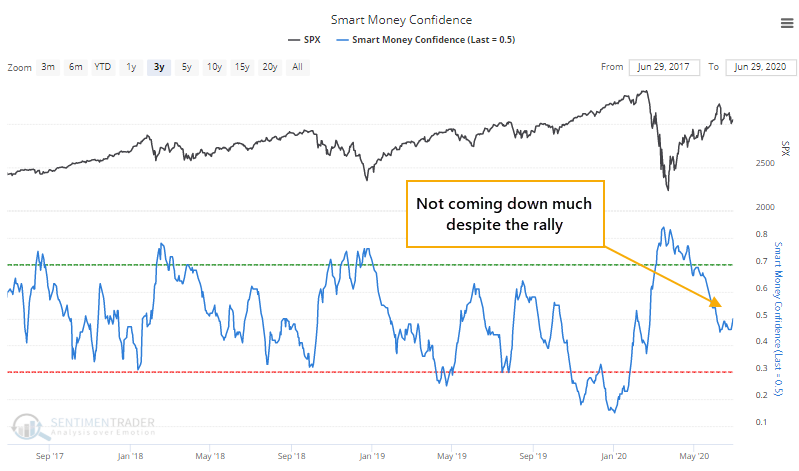
We've noted the main reasons why a couple of times - hedgers are still holding a large net long position in equity index futures, and corporate insiders have been buying up shares. That still hasn't changed much.
Like they did in 2019, hedgers bought the decline in prices aggressively then held on even as stocks rallied. They're doing the same thing this time, but are not only holding on, they're buying more. This is extremely unusual.
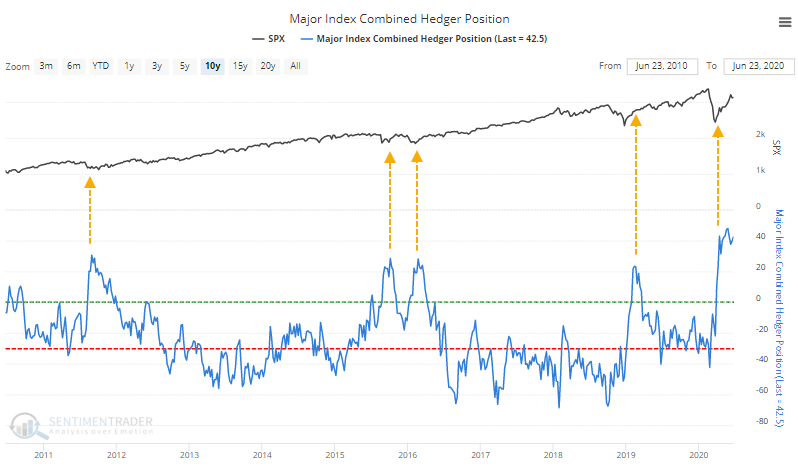
We don't like unusual. It's better when investors behave as they have in the past because that gives us more confidence that prices will react in the same way. So this is a bit of a worry, but so far it's unfounded - stocks are still rallying.
Along with hedgers, corporate insiders not only stepped up in March, but they've kept at it. The ratio of open market buys to sells in S&P 500 companies over the past six months is the highest since late 2011.
Thanks can be given to a couple of sectors in particular. Even though energy companies have been busy filing bankruptcy, there has been a pickup in the number of corporate insiders buying shares in the sector.
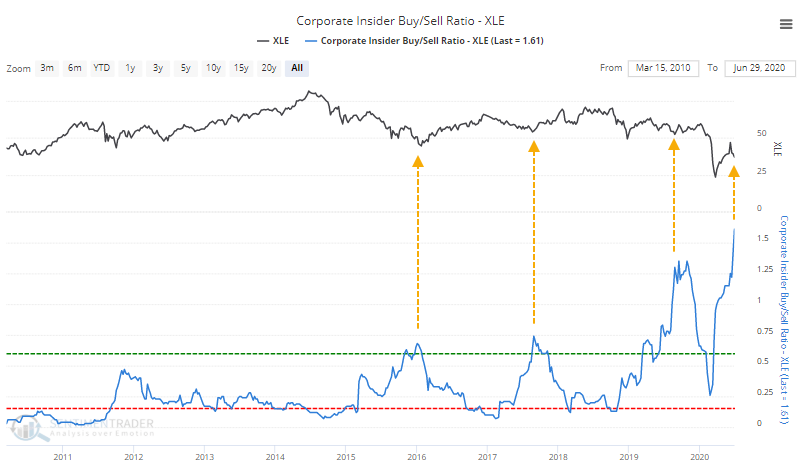
There was a jump in buying last summer, too, and while energy stocks tried to rally, they obviously took a big hit this spring, so that was a failure.
The beaten-down financial sector has seen an increase in buying relative to selling, too.
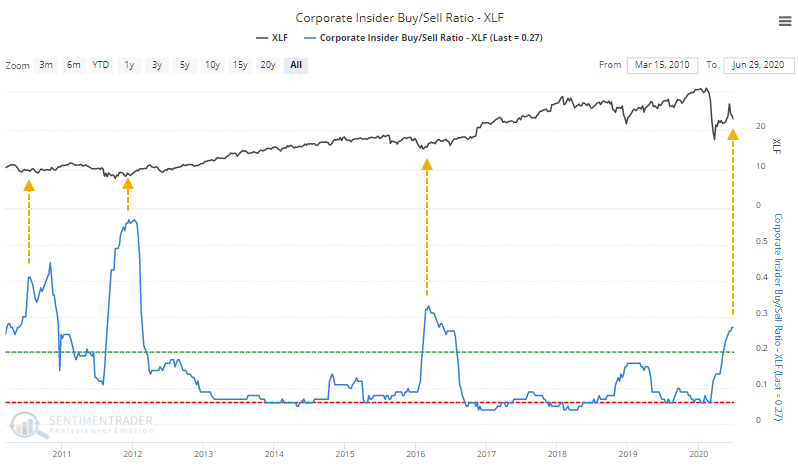
It's not as aggressive as it has been a few other times over the past decade, but is better than it's been in several years, and is clearly more positive than it was to start the year.
Smart money types of indicators tend to be longer-term as opposed to dumb money ones that are mostly shorter-term. The high level of Dumb Money Confidence is a shorter-term worry, while signs of persistent smart money buying are more comforting longer-term.
BOTTOM LINE
U.S. companies have been raising their profit outlooks over the past month, in some respects to a record degree. Wall Street analysts have been upwardly revising their earnings estimates and price targets, too.
FORECAST / TIMEFRAME
None
|
Companies are raising their outlooks.
After the uncertainty of the pandemic earlier this year, the past month+ has seen businesses gingerly re-open, with a little bit more optimism among executives. As a result, a greater percentage of them are thinking that profits will be higher than expected.
As noted by Bloomberg:
"Up, Down, and Neutral ratings are based on a comparison between the company forecast and the consensus analyst estimate. The Profit Outlook Net Index is calculated as the percentage of companies reporting higher profit outlooks and adding one-half of the percentage of companies reporting unchanged profit outlooks, relative to the consensus analyst estimates. A reading above 50 is positive, below 50 is negative, while 50 indicates no change."
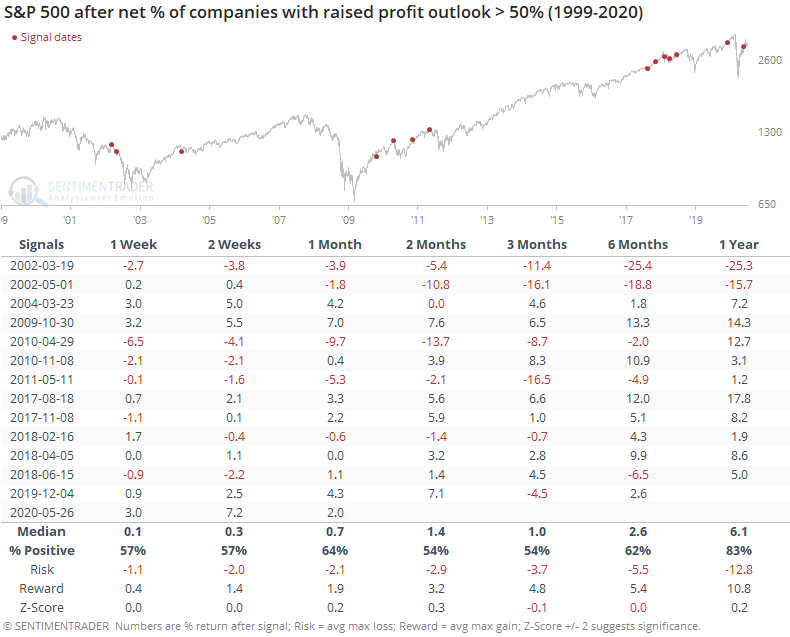
Based on these definitions, companies haven't raised their outlooks to this degree in more than 20 years.
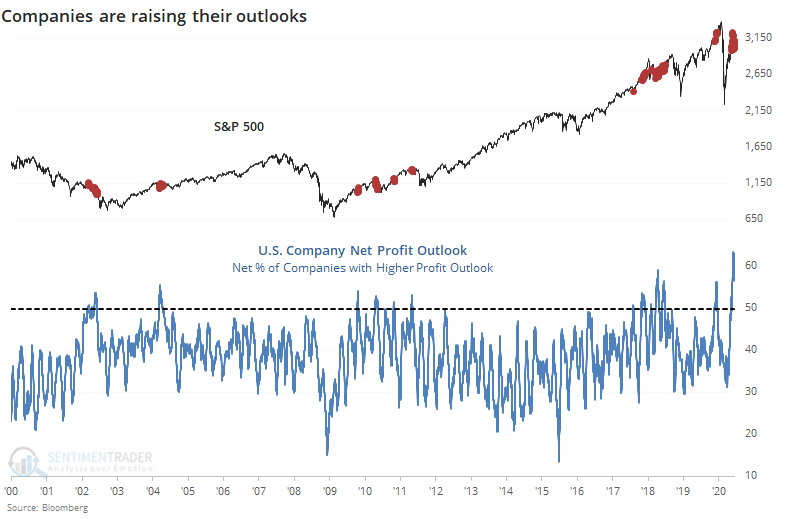
This should be a good sign for future returns but logic isn't always a good guide in markets. By the time companies became this enthused about their future profits, investors had already anticipated much of the gain.
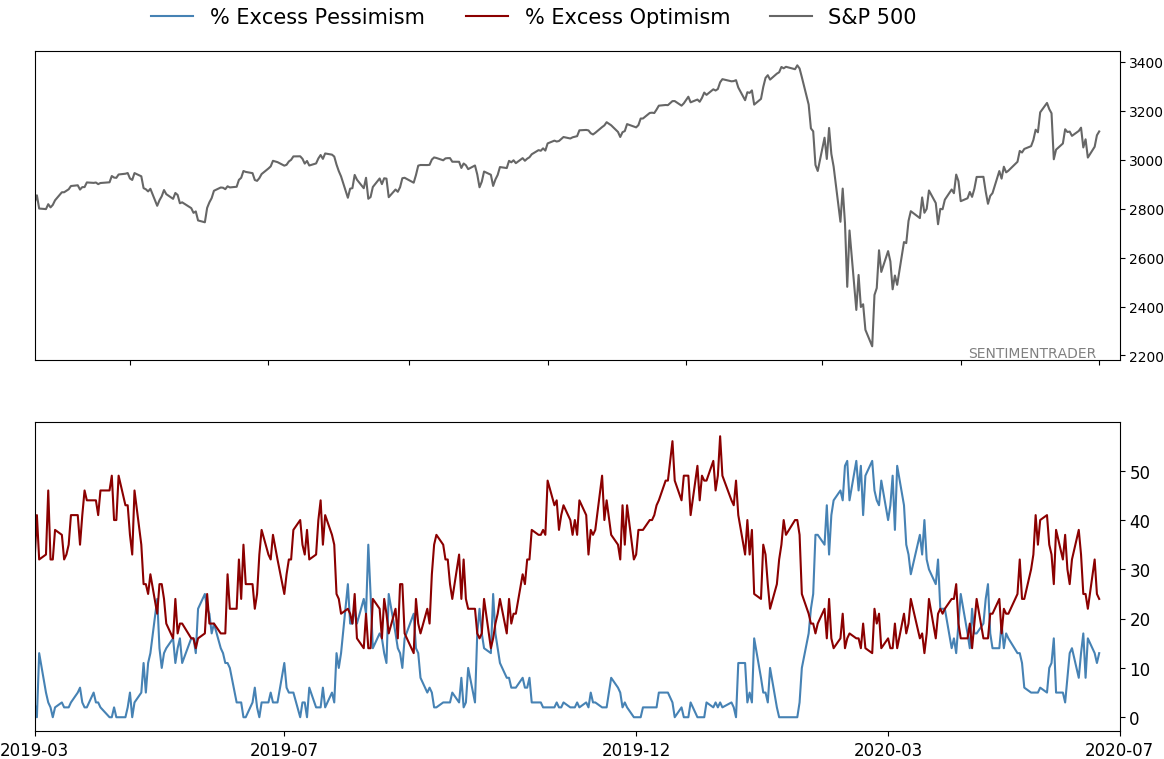
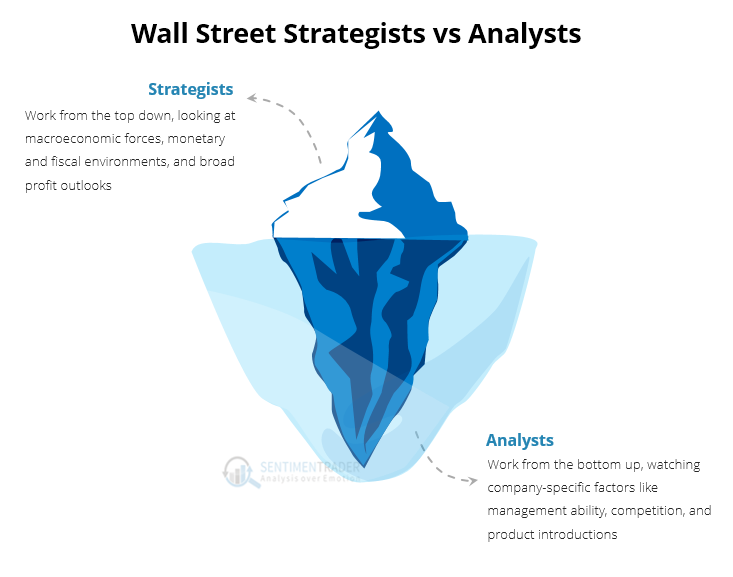
At the same time, even though Wall Street strategists are apprehensive, analysts have been busy upgrading price targets on the stocks in their coverage universe.
If we think about investors' risk being like an iceberg, then strategists would be warning about risks from above while analysts would be looking under the surface.
Below, we can see the net number of stocks within the S&P 500 that enjoyed a price target increase minus decrease. These technical upgrades were at a record high on June 10 and have settled down somewhat since then, but still high. This has tended to be a short- to medium-term contrary indicator.
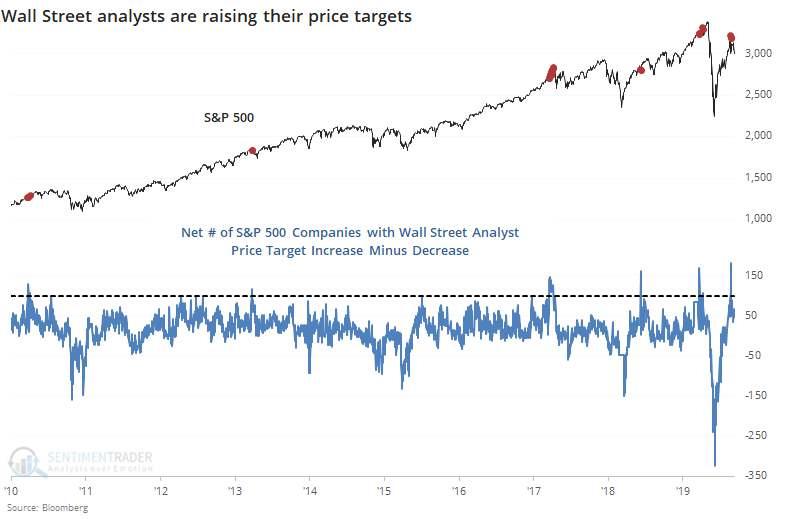
Analysts have been upgrading earnings estimates on the stocks they cover, too, so they're becoming a bit more optimistic about company fundamentals.
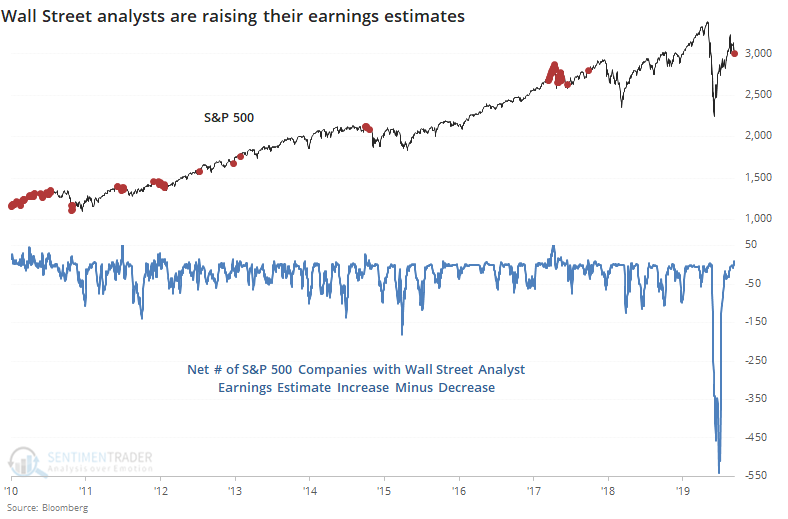
This has been less of a contrary indicator than when analysts are just raising price targets. Like we saw in the January 14 report, when analysts are upgrading technicals but not fundamentals, it's a big worry. That's not so much the case now.
Overall, the rise in optimism from both companies and Wall Street seems like it should be a good sign, but the evidence is mixed. When optimism gets to a very high level, it has tended to be more of a contrary than confirming indicator. Because of that, we'd consider the current bout of positivity to be a slight negative, but it's not enough to consider it a sell signal.
Active Studies
| Time Frame | Bullish | Bearish | | Short-Term | 0 | 0 | | Medium-Term | 8 | 6 | | Long-Term | 42 | 1 |
|
Indicators at Extremes
Portfolio
| Position | Weight % | Added / Reduced | Date | | Stocks | 29.8 | Reduced 9.1% | 2020-06-11 | | Bonds | 0.0 | Reduced 6.7% | 2020-02-28 | | Commodities | 5.2 | Added 2.4%
| 2020-02-28 | | Precious Metals | 0.0 | Reduced 3.6% | 2020-02-28 | | Special Situations | 0.0 | Reduced 31.9% | 2020-03-17 | | Cash | 65.0 | | |
|
Updates (Changes made today are underlined)
In the first months of the year, we saw manic trading activity. From big jumps in specific stocks to historic highs in retail trading activity to record highs in household confidence to almost unbelievable confidence among options traders. All of that came amid a market where the average stock couldn't keep up with their indexes. There were signs of waning momentum in stocks underlying the major averages, which started triggering technical warning signs in late January. After stocks bottomed on the 23rd, they enjoyed a historic buying thrust and retraced a larger amount of the decline than "just a bear market rally" tends to. Those thrusts are the most encouraging sign we've seen in years. Through early June, we were still seeing thrusts that have led to recoveries in longer-term breadth metrics. The longer-term prospects for stocks (6-12 months) still look decent given the above. On a short- to medium-term basis, it was getting harder to make that case. Dumb Money Confidence spiked and there were multiple signs of a historic level of speculation. This is likely the lowest I will go given what I still consider to be compelling positives over a longer time frame. There is not a slam-dunk case to be made for either direction, so it will seem like a mistake whether stocks keep dropping (why didn't I sell more?) or if they turn and head higher (why did I let short-term concerns prevail?). After nearly three decades of trading, I've learned to let go of the idea of perfection.
RETURN YTD: -5.6% 2019: 12.6%, 2018: 0.6%, 2017: 3.8%, 2016: 17.1%, 2015: 9.2%, 2014: 14.5%, 2013: 2.2%, 2012: 10.8%, 2011: 16.5%, 2010: 15.3%, 2009: 23.9%, 2008: 16.2%, 2007: 7.8%
|
|
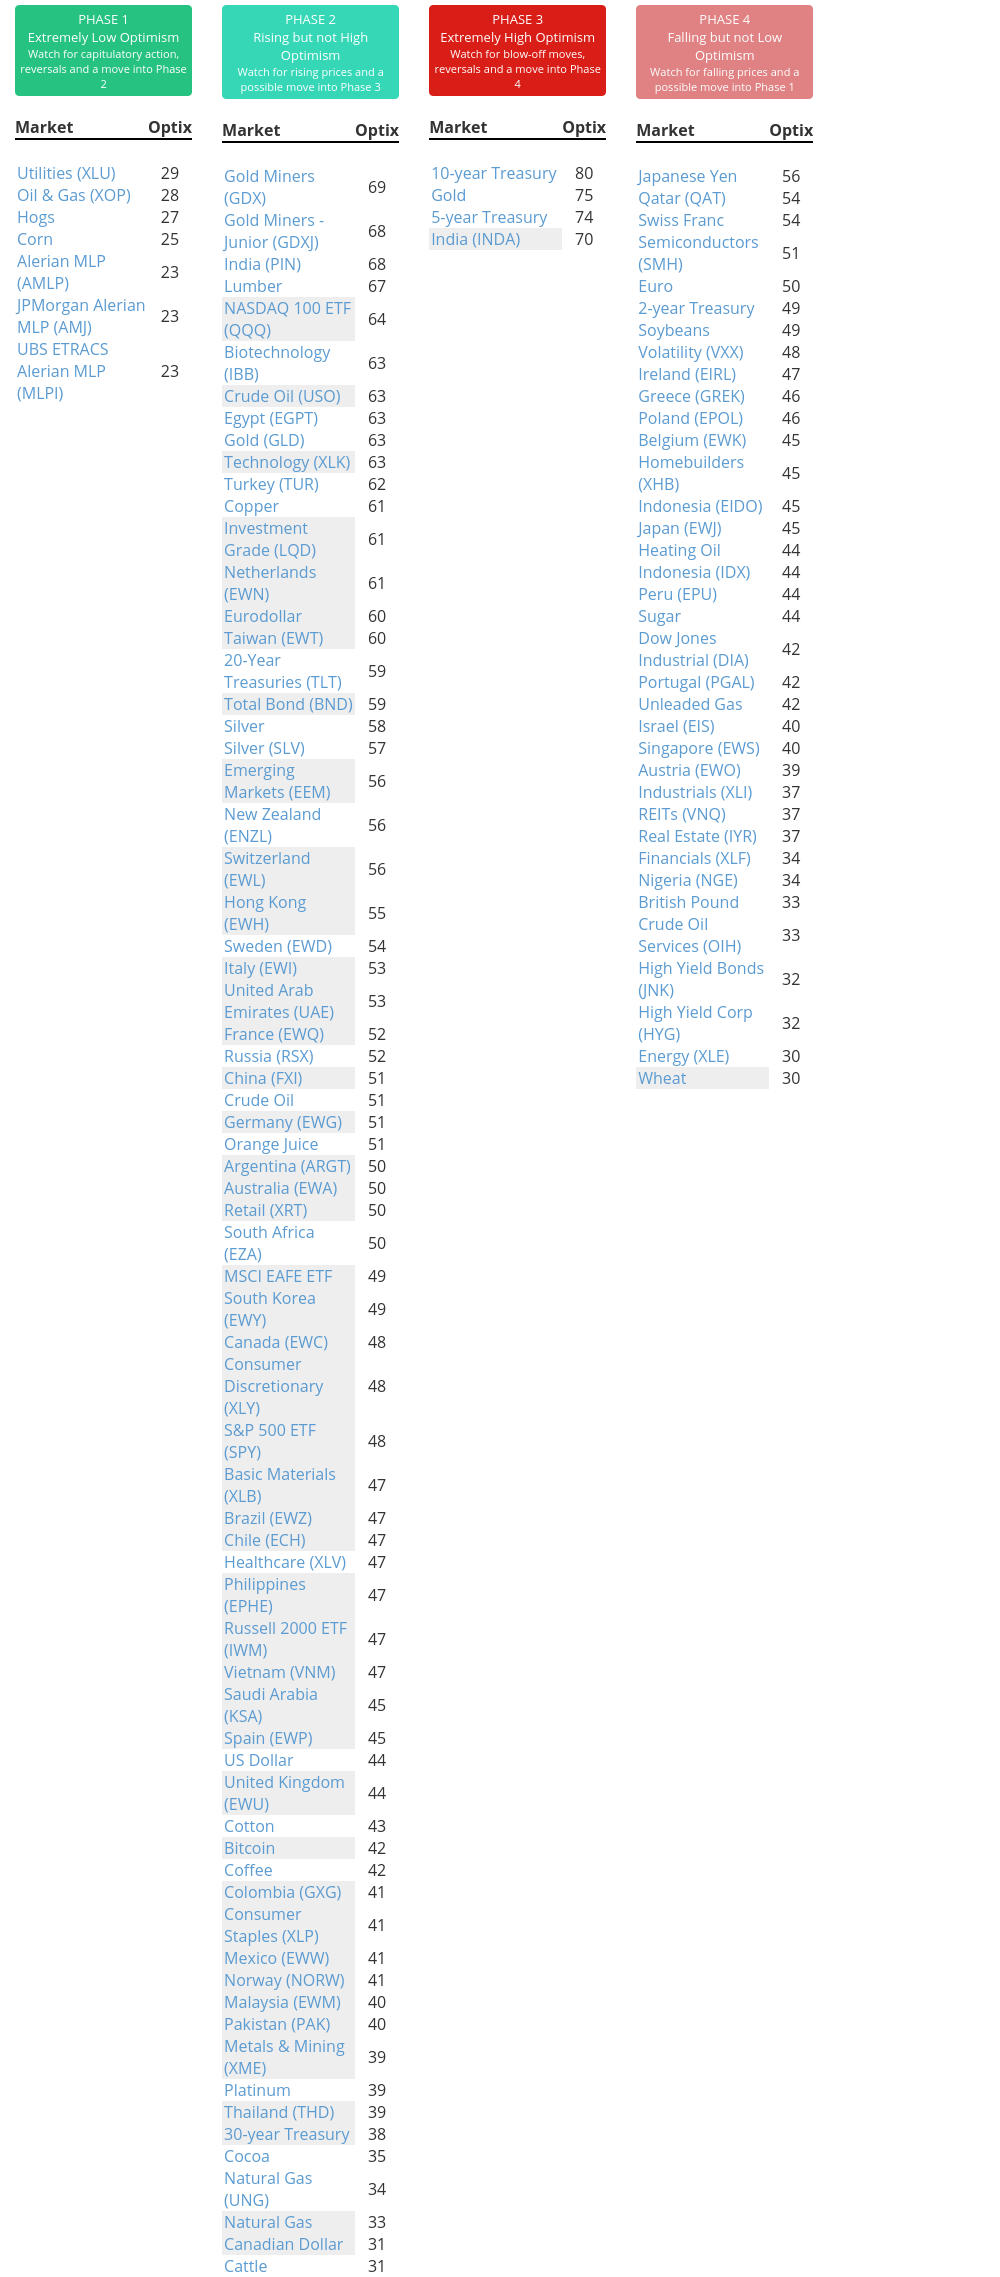
Phase Table
Ranks
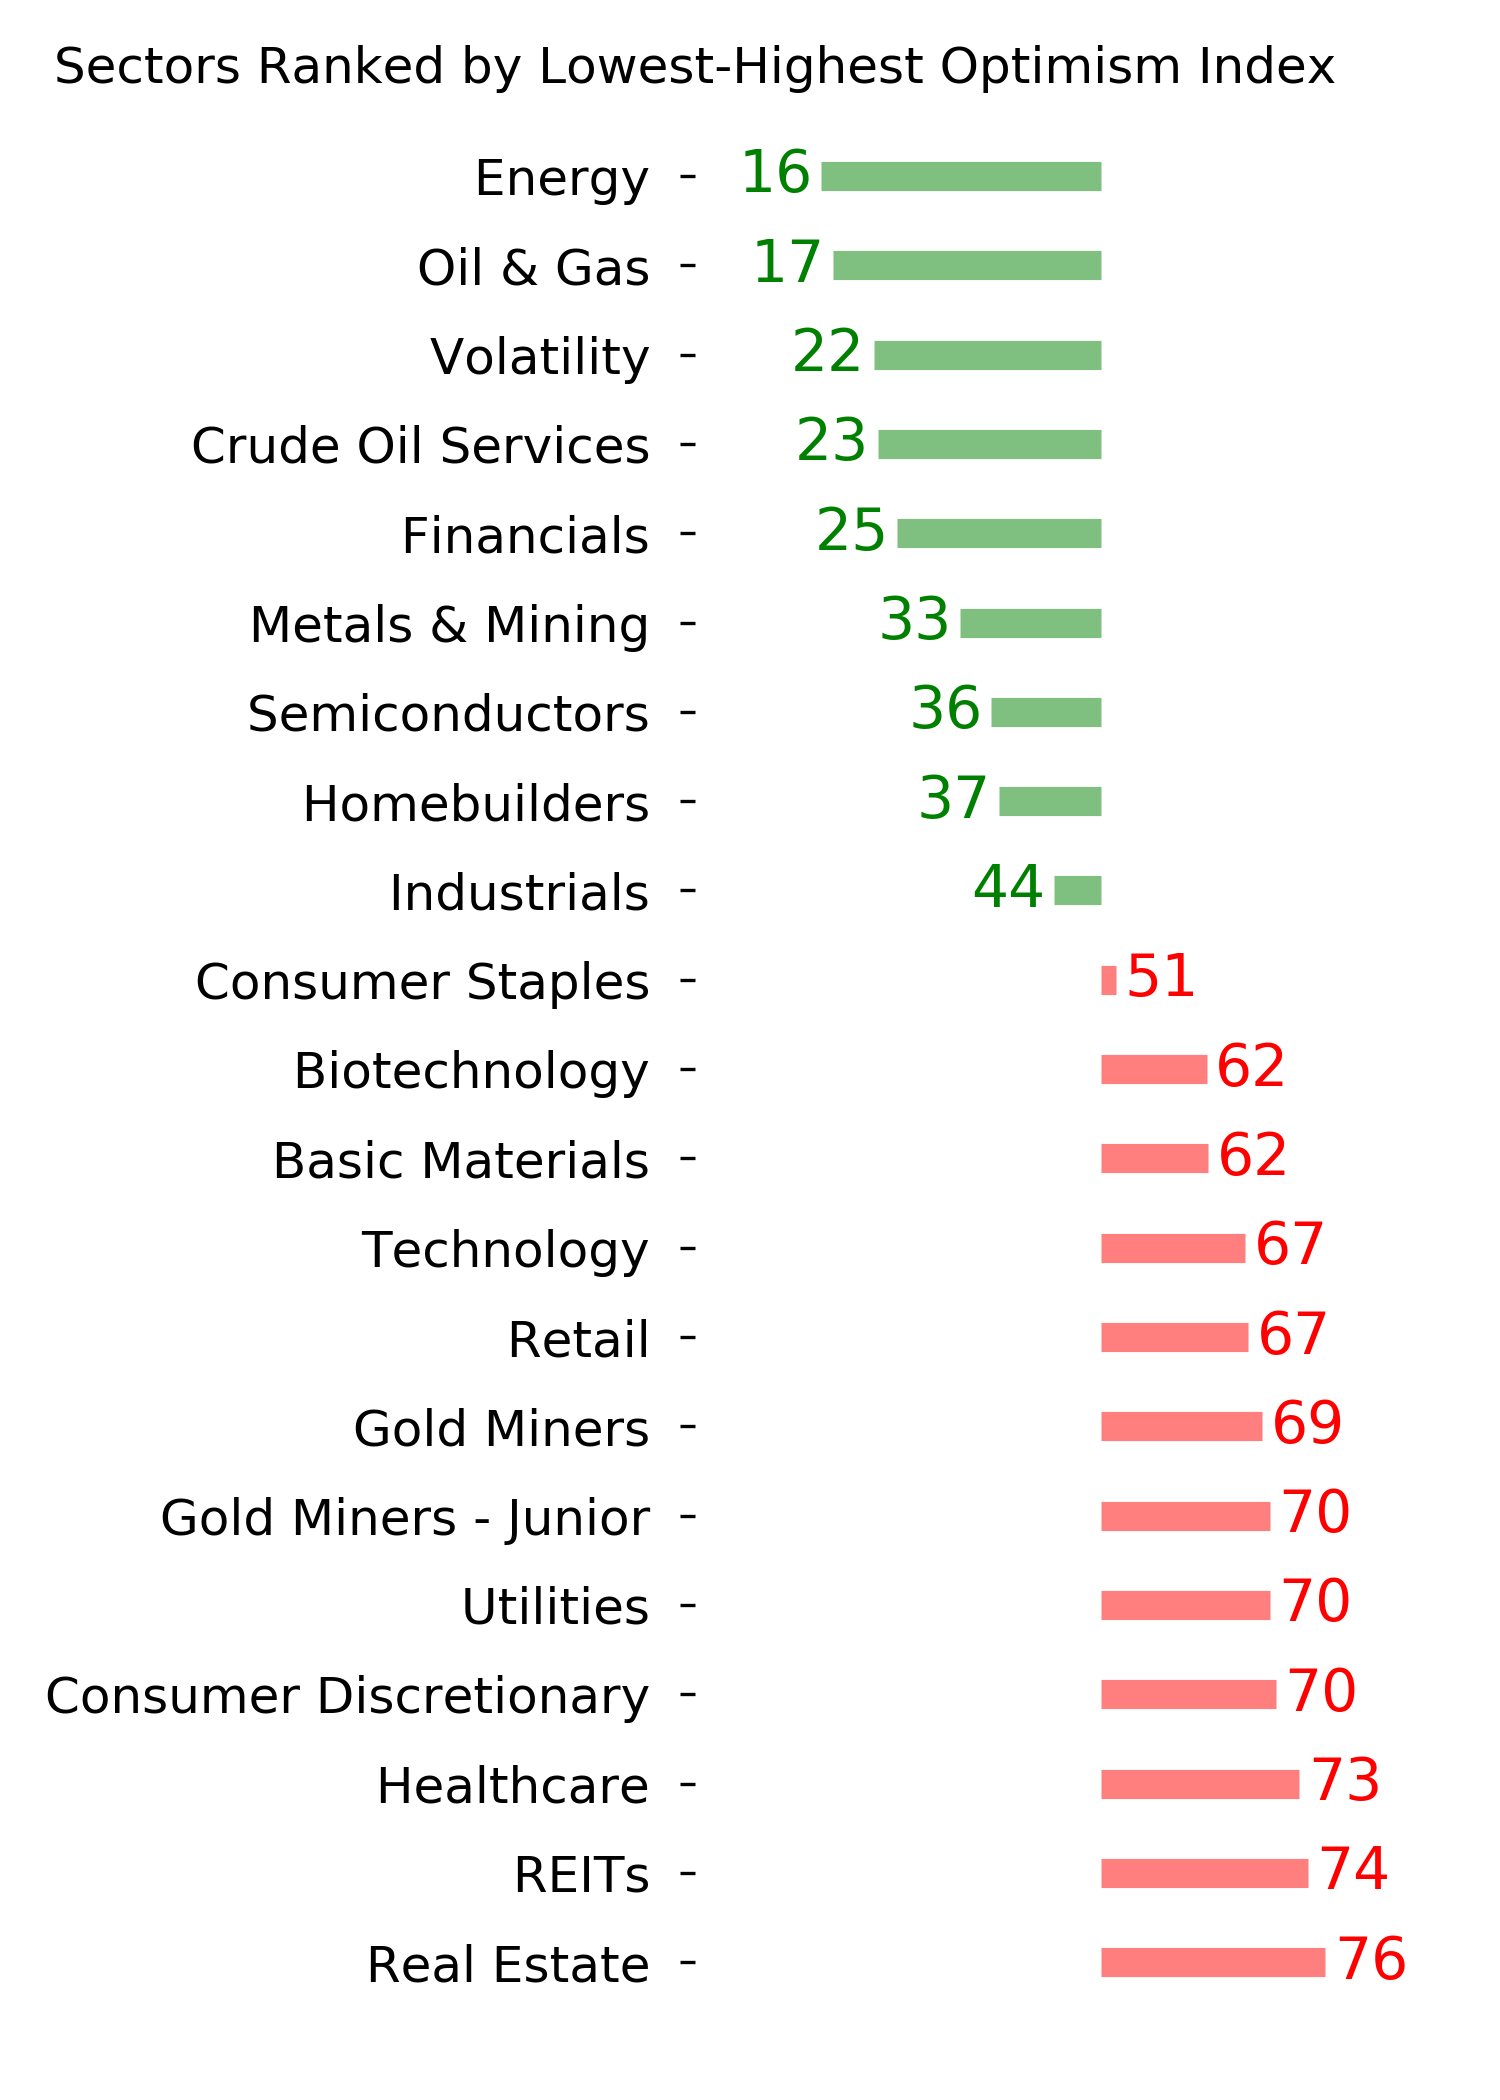
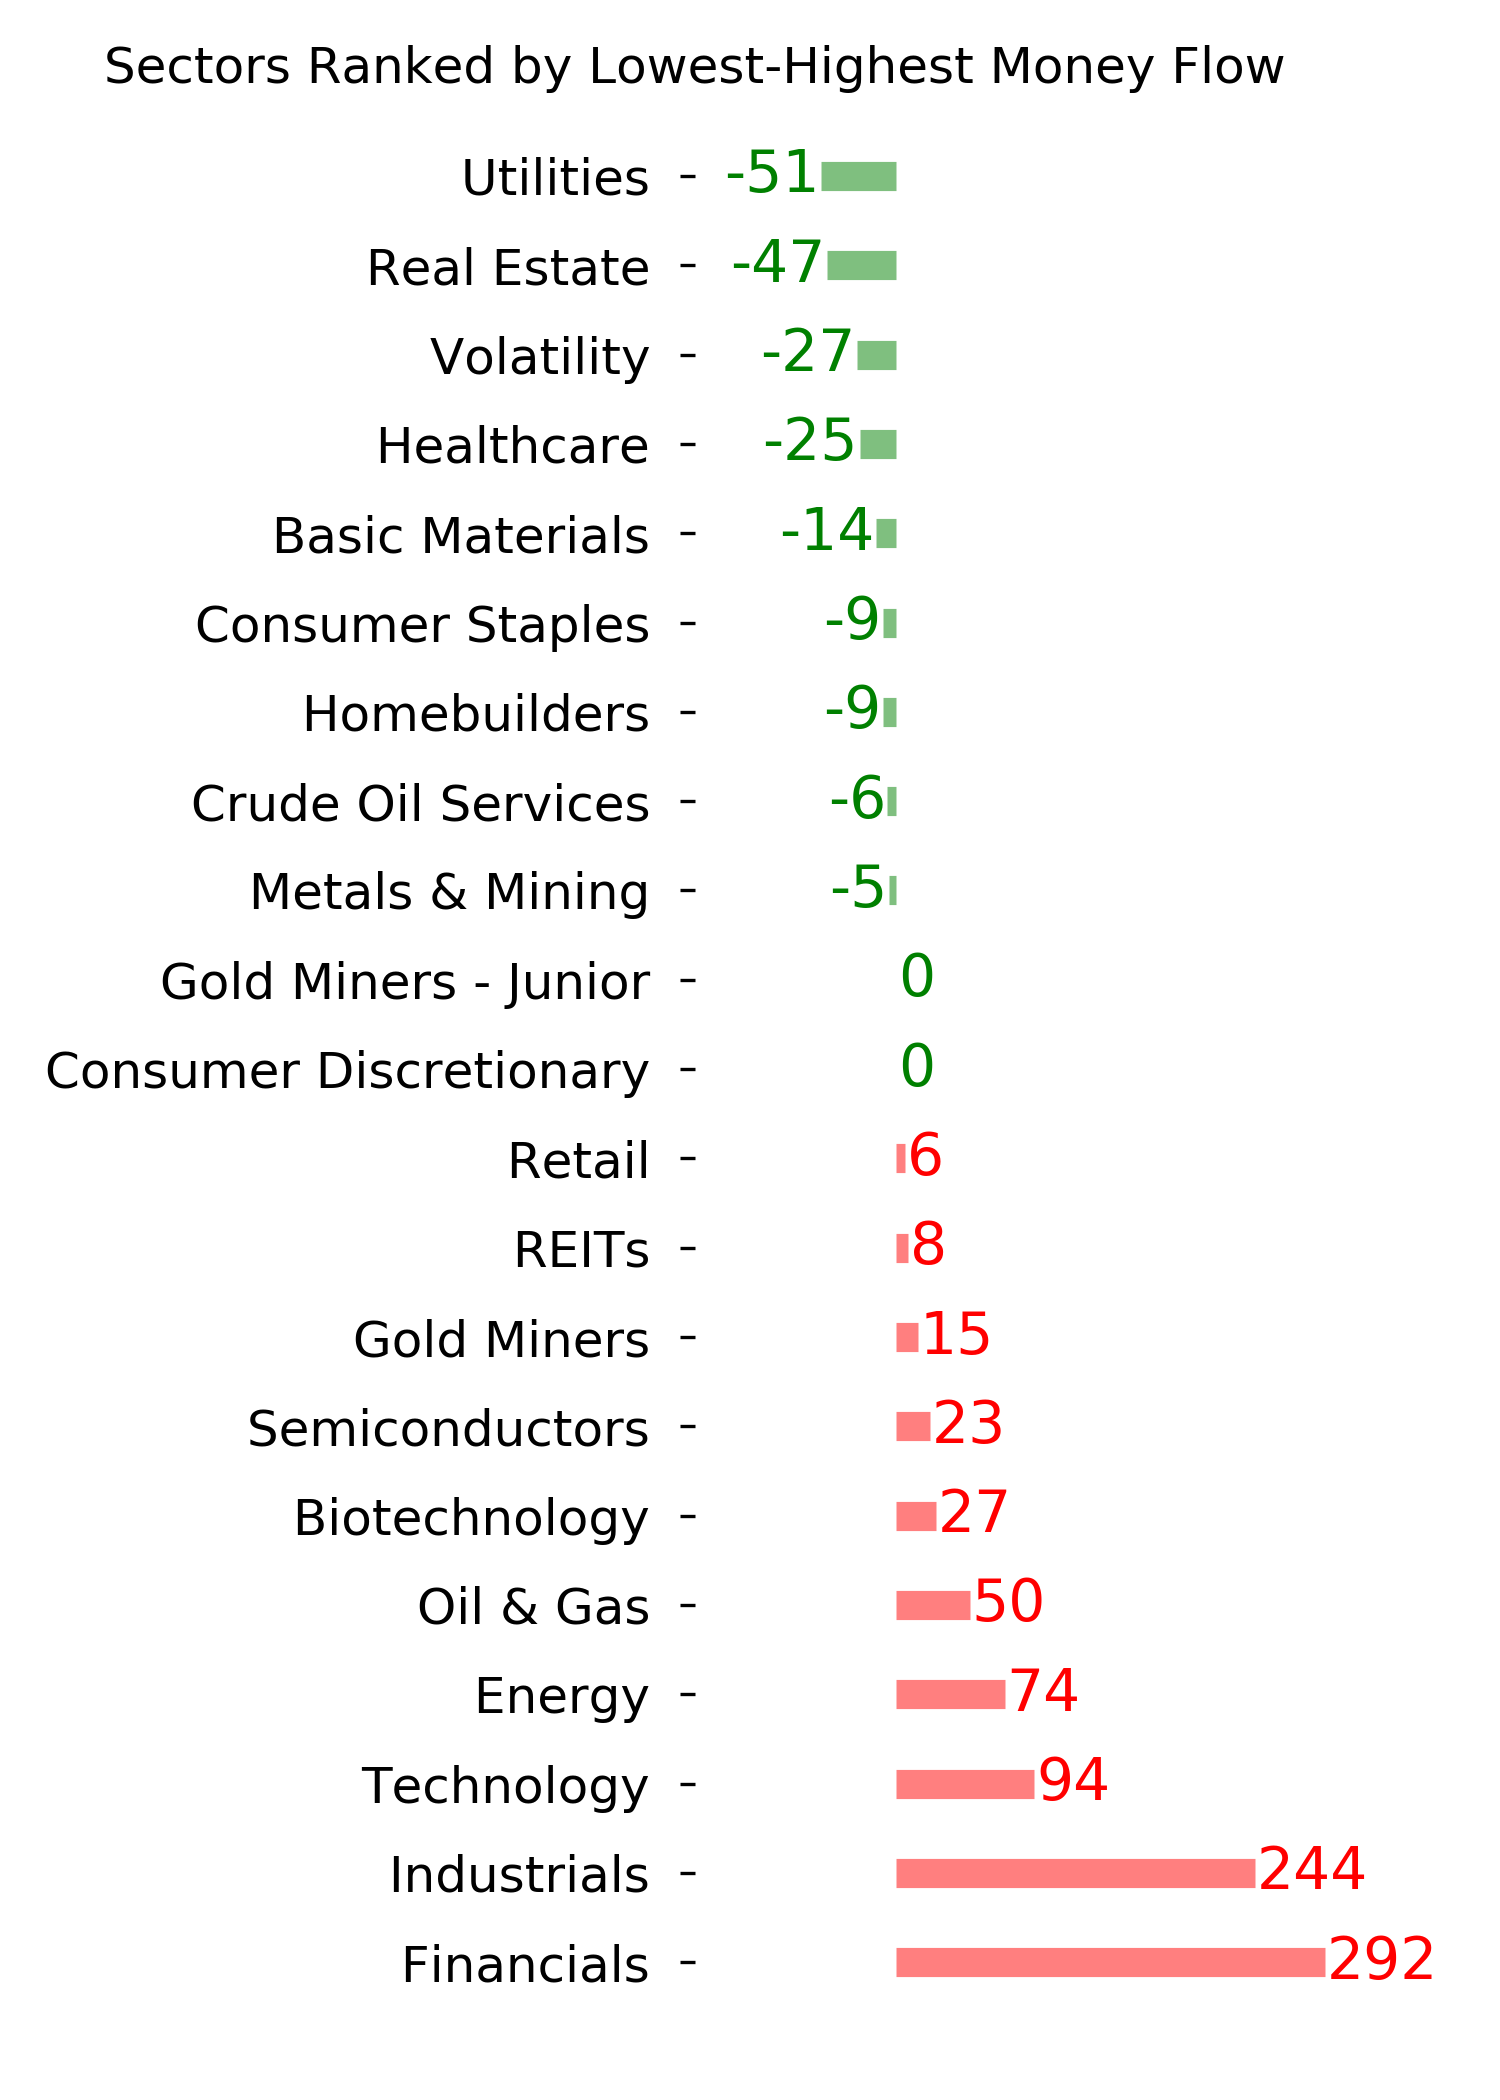
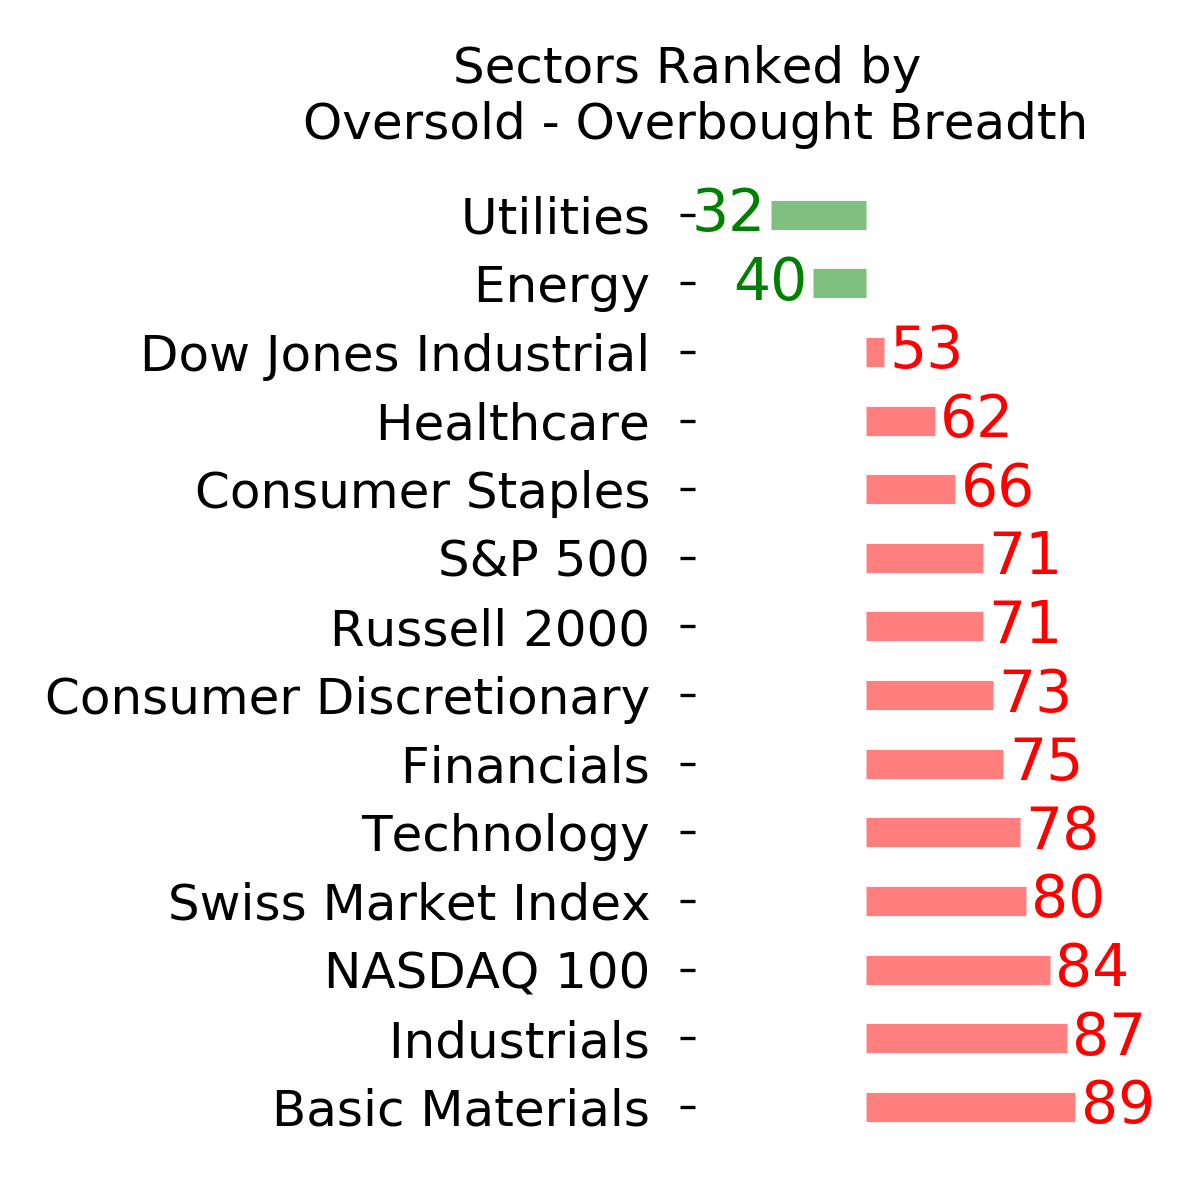
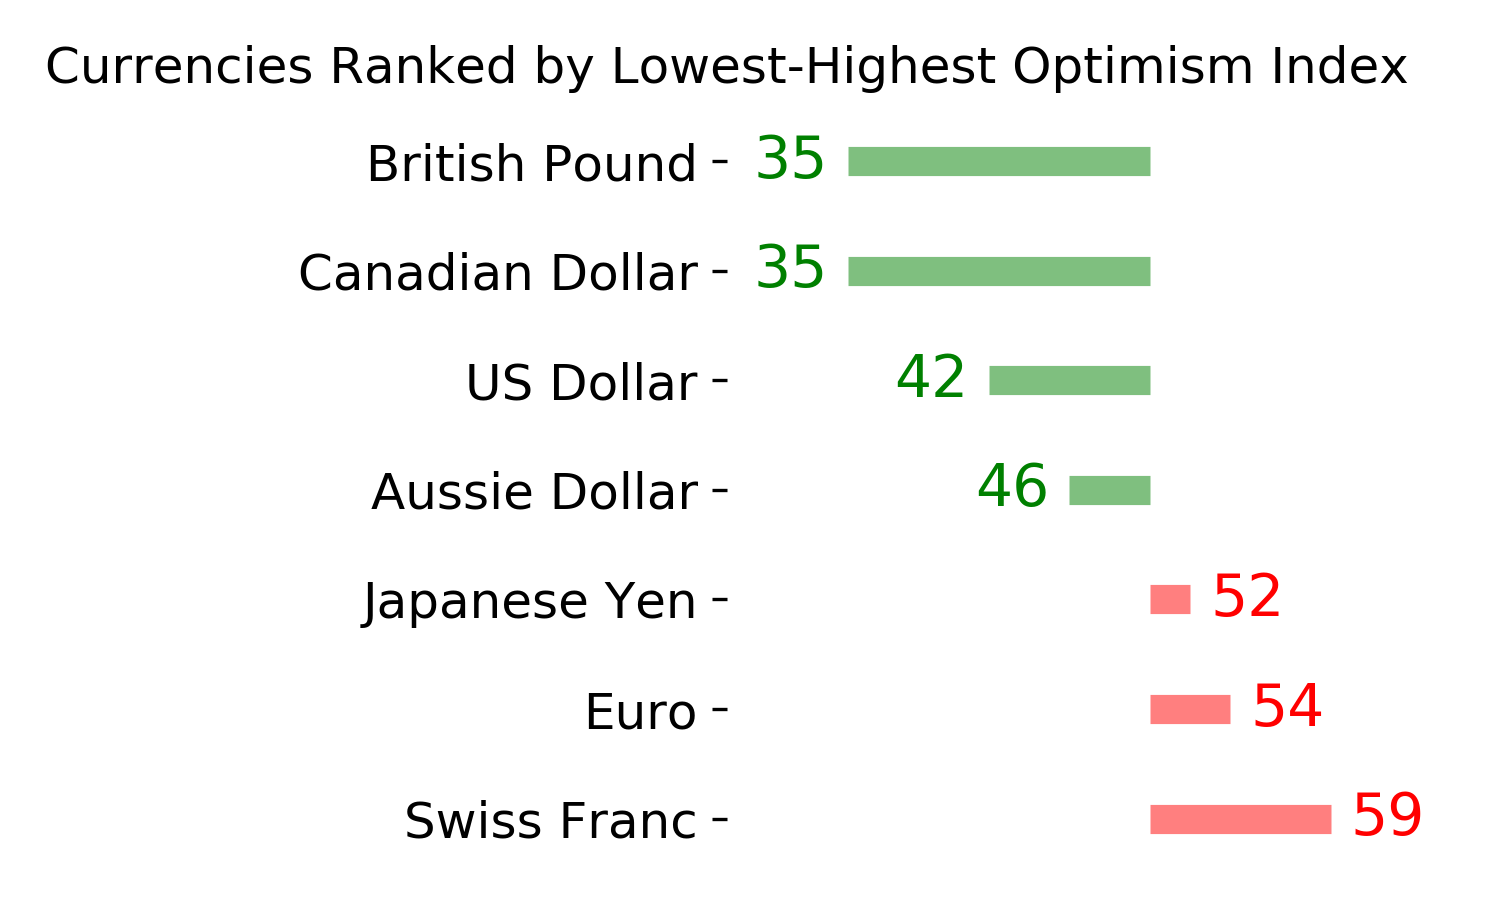
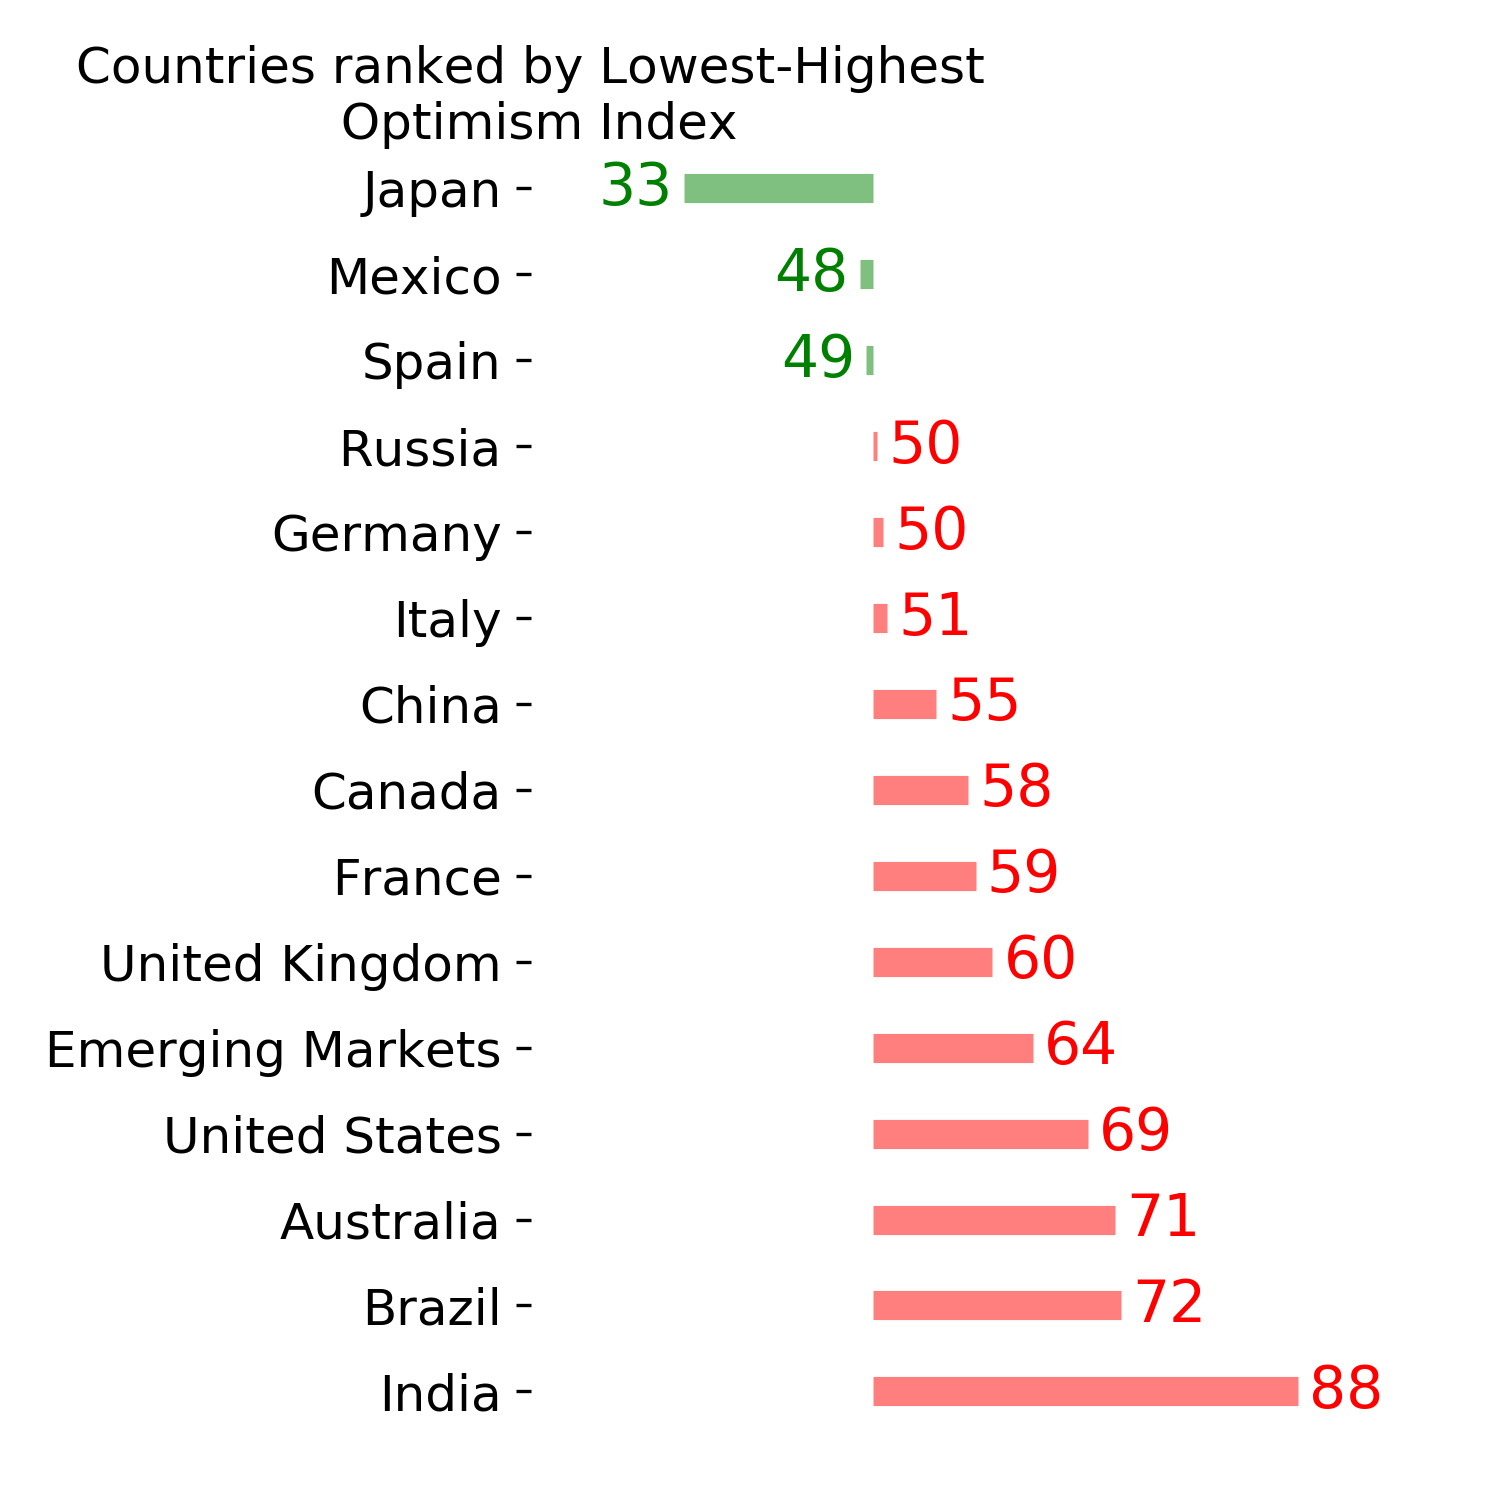
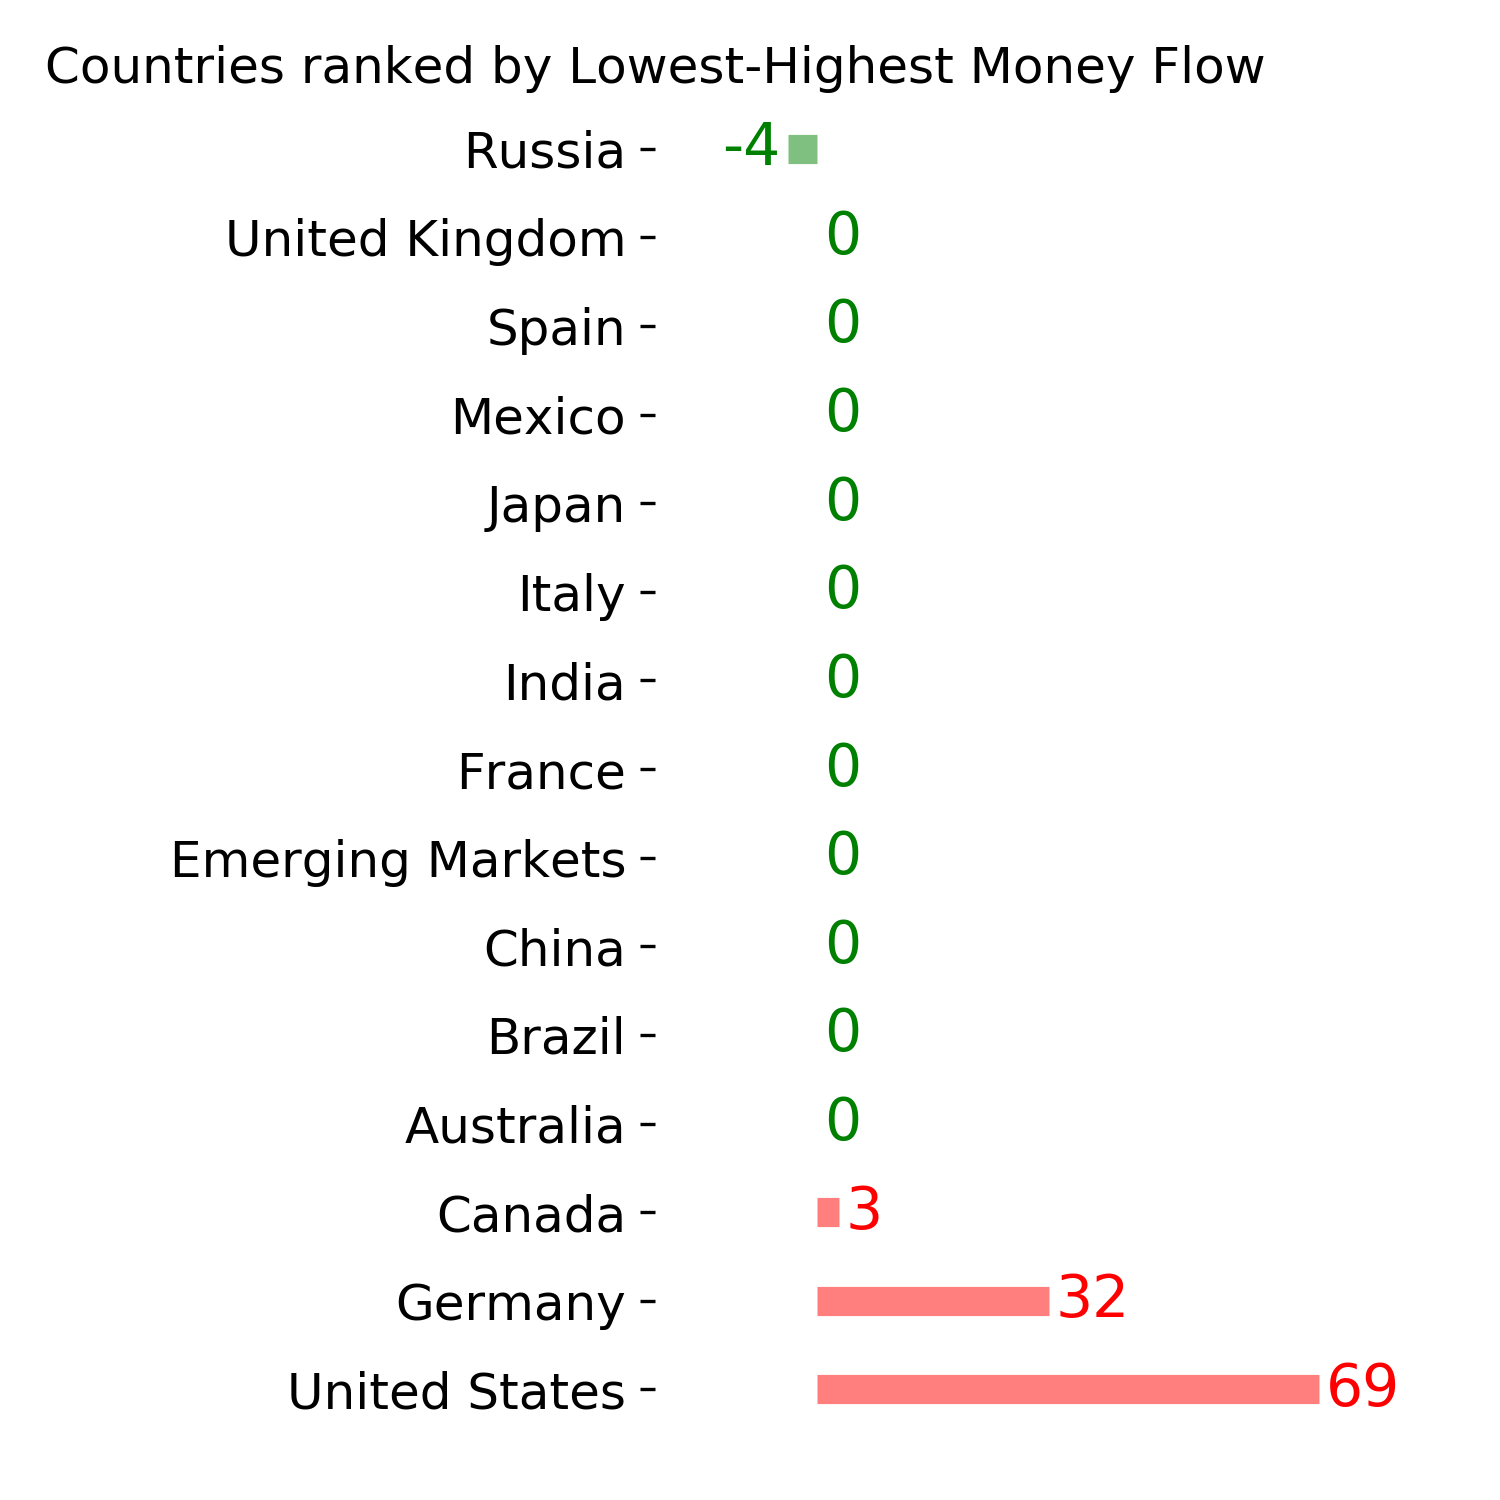
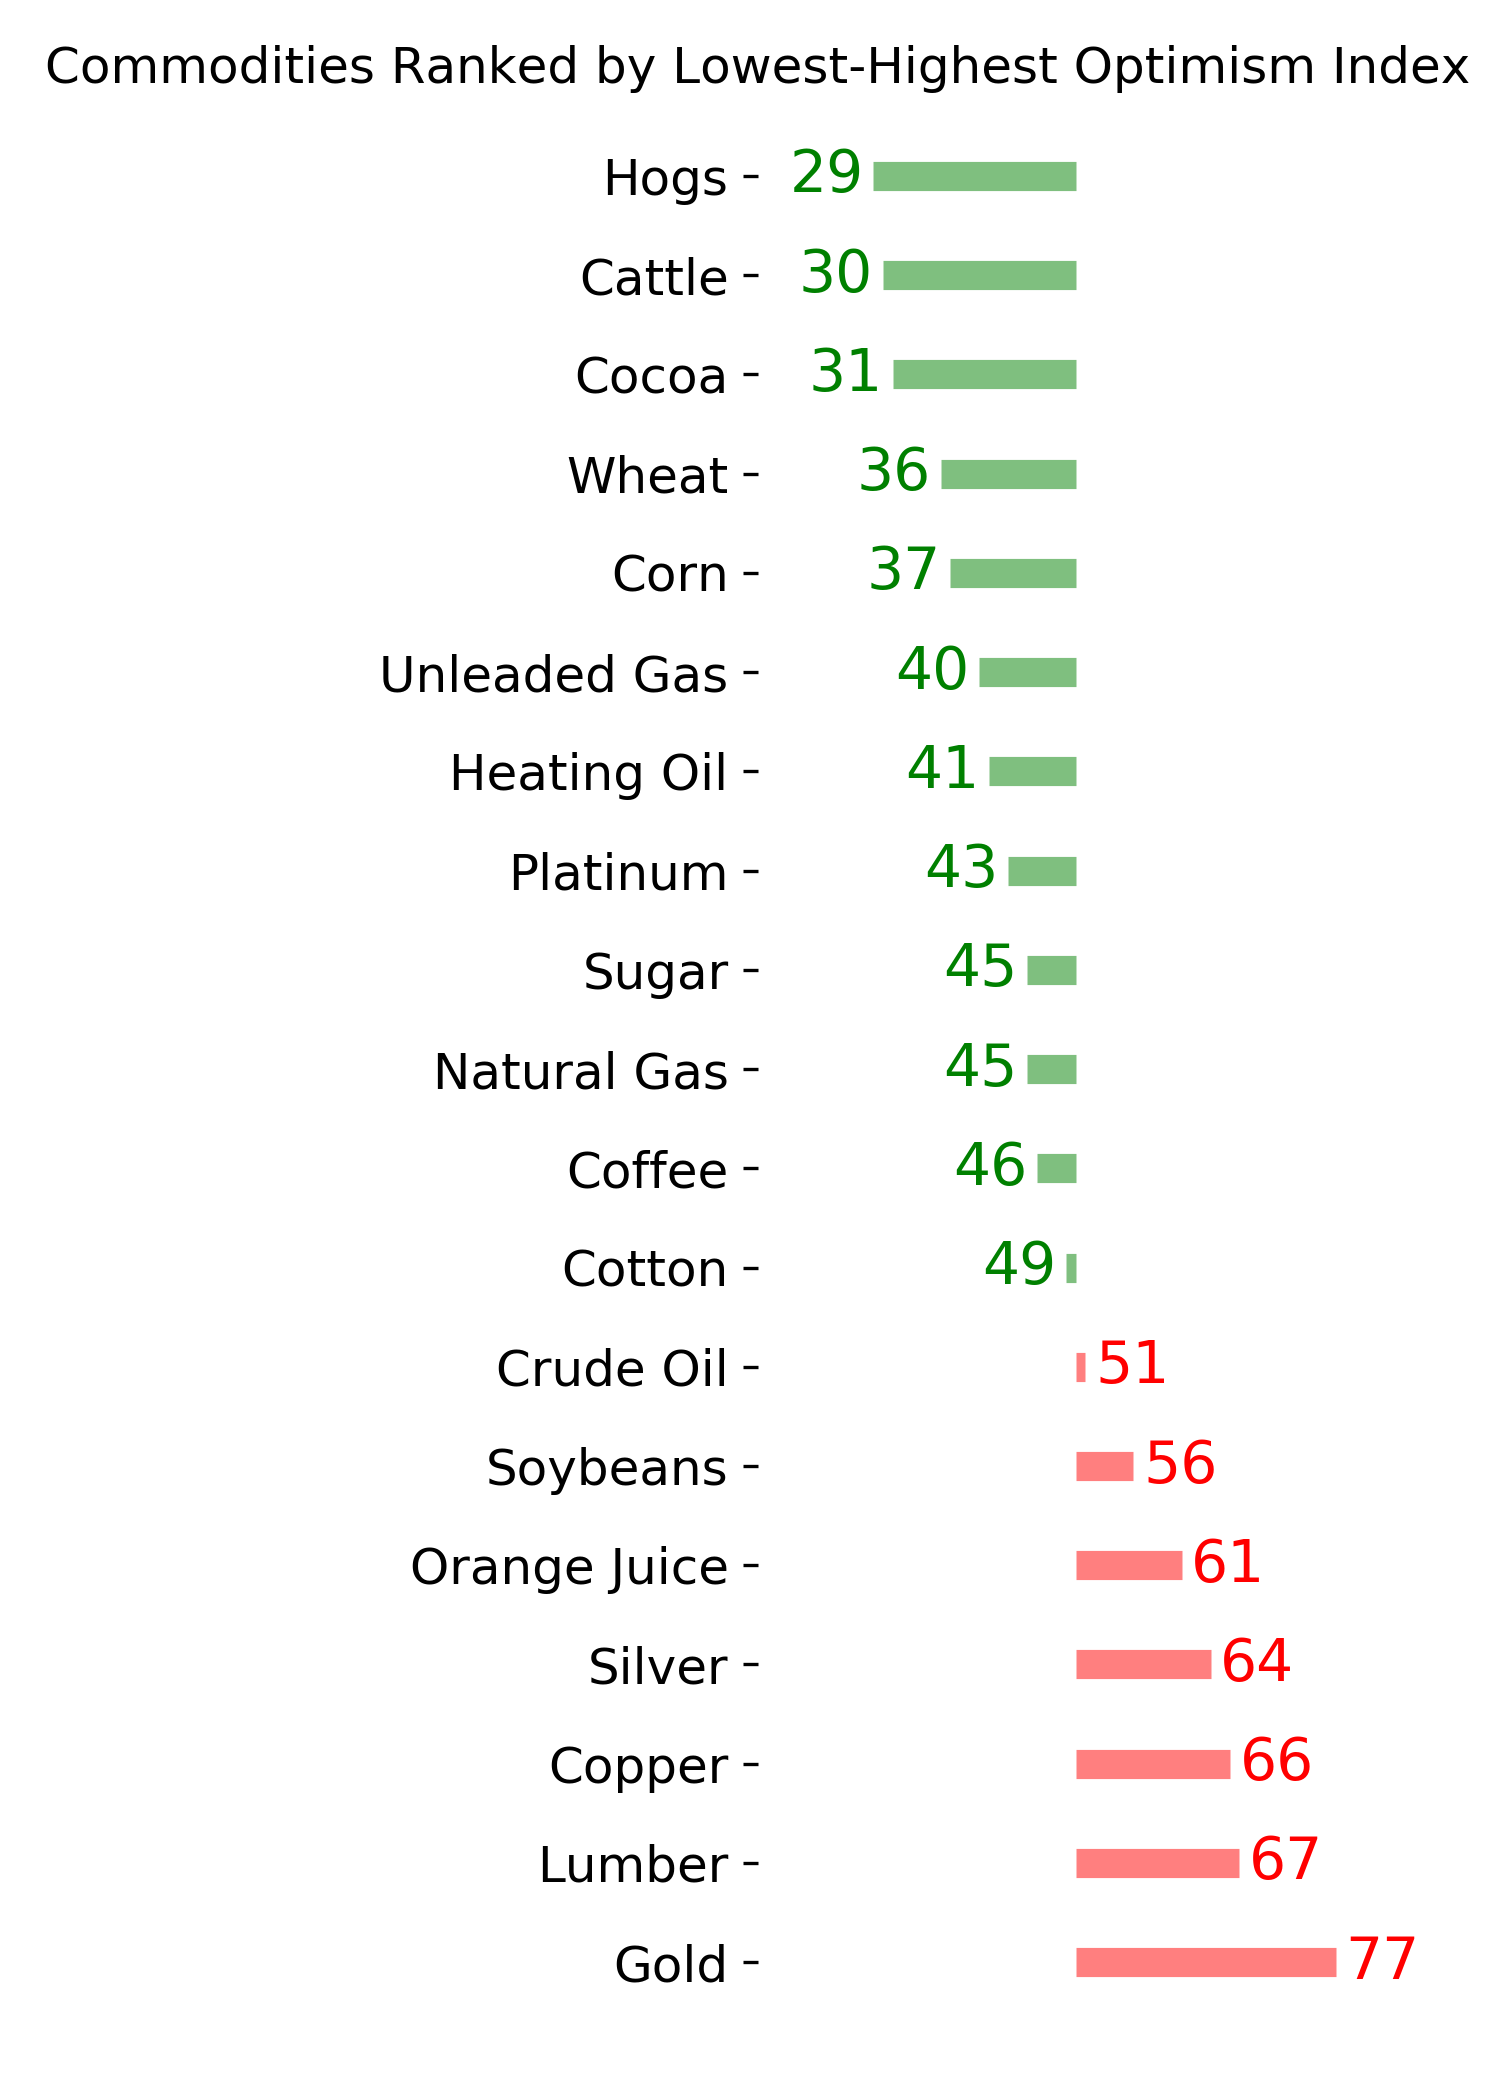
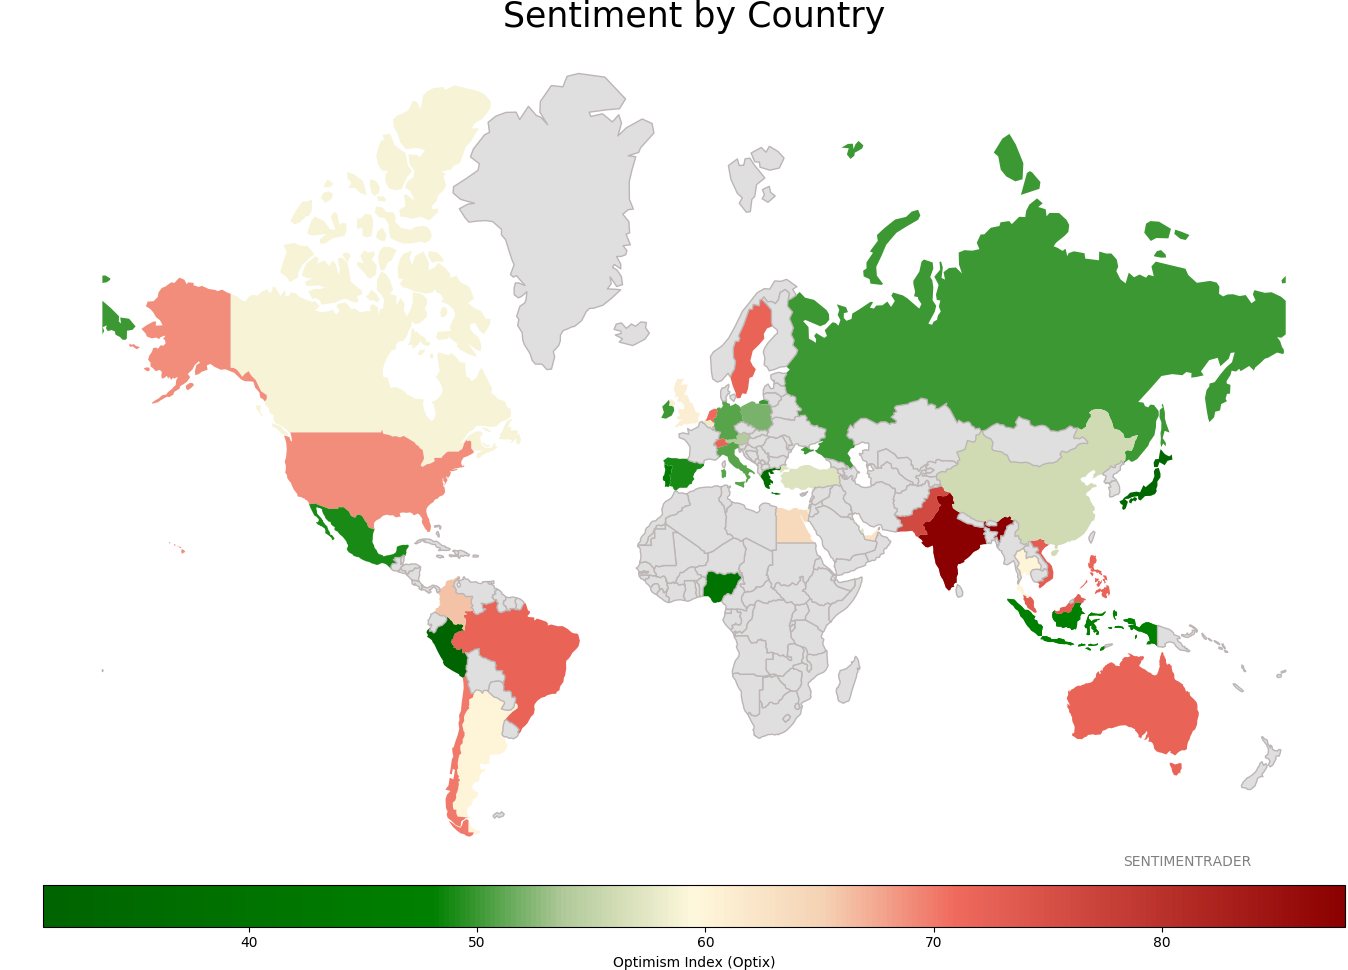
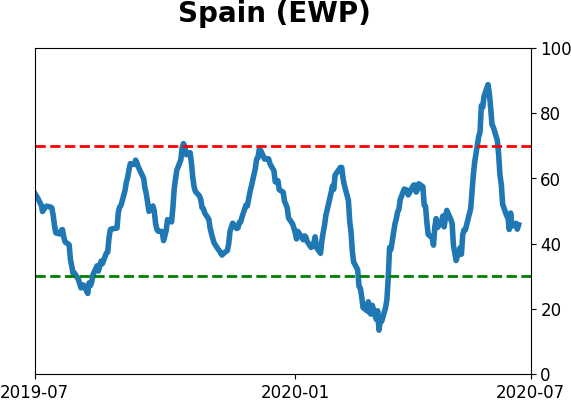
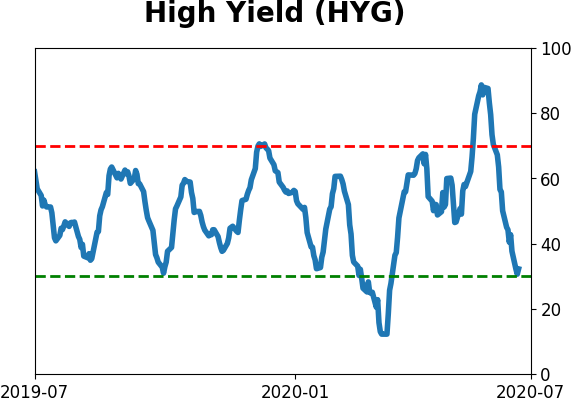
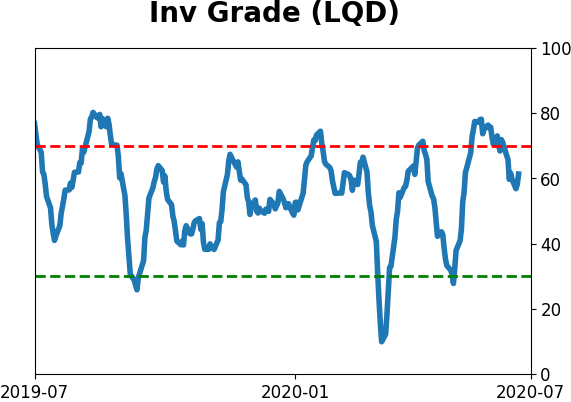
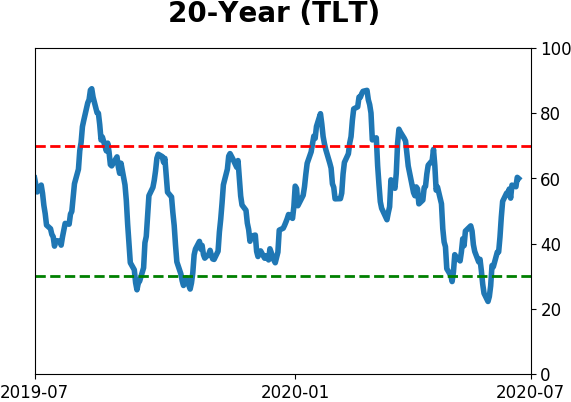
Sentiment Around The World
Optimism Index Thumbnails
|
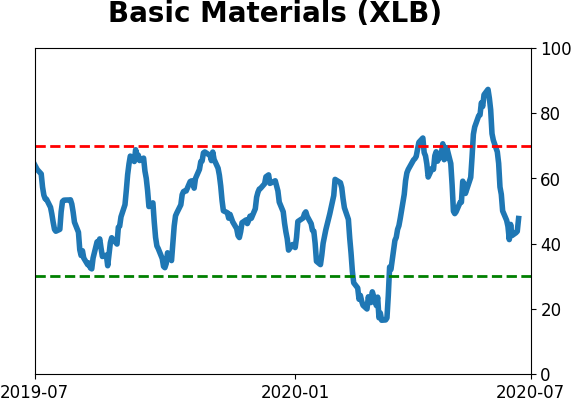
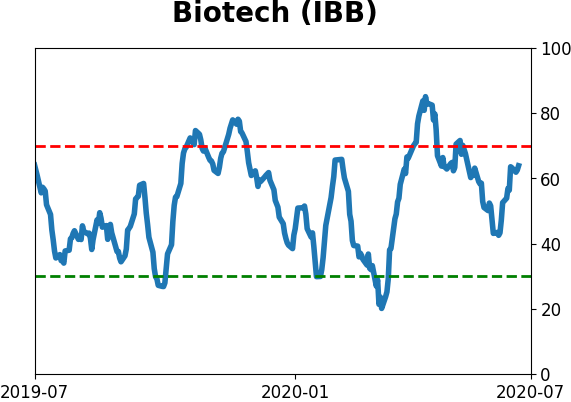
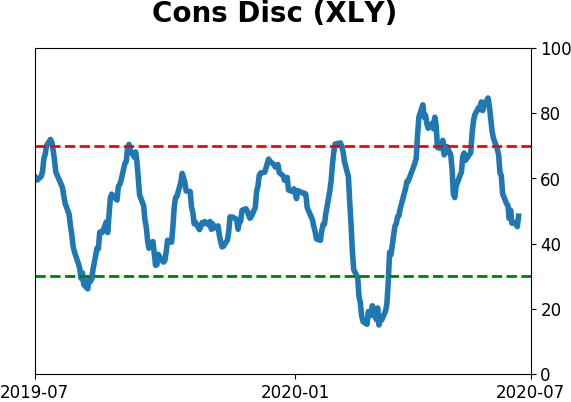
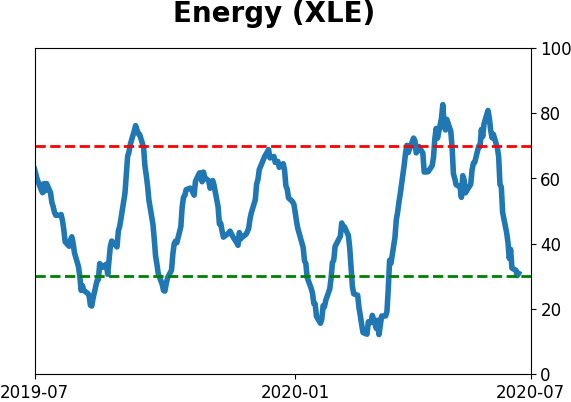
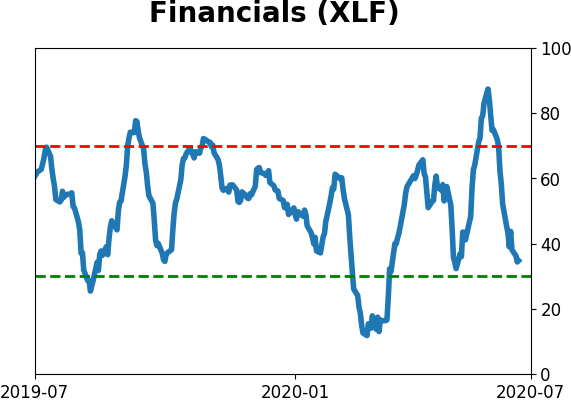
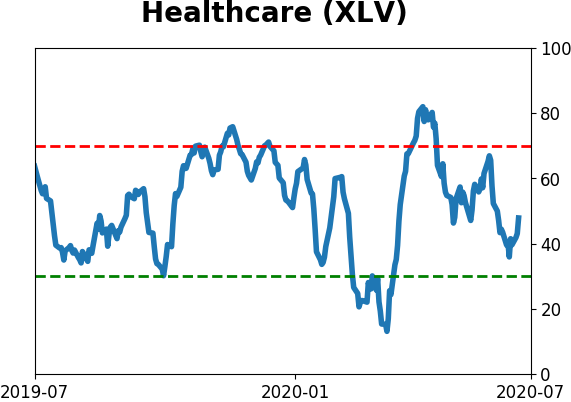
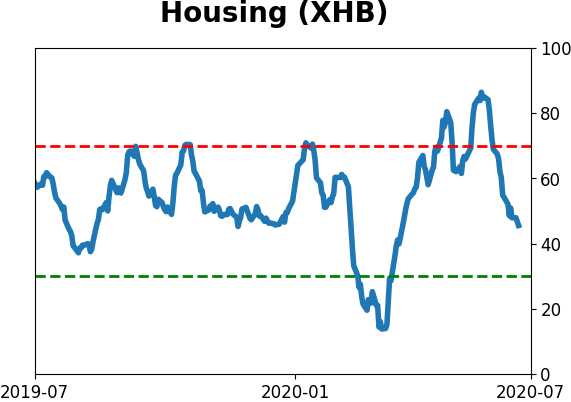
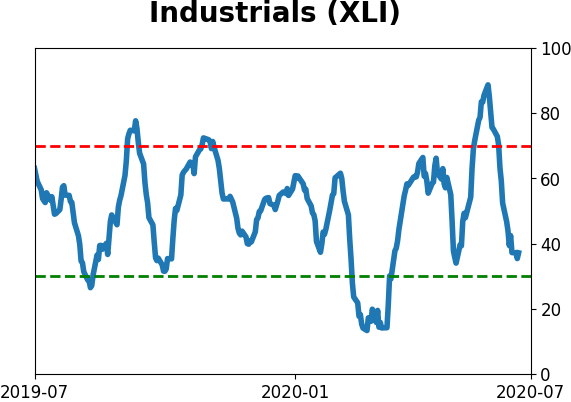
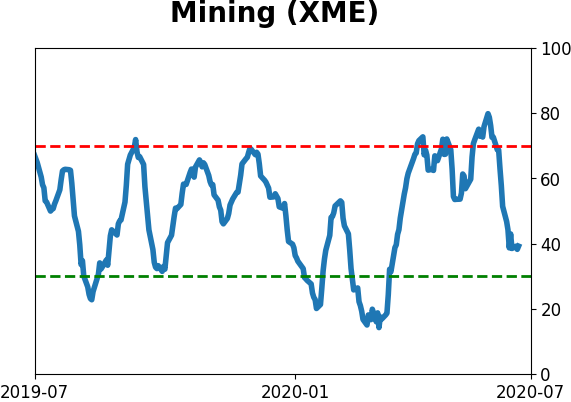
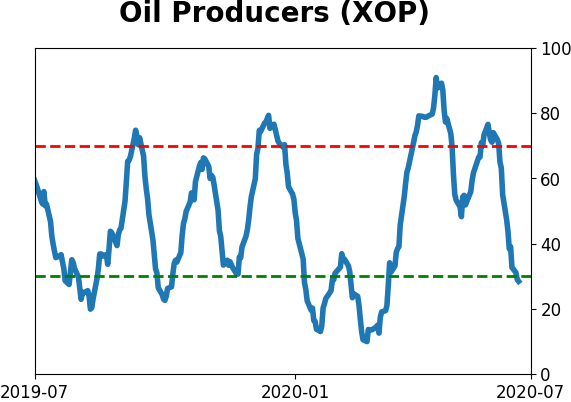
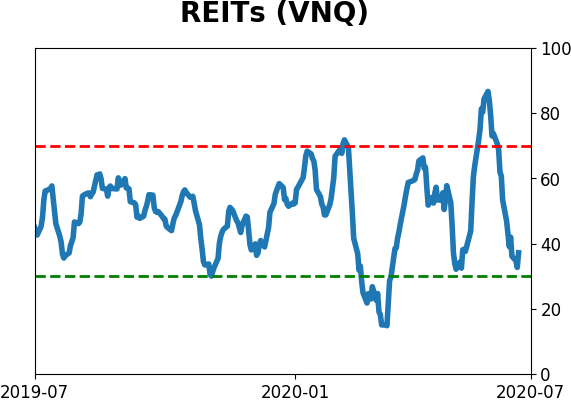
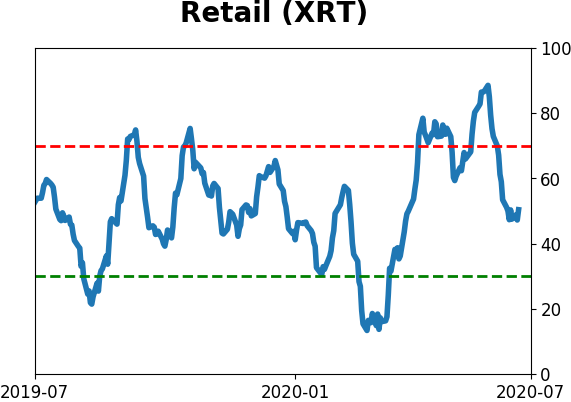
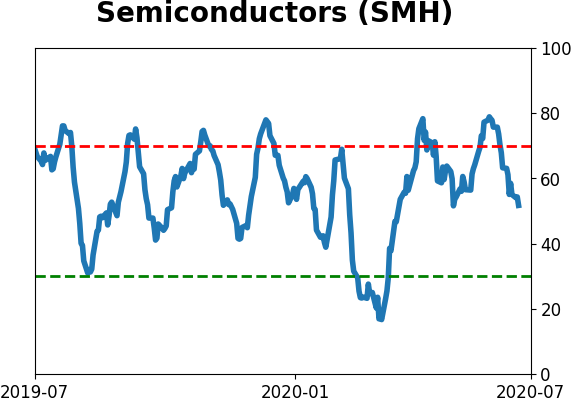
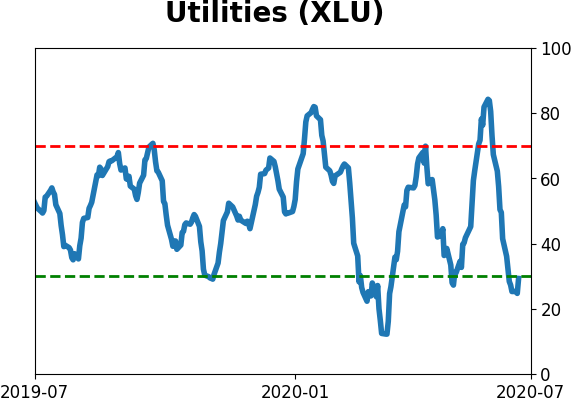
Sector ETF's - 10-Day Moving Average
|
|
|
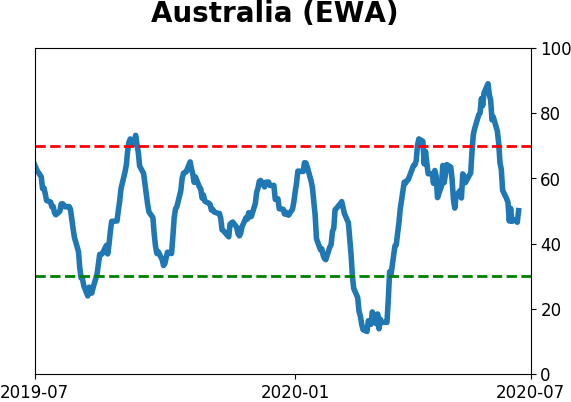
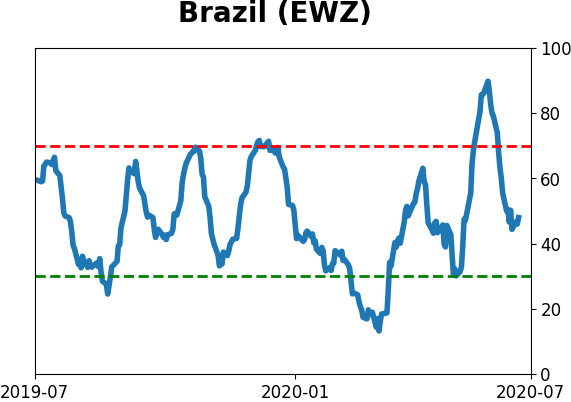
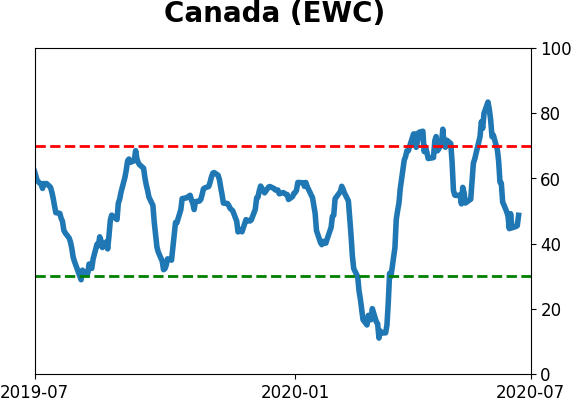
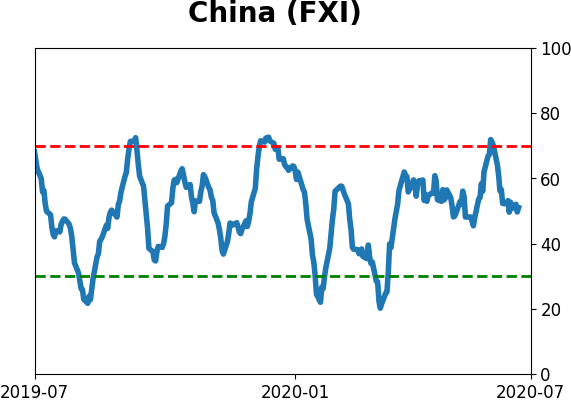
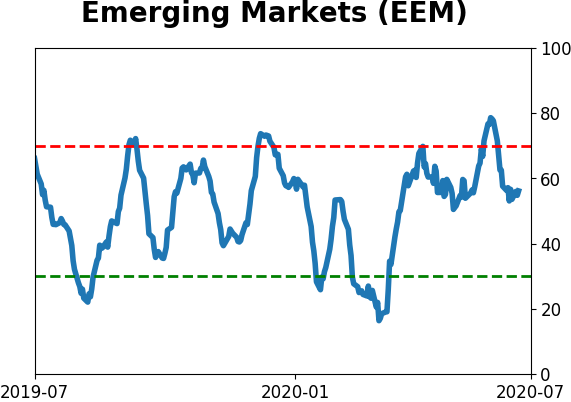
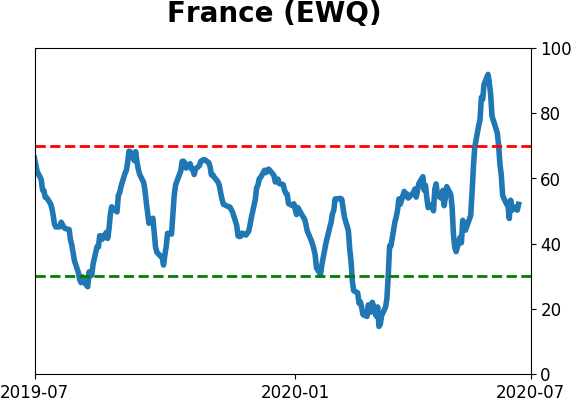
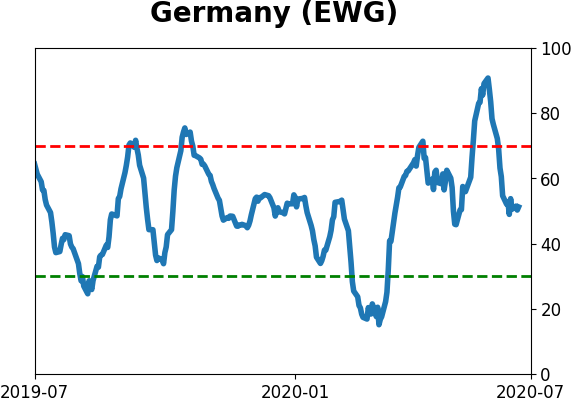
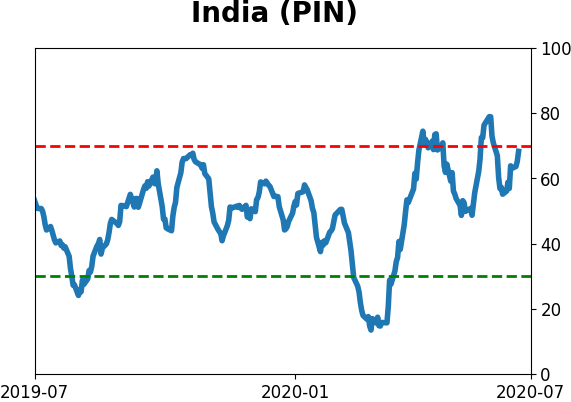
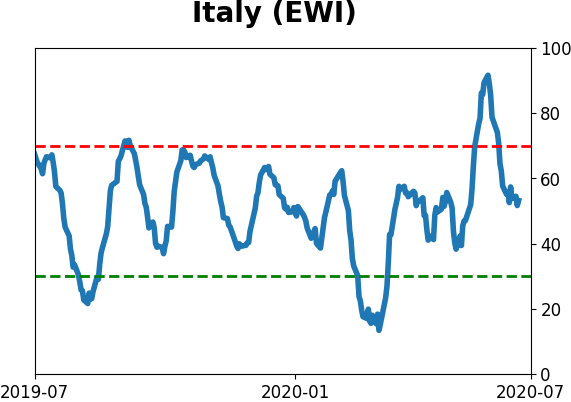
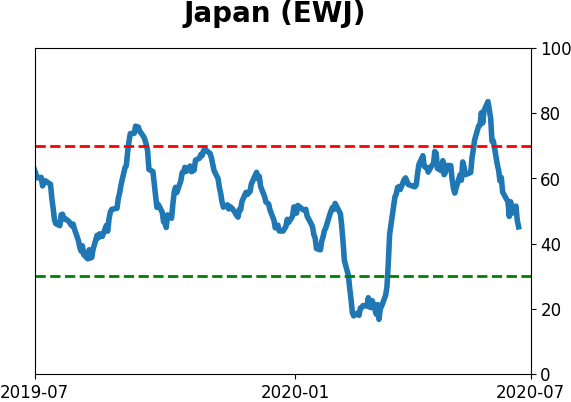
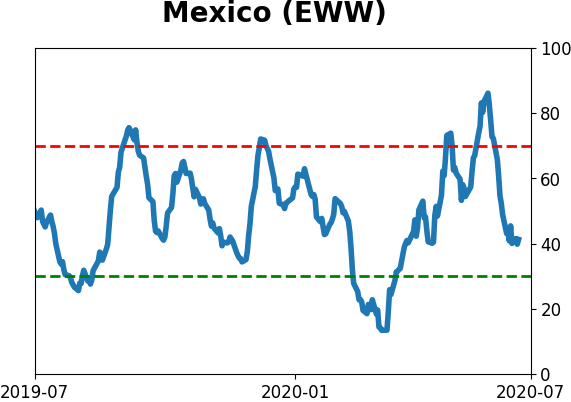
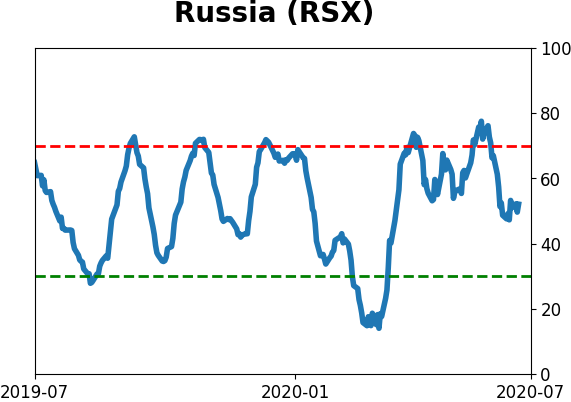
Country ETF's - 10-Day Moving Average
|
|
|
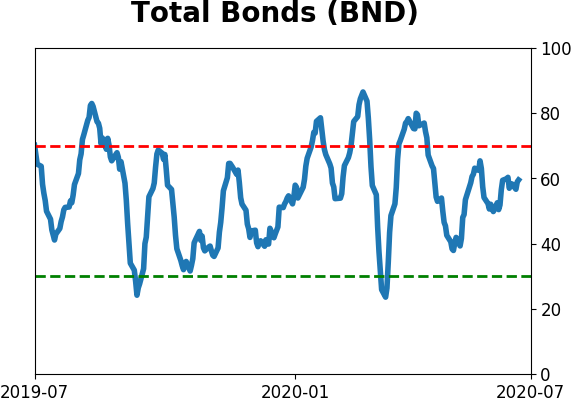
Bond ETF's - 10-Day Moving Average
|
|
|
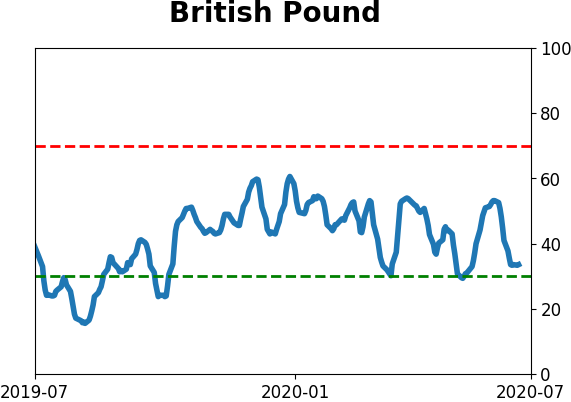
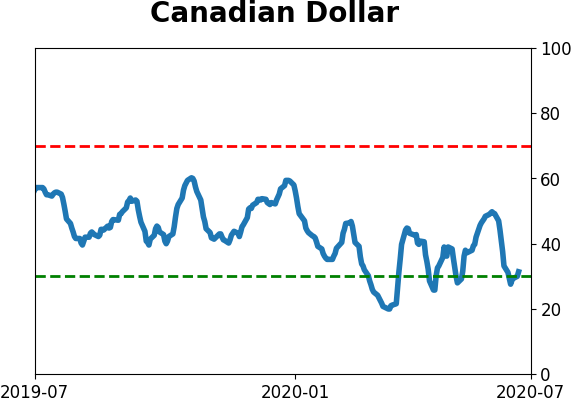
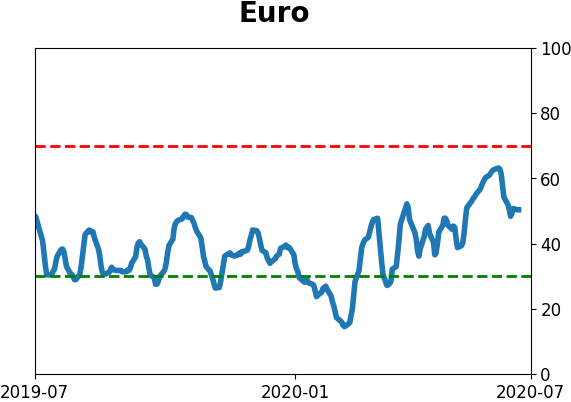
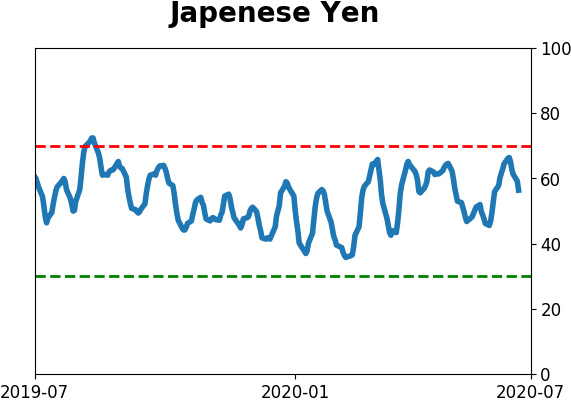
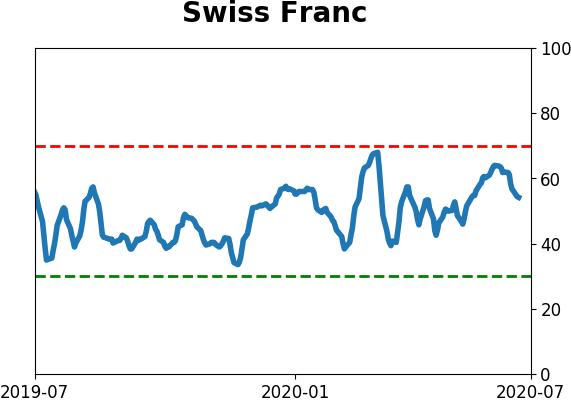
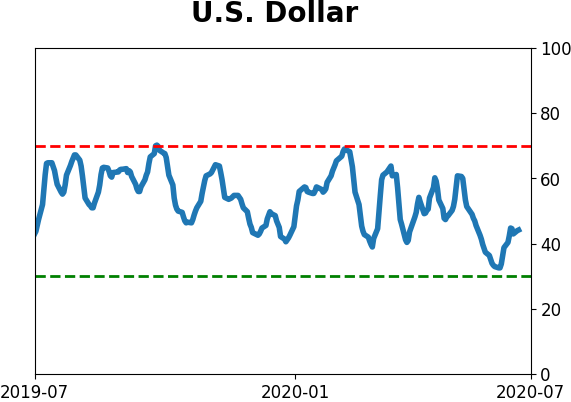
Currency ETF's - 5-Day Moving Average
|
|
|
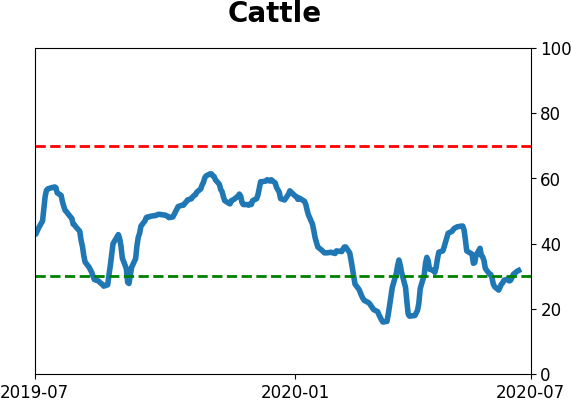
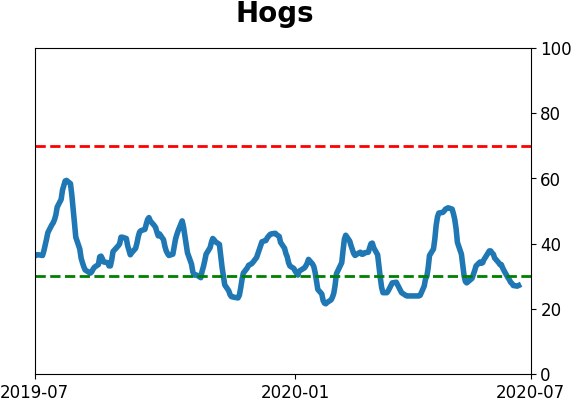
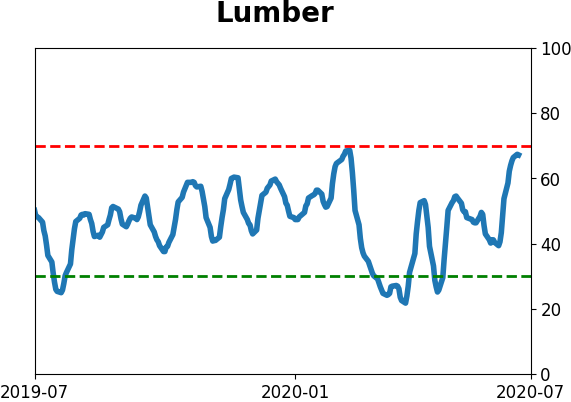
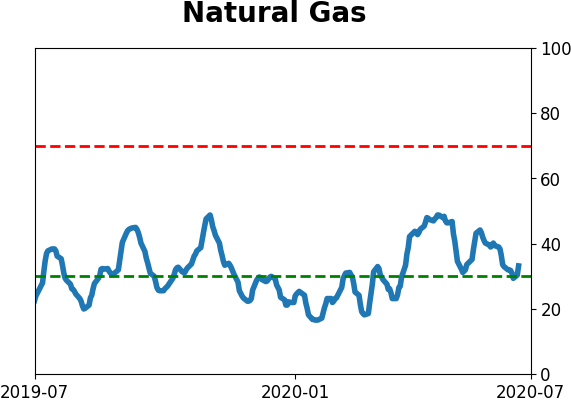
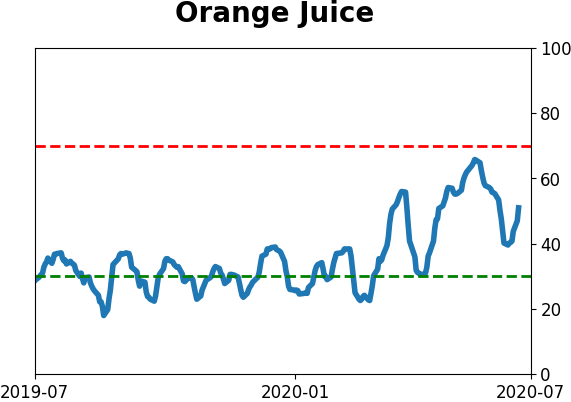
Commodity ETF's - 5-Day Moving Average
|
|