Headlines
|
|
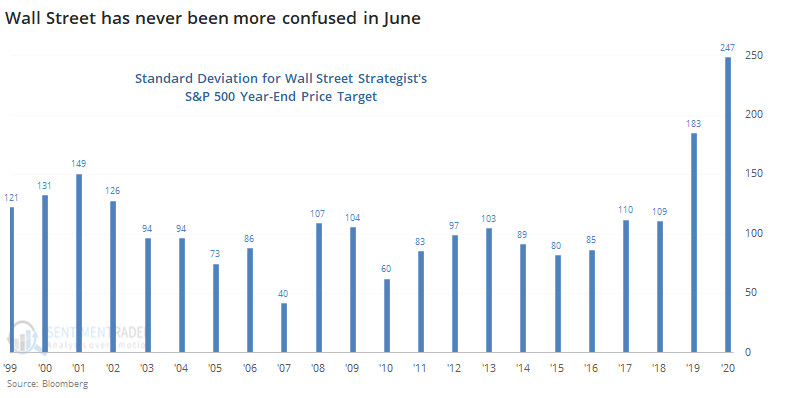
Wall Street has never been more confused:
Wall Street strategists have been slow to increase their year-end price targets for the S&P 500. Through the end of June, their current price target is tied for the lowest in 20 years. There is wide variability among the price targets, showing a lot of confusion. Overall, they're not giving the S&P much room to rally over the next 6 months, which has tended to be a good sign.
An overbought and volatile combination:
By the end of last week, the S&P 500 hit an overbought reading according to the popular stochastic technical indicator. This is unusual because volatility was still high, with the VIX above 30. The combination of a high stochastic and high VIX has preceded gains in stocks over the next 6-12 months.
The Dow's great quarter: The Dow Industrials finished Q2 with more than a 17% gain, the largest since 1998. Going back to 1896, the venerable index has gained more than 17% in 17 quarters. The next quarter, it added to gains 13 of the 17 times, with gradually less success during each subsequent quarter. By four quarters later, it was higher 8 times, lower 9 times. Most of the signals (12 of them) occurred prior to 1940, so only 5 of them have triggered recently. For those curious, those quarters were 1975-03-31, 1976-03-31, 1986-03-31, 1987-03-31, and 1998-12-31.
Bottom line: - Weight of the evidence has been suggesting flat/lower stock prices short- to medium-term, though that's turning more neutral as stocks pulled back over the past week; still suggesting higher prices long-term
- Indicators showed high and declining optimism, as Dumb Money Confidence was recently near 80% with isolated signs of reckless speculation, during what appears to be an unhealthy market environment
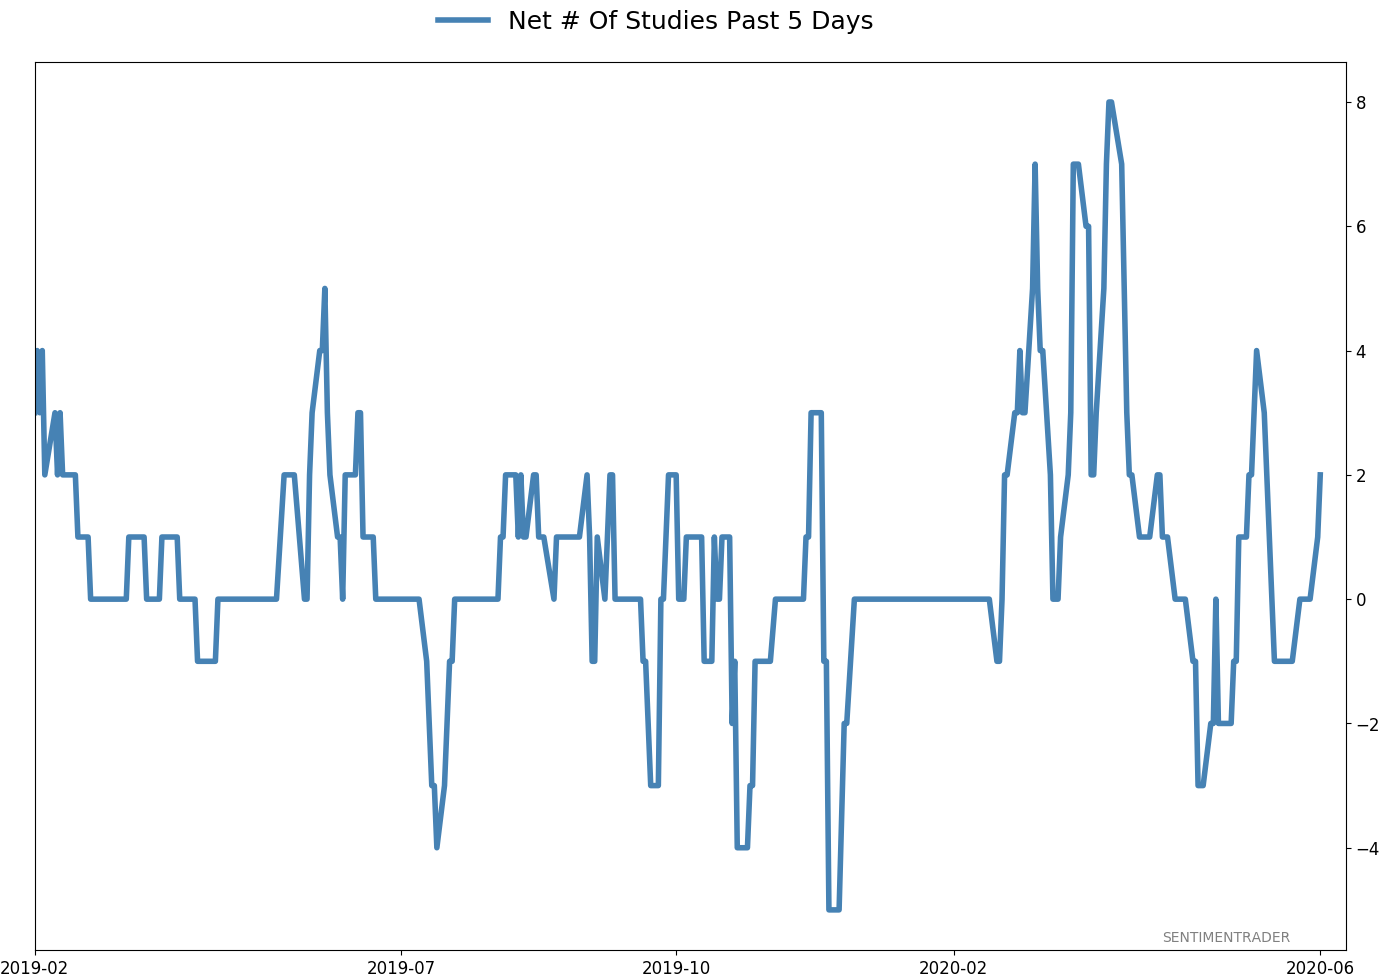
- Active Studies show a heavy positive skew over the medium- to long-term; breadth thrusts and recoveries have an almost unblemished record at preceding higher prices over a 6-12 month time frame
- Signs of extremely skewed preference for tech stocks nearing exhaustion, especially relative to industrials and financials (here and here)
- Indicators and studies for other markets are mixed with no strong conclusion
|
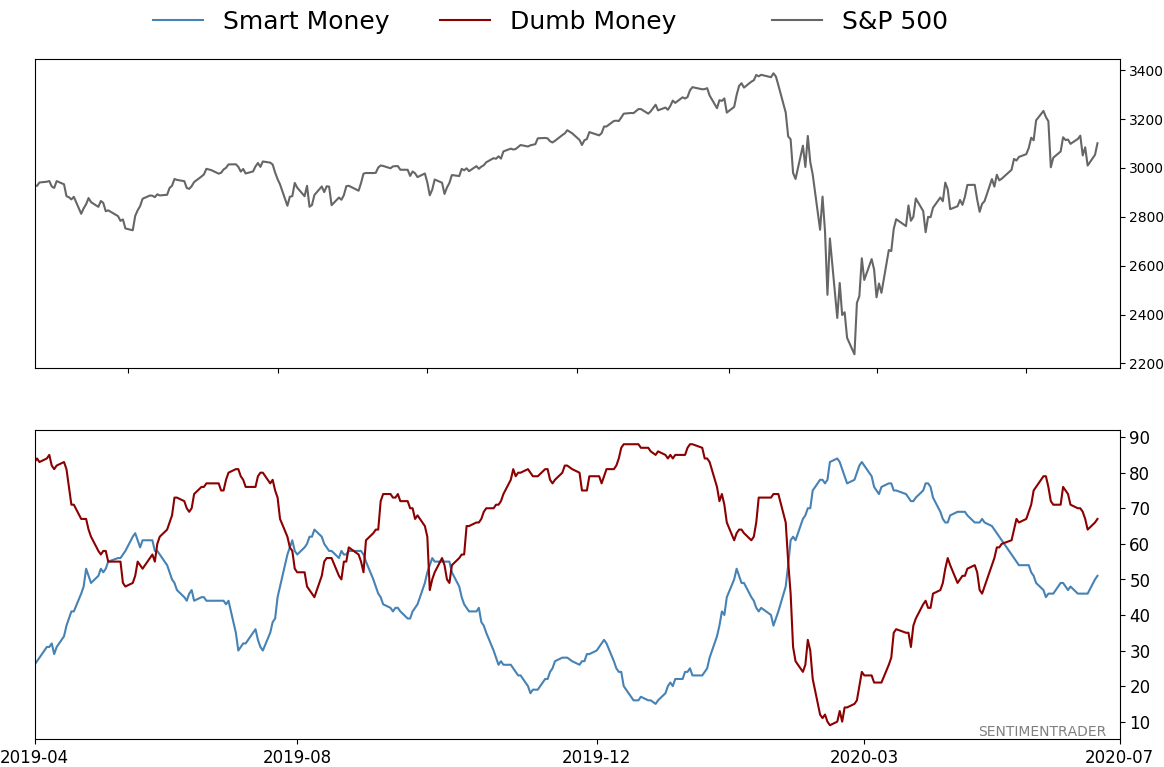
Smart / Dumb Money Confidence
|
Smart Money Confidence: 51%
Dumb Money Confidence: 67%
|
|
Risk Levels
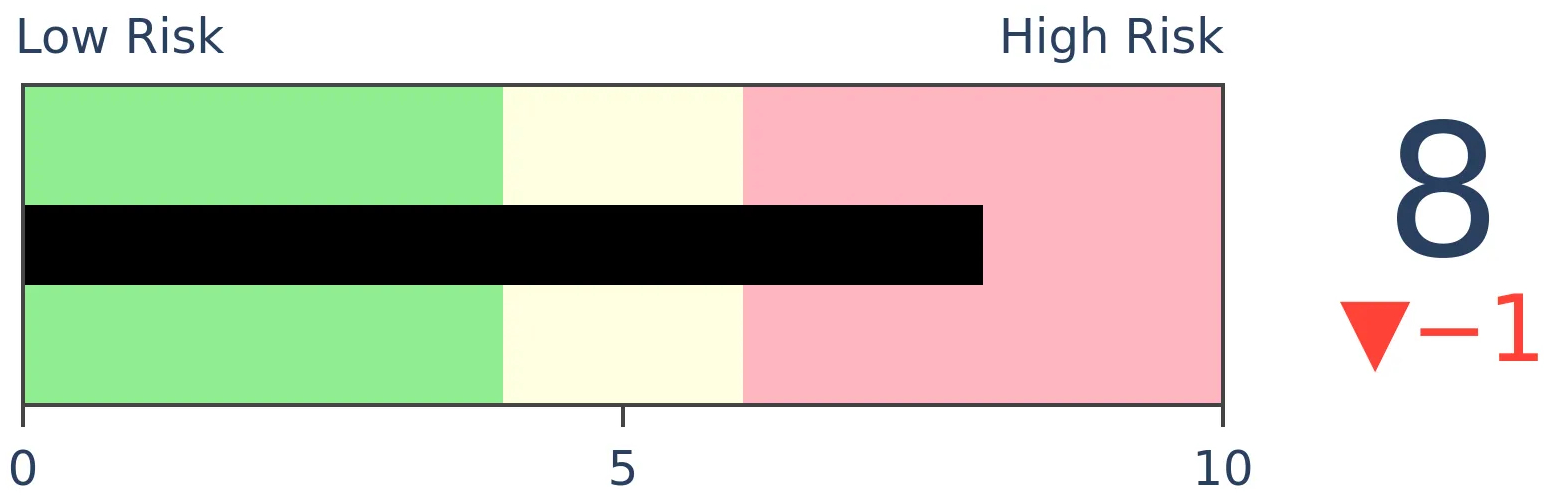
Stocks Short-Term
|
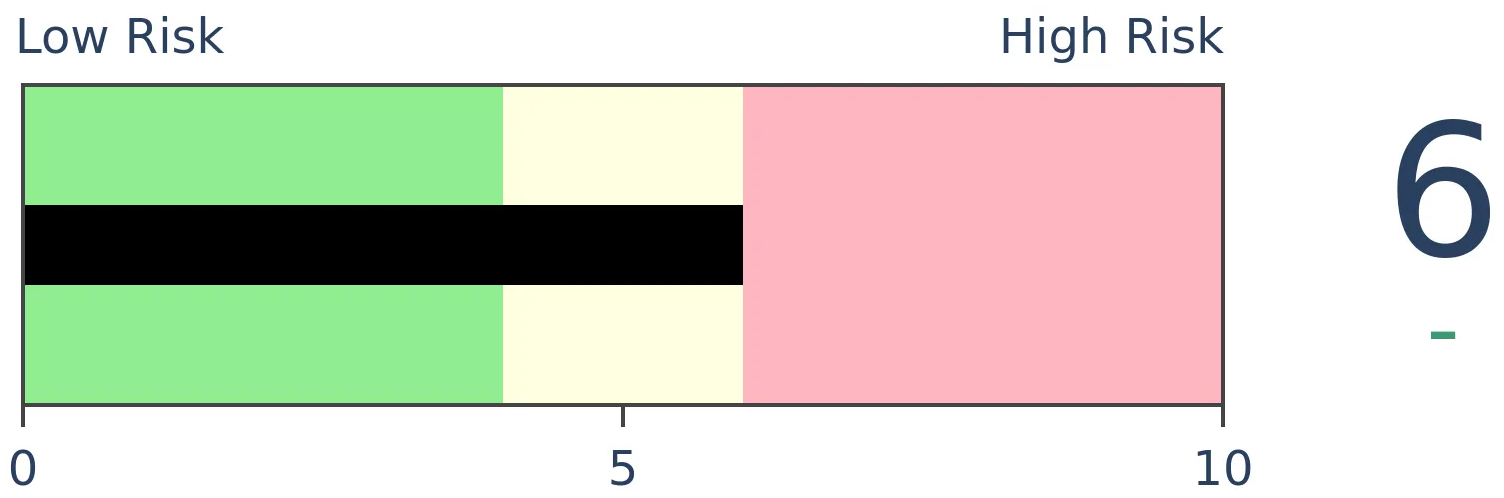
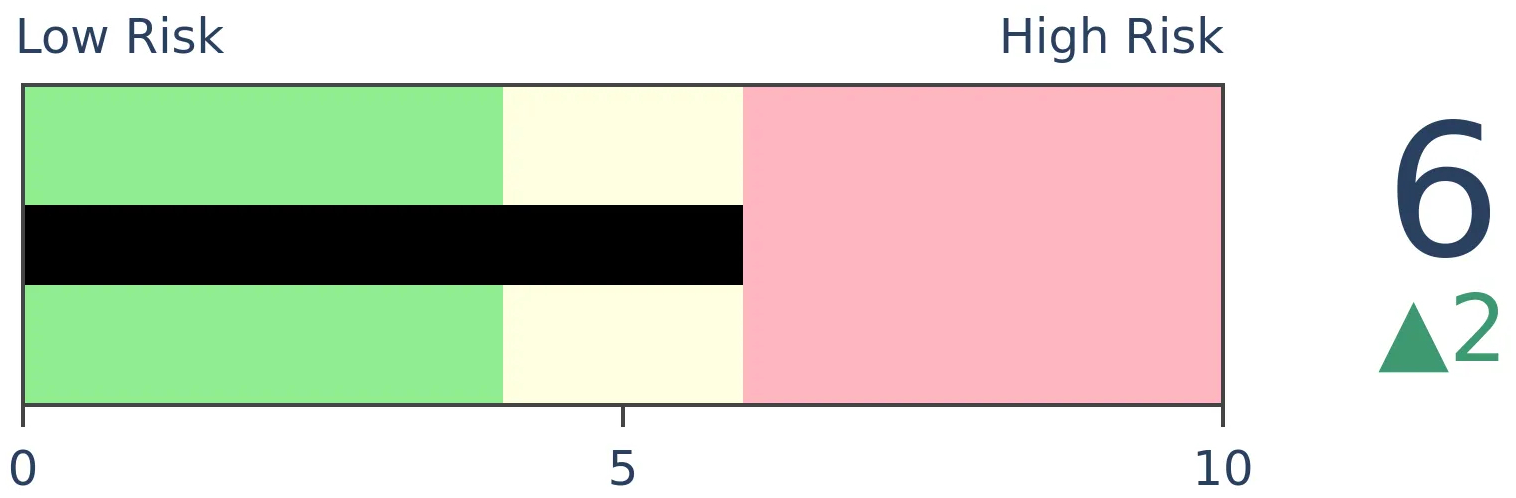
Stocks Medium-Term
|
|
Bonds

|
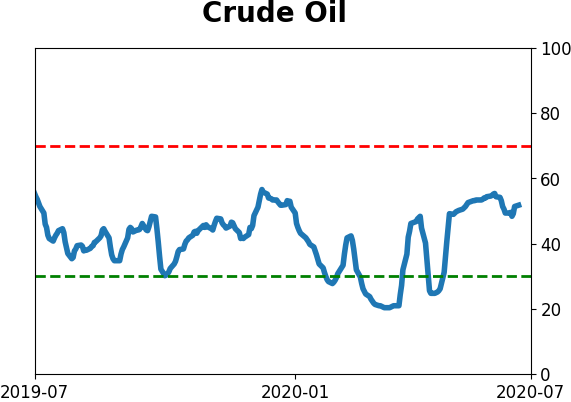
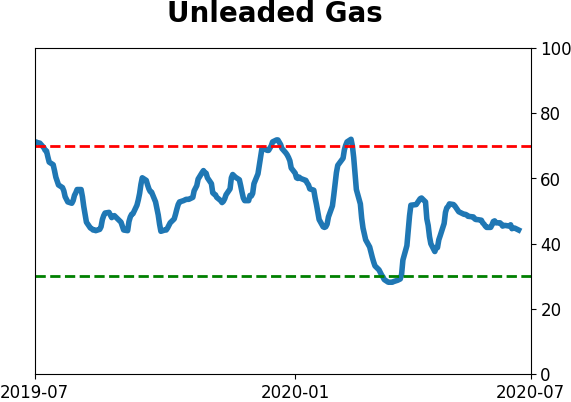
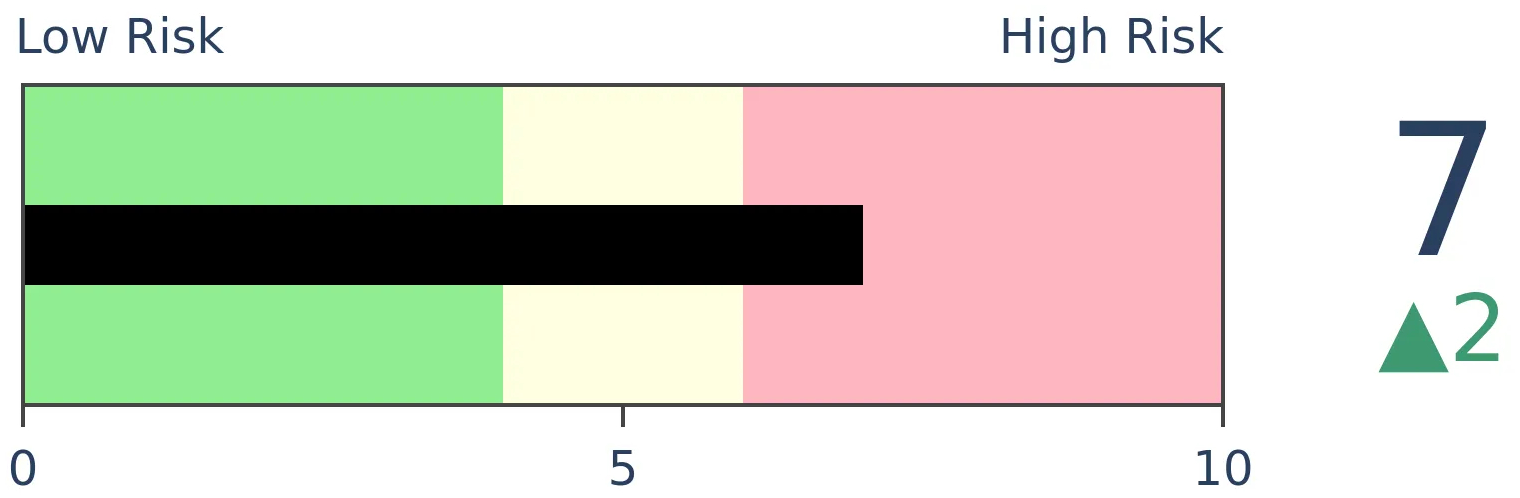
Crude Oil
|
|
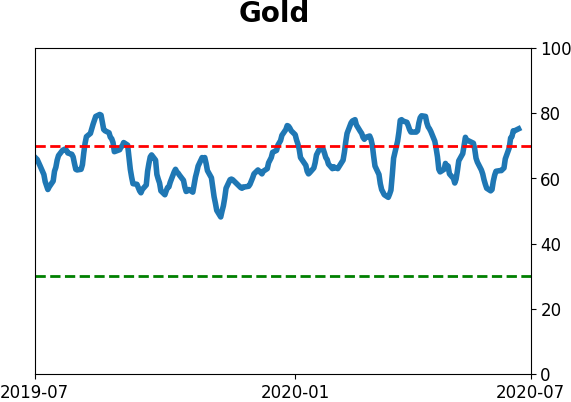
Gold
|
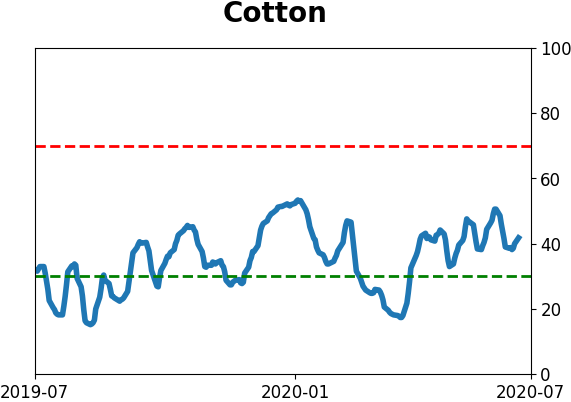
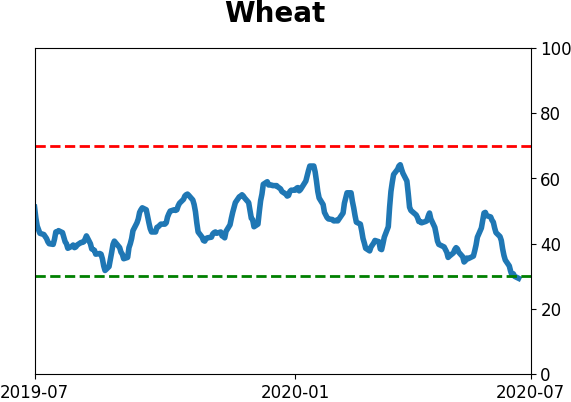
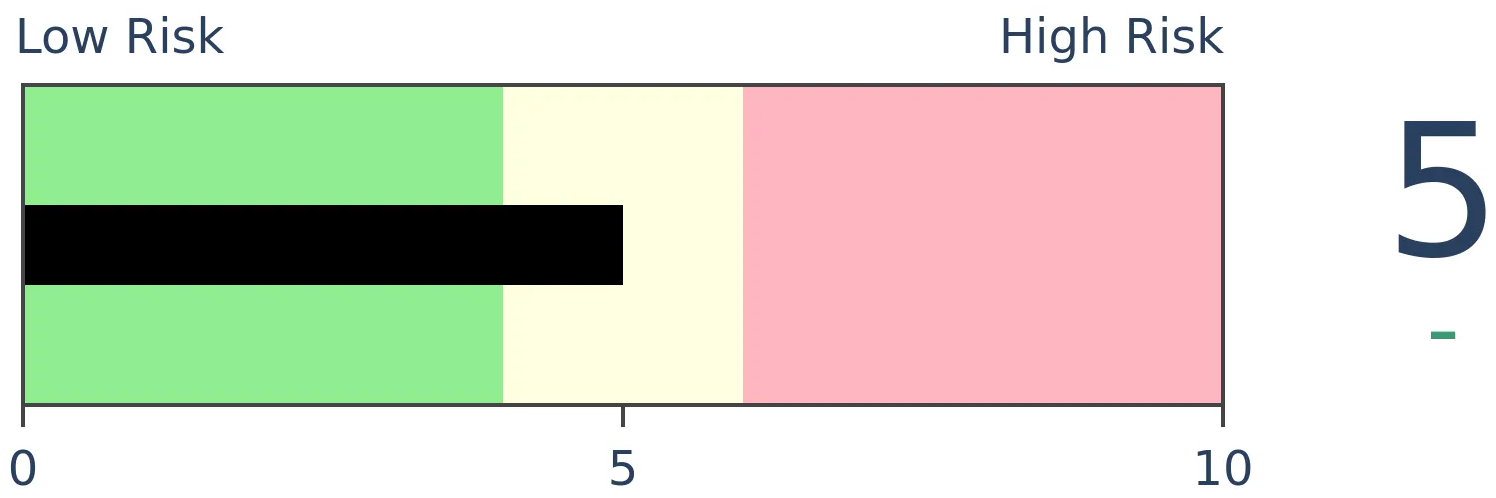
Agriculture
|
|
Research
BOTTOM LINE
Wall Street strategists have been slow to increase their year-end price targets for the S&P 500. Through the end of June, their current price target is tied for the lowest in 20 years. There is wide variability among the price targets, showing a lot of confusion. Overall, they're not giving the S&P much room to rally over the next 6 months, which has tended to be a good sign.
FORECAST / TIMEFRAME
SPY -- Up, Long-Term
|
Wall Street has never been more confused, or apprehensive. Even while analysts have been upgrading price targets from the bottom up, strategists have hesitated to raise their price targets from the top down.
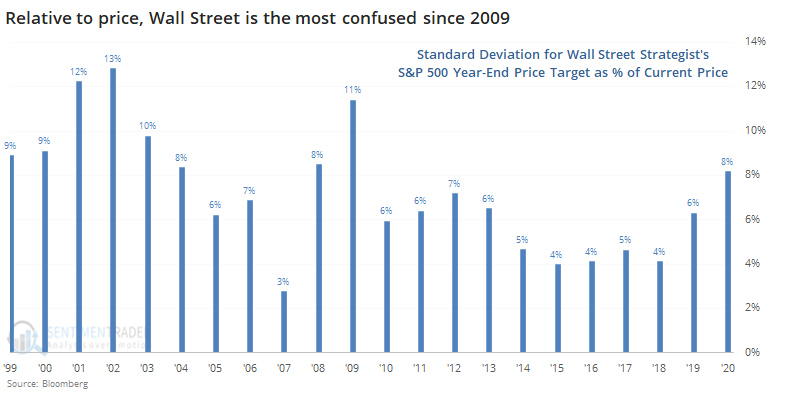
Bloomberg notes that there is a wide disparity in where strategists think the S&P 500 is going to end the year. Indeed there is - the standard deviation among year-end price targets at the end of June has never been wider, by a long shot.
That's somewhat misleading since it uses the raw price level, and the S&P has rallied significantly over the past 20 years. Expressed as a percentage of the S&P's price at the end of June, the standard deviation among year-end targets is still the highest since 2009.
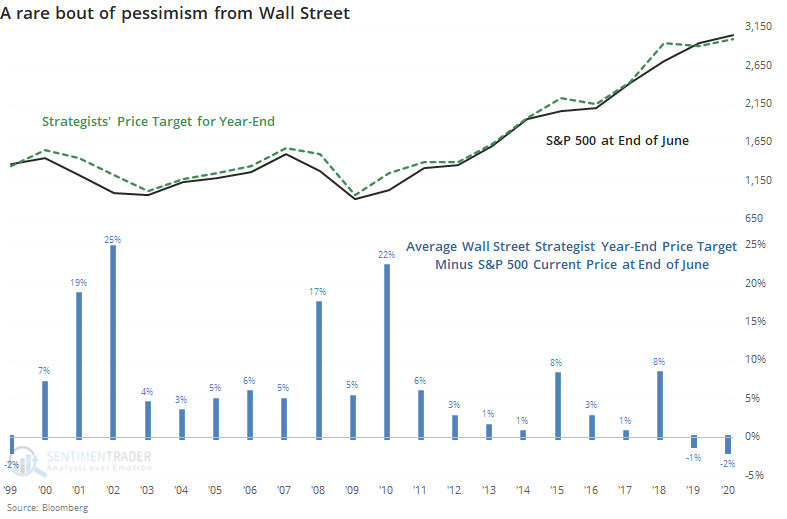
What's even more notable is that strategists aren't giving the S&P much room to rally. On average, they have a year-end target of 2998, about 2% below where the S&P is trading. That's tied for the lowest-ever year-end target relative to where the S&P was trading at the end of June.
Strategists by nature are optimists, so it's highly unusual to see them with such a low opinion of where the S&P should go over the next six months.
Below, we can see every year when strategists had the lowest year-end price forecast relative to where the S&P was trading at the end of June, and how the S&P fared in the months ahead.
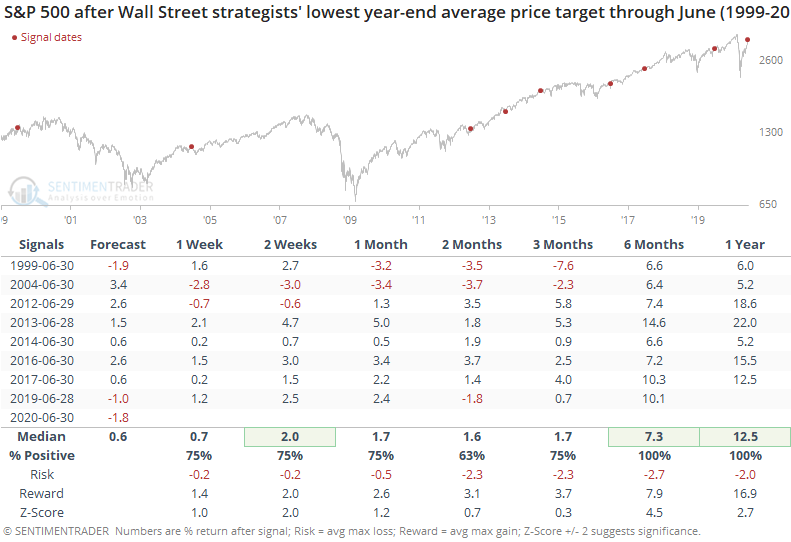
This was a good sign. While the medium-term was mixed-to-positive, the next 6-12 months were invariably bullish. The S&P returned an average of more than 7% over the next six months, roughly July through December. Every signal saw a return of at least 6.4% and was remarkably consistent, which is why the z-score is so high even with a small sample size.
When we contrast that to years when strategists were the most optimistic, there is a stark difference in returns.
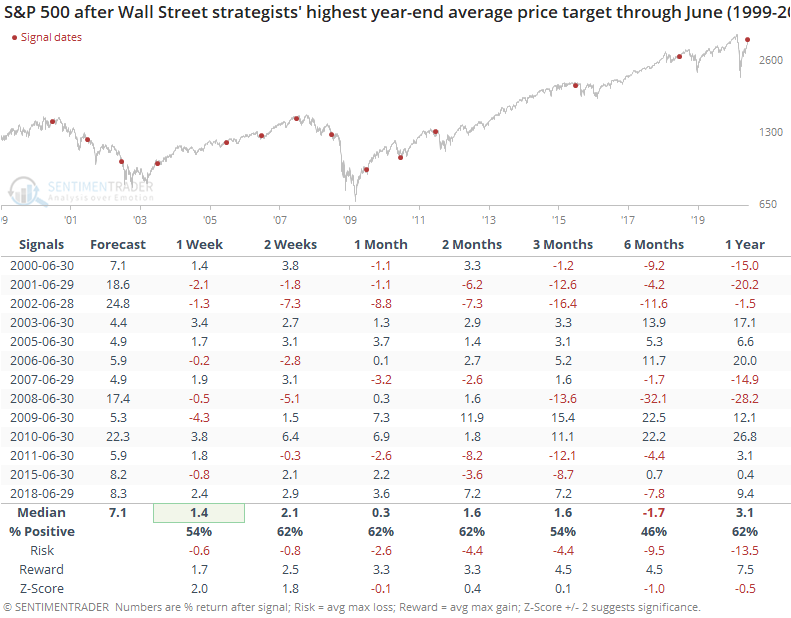
During those years, the S&P returned an average of -1.7% through year-end, with risk twice as high as reward.
Individually, these folks are invariably smart and well-educated. Like other surveys of smart money or big money populations, though, in aggregate we can sometimes see signs of group-think, and that tends to be a contrary indicator. That's the case here, too.
Even though there is a wide disparity among some of the year-end targets, the overall forecast is very low. And when strategists gave the S&P 500 the least credit this far into the year, it had a strong and consistent tendency to defy those expectations by rallying into year-end.
BOTTOM LINE
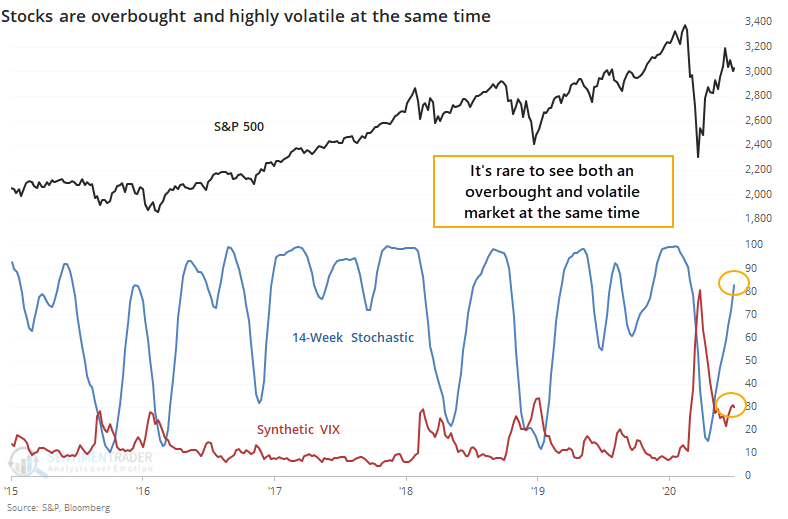
By the end of last week, the S&P 500 hit an overbought reading according to the popular stochastic technical indicator. This is unusual because volatility was still high, with the VIX above 30. The combination of a high stochastic and high VIX has preceded gains in stocks over the next 6-12 months.
FORECAST / TIMEFRAME
None
|
By the end of last week, the most benchmarked index in the world accomplished something it rarely does - it became overbought at the same time it was highly volatile.
Our good pal, and one of the most balanced strategists on Wall Street, Tony Dwyer from Canaccord Genuity noted to clients that when the 14-week stochastic indicator became overbought at the same time that the VIX was above 30, then it preceded positive returns over the next 6-12 months.
The reason this is unusual is that when an oscillator like the stochastic becomes overbought, it usually happens during calm markets, so the VIX tends to be low. If the VIX is high, then stocks have been volatile (almost always to the downside), so the stochastic is usually low.
Using the same process for creating a synthetic VIX index that we've used in the past, we can go back to 1962 and look for other times this might have happened. Like Tony mentioned, it has been a very good longer-term sign for stocks.
The table below shows times when a combination of the stochastic and VIX was above 120. The stochastic can't go above 100, so it means the VIX must be at least above 20. Usually, there was some combination of them both being relatively high.
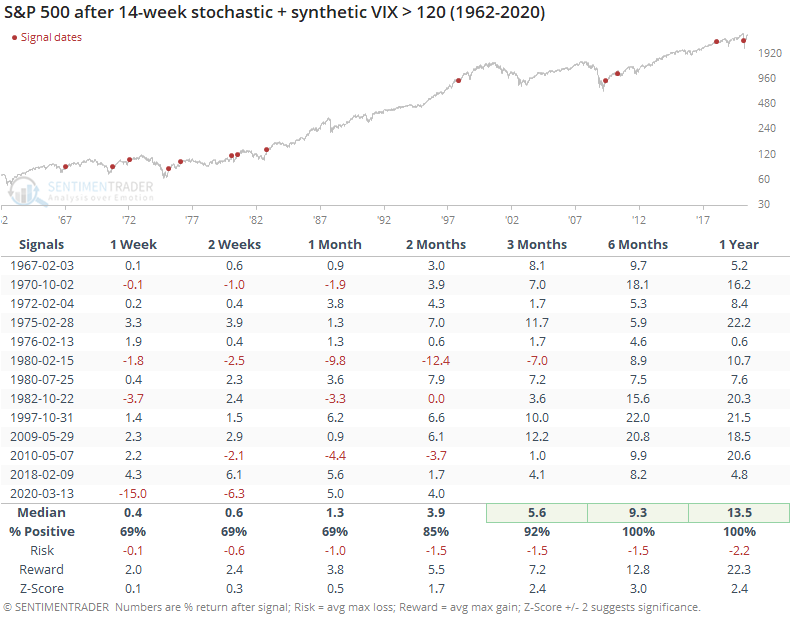
This typically triggered when stocks went through a severe, or at least fearful, decline, then jumped far and long enough for the stochastic to hit 80. While that preceded some shorter-term bumps a few times, the S&P was higher over the next 6-12 months every time.
The signal in March of this year is unusual because it was mostly due to the VIX being extremely high and the stochastic not being oversold yet. Maybe that will lessen the impact of the signal, which is the only reason we're not including this in the Active Studies.
Active Studies
| Time Frame | Bullish | Bearish | | Short-Term | 0 | 0 | | Medium-Term | 8 | 6 | | Long-Term | 42 | 1 |
|
Indicators at Extremes
Portfolio
| Position | Weight % | Added / Reduced | Date | | Stocks | 29.8 | Reduced 9.1% | 2020-06-11 | | Bonds | 0.0 | Reduced 6.7% | 2020-02-28 | | Commodities | 5.2 | Added 2.4%
| 2020-02-28 | | Precious Metals | 0.0 | Reduced 3.6% | 2020-02-28 | | Special Situations | 0.0 | Reduced 31.9% | 2020-03-17 | | Cash | 65.0 | | |
|
Updates (Changes made today are underlined)
In the first months of the year, we saw manic trading activity. From big jumps in specific stocks to historic highs in retail trading activity to record highs in household confidence to almost unbelievable confidence among options traders. All of that came amid a market where the average stock couldn't keep up with their indexes. There were signs of waning momentum in stocks underlying the major averages, which started triggering technical warning signs in late January. After stocks bottomed on the 23rd, they enjoyed a historic buying thrust and retraced a larger amount of the decline than "just a bear market rally" tends to. Those thrusts are the most encouraging sign we've seen in years. Through early June, we were still seeing thrusts that have led to recoveries in longer-term breadth metrics. The longer-term prospects for stocks (6-12 months) still look decent given the above. On a short- to medium-term basis, it was getting harder to make that case. Dumb Money Confidence spiked and there were multiple signs of a historic level of speculation. This is likely the lowest I will go given what I still consider to be compelling positives over a longer time frame. There is not a slam-dunk case to be made for either direction, so it will seem like a mistake whether stocks keep dropping (why didn't I sell more?) or if they turn and head higher (why did I let short-term concerns prevail?). After nearly three decades of trading, I've learned to let go of the idea of perfection.
RETURN YTD: -5.8% 2019: 12.6%, 2018: 0.6%, 2017: 3.8%, 2016: 17.1%, 2015: 9.2%, 2014: 14.5%, 2013: 2.2%, 2012: 10.8%, 2011: 16.5%, 2010: 15.3%, 2009: 23.9%, 2008: 16.2%, 2007: 7.8%
|
|
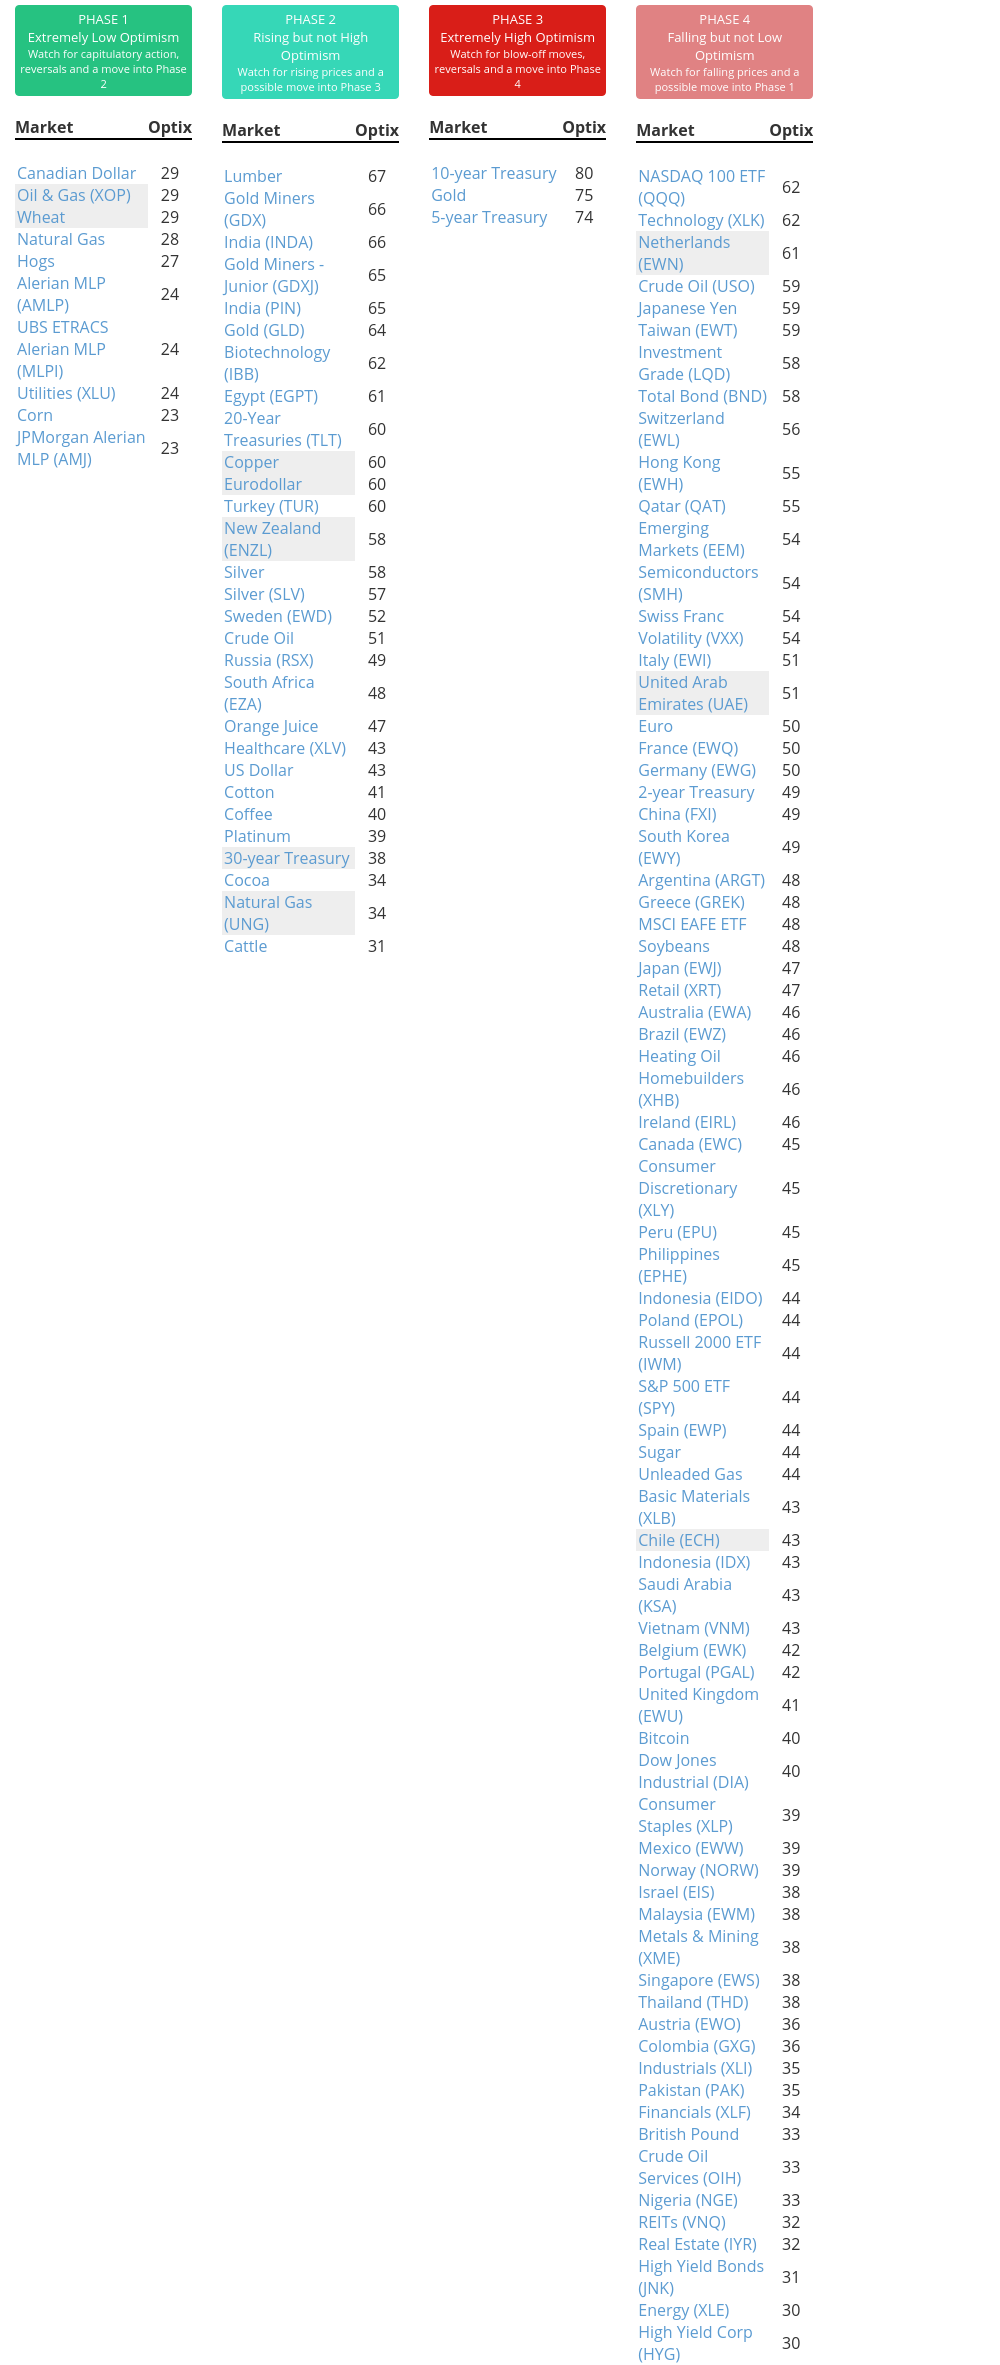
Phase Table
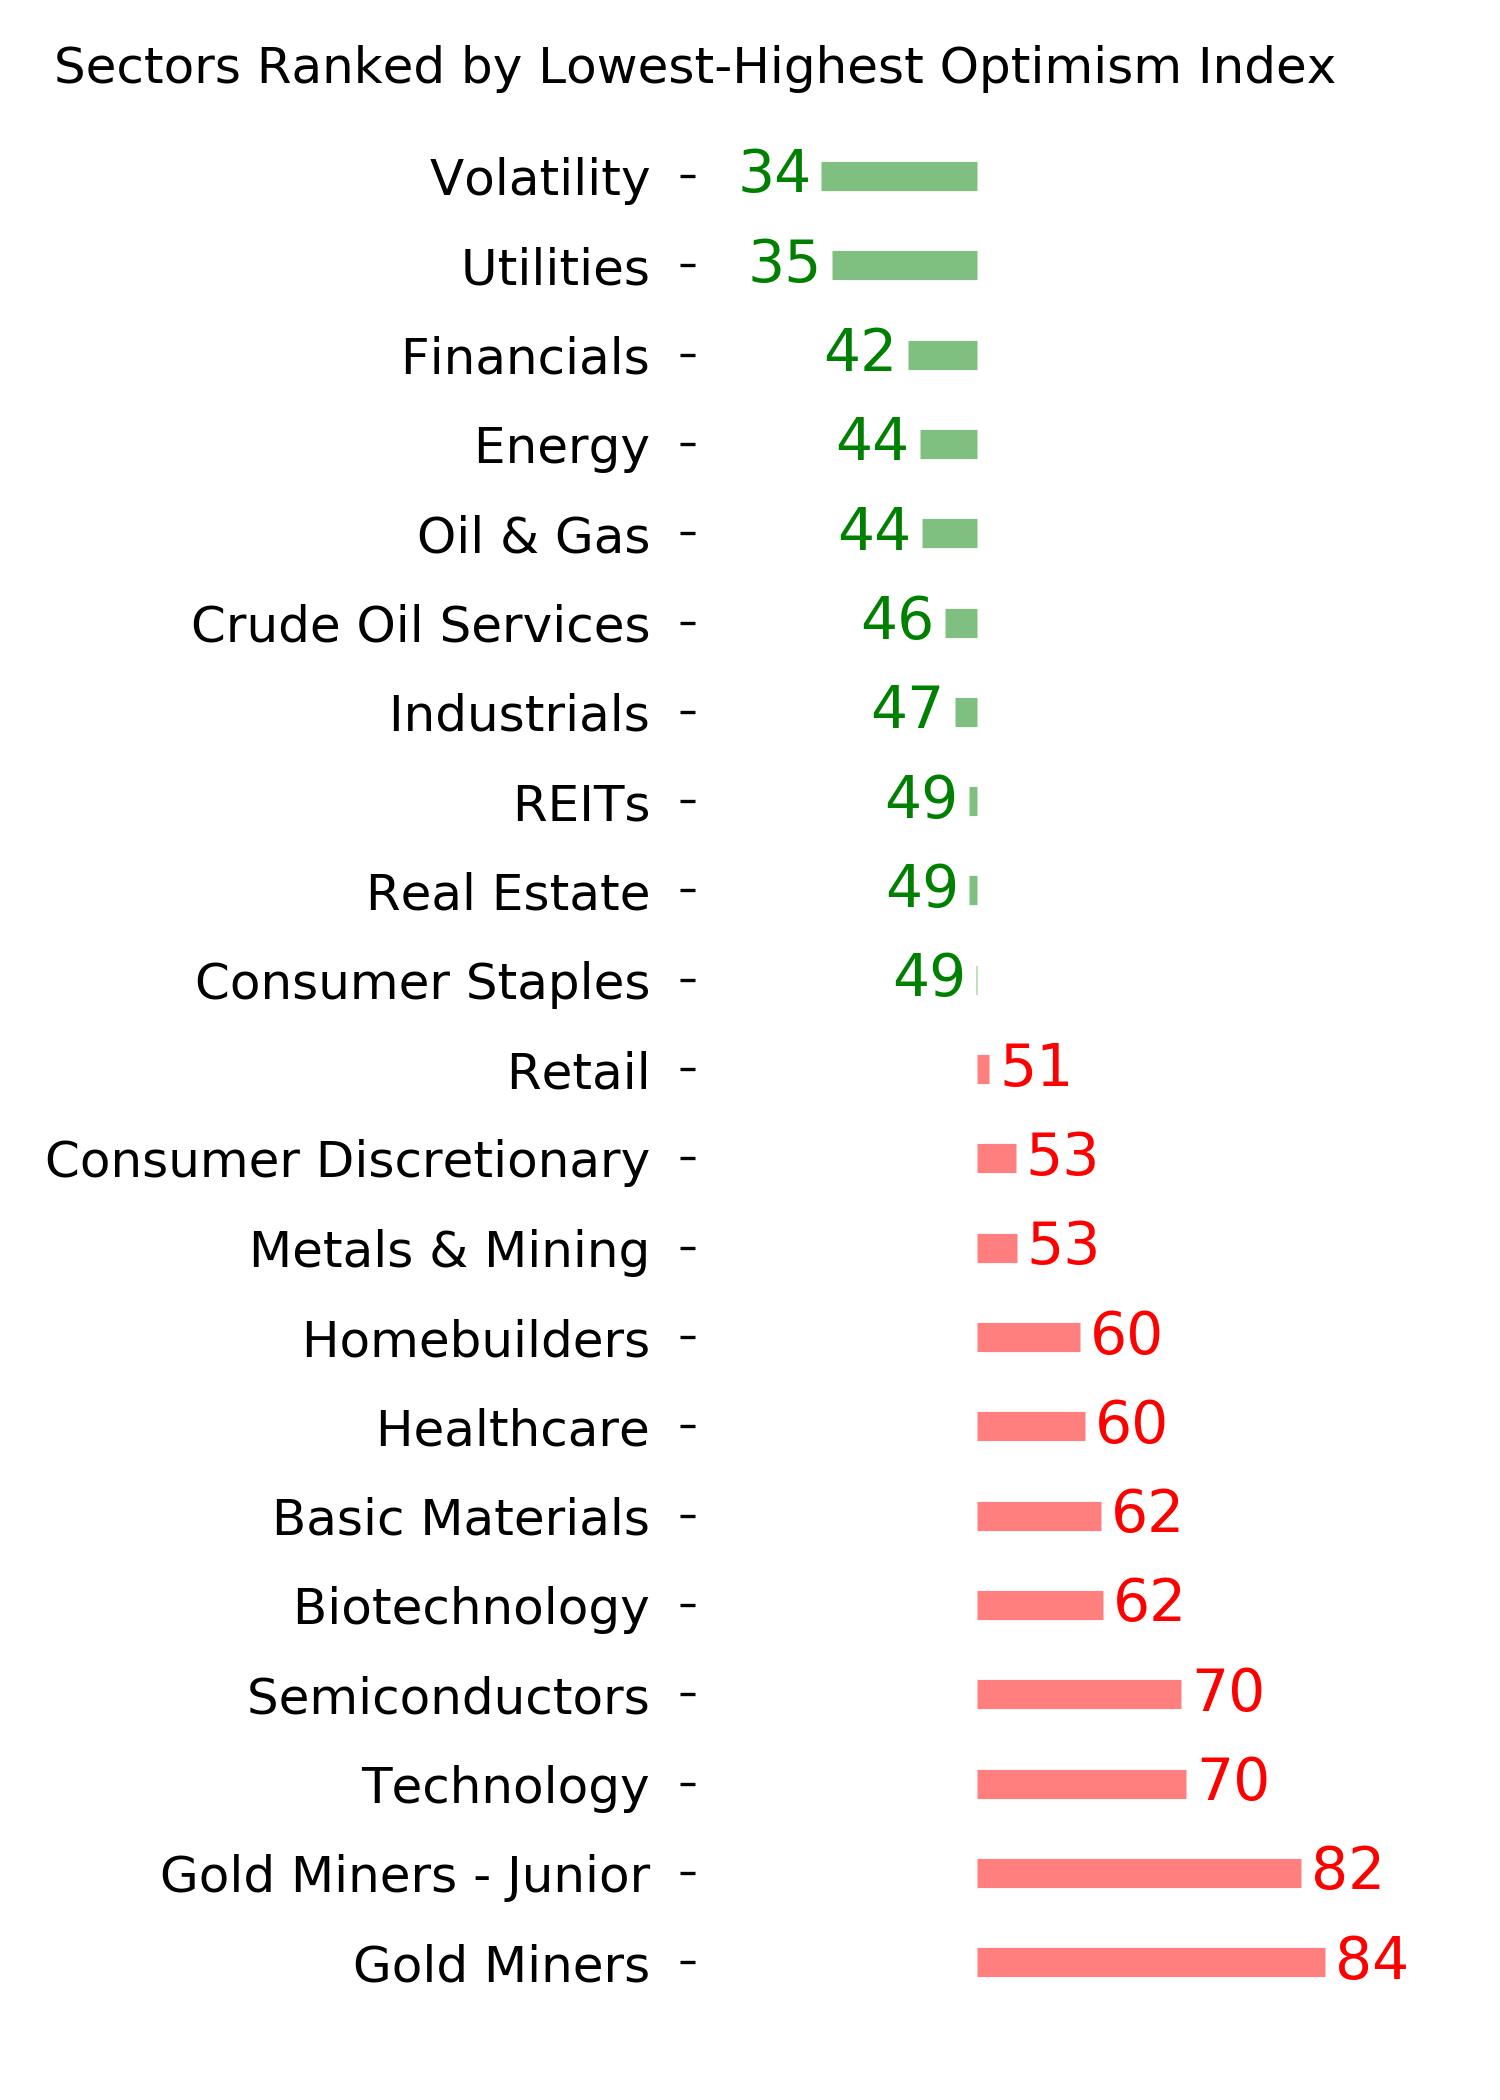
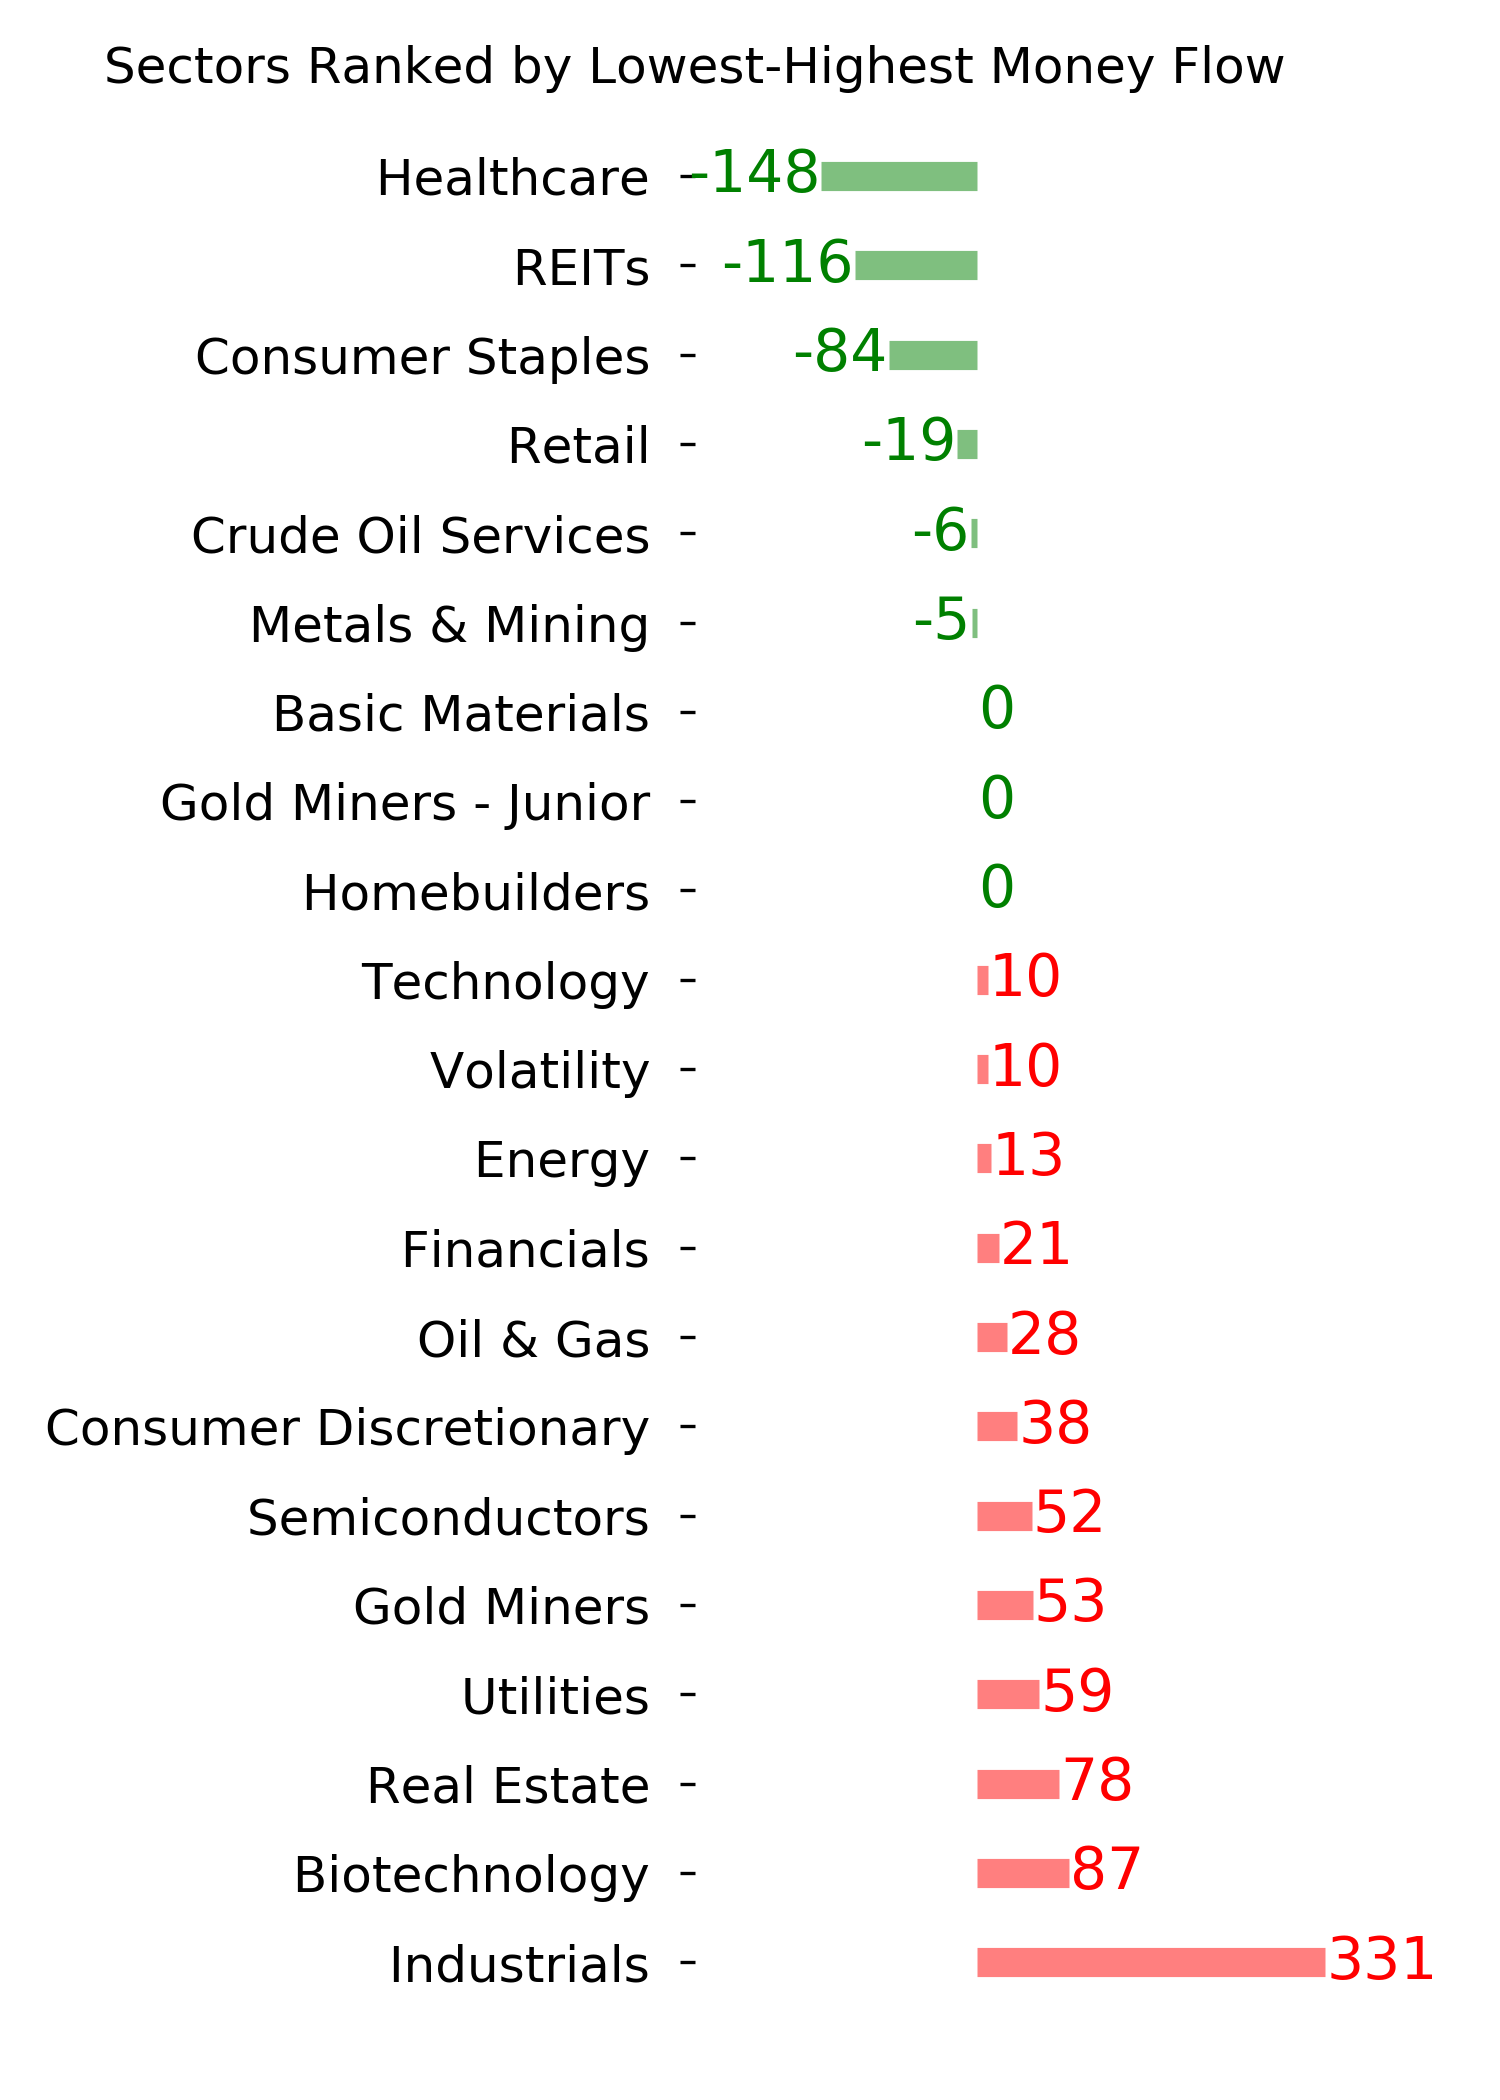
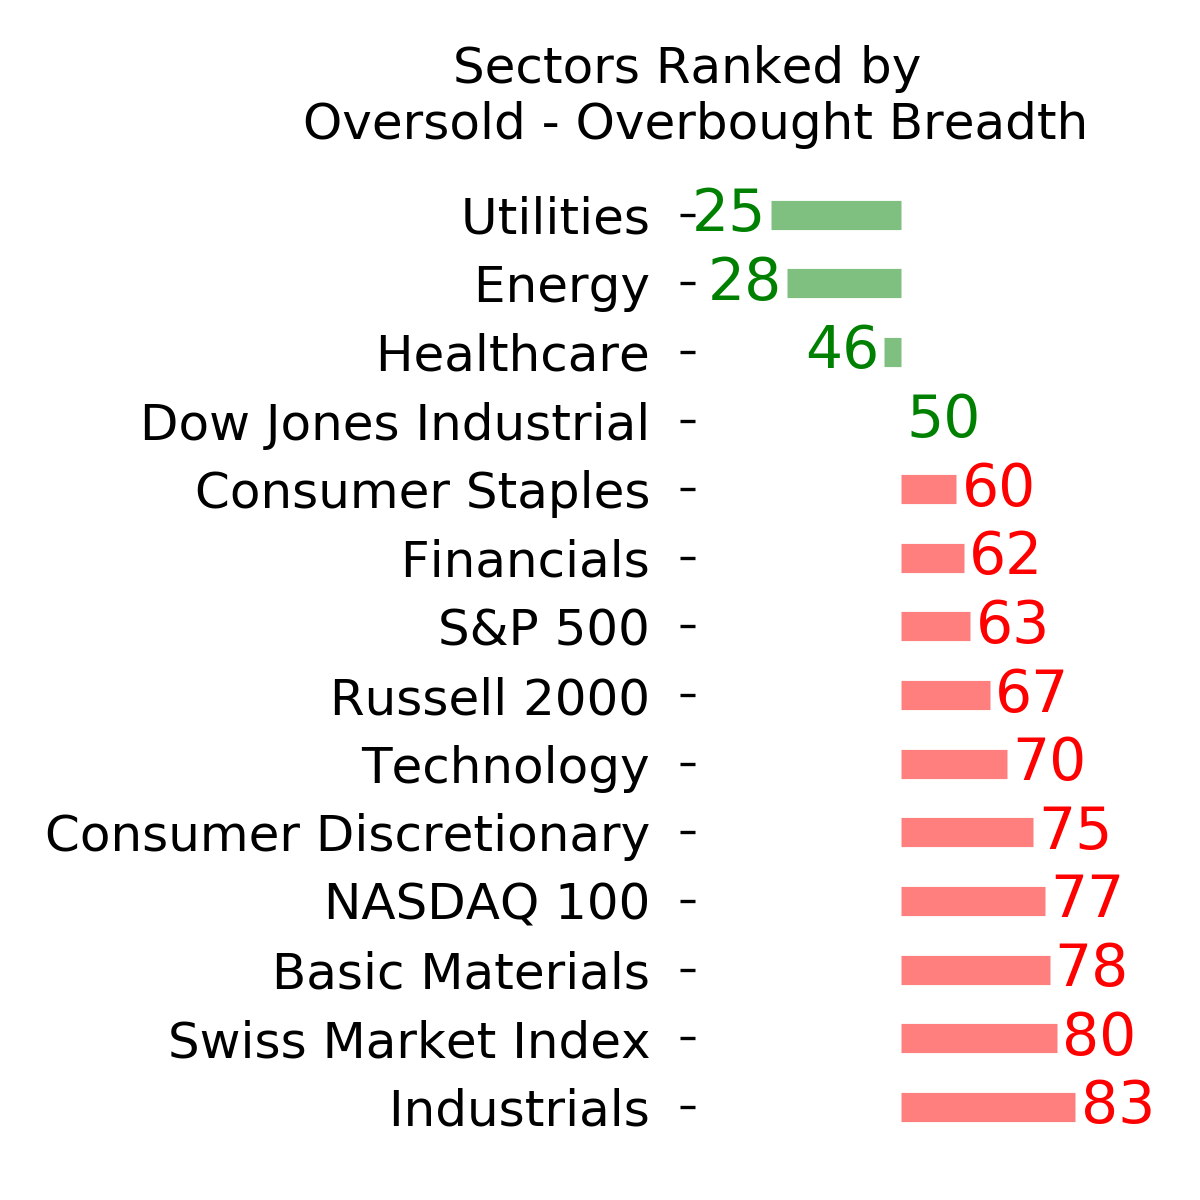
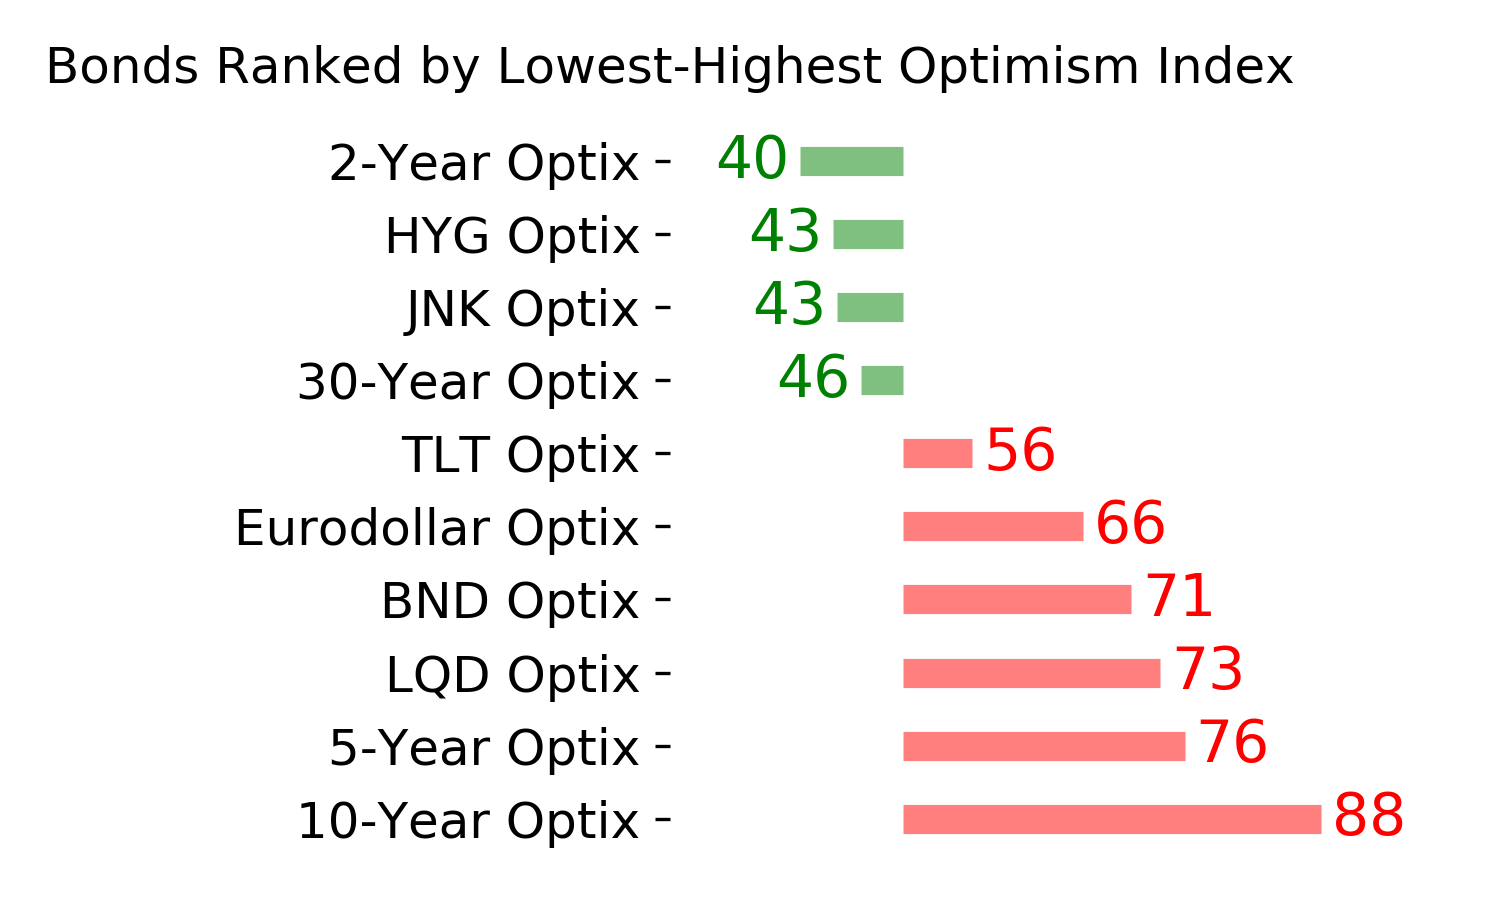
Ranks
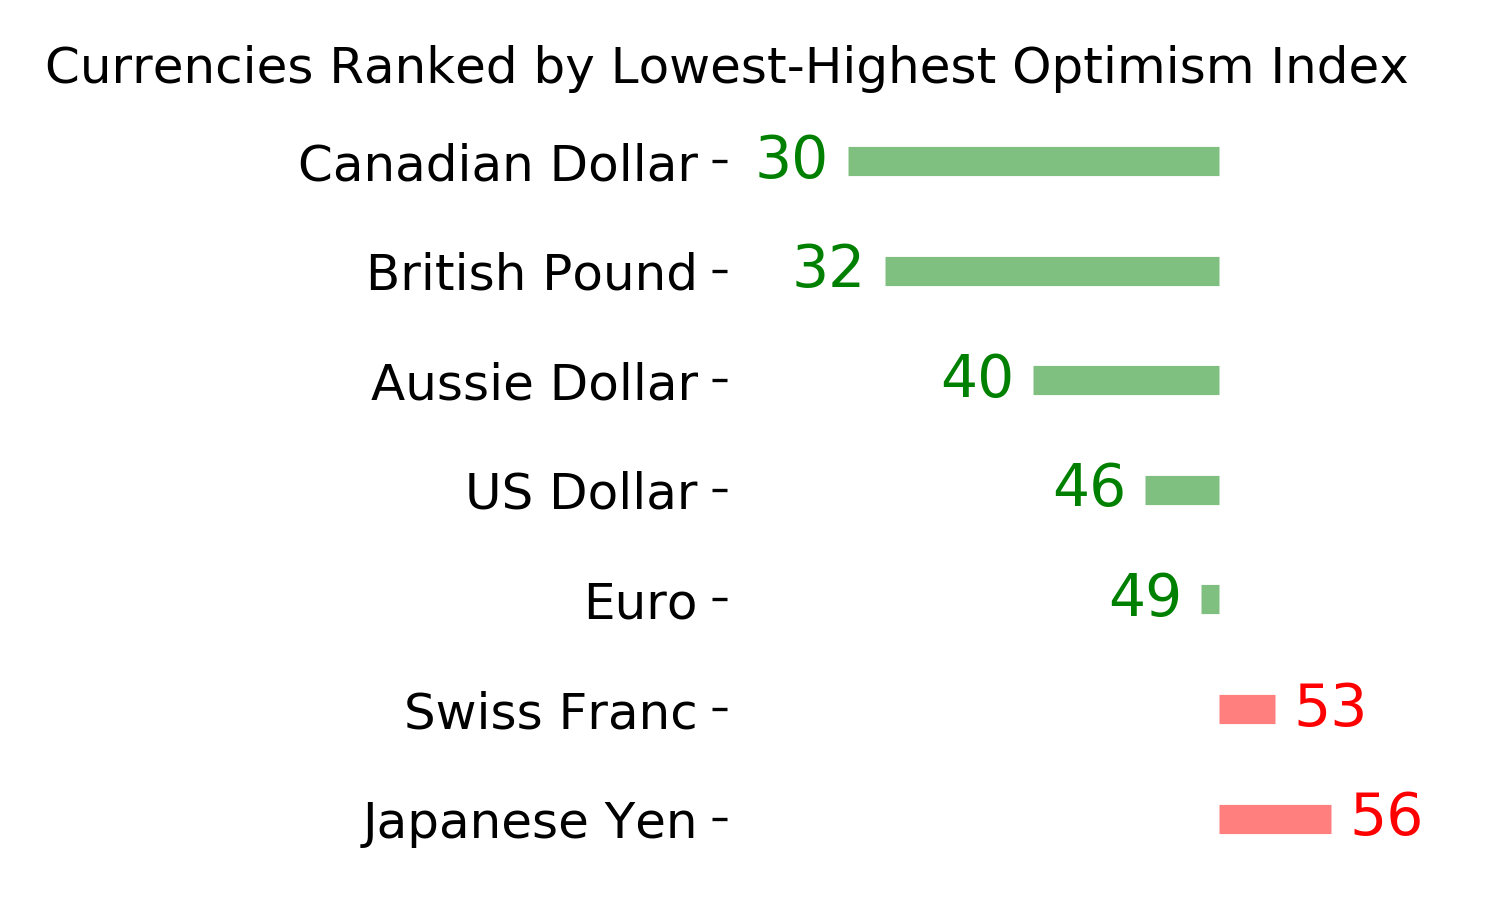
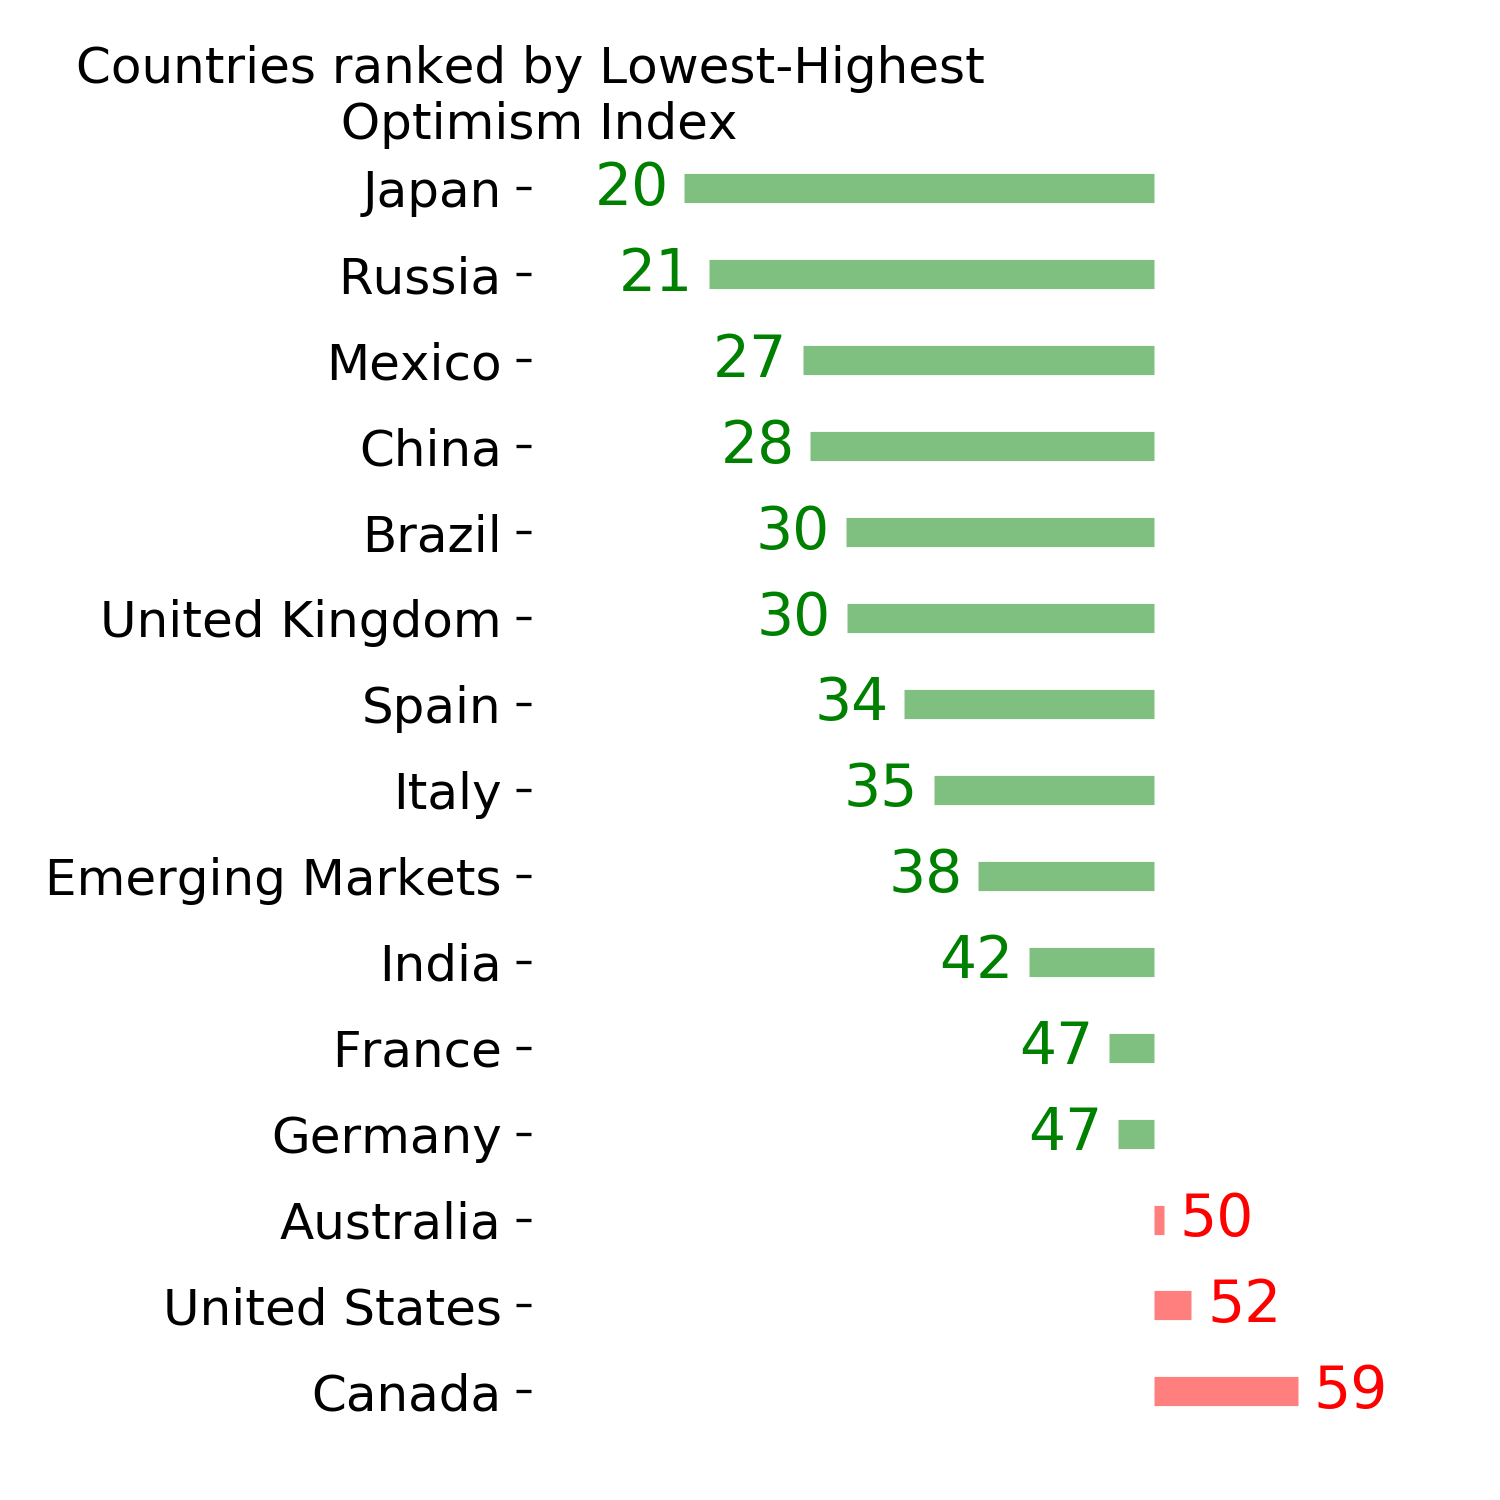
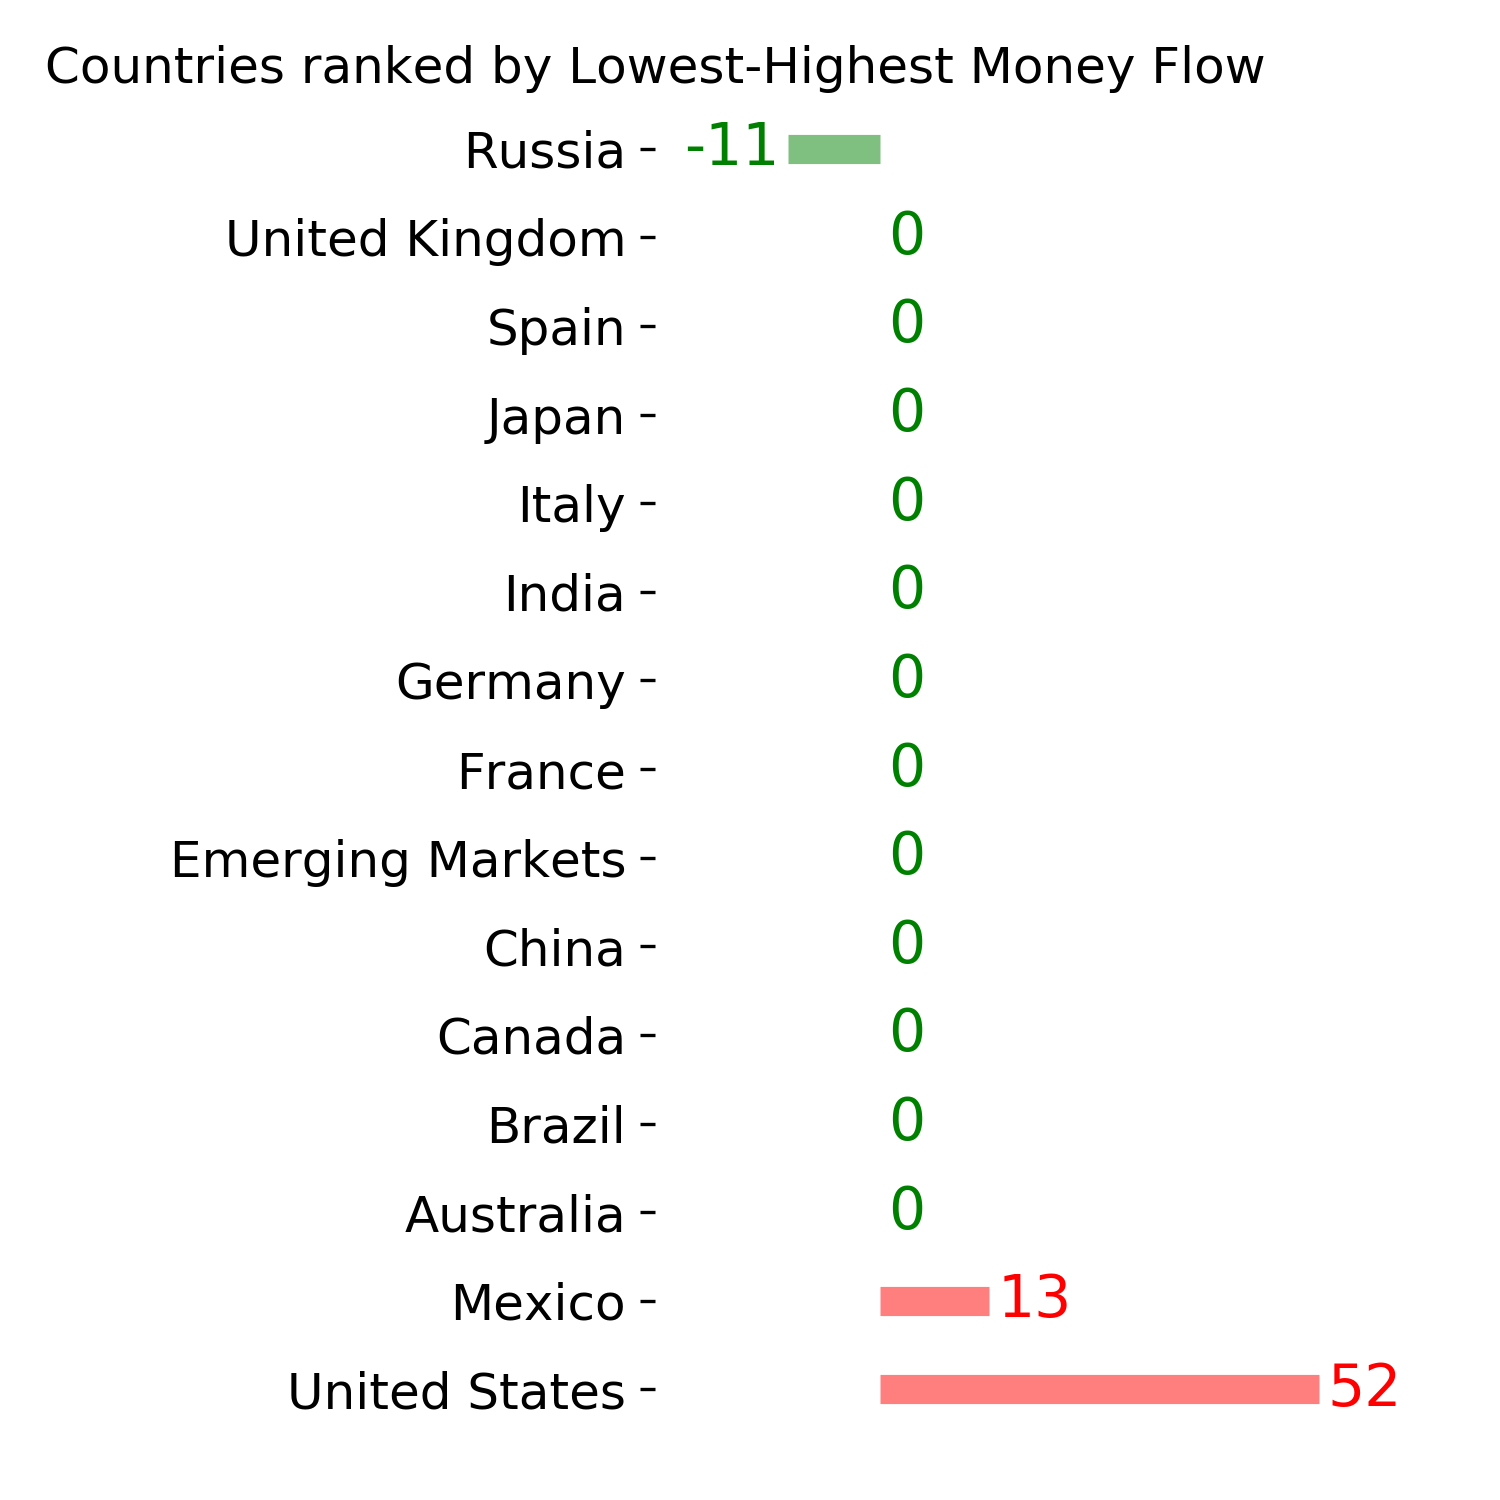
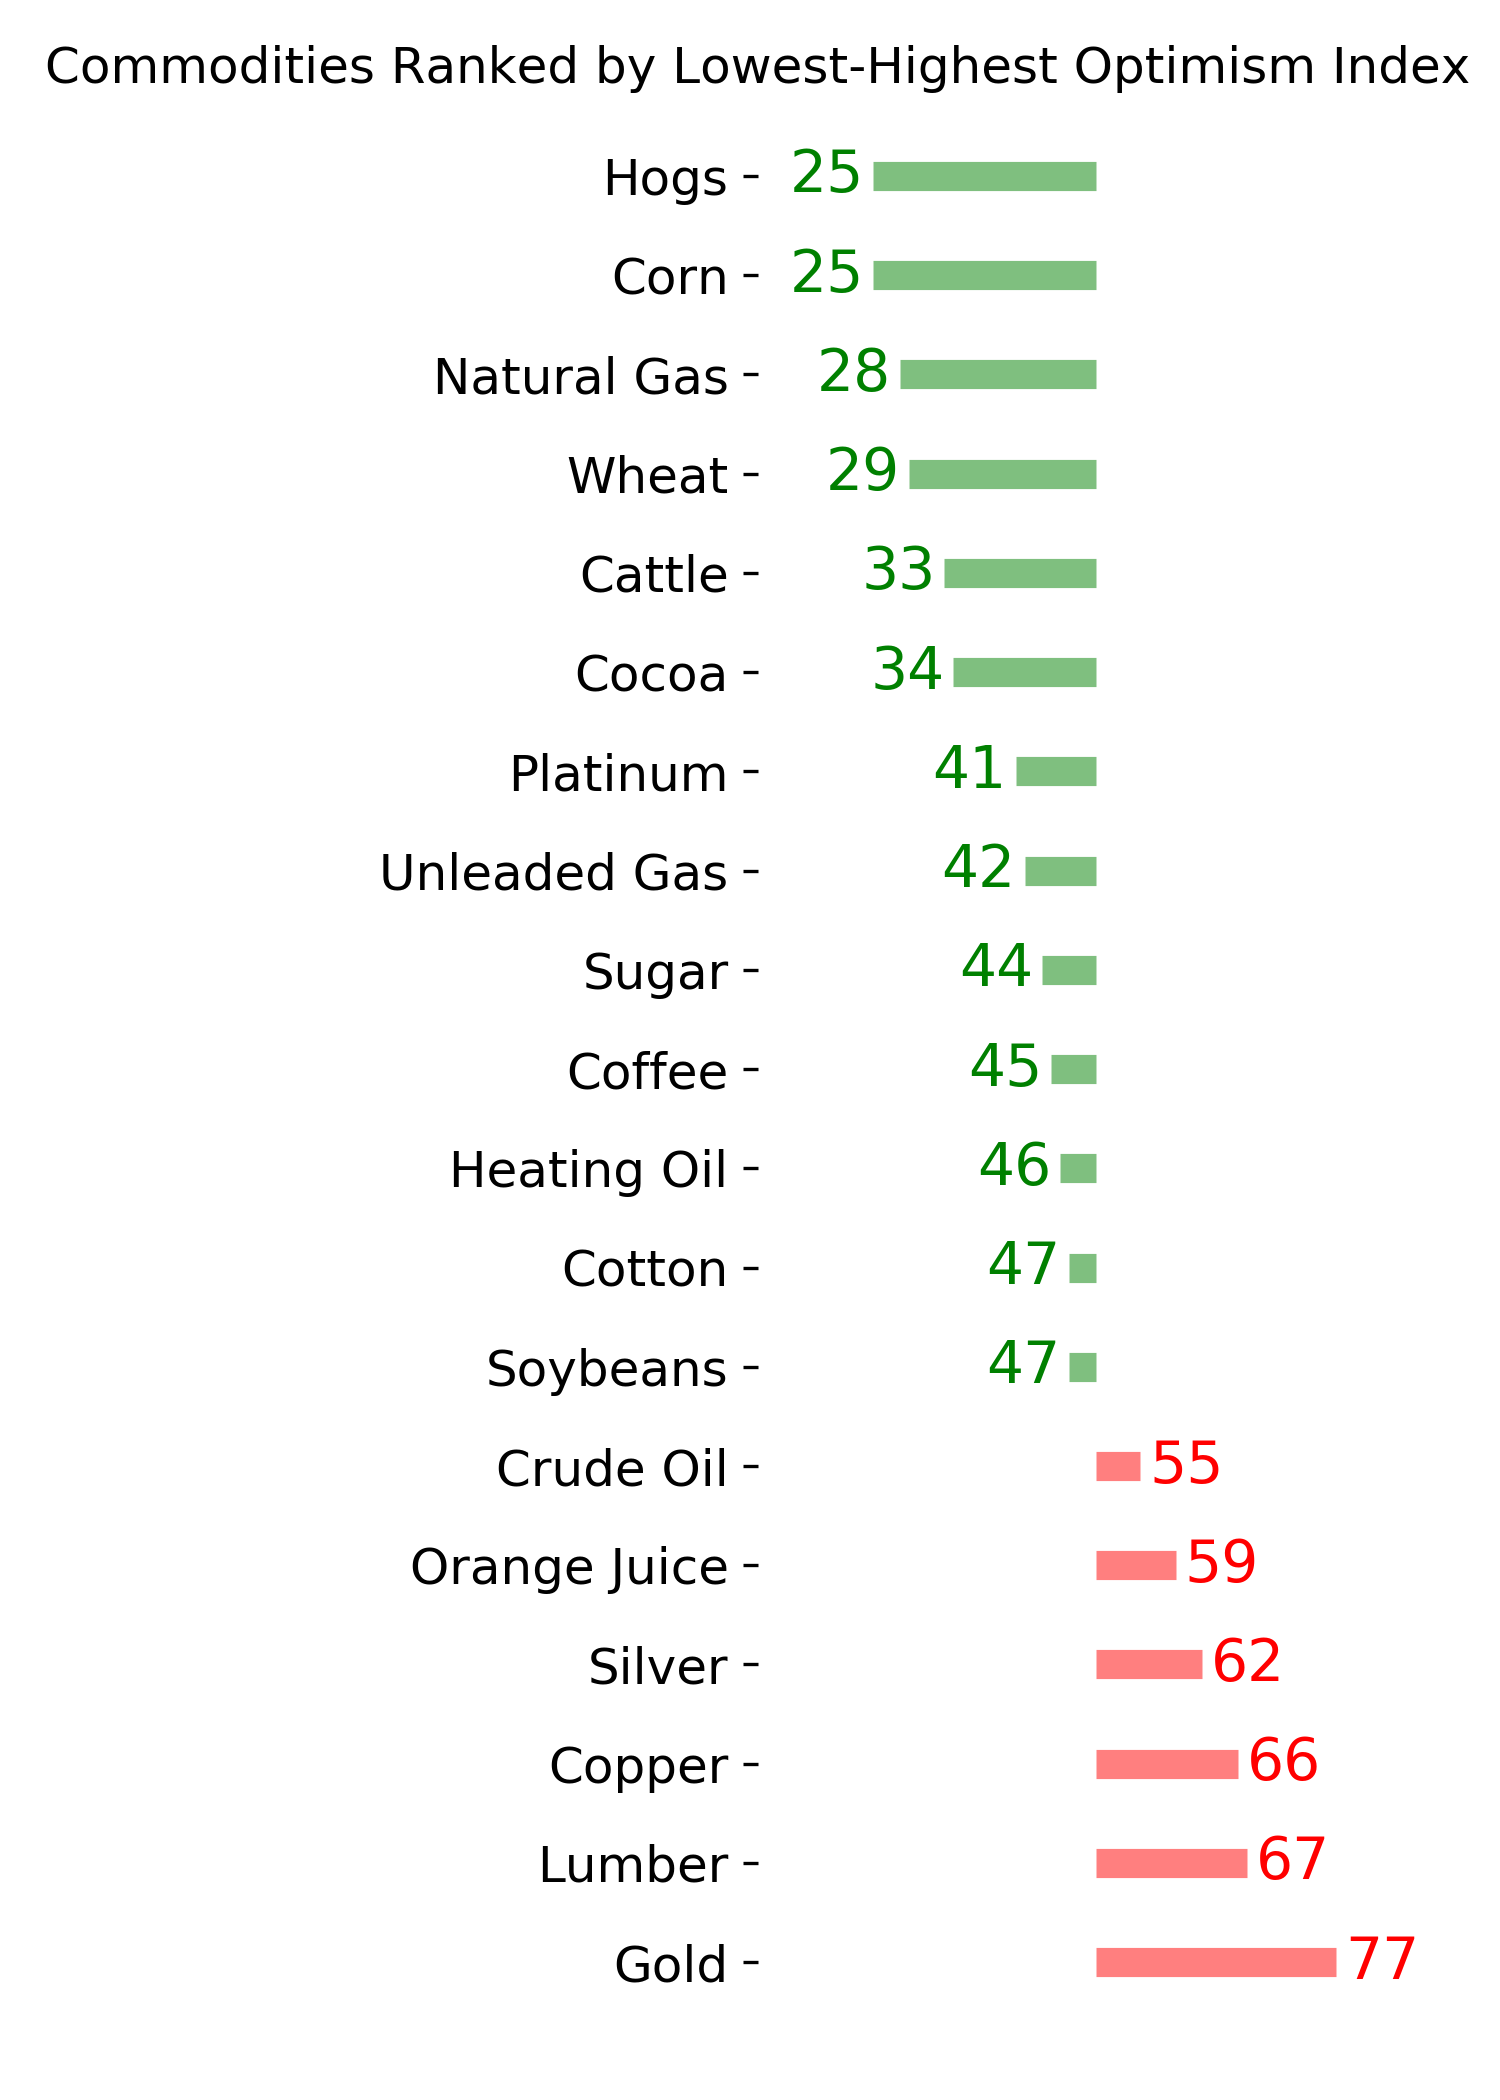
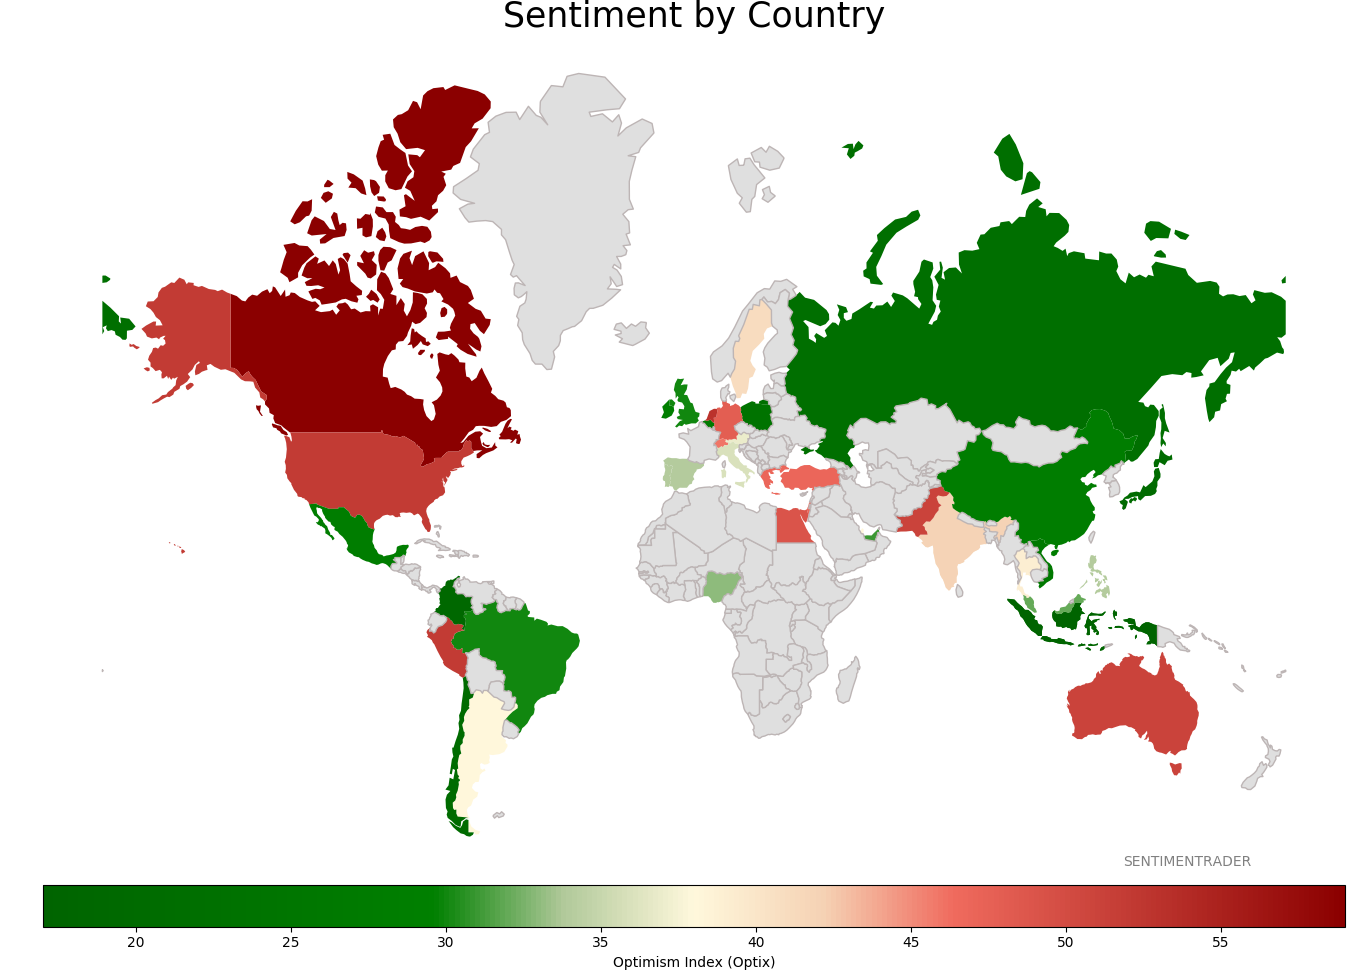
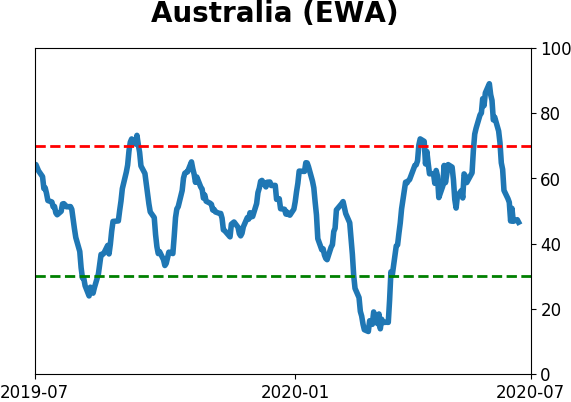
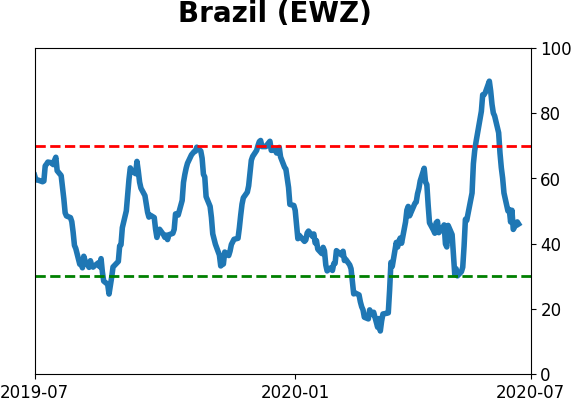
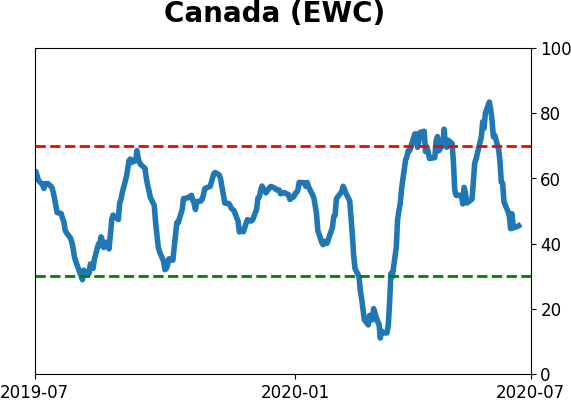
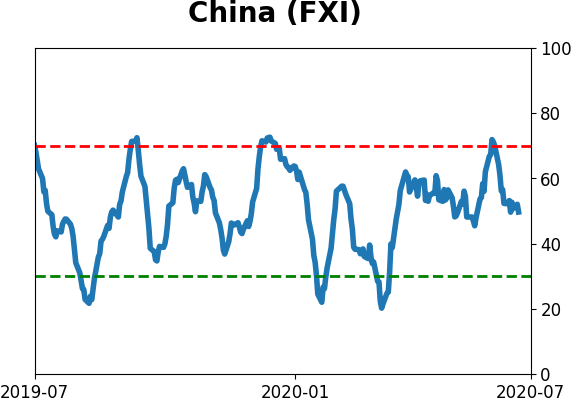
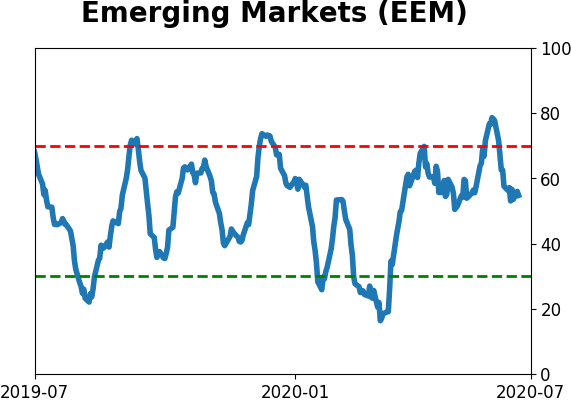
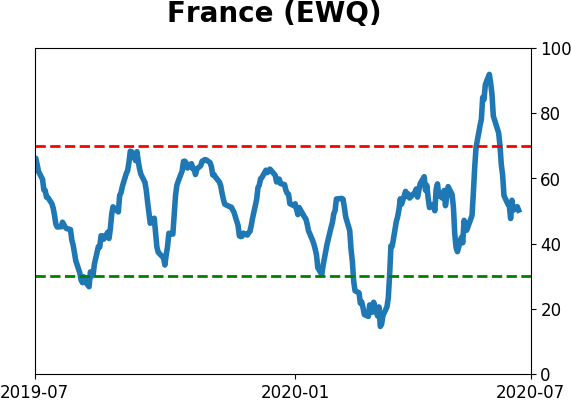
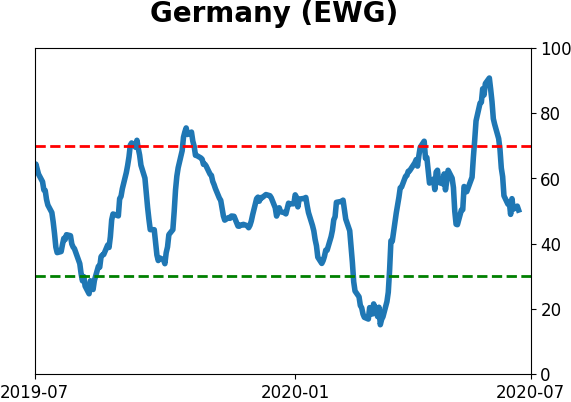
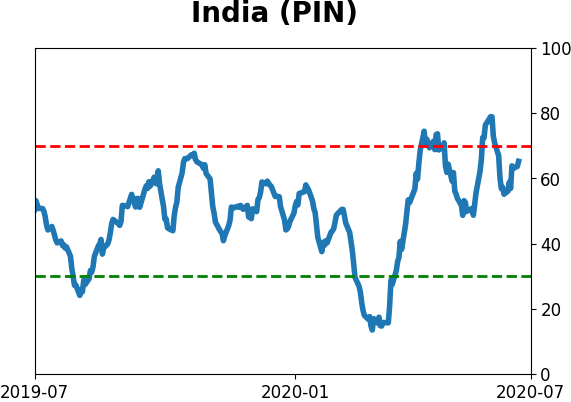
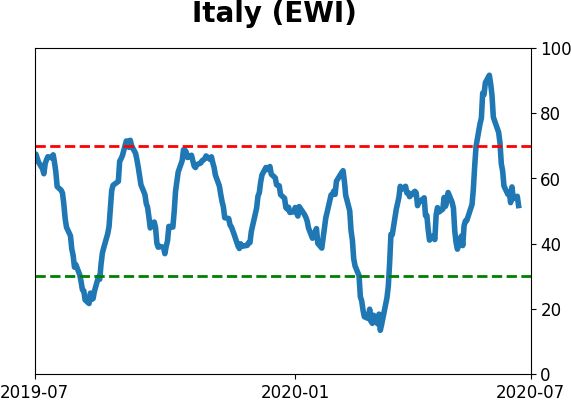
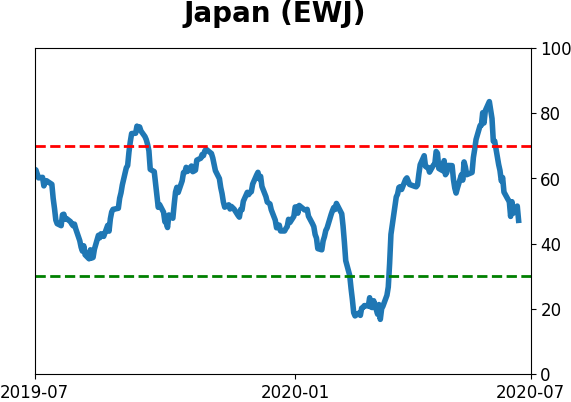
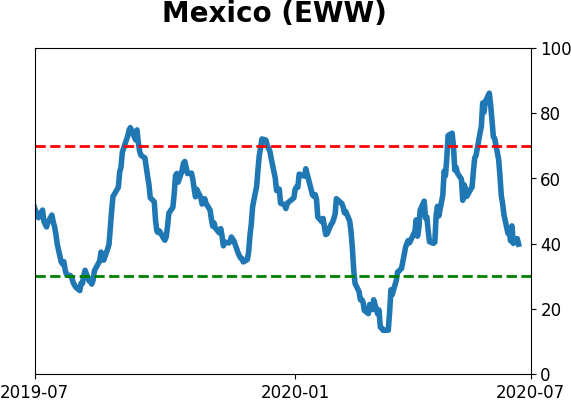
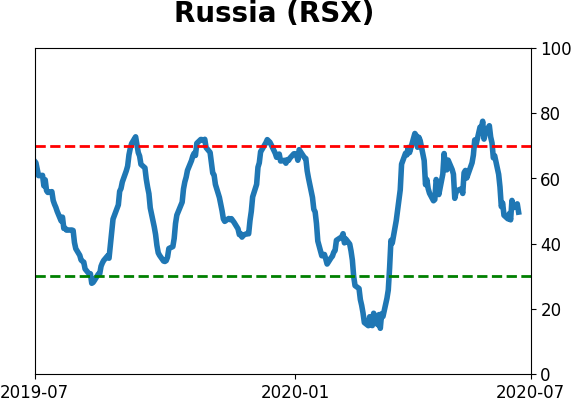
Sentiment Around The World
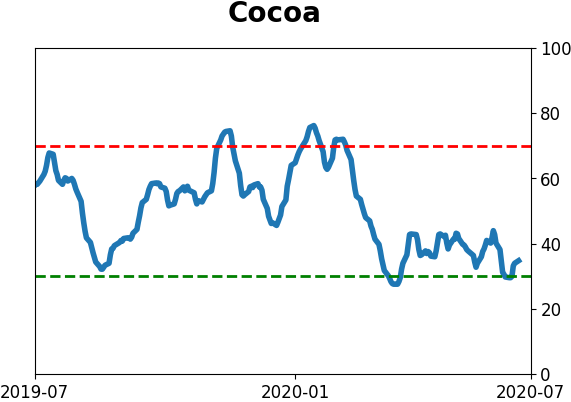
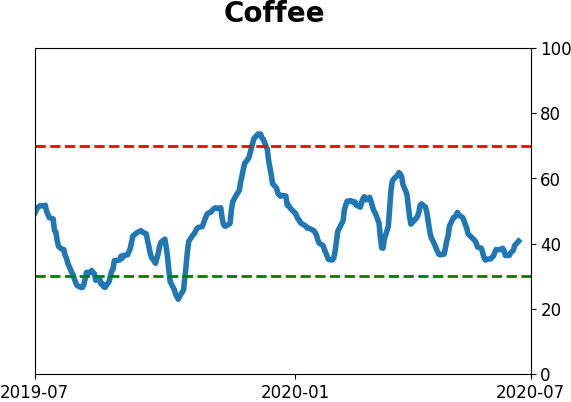
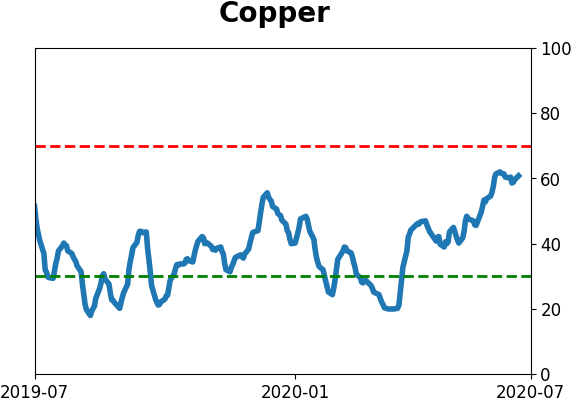
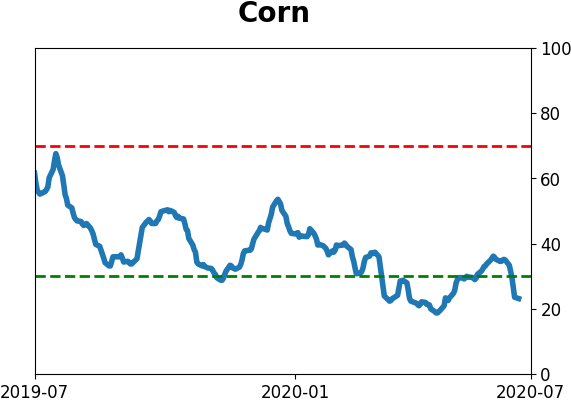
Optimism Index Thumbnails
|
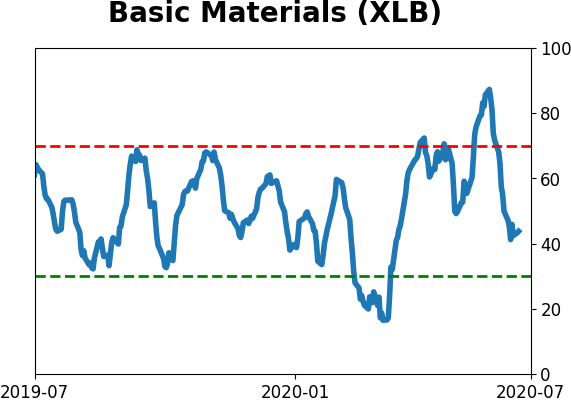
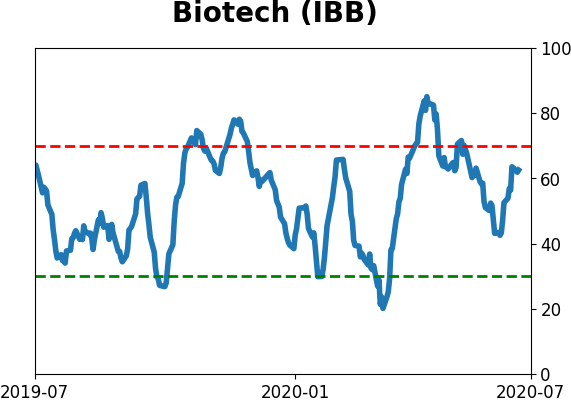
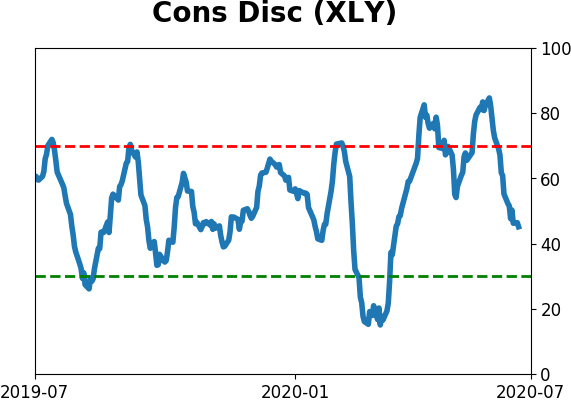
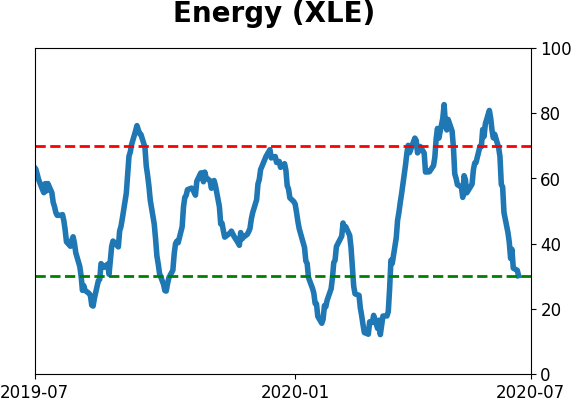
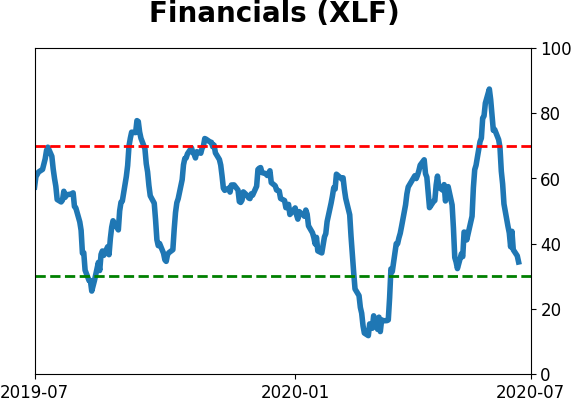
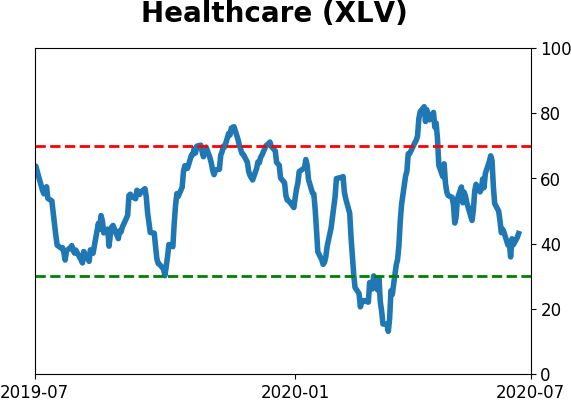
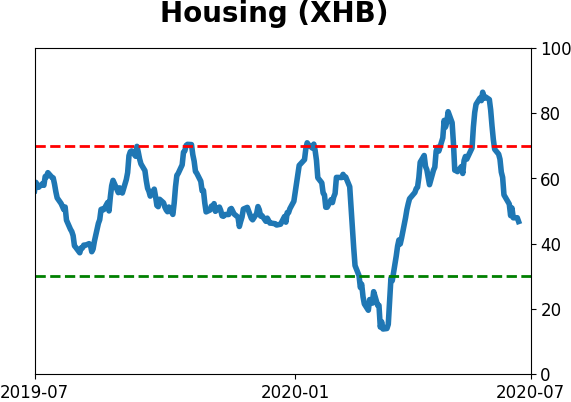
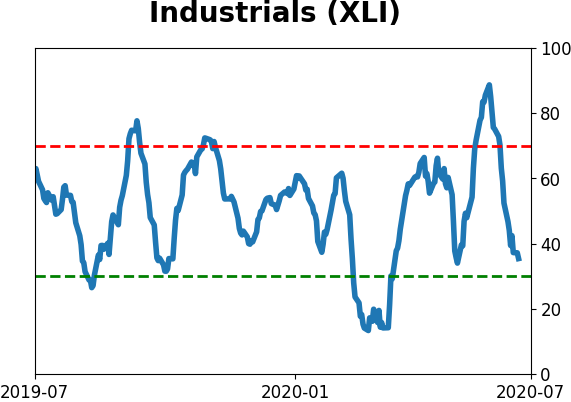
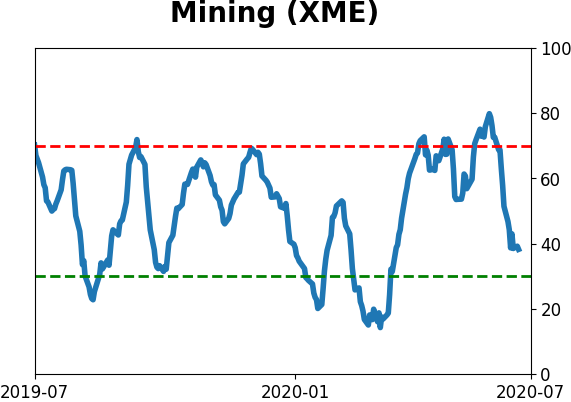
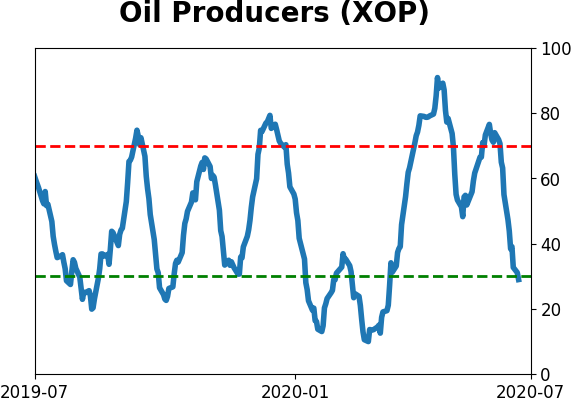
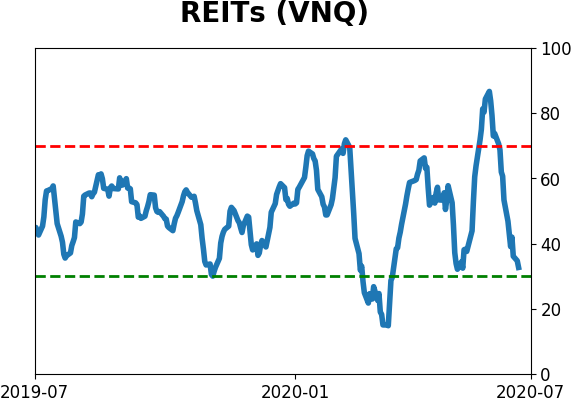
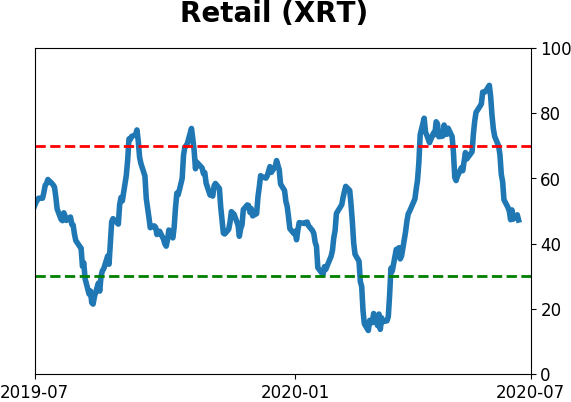
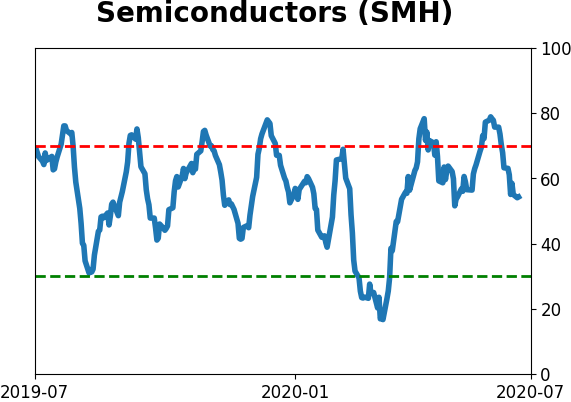
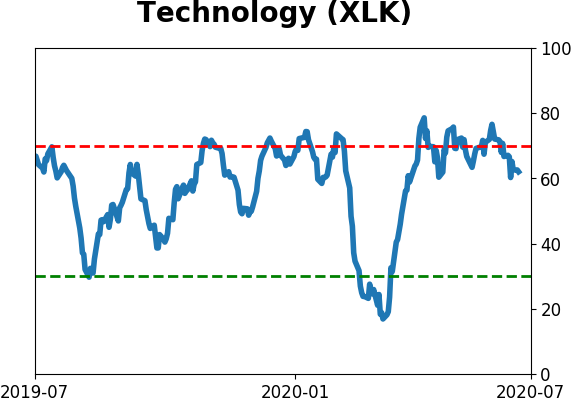
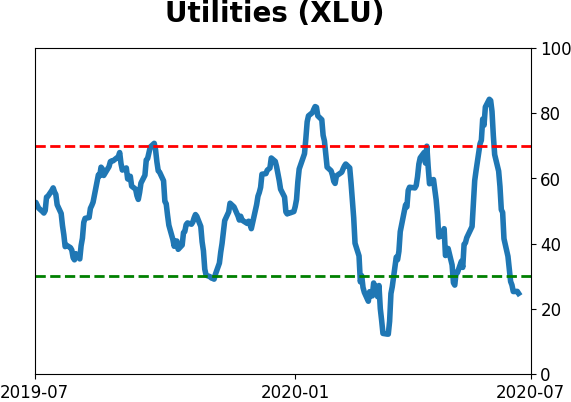
Sector ETF's - 10-Day Moving Average
|
|
|
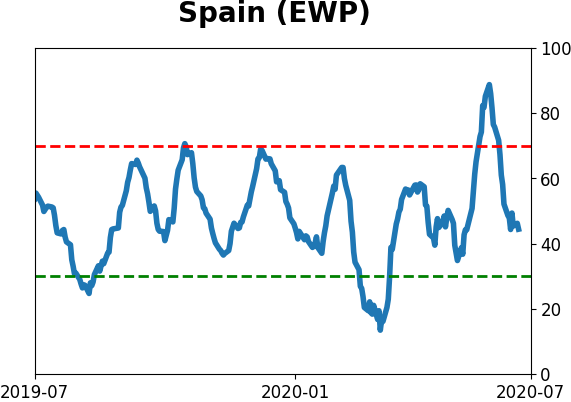
Country ETF's - 10-Day Moving Average
|
|
|
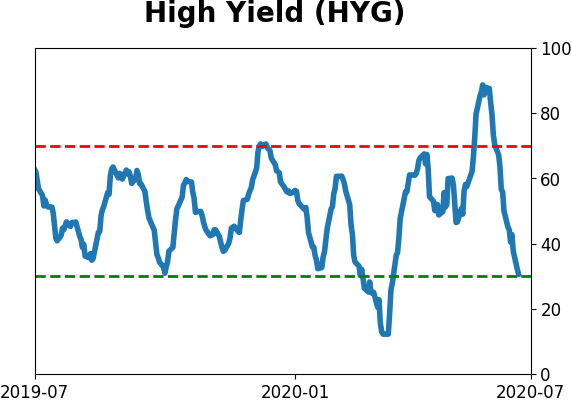
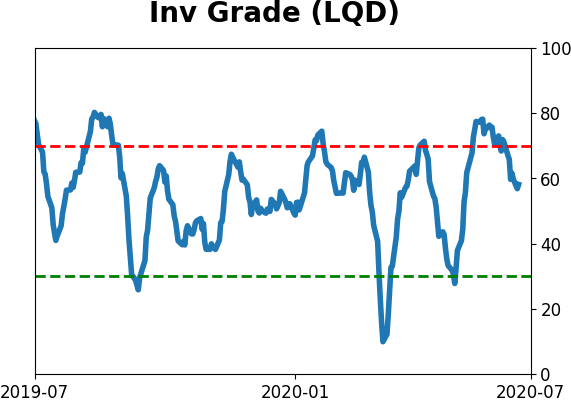
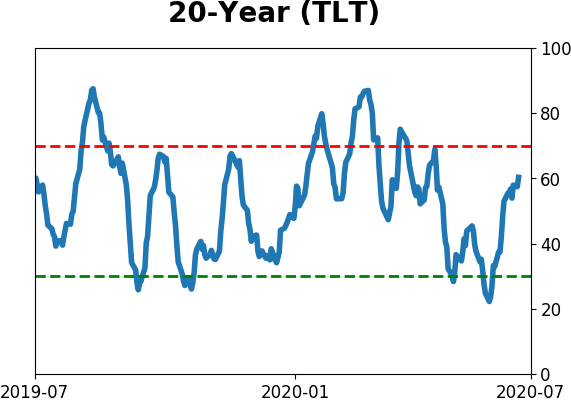
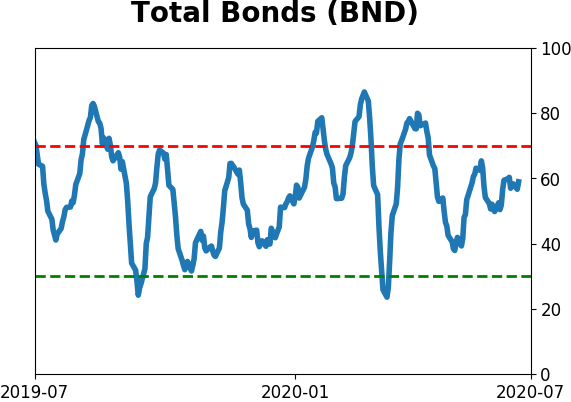
Bond ETF's - 10-Day Moving Average
|
|
|
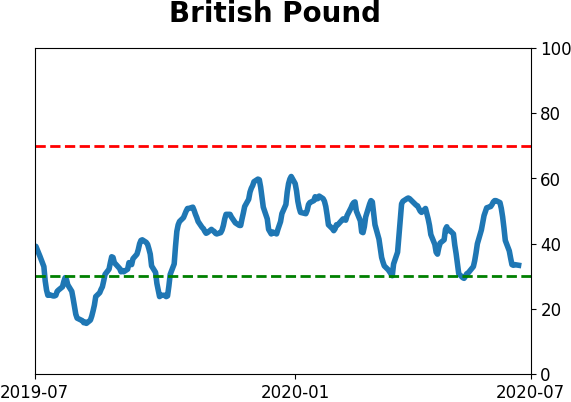
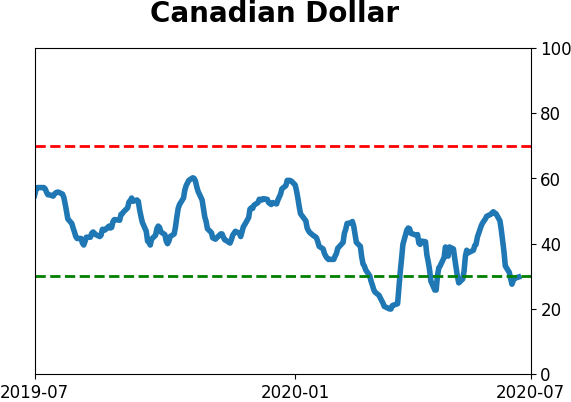
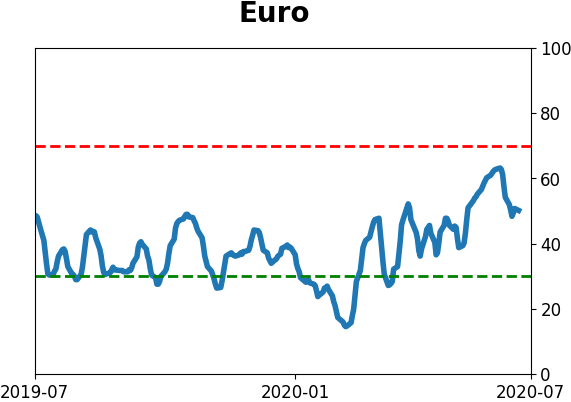
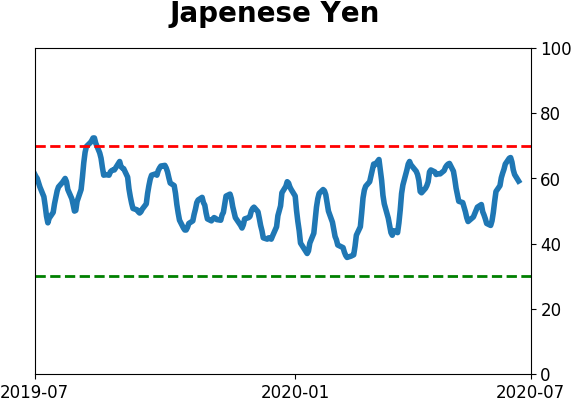
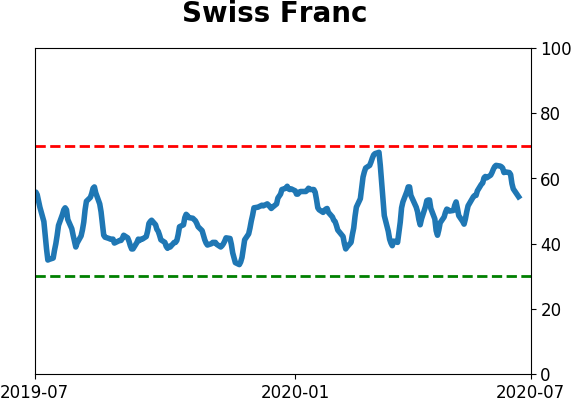
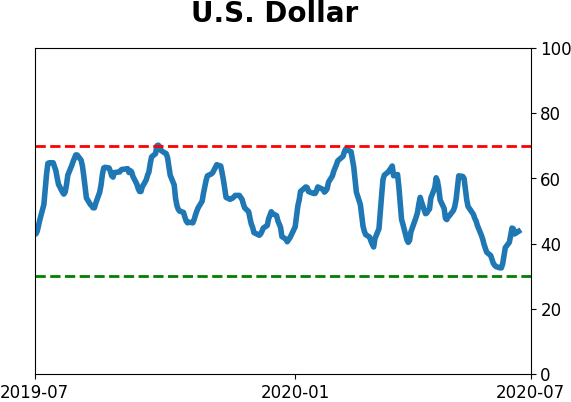
Currency ETF's - 5-Day Moving Average
|
|
|
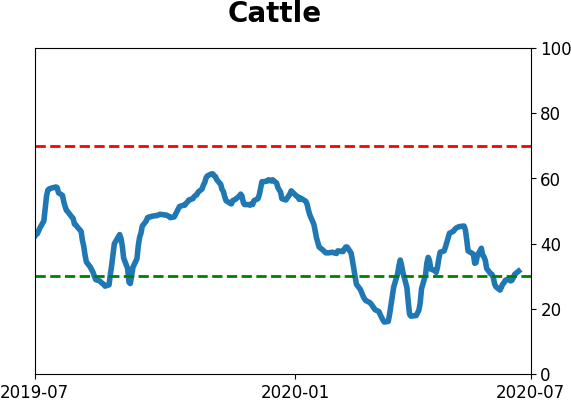
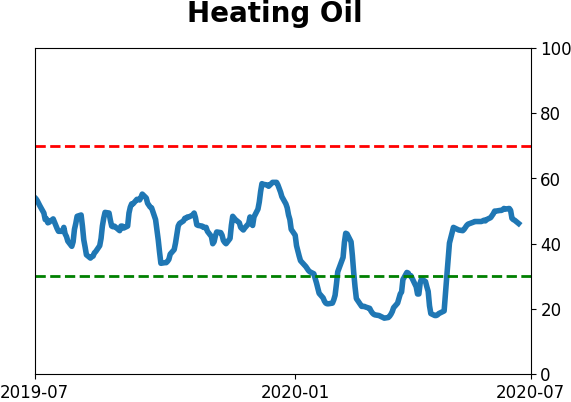
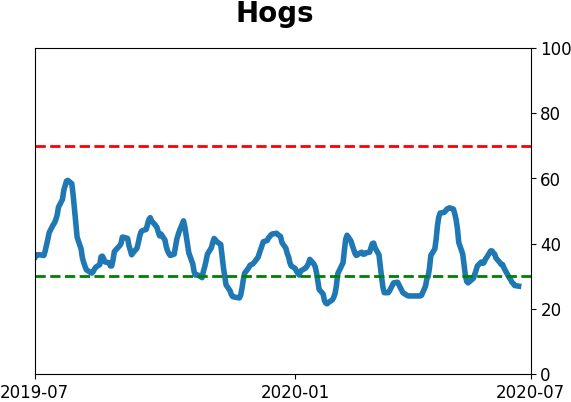
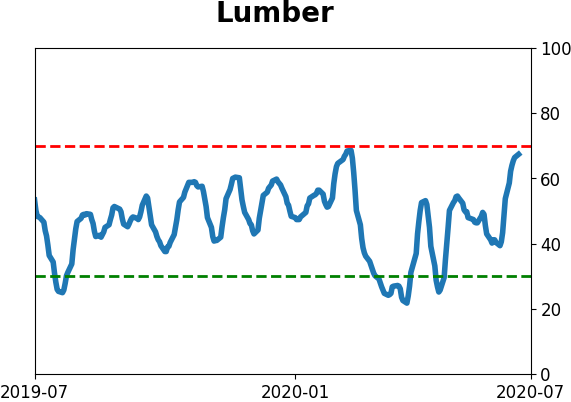
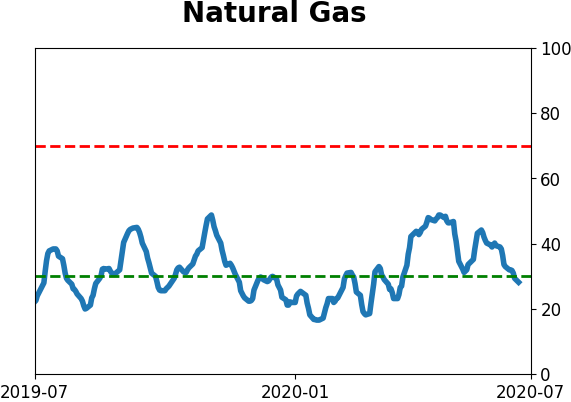
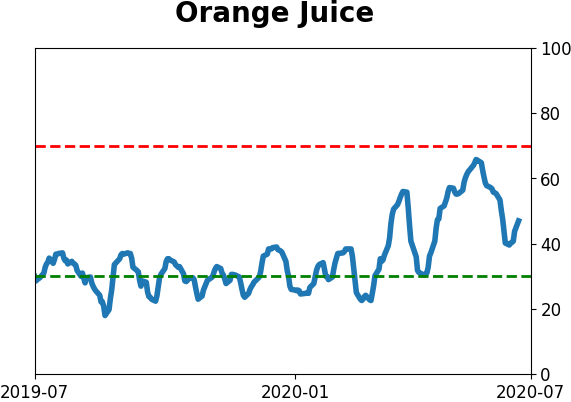
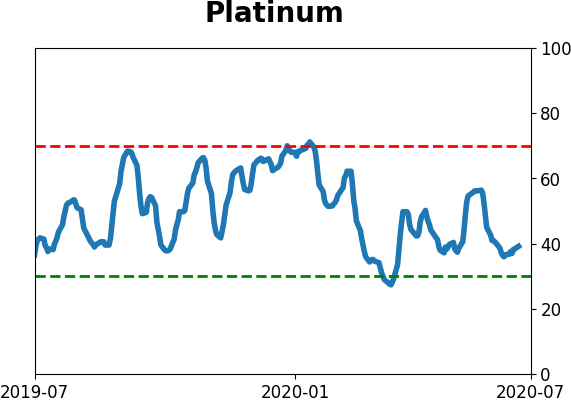
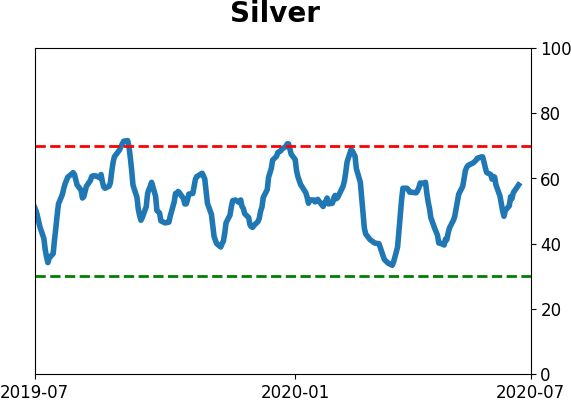
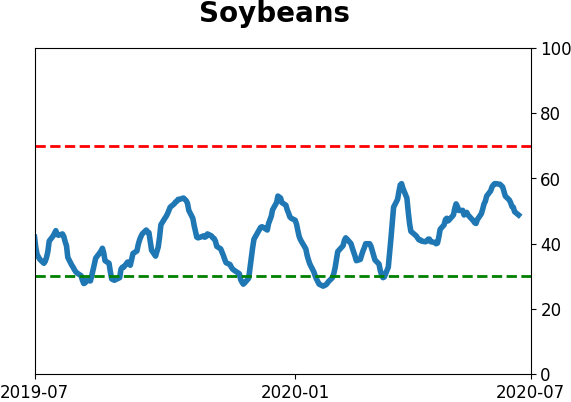
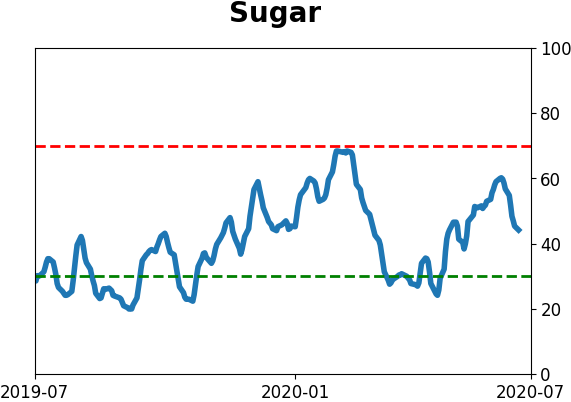
Commodity ETF's - 5-Day Moving Average
|
|