Headlines
|
|
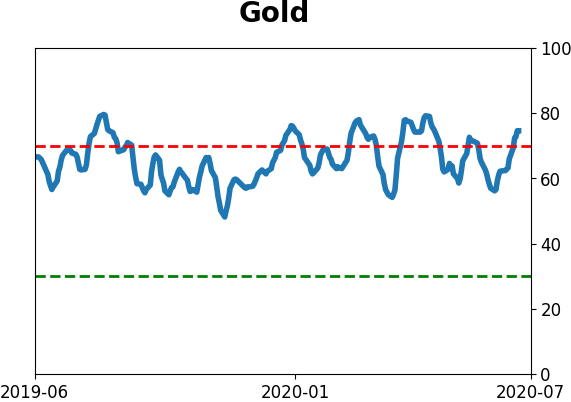
Gold's good year brings optimism:
So far in 2020, gold has suffered only a minor drawdown relative to its gains. That kind of momentum this far into a year tends to keep going. There are some worrying signs like speculators in gold futures and fund inflows, during what tends to be a flat time of the year for the metal. But it points to higher prices later in the summer.
Breadth momentum cools down:
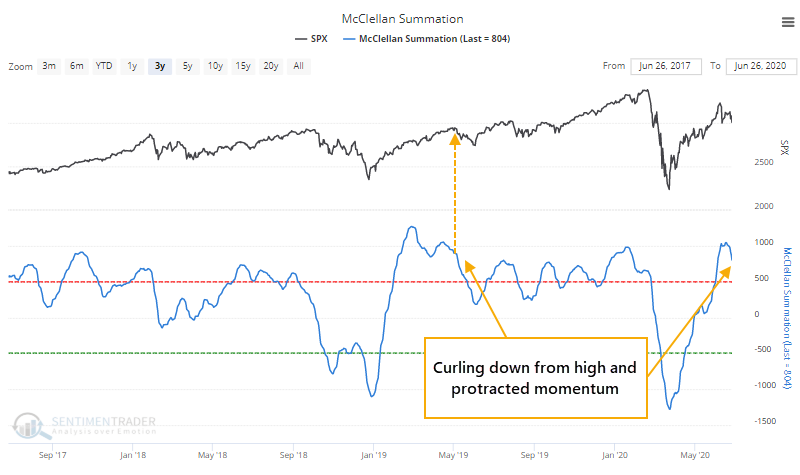
The McClellan Summation Index has curled down from an extremely high level, after holding above it for weeks. This kind of high, positive, and protracted momentum underlying the market has had a consistent tendency to lead to higher prices over the next 6-12 months.
Russell wins vs tech: The small-cap Russell 2000 gained more than 2.5% on Monday while the big tech-heavy Nasdaq 100 (NDX) managed less than 1.25%. That's happened 20 other times since their inception, all since the year 2000. It rarely led to a shift in the relationship between the two - a week later, the Russell / NDX ratio rose only 25% of the time by an average of -1.0%. A month later, the ratio was higher 40% of the time by an average of -2.5%, and three months later also 40% of the time by an average -4.0%.
Bottom line: - Weight of the evidence has been suggesting flat/lower stock prices short- to medium-term, though that's turning more neutral as stocks pulled back over the past week; still suggesting higher prices long-term
- Indicators showed high and declining optimism, as Dumb Money Confidence was recently near 80% with isolated signs of reckless speculation, during what appears to be an unhealthy market environment
- Active Studies show a heavy positive skew over the medium- to long-term; breadth thrusts and recoveries have an almost unblemished record at preceding higher prices over a 6-12 month time frame
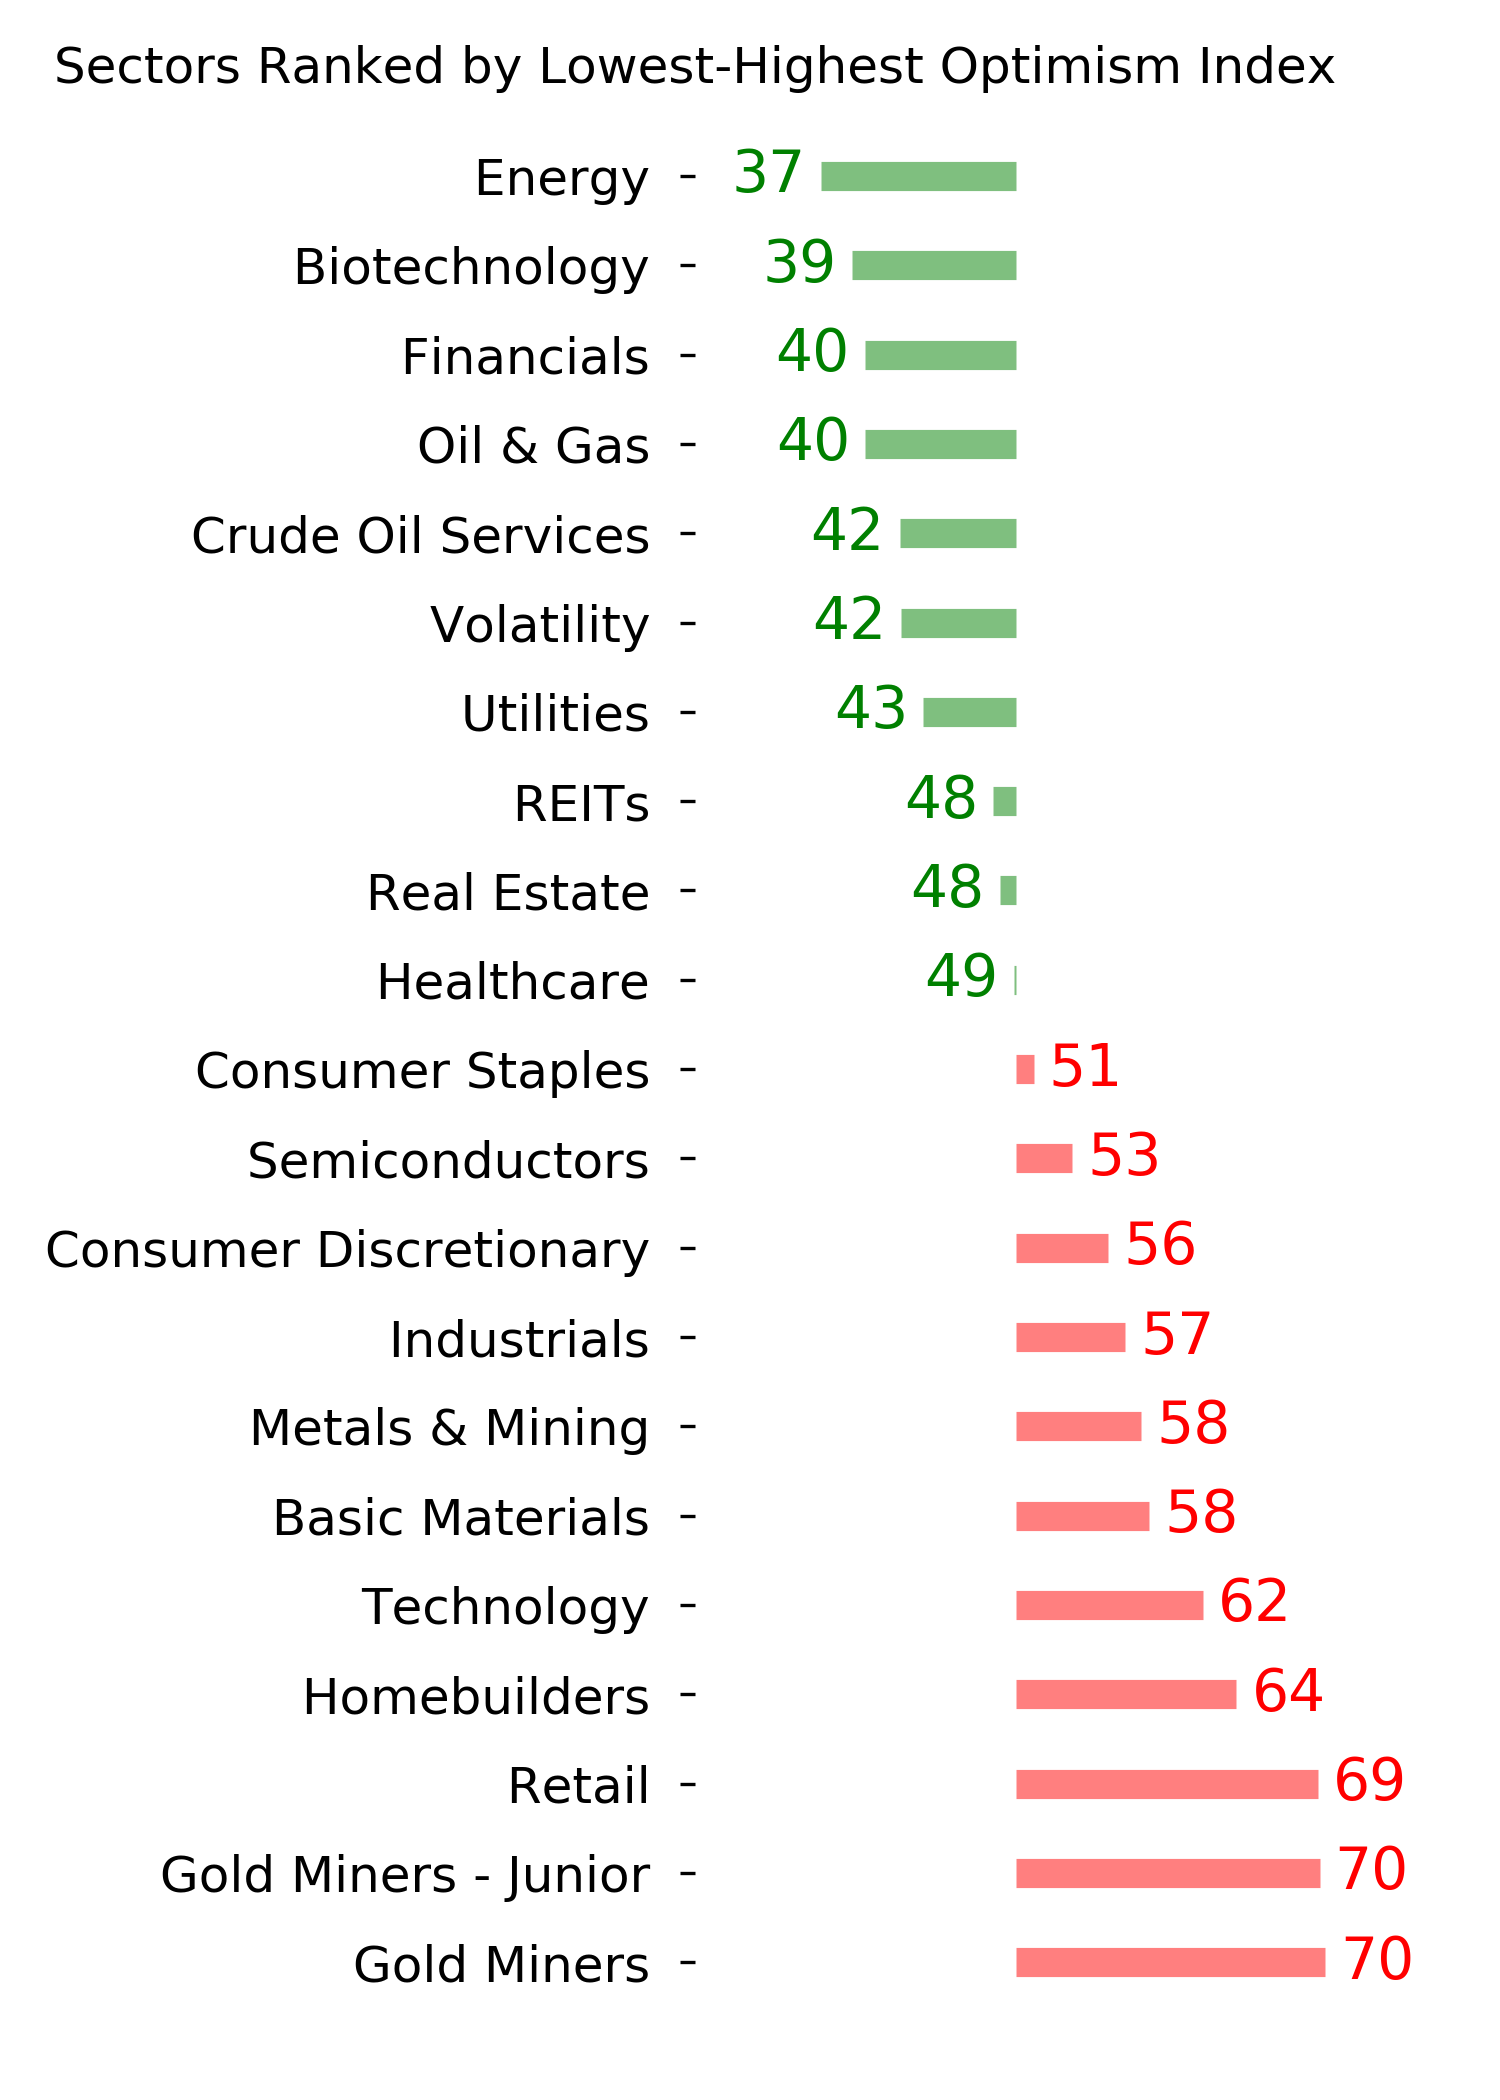
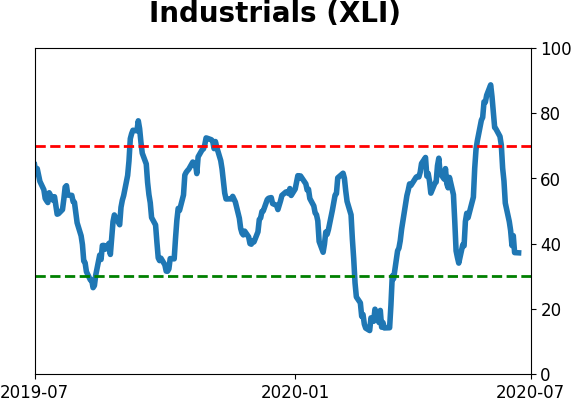
- Signs of extremely skewed preference for tech stocks nearing exhaustion, especially relative to industrials and financials (here and here)
- Indicators and studies for other markets are mixed with no strong conclusion
|
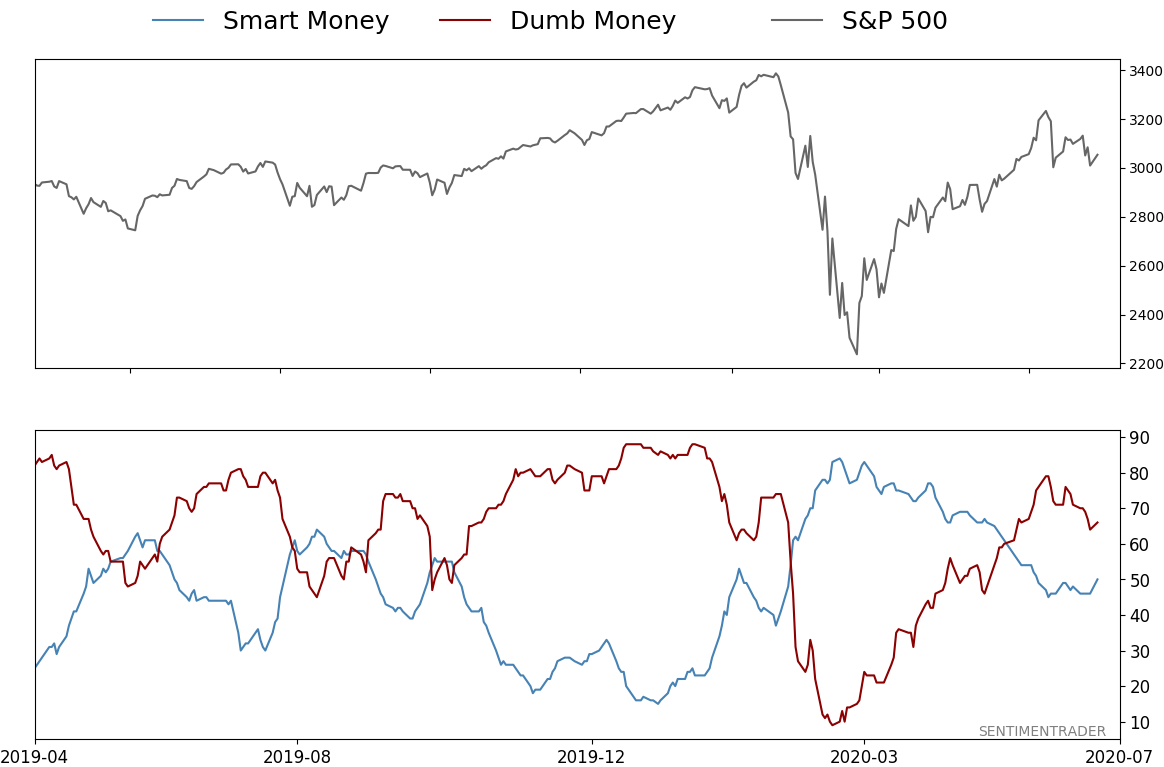
Smart / Dumb Money Confidence
|
Smart Money Confidence: 50%
Dumb Money Confidence: 66%
|
|
Risk Levels
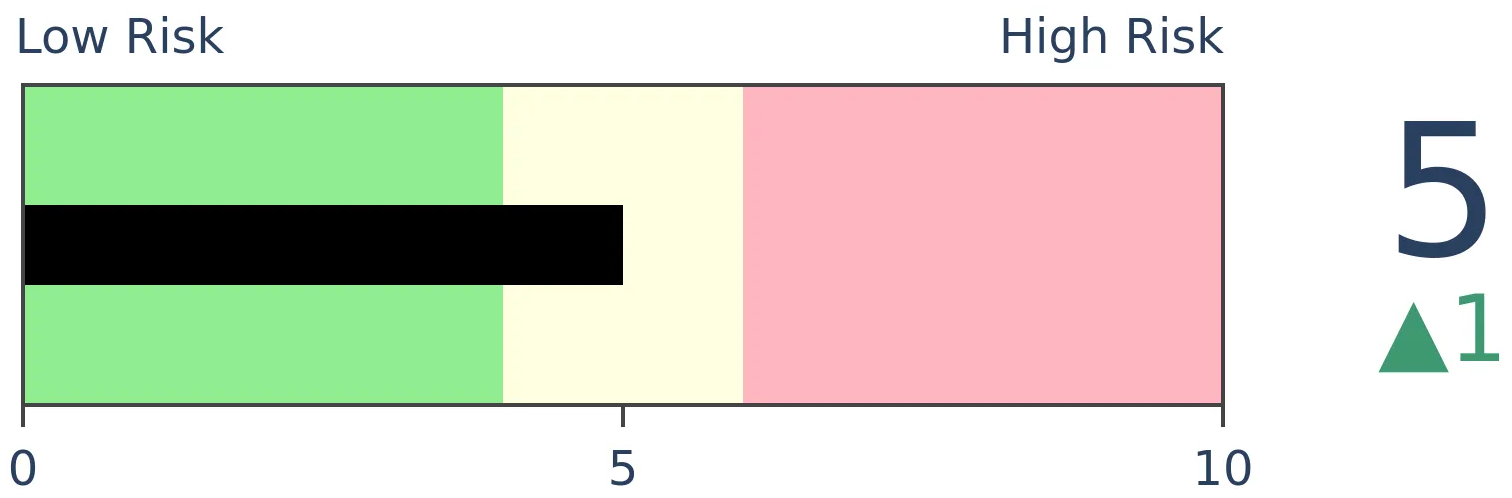
Stocks Short-Term
|
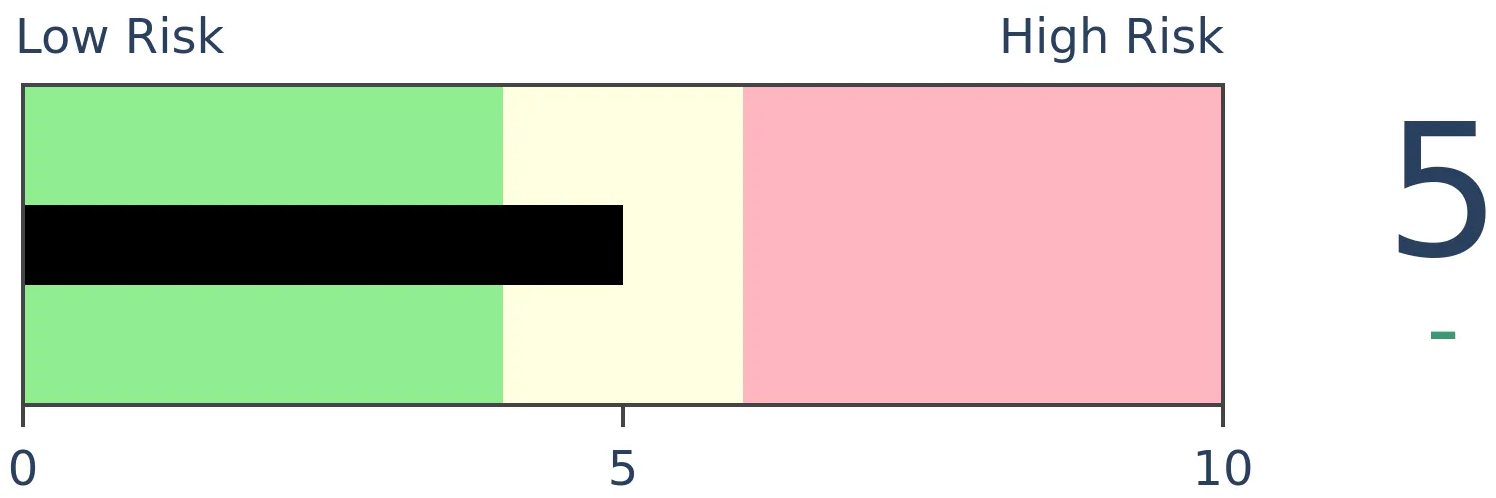
Stocks Medium-Term
|
|
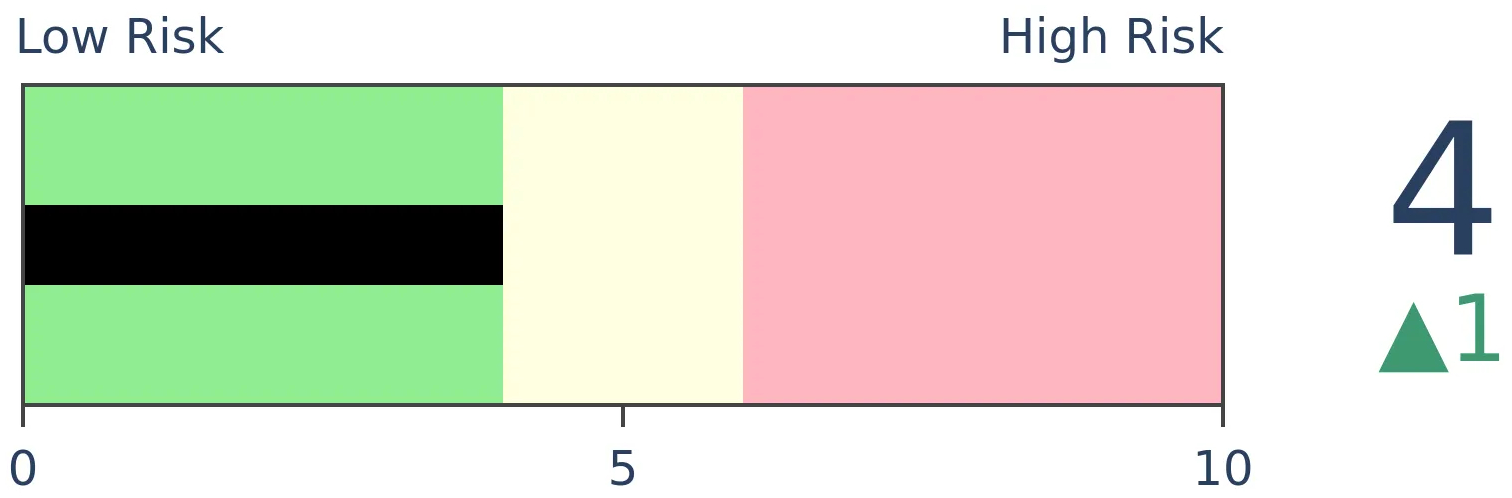
Bonds

|
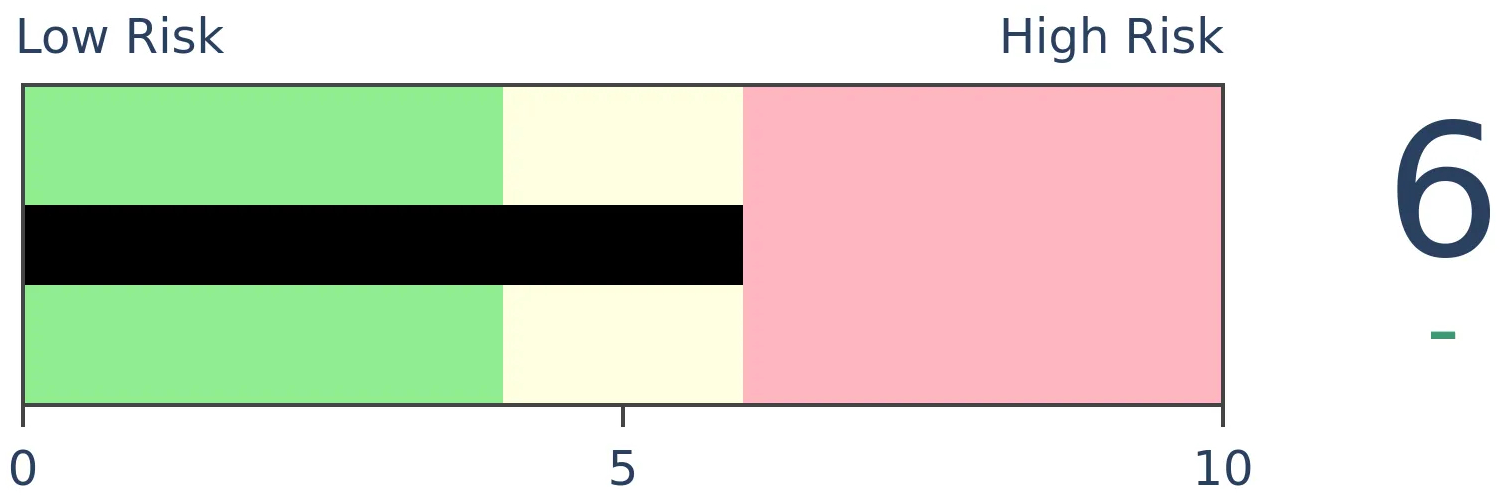
Crude Oil
|
|
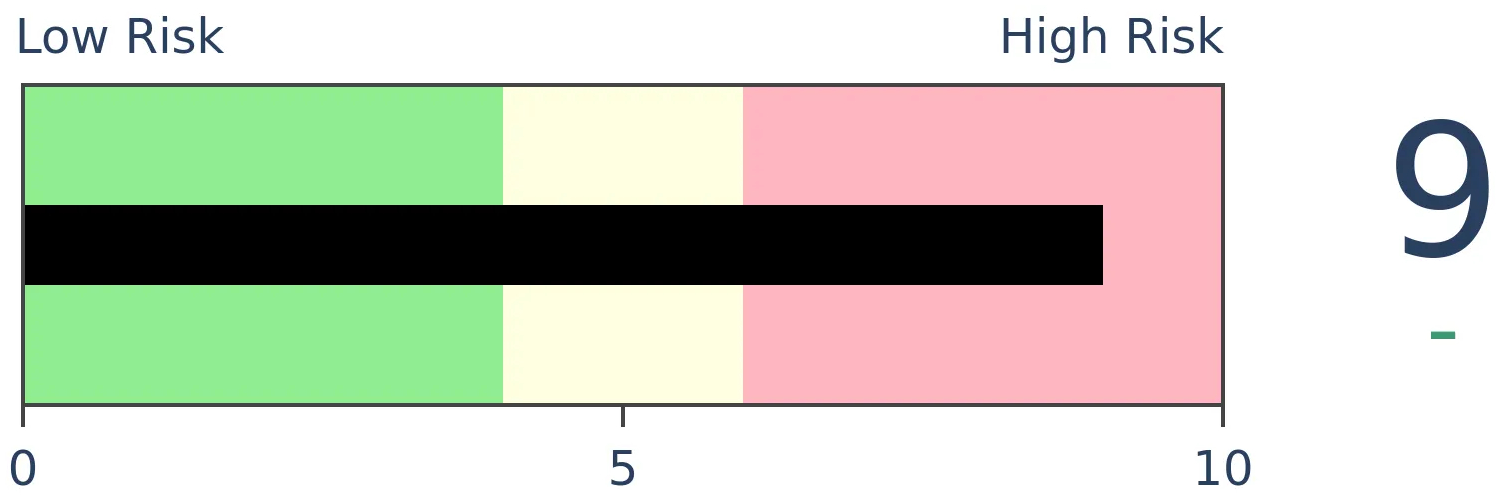
Gold
|
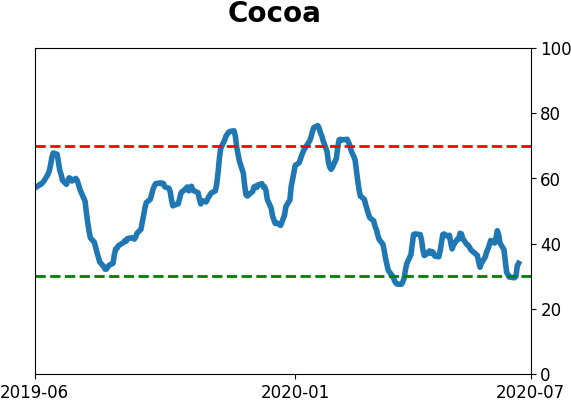
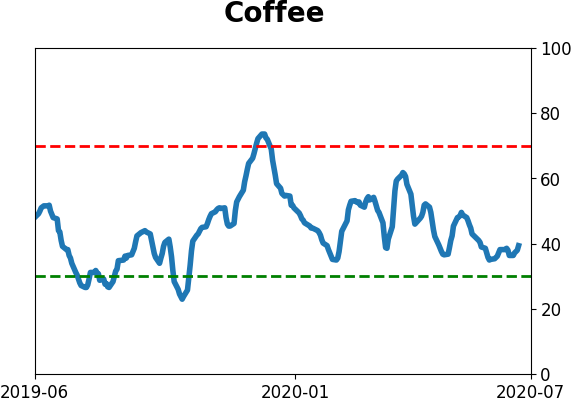
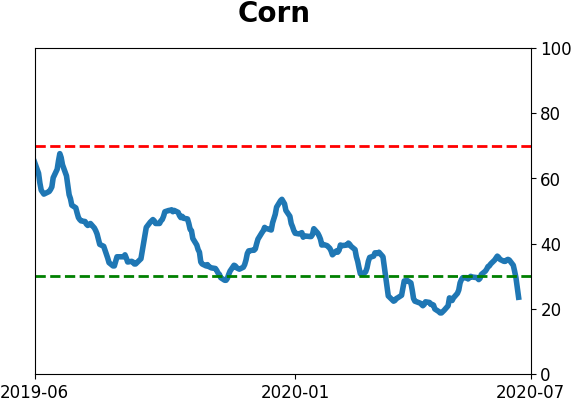
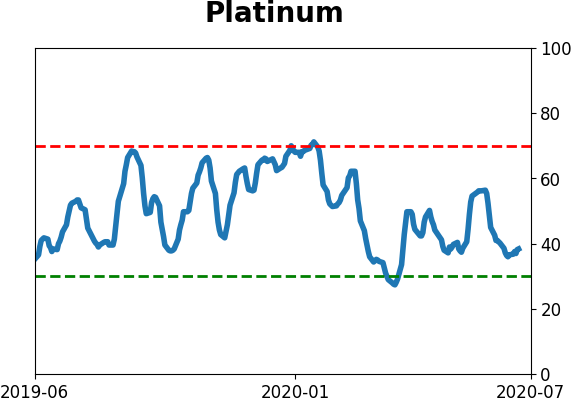
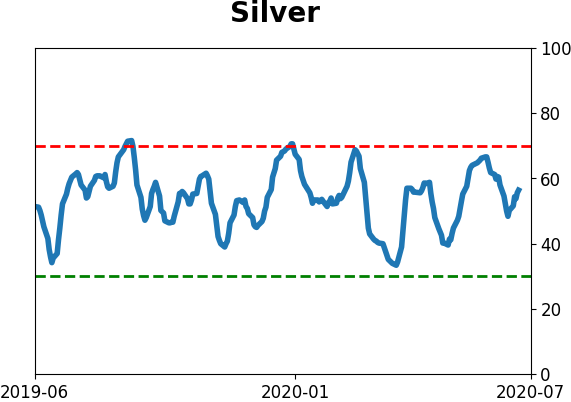
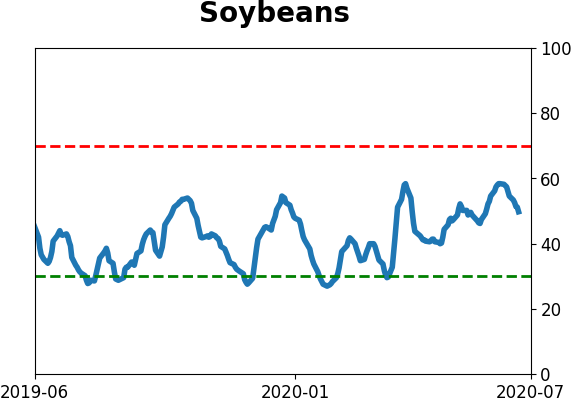
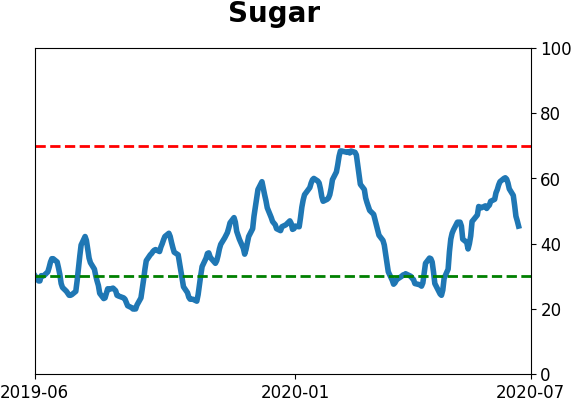
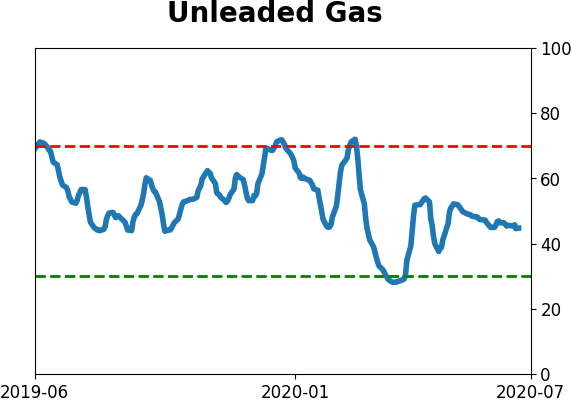
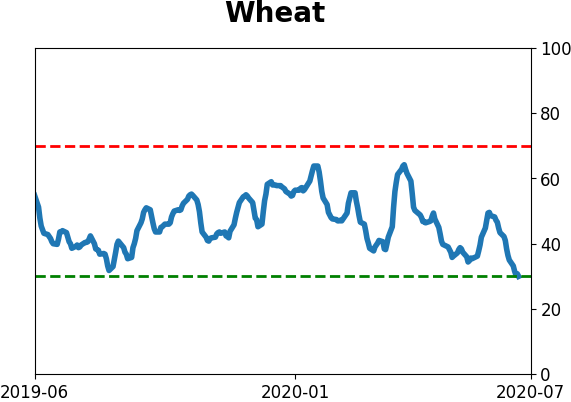
Agriculture
|
|
Research
BOTTOM LINE
So far in 2020, gold has suffered only a minor drawdown relative to its gains. That kind of momentum this far into a year tends to keep going. There are some worrying signs like speculators in gold futures and fund inflows, during what tends to be a flat time of the year for the metal. But it points to higher prices later in the summer.
FORECAST / TIMEFRAME
None
|
Last week, we saw that technology stocks were beating every other sector by more than 5% through about the mid-way part of the year. Tech isn't the only asset having a good half-year - gold is, too.
Through about the half-way point of 2020, gold has returned more than 16% and is at its highs for the year. Meanwhile, it suffered only a small drawdown from where it closed 2019.
Below, we can see all years when gold had the best risk/reward through this many sessions of a year.
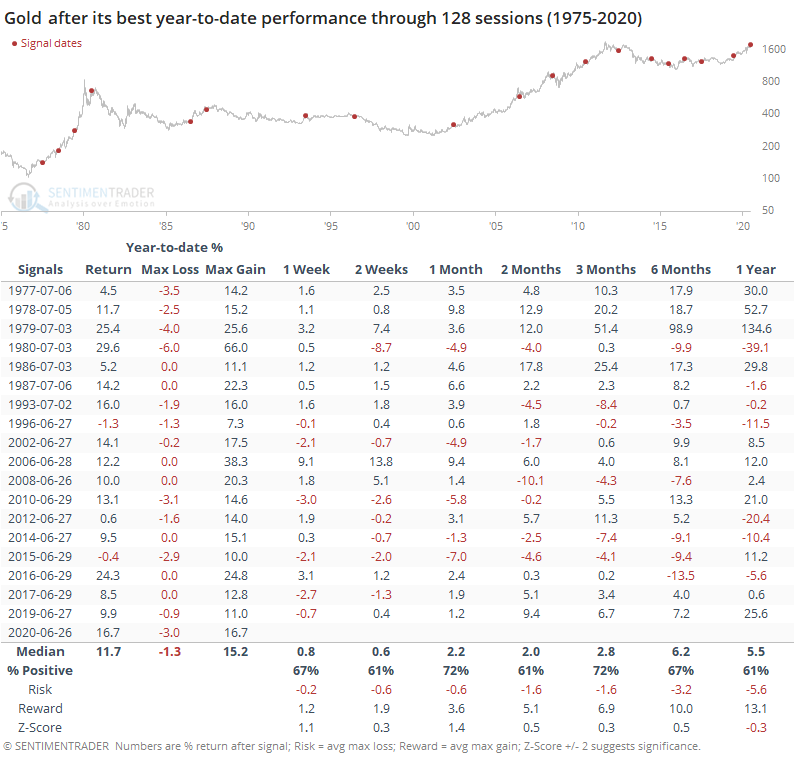
Momentum is a powerful thing, and when gold had good years, it tended to keep going. Over the next few months, gold tended to keep rallying, with only 4 out of the 18 years showing a substantial decline in the months ahead. It's not a very strong signal but looks to be a modest positive.
Contrast this to years when gold suffered its worst risk/reward through about the half-way point of a year.
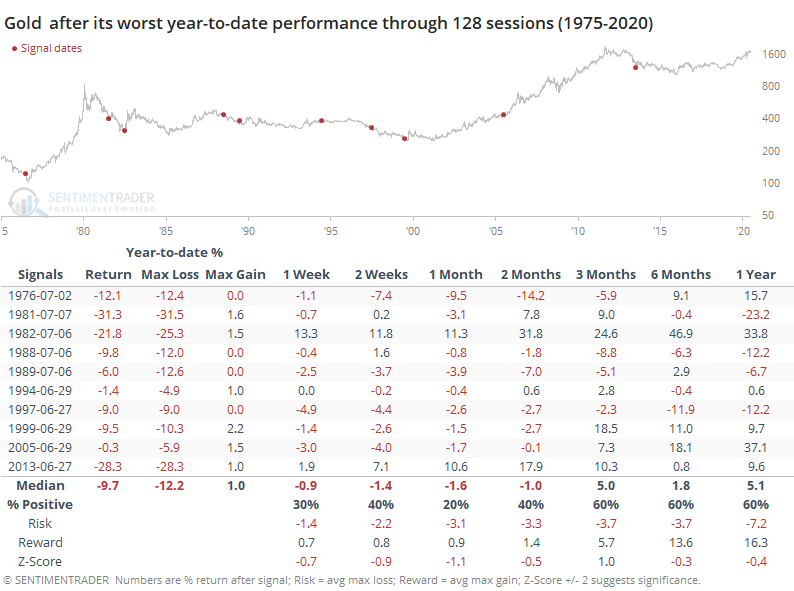
Its returns were much worse, with only two years (1982 and 2013) seeing the metal turn around significantly in the months ahead.
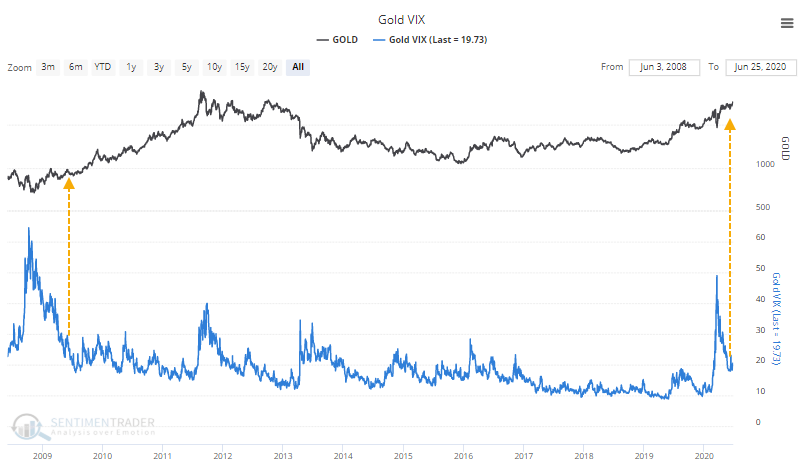
Implied volatility in gold spiked in March when it quickly tumbled along with almost everything else during the peak of the panic. It has since started to calm down. Implied volatility in commodities doesn't necessarily work like it does in stocks - it's just as likely to spike during rapid price rallies as declines. The only time gold's "VIX" spiked above 40 during a decline and then calmed down below 20 was in 2009.
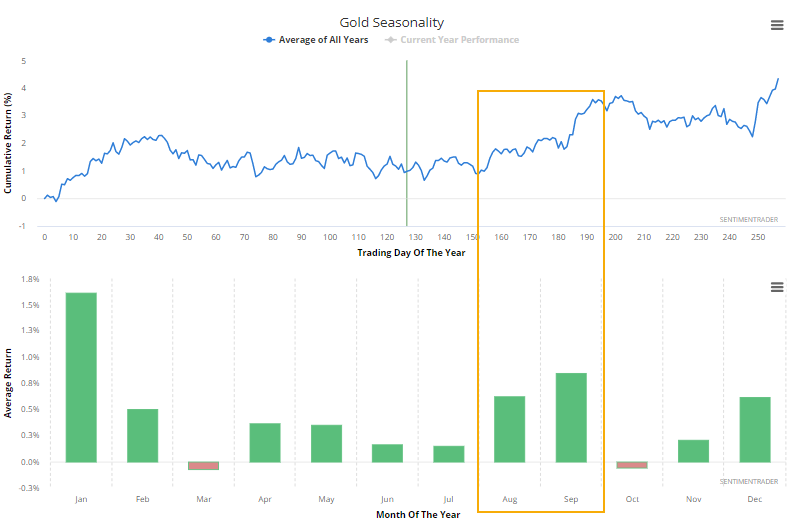
Gold's seasonal pattern has tended to show mediocre returns during the summer, with more "oomph" during the latter months.
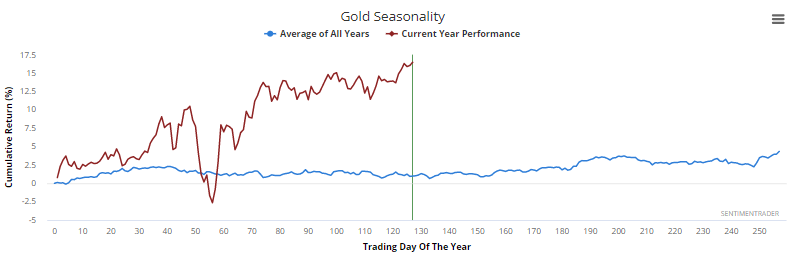
Its pattern in 2020 has somewhat followed the script in general, but clearly not in magnitude.
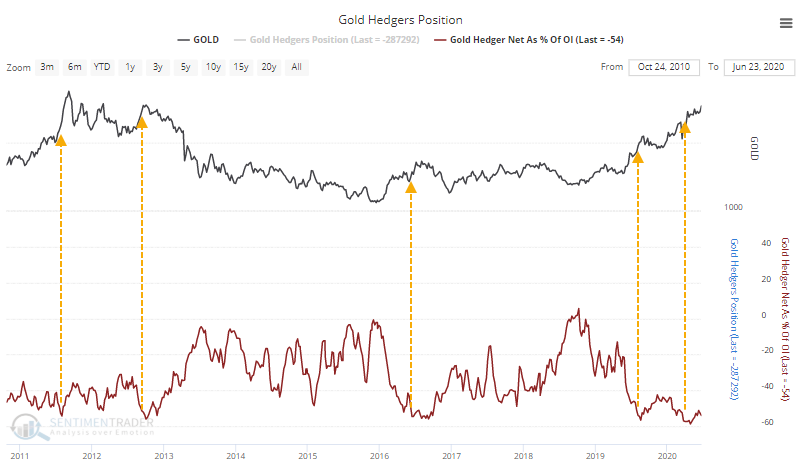
One concern is that "smart money" hedgers are betting against the metal, holding more than 50% of open interest net short, which means that speculators are heavily long. This has been an issue in recent years, but not so much historically. This is drastically different from the kind of sentiment we saw in August 2018 (here and here and here).
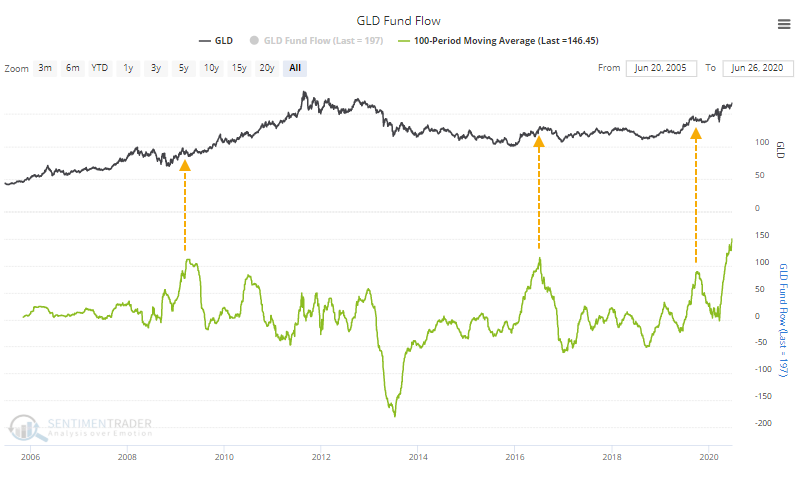
There have also been heavy flows into some gold funds like GLD. Over the past 100 days, it has averaged an inflow of nearly $150 million per day, a record high.
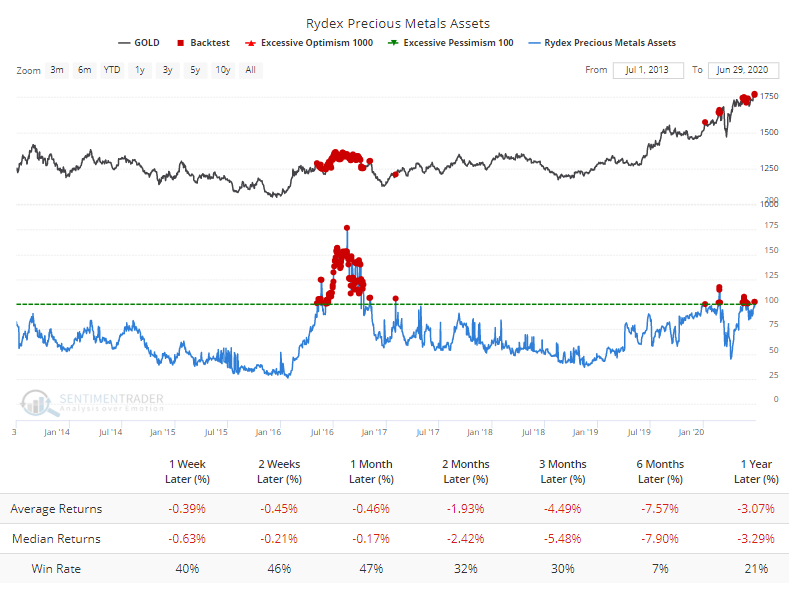
Traders who frequent the Rydex family of mutual funds have also come back to precious metals. Assets in that fund have doubled since early April and are back above $100 million. The Backtest Engine shows poor returns over the past 7 years when assets were this high, though with the caveat that assets were frequently 2-3 times higher than this during the mid-2000s run.
This kind of activity has pushed the Optimism Index for gold above 75. The Backtest Engine shows that gold's short- to medium-term returns have been flat when optimism is this high.
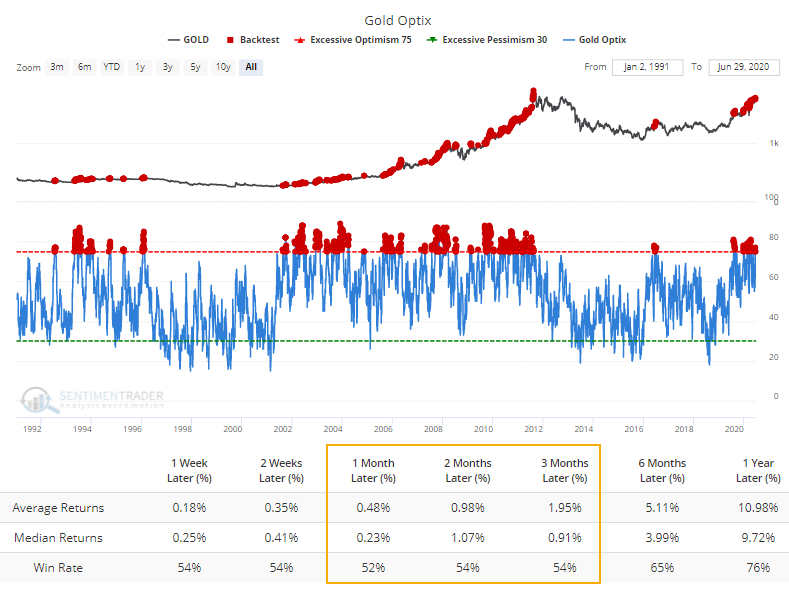
The fact that gold is still hitting new highs despite signs of high optimism earlier this year is a good sign. If gold can continue to hold ground despite high optimism, then it suggests a long-term positive market environment much like the mid-2000s.
The best risk/reward setups tend to occur during periods of truly extreme pessimism like late summer 2018, with the next-best being momentum market environments. We're definitely not seeing the former; we're potentially seeing the latter. There are some minor shorter-term negatives, so if those can calm down in the weeks ahead, then it should present a better risk/reward for the metal heading into the late summer.
BOTTOM LINE
The McClellan Summation Index has curled down from an extremely high level, after holding above it for weeks. This kind of high, positive, and protracted momentum underlying the market has had a consistent tendency to lead to higher prices over the next 6-12 months.
FORECAST / TIMEFRAME
SPY -- Up, Long-Term
|
A lot of what we looked at from late March through May was related to thrusts in breadth and displays of historic momentum. Now that the trends in most indexes and stocks have plateaued, we're seeing those breadth and momentum figures come back toward neutral.
One of the better indications of this is the McClellan Summation Index. This long-term representation of momentum in advancing versus declining stocks spent several weeks above +800, thrusting above +1,000, and is now curling lower. The only time in recent years it did this was the spring of 2019 (it didn't quite make it above +1,000 earlier this year).
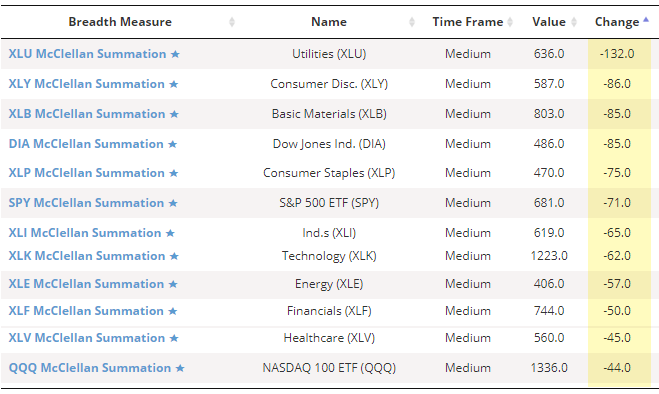
The Summation Indexes for the sectors we follow have also been coming down hard in recent days.
This is pretty much the opposite of what we saw on March 26, when the Summation Index was curling up from a very low level. That study showed consistent long-term positive implications.
As an aside, if you want to see any recent research that we've posted about a particular indicator, pull up the chart, scroll down toward the bottom of the page and click "Blog Posts Mentions."
As far as implications go, when the Summation Index curls down from highly positive, protracted momentum, it has also been a good long-term sign.
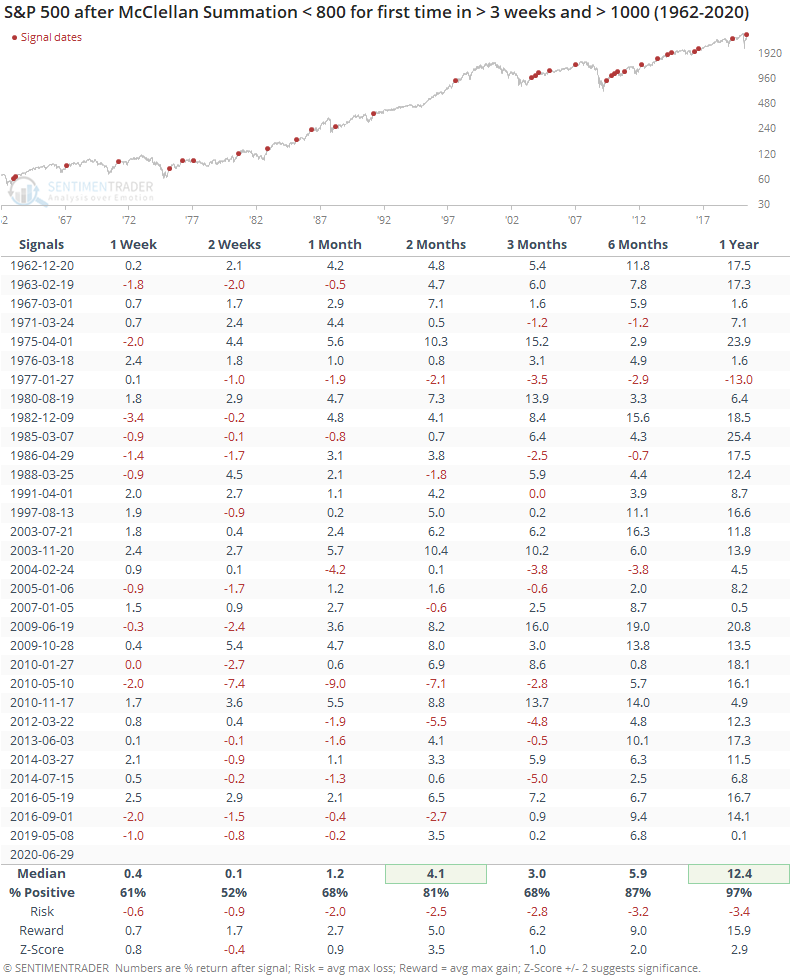
Shorter-term returns were mixed, turning positive over the medium-term, though the risk/reward still wasn't great. It wasn't until 6-12 months later that it suggested a strong bullish edge. Over the next six months, there were only a few small losses, and a year later, there was only a single loss.
Displays of extremely low breadth momentum have positive long-term implications, and displays of extremely high momentum do, too. We've seen both over the past few months.
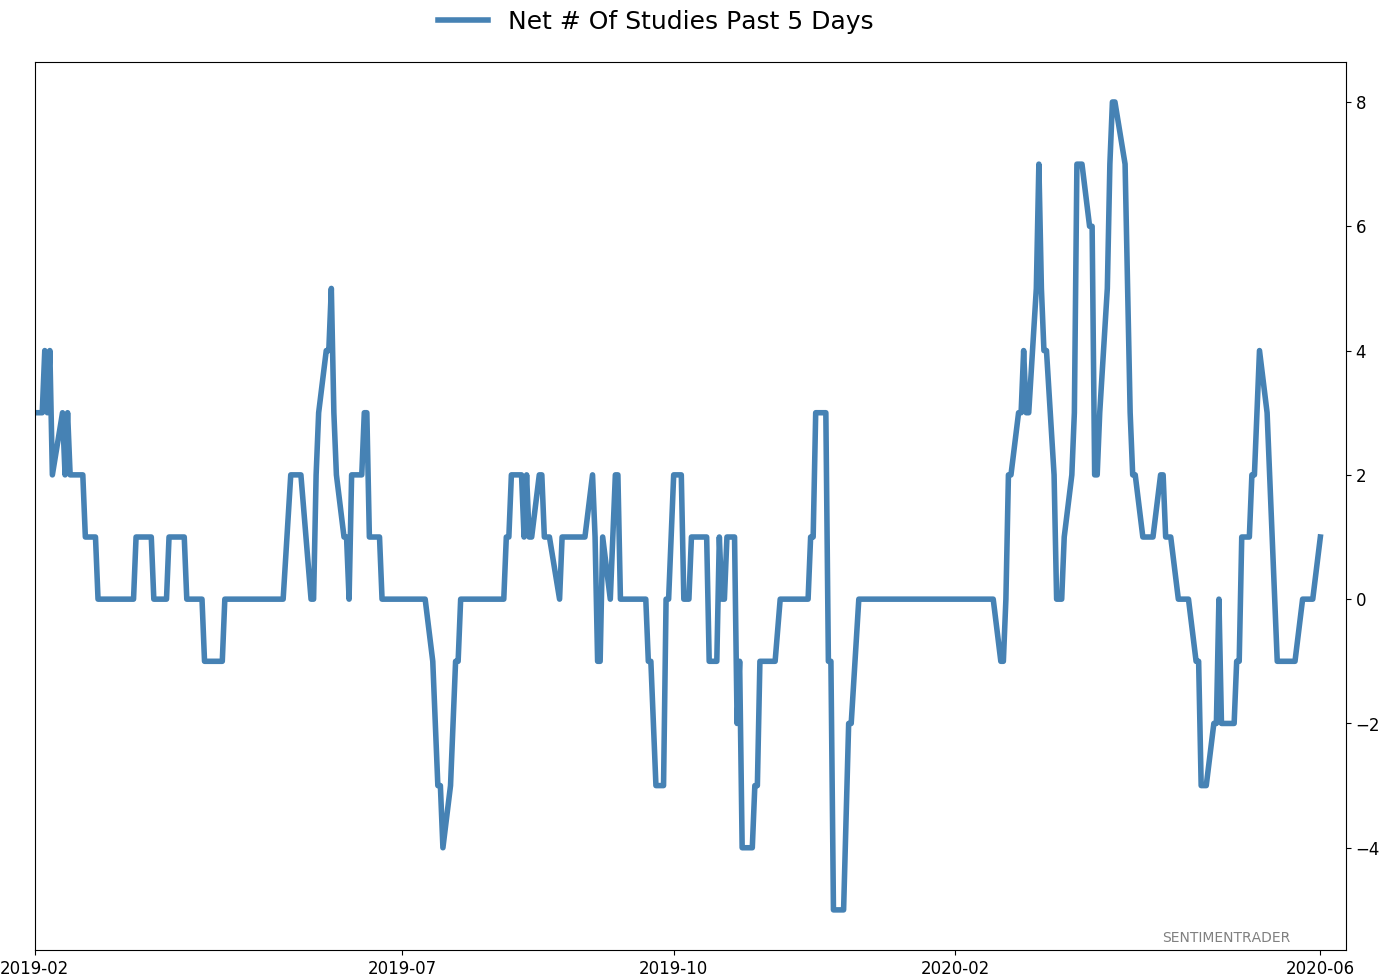
Active Studies
| Time Frame | Bullish | Bearish | | Short-Term | 0 | 0 | | Medium-Term | 8 | 6 | | Long-Term | 41 | 1 |
|
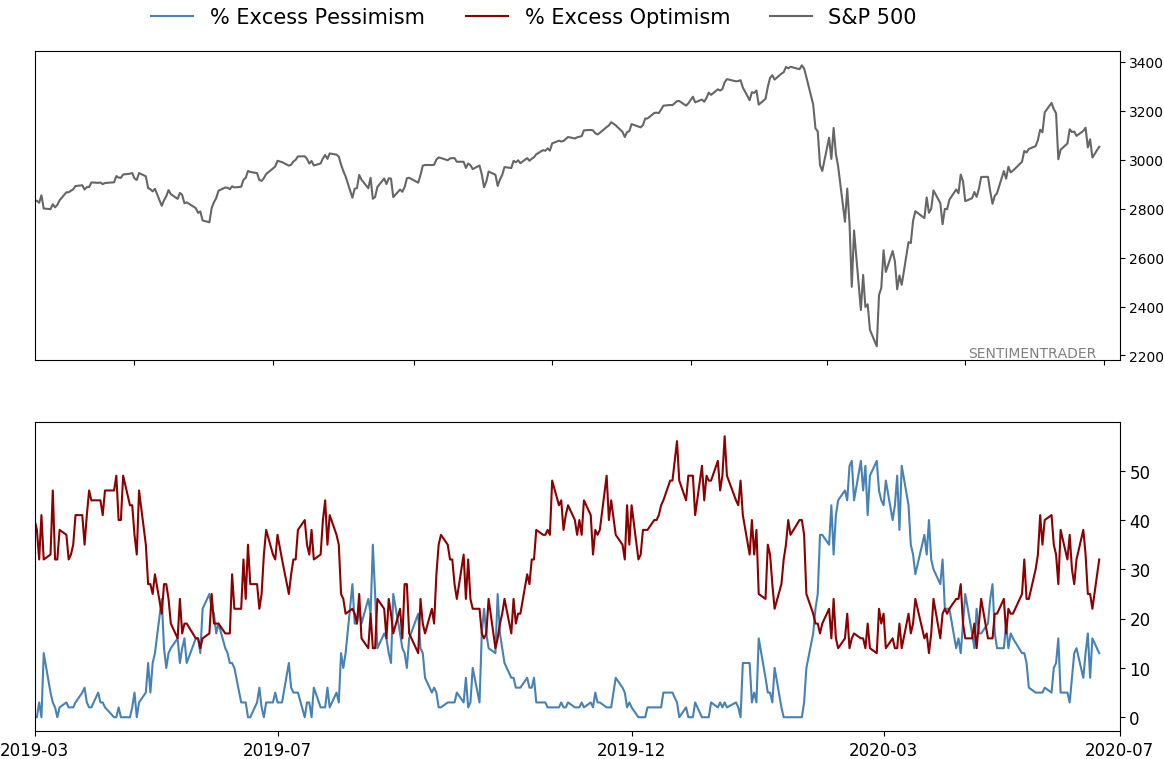
Indicators at Extremes
Portfolio
| Position | Weight % | Added / Reduced | Date | | Stocks | 29.8 | Reduced 9.1% | 2020-06-11 | | Bonds | 0.0 | Reduced 6.7% | 2020-02-28 | | Commodities | 5.2 | Added 2.4%
| 2020-02-28 | | Precious Metals | 0.0 | Reduced 3.6% | 2020-02-28 | | Special Situations | 0.0 | Reduced 31.9% | 2020-03-17 | | Cash | 65.0 | | |
|
Updates (Changes made today are underlined)
In the first months of the year, we saw manic trading activity. From big jumps in specific stocks to historic highs in retail trading activity to record highs in household confidence to almost unbelievable confidence among options traders. All of that came amid a market where the average stock couldn't keep up with their indexes. There were signs of waning momentum in stocks underlying the major averages, which started triggering technical warning signs in late January. After stocks bottomed on the 23rd, they enjoyed a historic buying thrust and retraced a larger amount of the decline than "just a bear market rally" tends to. Those thrusts are the most encouraging sign we've seen in years. Through early June, we were still seeing thrusts that have led to recoveries in longer-term breadth metrics. The longer-term prospects for stocks (6-12 months) still look decent given the above. On a short- to medium-term basis, it was getting harder to make that case. Dumb Money Confidence spiked and there were multiple signs of a historic level of speculation. This is likely the lowest I will go given what I still consider to be compelling positives over a longer time frame. There is not a slam-dunk case to be made for either direction, so it will seem like a mistake whether stocks keep dropping (why didn't I sell more?) or if they turn and head higher (why did I let short-term concerns prevail?). After nearly three decades of trading, I've learned to let go of the idea of perfection.
RETURN YTD: -6.1% 2019: 12.6%, 2018: 0.6%, 2017: 3.8%, 2016: 17.1%, 2015: 9.2%, 2014: 14.5%, 2013: 2.2%, 2012: 10.8%, 2011: 16.5%, 2010: 15.3%, 2009: 23.9%, 2008: 16.2%, 2007: 7.8%
|
|
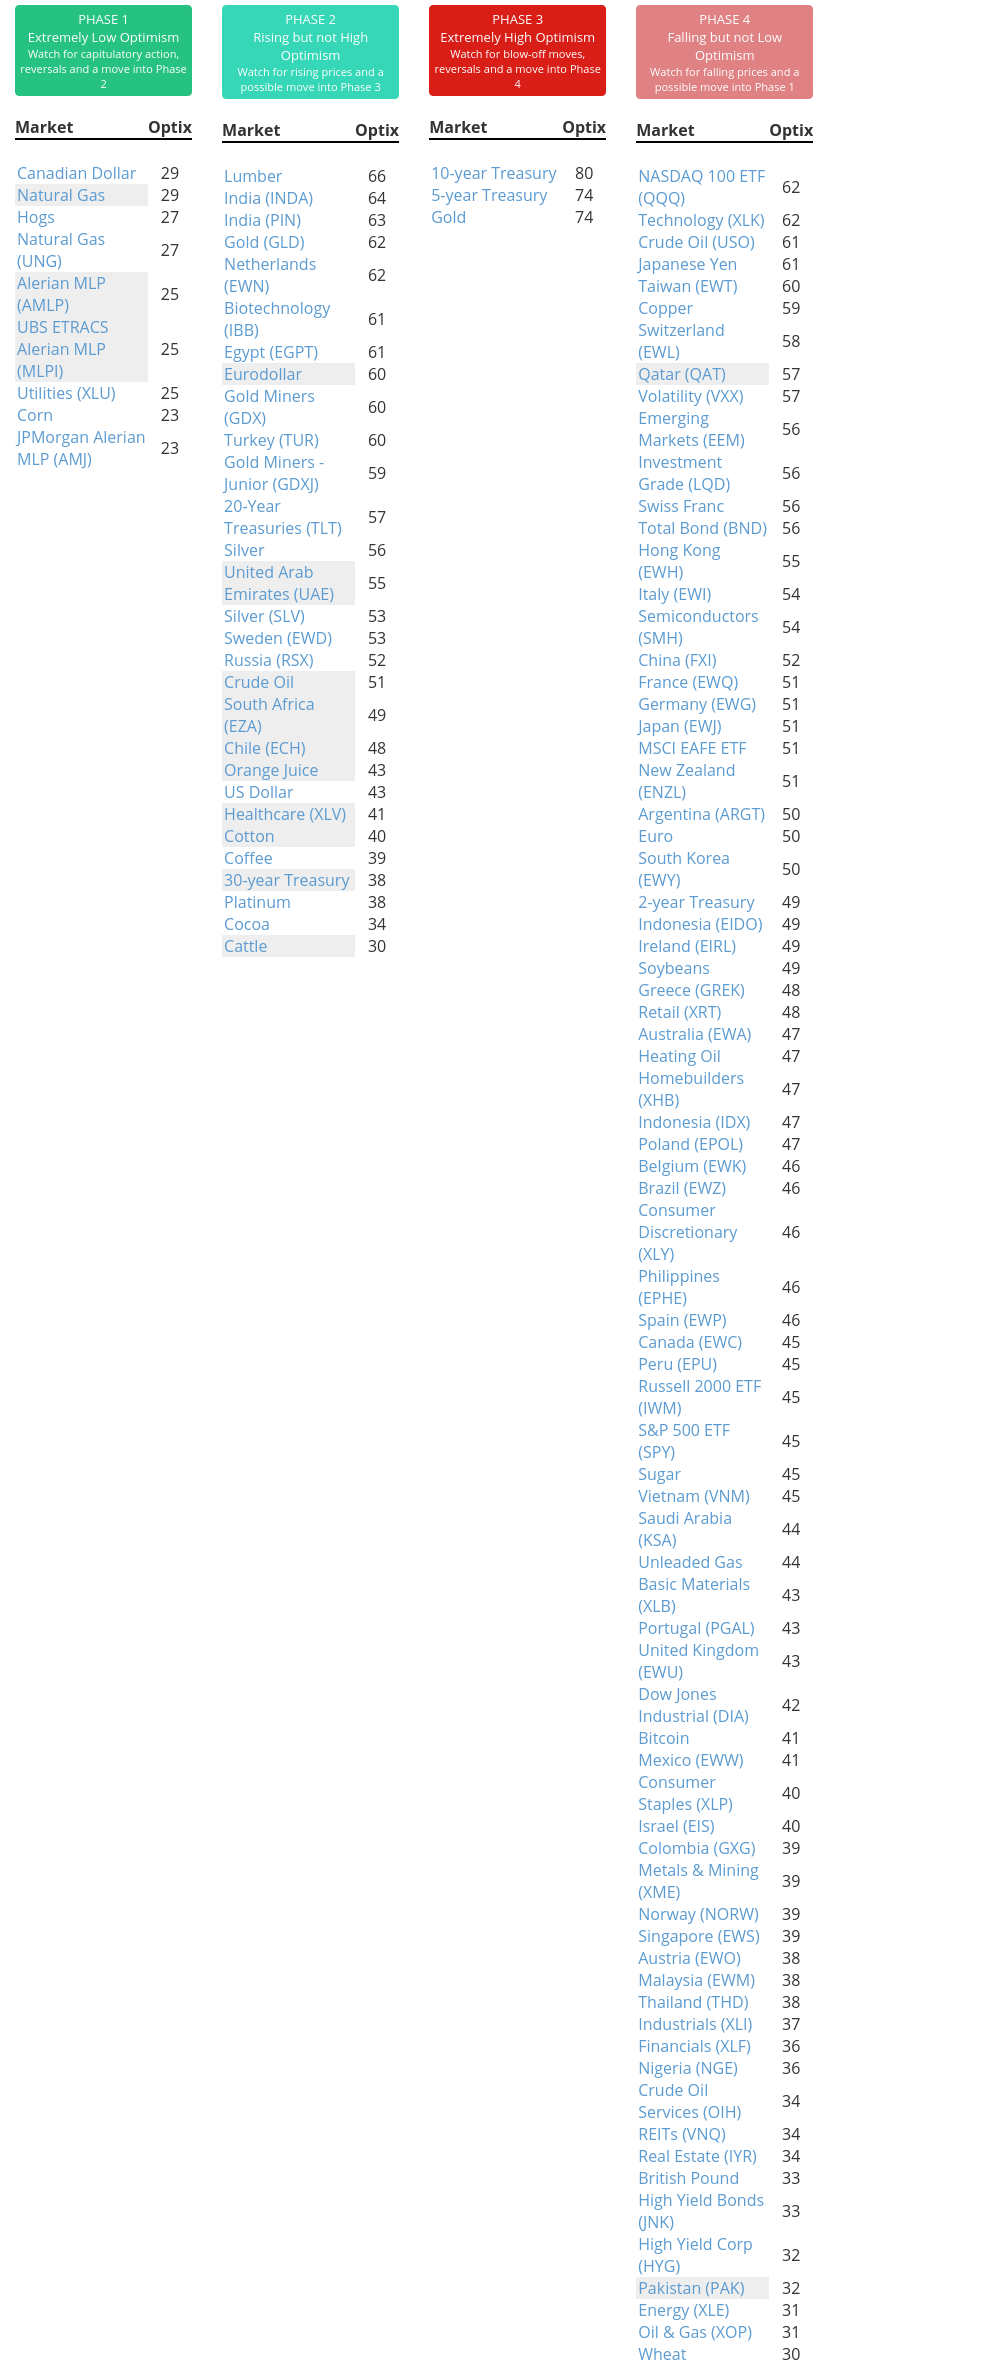
Phase Table
Ranks
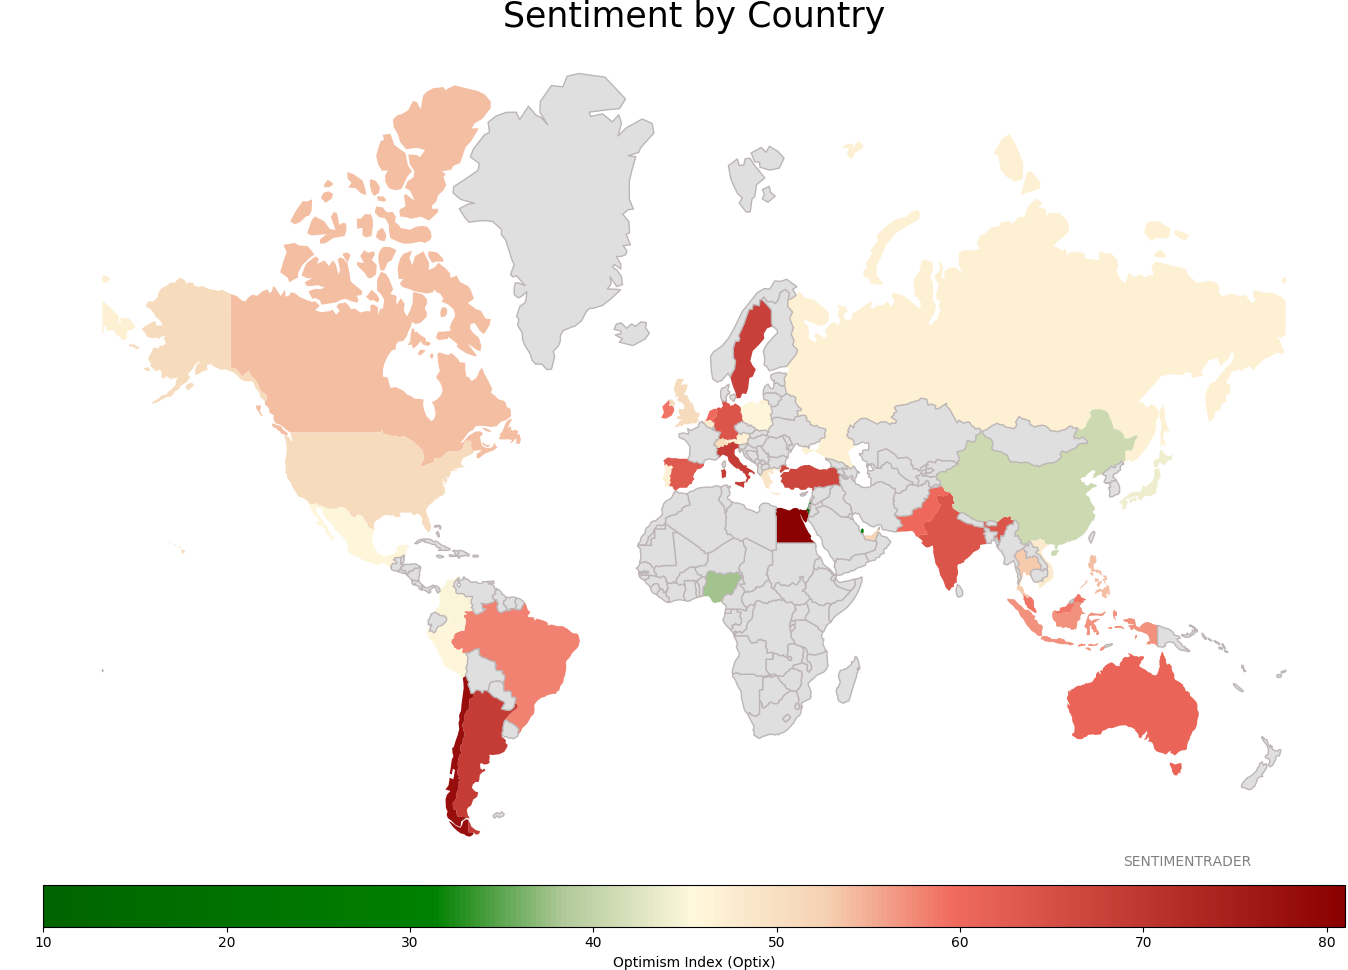
Sentiment Around The World
Optimism Index Thumbnails
|
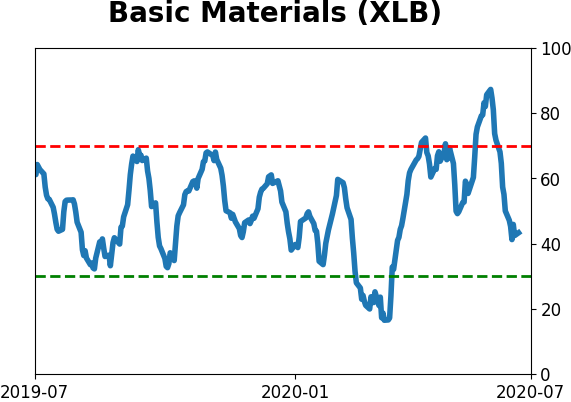
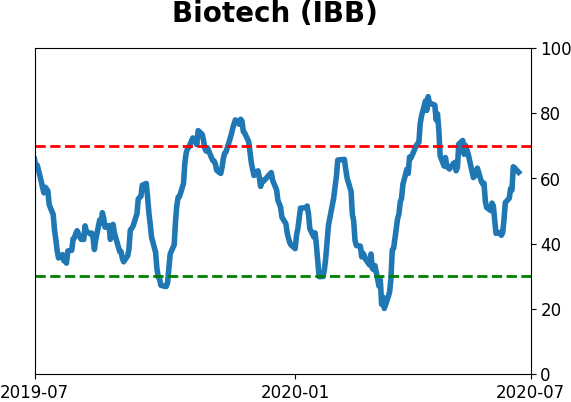
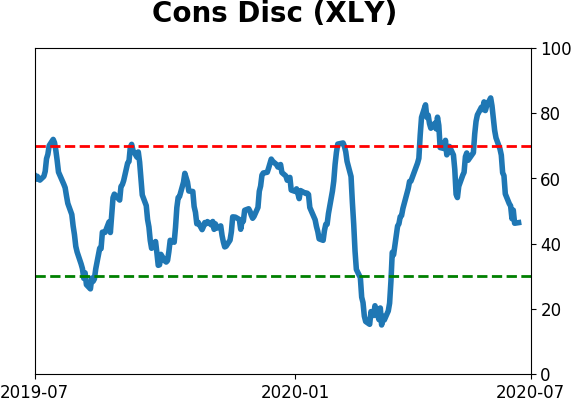
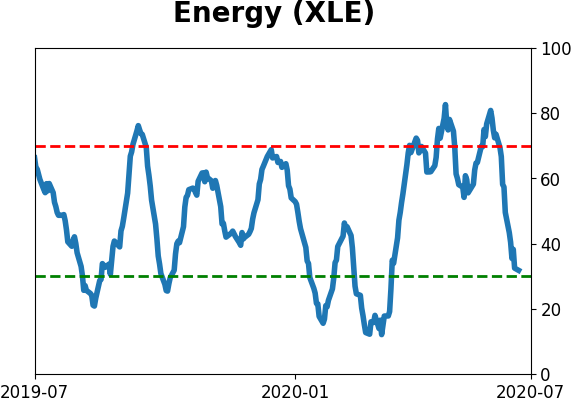
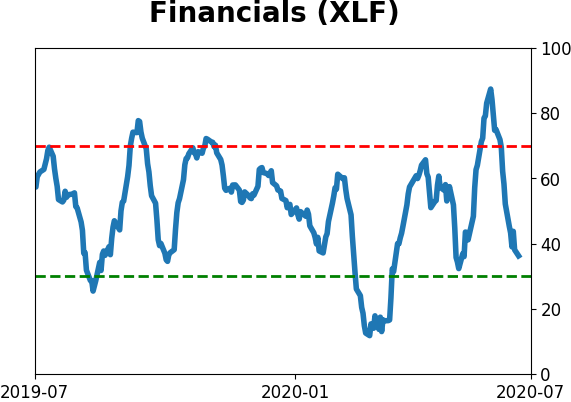
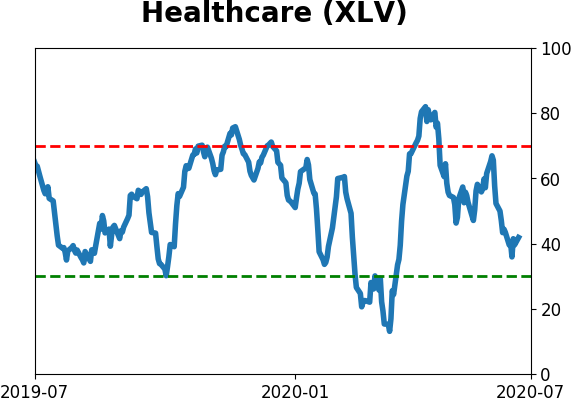
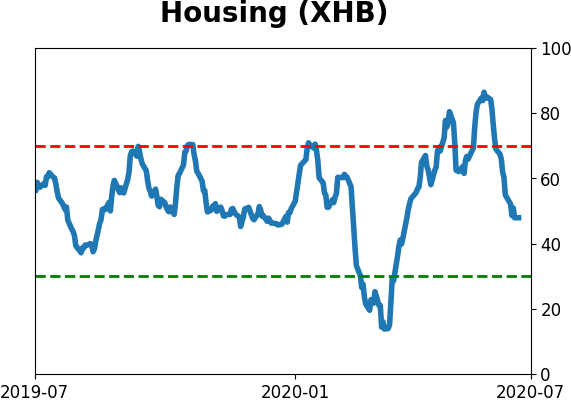
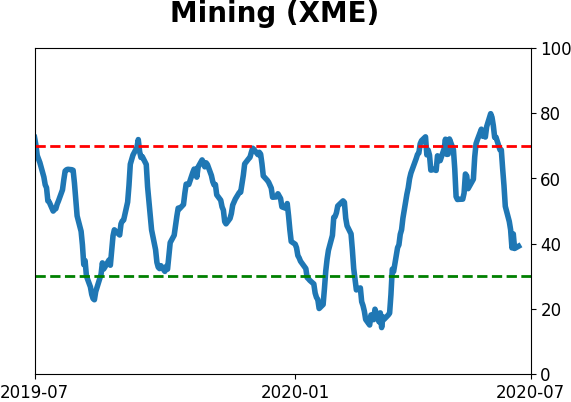
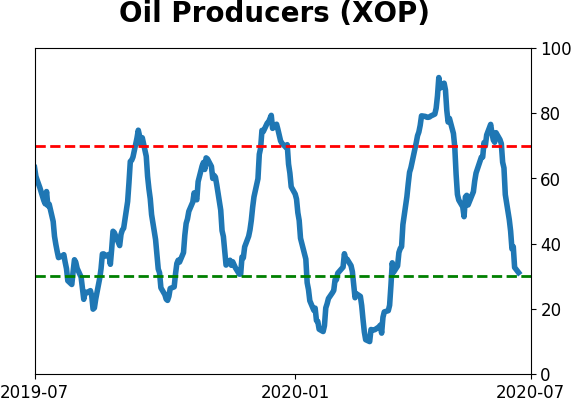
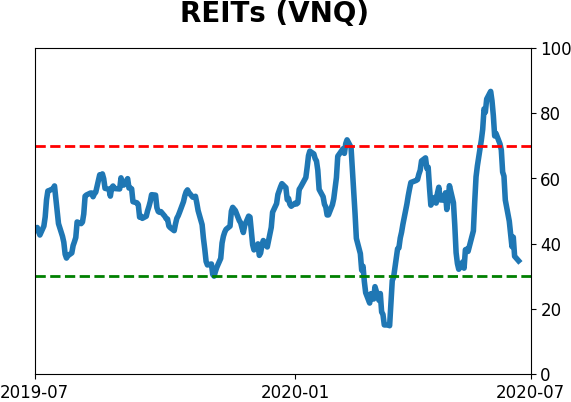
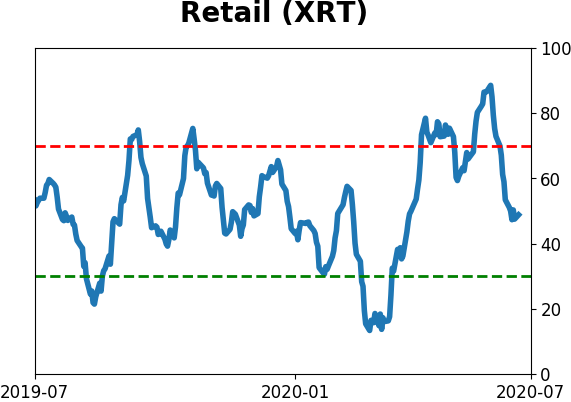
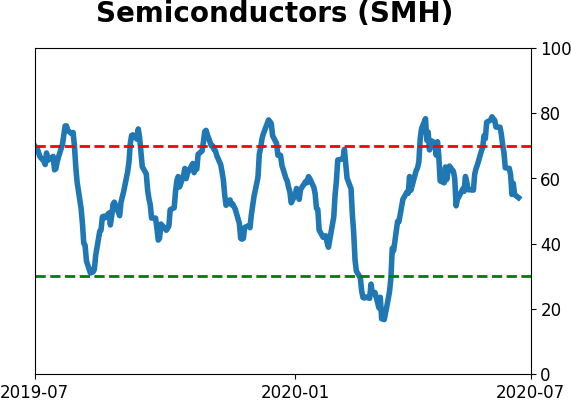
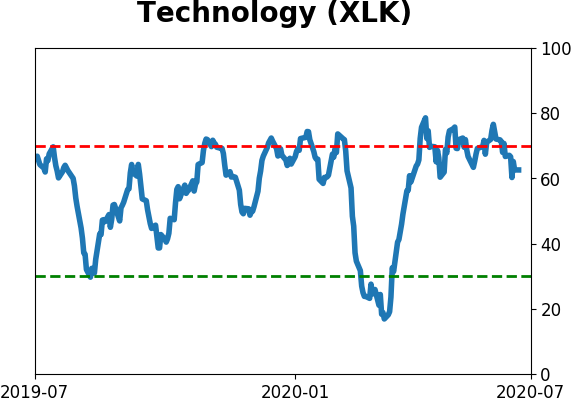
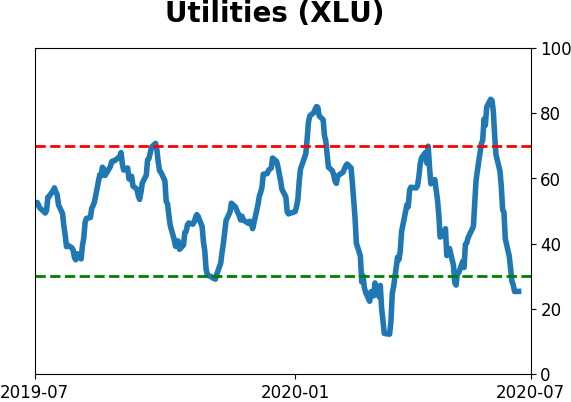
Sector ETF's - 10-Day Moving Average
|
|
|
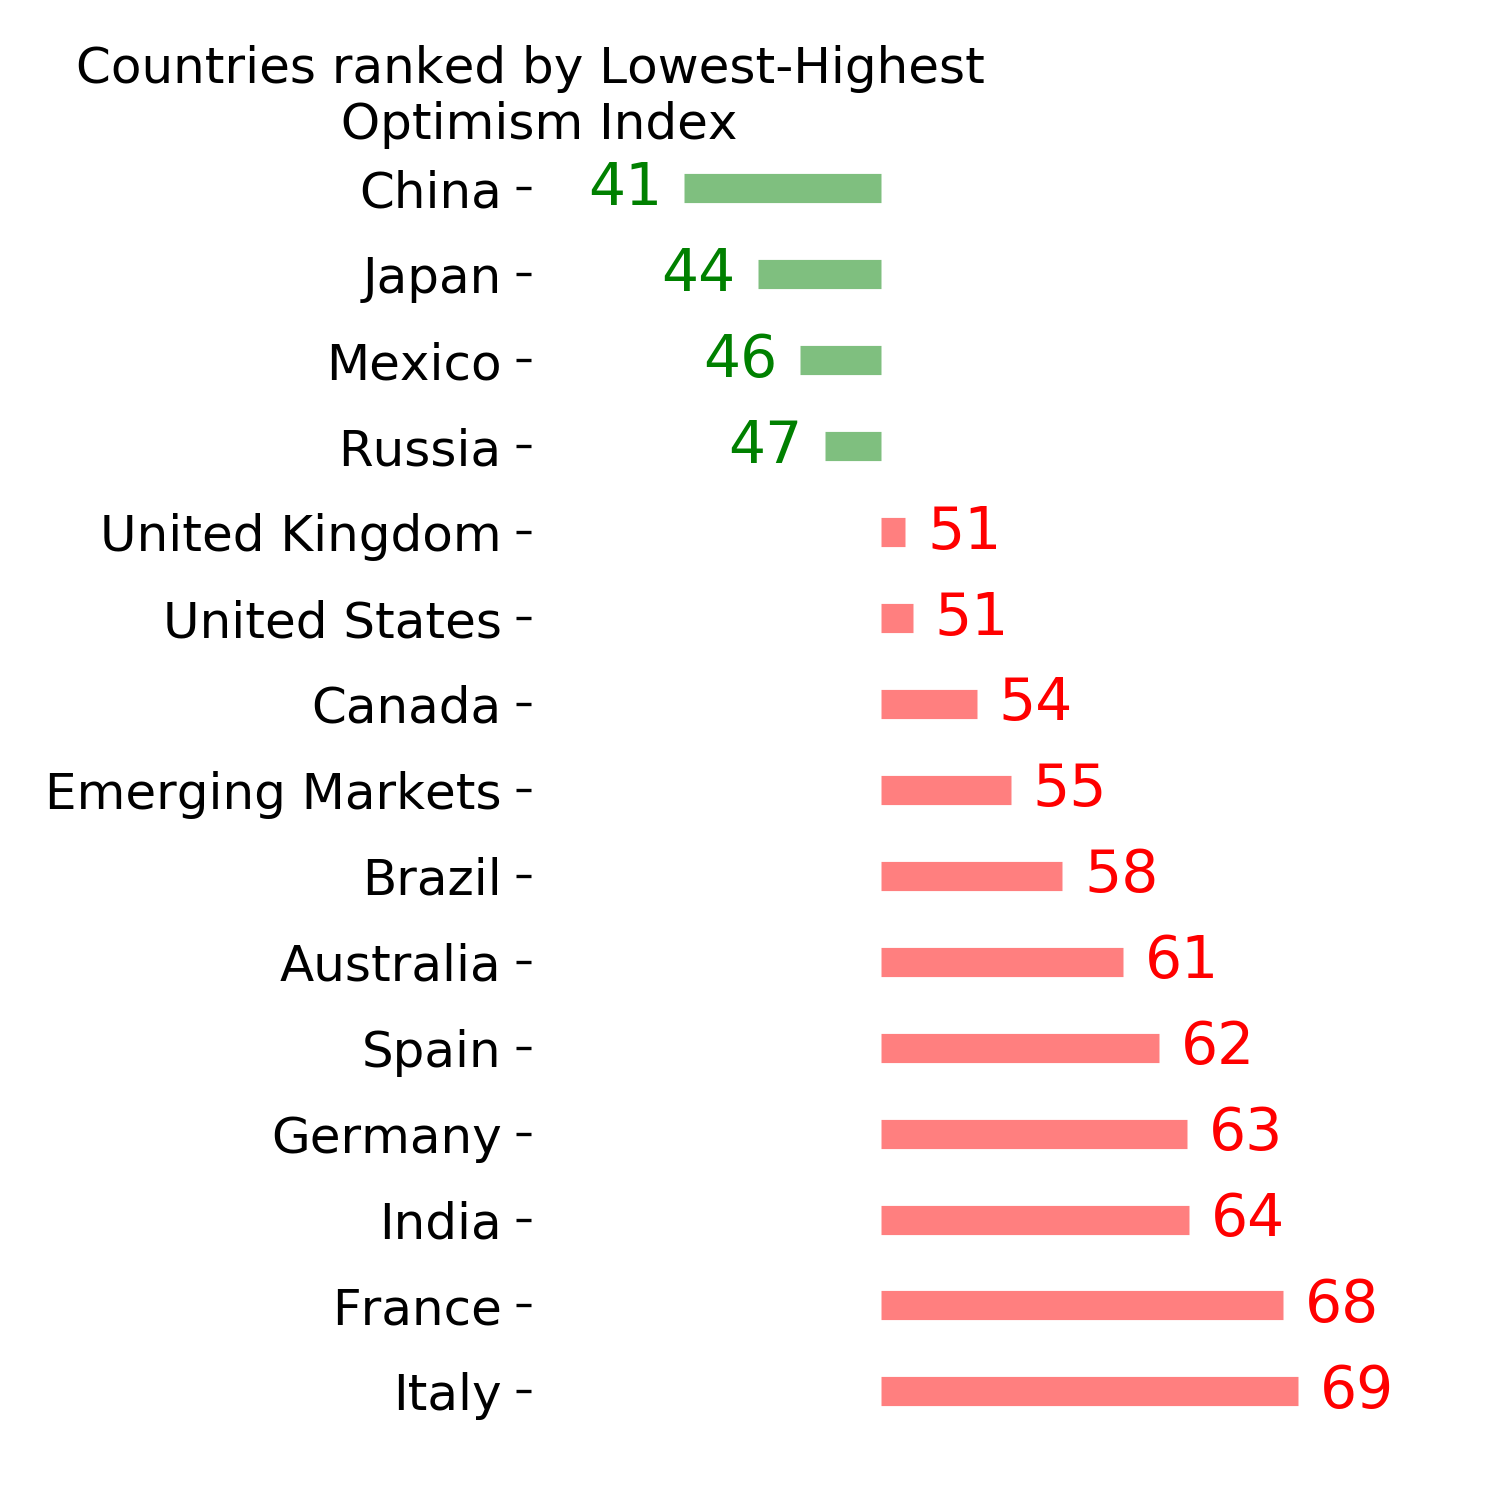
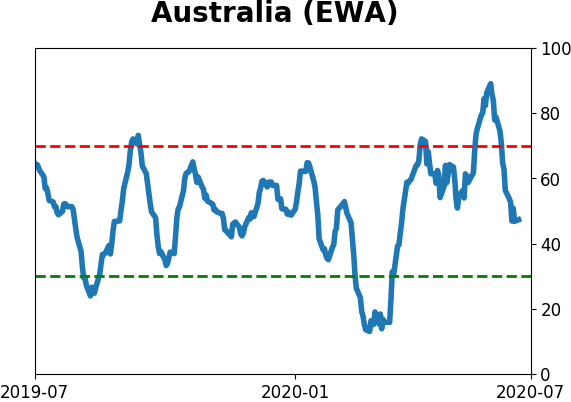
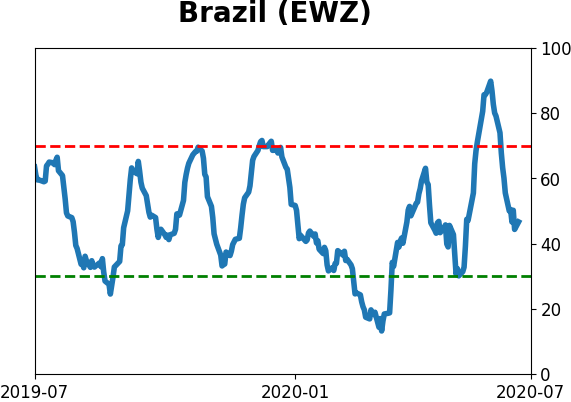
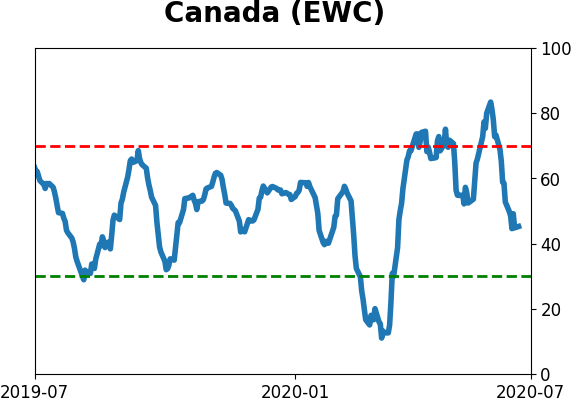
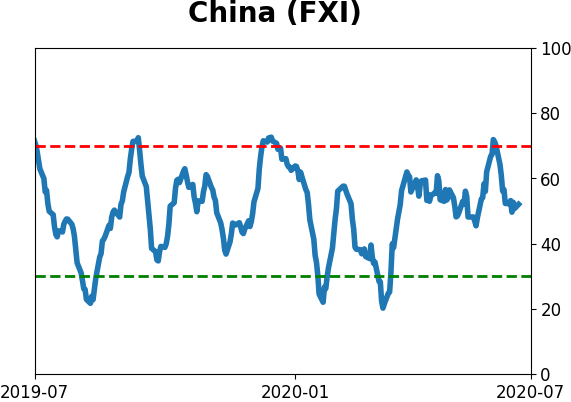
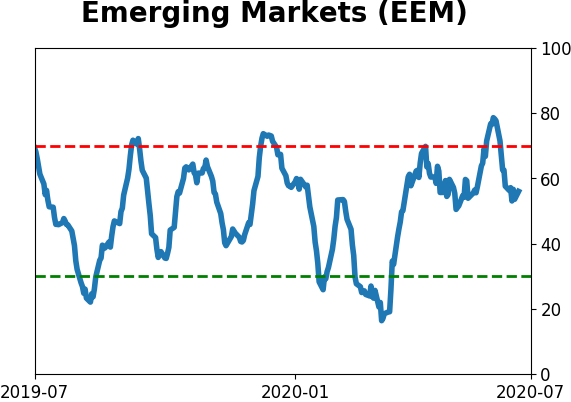
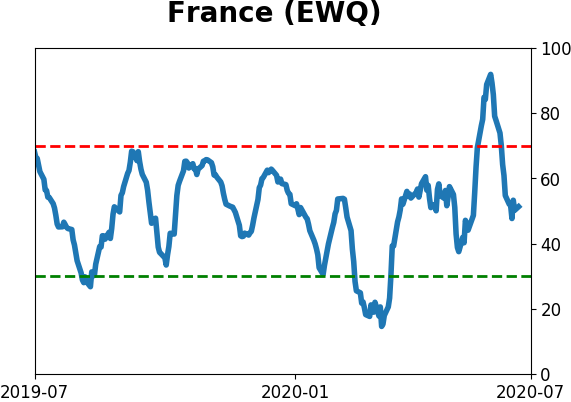
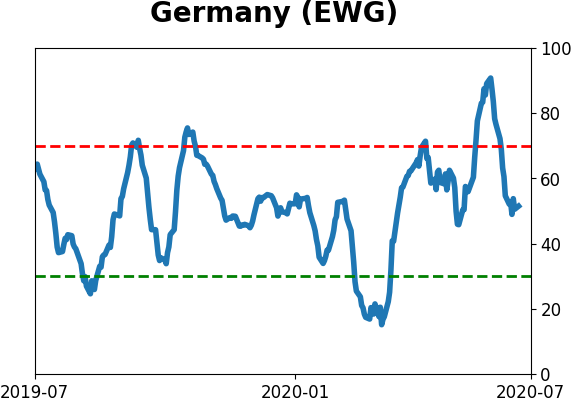
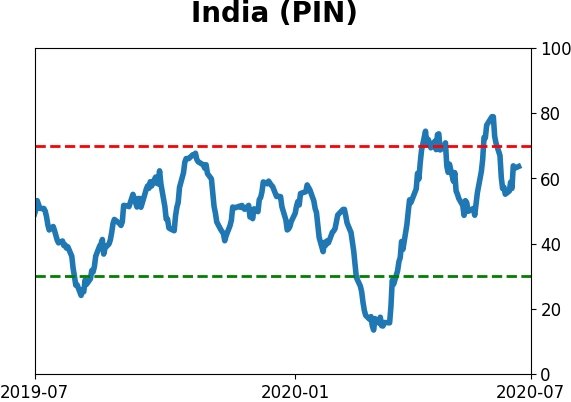
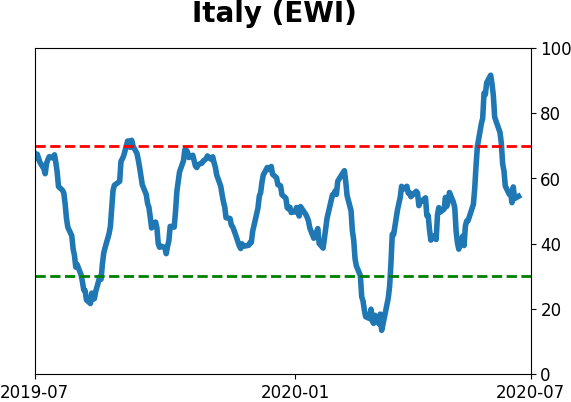
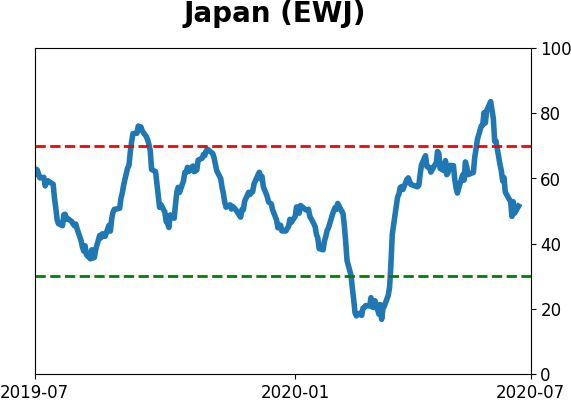
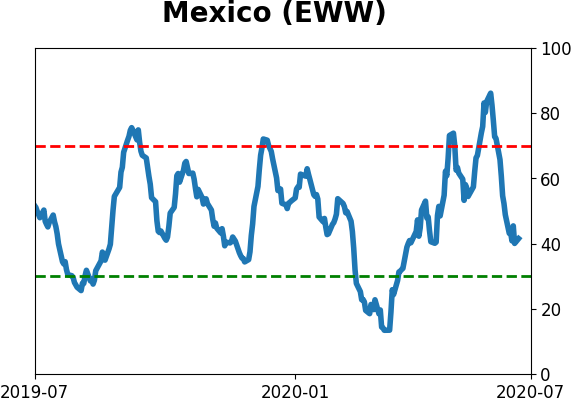
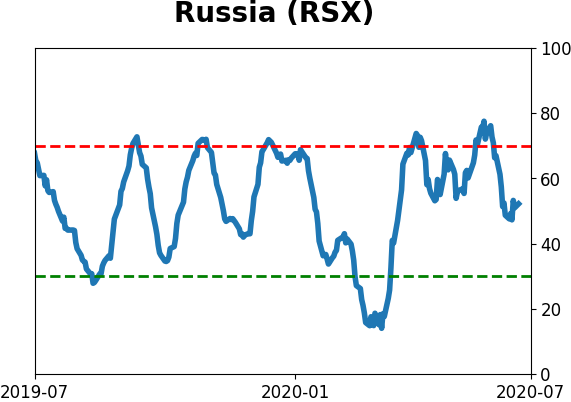
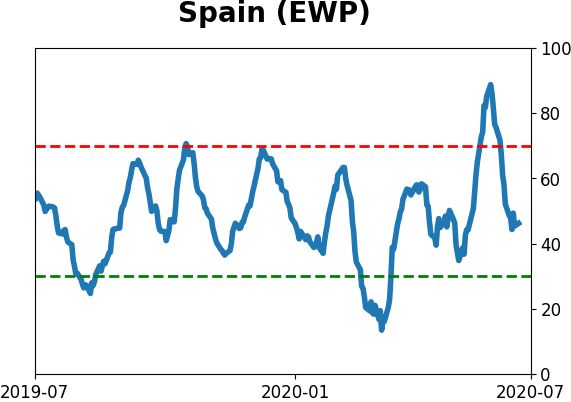
Country ETF's - 10-Day Moving Average
|
|
|
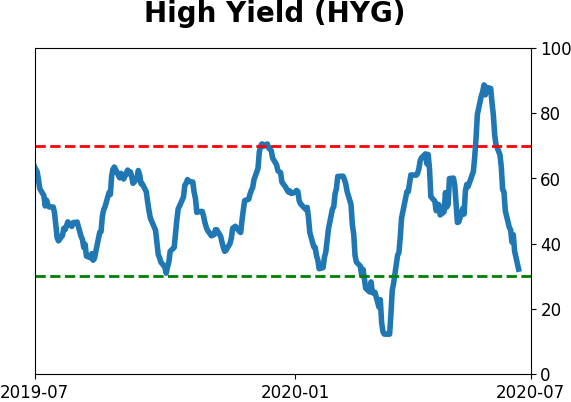
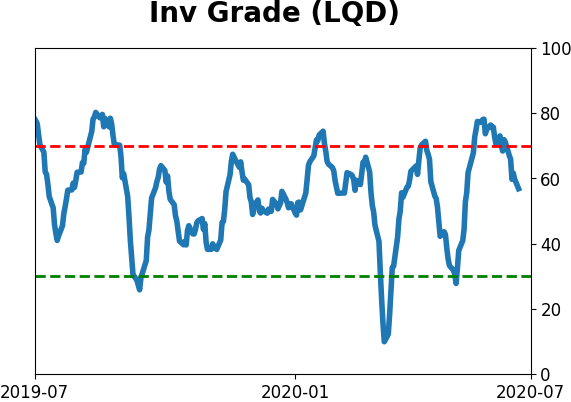
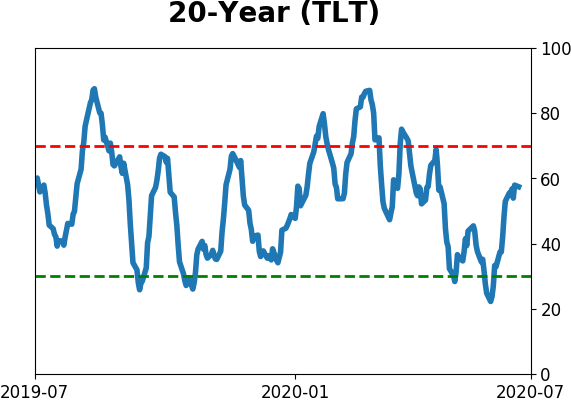
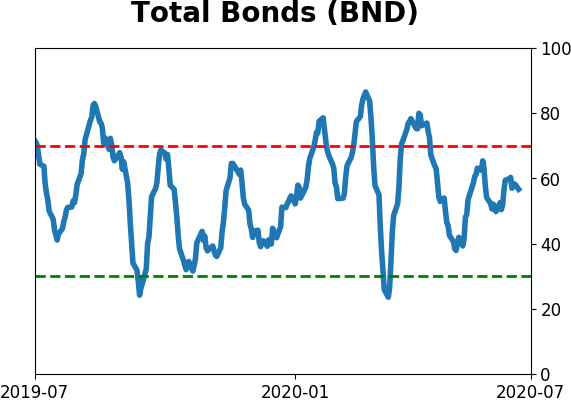
Bond ETF's - 10-Day Moving Average
|
|
|
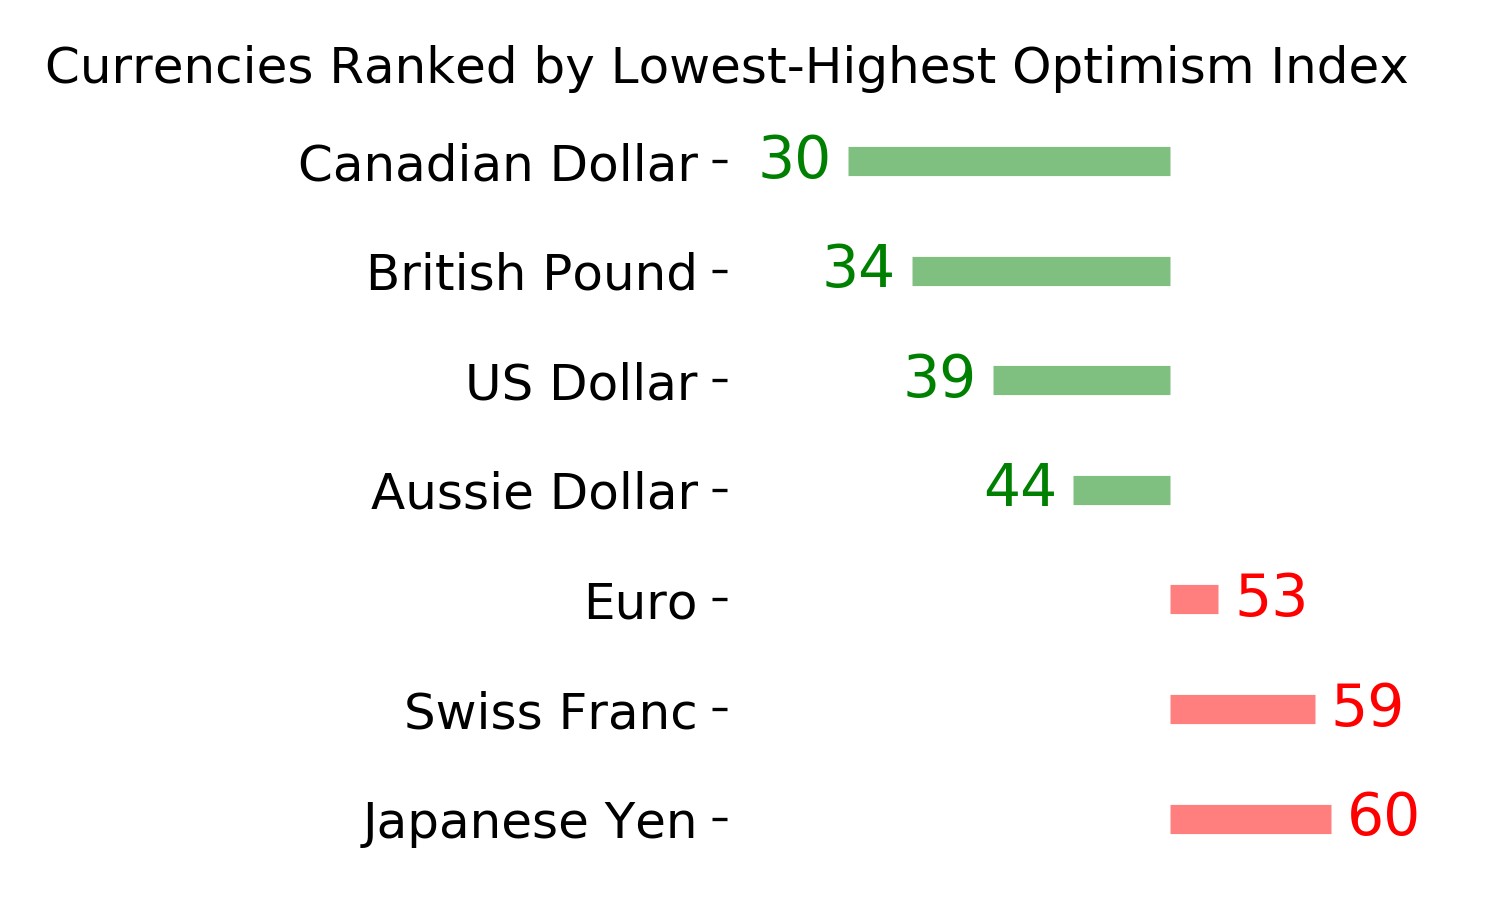
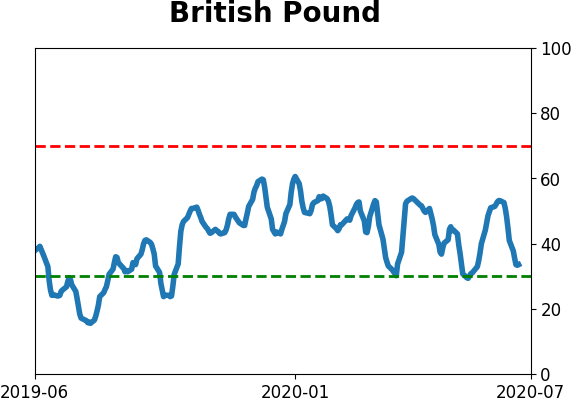
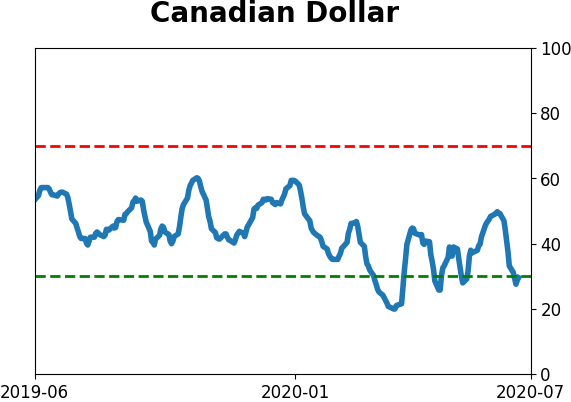
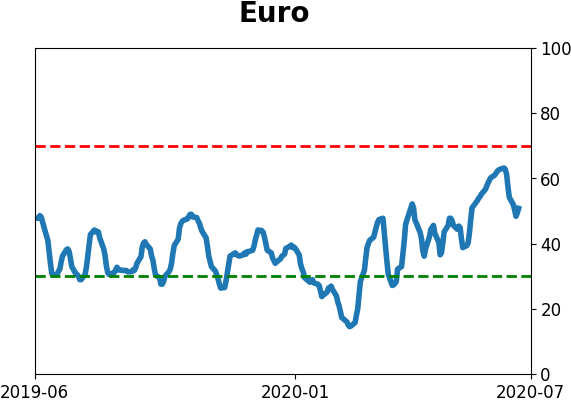
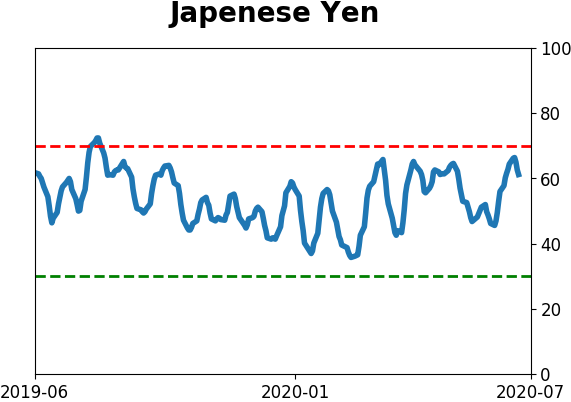
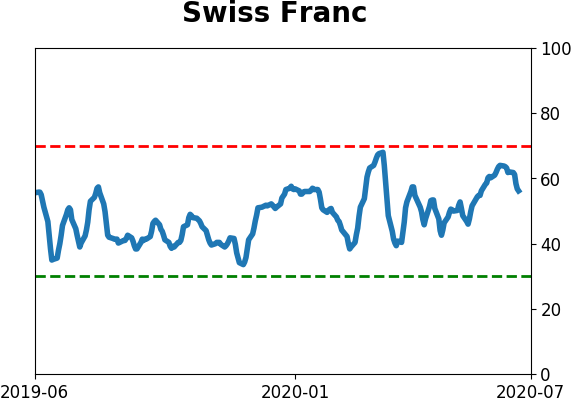
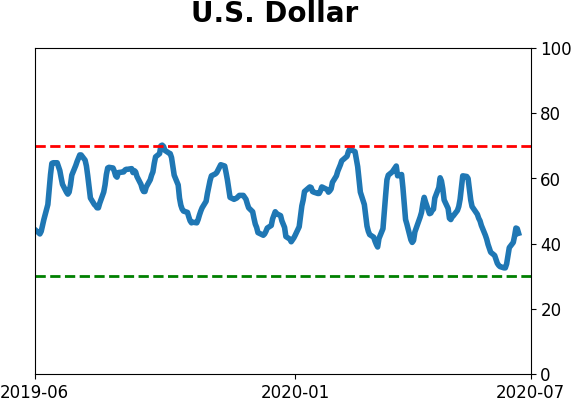
Currency ETF's - 5-Day Moving Average
|
|
|
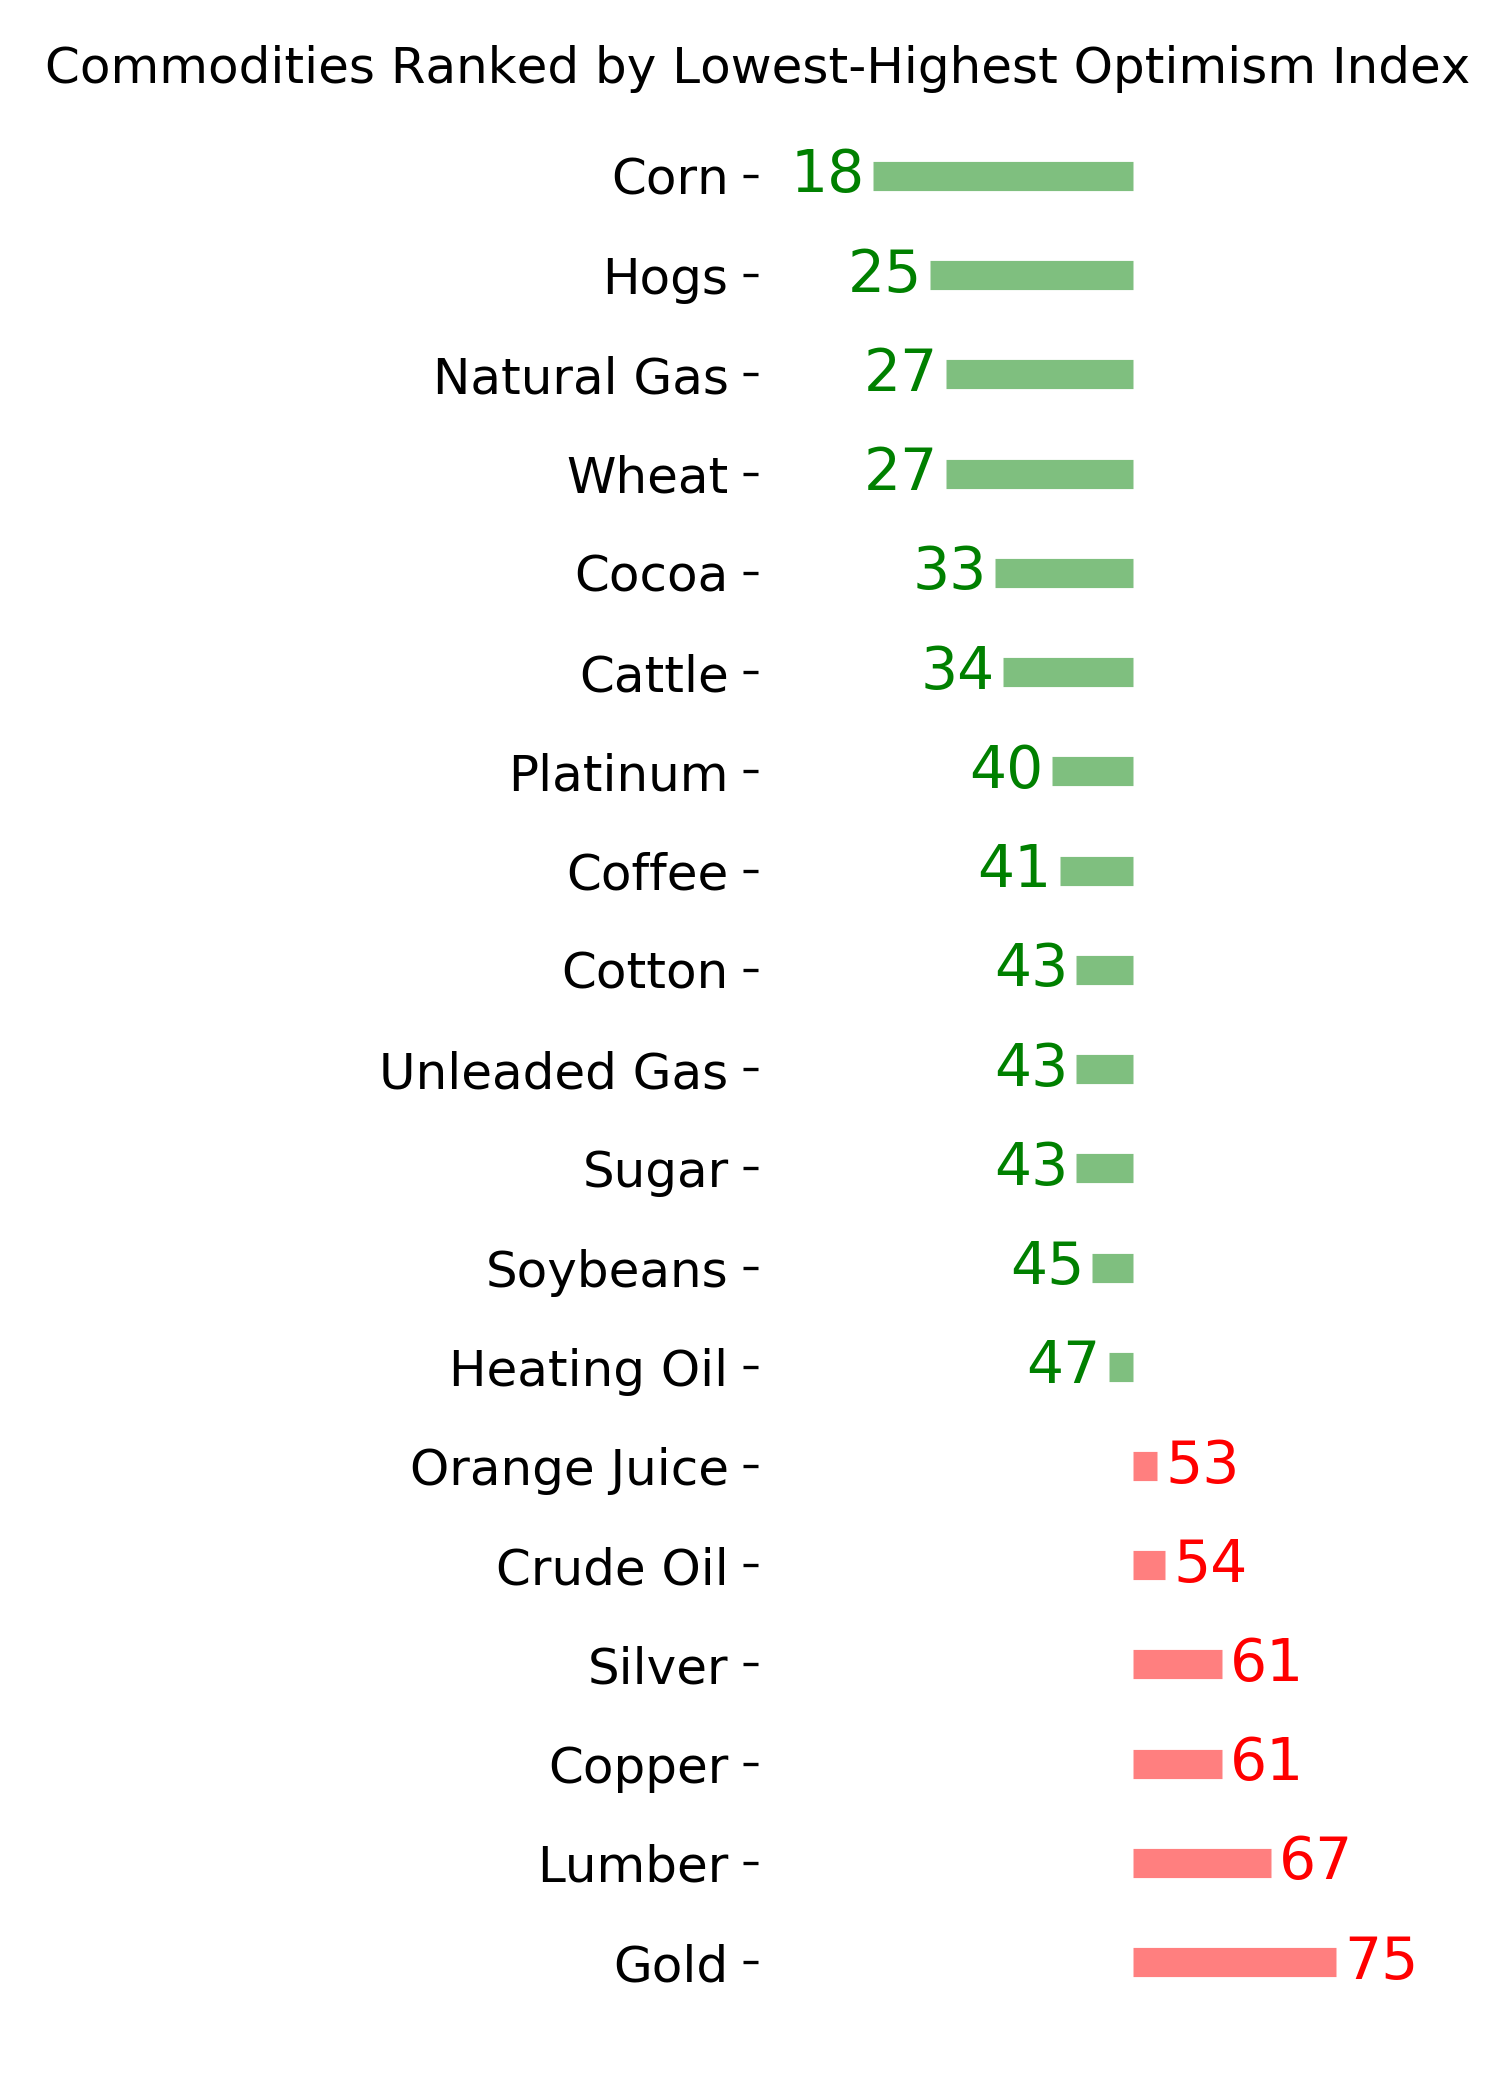
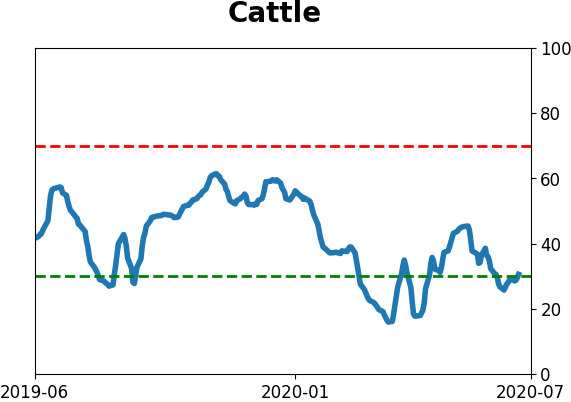
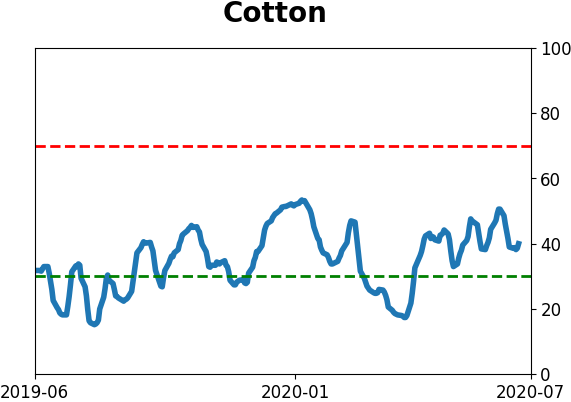
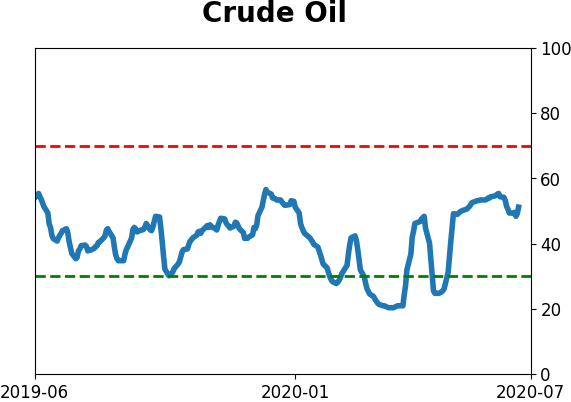
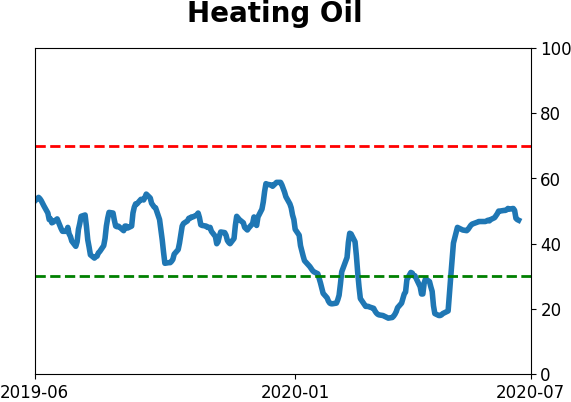
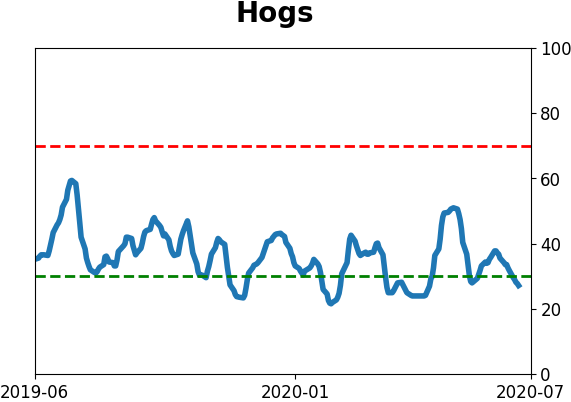
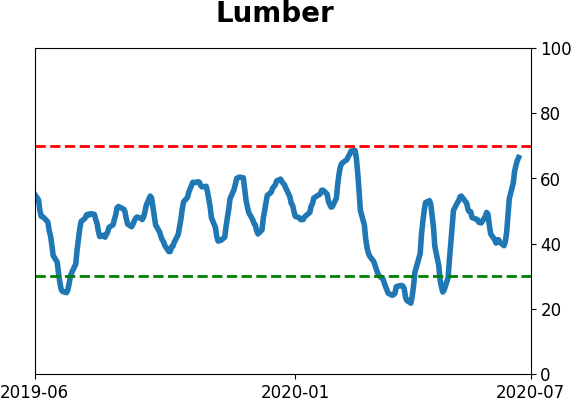
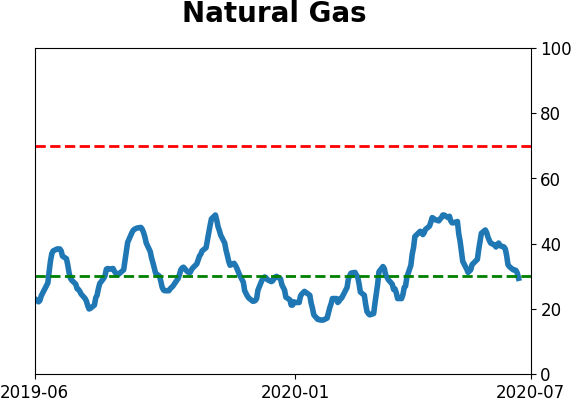
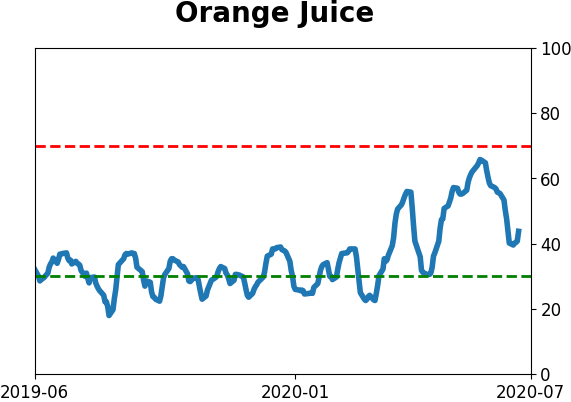
Commodity ETF's - 5-Day Moving Average
|
|