Headlines
|
|
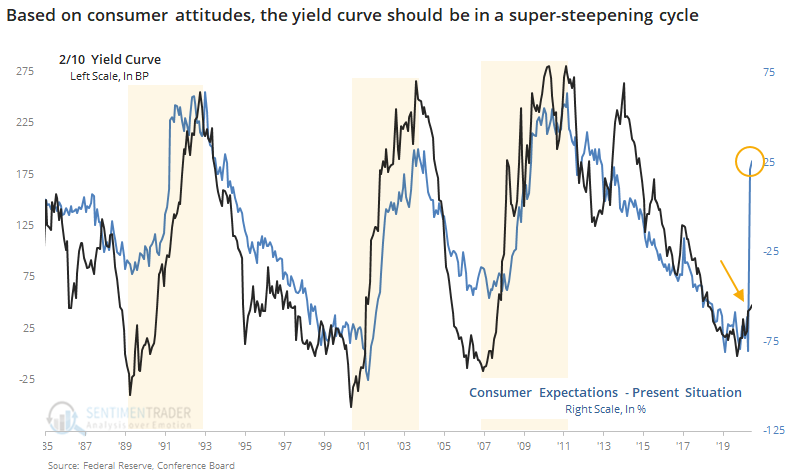
The impact of the yield curve's potential super-steepening cycle:
Based on consumer attitudes, it seems likely that the yield curve is in the midst of a long-term super steepening cycle. There have been four other cycles in the past 40 years, leading to mixed returns for stocks and most other assets, but good returns for bonds and some defensive sectors.
Newsletter writers return to optimism:
The Bull Ratio of newsletter writers in the I.I. survey has moved above 75% for the first time in months. Returning optimism has not been a good sell signal, though over the past decade it has led to more trouble than it did historically.
Individual investors are still apathetic: In contrast to newsletter writers and most other surveys, individuals in the AAII poll won't budge from their bearishness. That's what they're saying, not necessarily what they're doing. The Bull Ratio has been below 50% for 18 straight weeks, the 2nd-longest streak since its inception in 1986. It reached 22 straight weeks in December 1990. The 16-week average of the ratio has dropped below 40% for the first time since 2009, but it was exceptionally early as a contrary signal, first dipping below 40% in February 2008. We'll have a closer look at it on Friday to see if any sectors or factors stood out the previous times.
Bottom line: - Weight of evidence has been suggesting flat/lower stock prices short- to medium-term and higher prices long-term
- Indicators are showing high and declining optimism, as Dumb Money Confidence was recently near 80% with isolated signs of reckless speculation, during what appears to be an unhealthy market environment
- Active Studies show a heavy positive skew over the medium- to long-term; breadth thrusts and recoveries have an almost unblemished record at preceding higher prices over a 6-12 month time frame
- Signs of extremely skewed preference for tech stocks nearing exhaustion, especially relative to industrials and financials (here and here)
- Indicators and studies for other markets are mixed with no strong conclusion
|
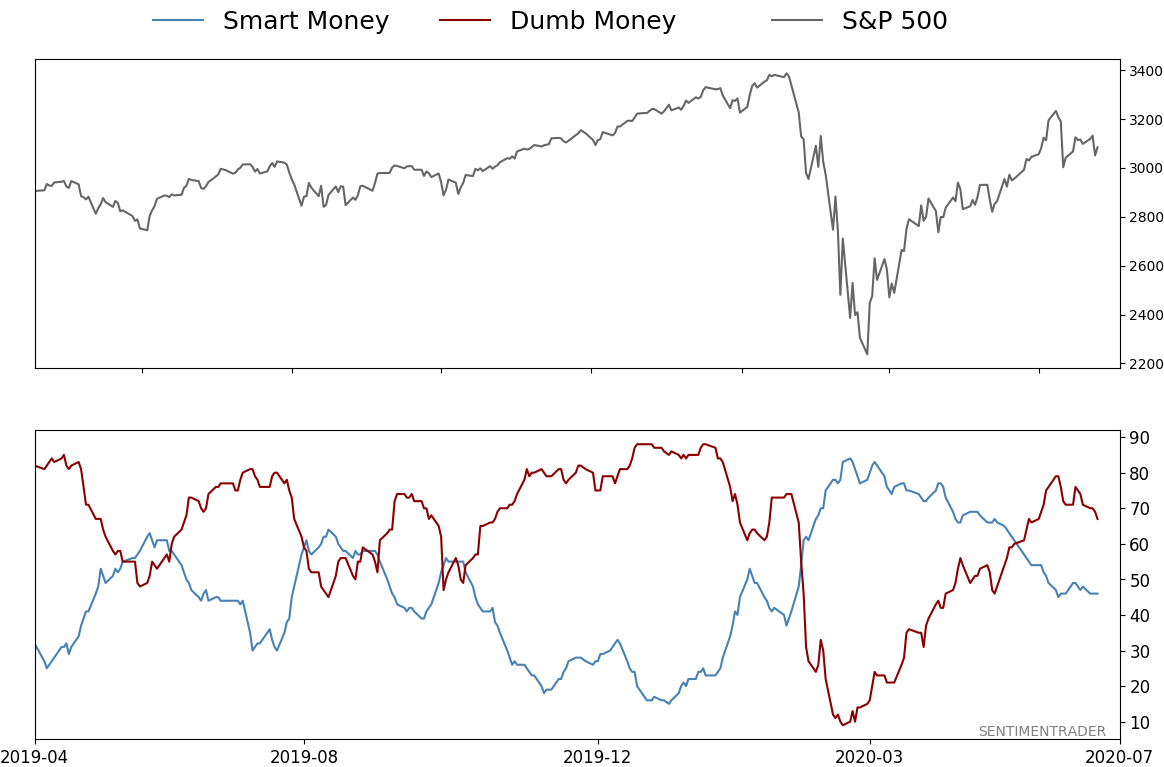
Smart / Dumb Money Confidence
|
Smart Money Confidence: 46%
Dumb Money Confidence: 67%
|
|
Risk Levels
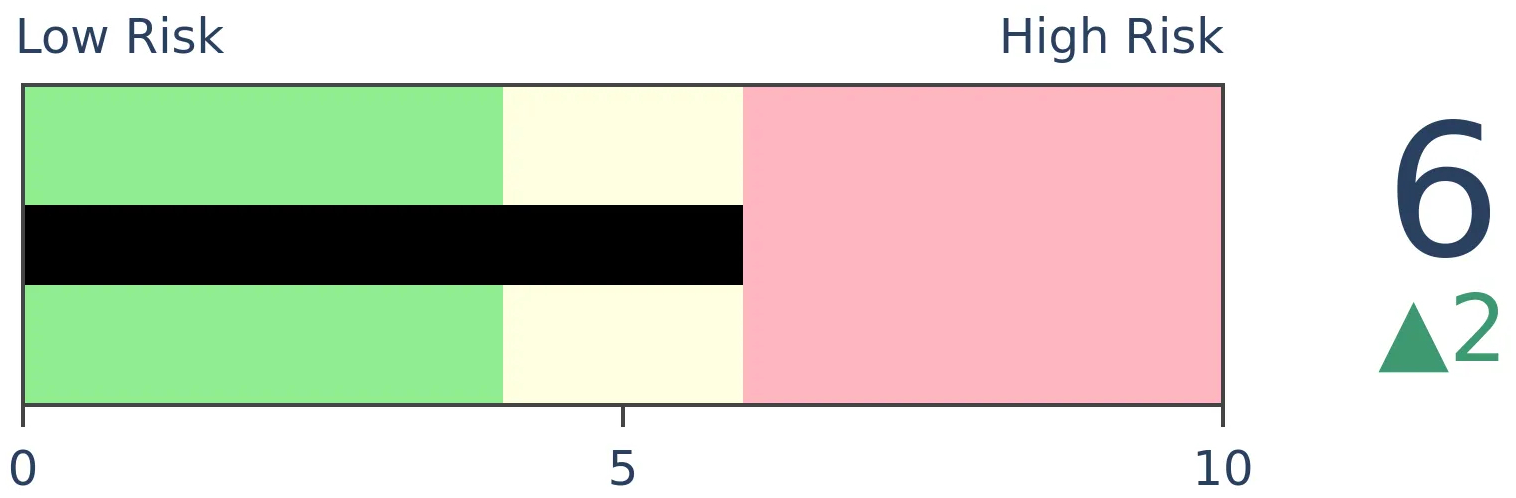
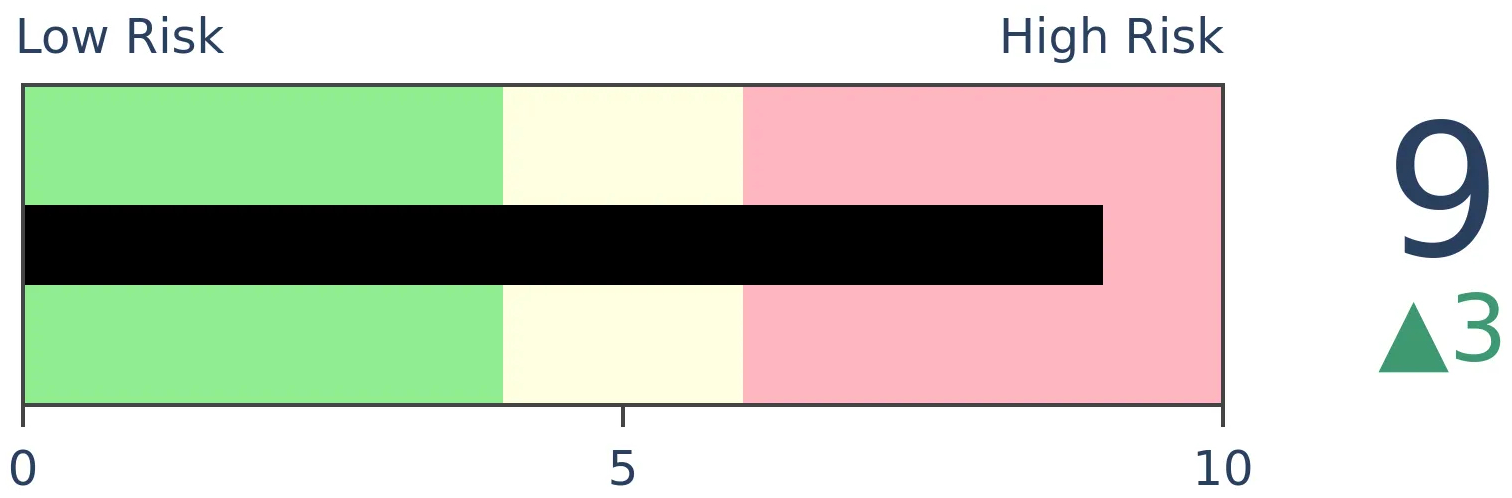
Stocks Short-Term
|
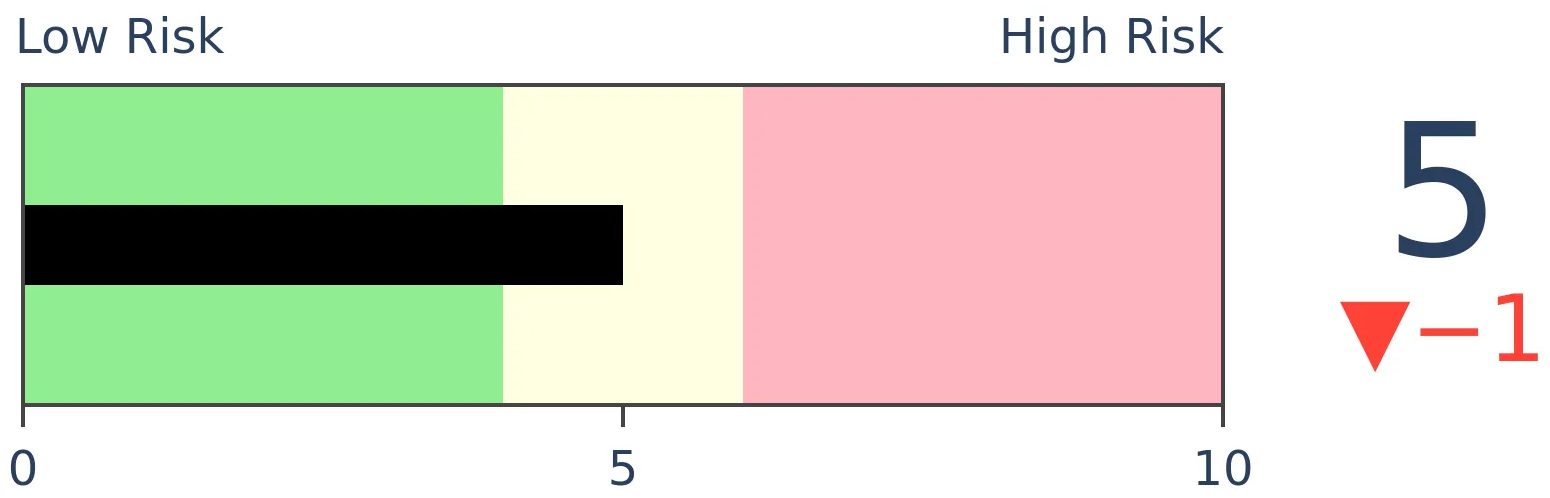
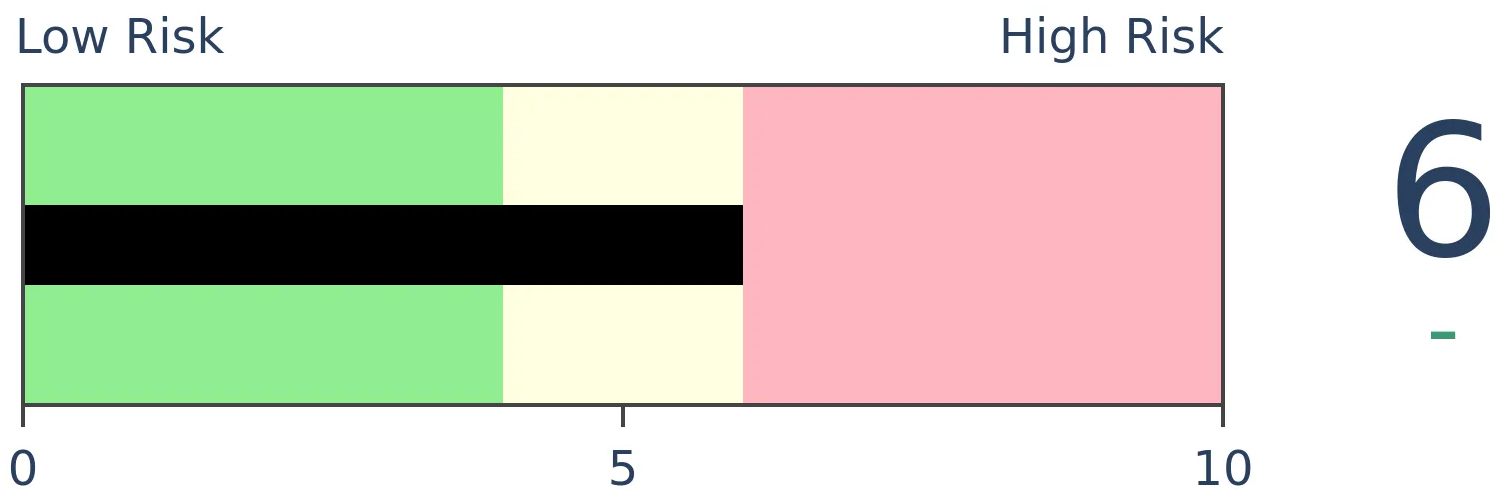
Stocks Medium-Term
|
|
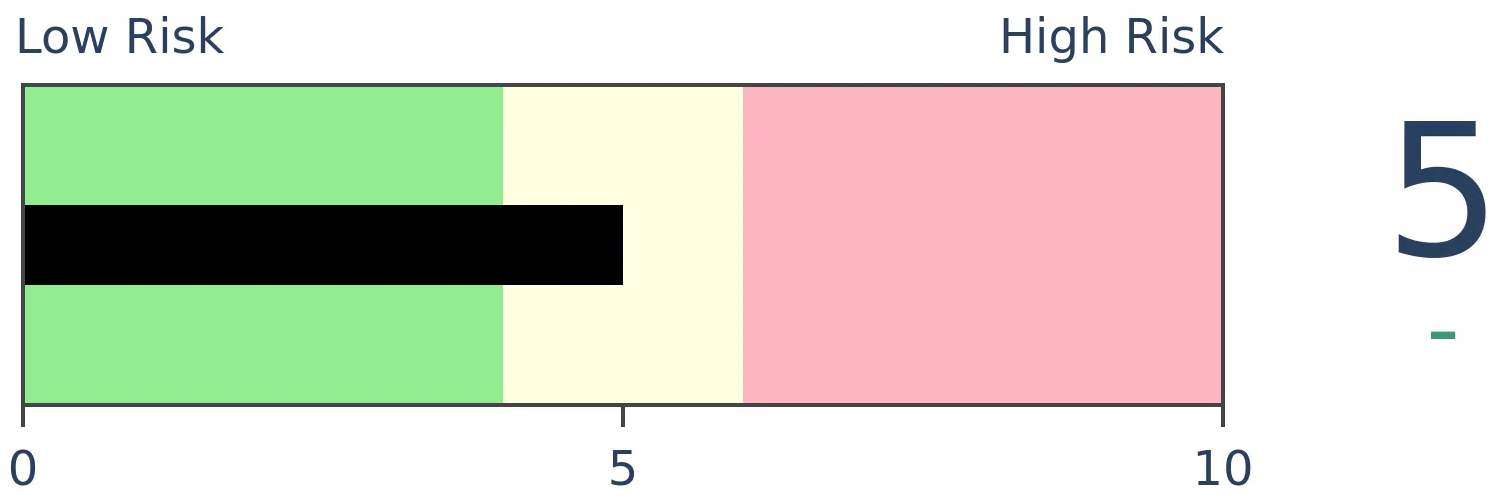
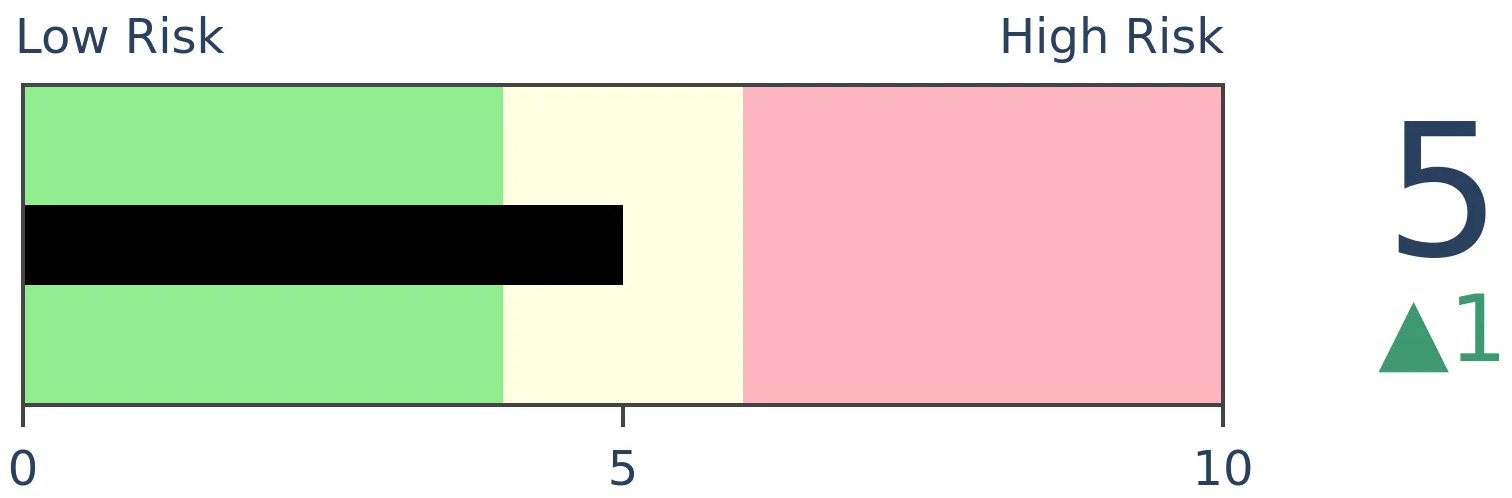
Bonds
|
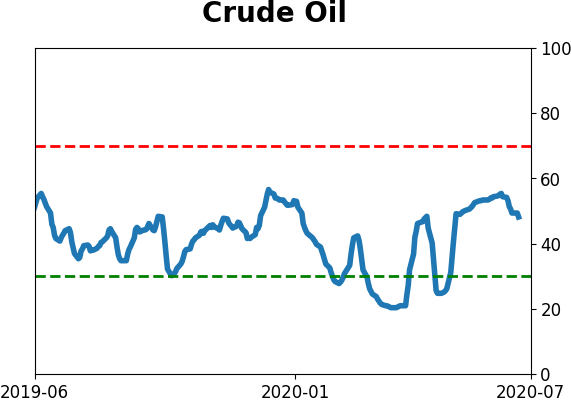
Crude Oil
|
|
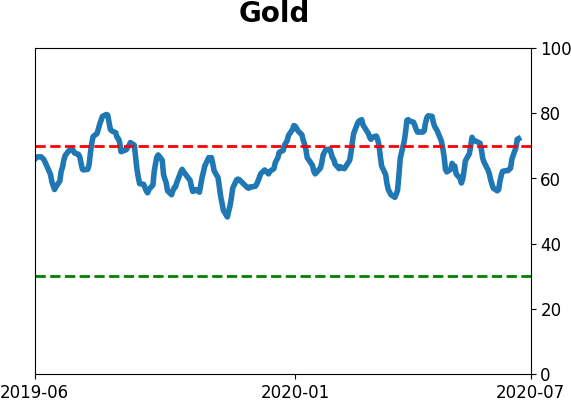
Gold
|
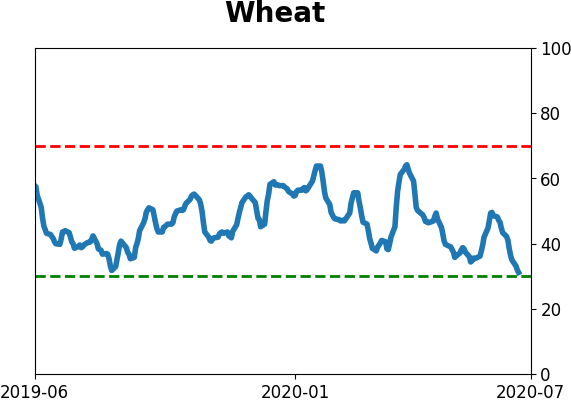
Agriculture
|
|
Research
BOTTOM LINE
Based on consumer attitudes, it seems likely that the yield curve is in the midst of a long-term super steepening cycle. There have been four other cycles in the past 40 years, leading to mixed returns for stocks and most other assets, but good returns for bonds and some defensive sectors.
FORECAST / TIMEFRAME
None
|
In recent notes, we've shown that U.S. consumers are increasingly confident about the future relative to the present. They feel that their current troubles are temporary and the economy will soon be growing again.
The Wall Street Journal on Wednesday showed that this difference in confidence based on time frames has had an extremely strong correlation to the yield curve.
Indeed it has, and it suggests that the 2/10 yield curve is in for a super-steepening cycle.
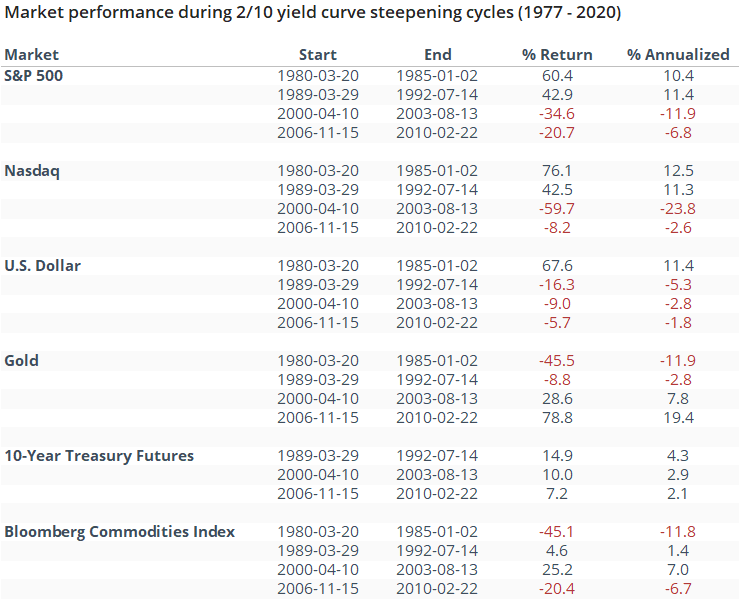
To see what that might mean for various markets, sectors, and factors, the tables below show their returns through the four major steepening cycles on a price-return and annualized basis, including dividends or inflation.
The first two cycles coincided with double-digit annualized gains in the S&P 500, while the last two were terrible times for stocks. The dollar declined during three out of the four cycles, while 10-year Treasury futures rallied.
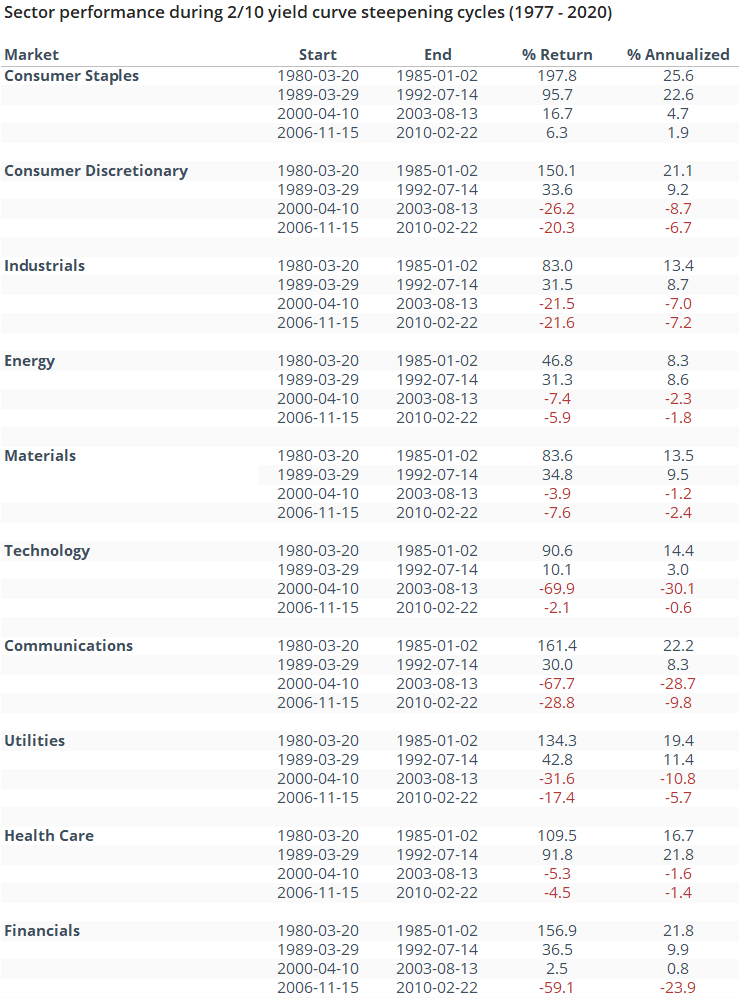
Among sectors, the only winner during all four cycles was consumer staples. People gotta eat and drink and smoke. The less-bad sectors included energy, health care, and financials. Technology stocks were volatile, along with communications.
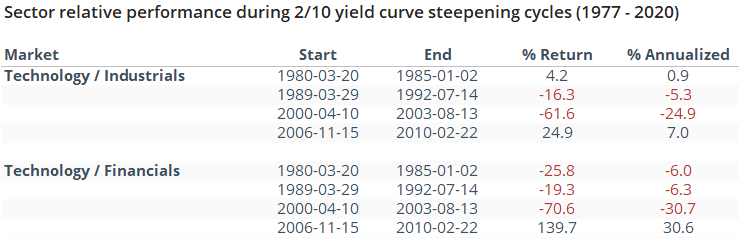
In recent notes (here and here), we've seen how far technology has outpaced industrial and financial stocks. If we look at the ratio of tech to those two sectors during the four cycles, the only one when tech meaningfully outpaced them was during the last one.
For factors, there was no clear winner. All of them show two losses and two gains.
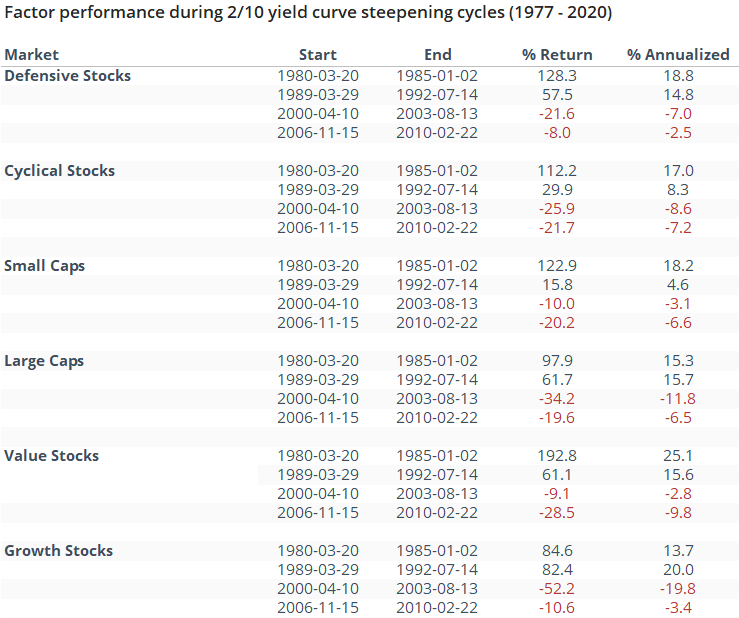
The table below shows ratios between the factors, to see if there was any pattern to what type of stock did better during these cycles.
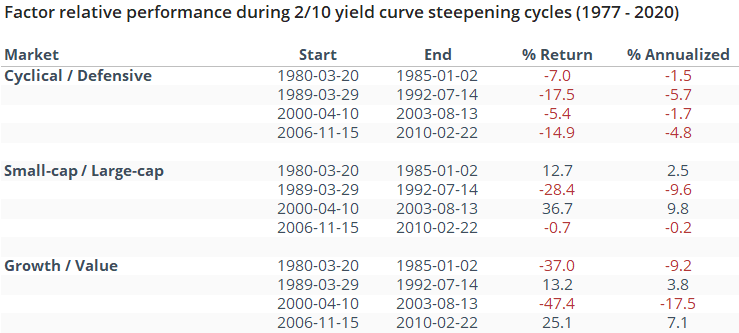
Cyclical stocks underperformed defensive ones during all four cycles, which isn't a huge surprise given that consumer staples was the only sector to show a positive return all four times.
We're dealing with a tiny sample size, and as always this time could be different. With a small sample, the precedents need to be extremely consistent to have even a small chance that it could tell us something. From the table, about the only suggestion we can make is that the chance we're in a super-steepening cycle has increased, and defensive stocks (namely consumer staples) are more likely to outperform in the years ahead.
BOTTOM LINE
The Bull Ratio of newsletter writers in the I.I. survey has moved above 75% for the first time in months. Returning optimism has not been a good sell signal, though over the past decade it has led to more trouble than it did historically.
FORECAST / TIMEFRAME
None
|
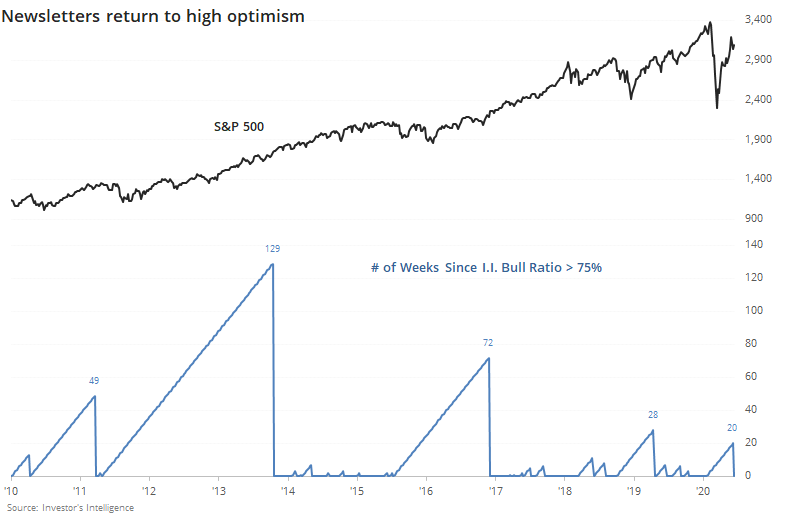
Newsletter writers have seen the rise in speculation among options traders, Robinhood users, and Wall Street analysts, and don't want to get left behind. Not being fully invested in a bull market leads to an increase in cancellations - nobody wants to see their neighbor doing better than they are.
The latest Investor's Intelligence survey showed three times as many bullish newsletters as bearish ones, meaning a Bull Ratio (Bulls / (Bulls + Bears)) greater than 75%. This is the first week in five months that there were so many bulls relative to bears, ending one of the longer streaks of "not optimism" over the past decade.
When long streaks with a Bull Ratio below 75% finally ended and included at least one week with more bears than bulls, it was mostly a good sign. There was some volatility over the medium-term, with more consistency longer-term. Over the next year, there were only two losses, and they were both small.
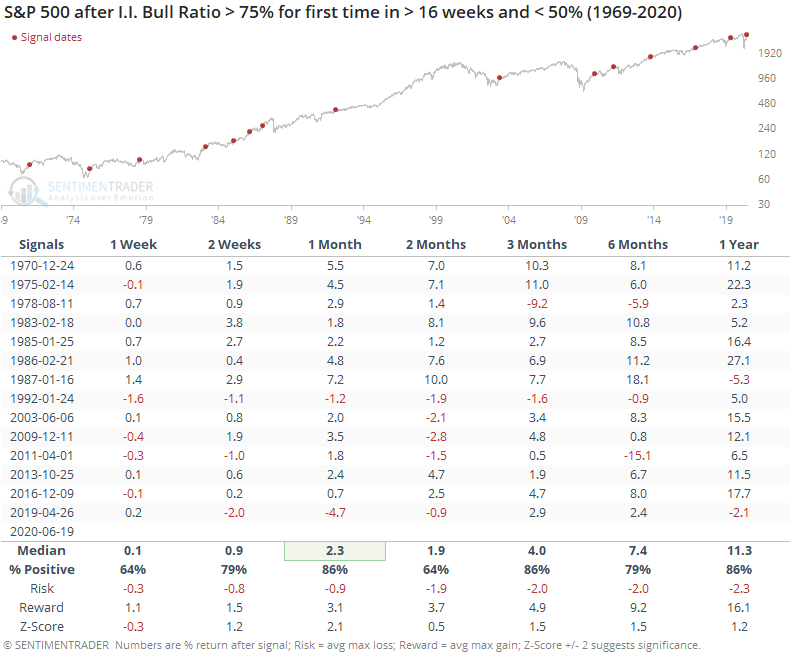
The most positive medium-term returns came in previous decades. More recently, stocks have tended to back off after optimism returned.
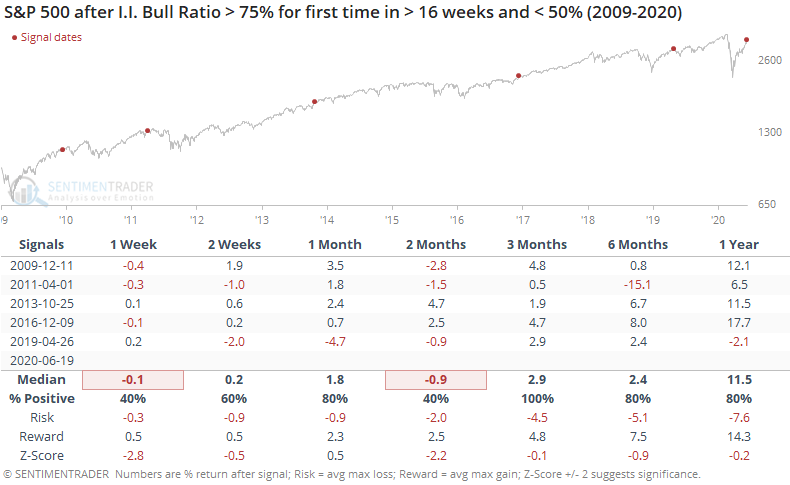
Over the next 2-3 months, the S&P either declined or showed a small gain, The biggest exception was late 2016, which showed a small gain a month later then built on that during the mo-mo market of 2017. In 2013, the S&P rallied strongly shorter-term, then gave quite a bit of that back 2-3 months later before rallying again.
Returning optimism is a good sign for stocks, as long as it's not extreme. The Investor's Intelligence data is just bordering on that. It's not extreme enough to be an outright negative, especially when it's the first reading after a period of pessimism. It's a mild concern that over the past decade, returning optimism led to a pause in the rally over the next 2-3 months.
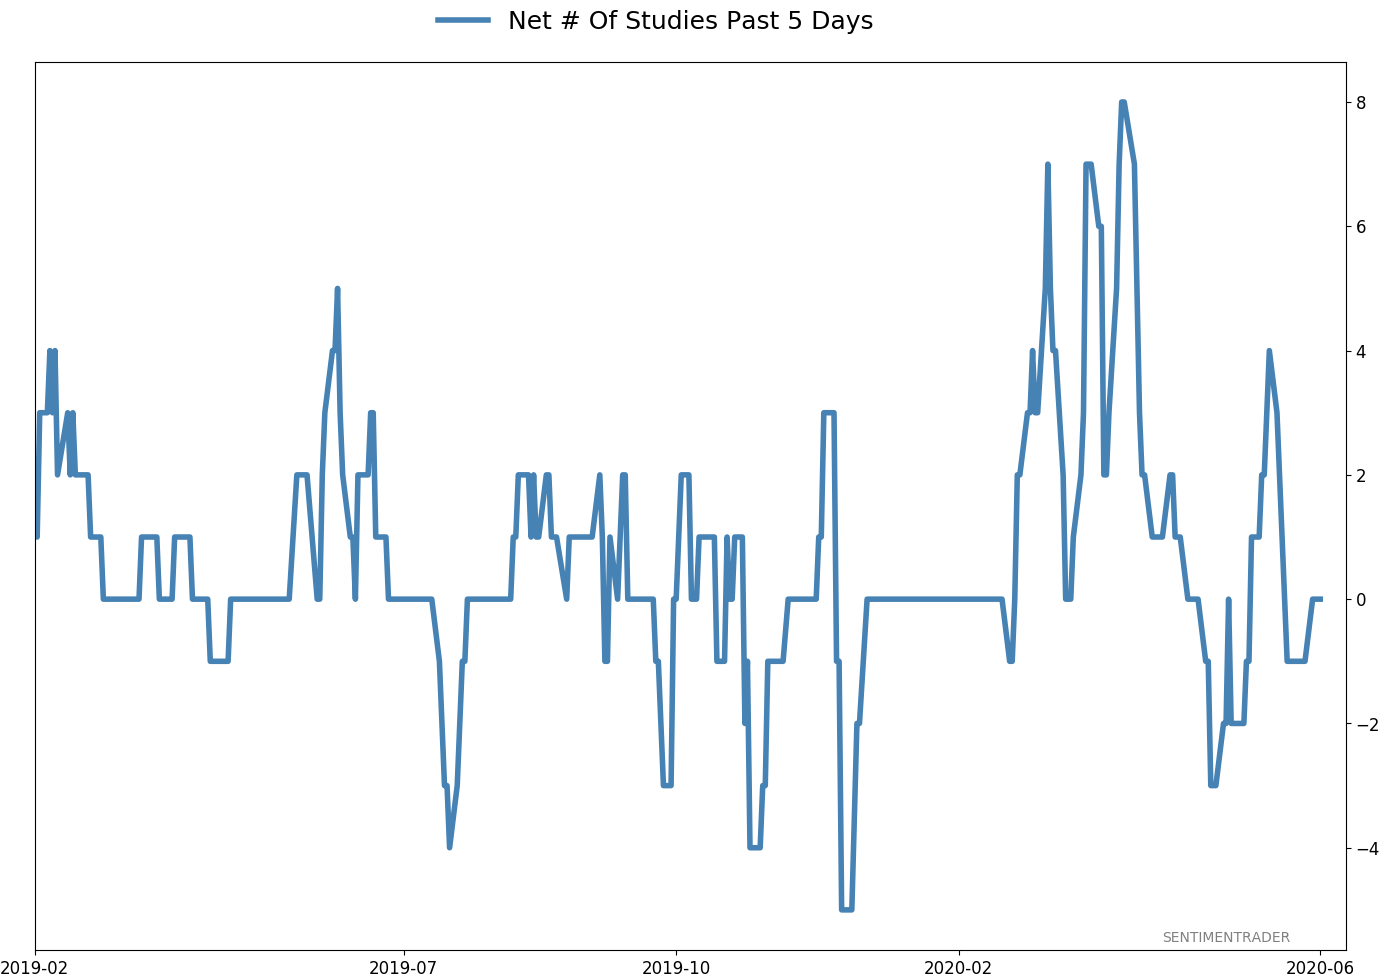
Active Studies
| Time Frame | Bullish | Bearish | | Short-Term | 0 | 1 | | Medium-Term | 8 | 6 | | Long-Term | 40 | 1 |
|
Indicators at Extremes
Portfolio
| Position | Weight % | Added / Reduced | Date | | Stocks | 29.8 | Reduced 9.1% | 2020-06-11 | | Bonds | 0.0 | Reduced 6.7% | 2020-02-28 | | Commodities | 5.2 | Added 2.4%
| 2020-02-28 | | Precious Metals | 0.0 | Reduced 3.6% | 2020-02-28 | | Special Situations | 0.0 | Reduced 31.9% | 2020-03-17 | | Cash | 65.0 | | |
|
Updates (Changes made today are underlined)
In the first months of the year, we saw manic trading activity. From big jumps in specific stocks to historic highs in retail trading activity to record highs in household confidence to almost unbelievable confidence among options traders. All of that came amid a market where the average stock couldn't keep up with their indexes. There were signs of waning momentum in stocks underlying the major averages, which started triggering technical warning signs in late January. After stocks bottomed on the 23rd, they enjoyed a historic buying thrust and retraced a larger amount of the decline than "just a bear market rally" tends to. Those thrusts are the most encouraging sign we've seen in years. Through early June, we were still seeing thrusts that have led to recoveries in longer-term breadth metrics. The longer-term prospects for stocks (6-12 months) still look decent given the above. On a short- to medium-term basis, it was getting harder to make that case. Dumb Money Confidence spiked and there were multiple signs of a historic level of speculation. This is likely the lowest I will go given what I still consider to be compelling positives over a longer time frame. There is not a slam-dunk case to be made for either direction, so it will seem like a mistake whether stocks keep dropping (why didn't I sell more?) or if they turn and head higher (why did I let short-term concerns prevail?). After nearly three decades of trading, I've learned to let go of the idea of perfection.
RETURN YTD: -5.9% 2019: 12.6%, 2018: 0.6%, 2017: 3.8%, 2016: 17.1%, 2015: 9.2%, 2014: 14.5%, 2013: 2.2%, 2012: 10.8%, 2011: 16.5%, 2010: 15.3%, 2009: 23.9%, 2008: 16.2%, 2007: 7.8%
|
|
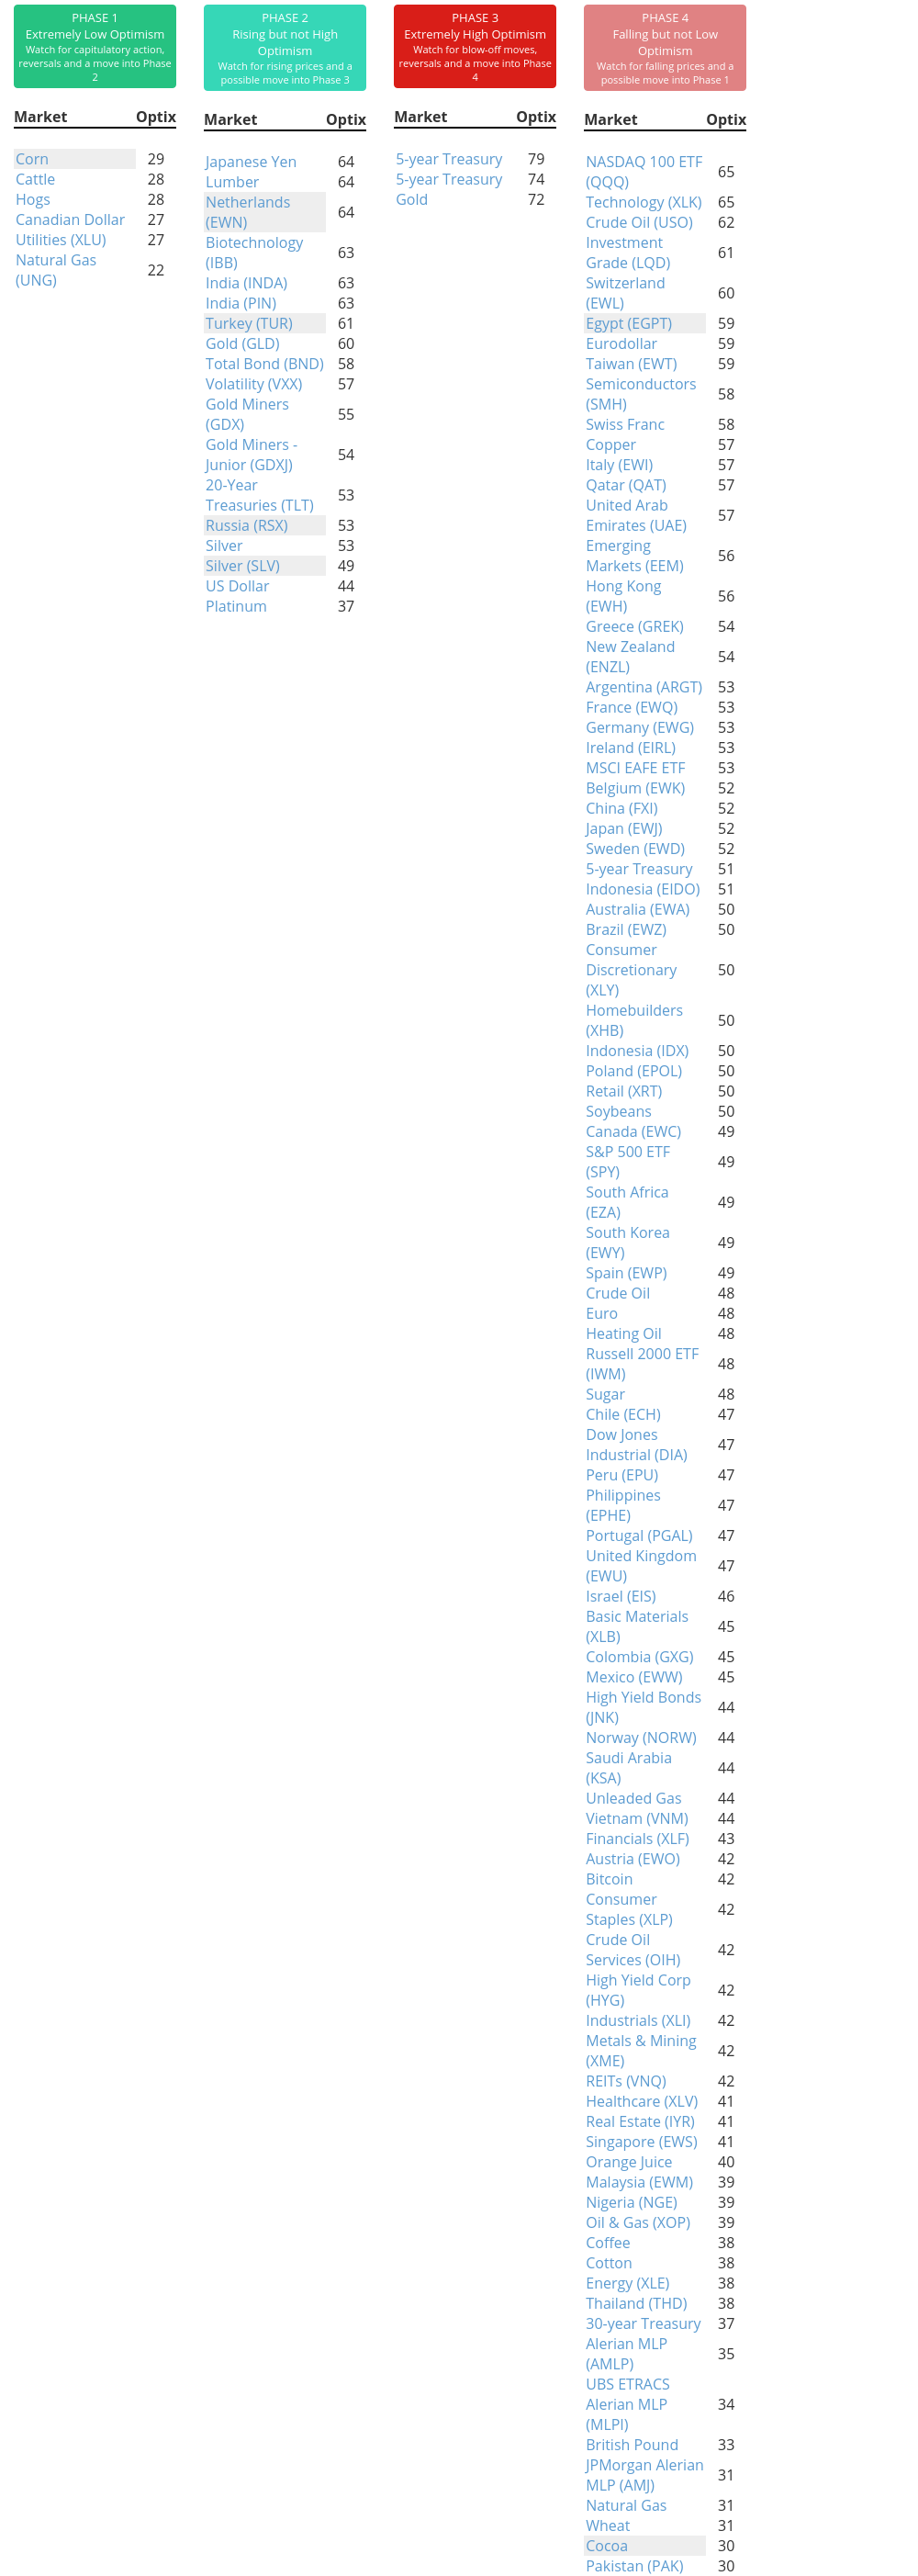
Phase Table
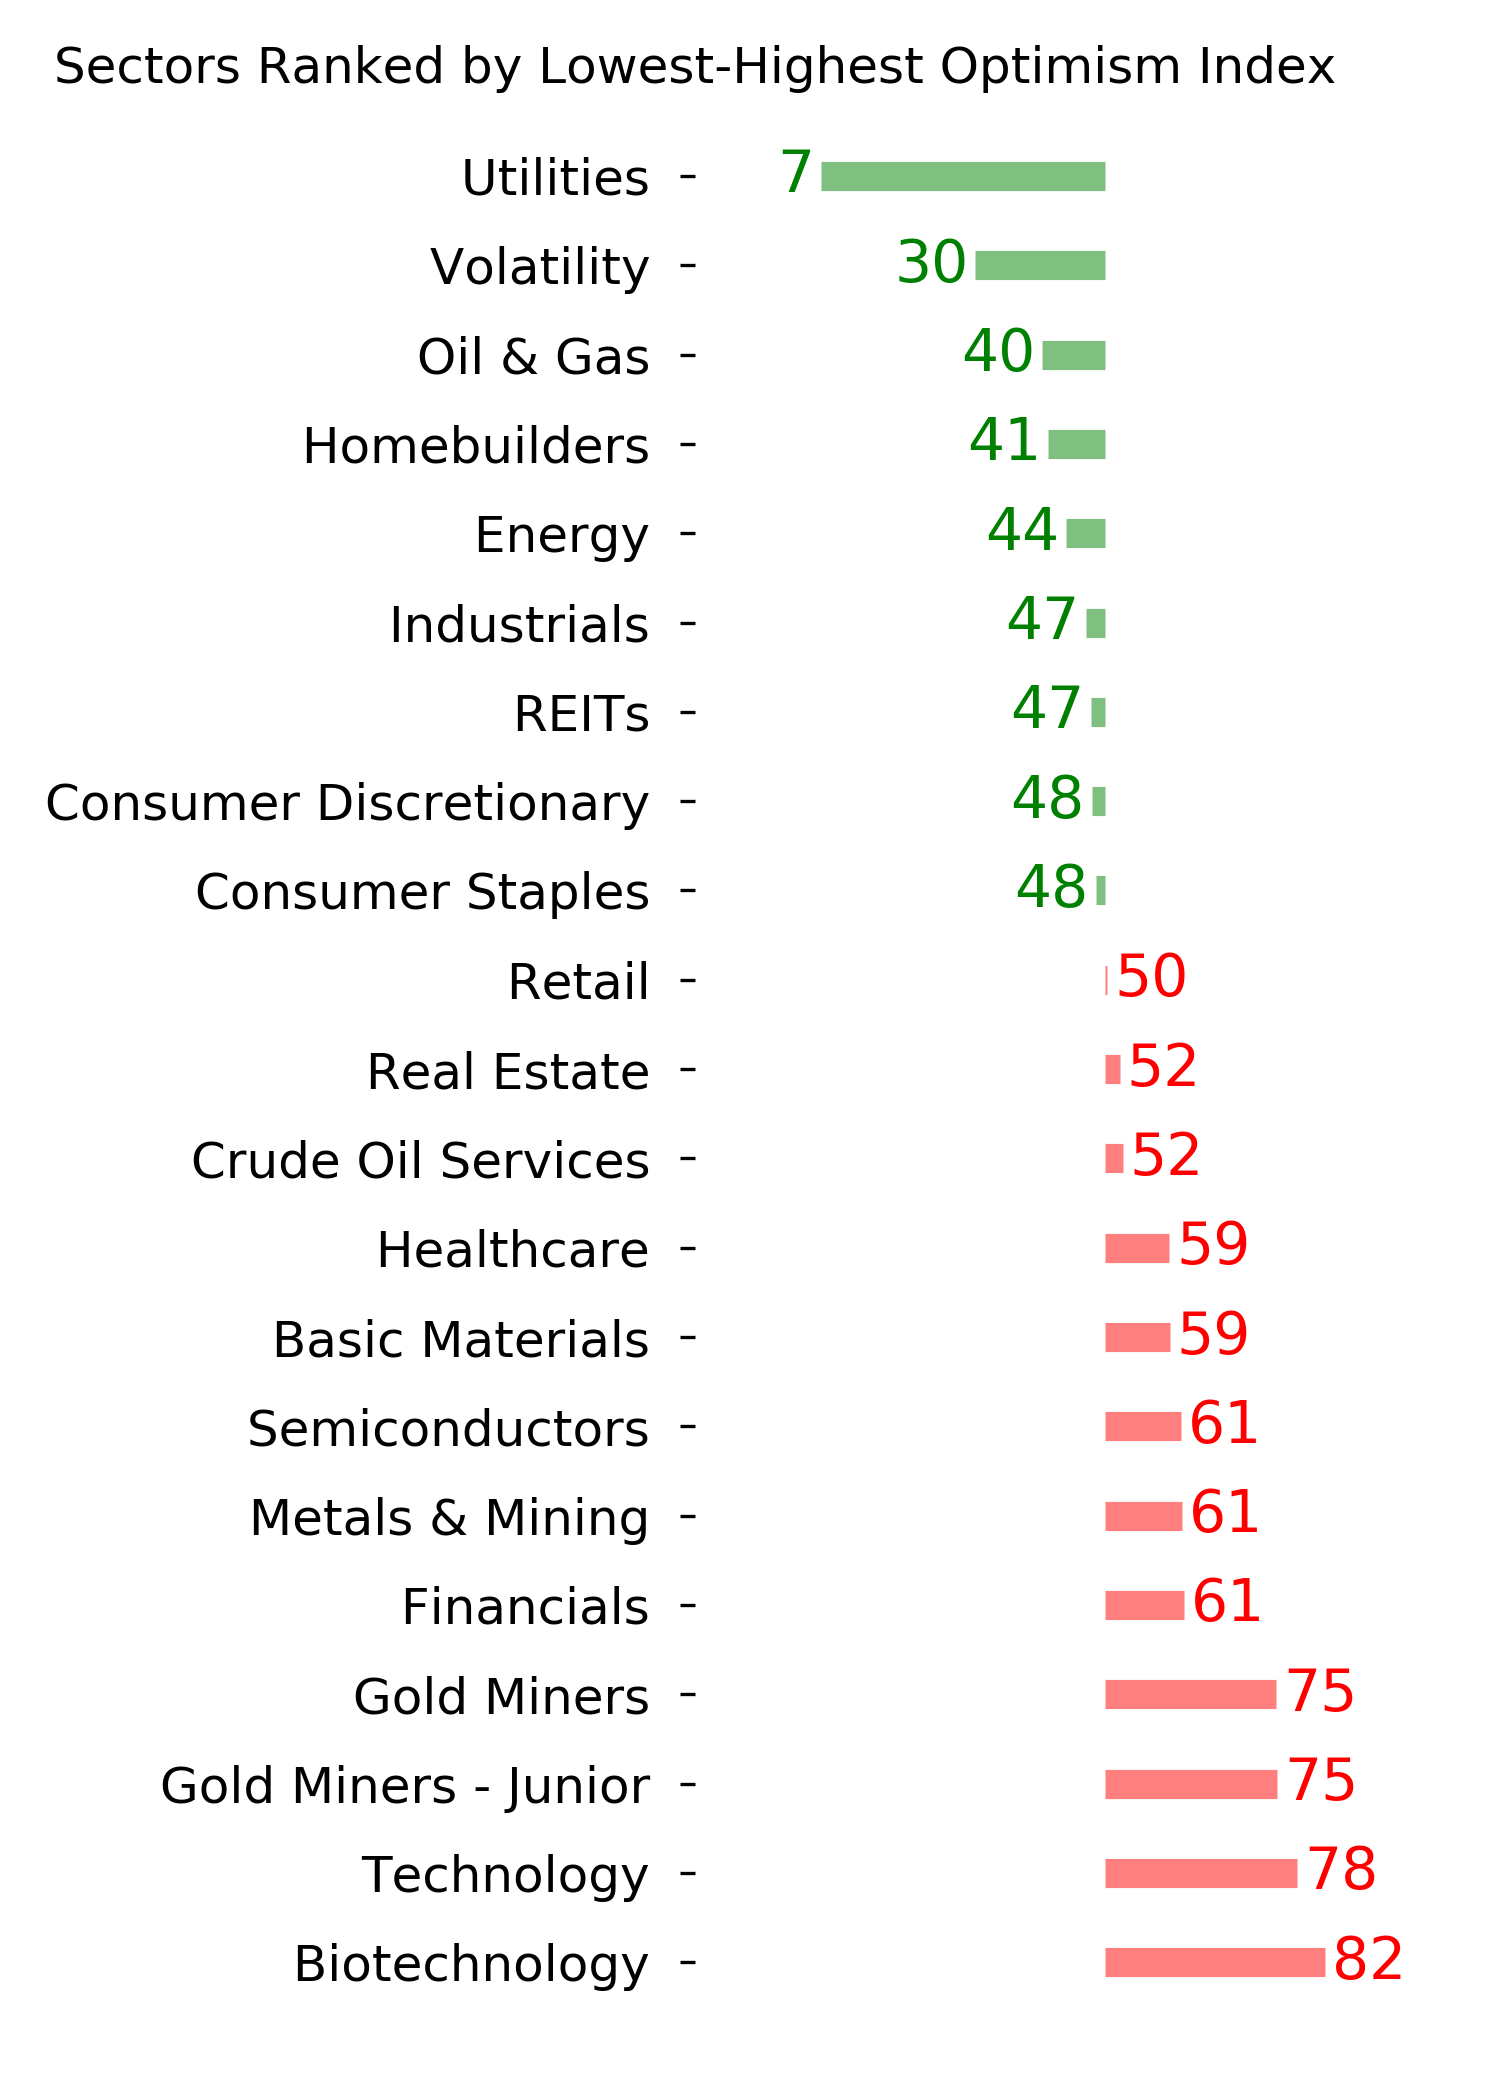
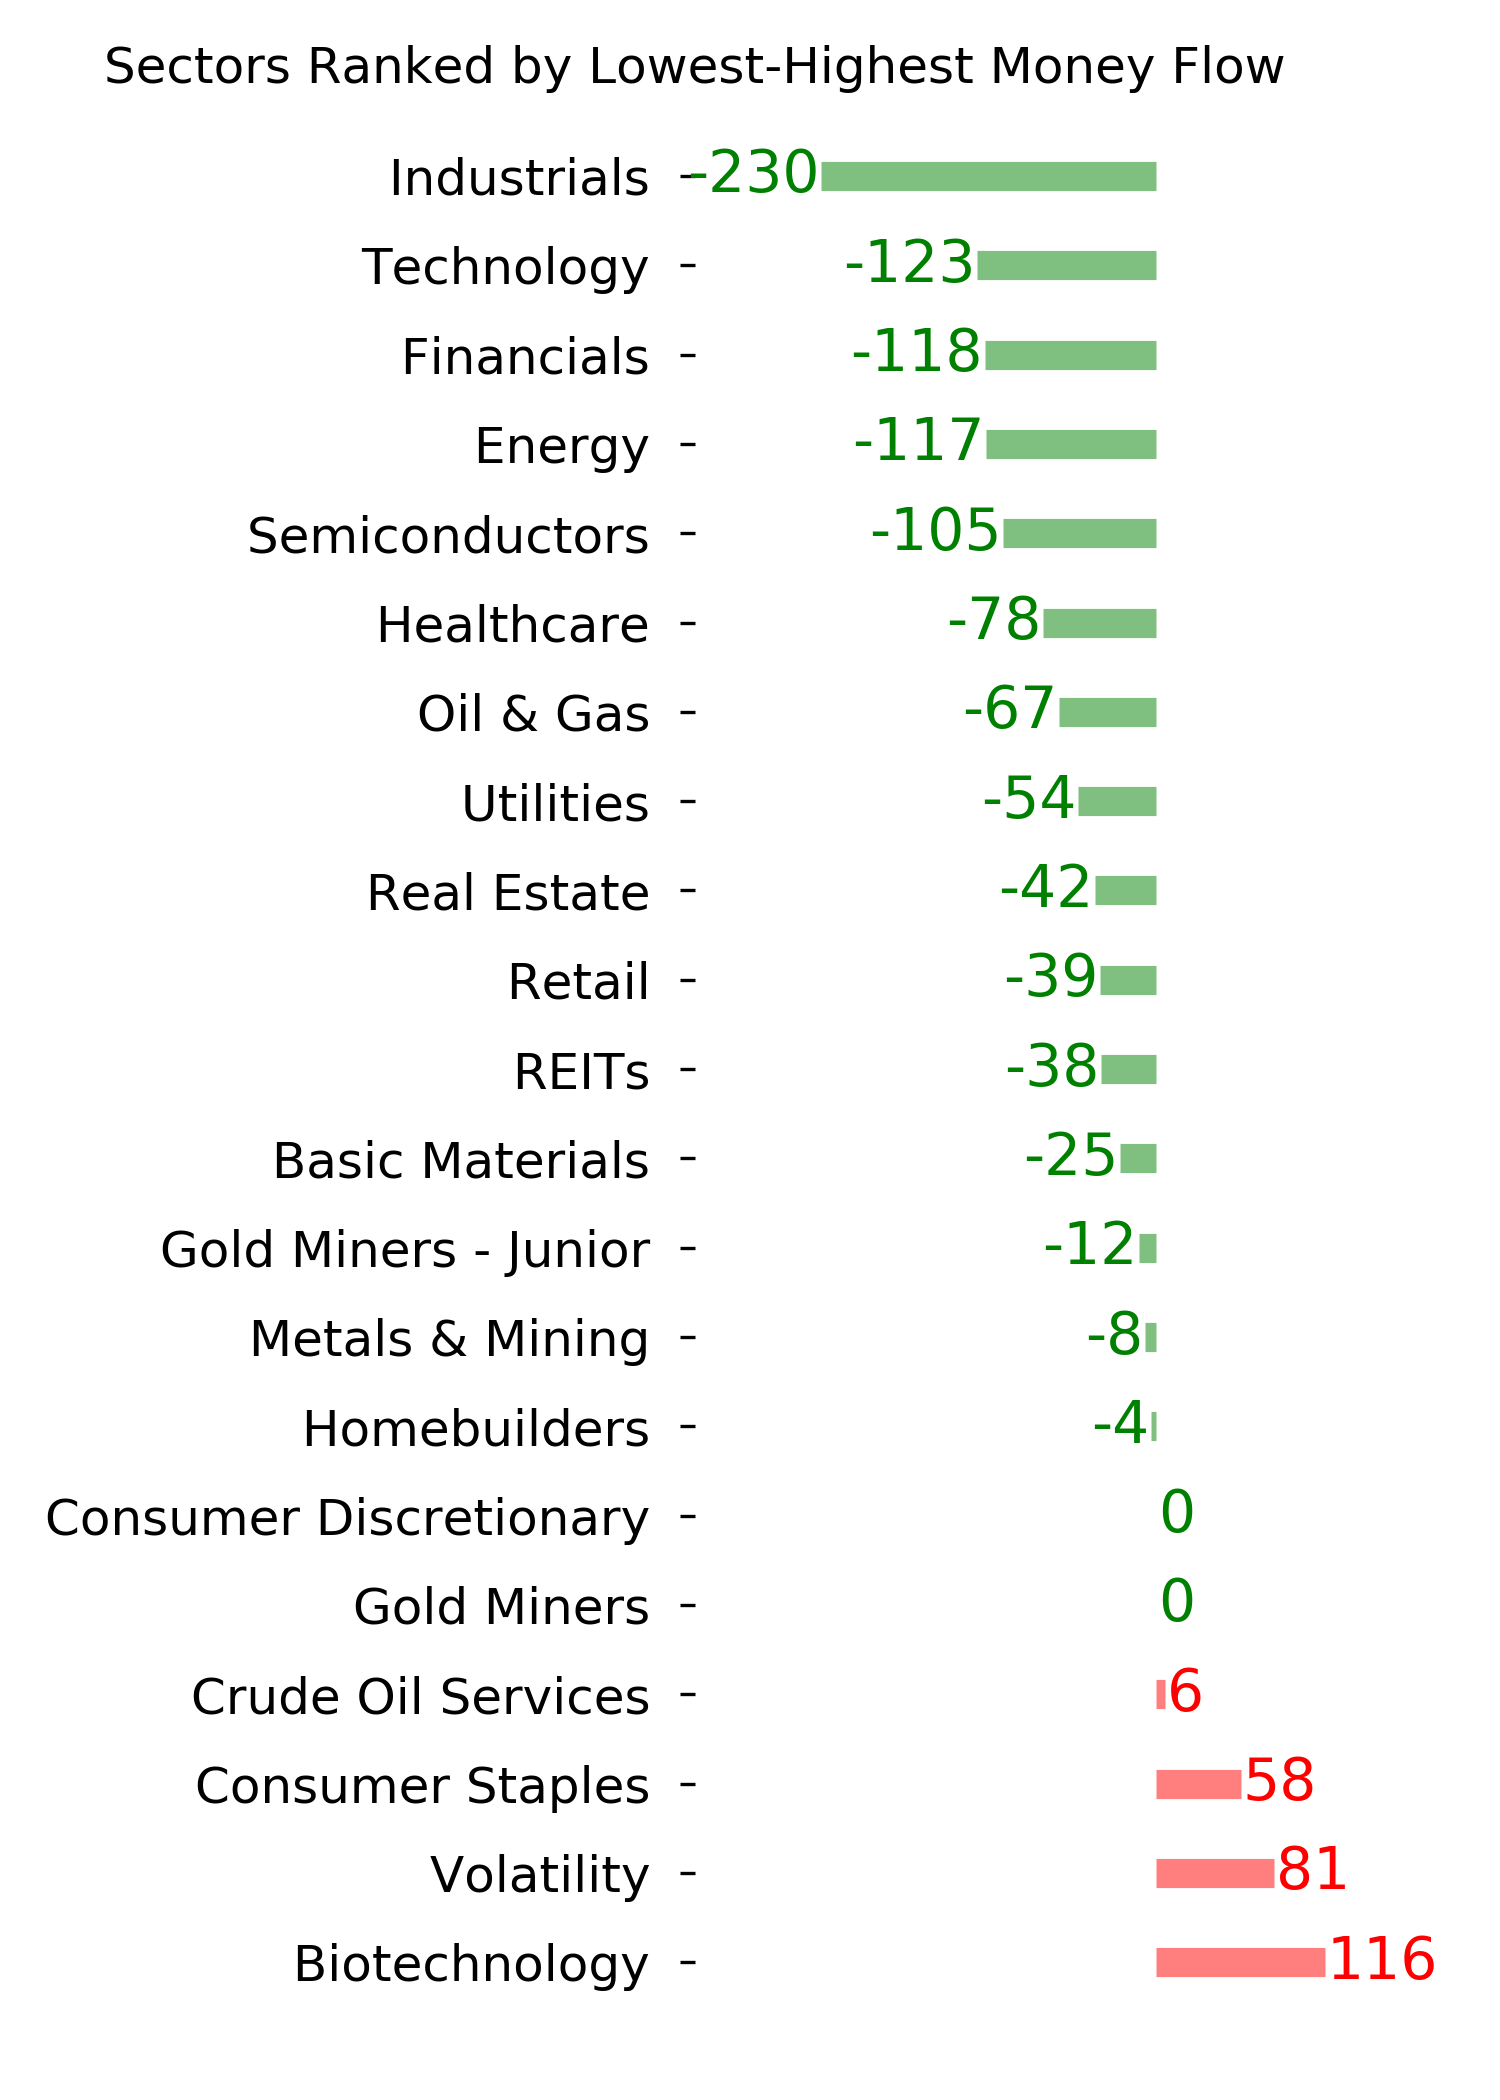
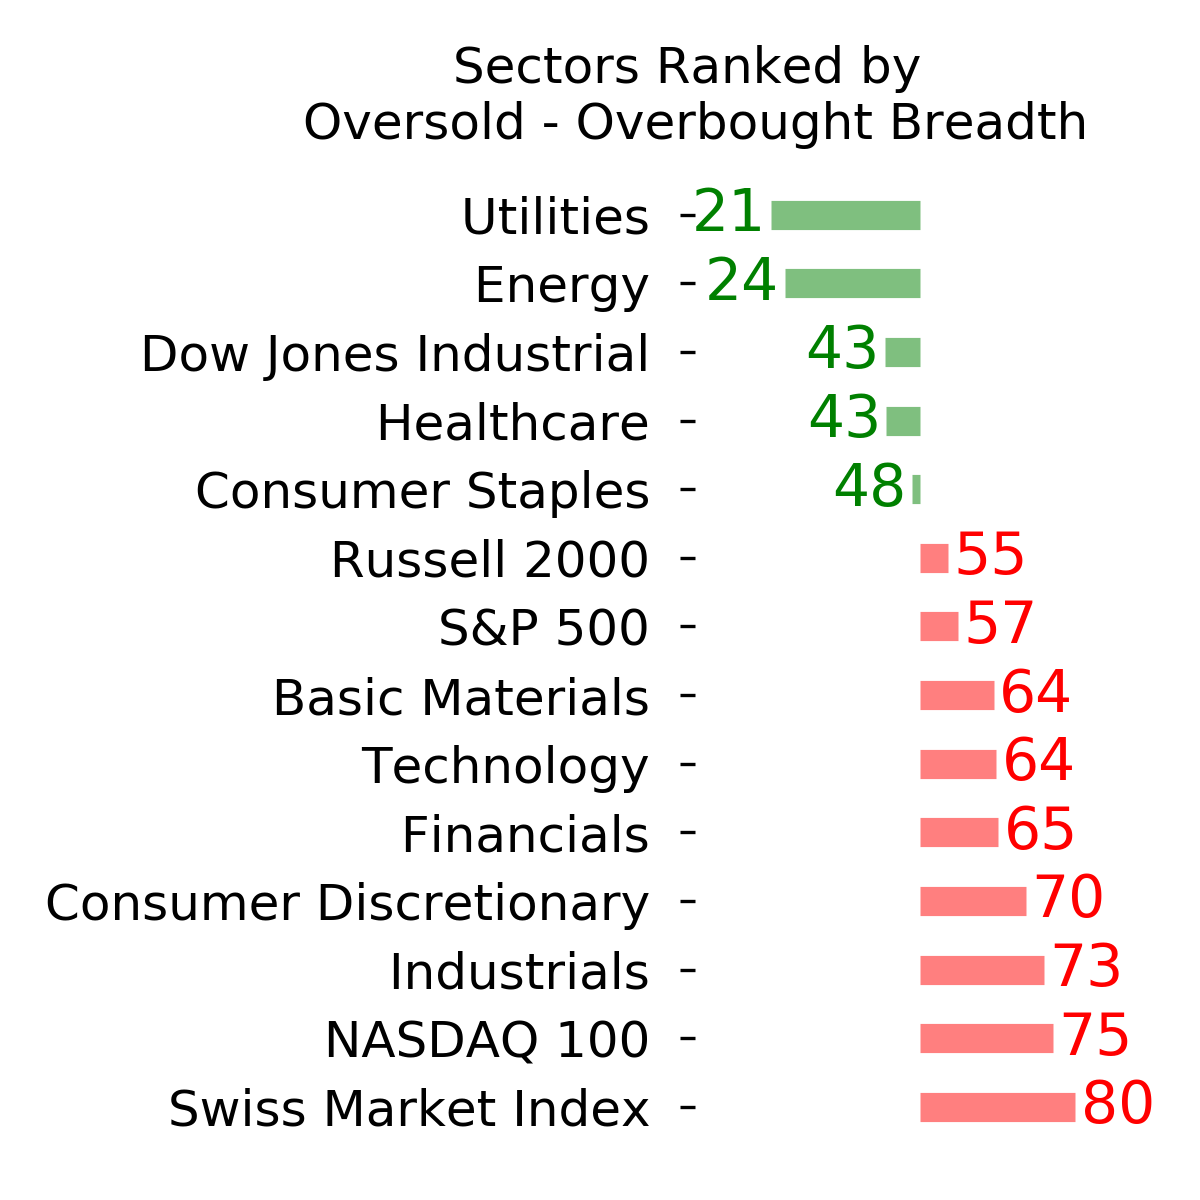
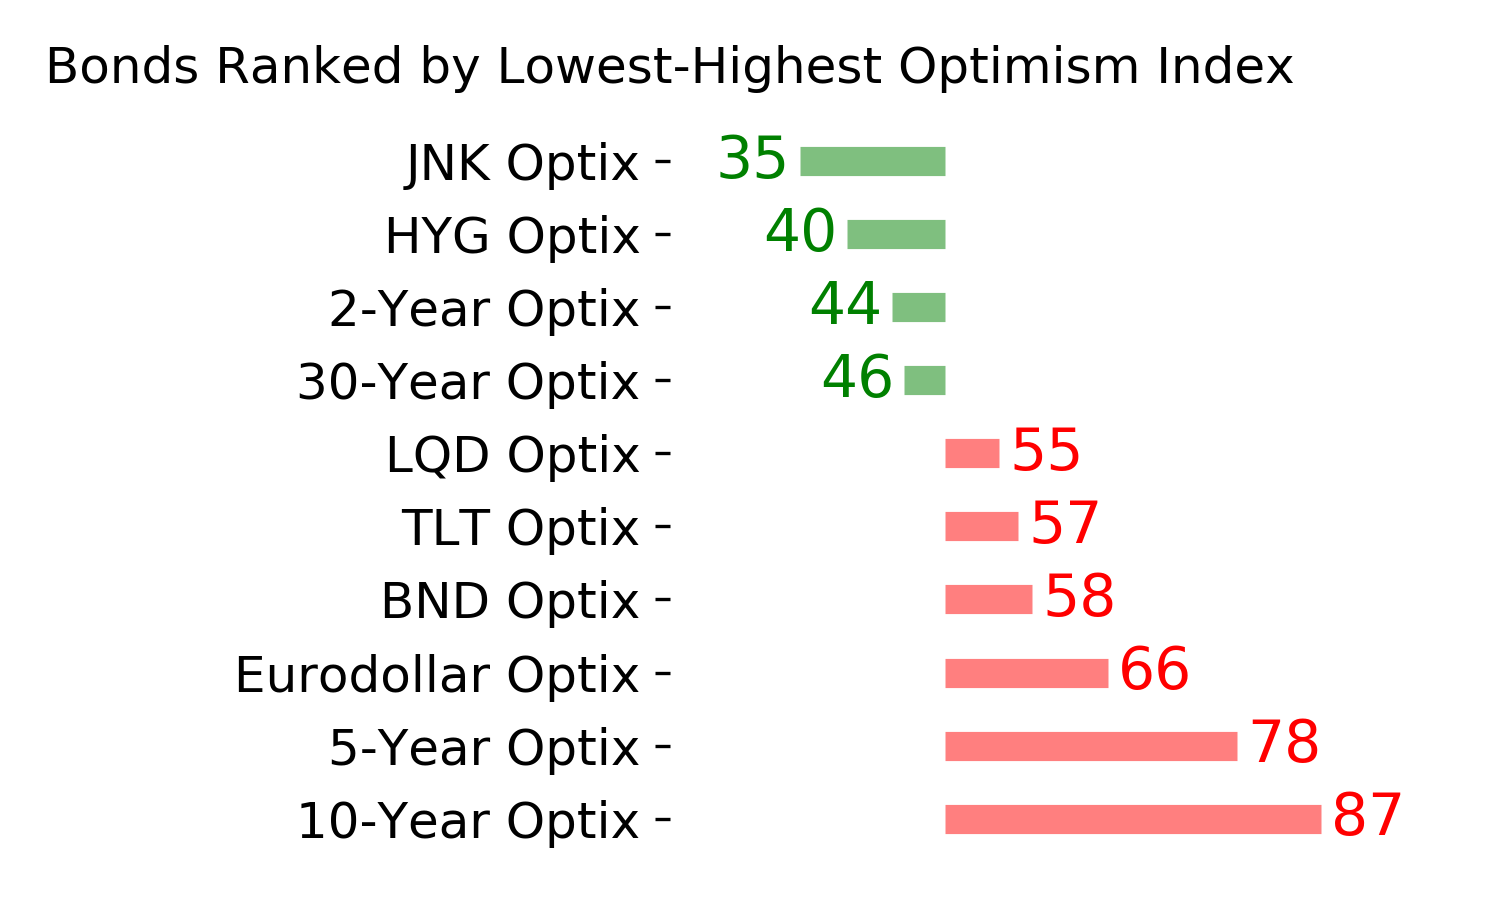
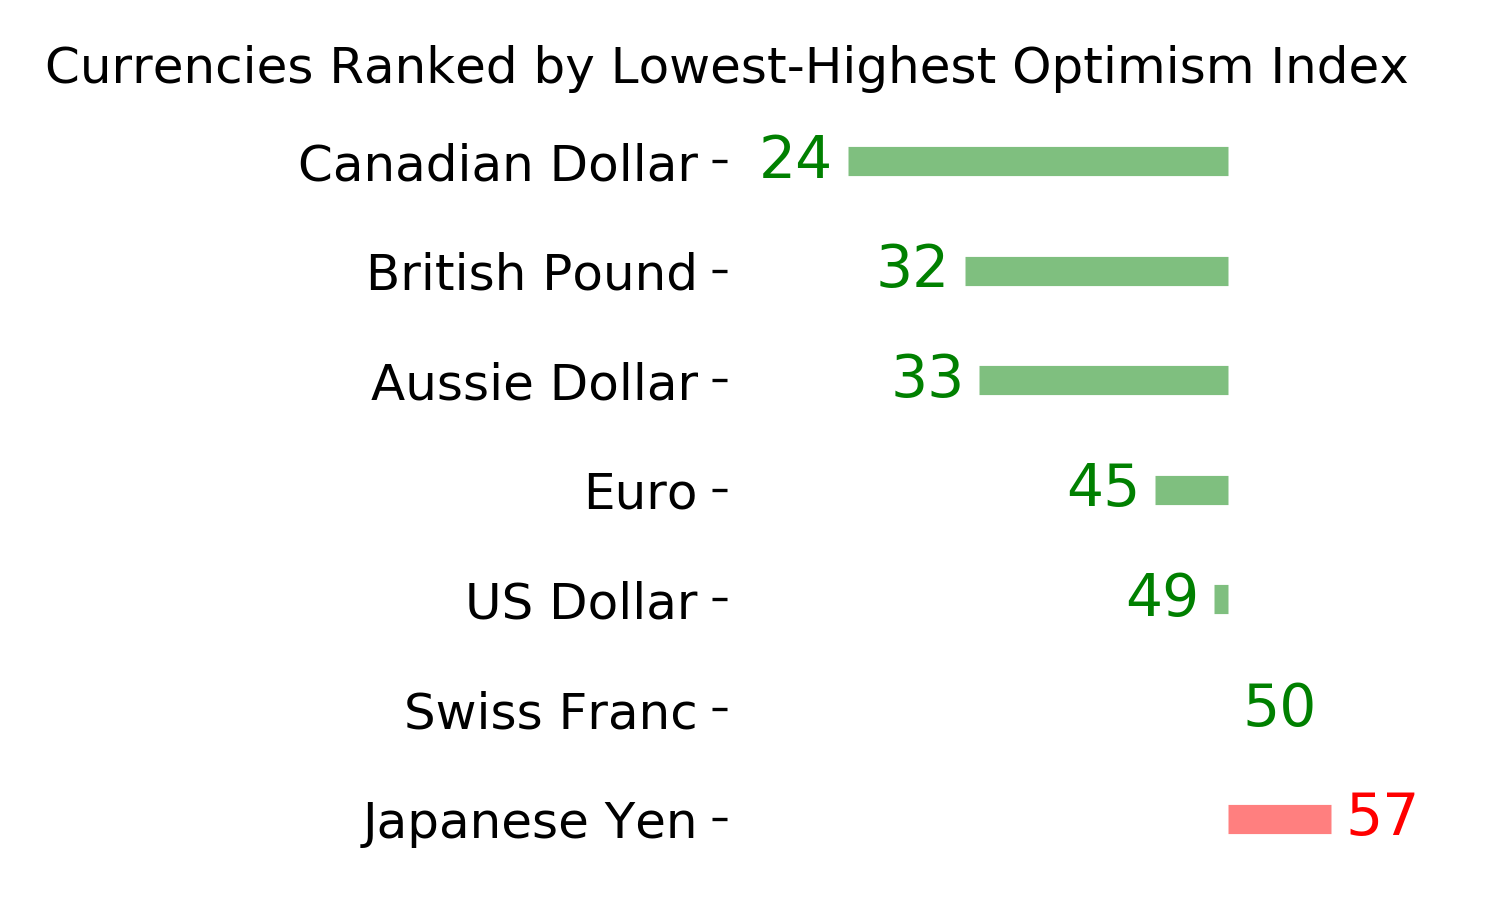
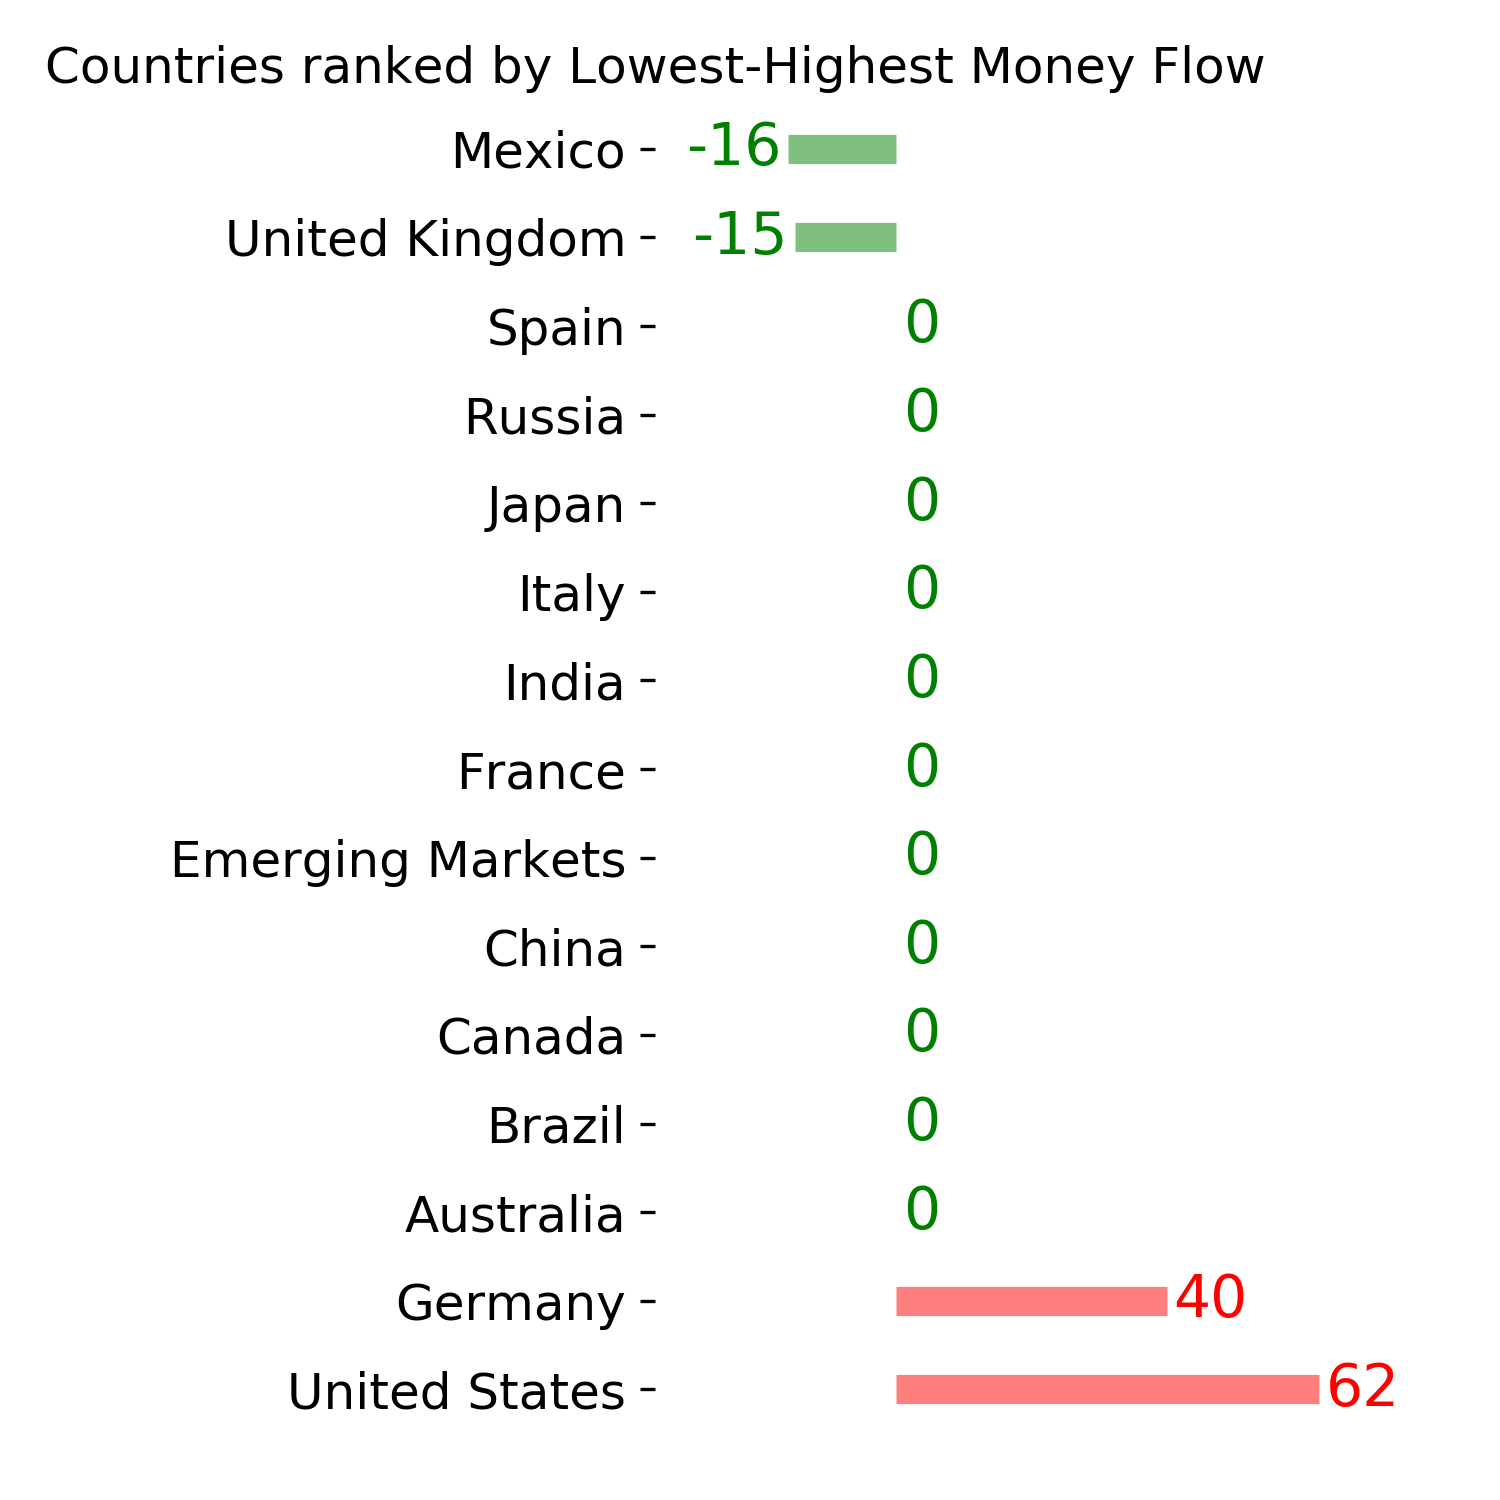
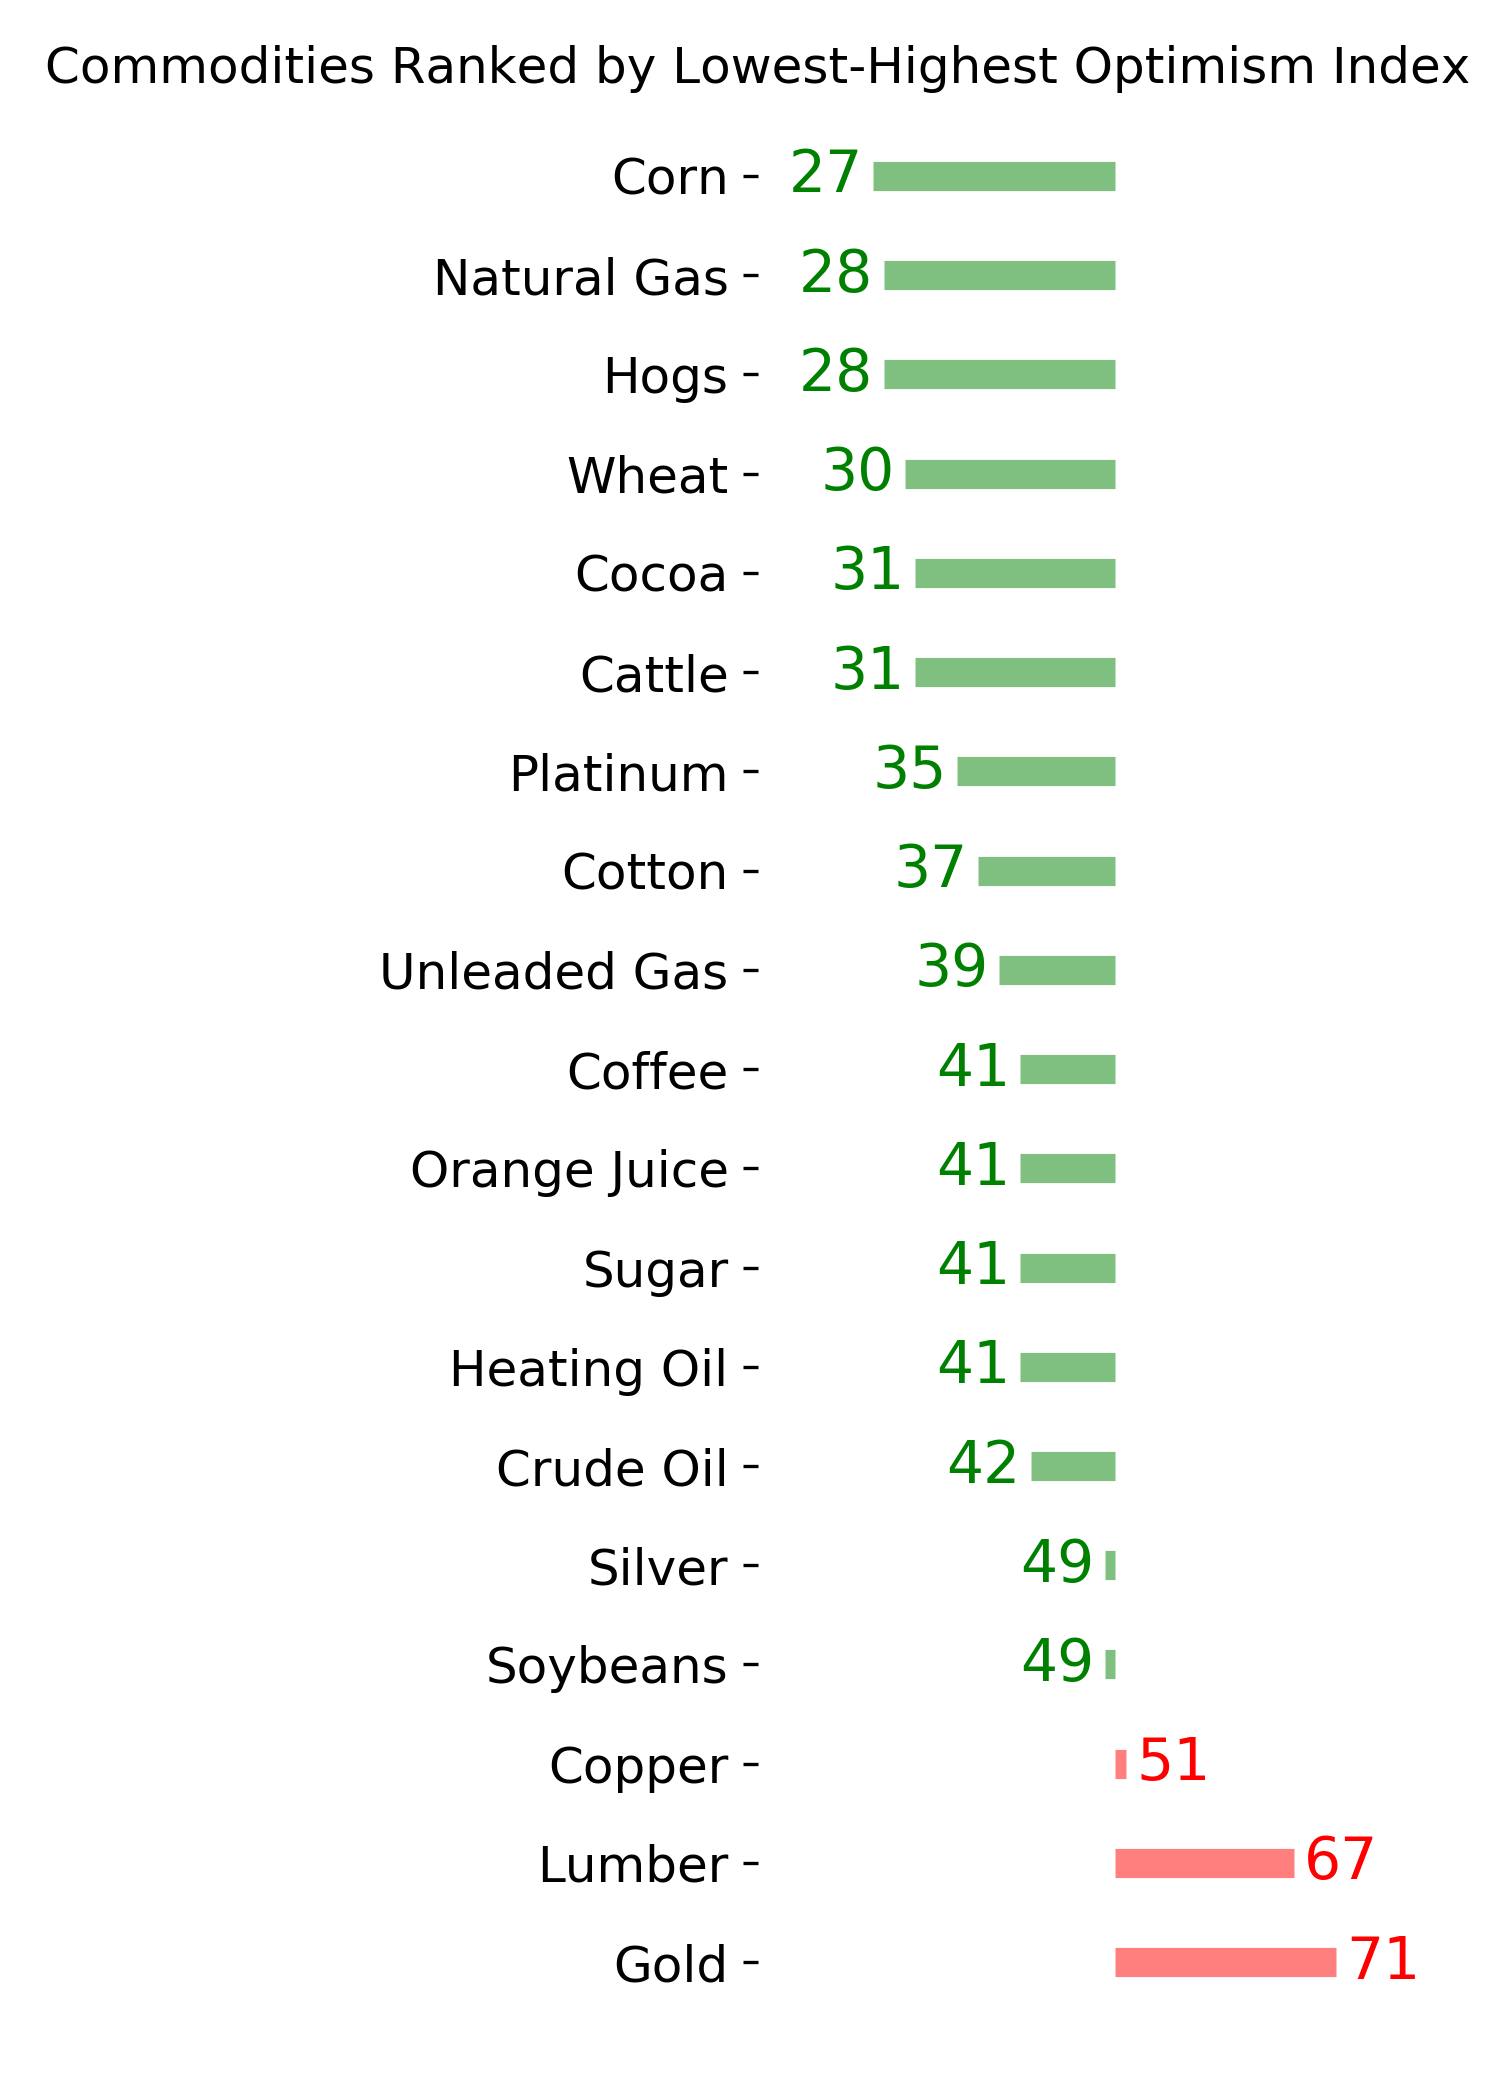
Ranks
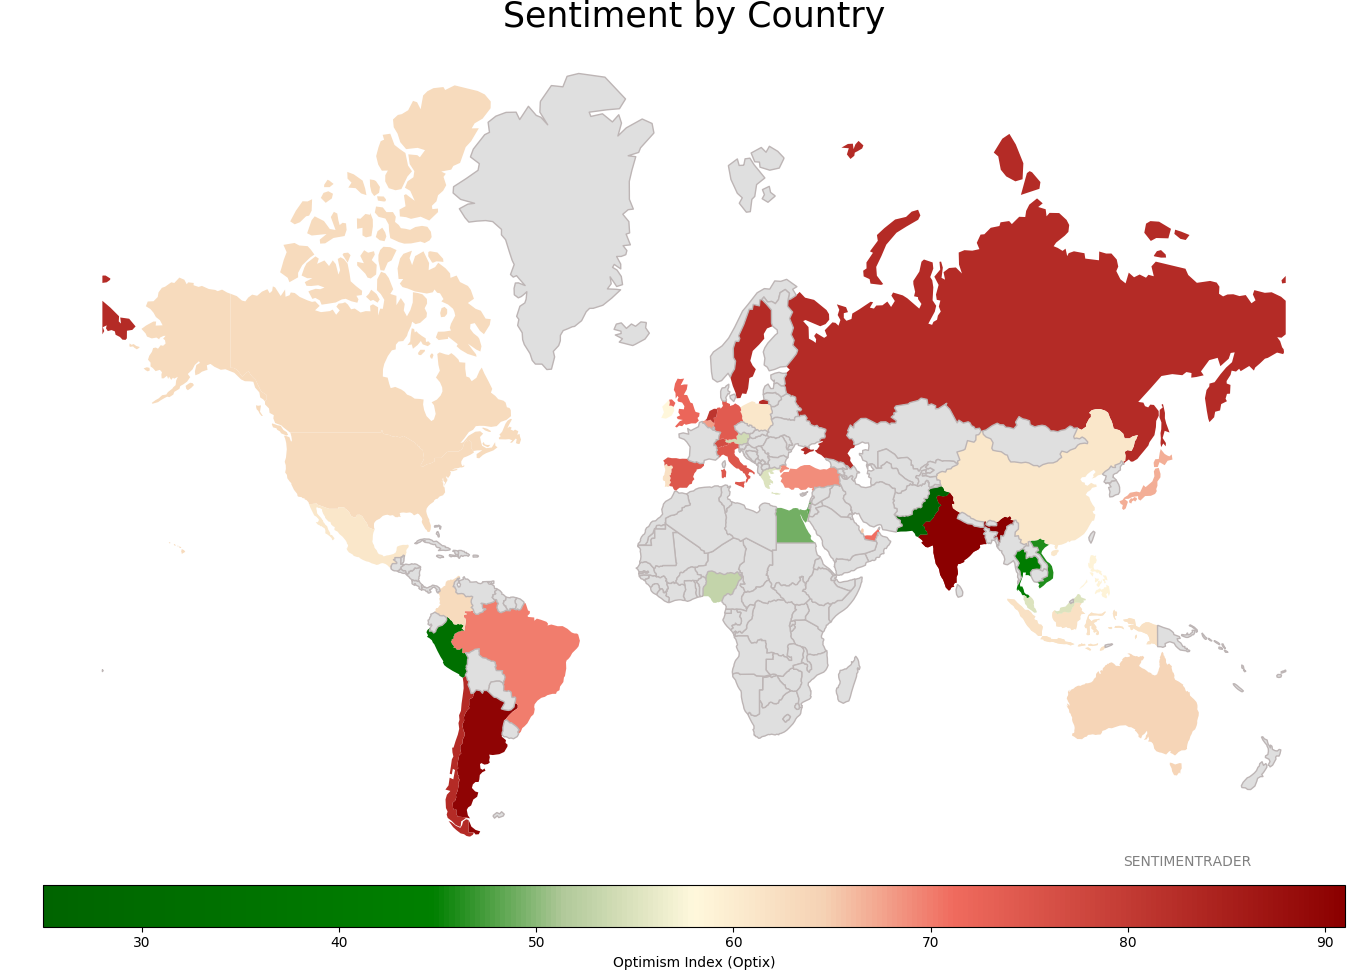
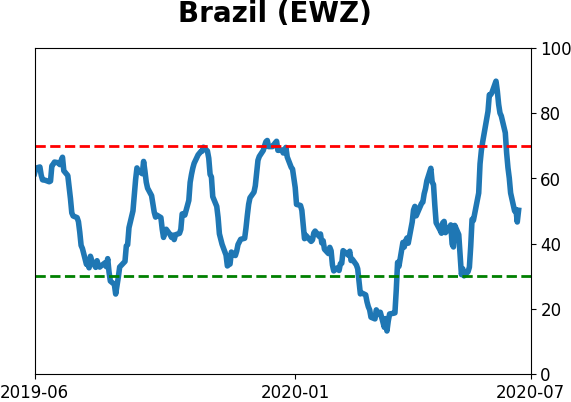
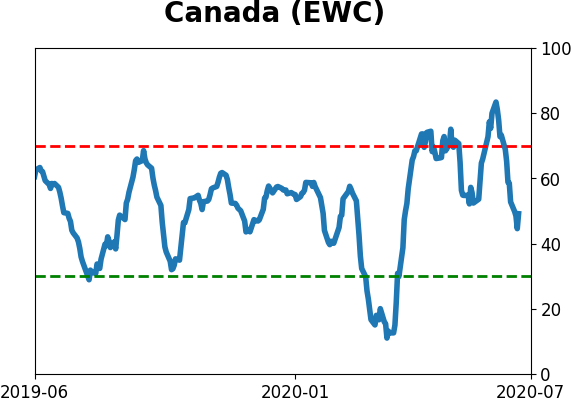
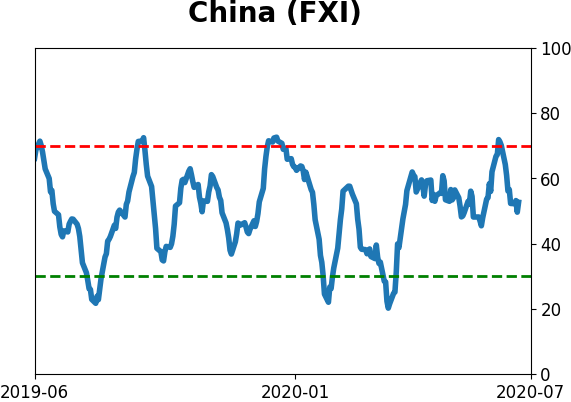
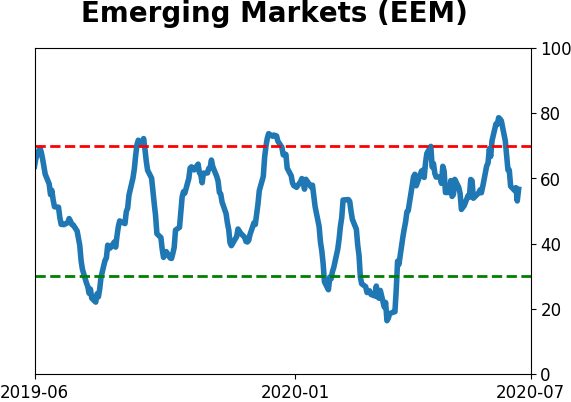
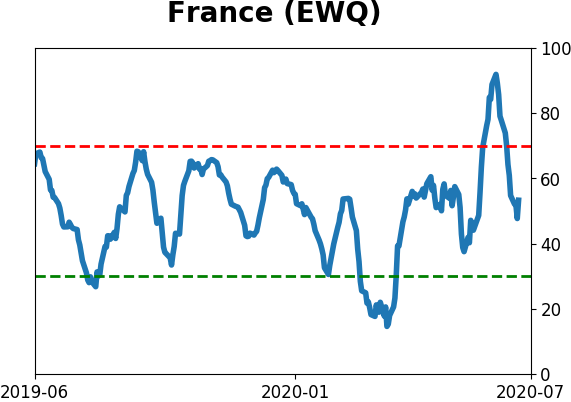
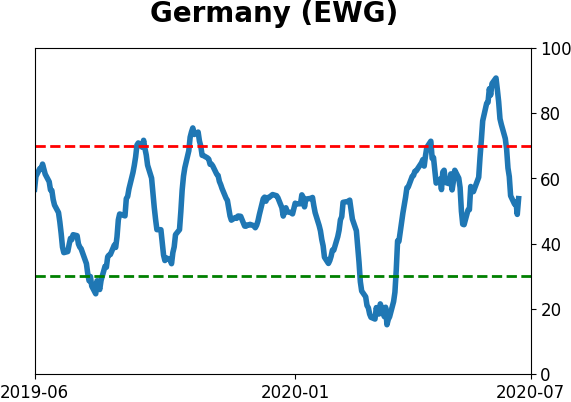
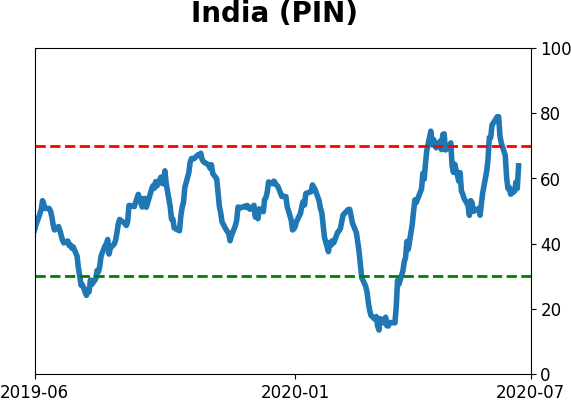
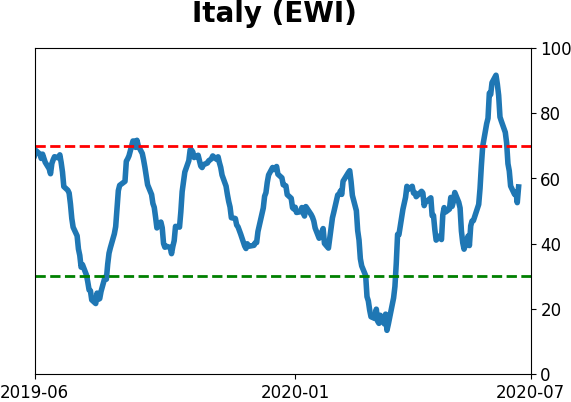
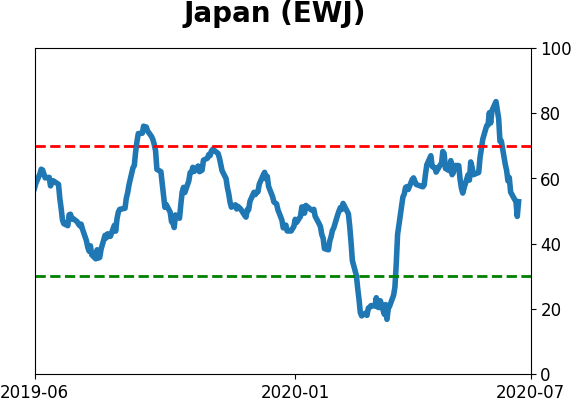
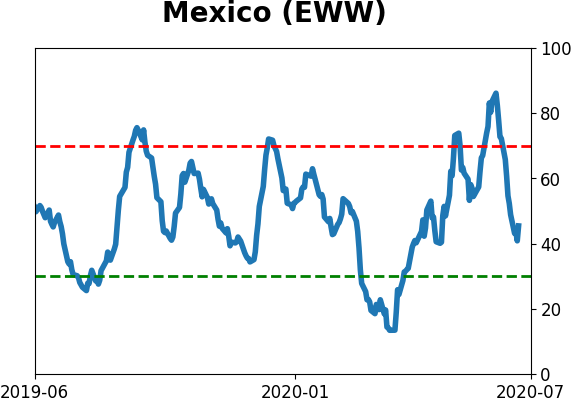
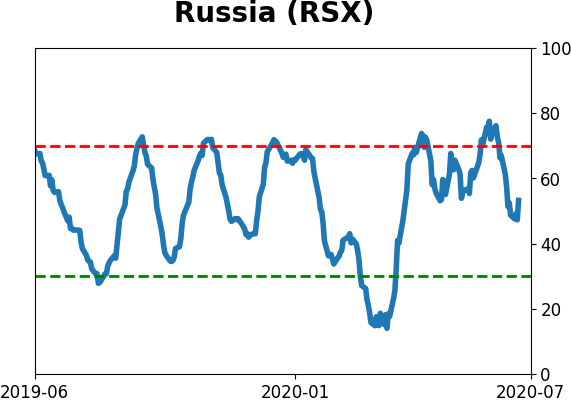
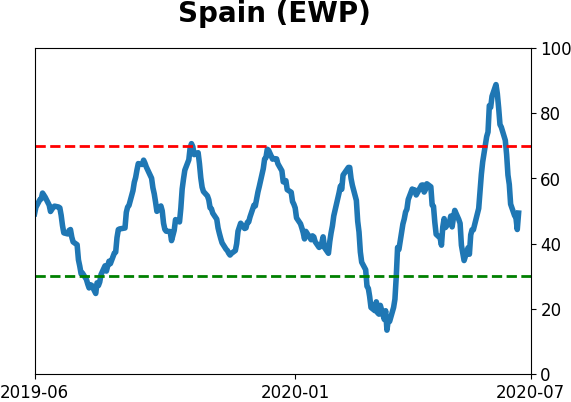
Sentiment Around The World
Optimism Index Thumbnails
|
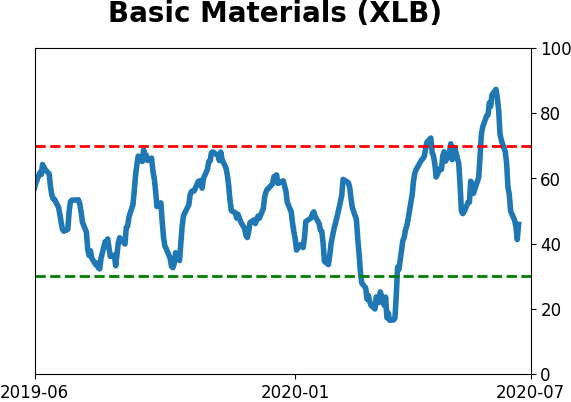
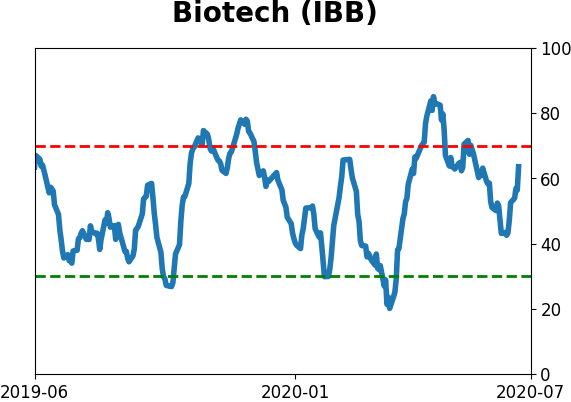
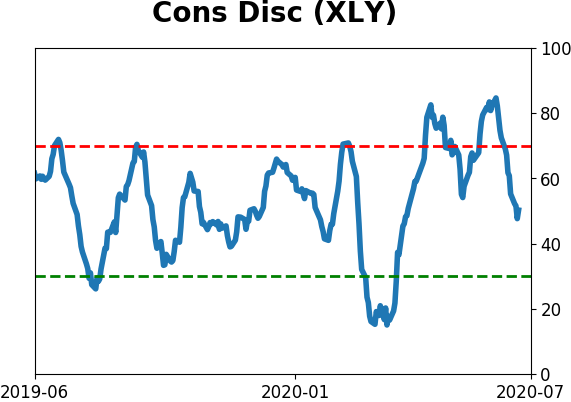
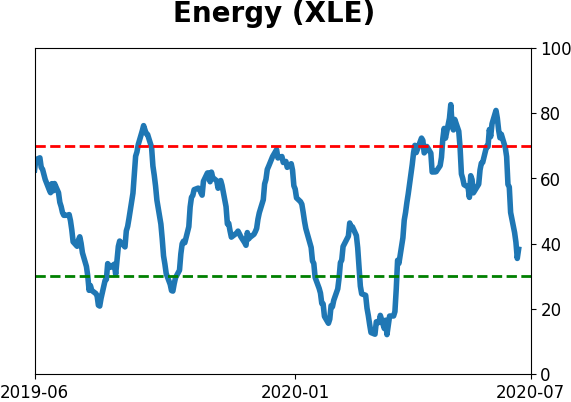
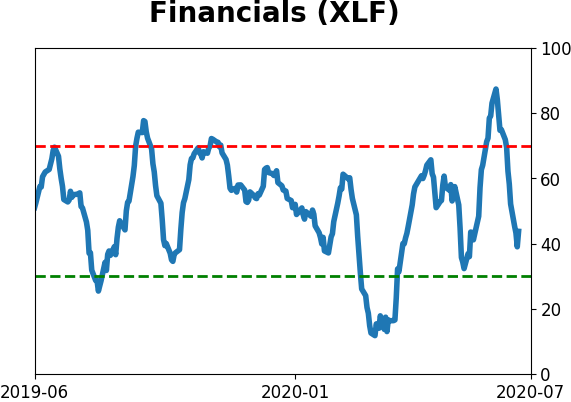
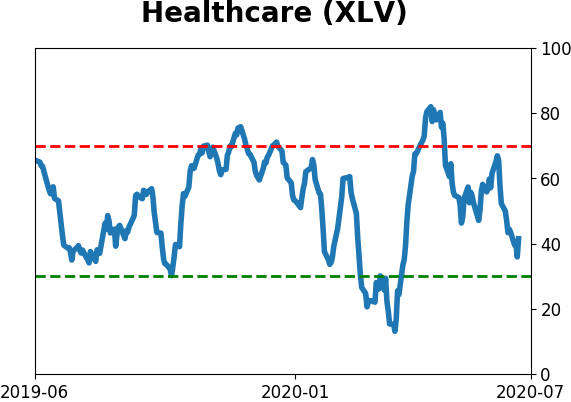
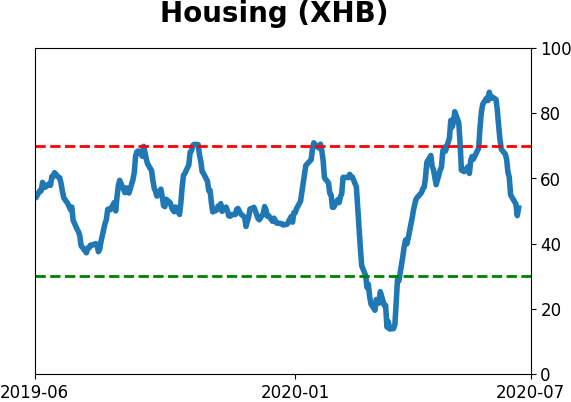
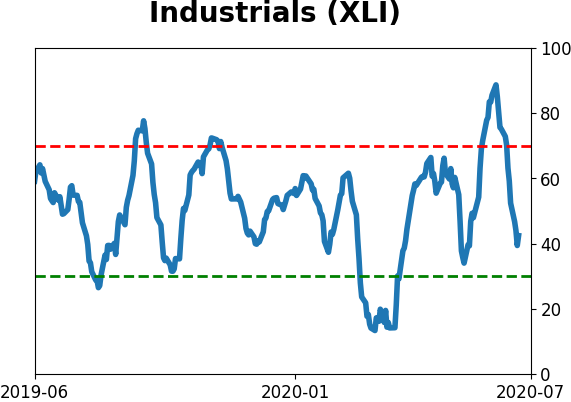
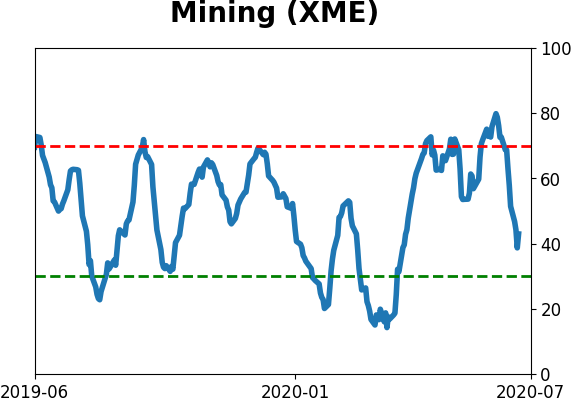
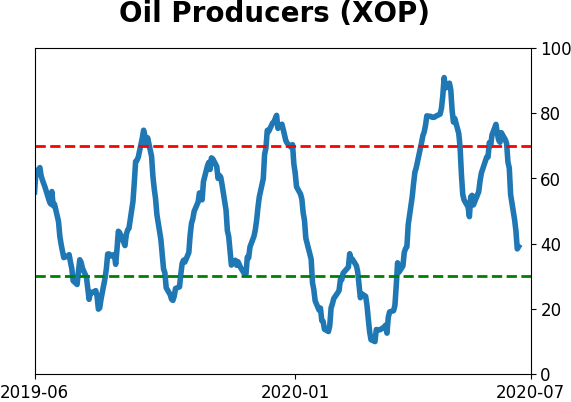
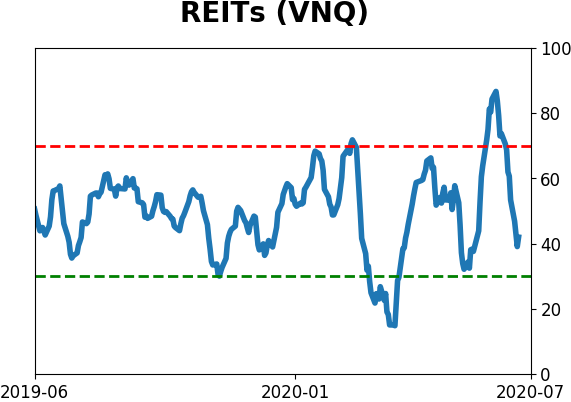
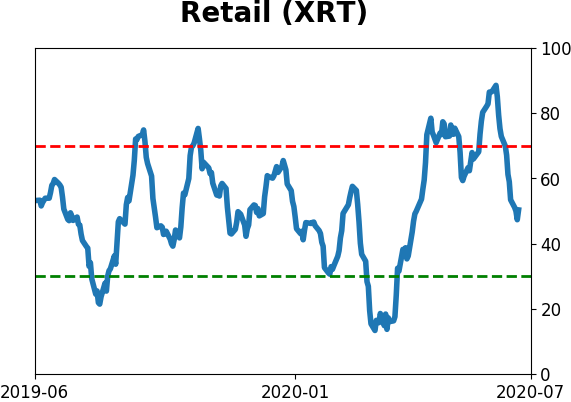
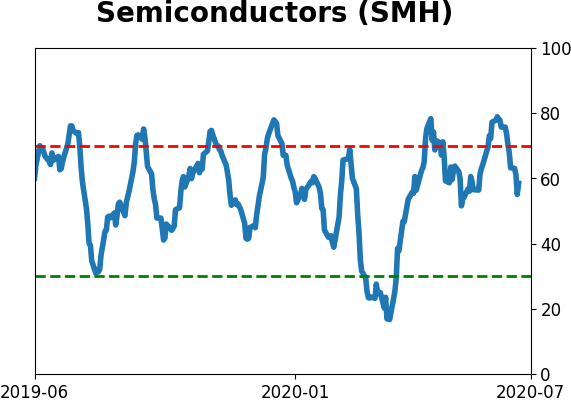
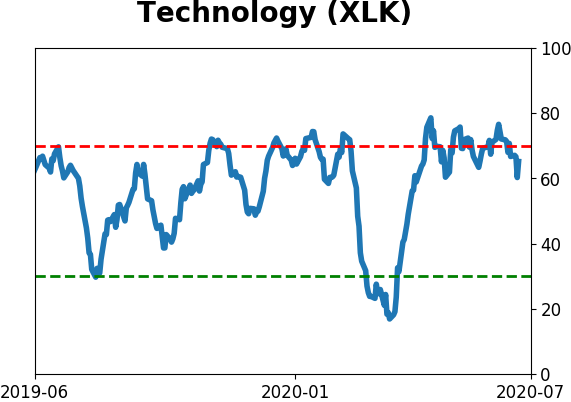
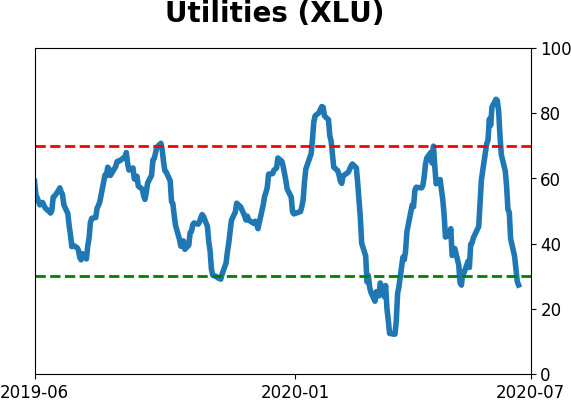
Sector ETF's - 10-Day Moving Average
|
|
|
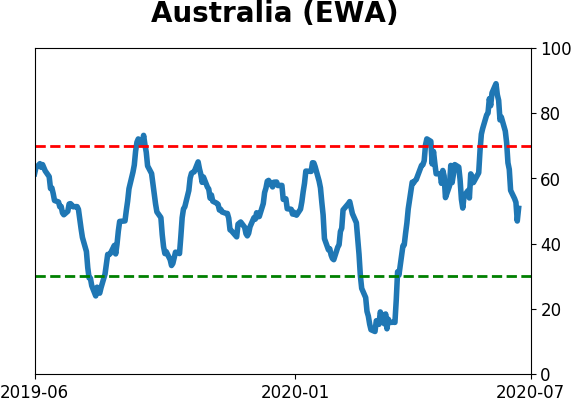
Country ETF's - 10-Day Moving Average
|
|
|
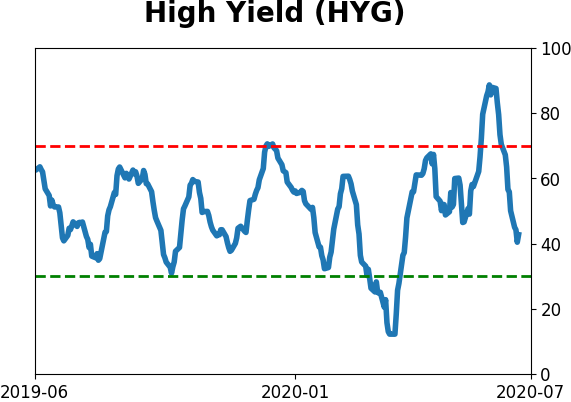
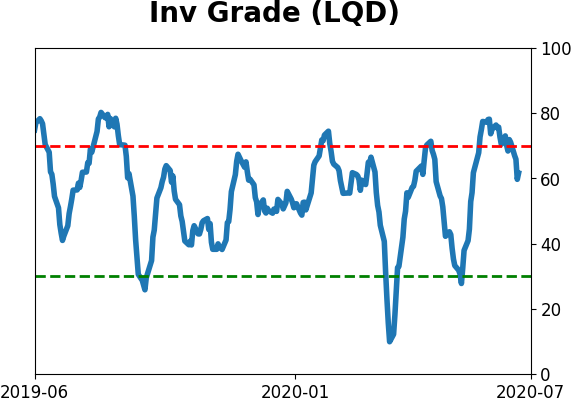
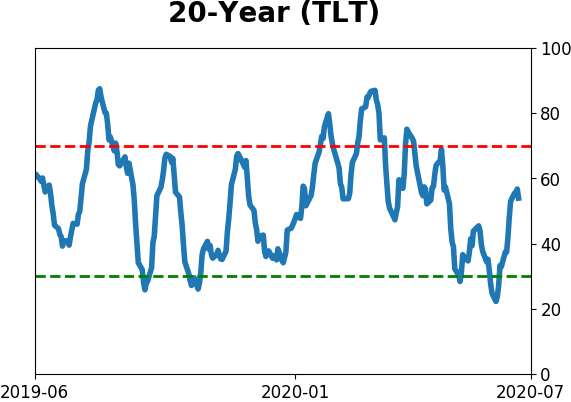
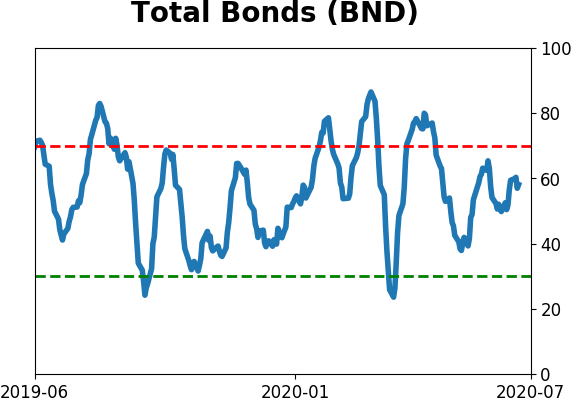
Bond ETF's - 10-Day Moving Average
|
|
|
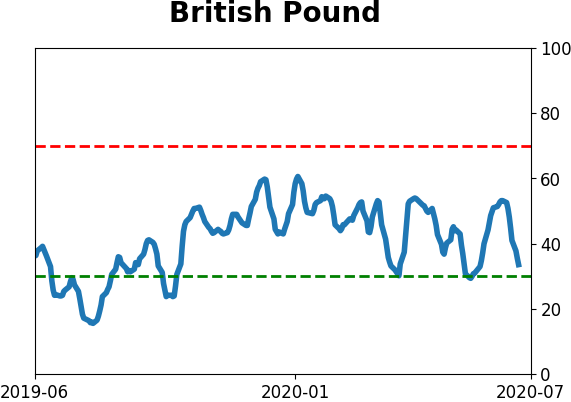
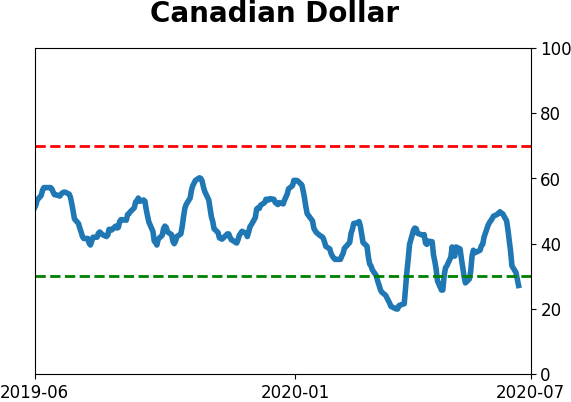
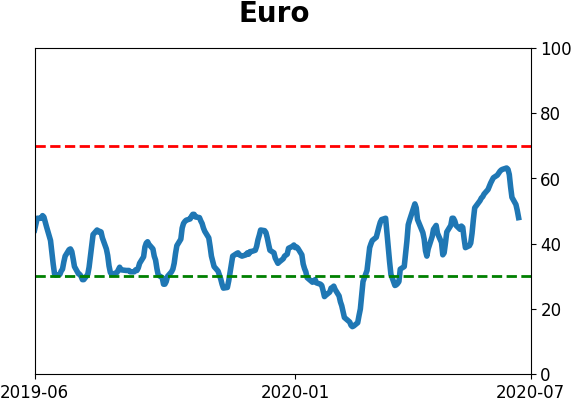
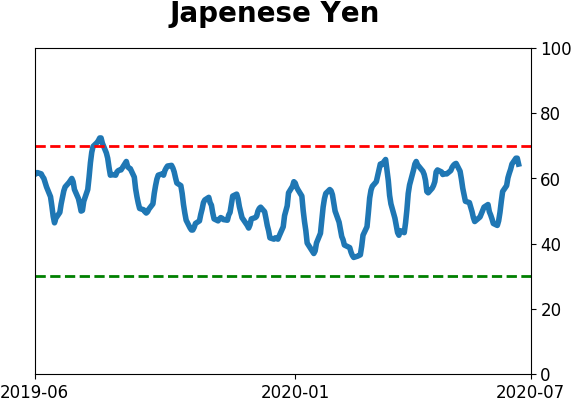
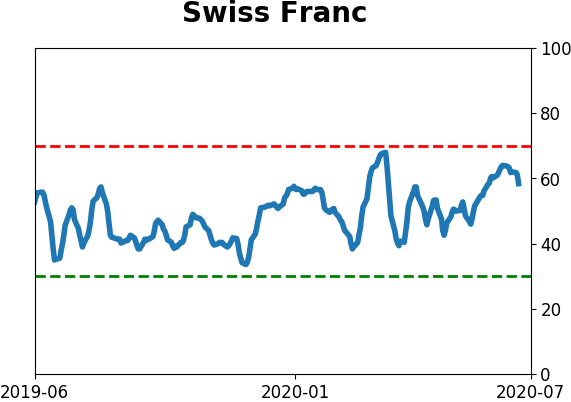
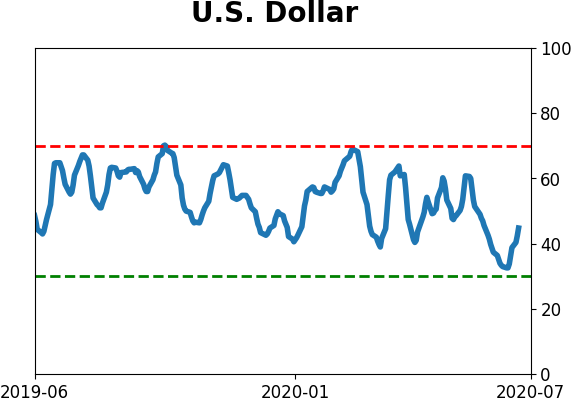
Currency ETF's - 5-Day Moving Average
|
|
|
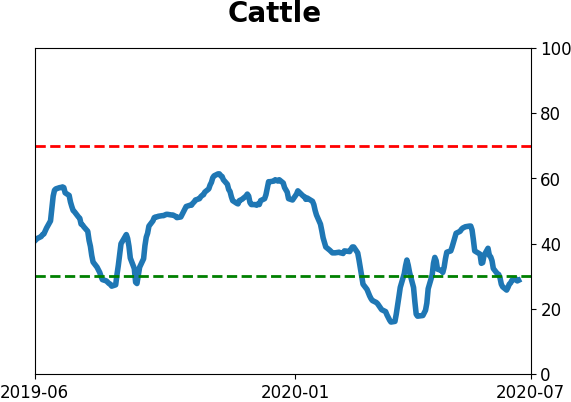
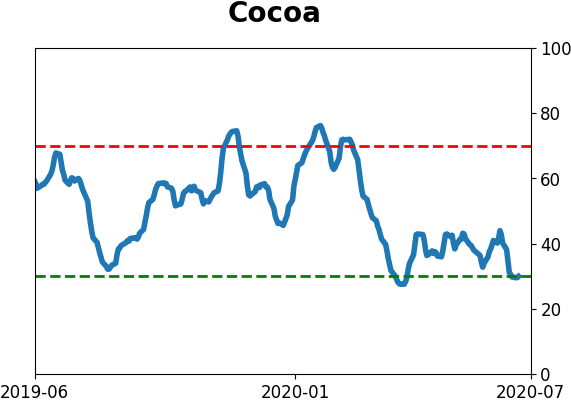
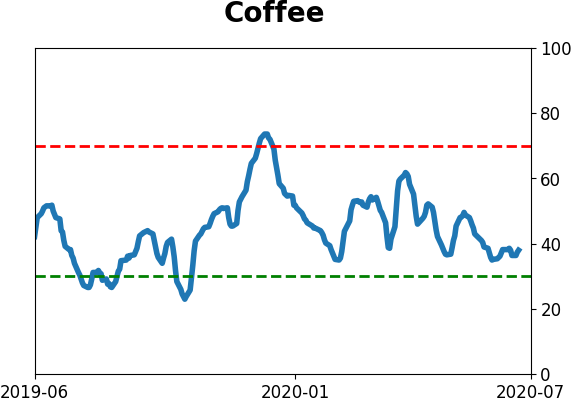
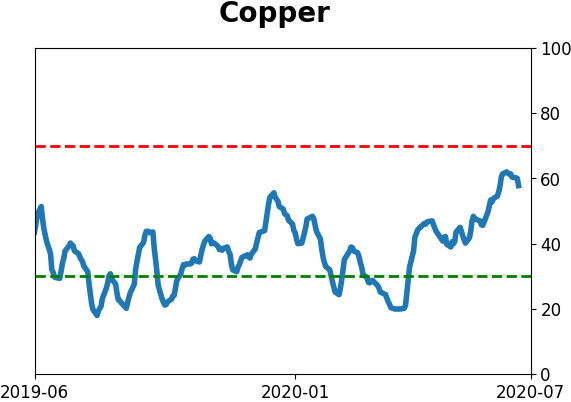
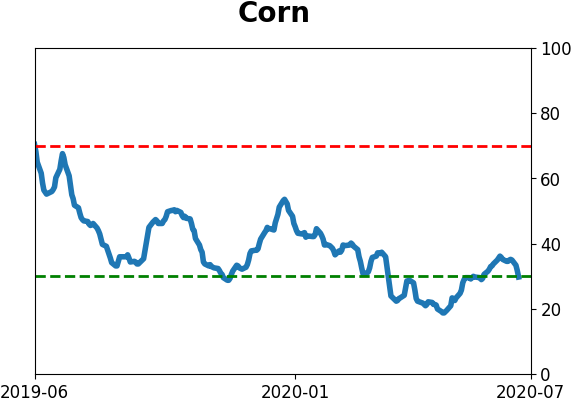
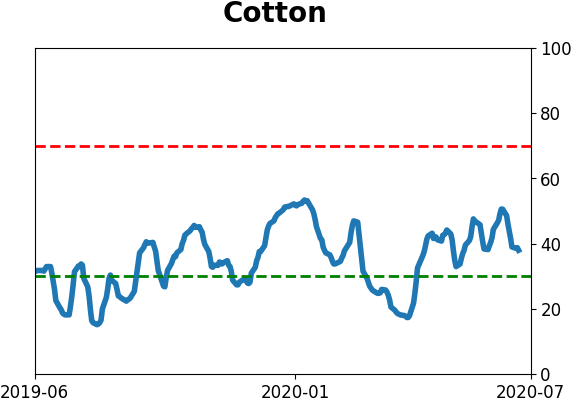
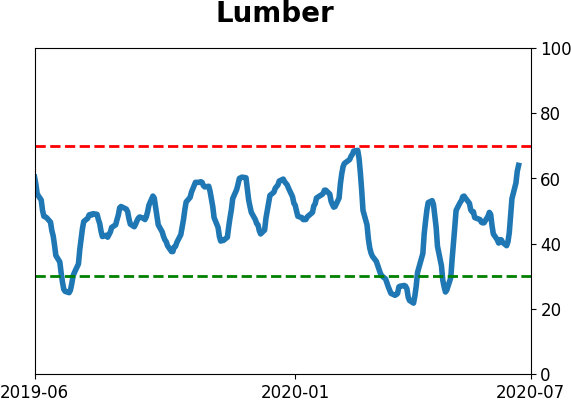
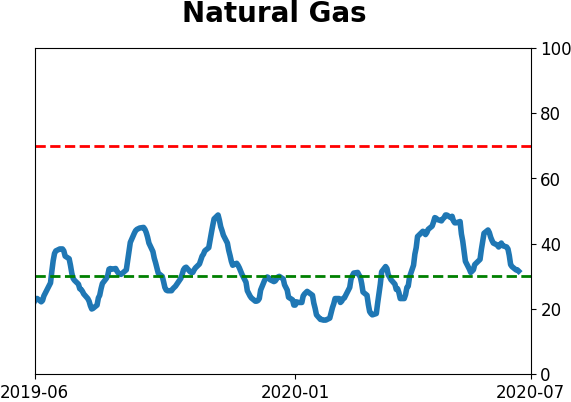
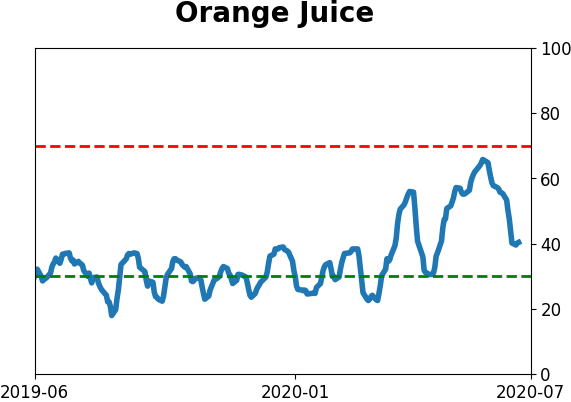
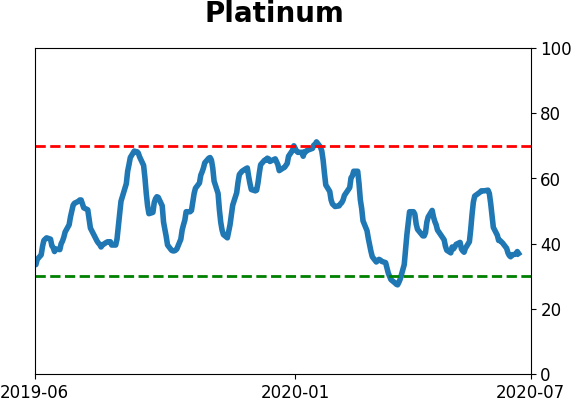
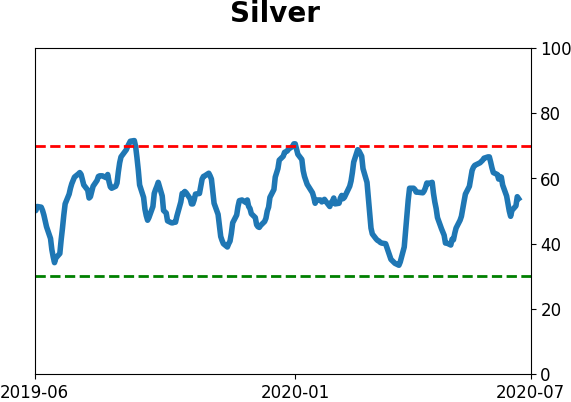
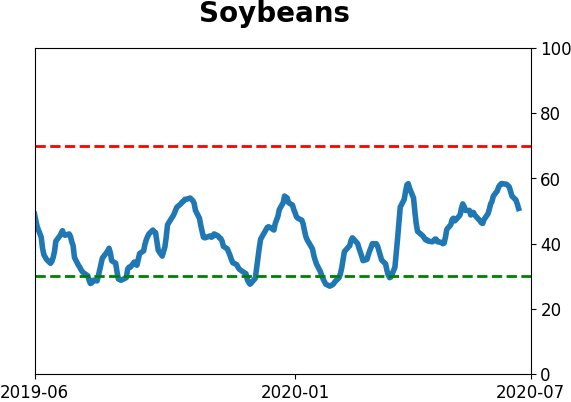
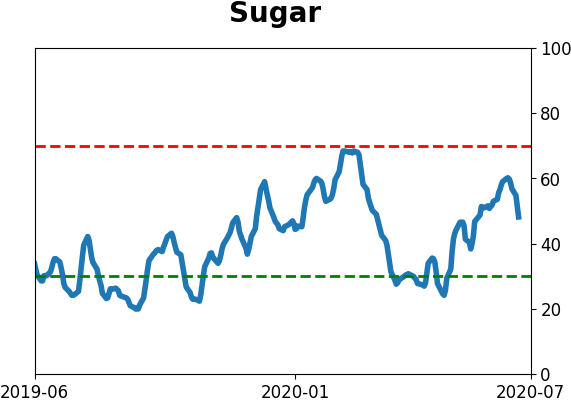
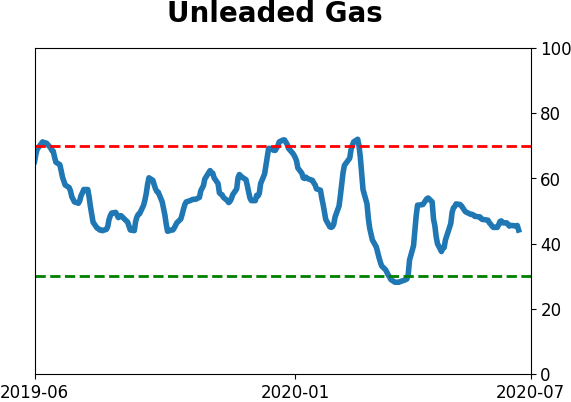
Commodity ETF's - 5-Day Moving Average
|
|