Headlines
|
|
Tech's streak is historic, beating every other sector by more than 5% this year:
The Nasdaq is up 19 out of 22 days, among the best streaks ever. Through 120 trading days of 2020, the tech sector is beating every other major sector by more than 5%. Not too many years since 1928 have seen tech stocks beat everything else by this much. It is especially extreme against industrial and financial stocks, both of which showed a tendency to reassert themselves in the months ahead.
Another nothing day: It seems like on big up days, everything rallies and on big down days, everything drops. That's not too far off base. Over the past 90 days, there have now been 20 "all or nothing" days, with NYSE Up Volume being either above 90% or below 10% like it was on Wednesday. Going back to 1962, the only periods that have exceeded this kind of volatility were November 2008 - March 2009 and September 2011 - February 2012. Both were volatile bottoming processes, for what that's worth.
Bottom line: - Weight of evidence suggests flat/lower stock prices short- to medium-term and higher prices long-term
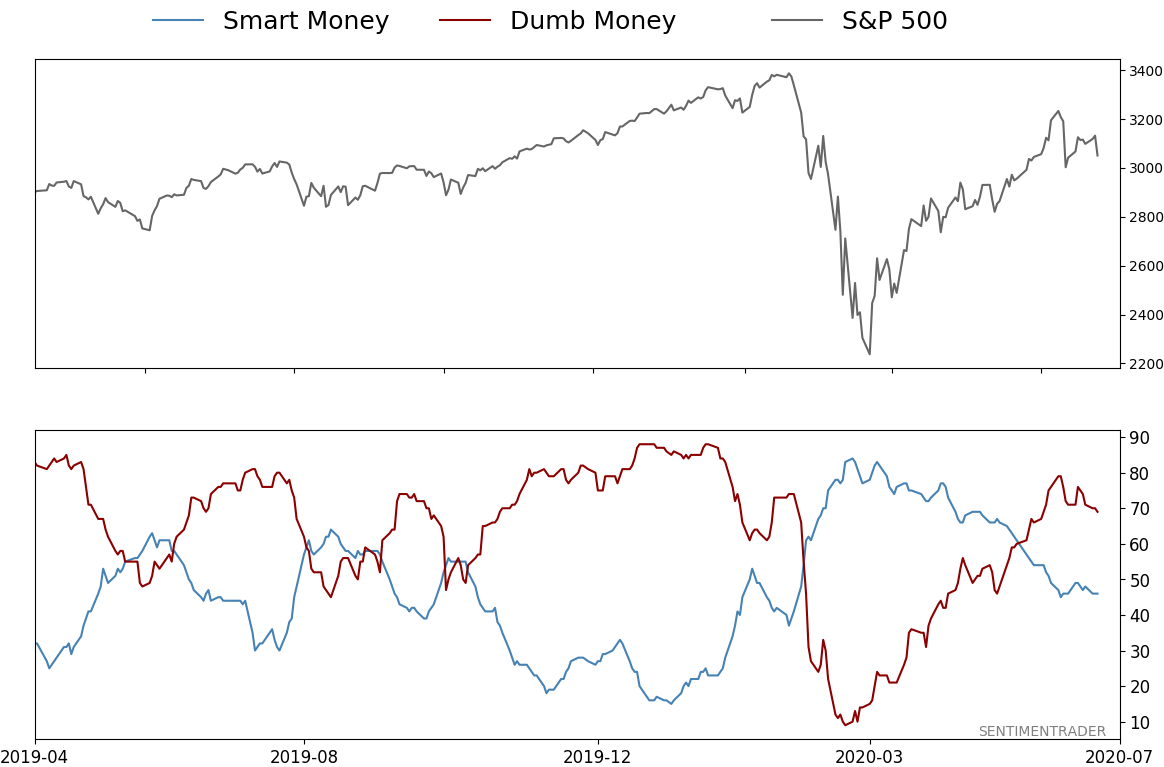
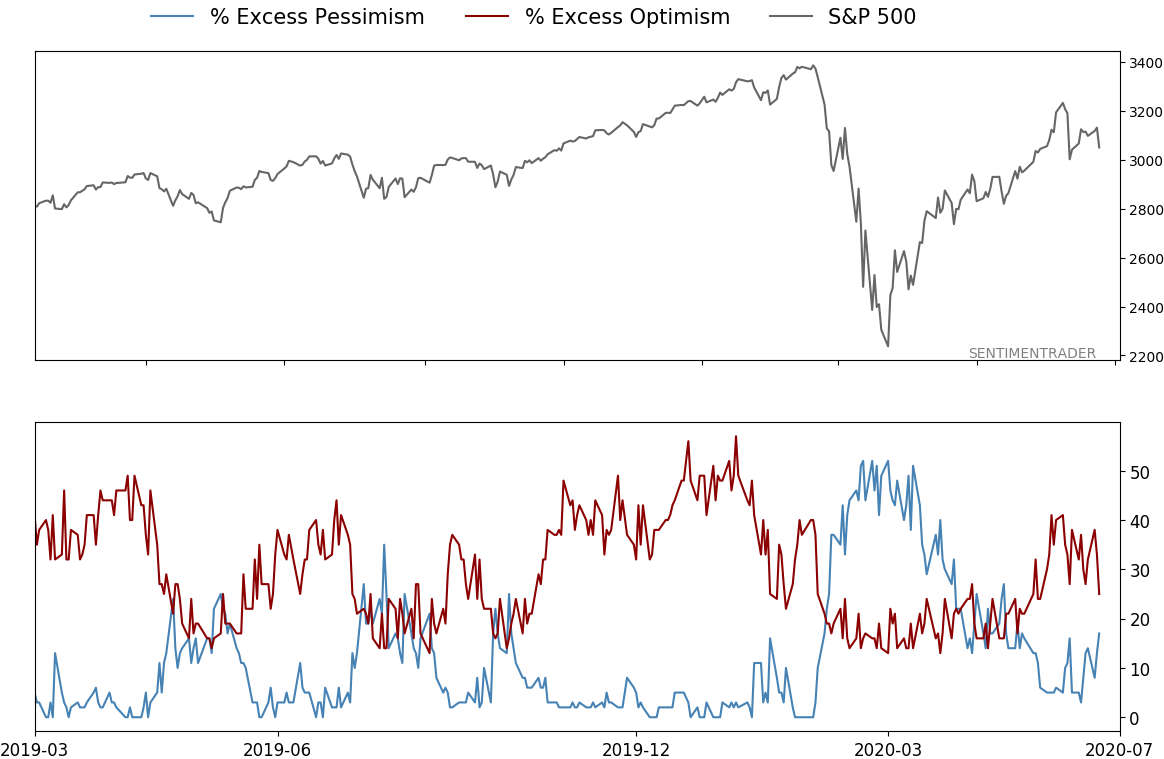
- Indicators are showing excessive optimism, as Dumb Money Confidence was recently near 80% with isolated signs of reckless speculation, during what appears to still be an unhealthy market environment
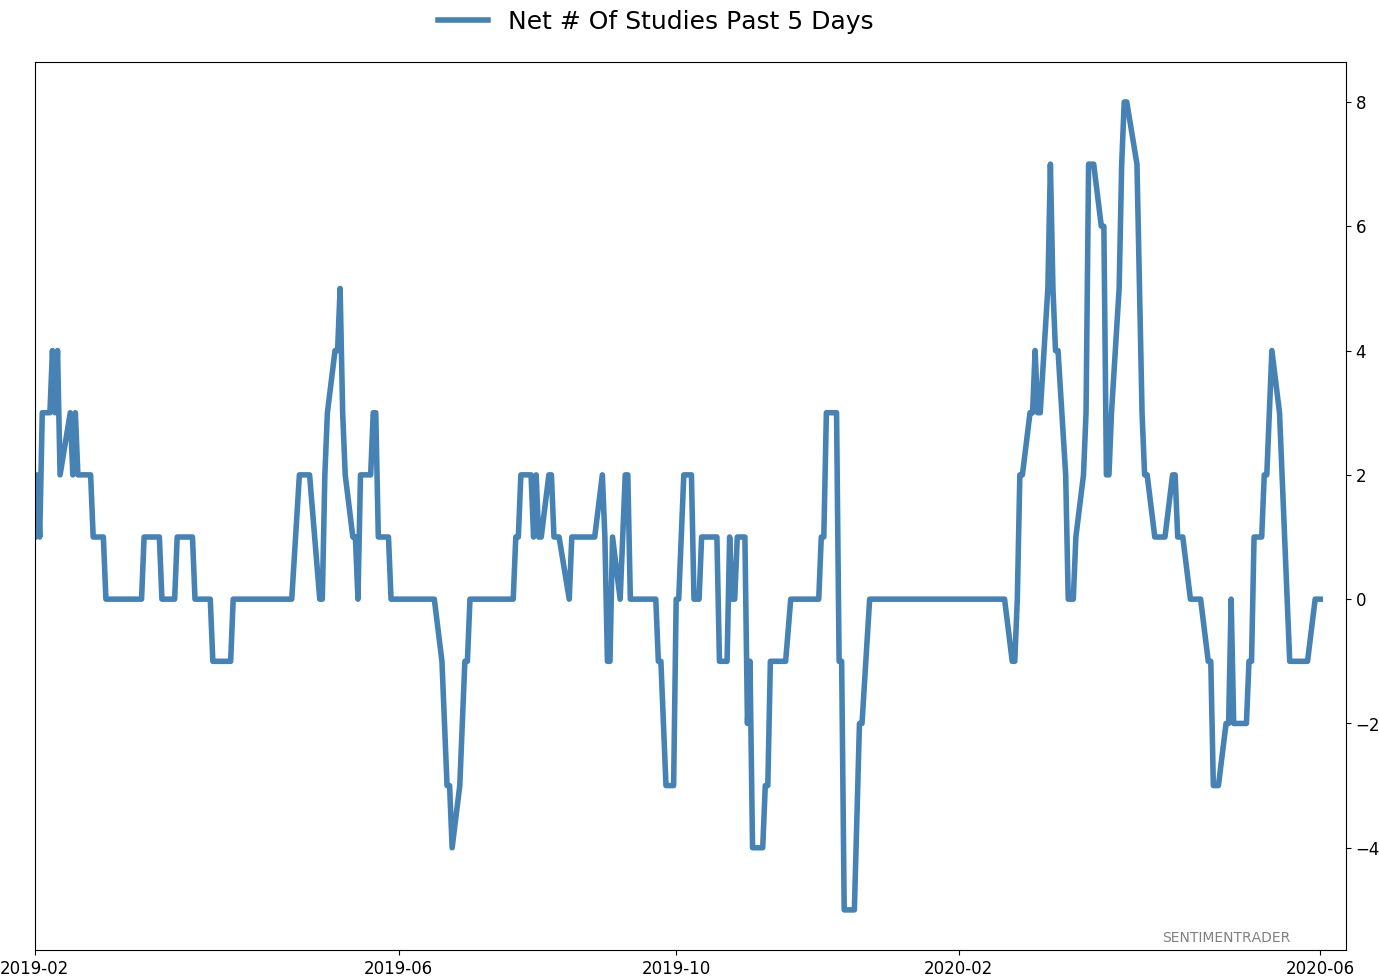
- Active Studies show a heavy positive skew over the medium- to long-term; breadth thrusts and recoveries have an almost unblemished record at preceding higher prices over a 6-12 month time frame
- Signs of extremely skewed preference for tech stocks nearing exhaustion, especially relative to industrials and financials (here and here)
- Indicators and studies for other markets are mixed with no strong conclusion
|
Smart / Dumb Money Confidence
|
Smart Money Confidence: 46%
Dumb Money Confidence: 69%
|
|
Risk Levels
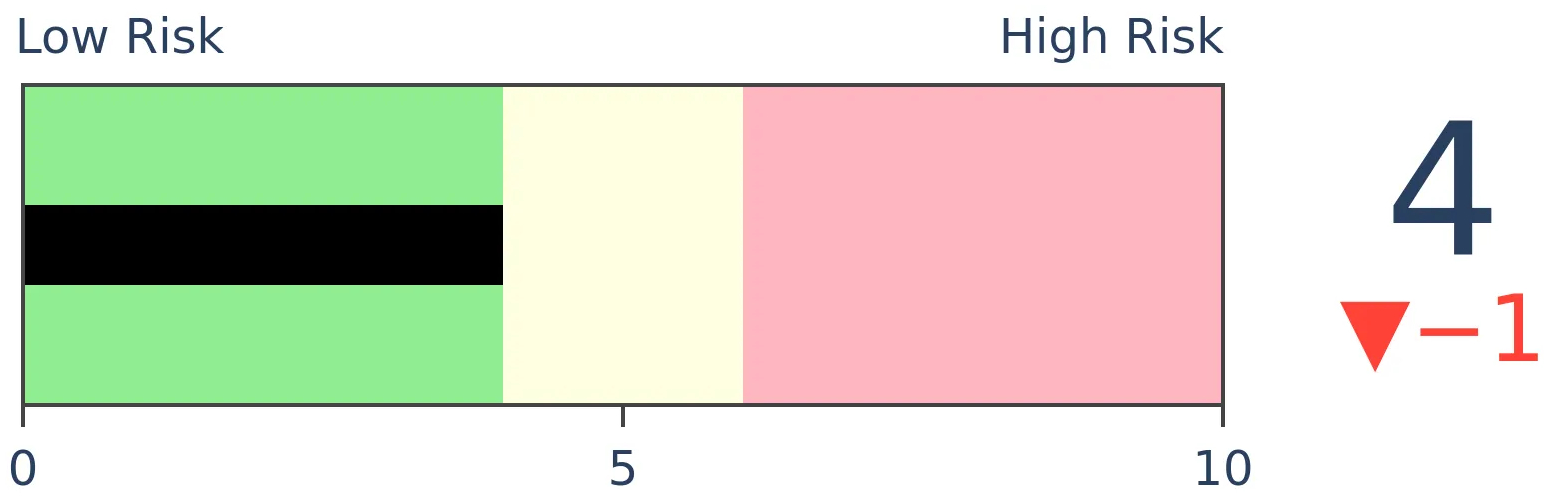
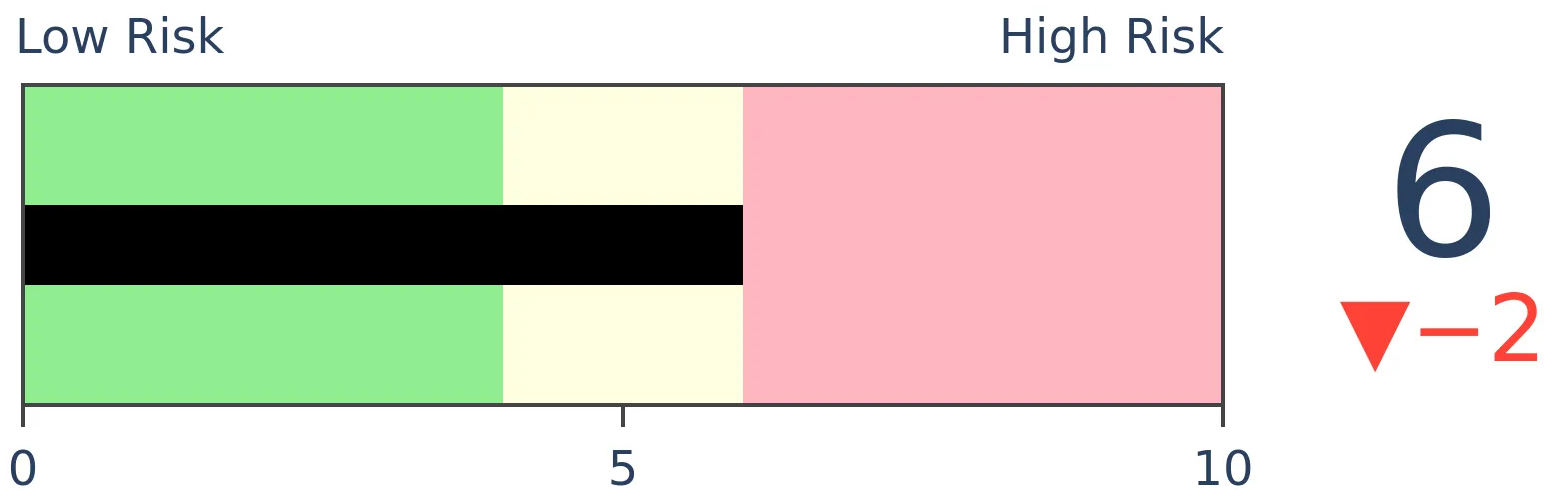
Stocks Short-Term
|
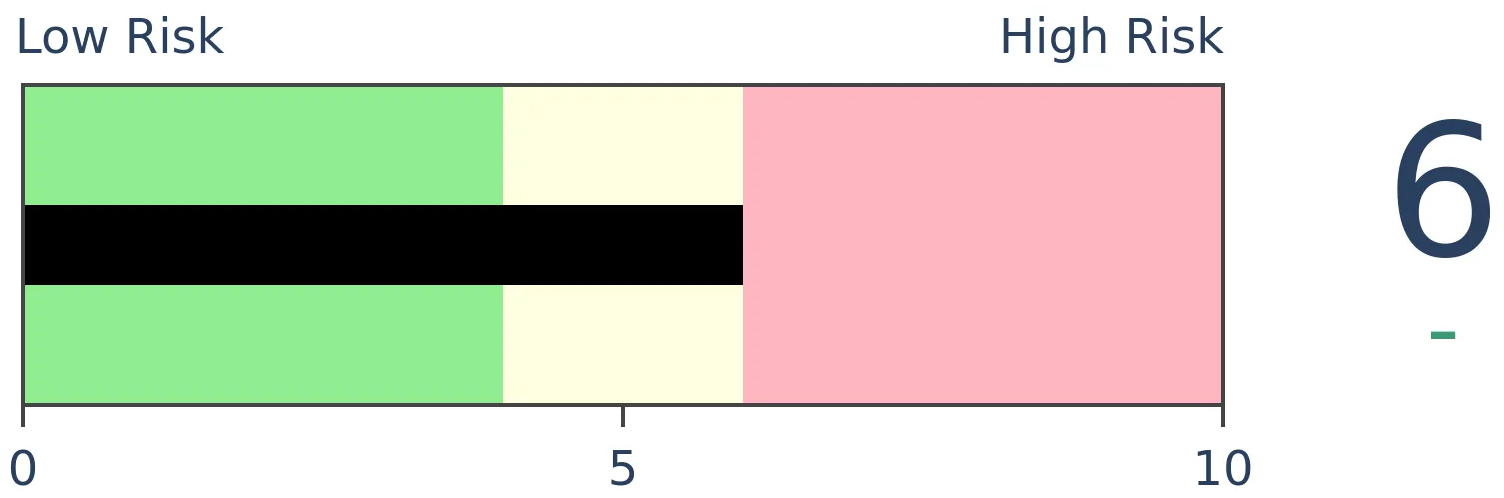
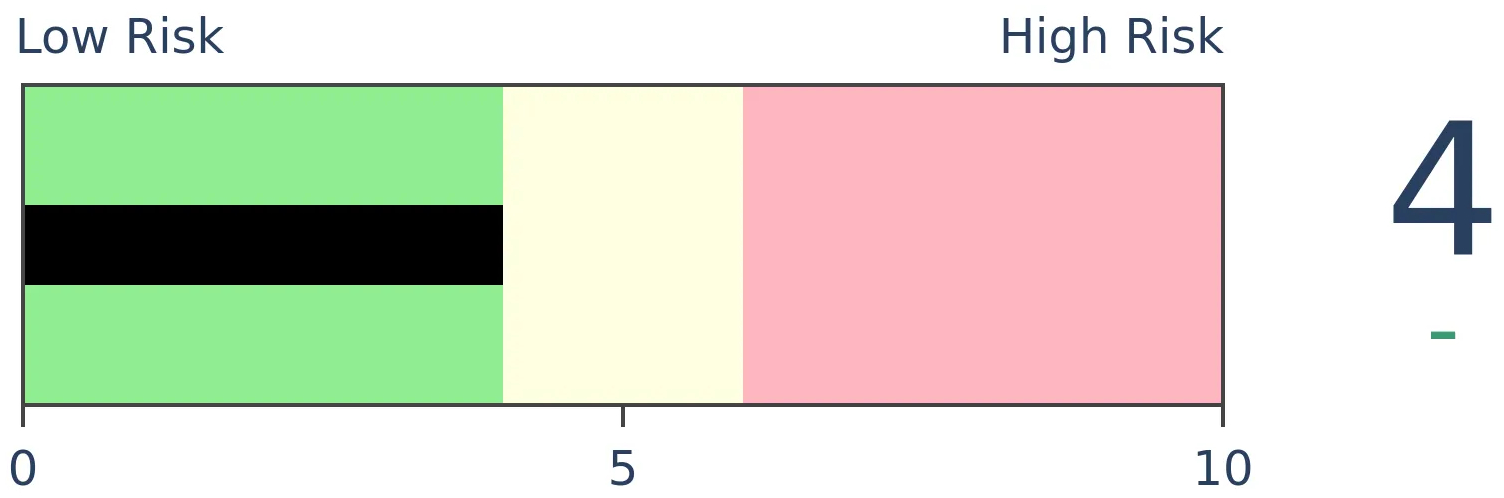
Stocks Medium-Term
|
|
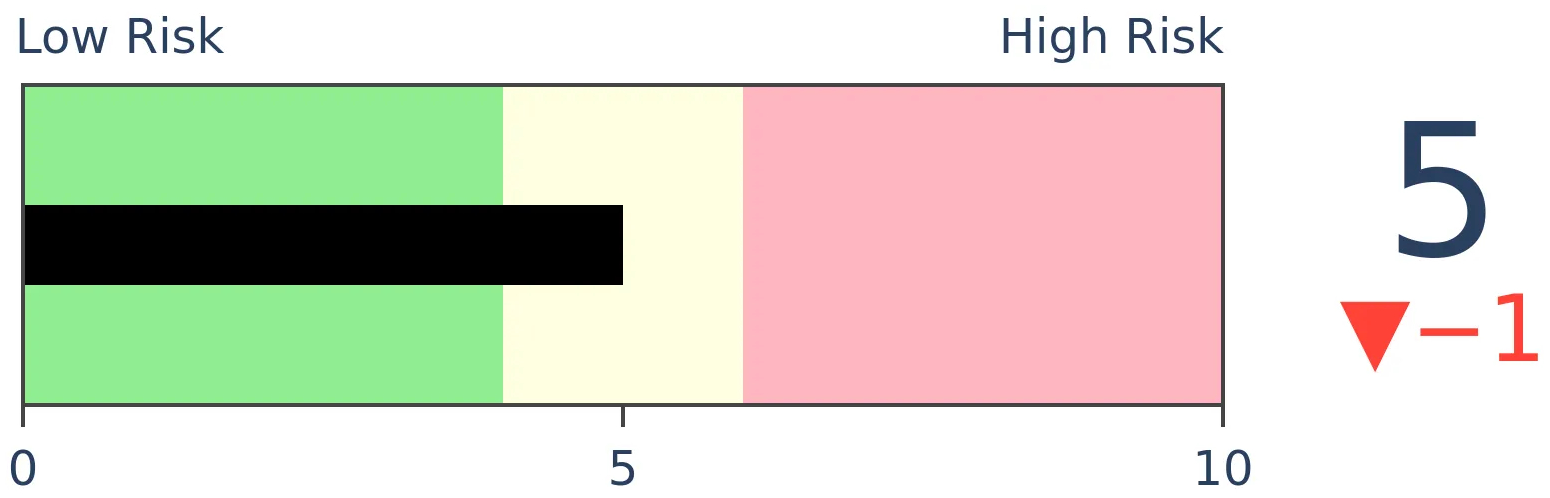
Bonds
|
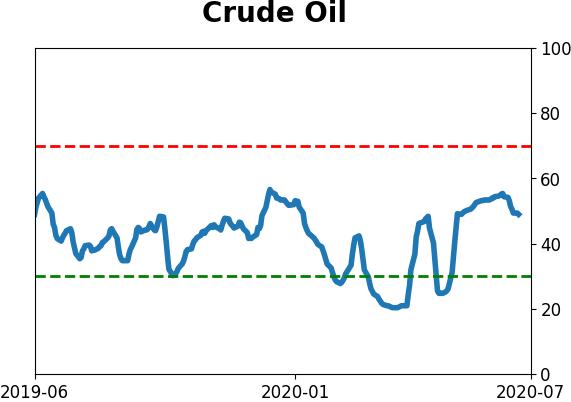
Crude Oil
|
|
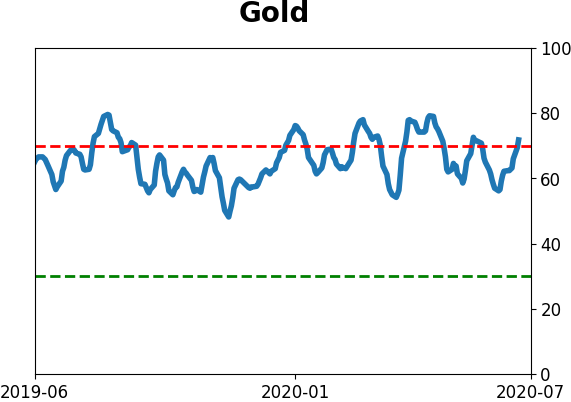
Gold

|
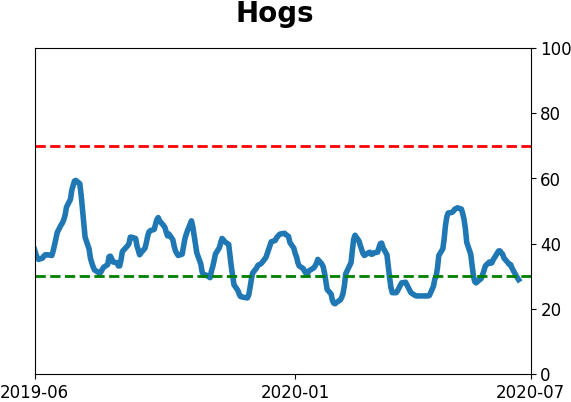
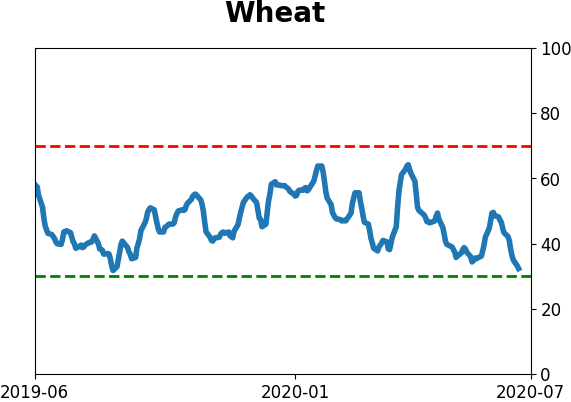
Agriculture
|
|
Research
BOTTOM LINE
The Nasdaq is up 19 out of 22 days, among the best streaks ever. Through 120 trading days of 2020, the tech sector is beating every other major sector by more than 5%. Not too many years since 1928 have seen tech stocks beat everything else by this much. It is especially extreme against industrial and financial stocks, both of which showed a tendency to reassert themselves in the months ahead.
FORECAST / TIMEFRAME
None
|
We just finished 120 trading sessions of 2020, and one pattern is clear. It's no surprise - tech rules the kingdom.
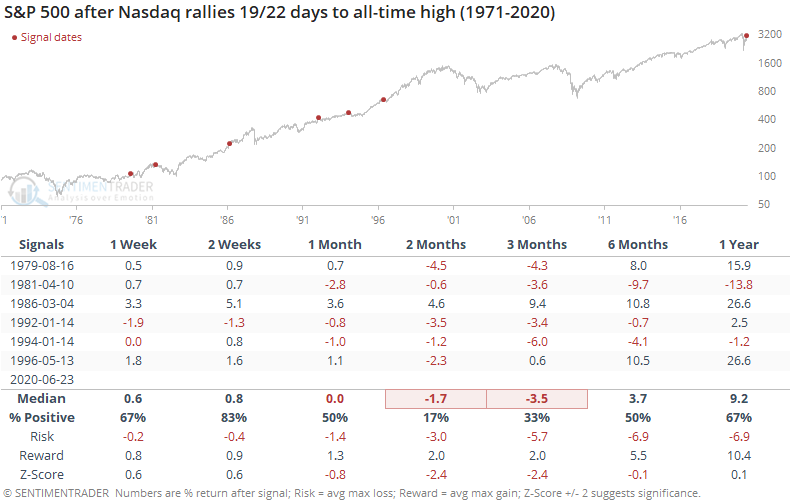
The Nasdaq Composite rallied 19 out of 22 days heading into Wednesday. That's a tie for the best streak in almost 25 years.
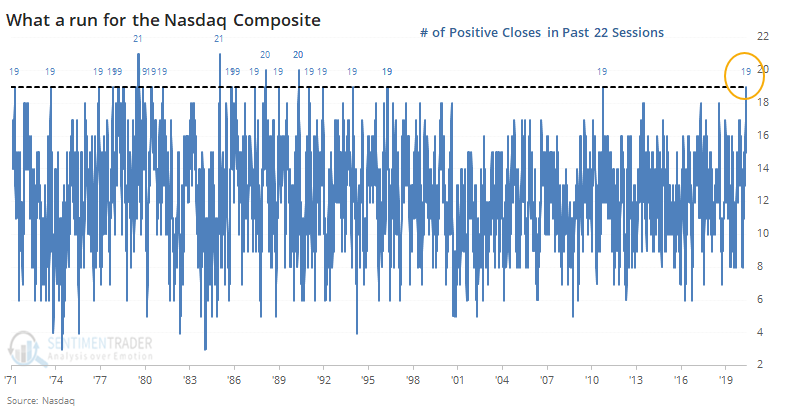
It also notched an all-time high for good measure. It hasn't enjoyed this kind of a run since the 1990s.
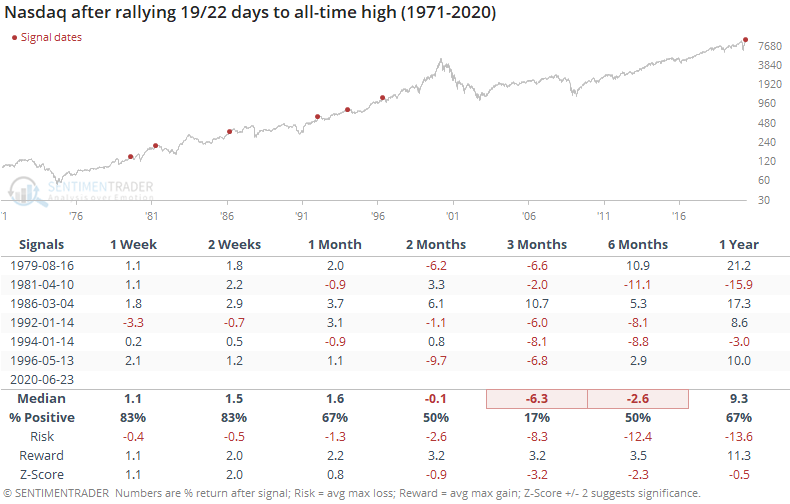
The only time the tech-heavy index managed to escape unscathed (for a while) from this kind of buying spurt was in March 1986. All the others showed lower prices over the next three months.
It was also negative for the S&P 500, with the losses occurring quicker than they did for the Nasdaq (a reflection of momentum persistency).
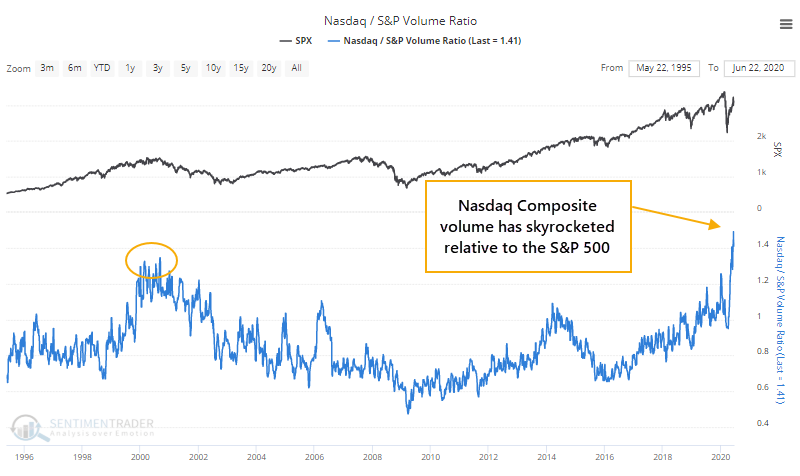
As Troy noted earlier, volume has been jumping in Nasdaq stocks relative to other parts of the market. The version we show on the site compares a 10-day average of Nasdaq Composite volume to S&P 500 volume. It just curled down from an all-time high.
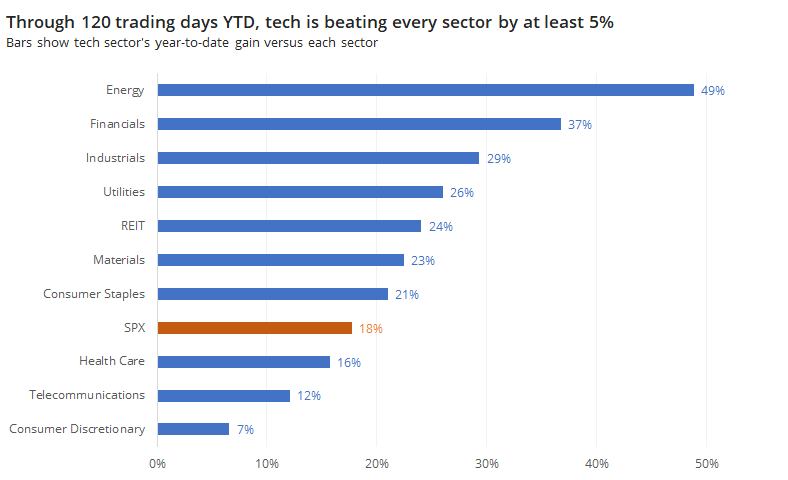
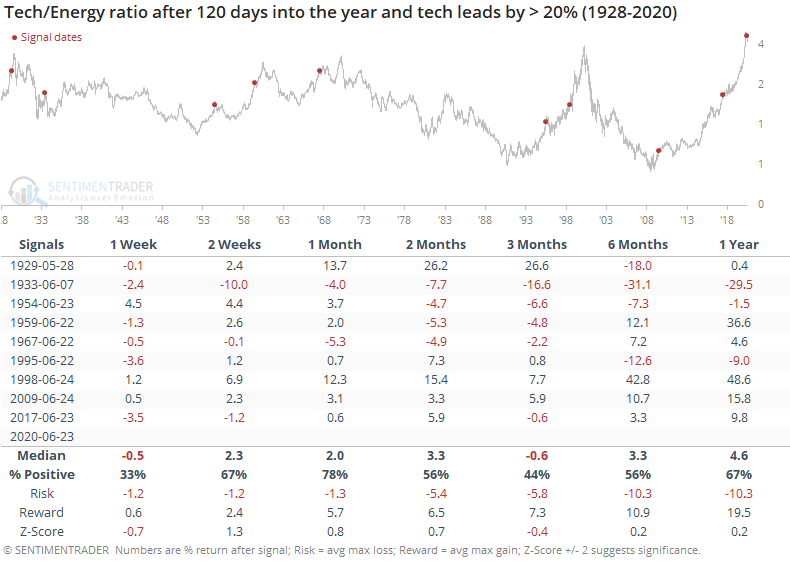
Year-to-date, the technology sector is beating every major sector by more than 5%. Its lead over energy is a whopping 49%, while the sector closest on its heels is consumer discretionary, and even that is lagging by 7%.
Going back to 1928, there haven't been too many years when tech has been such a winner.
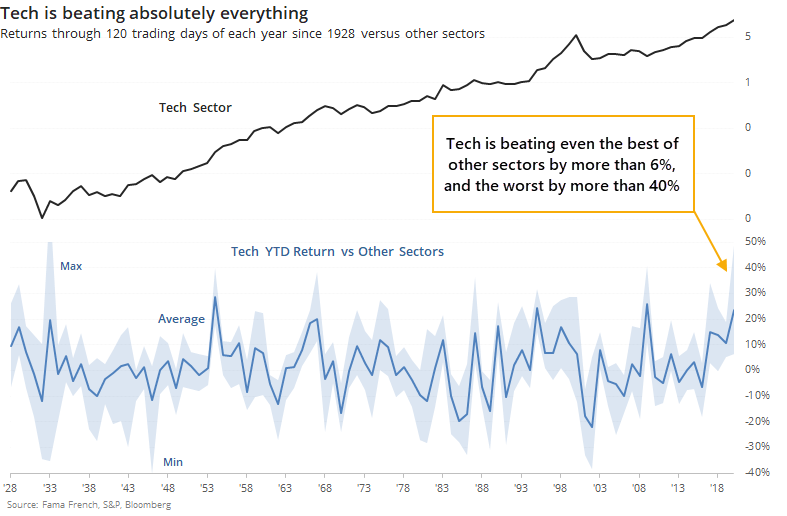
The table below shows returns in the tech sector after every year since 1928 when the sector was beating all other sectors by at least 5% through 120 trading days of a year.
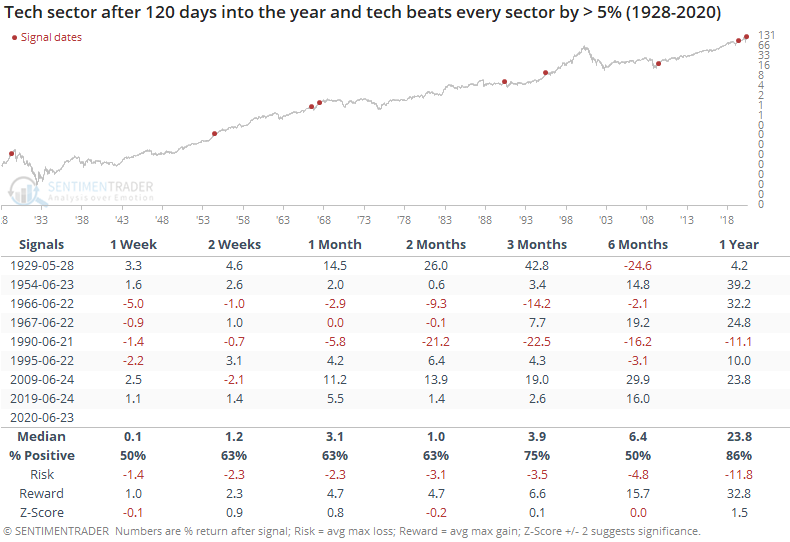
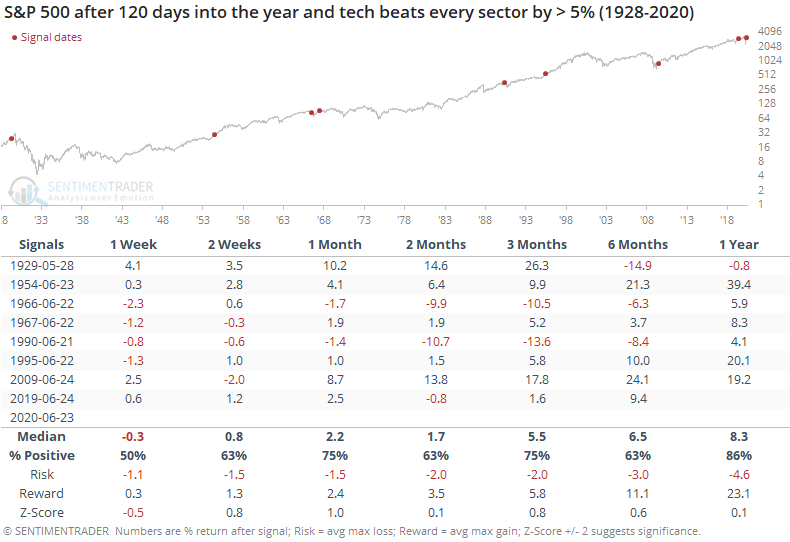
Returns weren't bad, but not great, either. Tech's returns were about in line with random across most time frames. For the S&P, it was about the same, but a bit more positive.
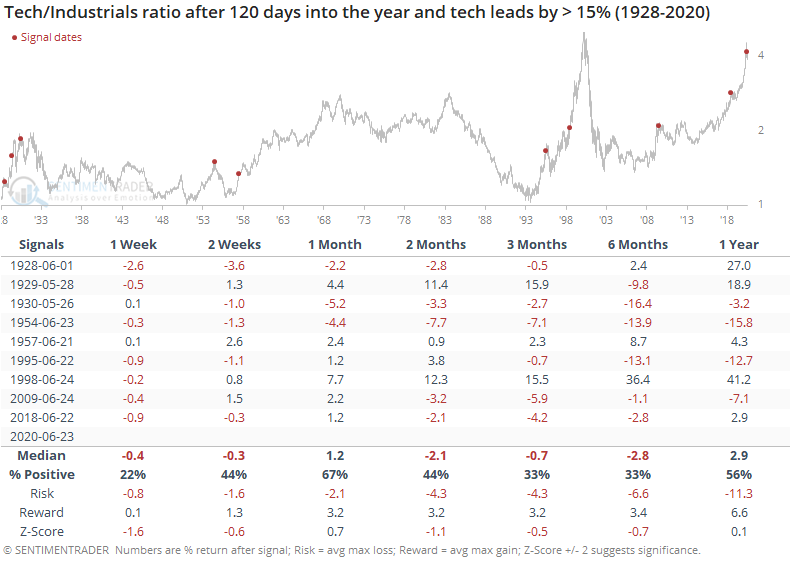
Among sectors, this year's tech outperformance is especially notable against industrials, financials, and energy stocks. Tech's outperformance this year ranks as the most extreme, or nearly so, versus each of those sectors.
We already saw that its weight in the S&P is approaching 30-year extremes versus industrials and financials, and it's just as extreme when going back much further.
Tech is beating industrial stocks by more than 29% so far this year. Only 2009 saw a greater spread between the two, and that just barely. Other times tech beat this sector by more than 15% through the approximate half-way point of the year, it tended to relatively struggle over the next 3-6 months.
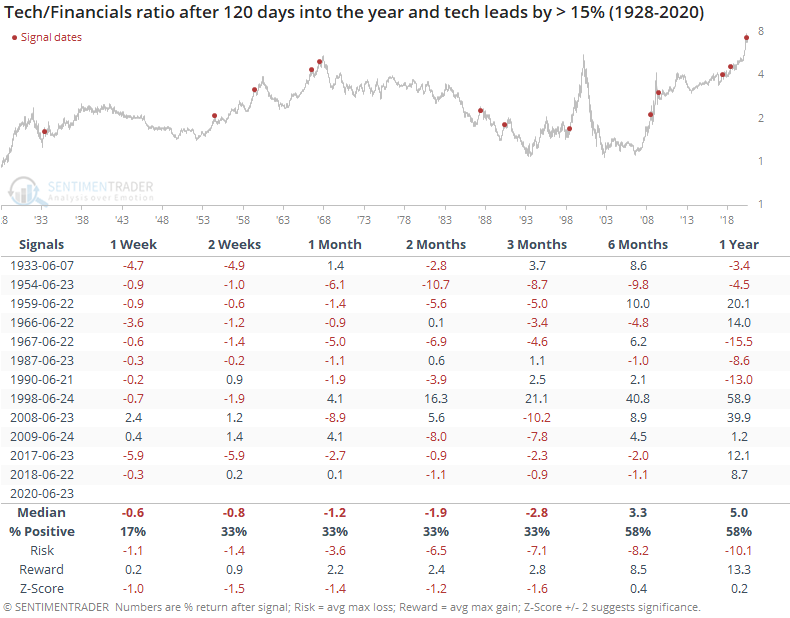
Tech is beating the financial sector by more than 36%, the most ever. The next most extreme outperformance through 120 days was 29% in 2009. Other times it was beating financial stocks by more than 15%, tech had a strong tendency to give back some relative performance.
It's beating energy by more than 48%, also the most ever. The next most extreme was 34% in 2017. Those stocks had less of a tendency to rebound against tech, though.
Maybe there is a signal in the fact that only the first half of 2009 saw technology stocks lead other sectors by this much, in particular industrials and financials. Even then, and supported by lesser extremes, tech stocks started to become exhausted versus the other sectors.
It's a suggestion that while excuses could be made why 2020 is different, historically tech stocks have started to give back some relative performance against more meat-and-potatoes sectors after leading by this much through this part of the year.
Active Studies
| Time Frame | Bullish | Bearish | | Short-Term | 0 | 1 | | Medium-Term | 8 | 6 | | Long-Term | 40 | 1 |
|
Indicators at Extremes
Portfolio
| Position | Weight % | Added / Reduced | Date | | Stocks | 29.8 | Reduced 9.1% | 2020-06-11 | | Bonds | 0.0 | Reduced 6.7% | 2020-02-28 | | Commodities | 5.2 | Added 2.4%
| 2020-02-28 | | Precious Metals | 0.0 | Reduced 3.6% | 2020-02-28 | | Special Situations | 0.0 | Reduced 31.9% | 2020-03-17 | | Cash | 65.0 | | |
|
Updates (Changes made today are underlined)
In the first months of the year, we saw manic trading activity. From big jumps in specific stocks to historic highs in retail trading activity to record highs in household confidence to almost unbelievable confidence among options traders. All of that came amid a market where the average stock couldn't keep up with their indexes. There were signs of waning momentum in stocks underlying the major averages, which started triggering technical warning signs in late January. After stocks bottomed on the 23rd, they enjoyed a historic buying thrust and retraced a larger amount of the decline than "just a bear market rally" tends to. Those thrusts are the most encouraging sign we've seen in years. Through early June, we were still seeing thrusts that have led to recoveries in longer-term breadth metrics. The longer-term prospects for stocks (6-12 months) still look decent given the above. On a short- to medium-term basis, it was getting harder to make that case. Dumb Money Confidence spiked and there were multiple signs of a historic level of speculation. This is likely the lowest I will go given what I still consider to be compelling positives over a longer time frame. There is not a slam-dunk case to be made for either direction, so it will seem like a mistake whether stocks keep dropping (why didn't I sell more?) or if they turn and head higher (why did I let short-term concerns prevail?). After nearly three decades of trading, I've learned to let go of the idea of perfection.
RETURN YTD: -6.5% 2019: 12.6%, 2018: 0.6%, 2017: 3.8%, 2016: 17.1%, 2015: 9.2%, 2014: 14.5%, 2013: 2.2%, 2012: 10.8%, 2011: 16.5%, 2010: 15.3%, 2009: 23.9%, 2008: 16.2%, 2007: 7.8%
|
|
Phase Table
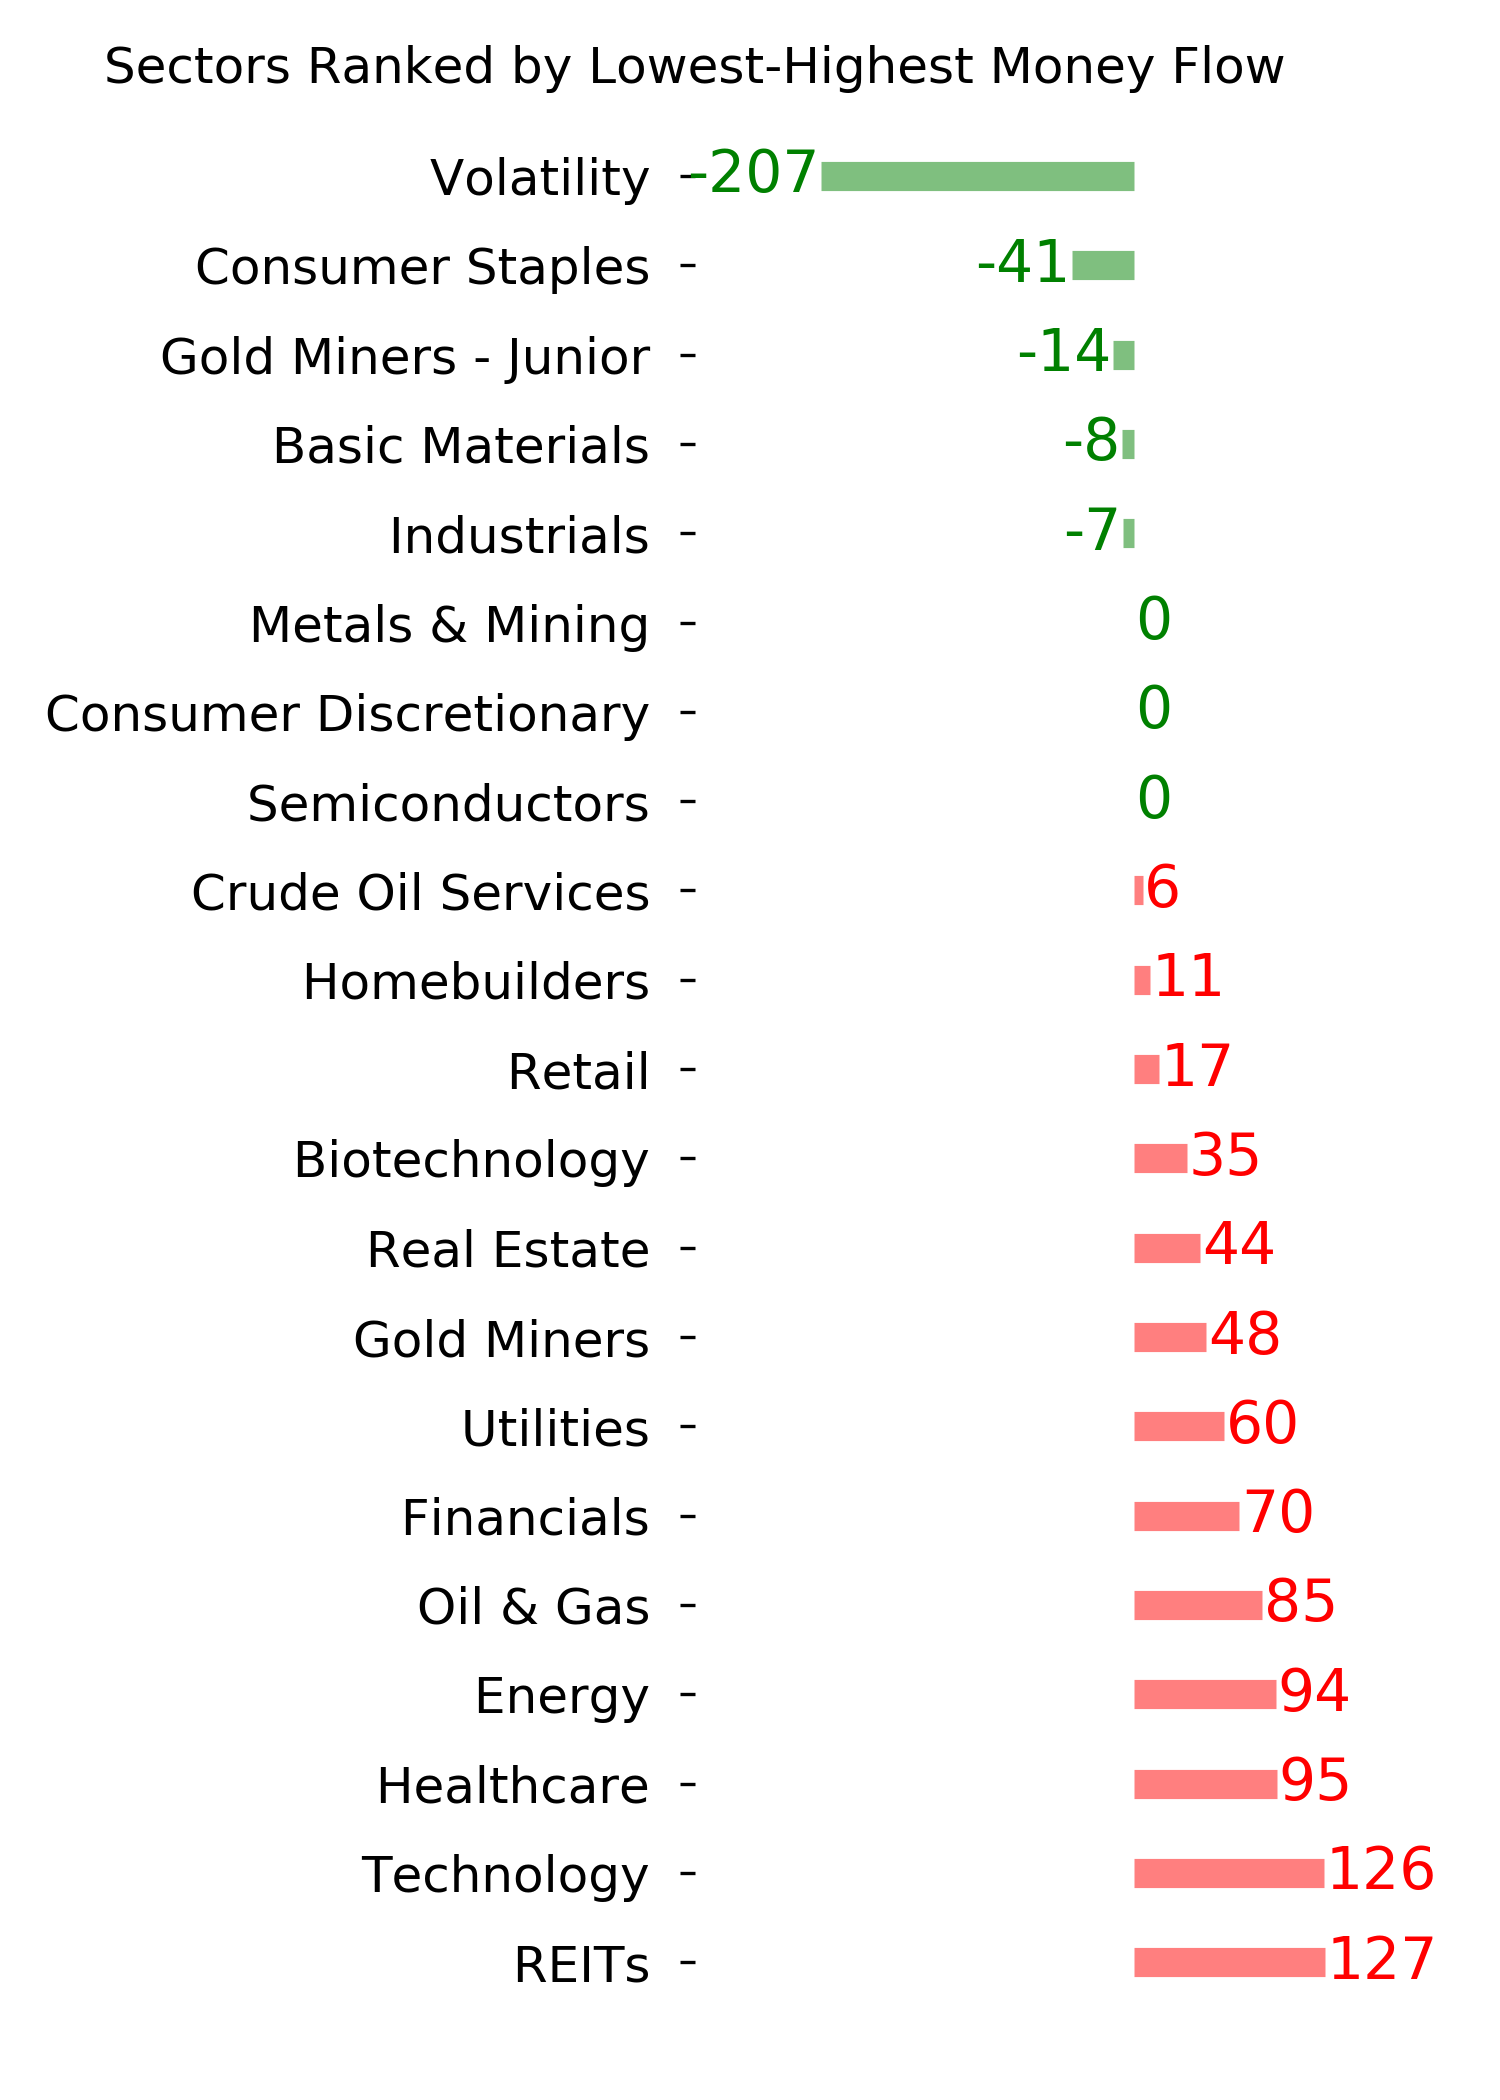
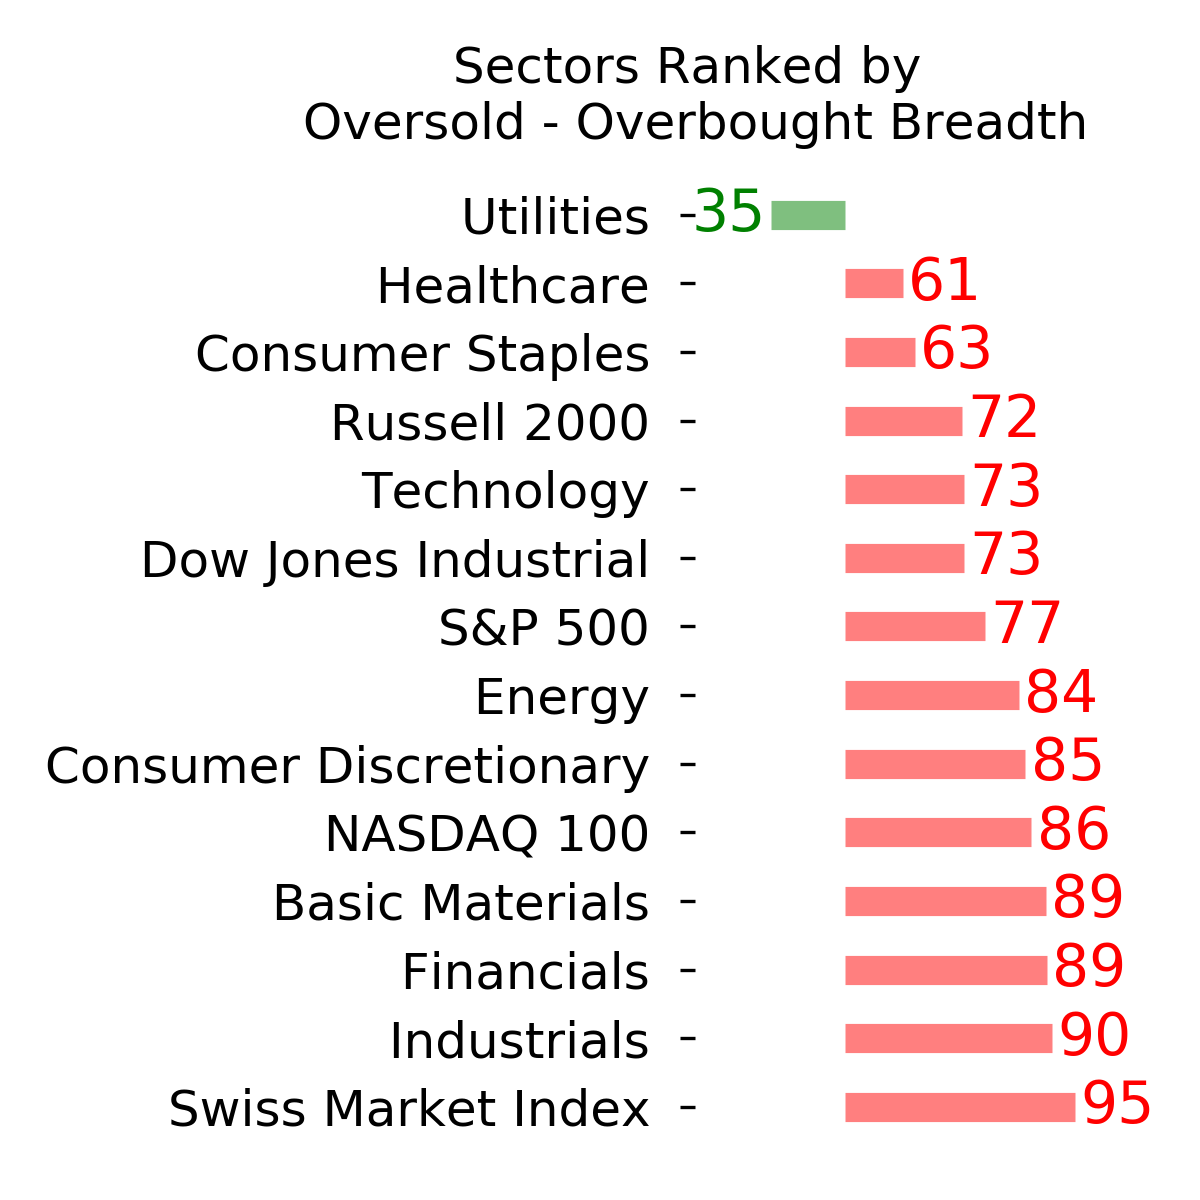
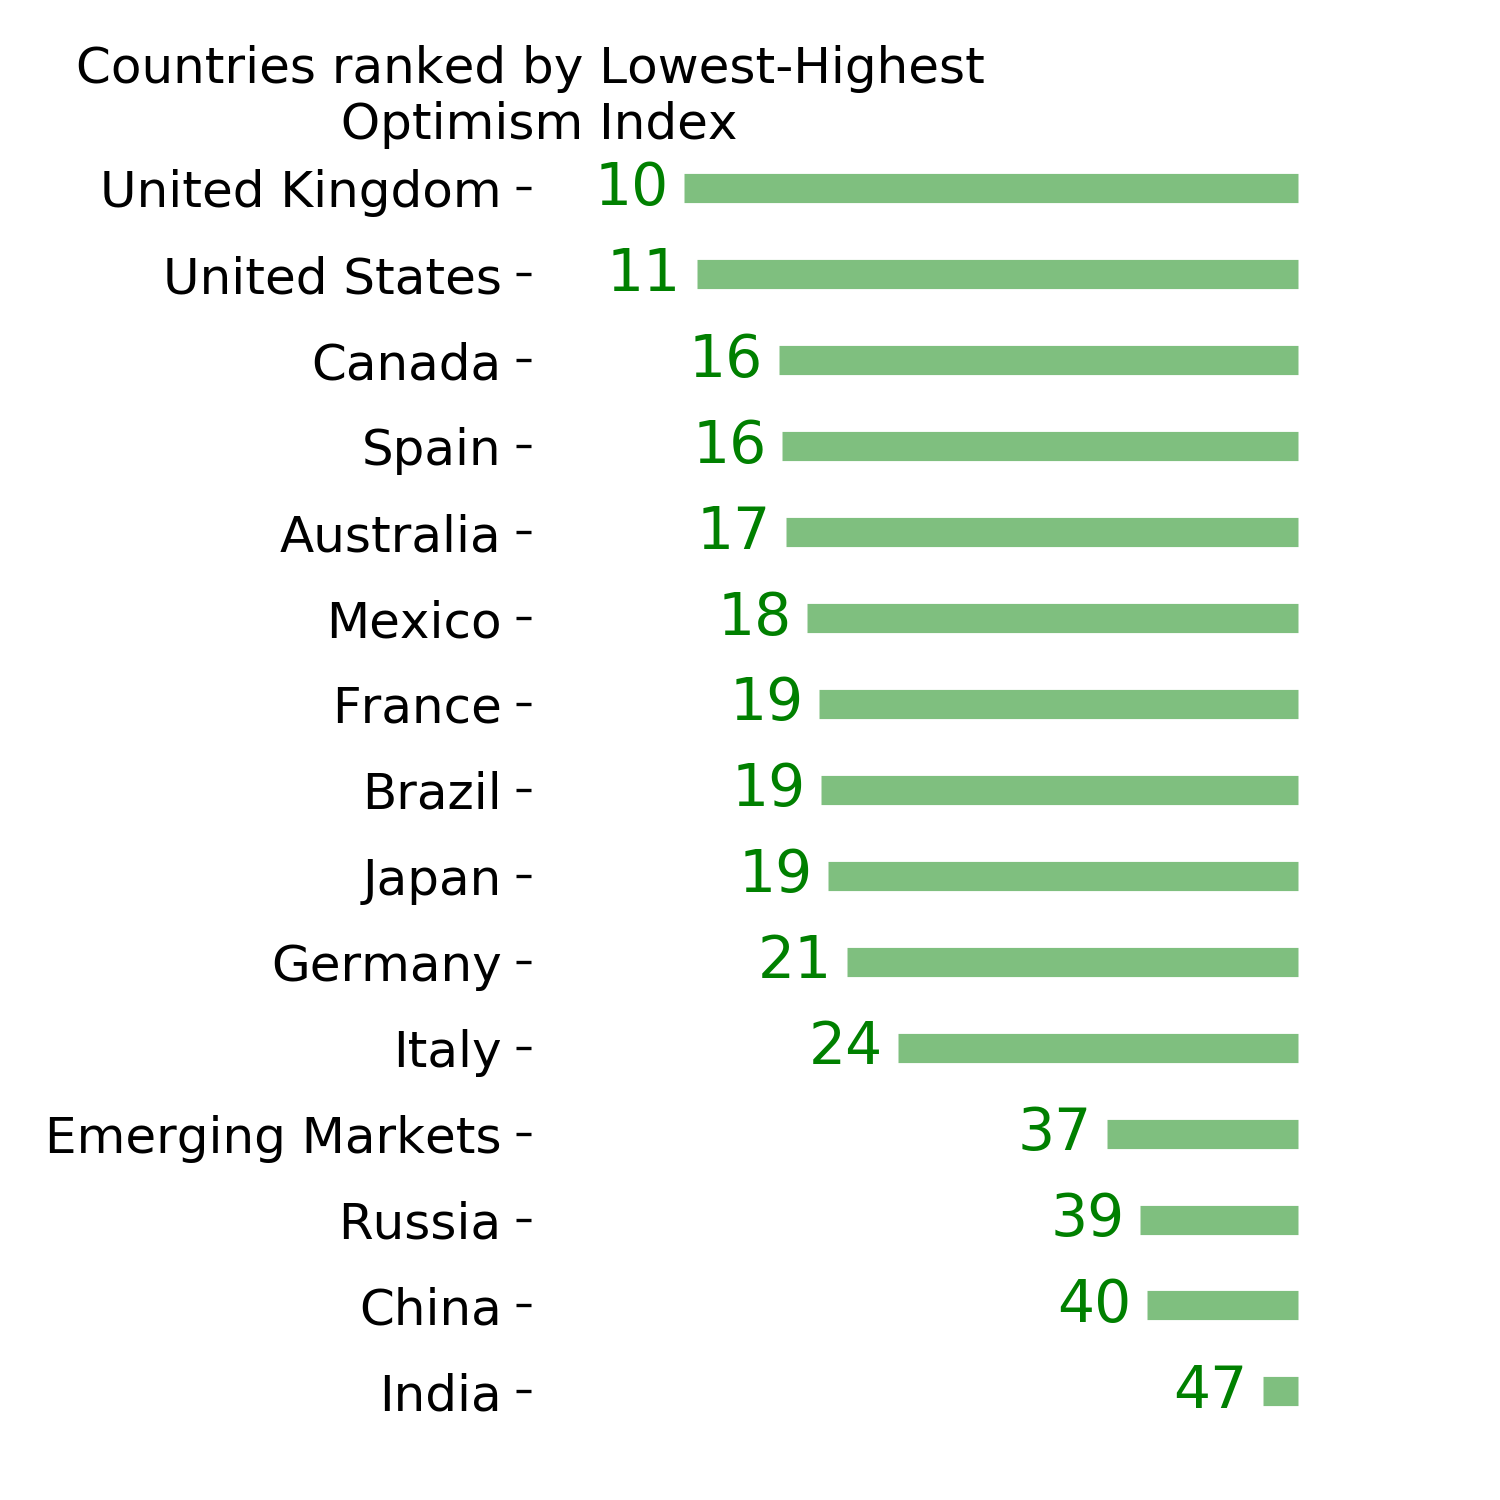
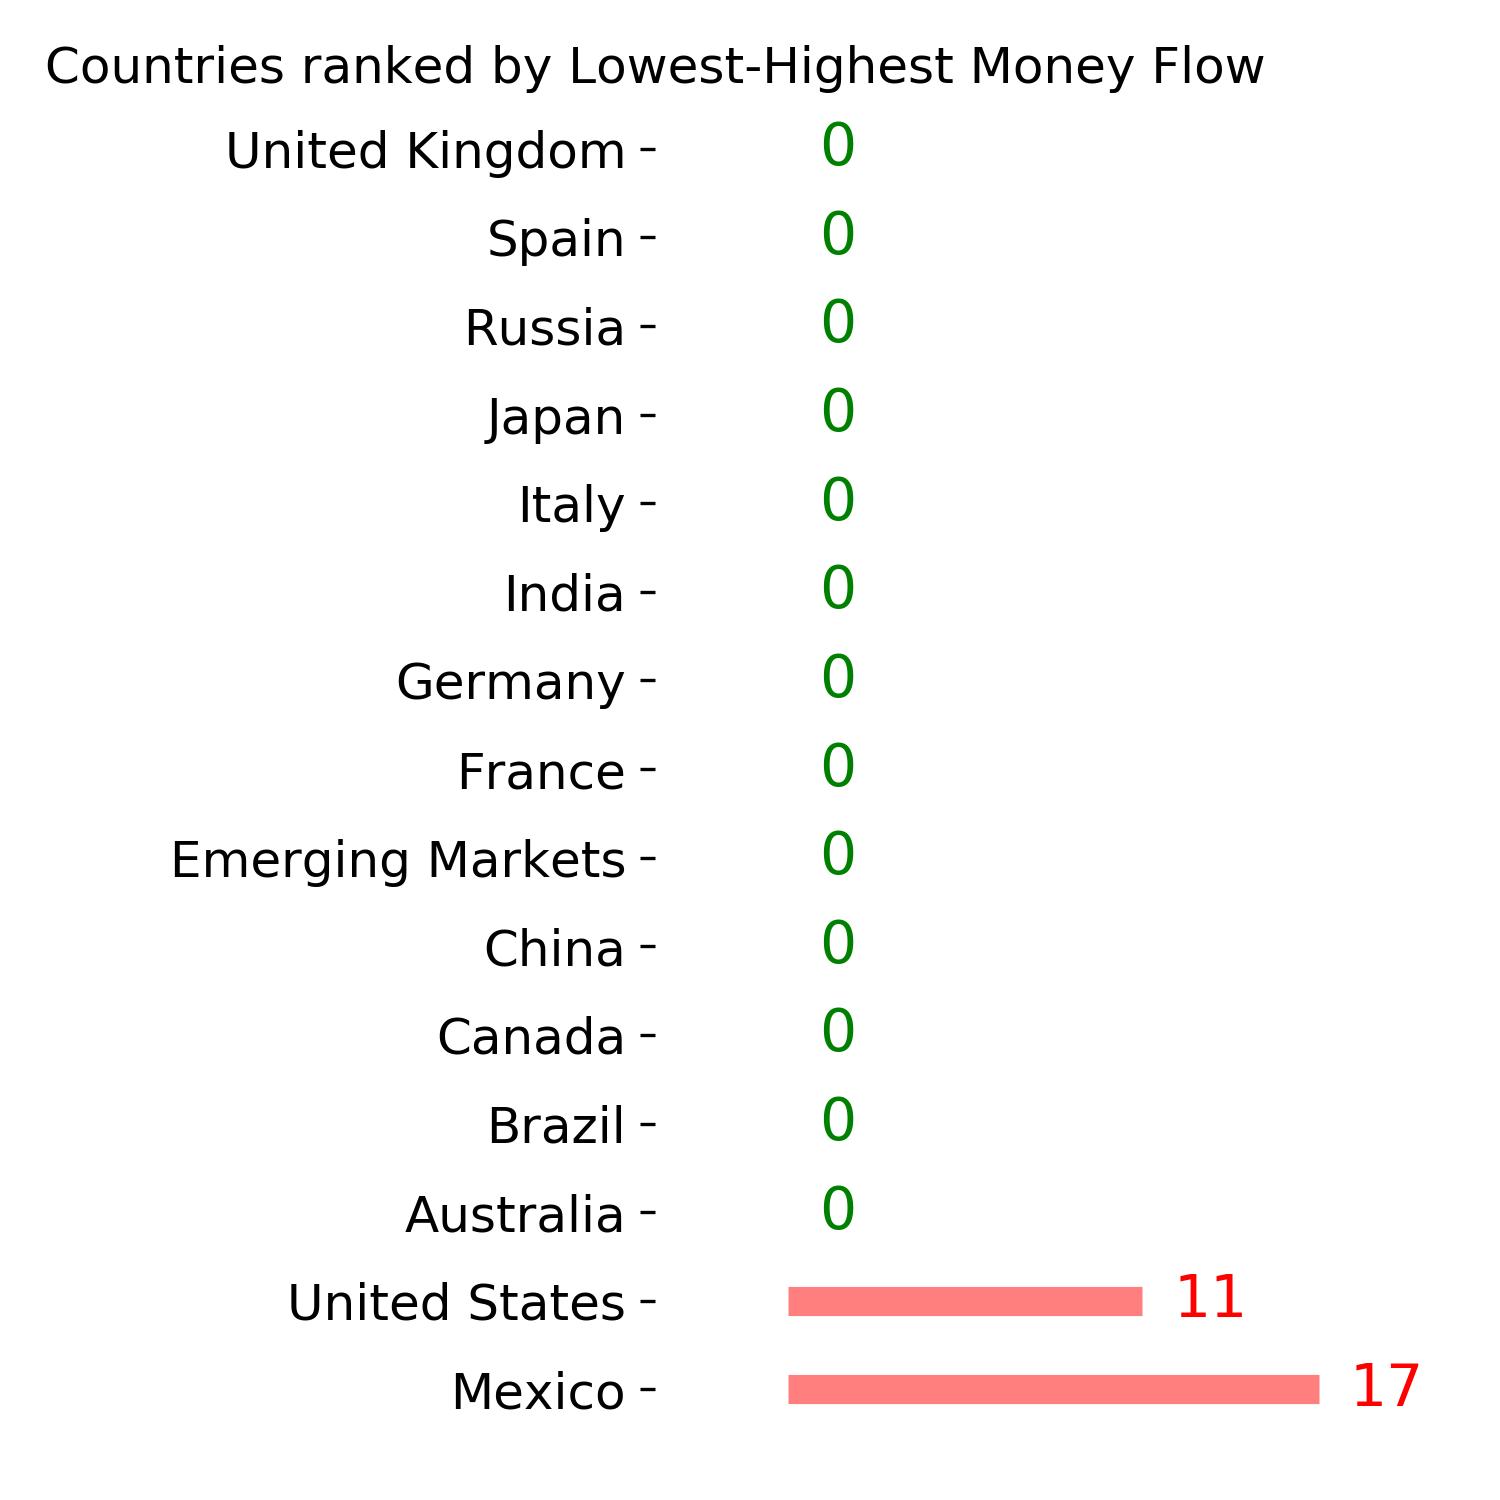
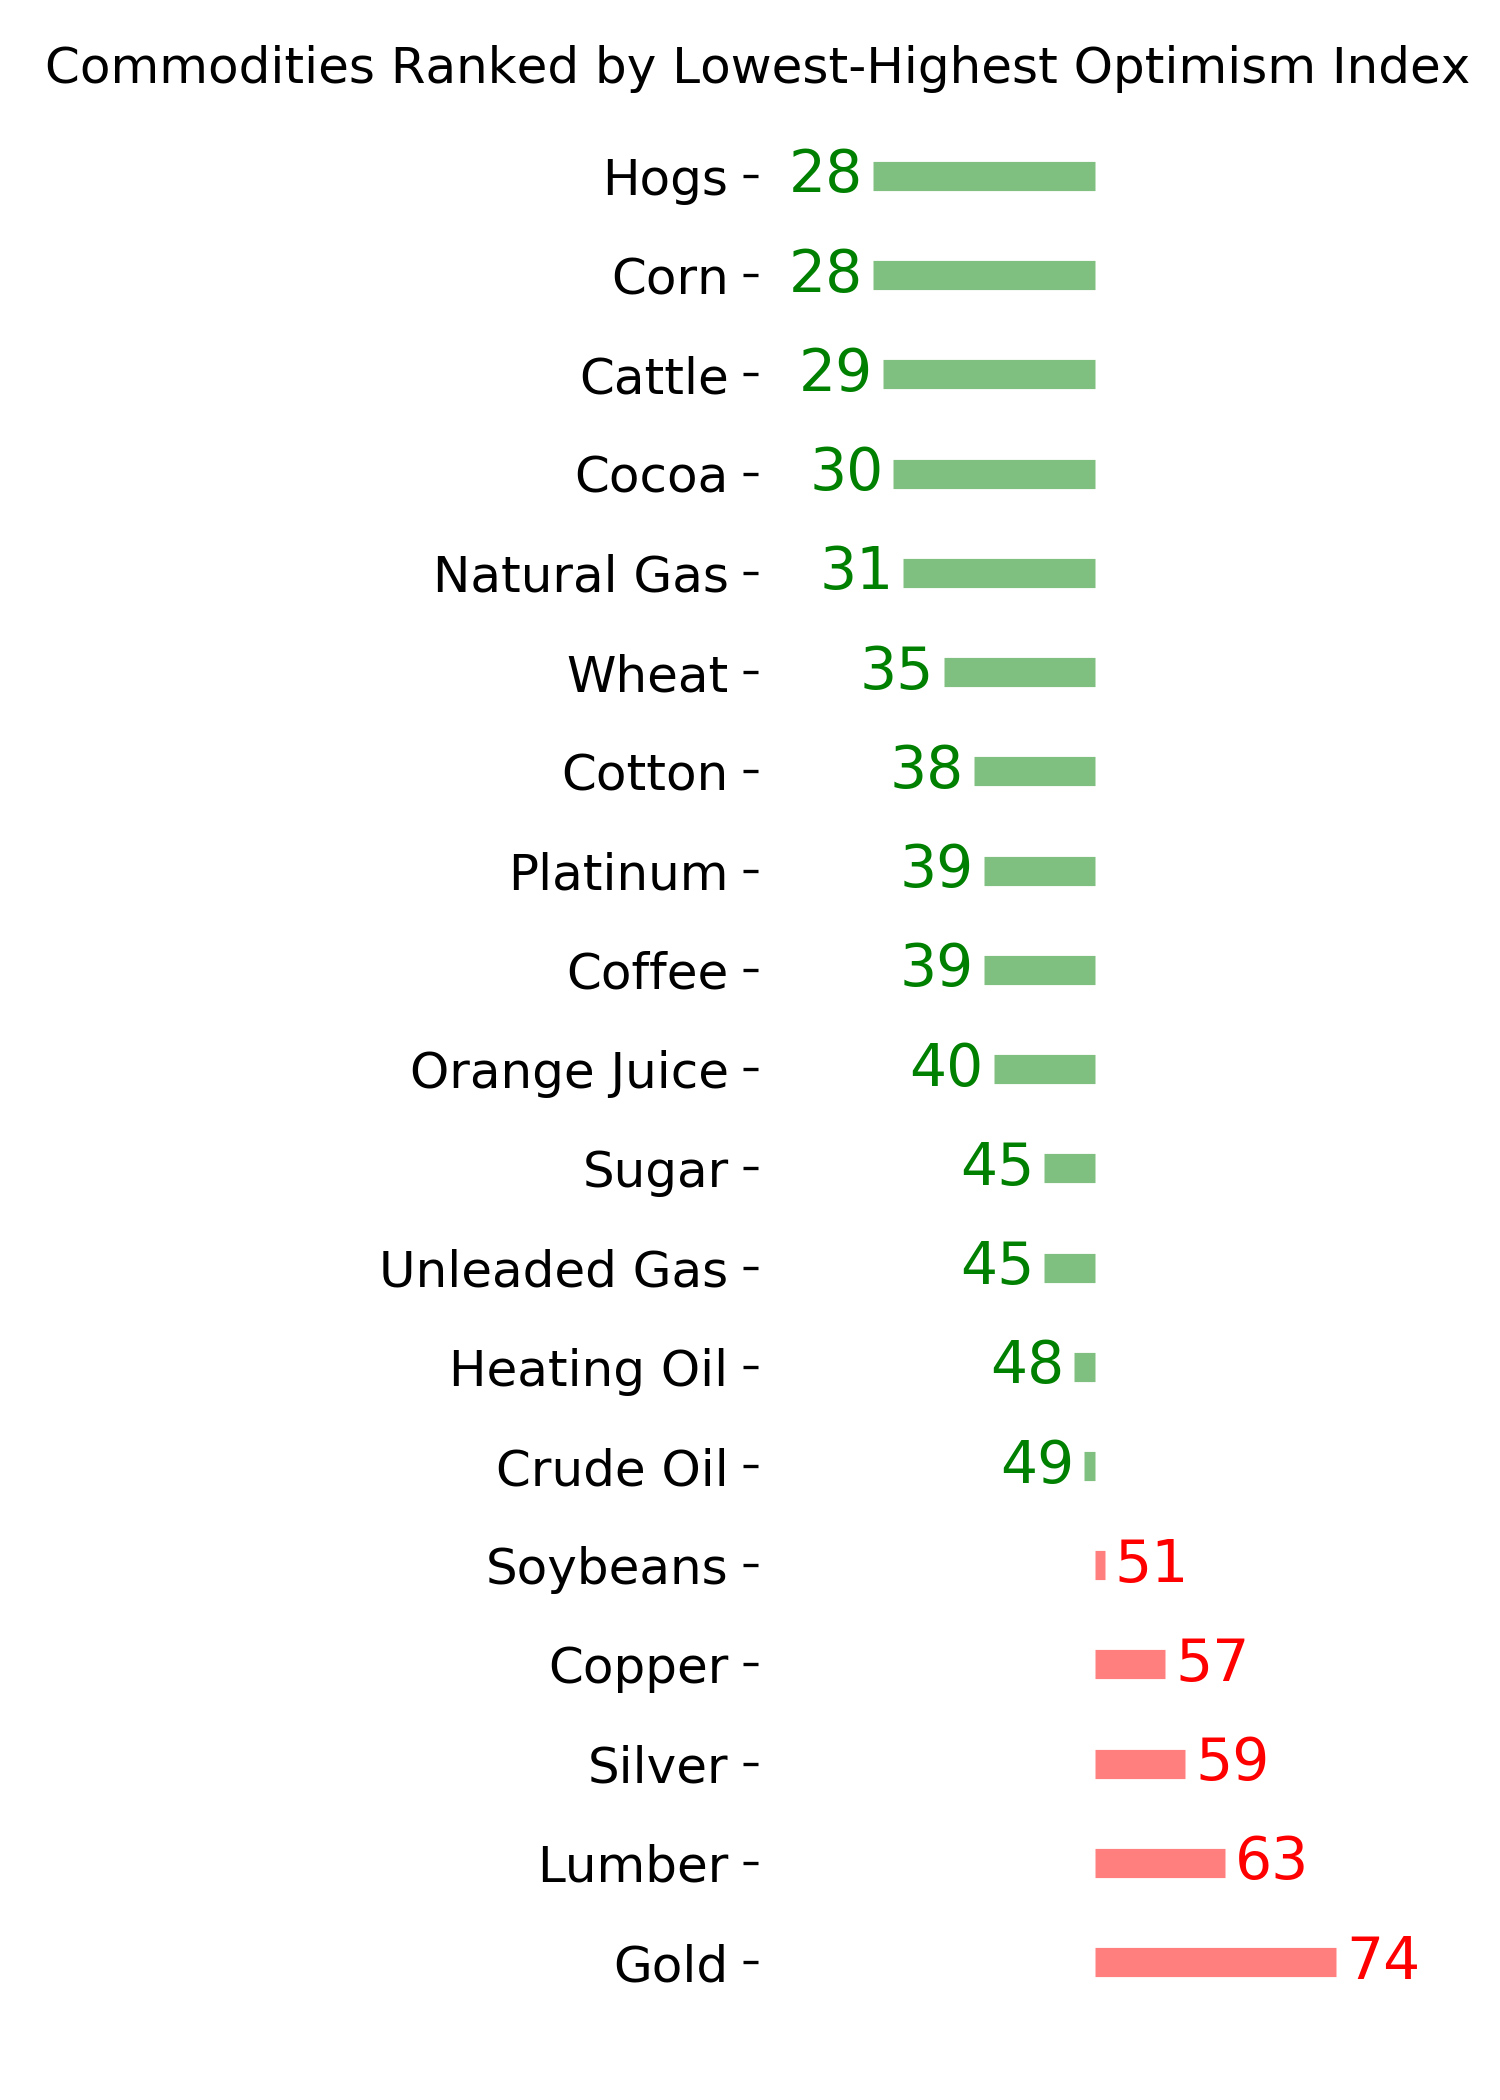
Ranks
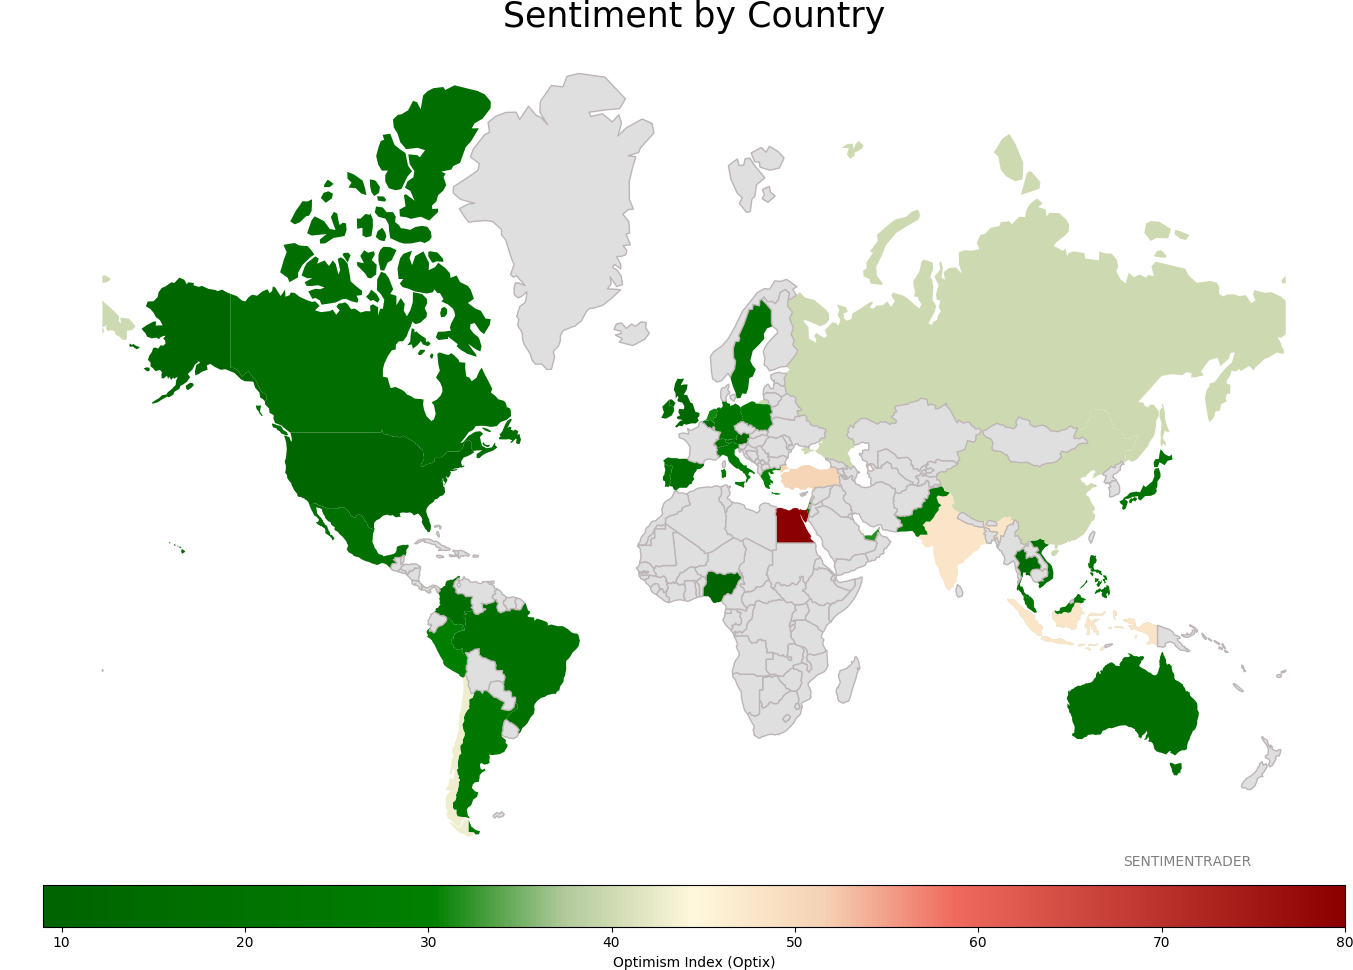
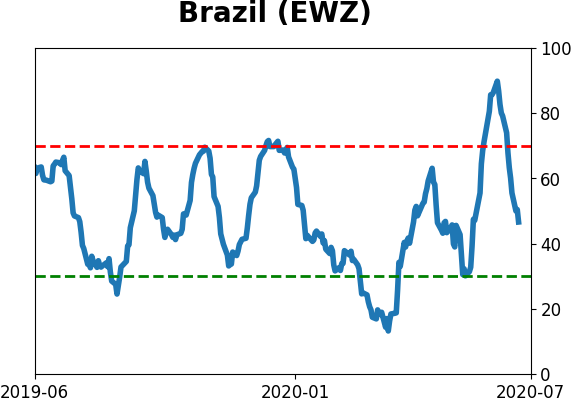
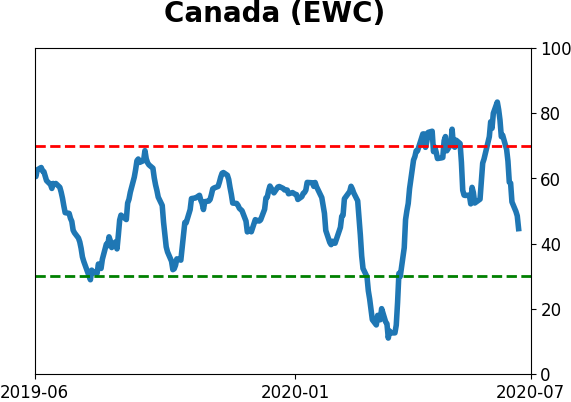
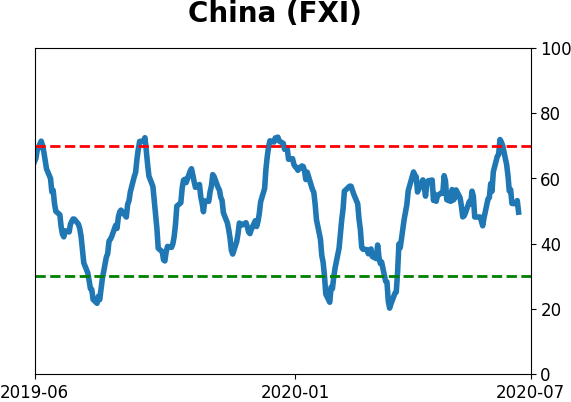
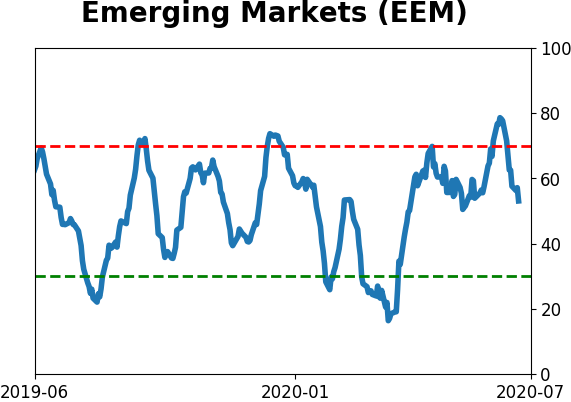
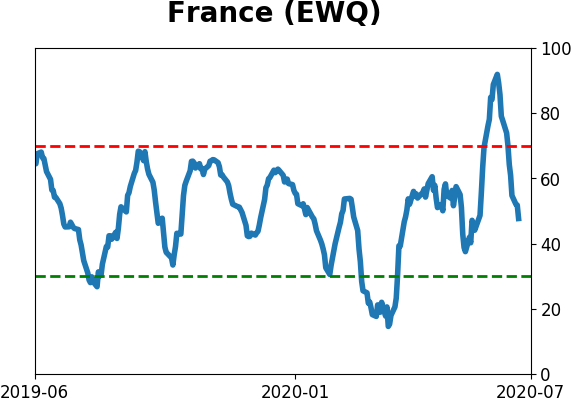
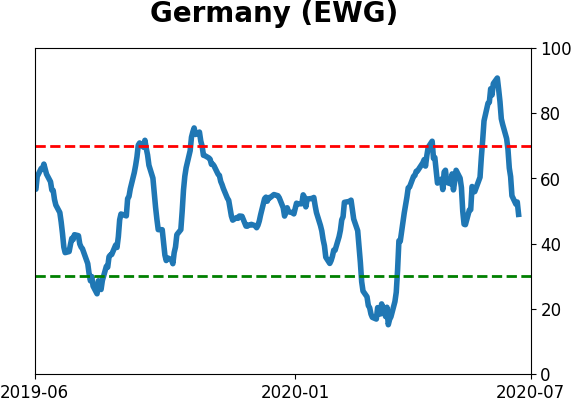
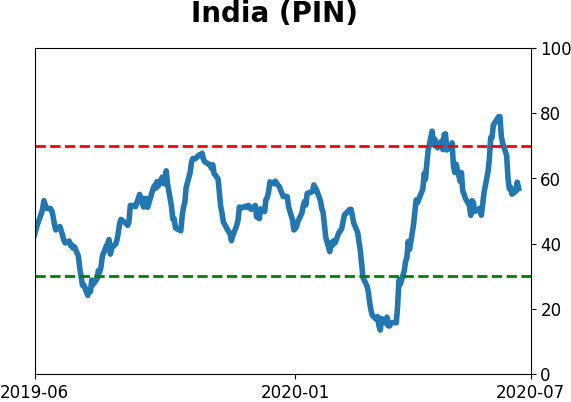
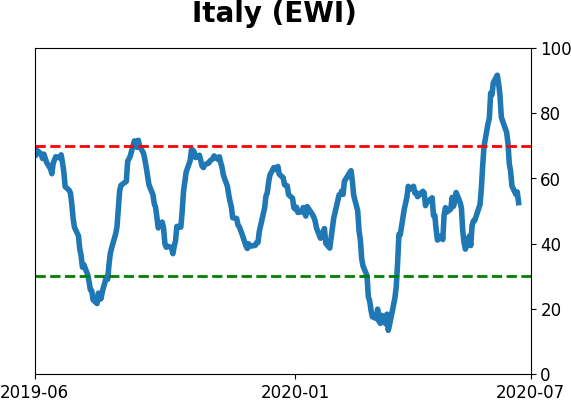
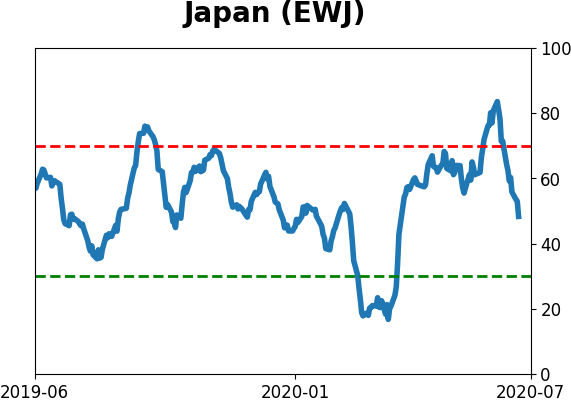
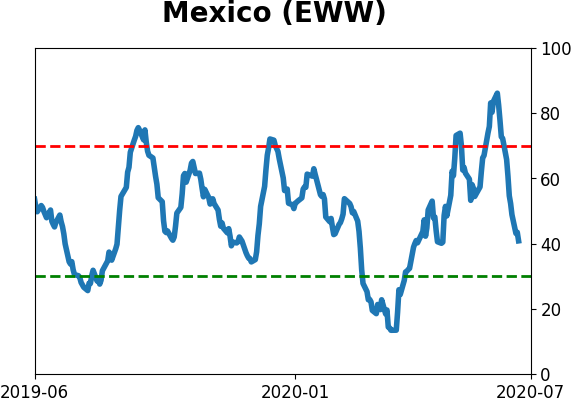
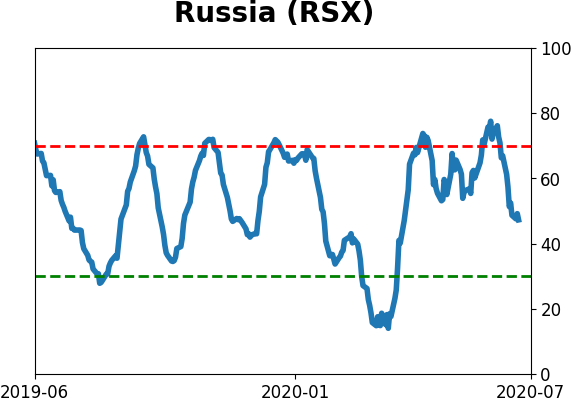
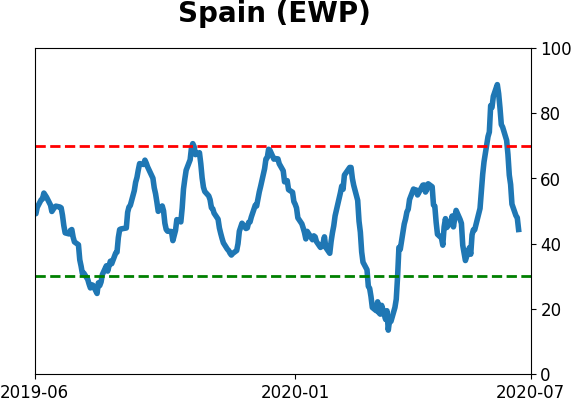
Sentiment Around The World
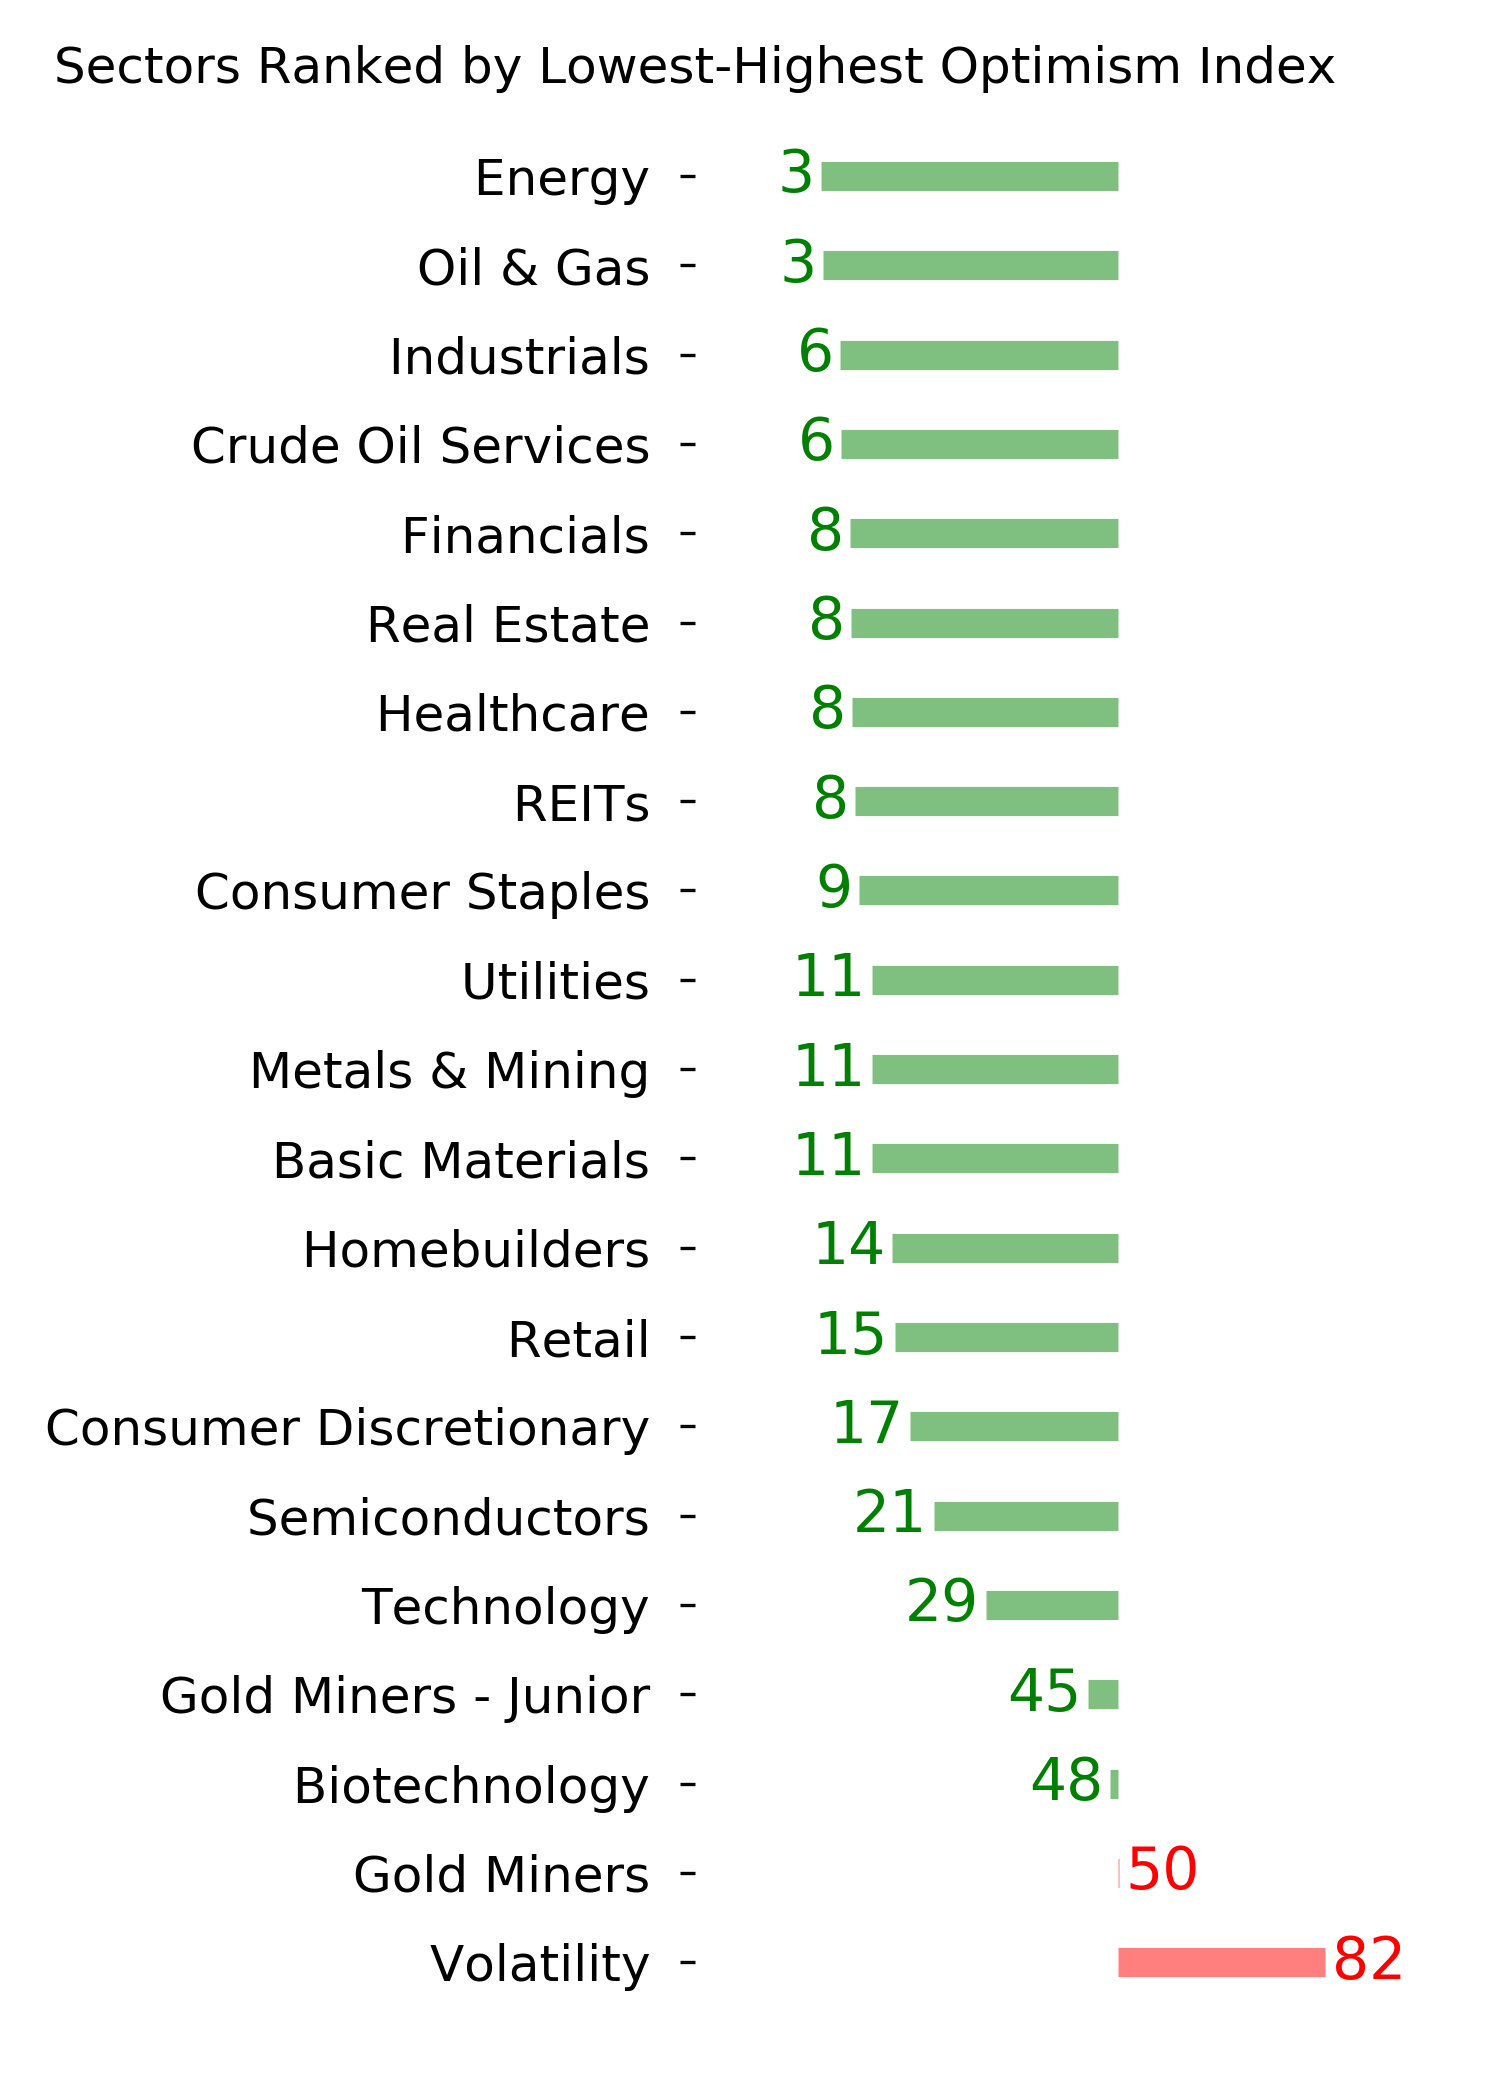
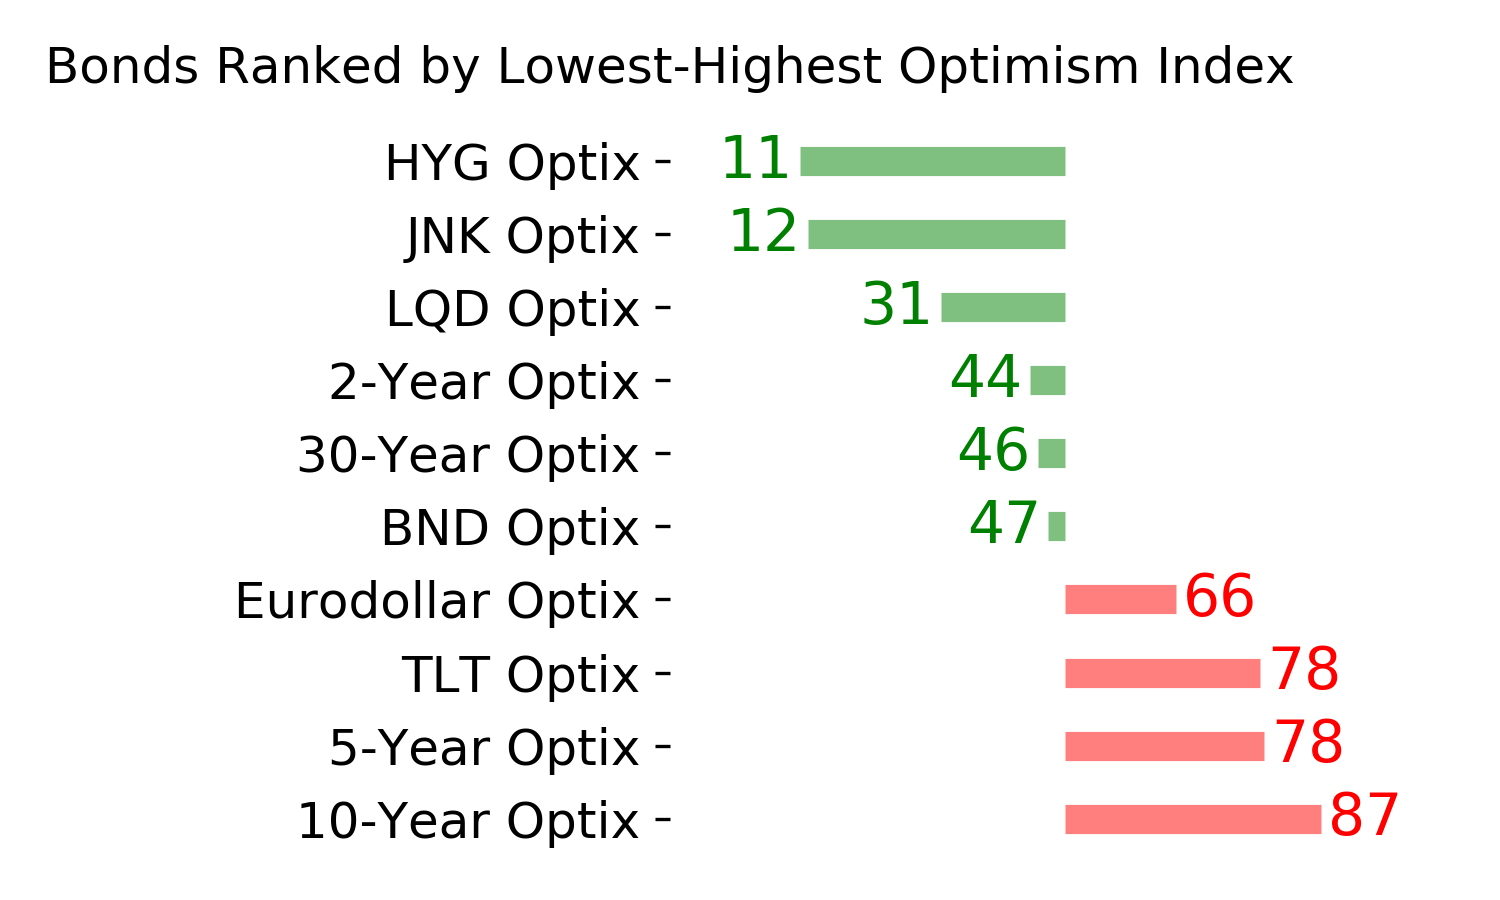
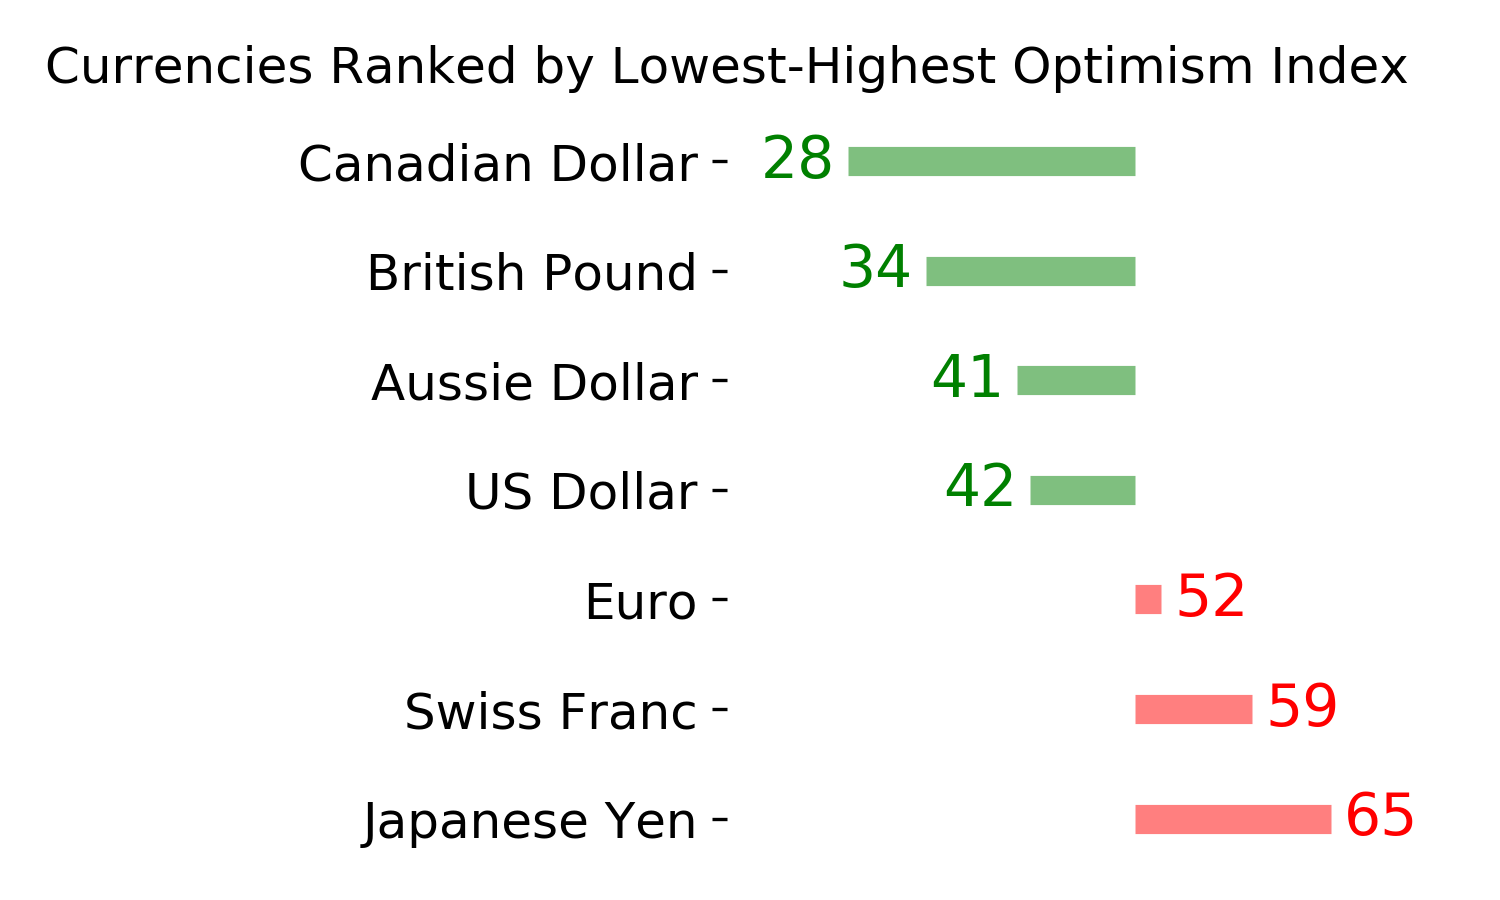
Optimism Index Thumbnails
|
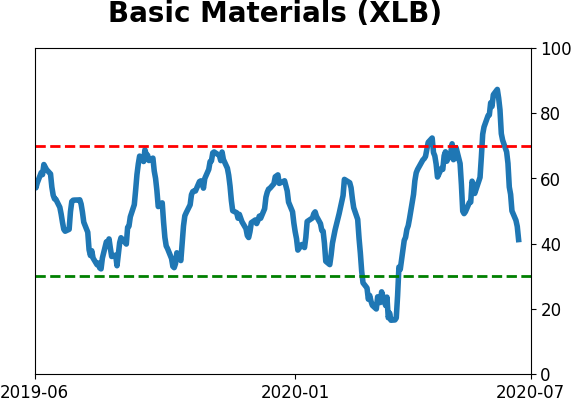
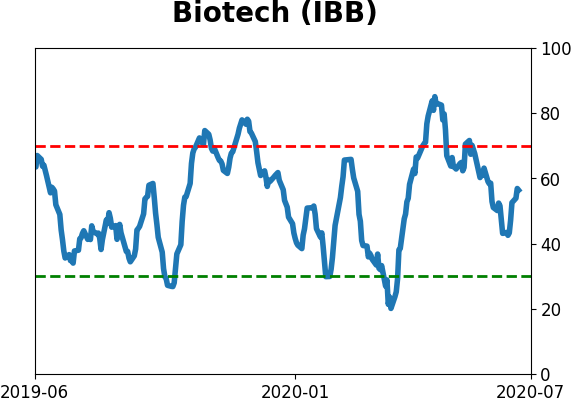
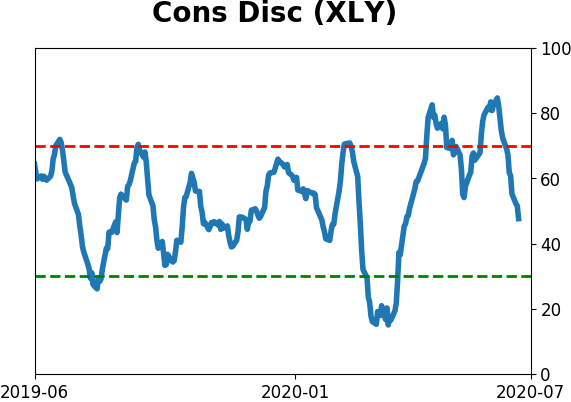
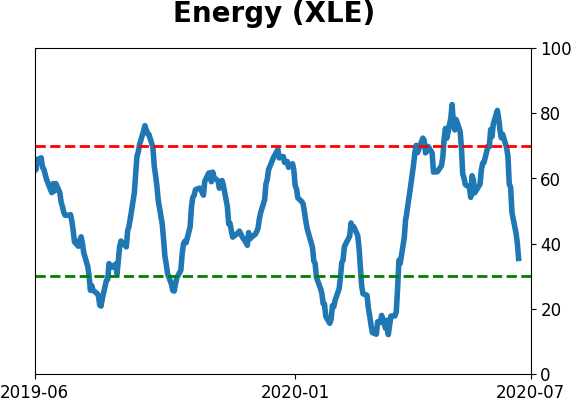
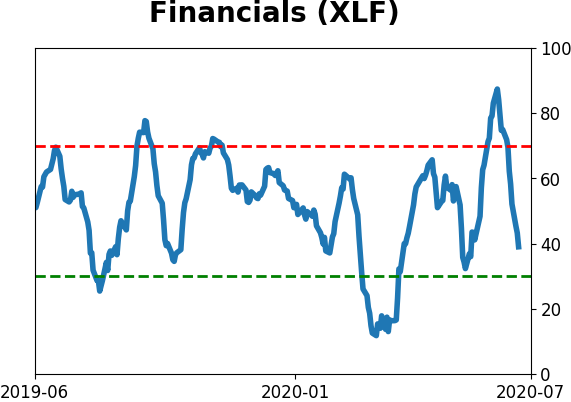
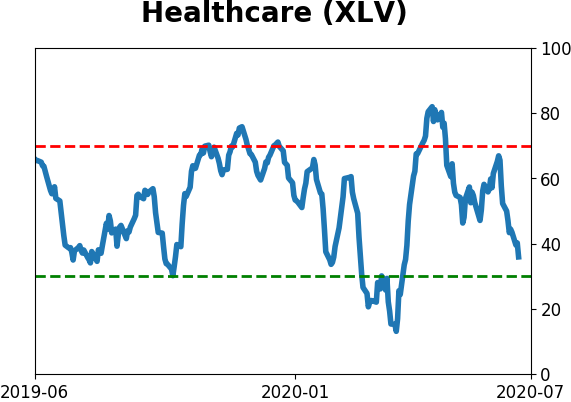
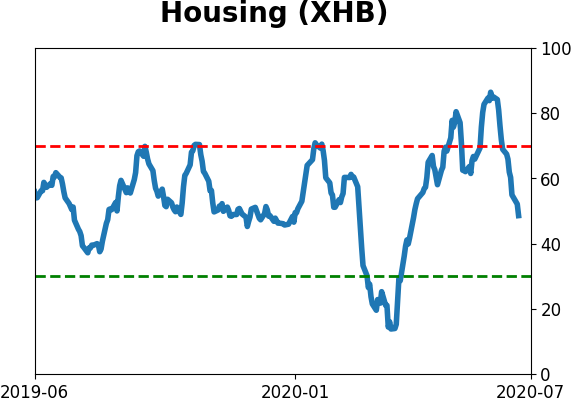
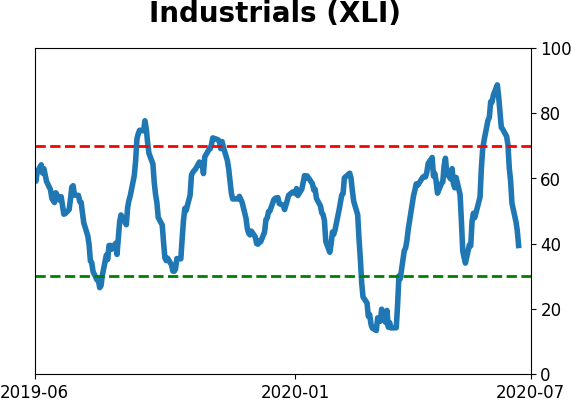
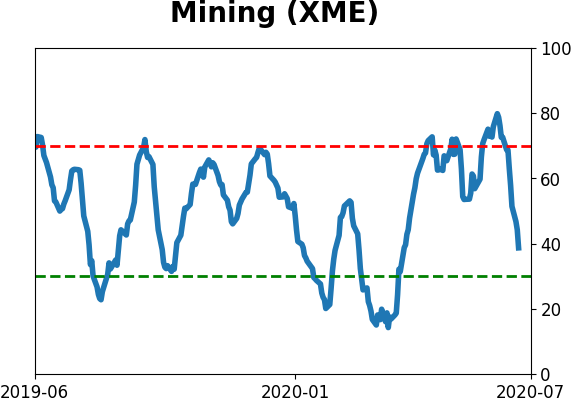
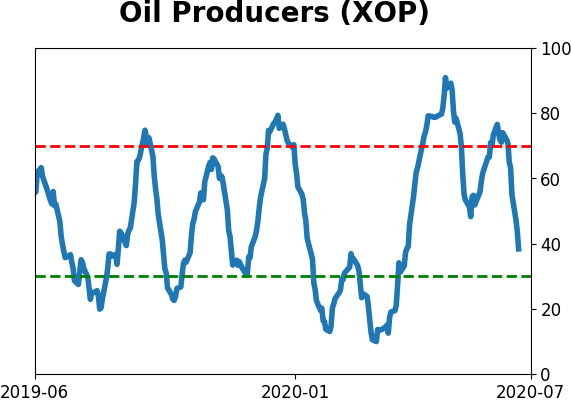
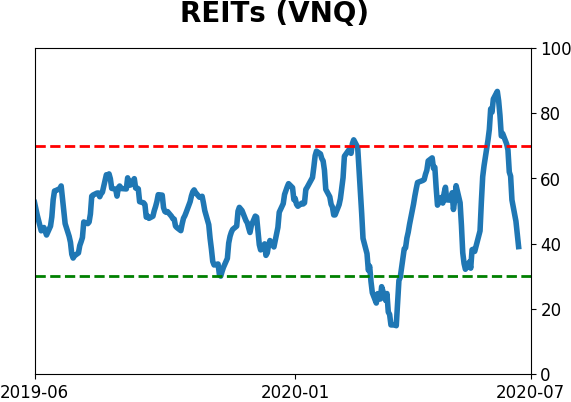
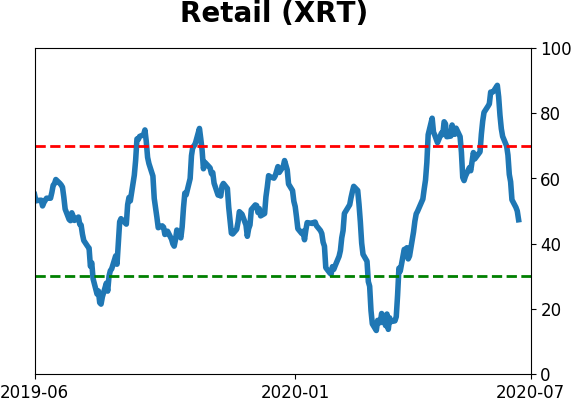
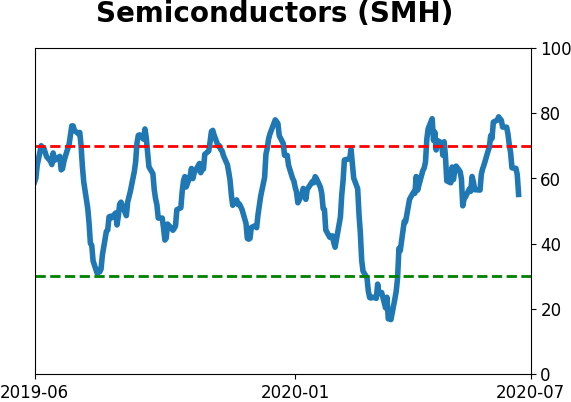
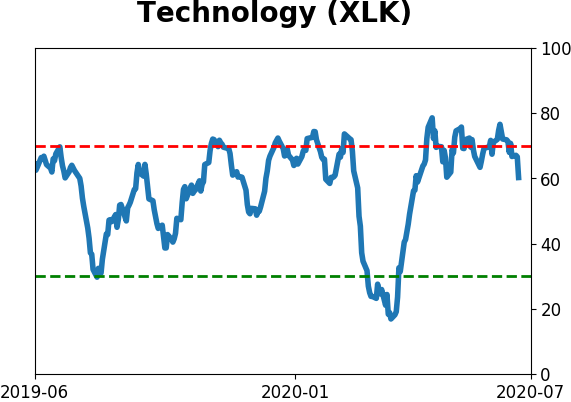
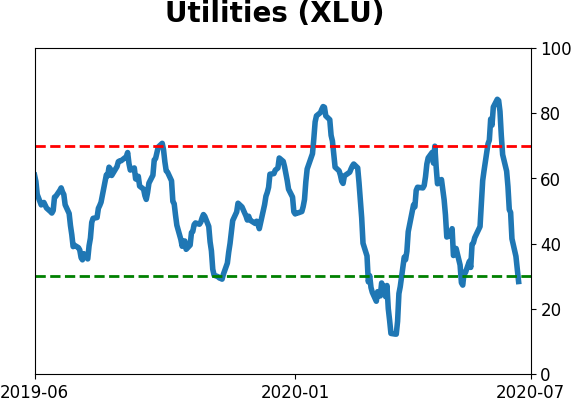
Sector ETF's - 10-Day Moving Average
|
|
|
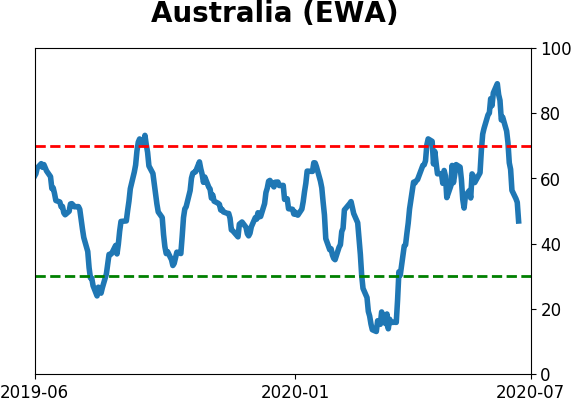
Country ETF's - 10-Day Moving Average
|
|
|
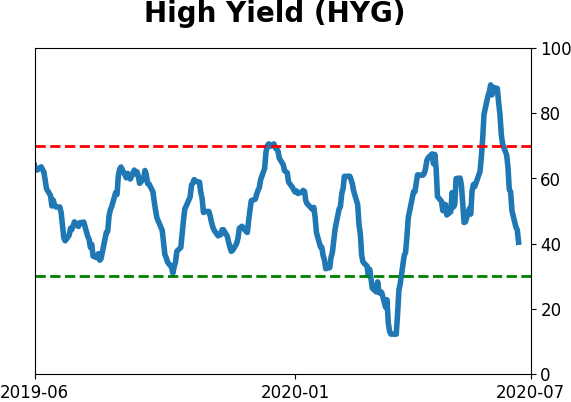
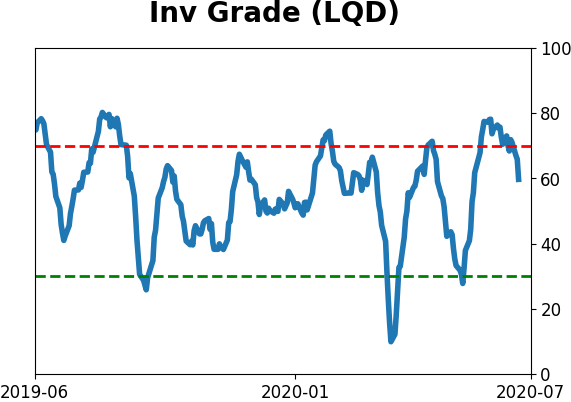
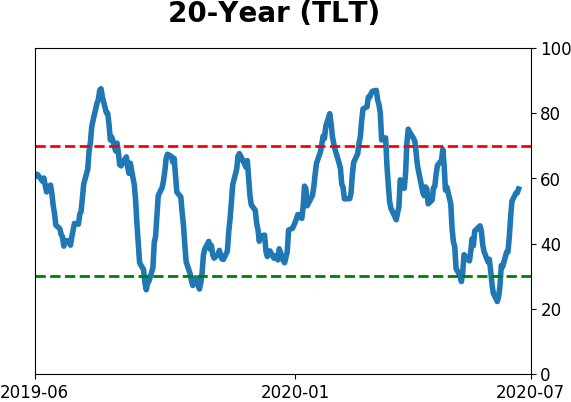
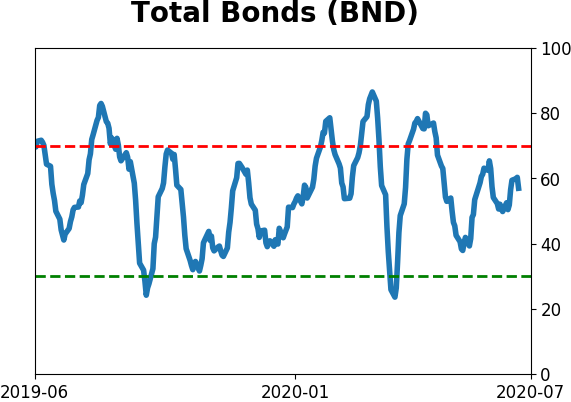
Bond ETF's - 10-Day Moving Average
|
|
|
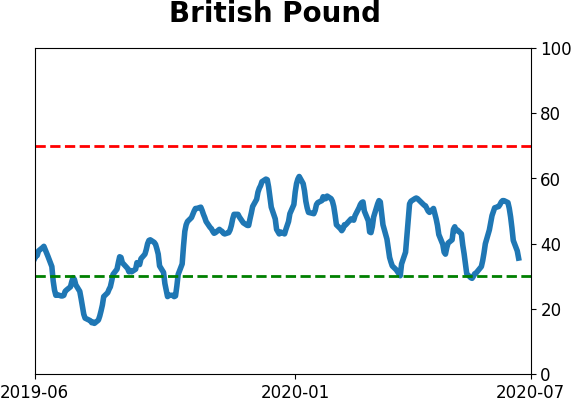
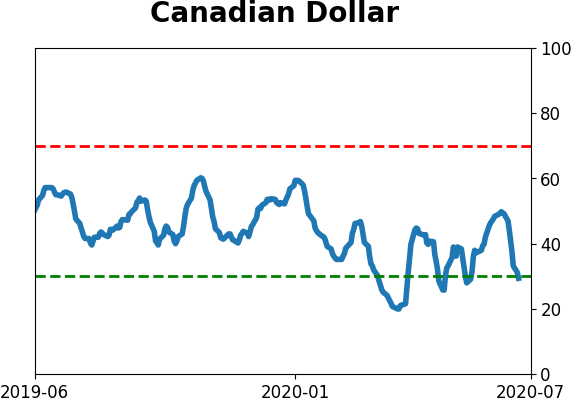
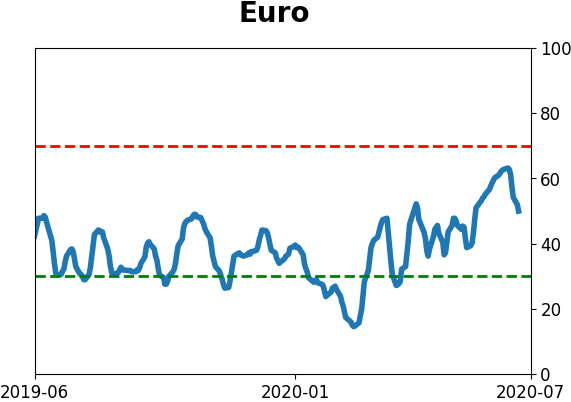
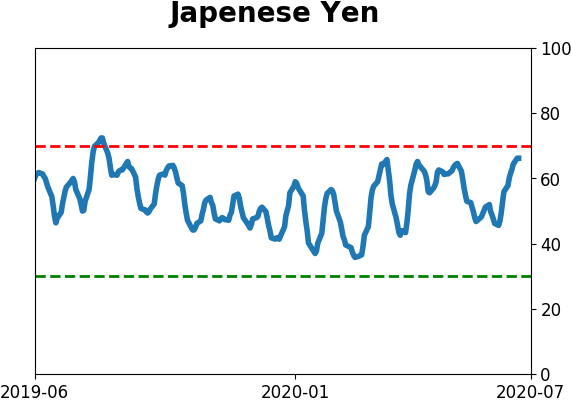
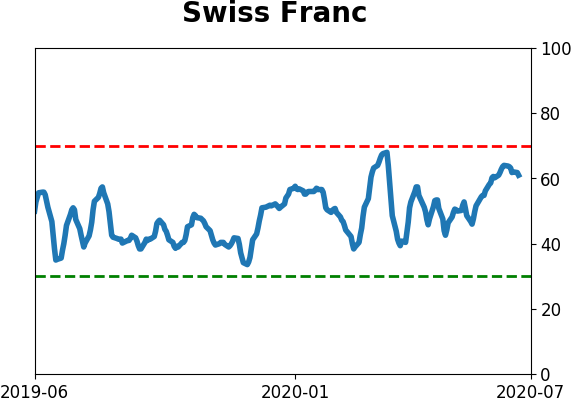
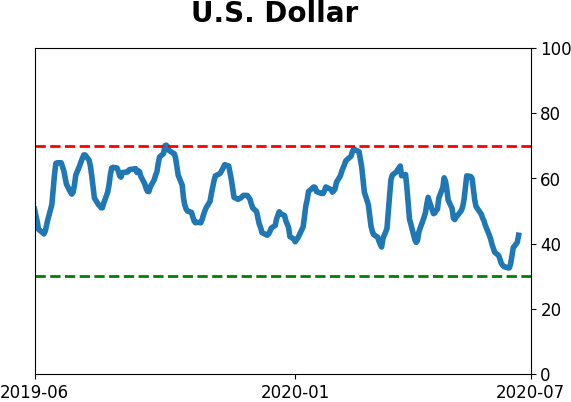
Currency ETF's - 5-Day Moving Average
|
|
|
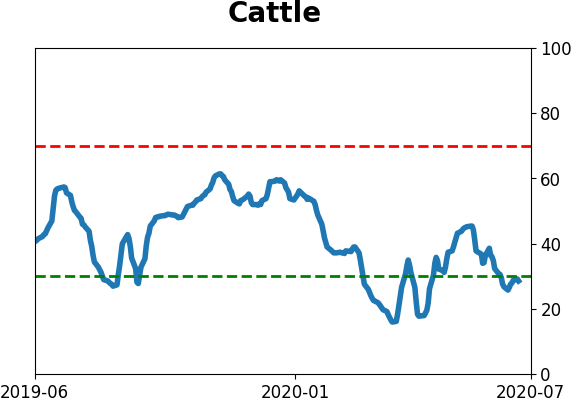
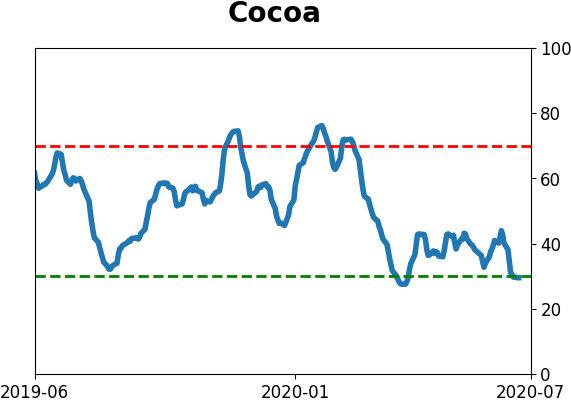
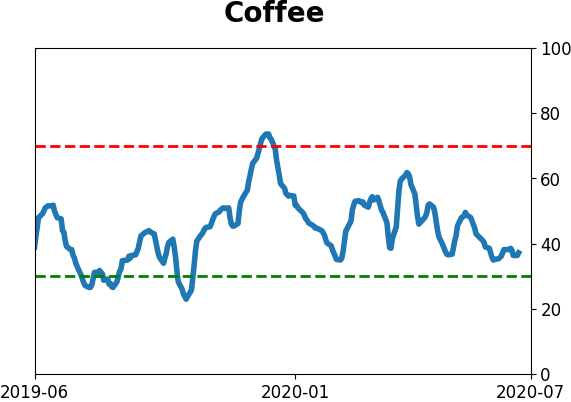
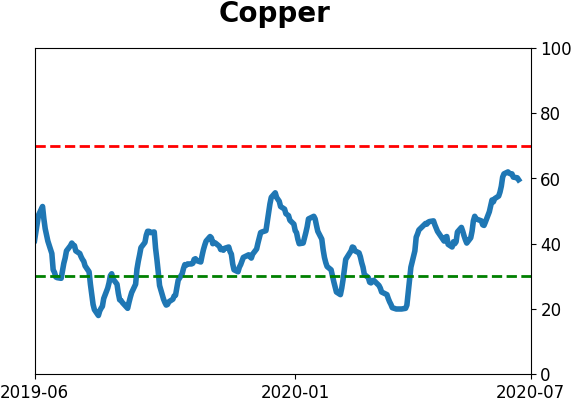
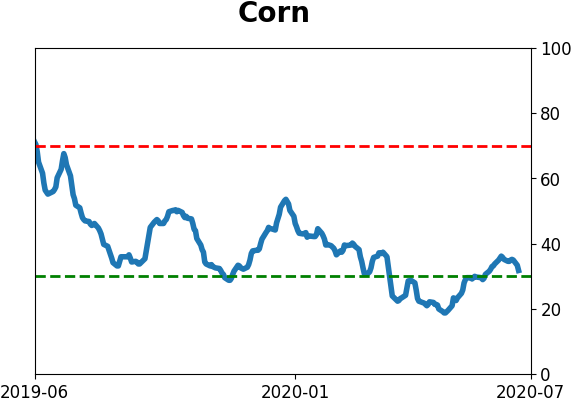
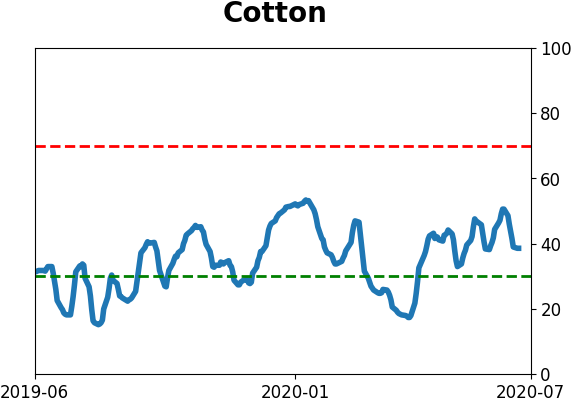
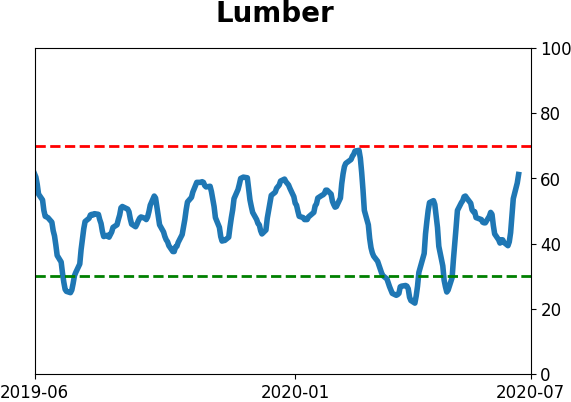
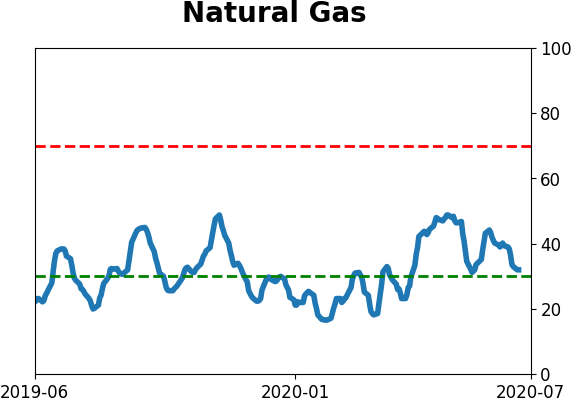
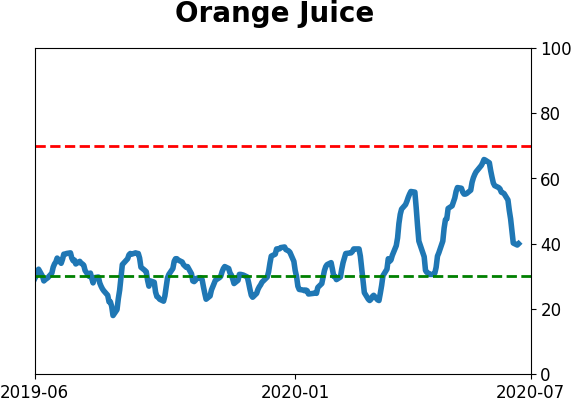
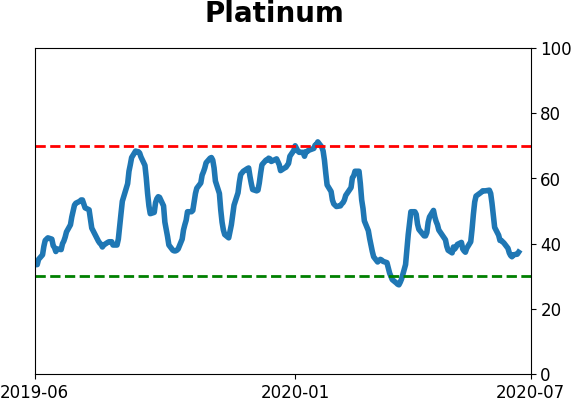
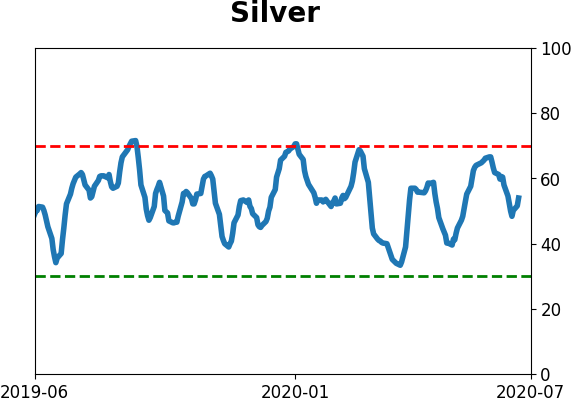
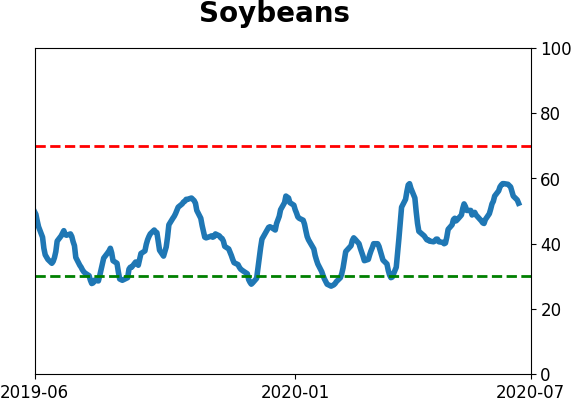
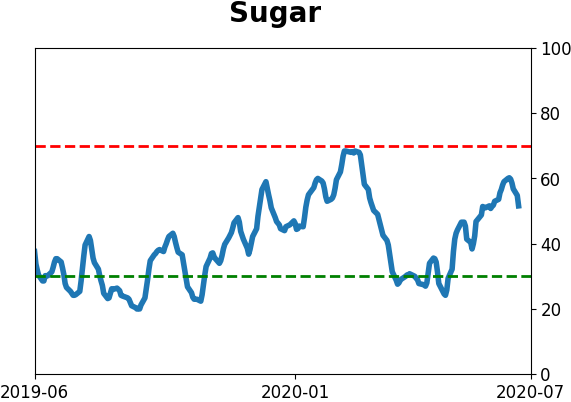
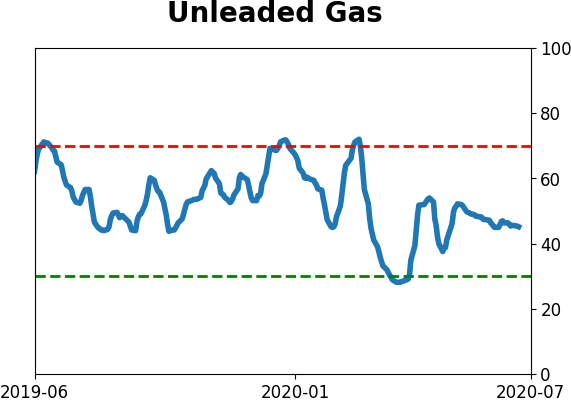
Commodity ETF's - 5-Day Moving Average
|
|