Headlines
|
|
Weekly Wrap for Jun 4 - Risk Appetite Rebounds:
This week saw a rebound in risk appetite as investors regained some confidence following choppy market conditions. This is coming on the heels of historic momentum already. Excess liquidity is draining from stocks, and inflation is a major concern.
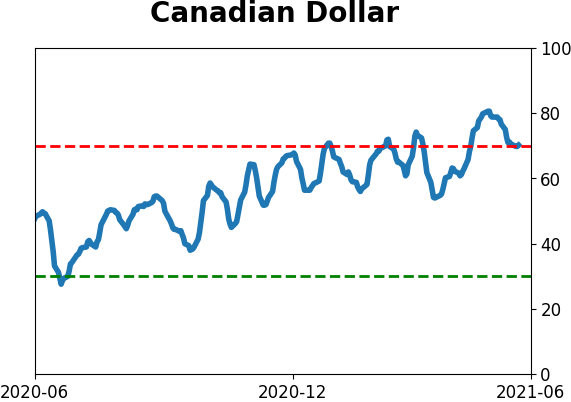
The latest Commitments of Traders report was released, covering positions through Tuesday: The 3-Year Min/Max Screen shows that "smart money" commercial hedgers moved to another record short against the Canadian dollar and this week added coffee to the list. The Backtest Engine shows that over the past decade, when hedgers hold more than 25% of Coffee's open interest net short, the contract has declined over the next year every time, averaging a return of -26%. The other notable position change was in major equity index futures, where small speculators added to an already-record net long position, pushing it now to nearly $39 billion. This should be a headwind for stocks, but we place a low weight on it.
Bottom Line:
See the Outlook & Allocations page for more details on these summaries STOCKS: Hold
The speculative frenzy in February is wrung out. Internal dynamics have mostly held up, with some exceptions. Many of our studies still show a mixed to poor short-term view, with medium- and long-term ones turning more positive. BONDS: Hold
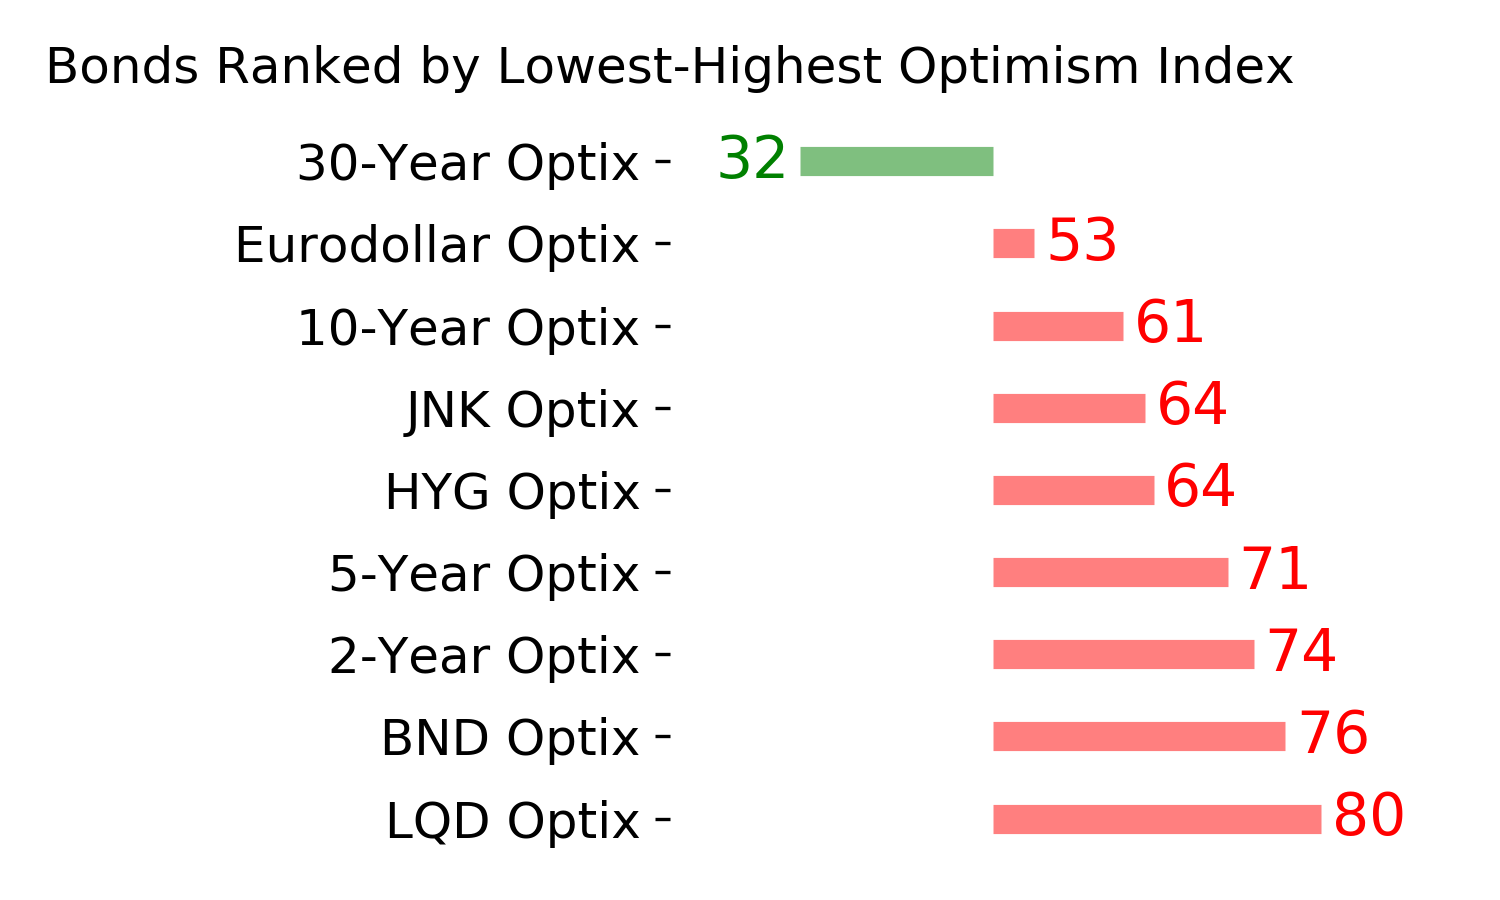
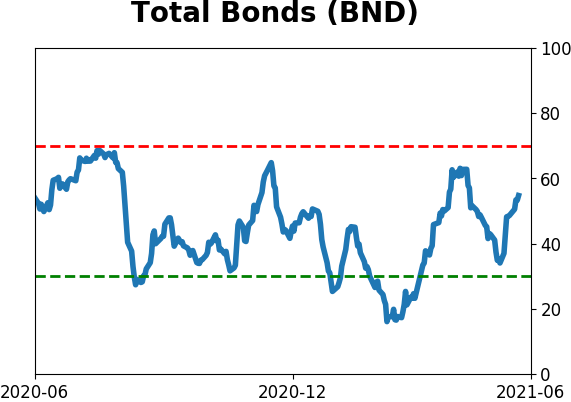
Various parts of the market got hit in March, with the lowest Bond Optimism Index we usually see during healthy environments. After a shaky couple of weeks, the broad bond market has modestly recovered. Not a big edge here either way. GOLD: Hold
Gold and miners have done very well, recovering above long-term trend lines. The issue is that both have tended to perform poorly after similar situations - will have to wait and see how it plays out.
|
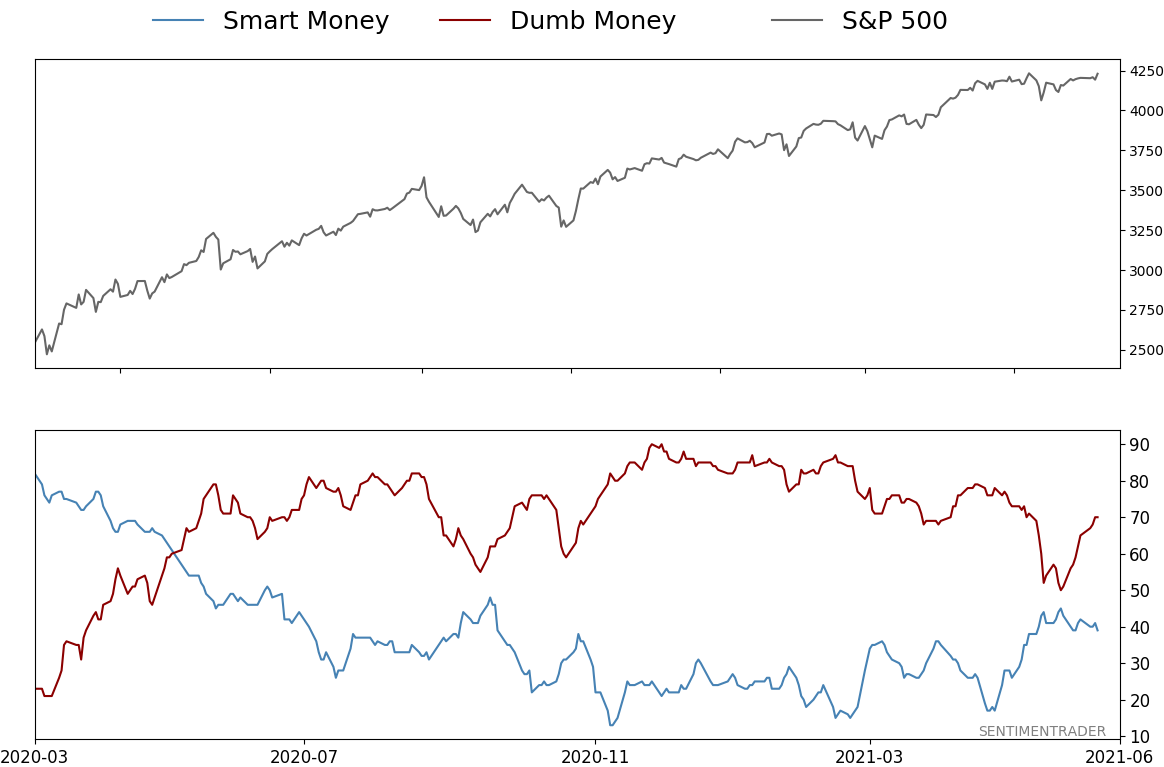
Smart / Dumb Money Confidence
|
Smart Money Confidence: 39%
Dumb Money Confidence: 70%
|
|
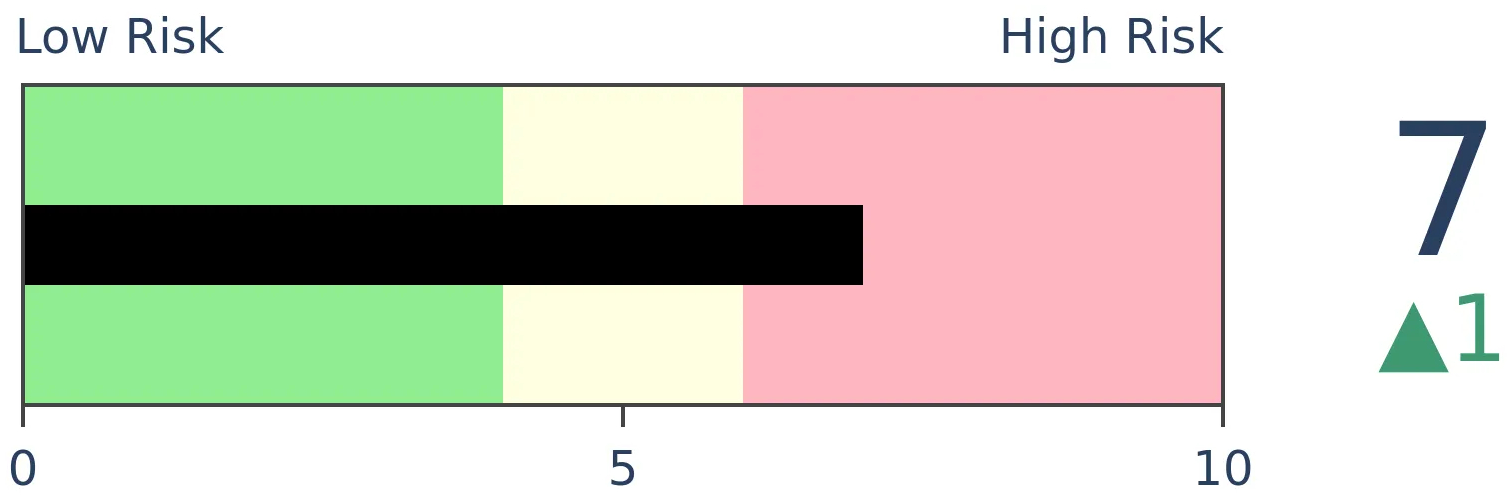
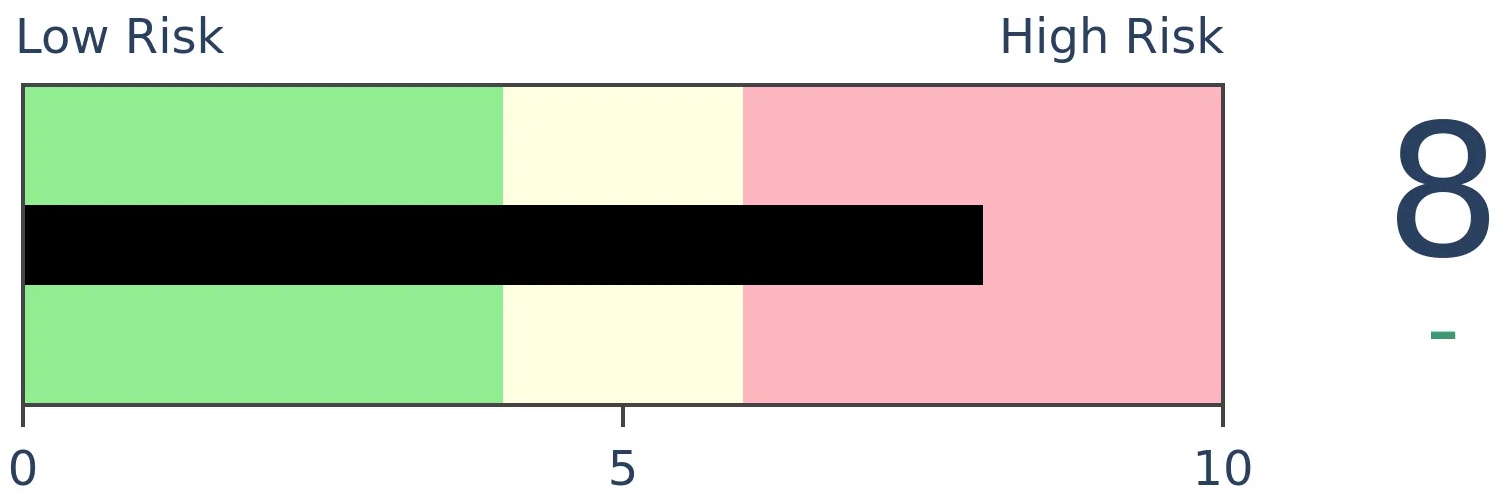
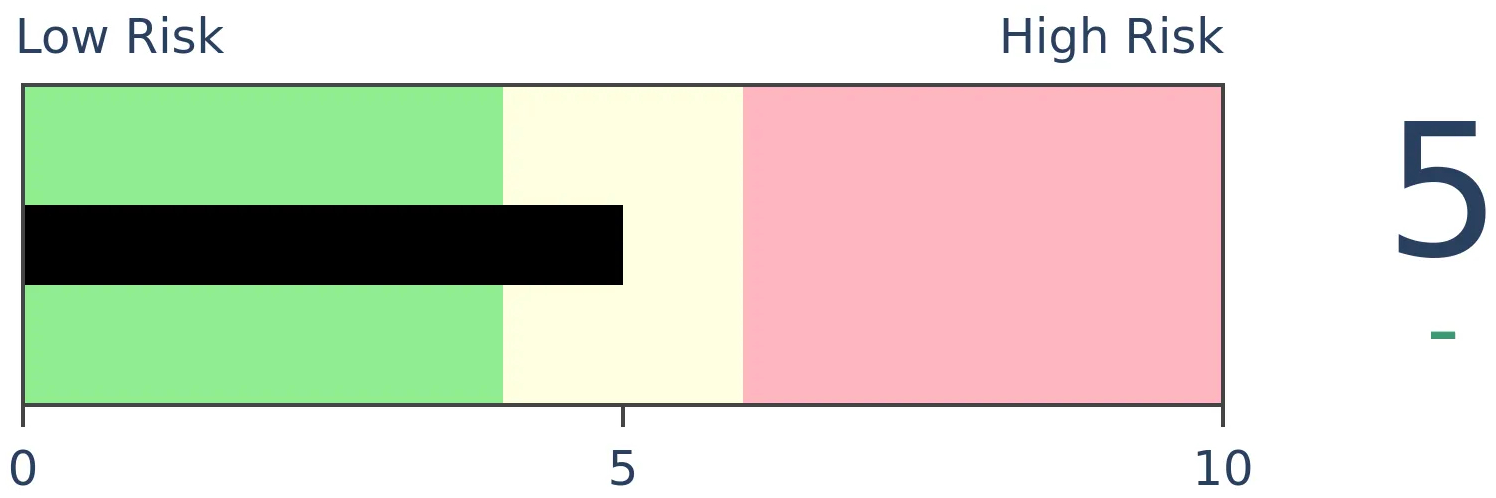
Risk Levels
Stocks Short-Term
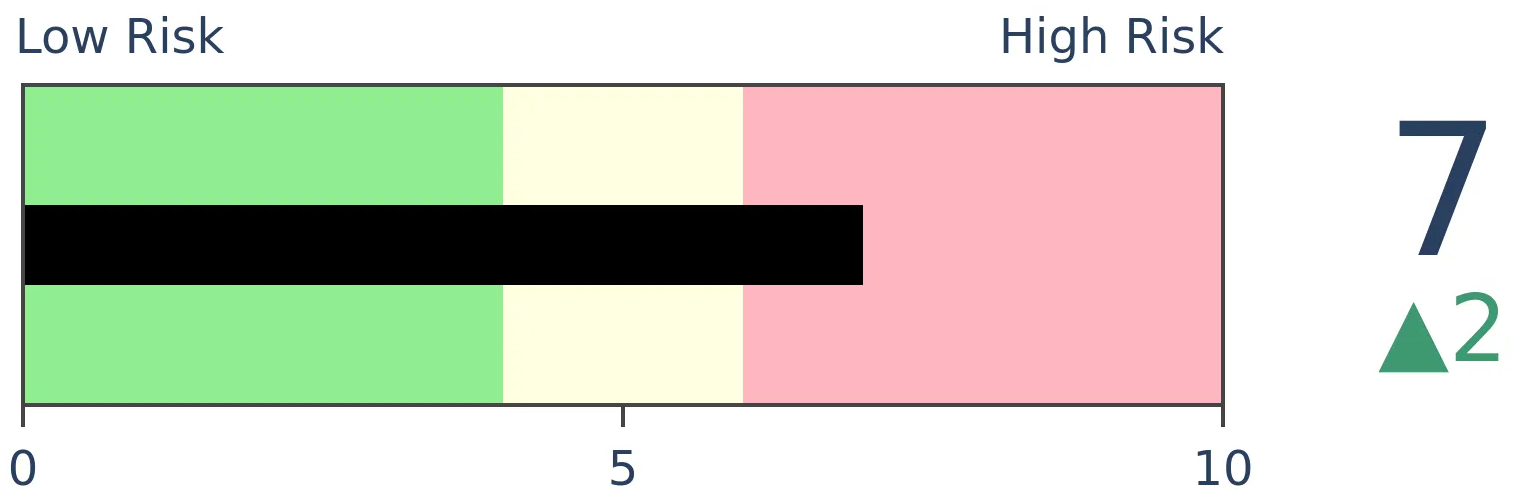
|
Stocks Medium-Term
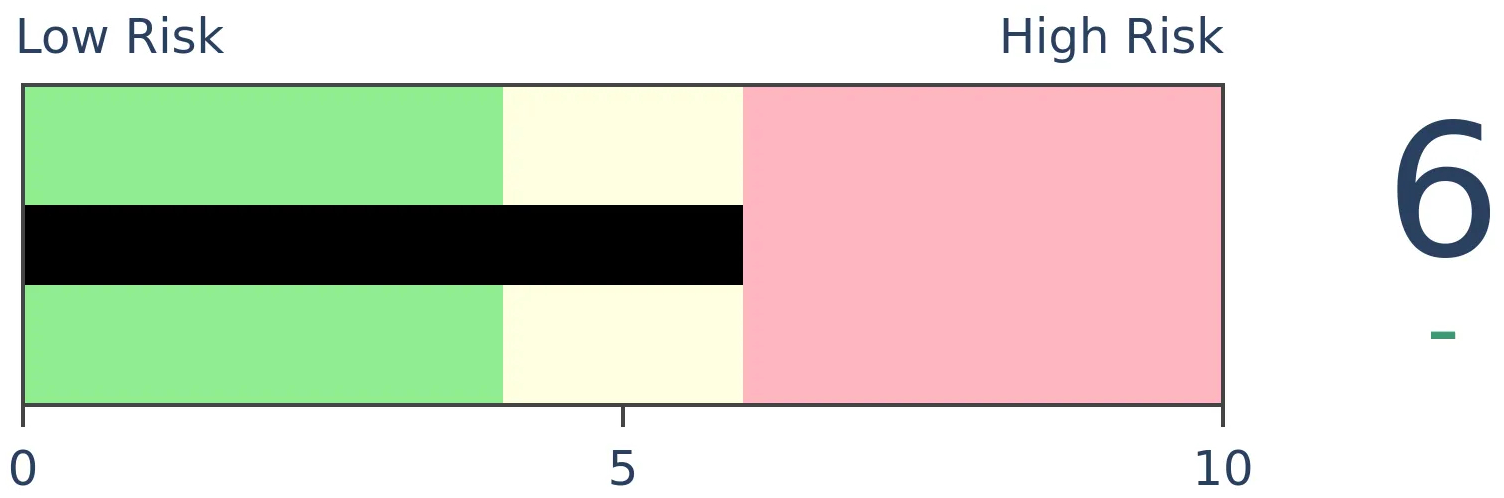
|
|
Bonds
|
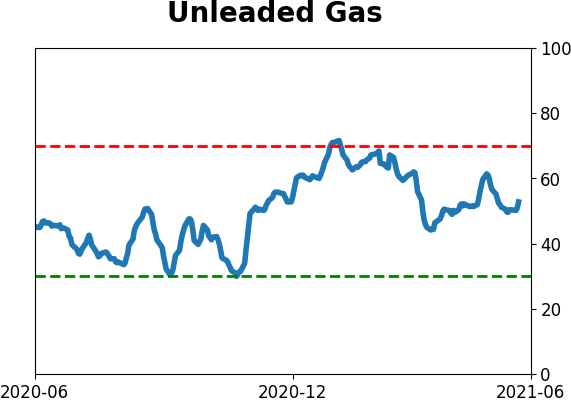
Crude Oil
|
|
Gold

|
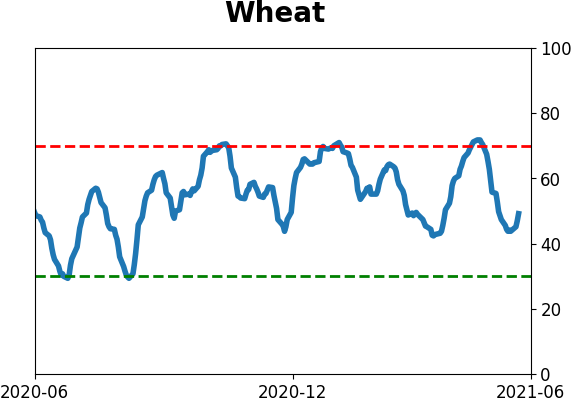
Agriculture
|
|
Research
BOTTOM LINE
This week saw a rebound in risk appetite as investors regained some confidence following choppy market conditions. This is coming on the heels of historic momentum already. Excess liquidity is draining from stocks, and inflation is a major concern.
FORECAST / TIMEFRAME
None
|
The goal of the Weekly Wrap is to summarize our recent research. Some of it includes premium content (underlined links), but we're highlighting the key focus of the research for all. Sometimes there is a lot to digest, with this summary meant to highlight the highest conviction ideas we discussed. Tags will show any symbols and time frames related to the research.
With a flood of money combining with preternaturally calm conditions in the broader market, equity investors can't help themselves. Once again, buying interest was enough to push the S&P 500 to a record monthly close in May.
For the most widely-benchmarked index in the world, this was its 4th consecutive month with an all-time high.
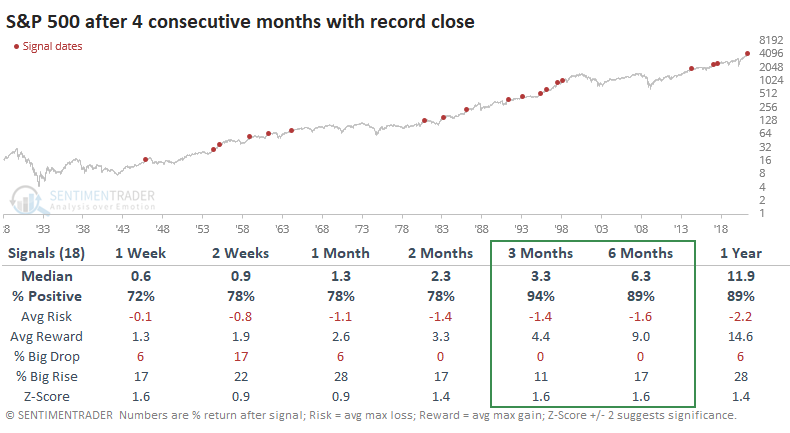
Looking at the Risk/Reward table, risk outweighed reward over the next six months only twice, and those two were reversed during the subsequent six months.
While they've settled back recently, part of the momentum has been due to a tremendous run in Small-Cap stocks, which just ended their 8th straight month with a positive total return, tied for the 5th-longest streak since 1926.
Some signs of momentum have been so hot that they've preceded weak short-term returns. The S&P one, however, is compelling and a better sign over the medium-term.
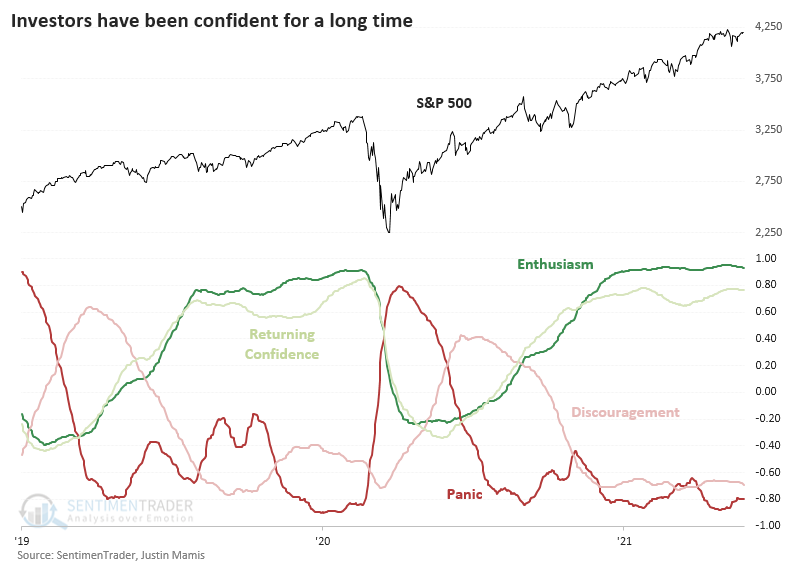
GOOD MOMENTUM HAS KEPT SENTIMENT ELEVATED
For more than six months, investors have had shown at least Returning Confidence and even Enthusiasm. That's according to the latest correlations to a Typical Sentiment Cycle.
If we go back to 1928 and compare all periods resembling the 1990-1991 period that Justin Mamis showed in his book The Nature of Risk, we can see the correlation we have to each part of the Cycle. When we do that, we get the following estimates for where we are now:
- Enthusiasm: +0.93
- Returning Confidence: +0.77
- Discouragement: -0.69
- Panic: -0.80
The correlations range from -1.0 (perfect opposite) to +1.0 (perfect symmetry). Based on that, there is a strong probability that we're in the Enthusiasm phase. Last September, the correlations suggested we were moving into the Returning Confidence phase, a good sign. It stayed there for a while, then moved into Enthusiasm near the end of last year.
So, it has been more than six months, 140 days to be exact, that the price pattern of the S&P 500 has had at least a +0.60 correlation to both Returning Confidence and Enthusiasm, while also showing at least a -0.40 correlation to Discouragement and Panic.
That has moved us into the top 15 stretches of time with this kind of confidence among investors.
We wouldn't put much weight on short-term returns following similar stretches, but those short-term returns were poor after the precedents for what it's worth.
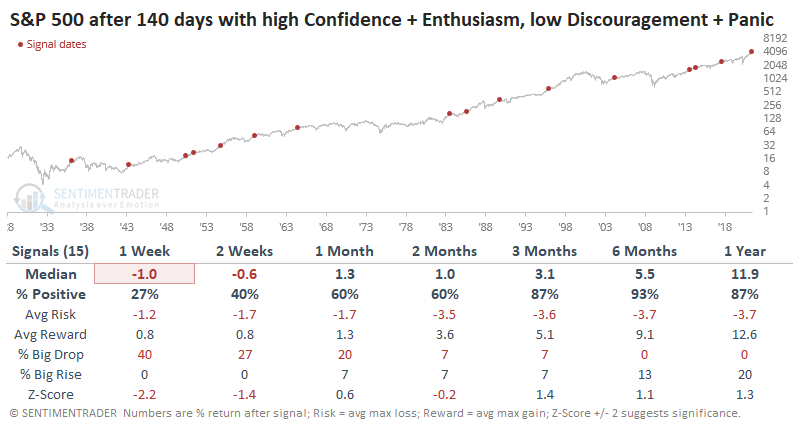
Longer-term, the S&P showed more resilience. Over the next 3-12 months, there were few losses, and the risk/reward was quite positive.
The biggest risk is that some trouble spots like valuation and inflation take hold, and investors' confidence starts to ebb. That could help trigger a very rocky short- to the medium-term environment. The biggest positive we can see right now is that momentum has been so strong that it tends to persist, and so far, we're still not seeing many internal warning signs of deterioration.
RISK IS COMING BACK...AGAIN
Our Risk On / Risk Off Indicator aggregates over 20 core risk indicators and assigns each a binary risk-on or risk-off state. The more that are showing risk-on behavior, the higher the aggregate indicator will rise.
It dipped as stocks chopped but has pushed higher once again, showing increasing risk appetite among investors. Dean discussed a way to use this as a trading signal, looking for times when the risk on/off indicator was in the lower 5% of its range over the past 84 days and then rose to within 68.5% of its range over the past 84 days.
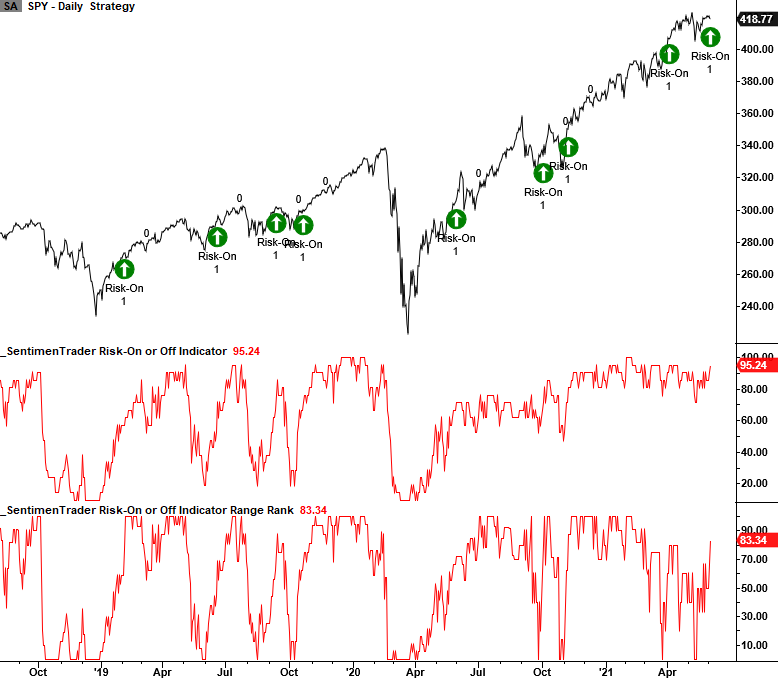
Looking at all holding periods up to two months later, the optimal time for the trade was just over a month. Out of 45 signals, 35 of them showed a profit, with a profit factor of 3.6 to 1. This suggests that risk appetite dipped enough to reset expectations, and the resumption of that appetite should help stocks in the weeks ahead.
THE FLOOD OF MONEY IS NOW JUST A TRICKLE
Part of all this confidence is due to the flood of money that found its way into financial markets. That is now leaving and pooling into economic production. This behavior suggests that Excess Liquidity is plunging.
We can see just how much this figure spiked and then plunged with the latest economic releases.
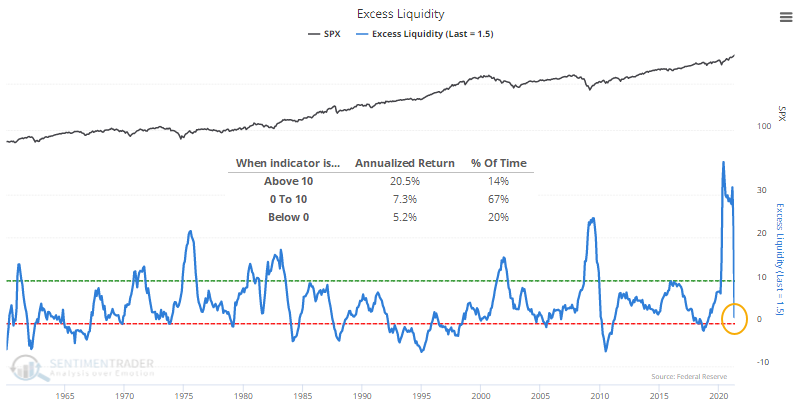
The S&P 500 has returned an annualized +20.5% when Excess Liquidity is above 10%, where it had been since last March. Its returns are more in line with random as that figure drops below 10% and heads toward zero.
After other streaks ended, the S&P did okay. It fell into a correction, or worse, four times during the next 1-2 years. That means that six times, stocks held up fine even with liquidity draining from financial assets. To account for data lags, the dates in the table are advanced one month.
For sectors and factors, Energy stocks fared the best, with impressive returns across every time frame. Technology stocks, no stranger to the losing end of many studies we've published over the past month, once again brought up the rear. There was quite a spread between the two sectors, with Energy averaging +9.1% over the next six months and Tech averaging -4.9%.
INFLATION IS STILL A CONCERN
Jay looked at a worrisome and little-known inflationary warning sign.
Last month the Producer Price Index (PPI) registered a 12-month rate-of-change of +17.25%, and the Consumer Price Index (CPI) registered a 12-month rate-of-change of +4.07%. As the PPI is often thought to lead the CPI, this is a cause of concern for many.
The chart below shows the monthly PPI 12-month change minus the CPI 12-month change, with a cutoff level of positive 7.
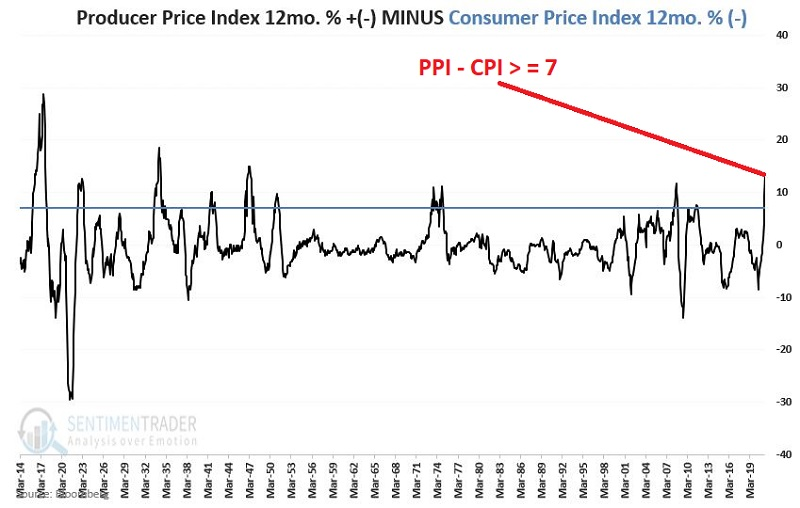
When this spread was above +7, the Dow Industrials had a strong tendency to struggle.
- # of periods Dow UP = 6
- # of periods Dow DOWN = 12
- Median UP period Dow % = +3.8%
- Median DOWN period Dow % = (-9.9%)
- Cumulative Dow % +(-) = (-63.9%)
The good news is that the stock market shrugged off this piece of bad news in May and worked its way slightly higher. As with any indicator, there is no reason why the stock market must sell off just because some indicator value is beyond what some analyst deems bearish.
Nevertheless, it is worth keeping a close eye on these two inflation measures - and the stock market itself - in the days ahead. The longer the bearish inflation readings persist, the greater the likelihood that trouble may develop in the stock market.
Jay dove further into sector and other asset returns following these periods, and the results were no prettier.
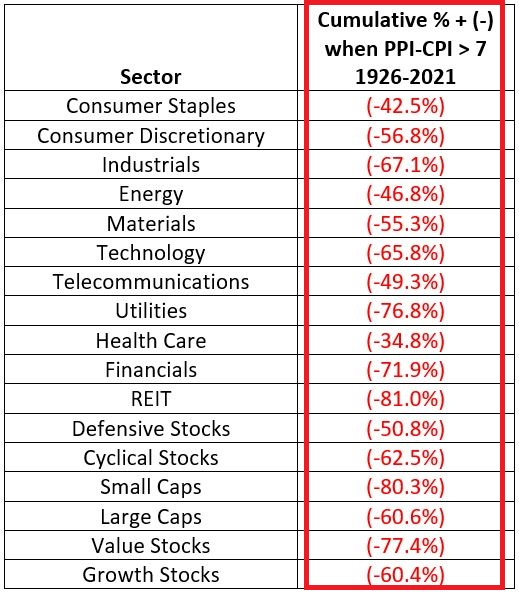
The good news (at least so far) is that in 2021, nothing seems to bother the markets, and there's always the standby that past performance is no guarantee of future results.
The bad news is there has been no consistent place to hide during PPI-CPI Unfavorable periods in the past, and the new Unfavorable period that began May 1st of 2021 still persists.
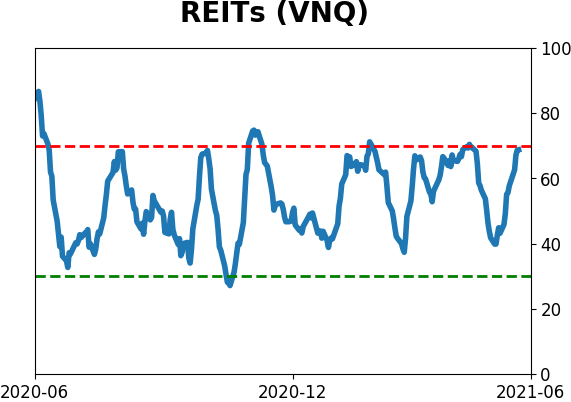
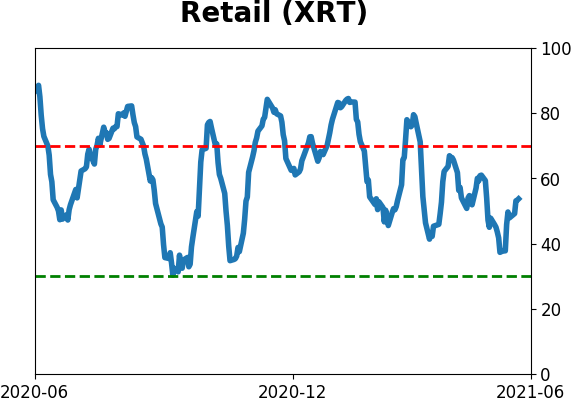
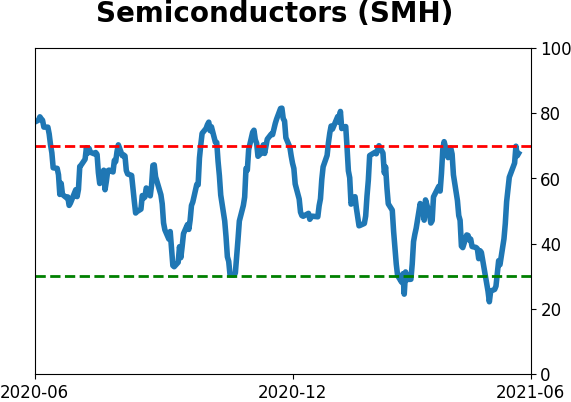
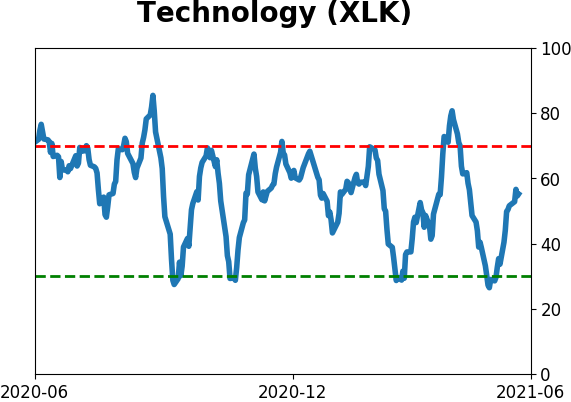
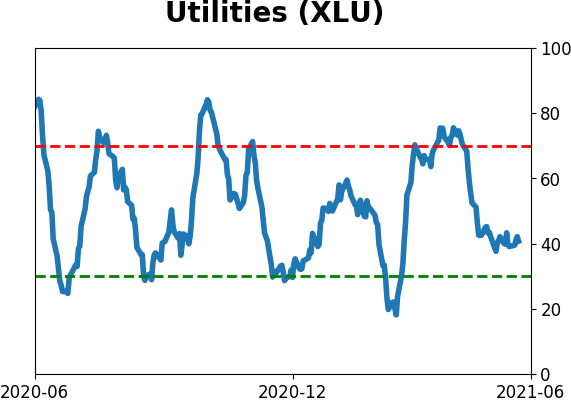
STOCKS AND SECTORS - REAL ESTATE IS PICKING UP
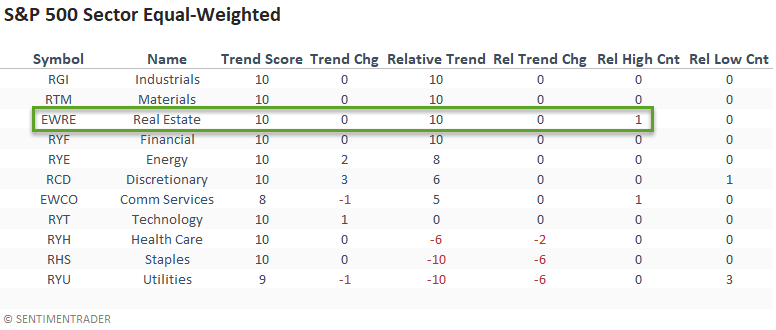
Dean showed that real estate is picking up in absolute and relative trends and is among the better performers among industry, sector, and country ETFs.
The market continues to favor a value/cyclical tilt. After a modest increase last week, the relative trend scores for defensive sectors deteriorated, with utilities registering a relative low on 3/5 days. Technology and consumer discretionary remain weak. Interestingly, real estate recorded a new relative high on 3/5 days. In a note last week, Jay highlighted real estate as a sector that performs well in June.
The equal-weighted sectors confirm the cap-weighted data with solid absolute and relative trend scores from the value/cyclical sectors and weak defensive groups. I would also note that the equal-weighted real estate sector looks better than the cap-weighted version.
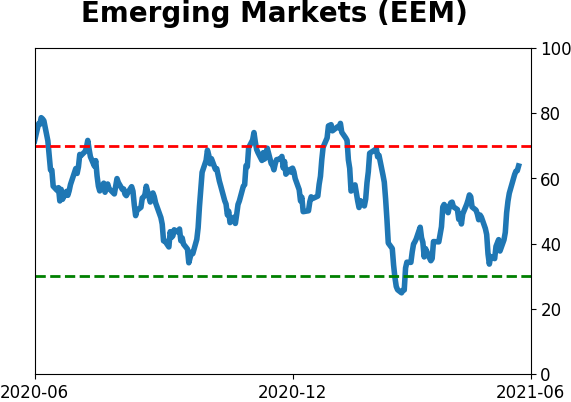
Emerging markets continue to perform poorly on a relative basis when compared to the S&P 500. Only 36% of the EM Countries are outperforming the S&P, a level that is unattractive for a broad-based allocation. This needs to be watched because when this figure drops below 25%, EEM has returned an annualized -11.0%.
STOCKS AND SECTORS - SENSEX THRUST
The percentage of S&P BSE Sensex Index members trading above their respective 50-day moving average registered an overbought momentum buy signal on the close of trading on 6/1/21, according to Dean.
This signal identifies when trend participation amongst index members is strong on an intermediate-term basis.
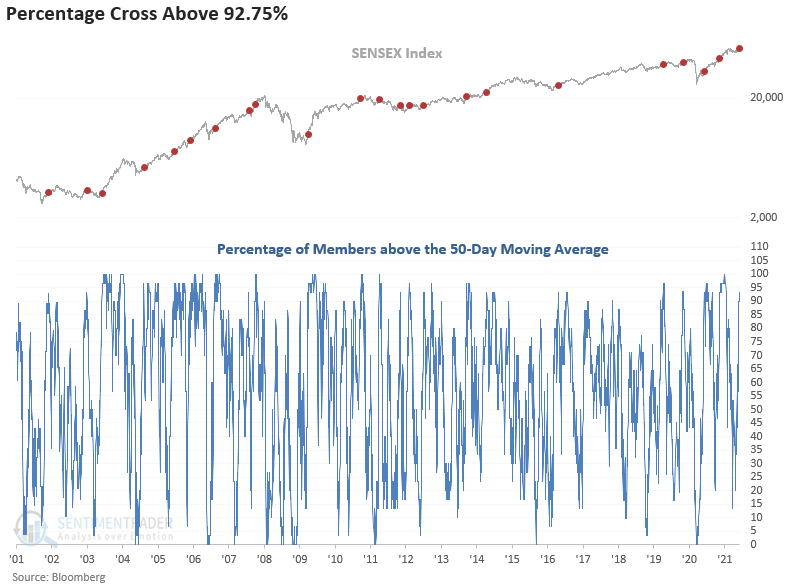
The 3-month timeframe looks good after this figure approaches 93%, especially during the last major emerging market bull cycle between 2003-07. Several unprofitable trades between the 2010-13 period impacted the 1-8 week timeframe. Over the next three months, 19 out of 22 signals showed a profit.
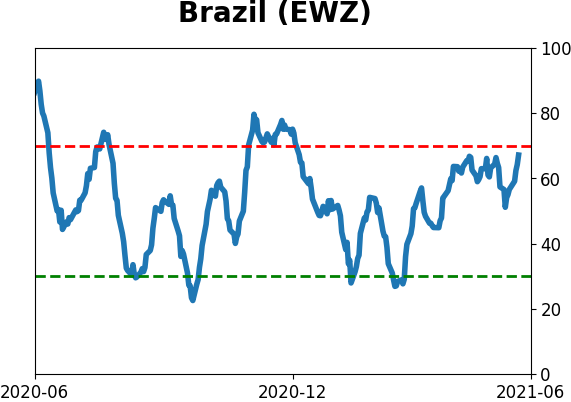
STOCKS AND SECTORS - BRAZILIAN THRUST, TOO
Similarly, Dean showed that the percentage of Ibovespa (IBOV) members trading above a Relative Strength Index (RSI) level of 70 registered a momentum buy signal on the close of trading on 6/2/21.
The signal identifies when the 3-day net change in the percentage of Index members trading above an RSI level of 70 surges above 13%.
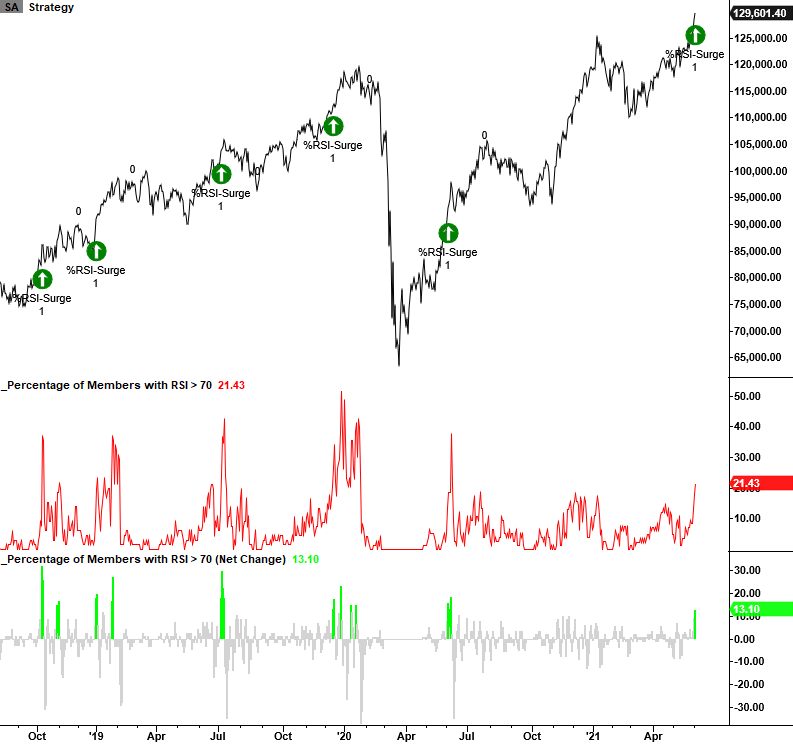
The 2-4 week timeframe looks good with a favorable risk/reward profile. I would classify this momentum signal as a good overbought condition whereby strength begets strength.
| COMMODITIES |
|  |
|
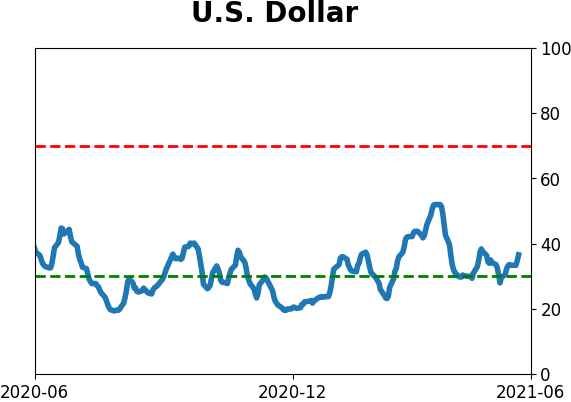
The U.S. Dollar has been in a pretty prolonged slump since spiking to a top in March of 2021. Jay makes a strong argument that the dollar is in the midst of a longer-term decline.
He discussed a 16-year cycle for the U.S. dollar. The first full 16-year cycle - by his account - began on 3/31/1969 with an 8-year bearish phase, followed by an 8-year bullish phase.
- The "bearish" phase ran from 3/31/1969 through 3/31/1977
- The "bullish" phase ran from 3/31/1977 through 3/31/1985
- And so forth
Historically the most challenging time for the dollar is during June through December, when the 16-year cycle is in a bearish phase. The chart below displays the cumulative % growth achieved by holding a hypothetical long position in the U.S. dollar ONLY during June through December during those years when the 16-year cycle is bearish.
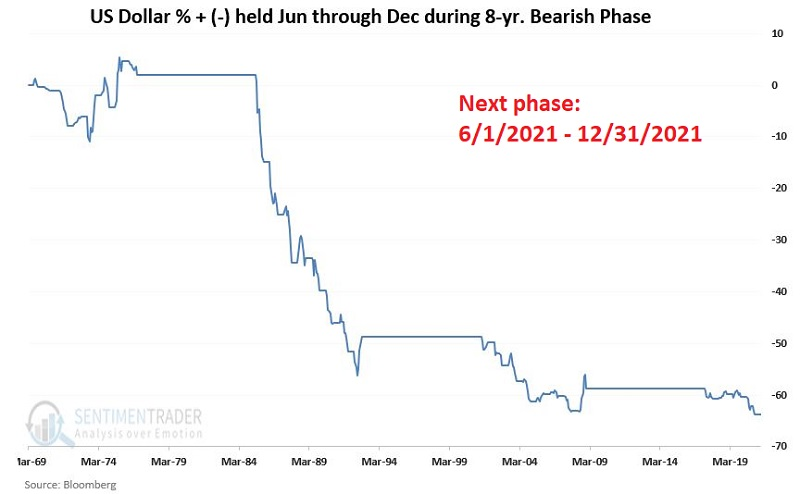
During these phases, the dollar rose 8 times and declined 20 times.
There is absolutely nothing that requires the U.S. dollar to adhere to the 16-year cycle detailed above. But history suggests that getting bearish during the bullish 8-year phase and/or getting bullish during the bearish 8-year phase typically involves being willing to "swim upstream."
GOLD'S TREND IS STILL AN ISSUE
If the dollar does continue to decline, it should help gold. But the metal still faces the headwind of a bad relative trend. Jay updated an article from April about the gold / S&P 500 ratio.
When you strip away all of the seemingly endless rhetoric, the reality is that - as with every other tradable - there is a time to own gold and a time not to own gold. What follows is one attempt at discerning when the time is right - or not right - to own gold.
The chart below is from Stockcharts. It shows the price of gold divided by the price of the S&P 500 Index (designated by entering "$GOLD:$SPX" as the Symbol) along with a 200-week exponential moving average of this ratio.
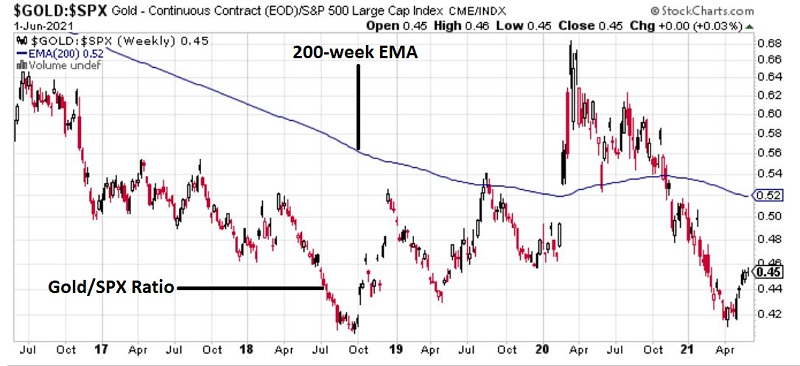
It is considered BULLISH for gold when this ratio is ABOVE the 200-week moving average; it is considered BEARISH for gold when this ratio is BELOW the 200-week moving average.
The chart below displays the cumulative growth in the price of gold ONLY when the Gold/SPX ratio is BELOW its 200-week EMA.
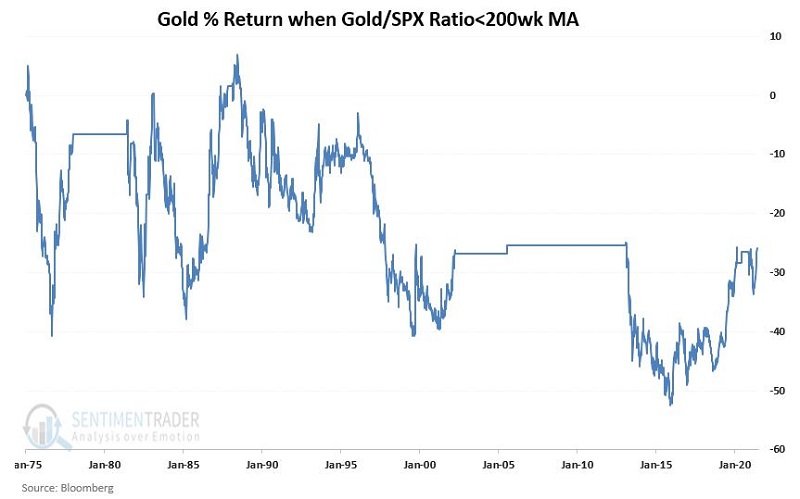
At present, the ratio is BELOW the moving average, so the indicator is still considered to be bearish for gold.
Active Studies
| Time Frame | Bullish | Bearish | | Short-Term | 0 | 0 | | Medium-Term | 1 | 11 | | Long-Term | 11 | 5 |
|
Indicators at Extremes
Portfolio
| Position | Description | Weight % | Added / Reduced | Date | | Stocks | RSP | 4.1 | Added 4.1% | 2021-05-19 | | Bonds | 23.9% BND, 6.9% SCHP | 30.7 | Reduced 7.1% | 2021-05-19 | | Commodities | GCC | 2.6 | Reduced 2.1%
| 2020-09-04 | | Precious Metals | GDX | 5.6 | Reduced 4.2% | 2021-05-19 | | Special Situations | 4.3% XLE, 2.2% PSCE | 7.6 | Reduced 5.6% | 2021-04-22 | | Cash | | 49.4 | | |
|
Updates (Changes made today are underlined)
Much of our momentum and trend work has remained positive for several months, with some scattered exceptions. Almost all sentiment-related work has shown a poor risk/reward ratio for stocks, especially as speculation drove to record highs in exuberance in February. Much of that has worn off, and most of our models are back toward neutral levels. There isn't much to be excited about here. The same goes for bonds and even gold. Gold has been performing well lately and is back above long-term trend lines. The issue is that it has a poor record of holding onto gains when attempting a long-term trend change like this, so we'll take a wait-and-see approach. RETURN YTD: 10.1% 2020: 8.1%, 2019: 12.6%, 2018: 0.6%, 2017: 3.8%, 2016: 17.1%, 2015: 9.2%, 2014: 14.5%, 2013: 2.2%, 2012: 10.8%, 2011: 16.5%, 2010: 15.3%, 2009: 23.9%, 2008: 16.2%, 2007: 7.8%
|
|
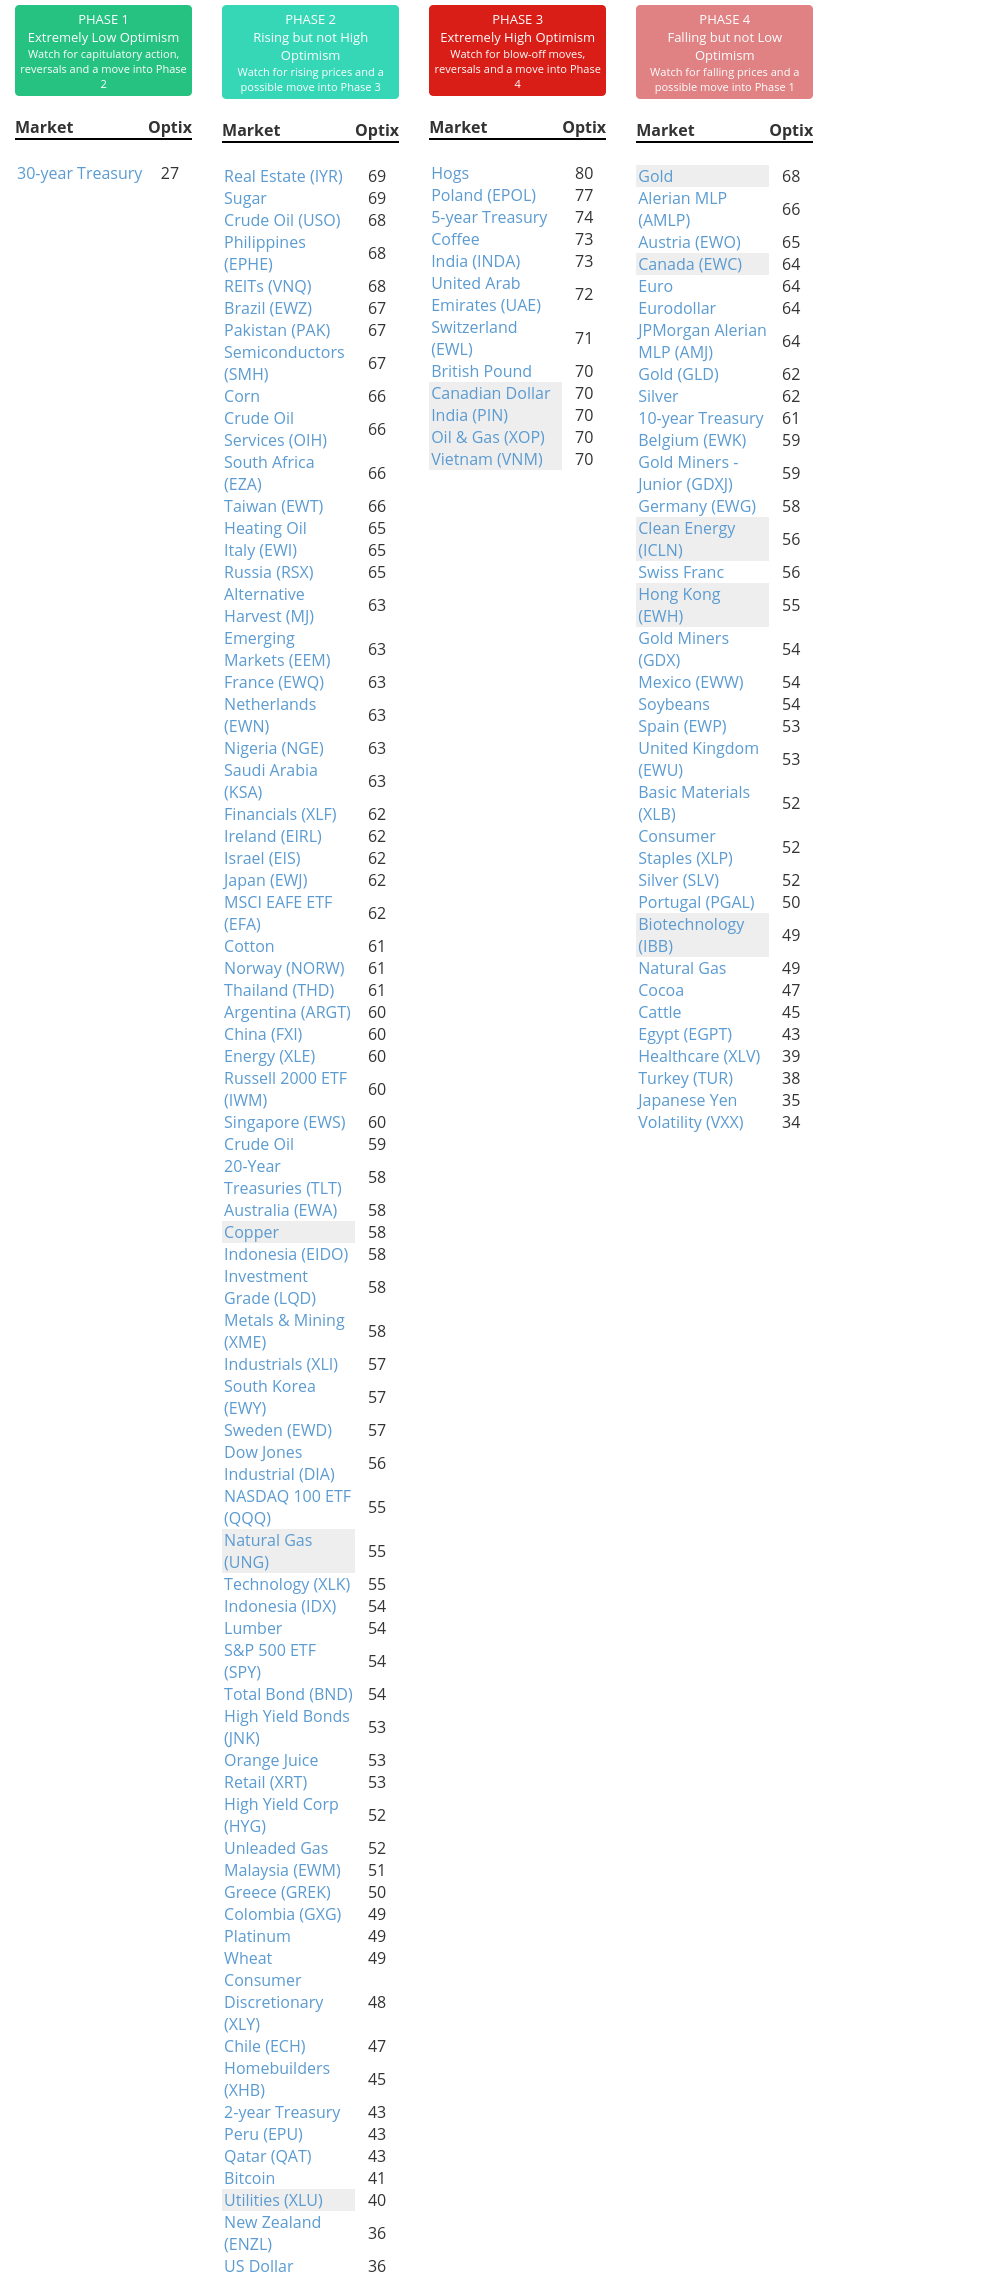
Phase Table
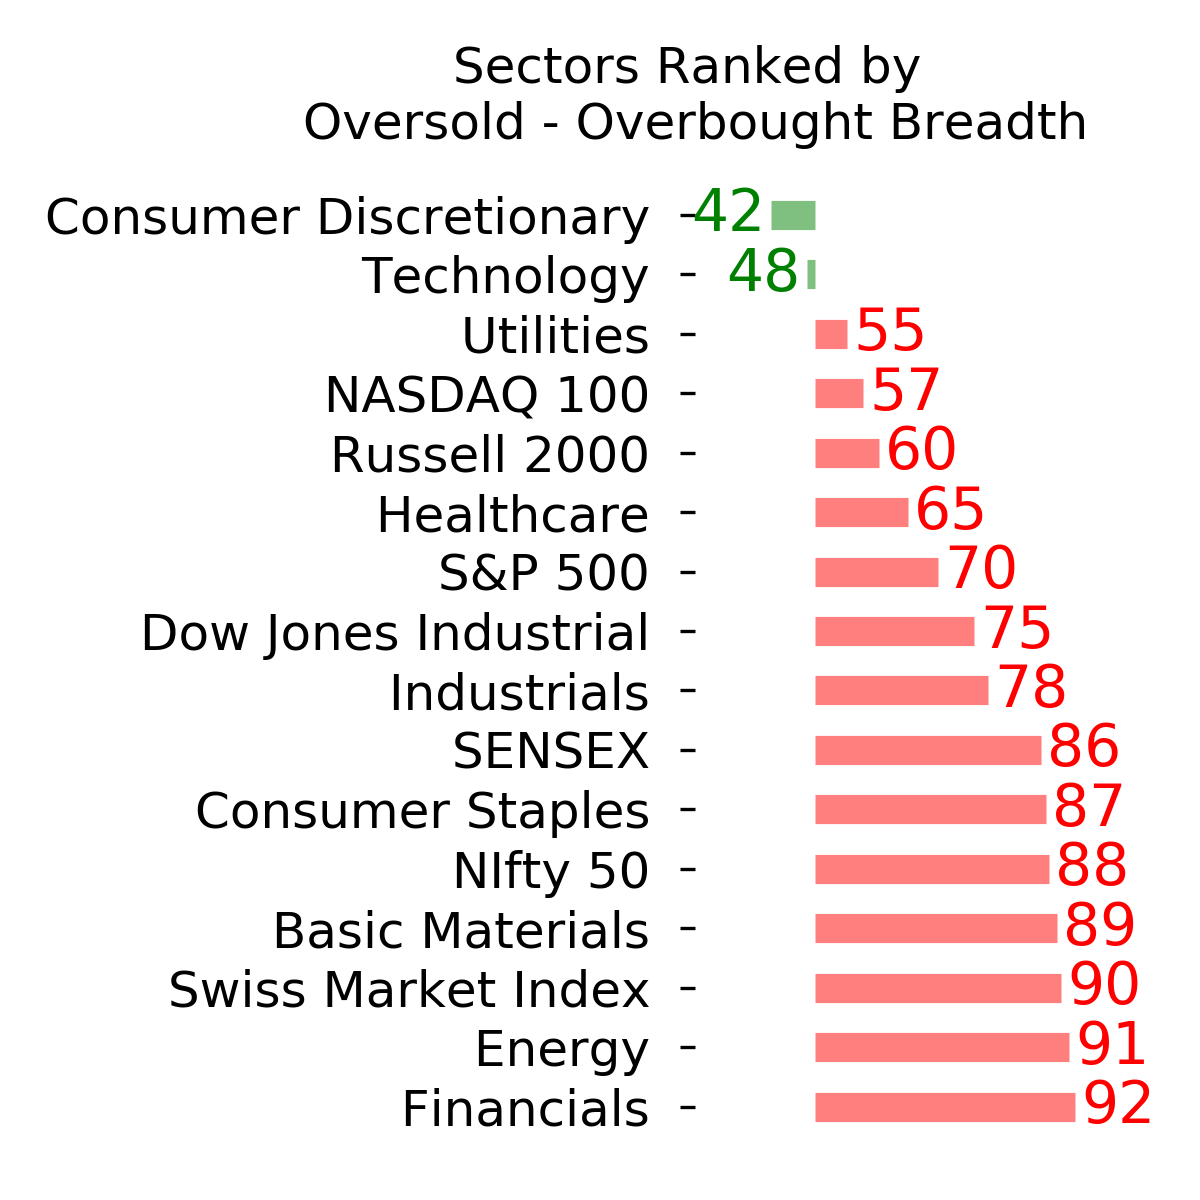
Ranks
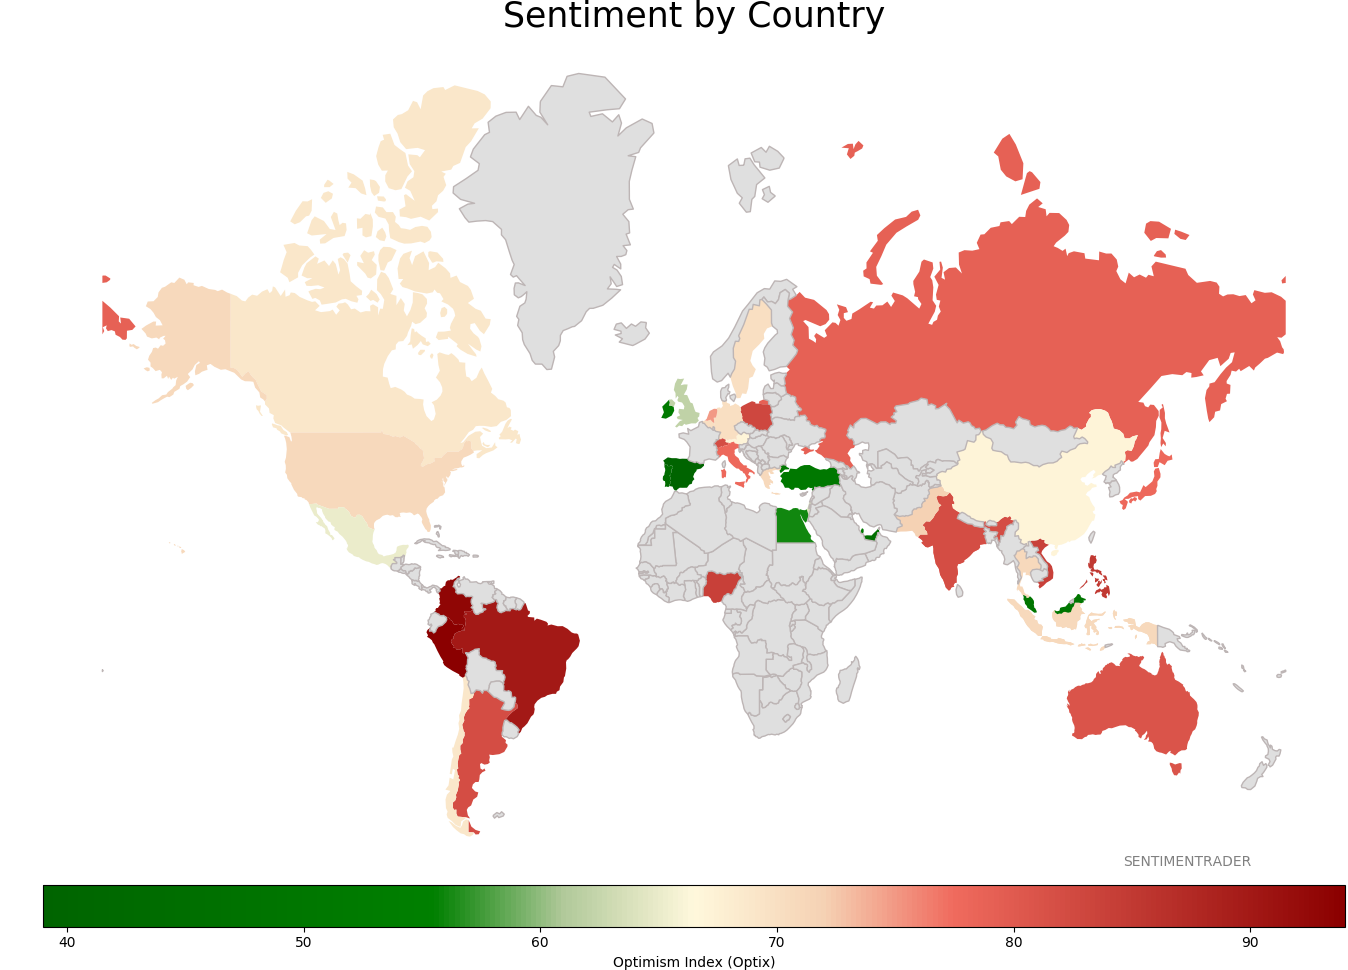
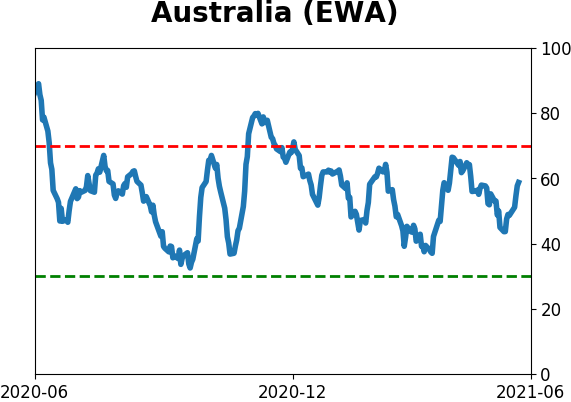
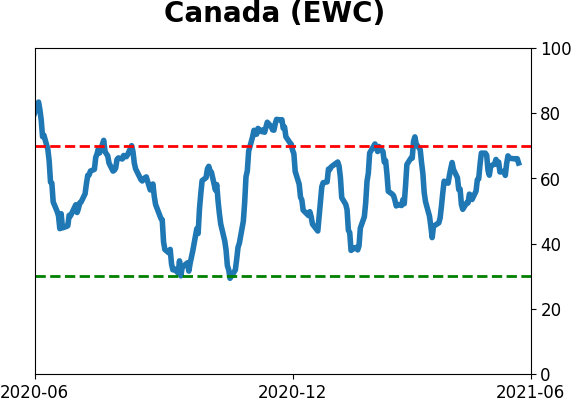
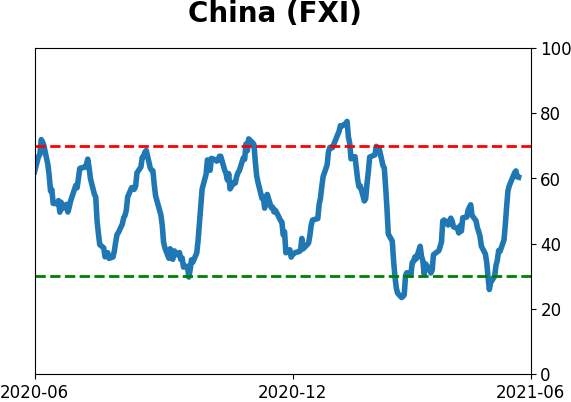
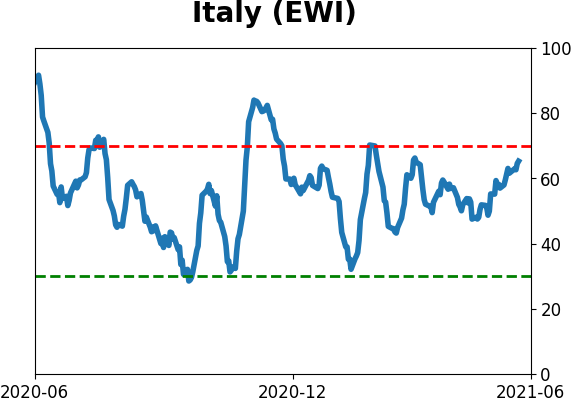
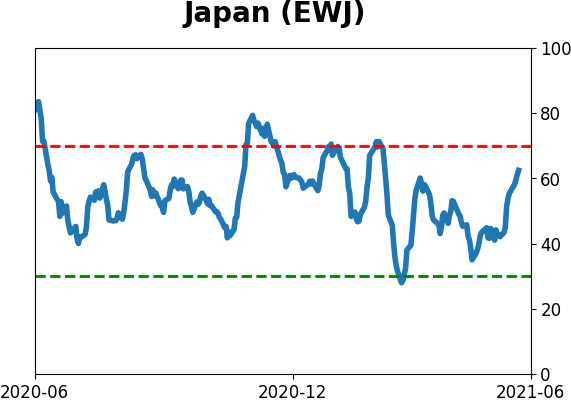
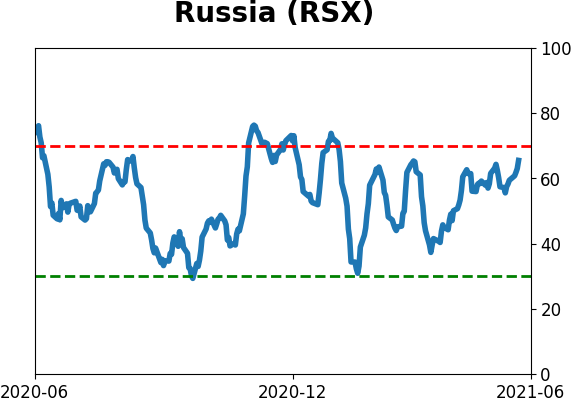
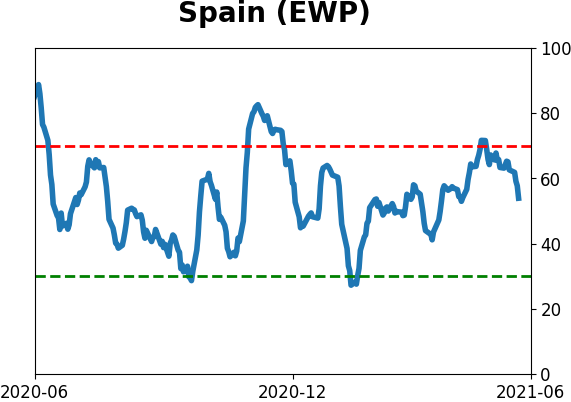
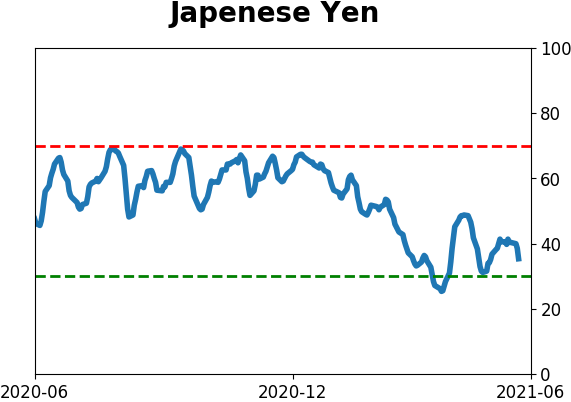
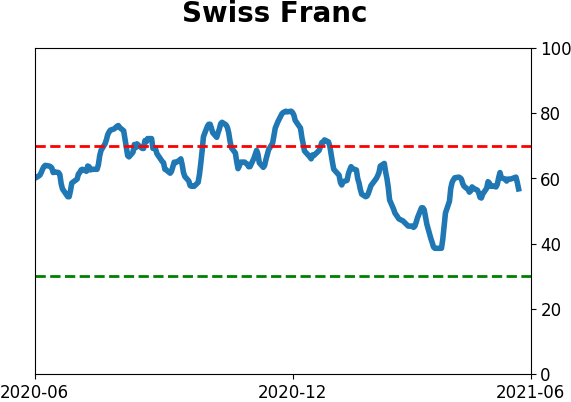
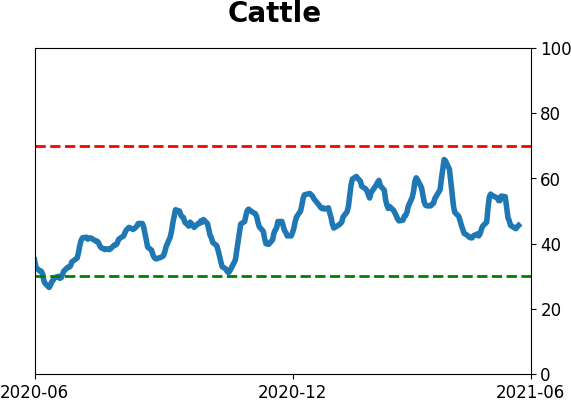
Sentiment Around The World
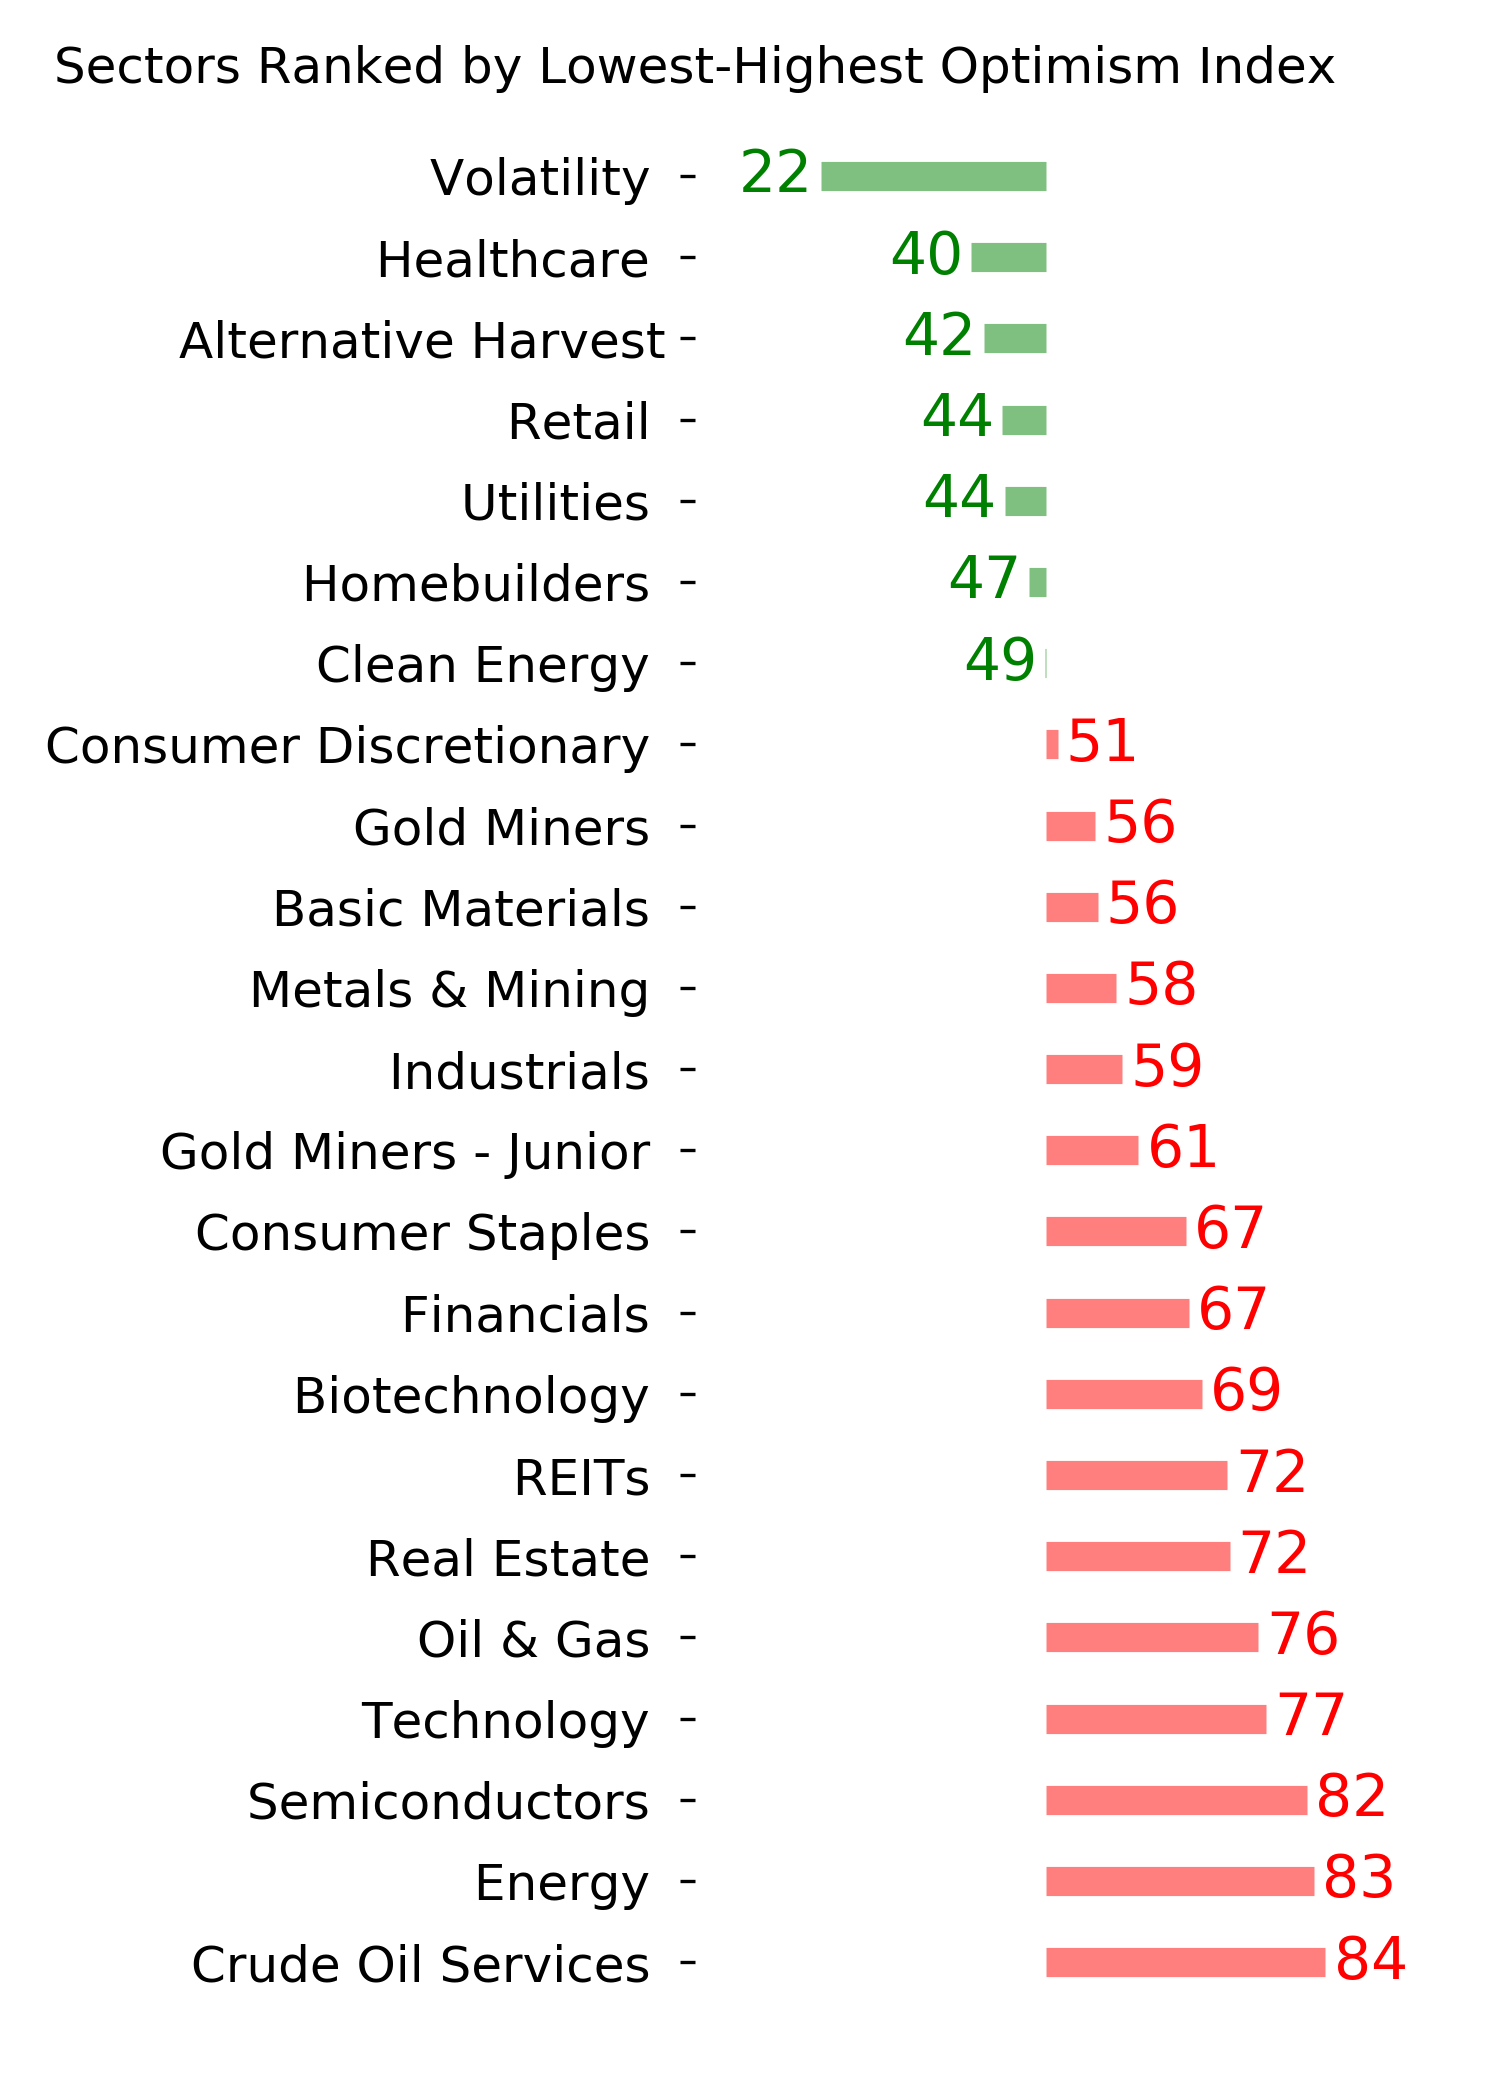
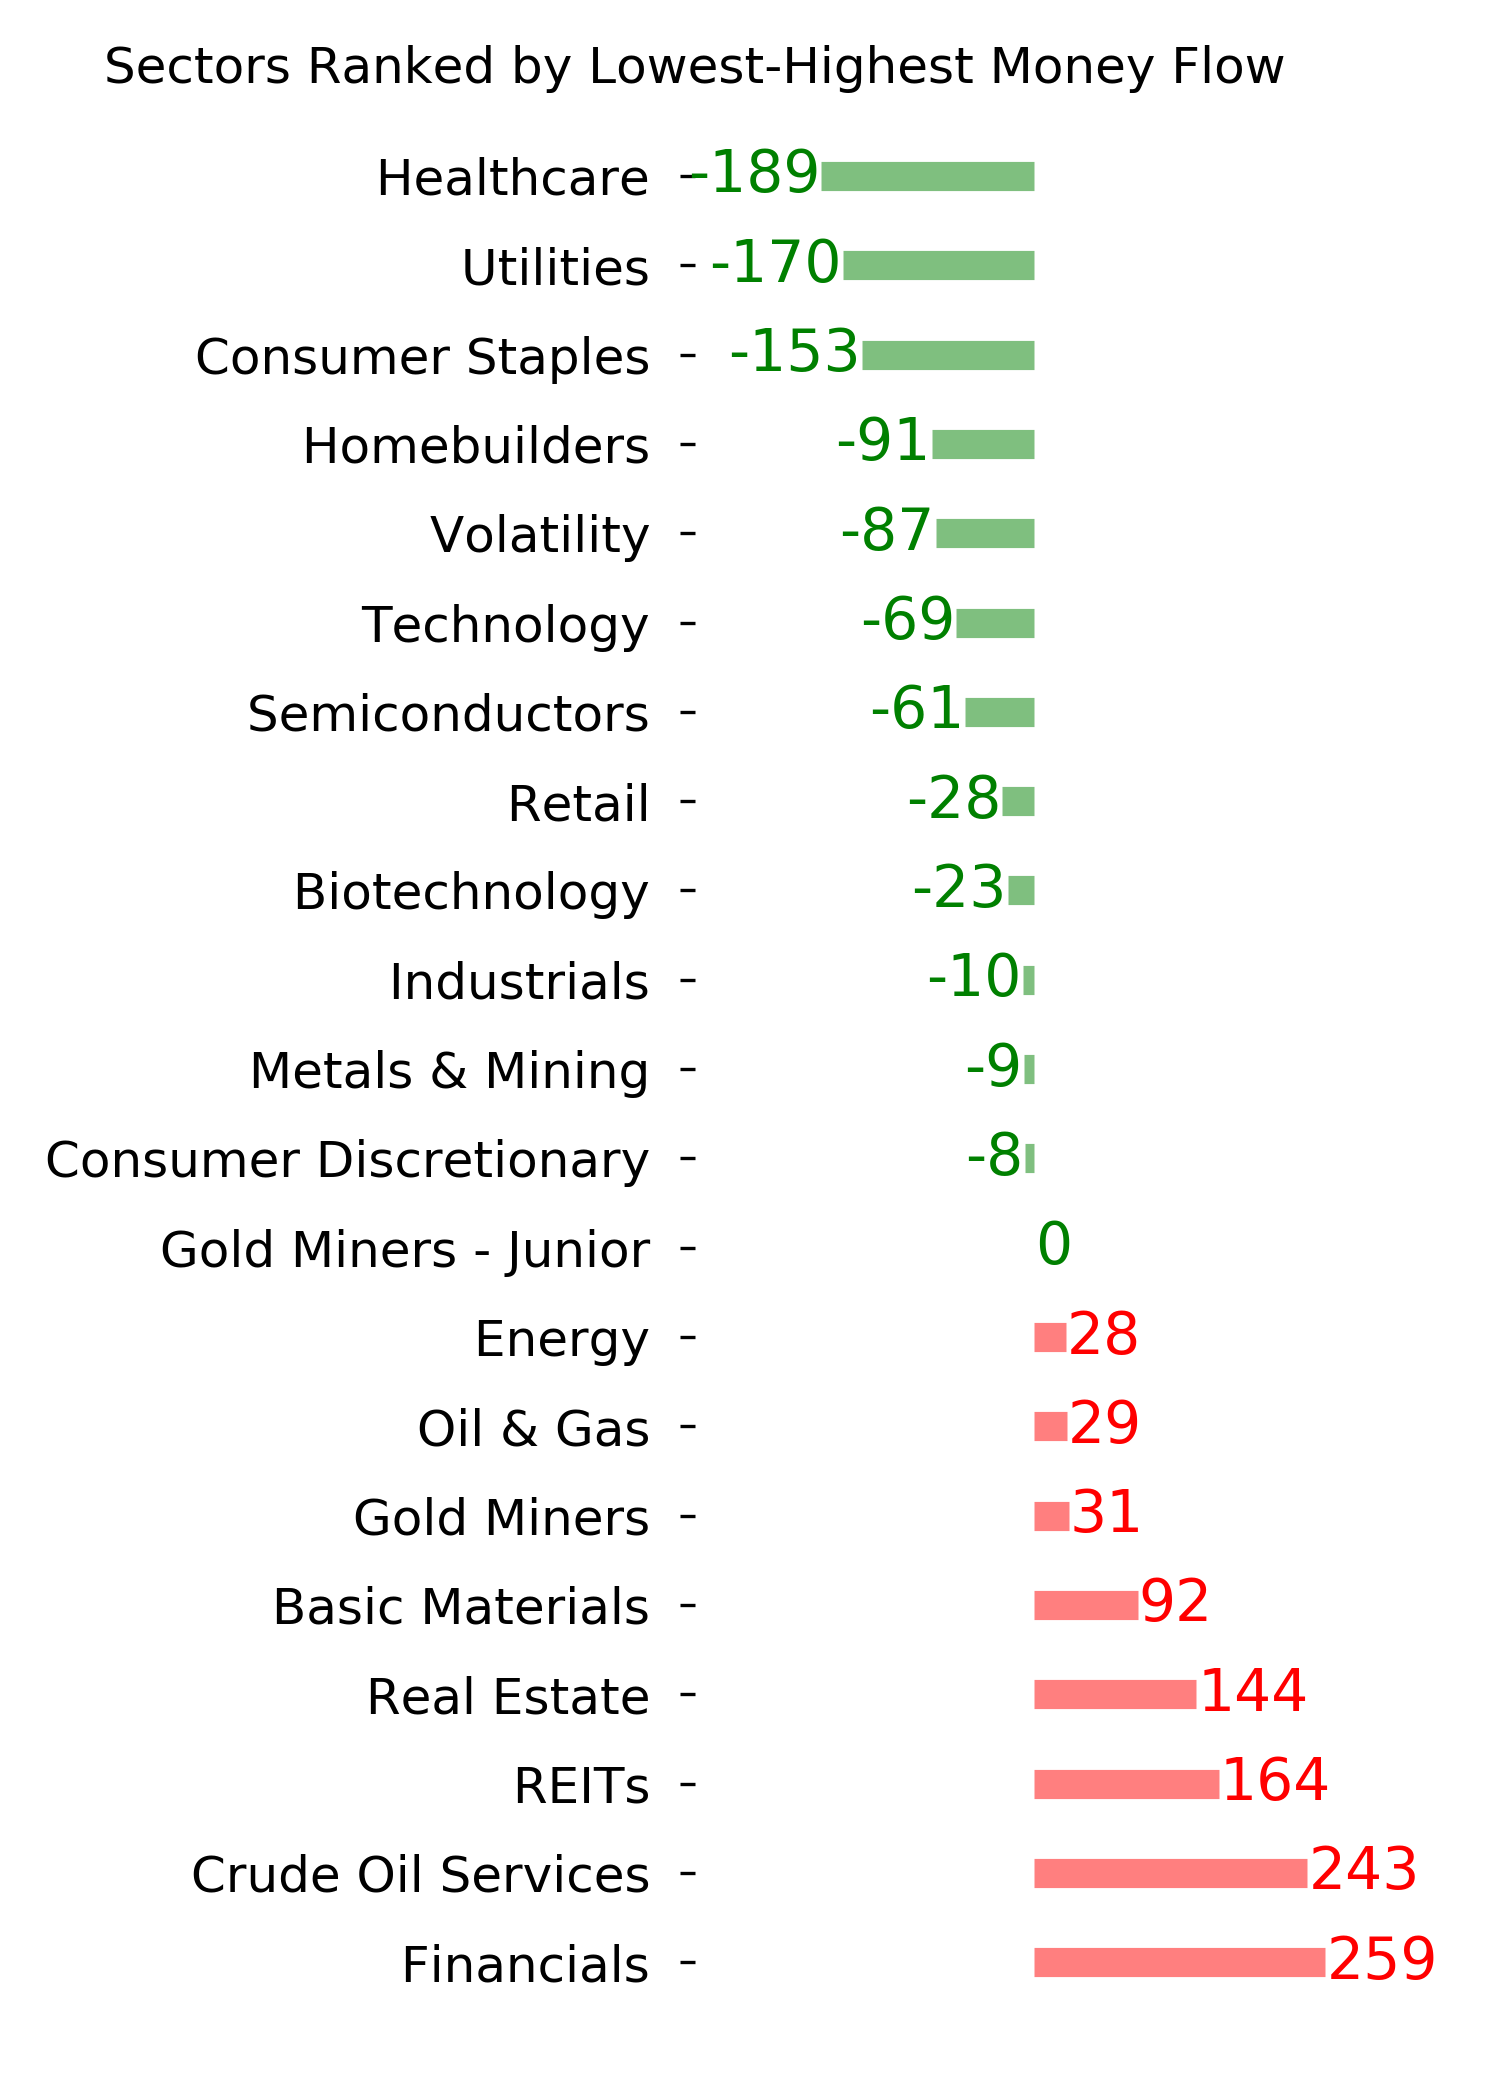
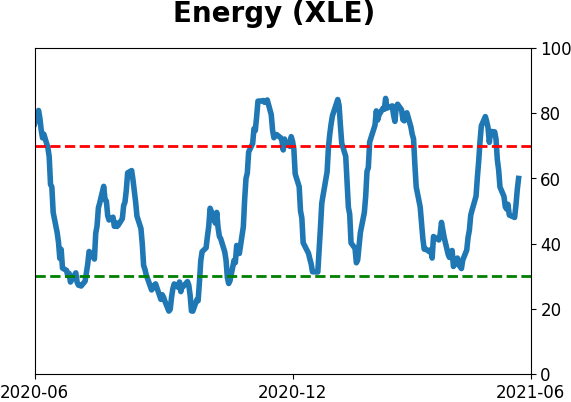
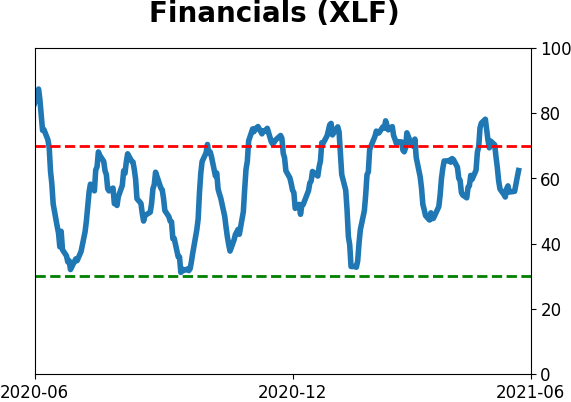
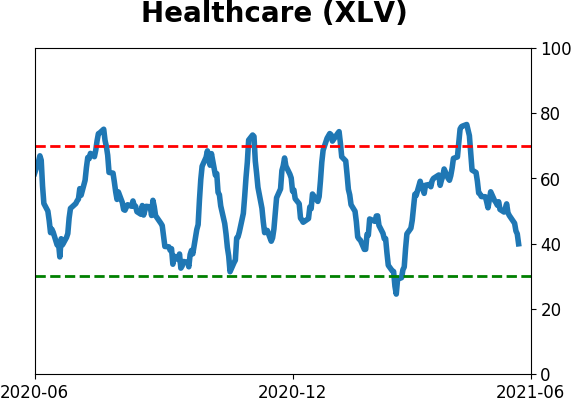
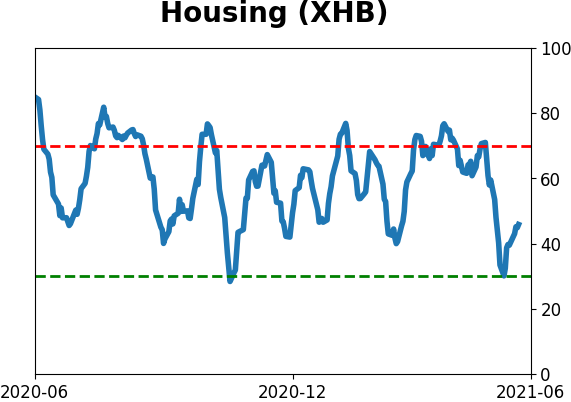
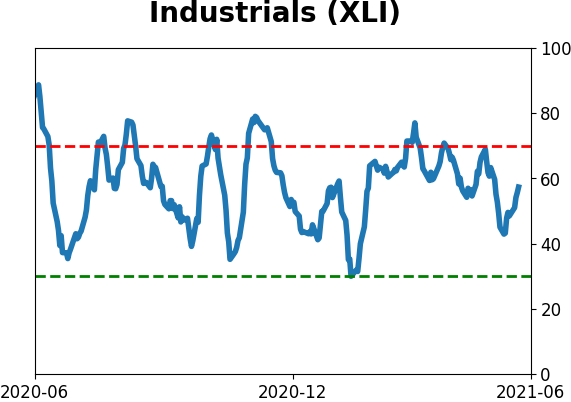
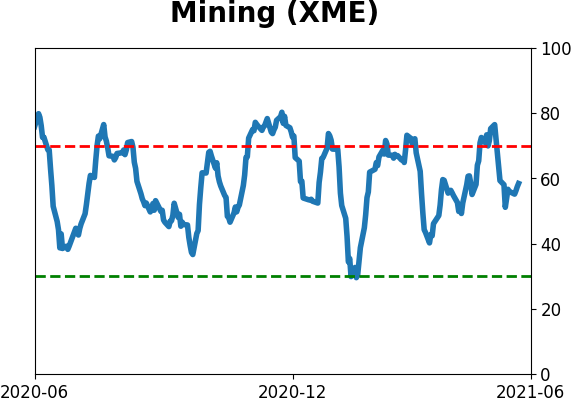
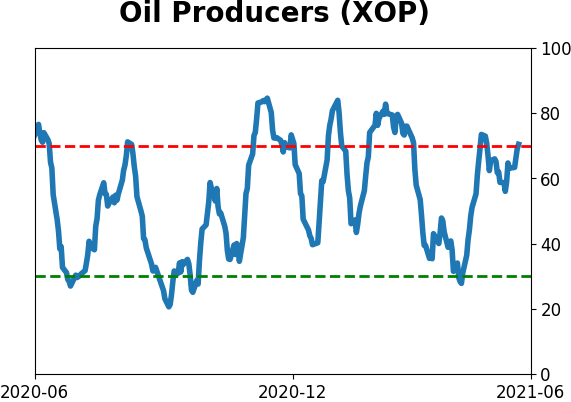
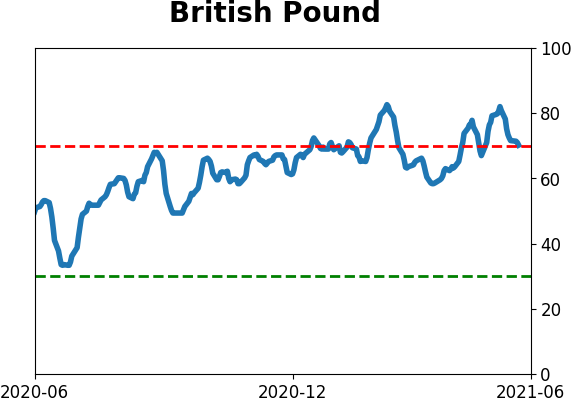
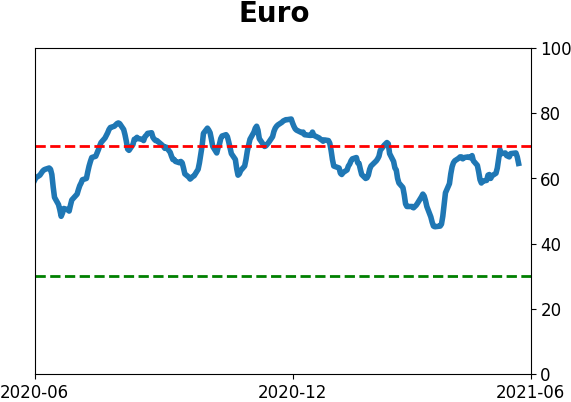
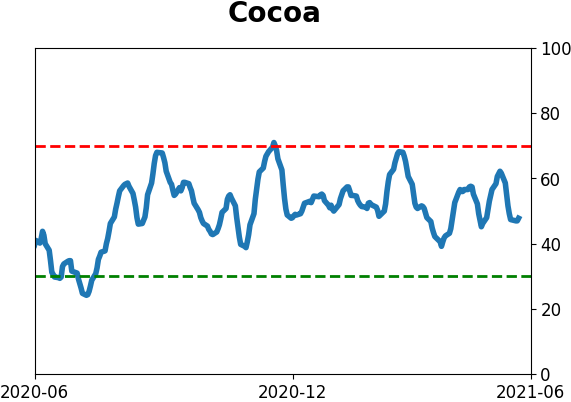
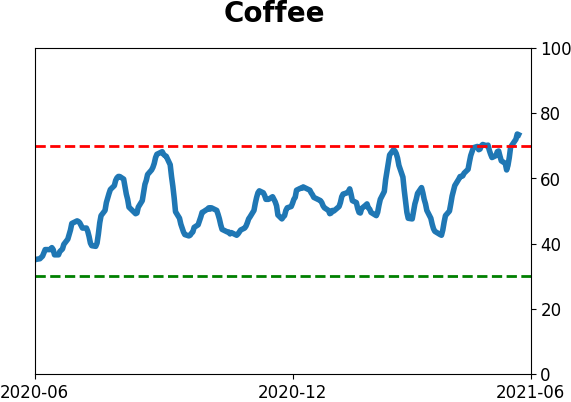
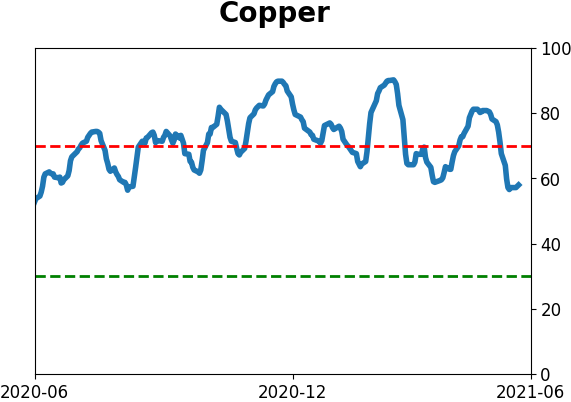
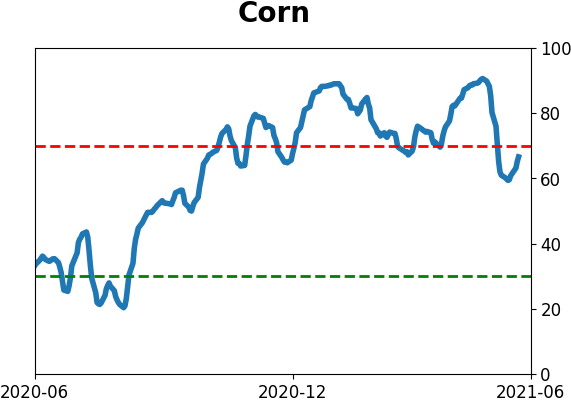
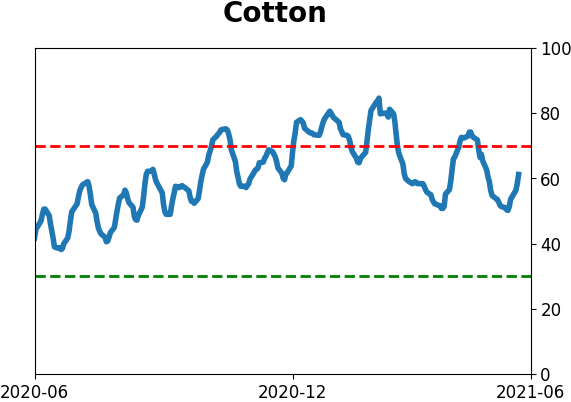
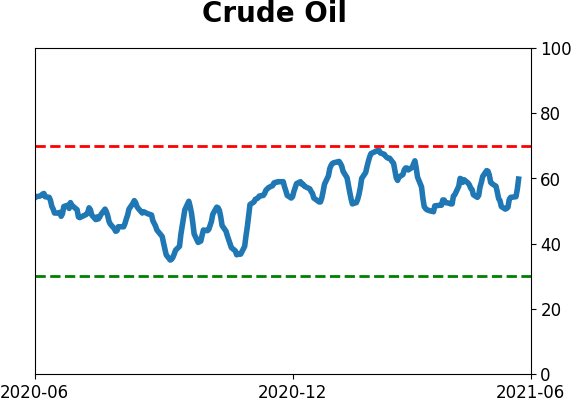
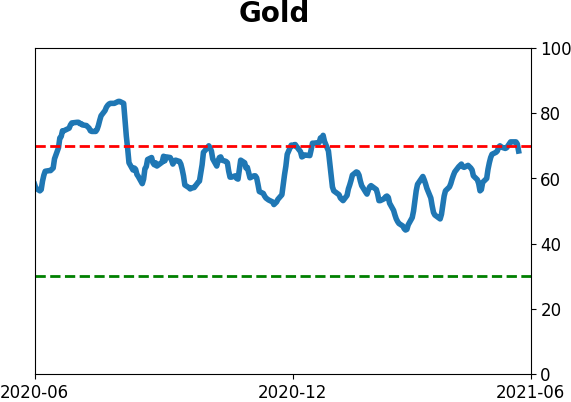
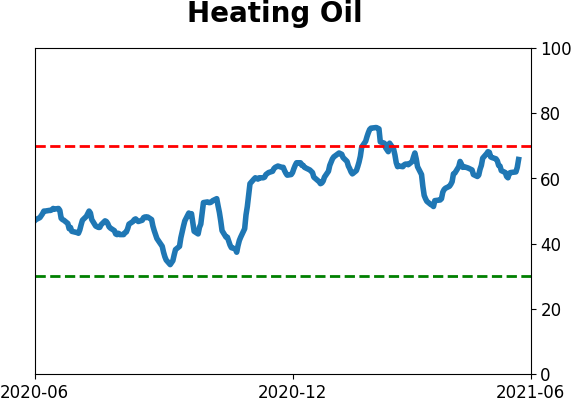
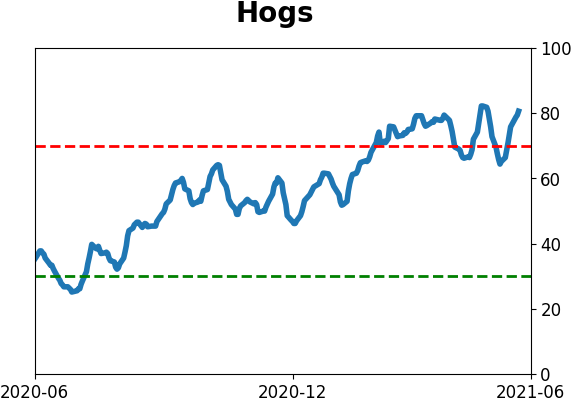
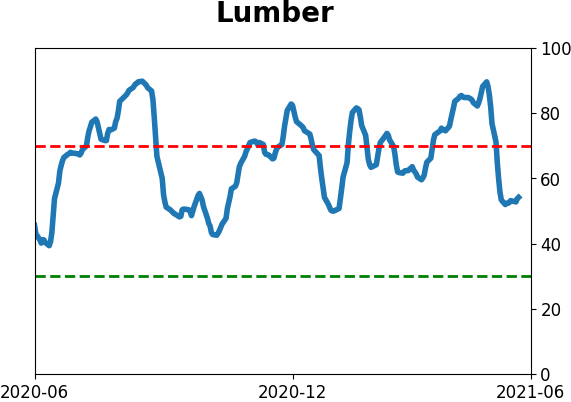
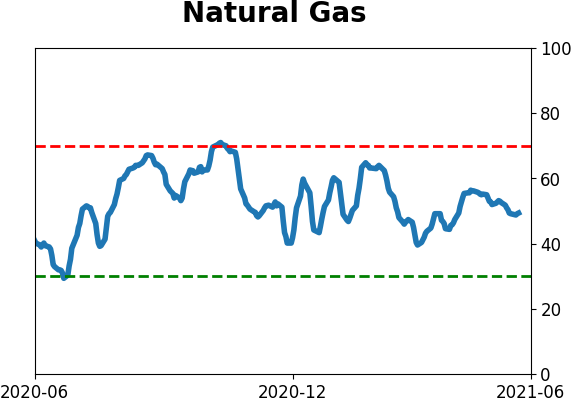
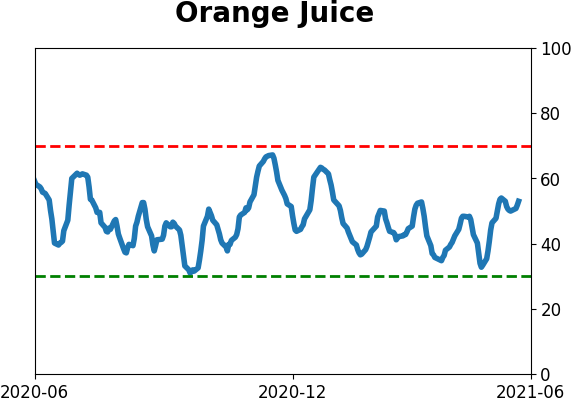
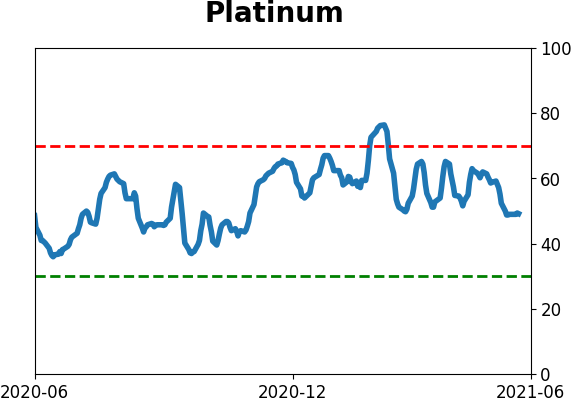
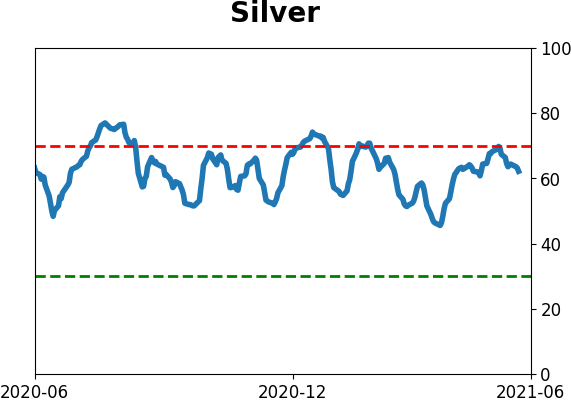
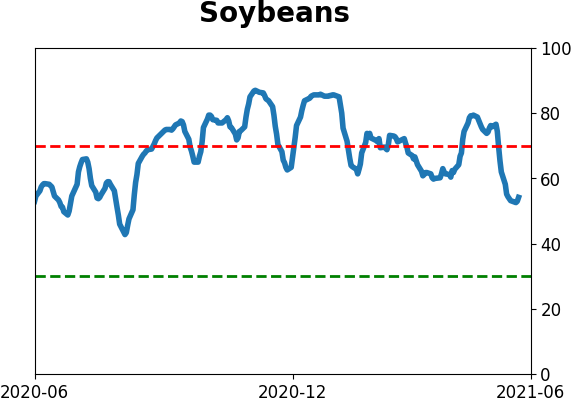
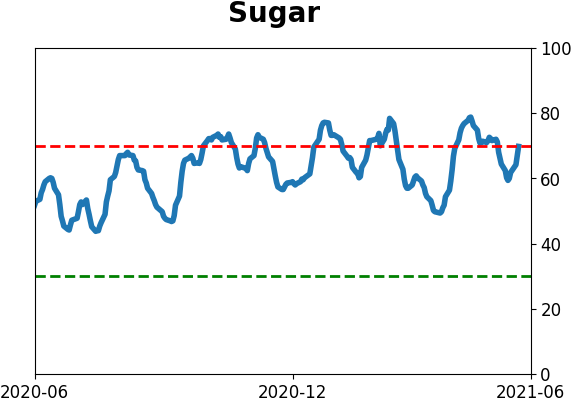
Optimism Index Thumbnails
|
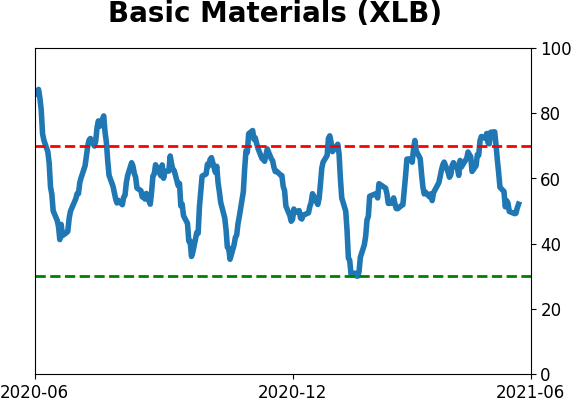
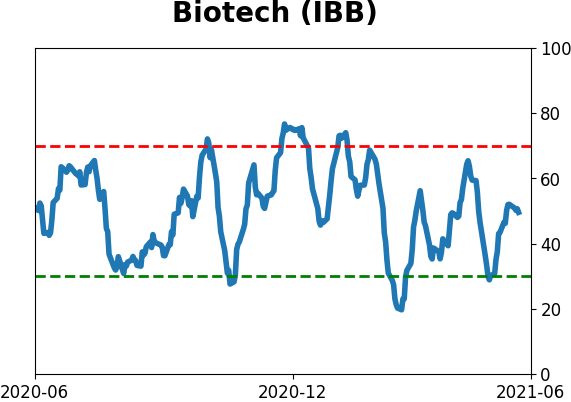
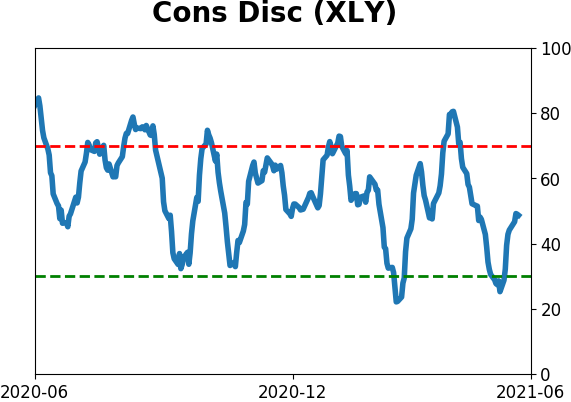
Sector ETF's - 10-Day Moving Average
|
|
|
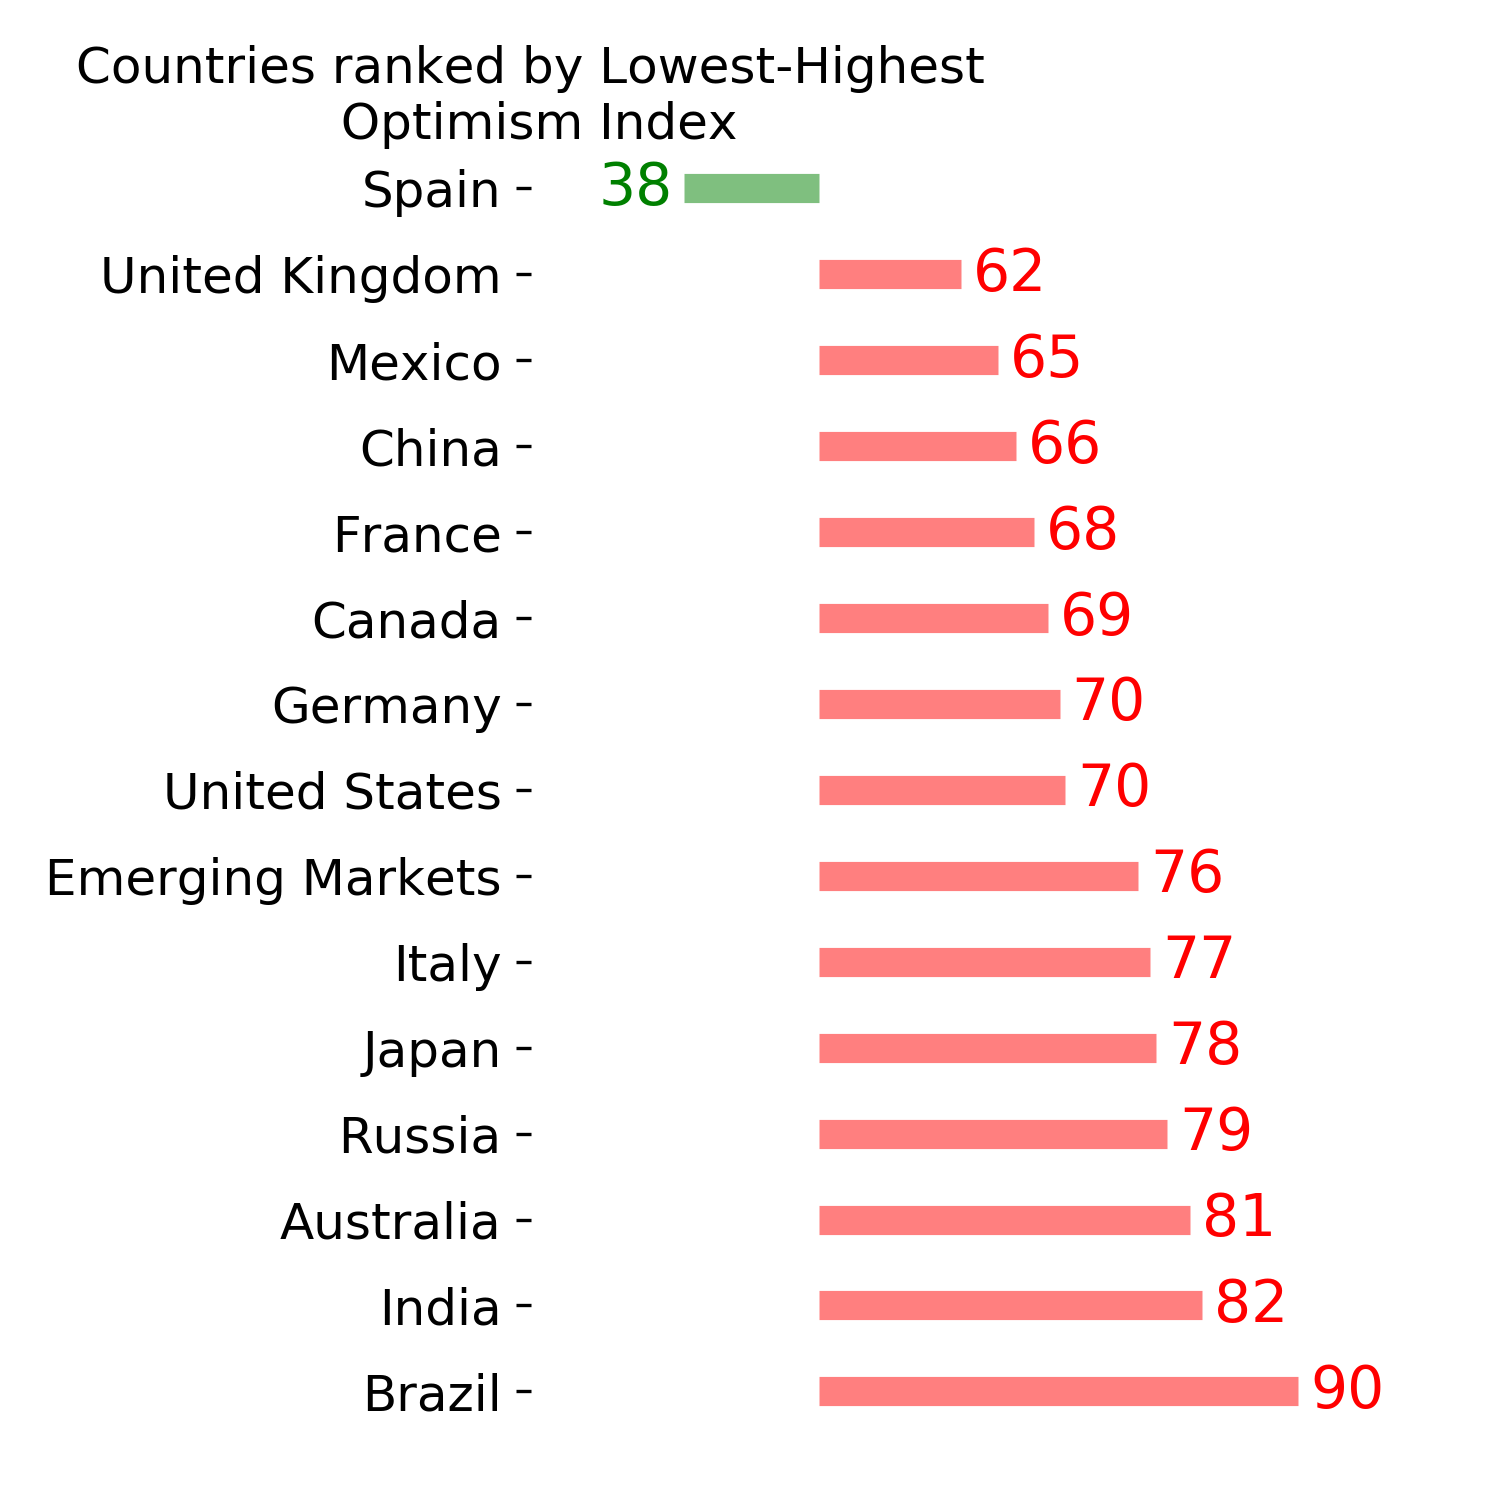
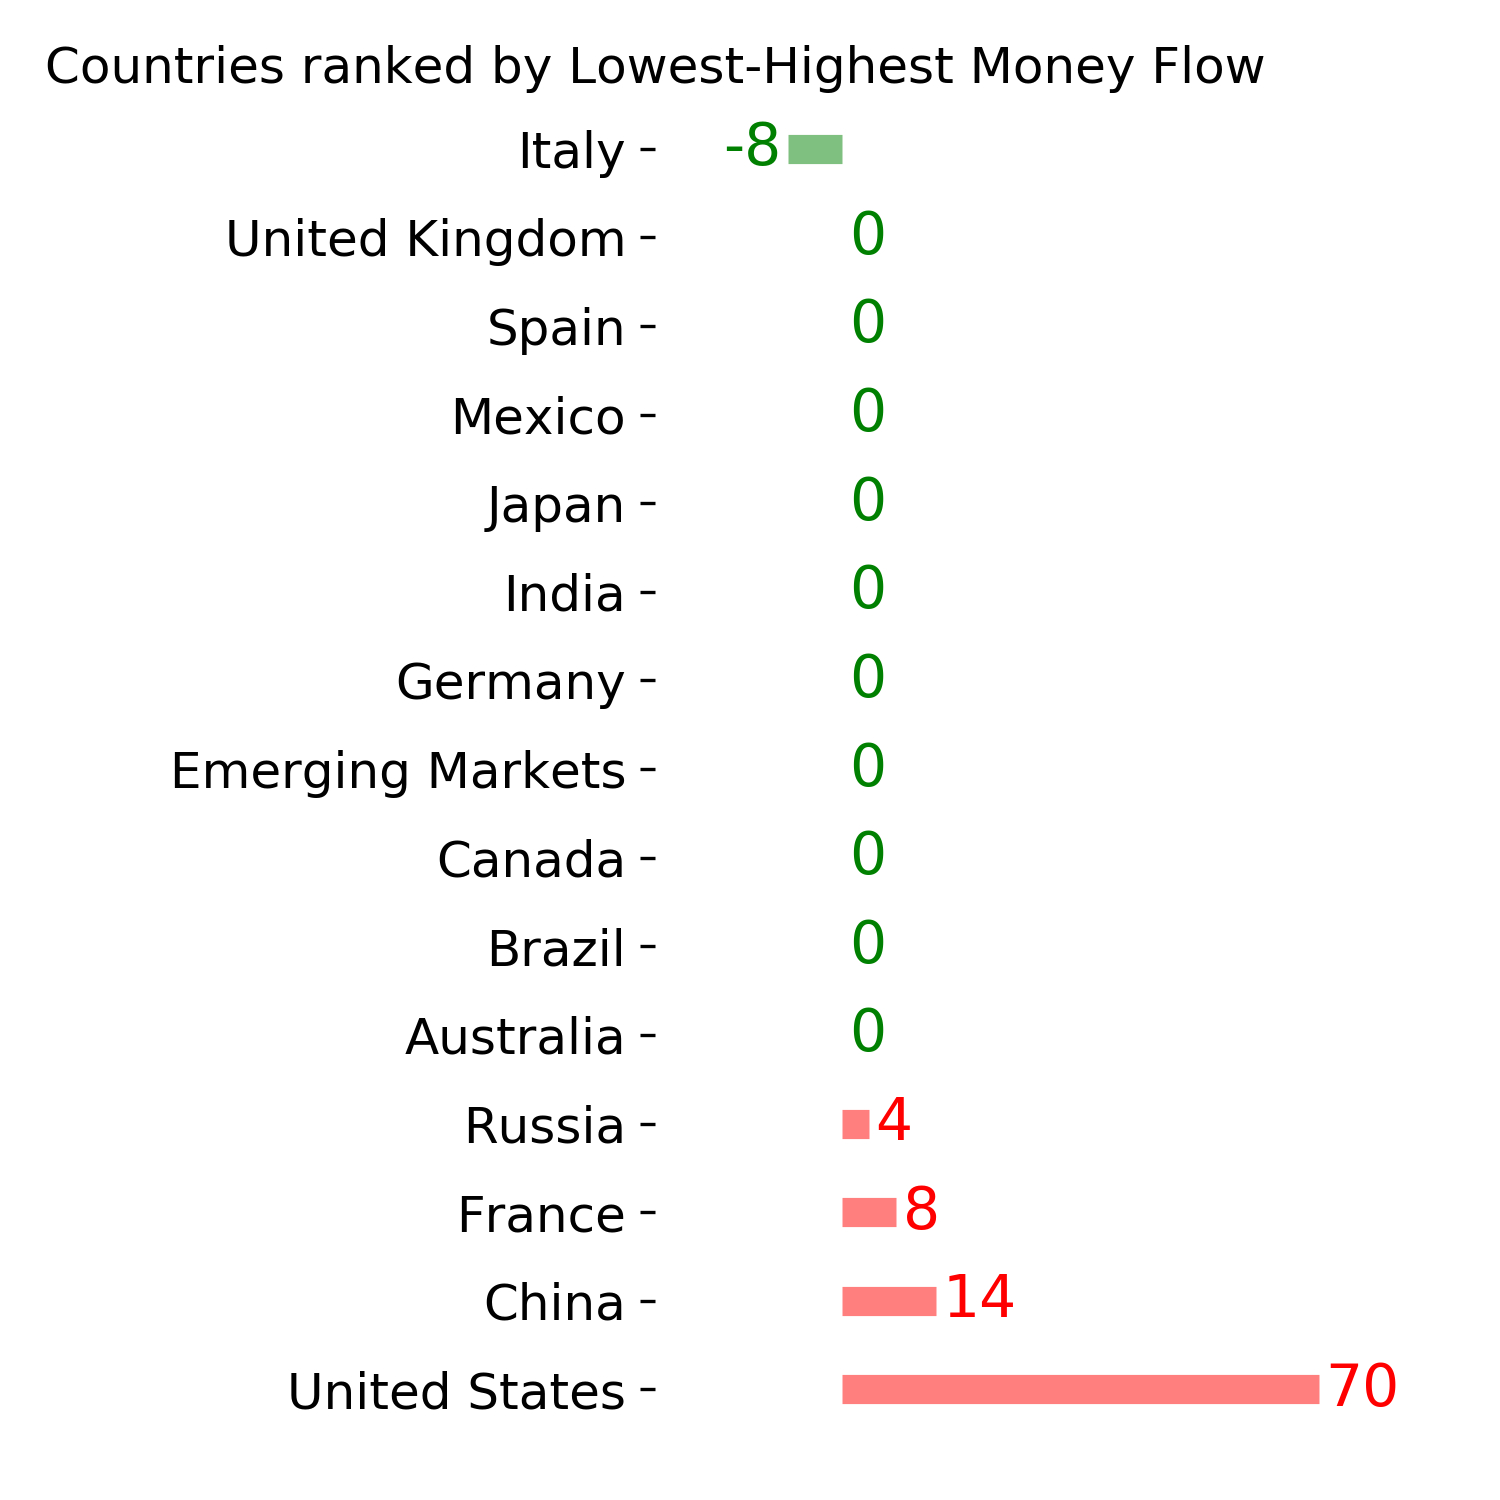
Country ETF's - 10-Day Moving Average
|
|
|
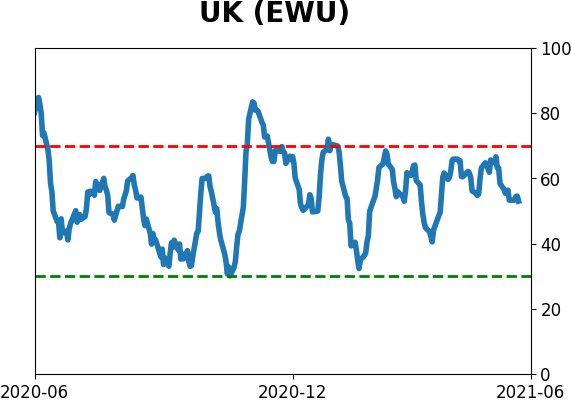
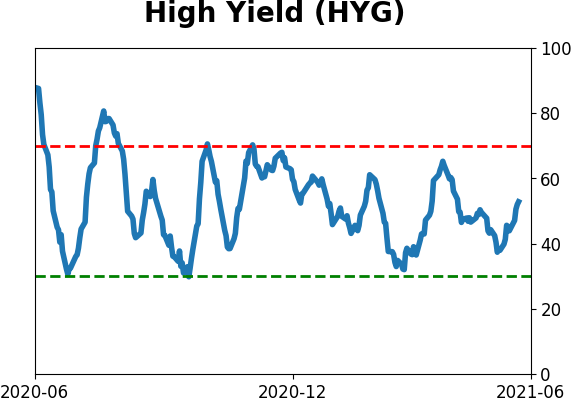
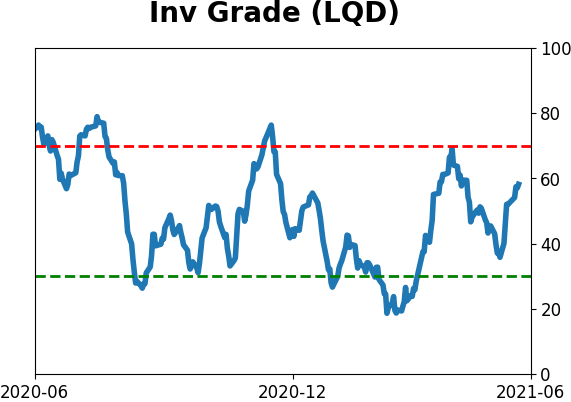
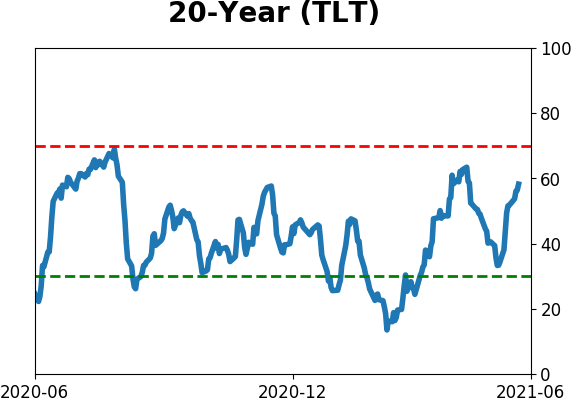
Bond ETF's - 10-Day Moving Average
|
|
|
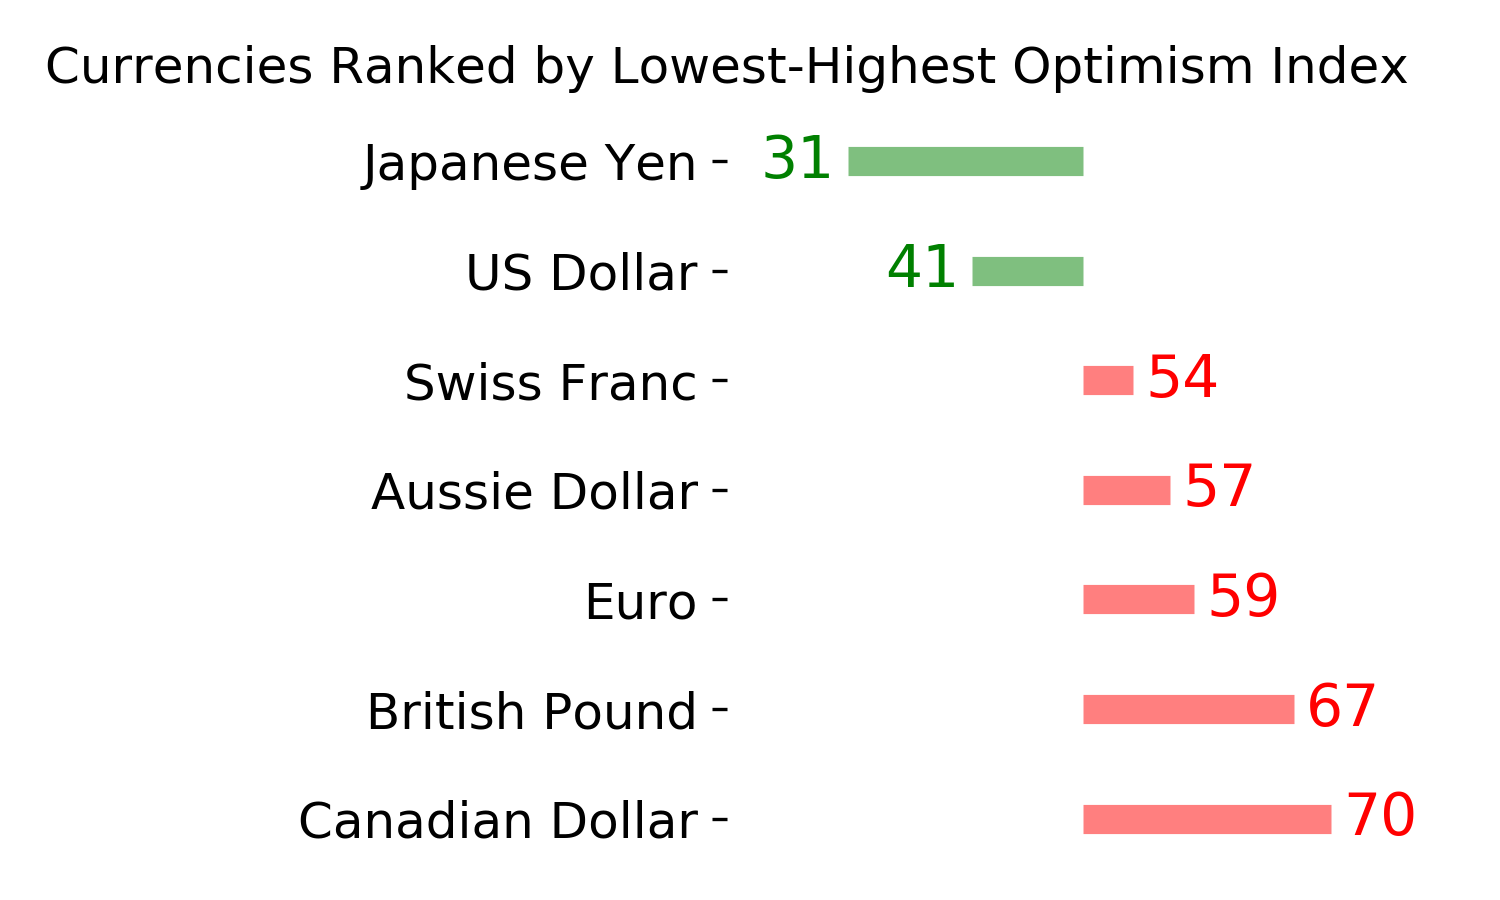
Currency ETF's - 5-Day Moving Average
|
|
|
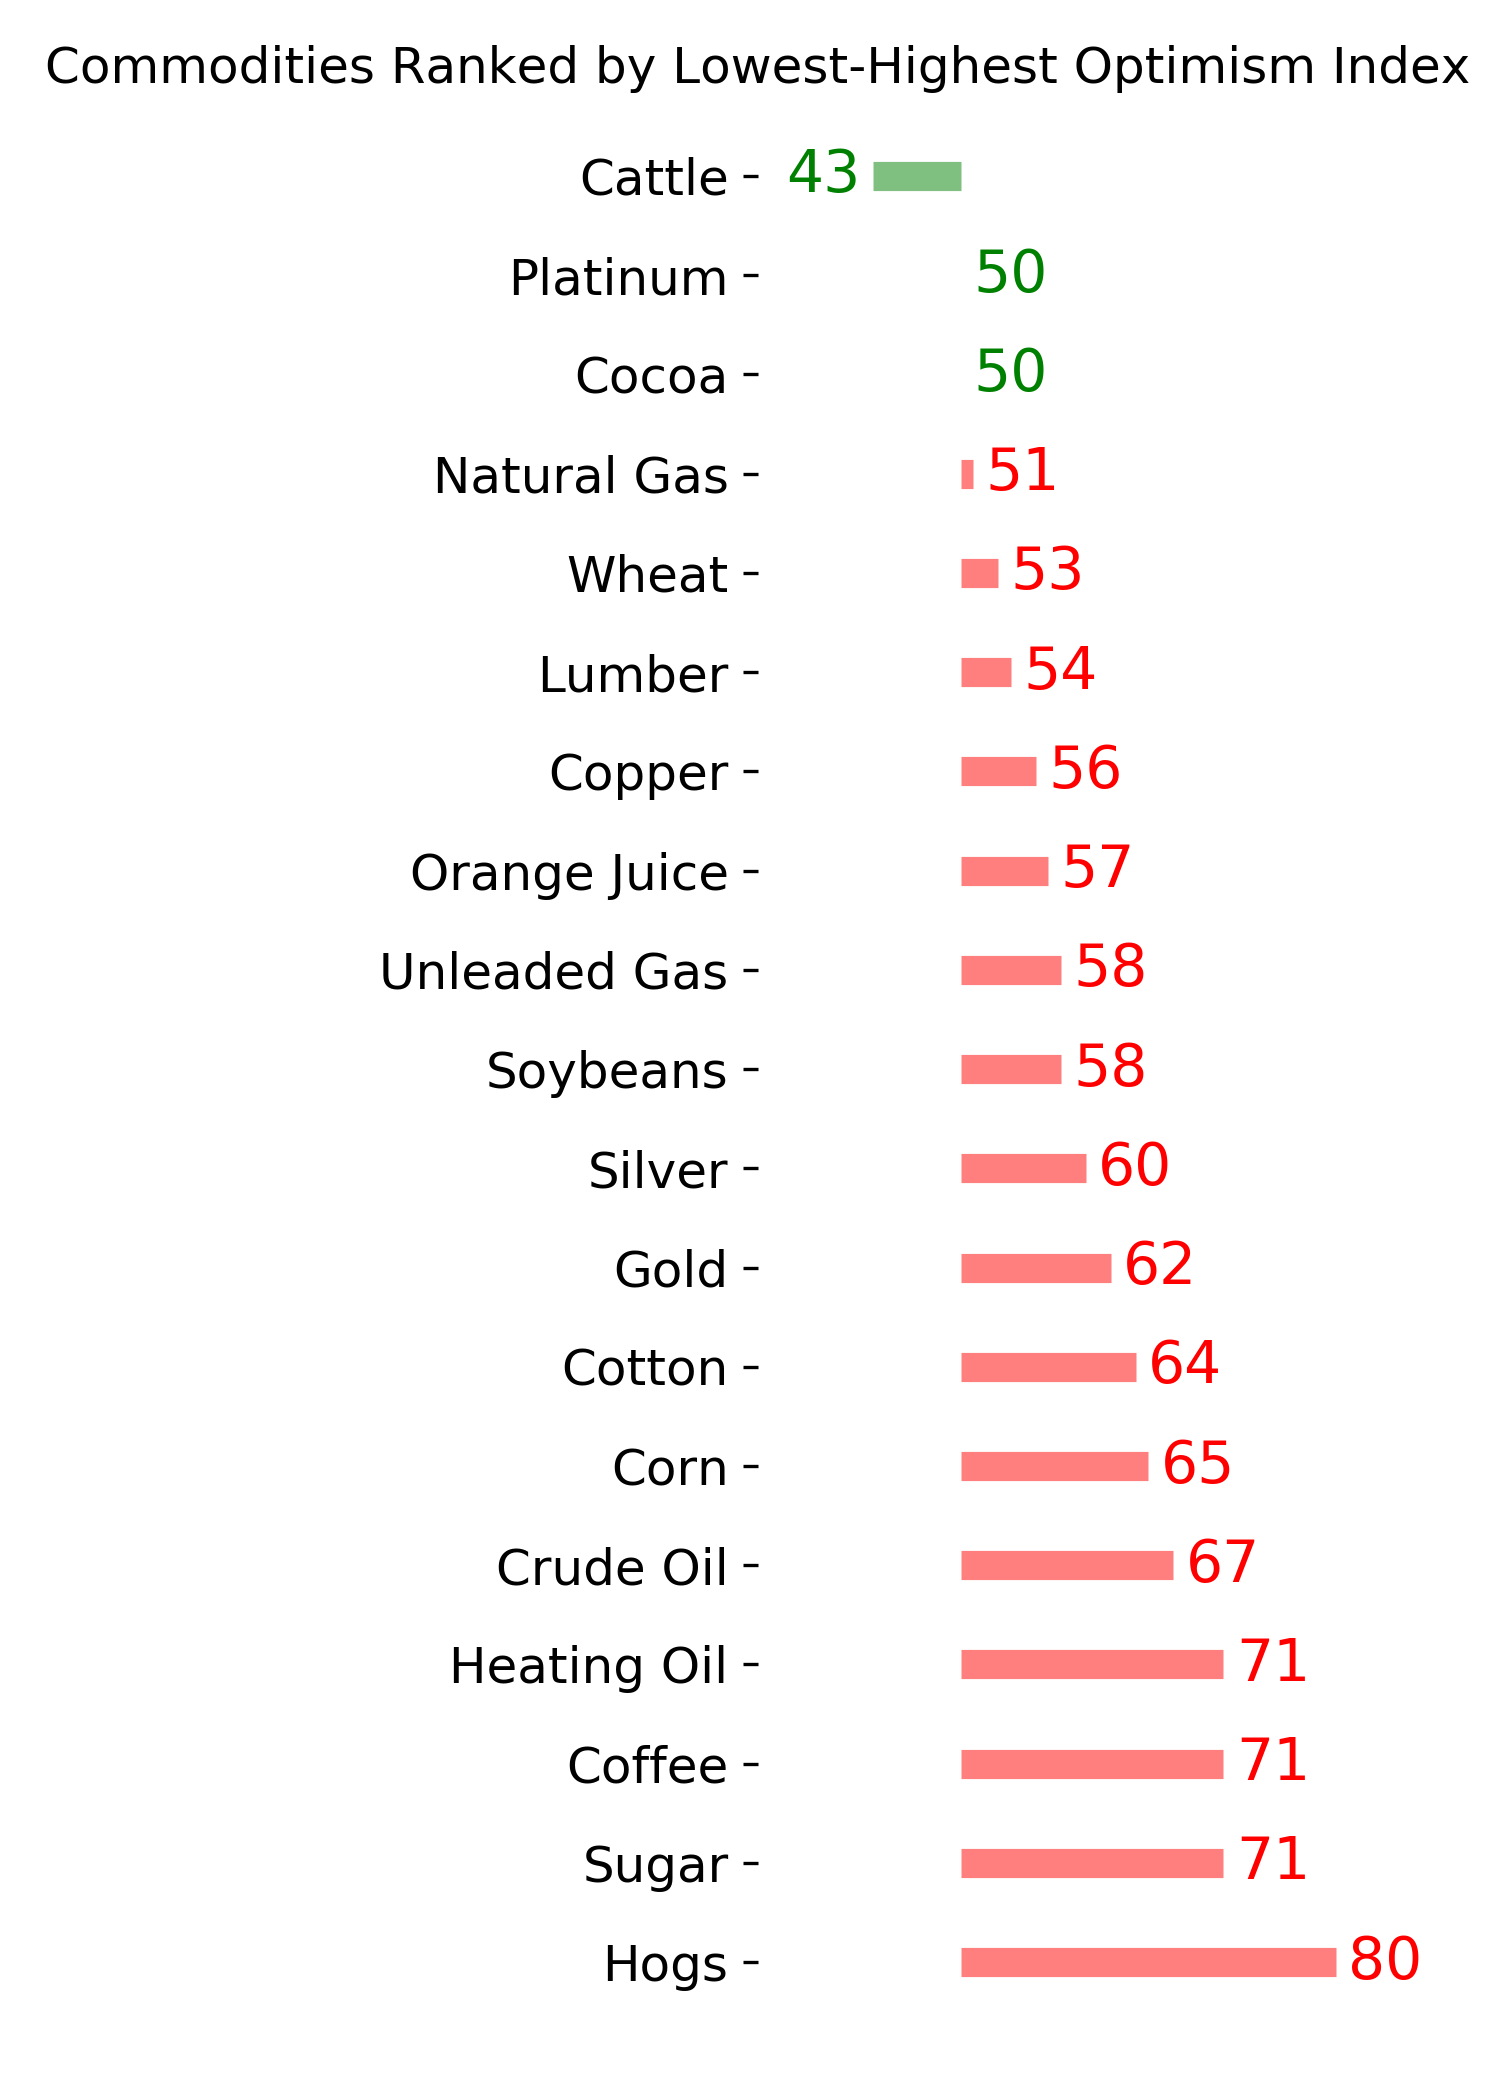
Commodity ETF's - 5-Day Moving Average
|
|