Headlines
|
|
Two Risk-Off Composite Model members triggered warnings:
Two components in the Risk-Off Composite Model issued warnings, hinting at diminishing stock participation. Following comparable signals, the S&P 500 struggled over the ensuing two months.
|
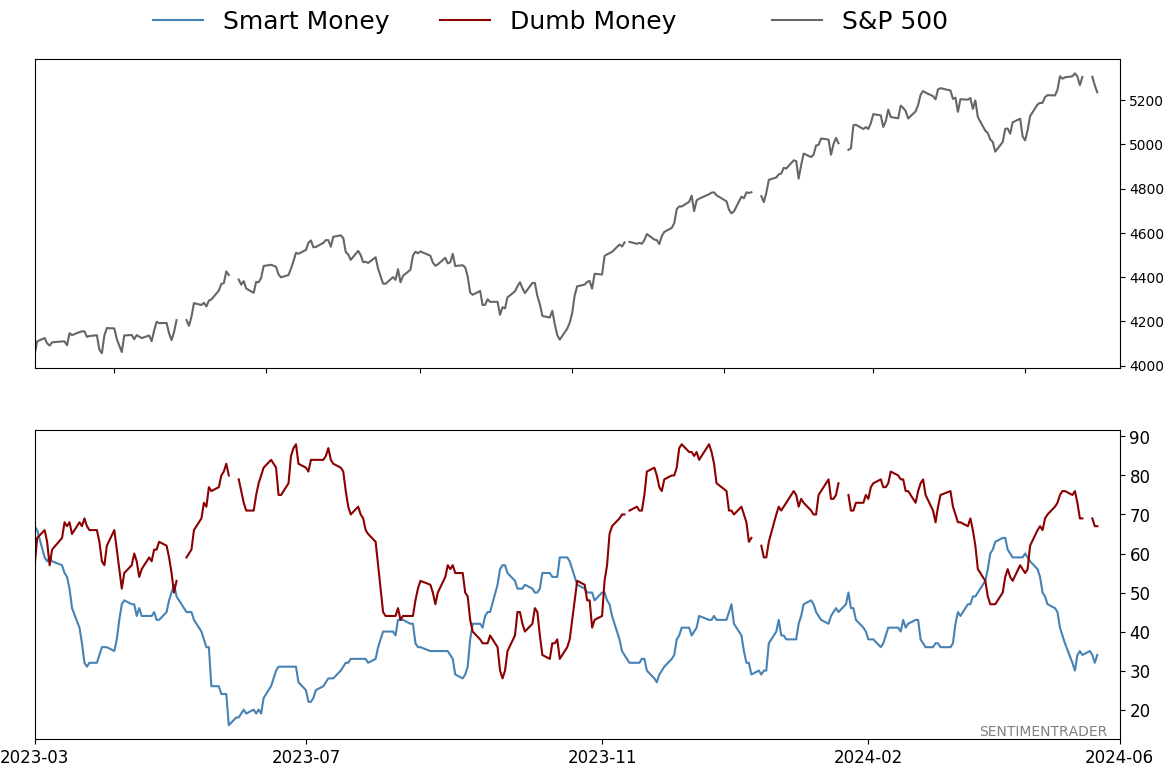
Smart / Dumb Money Confidence
|
Smart Money Confidence: 34%
Dumb Money Confidence: 67%
|
|
Risk Levels
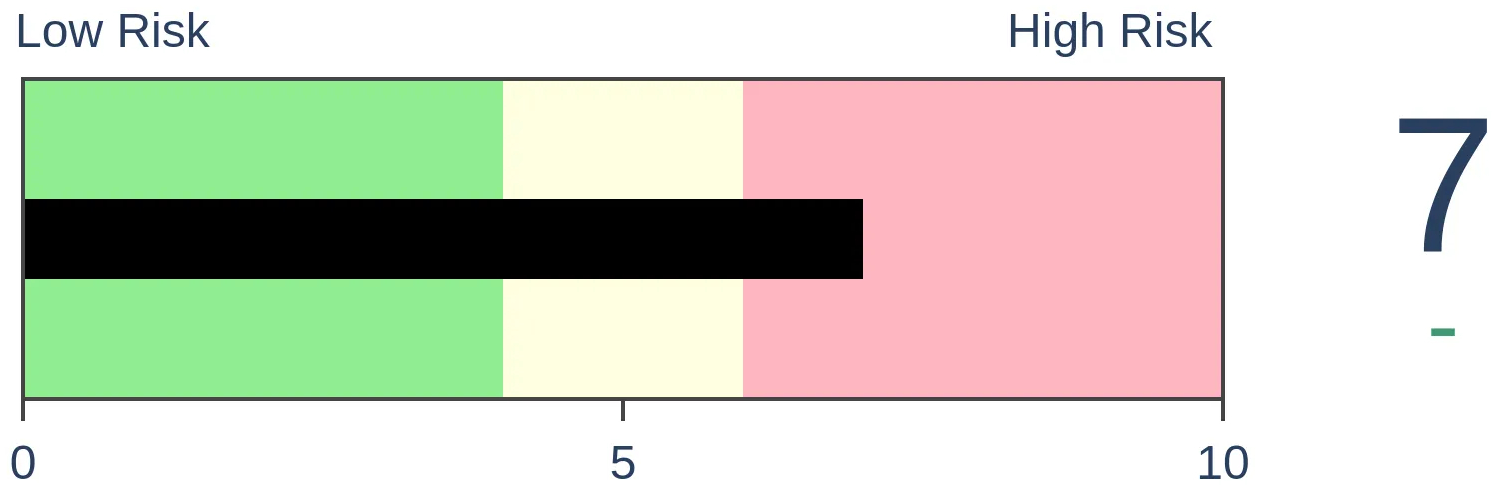
Stocks Short-Term
|
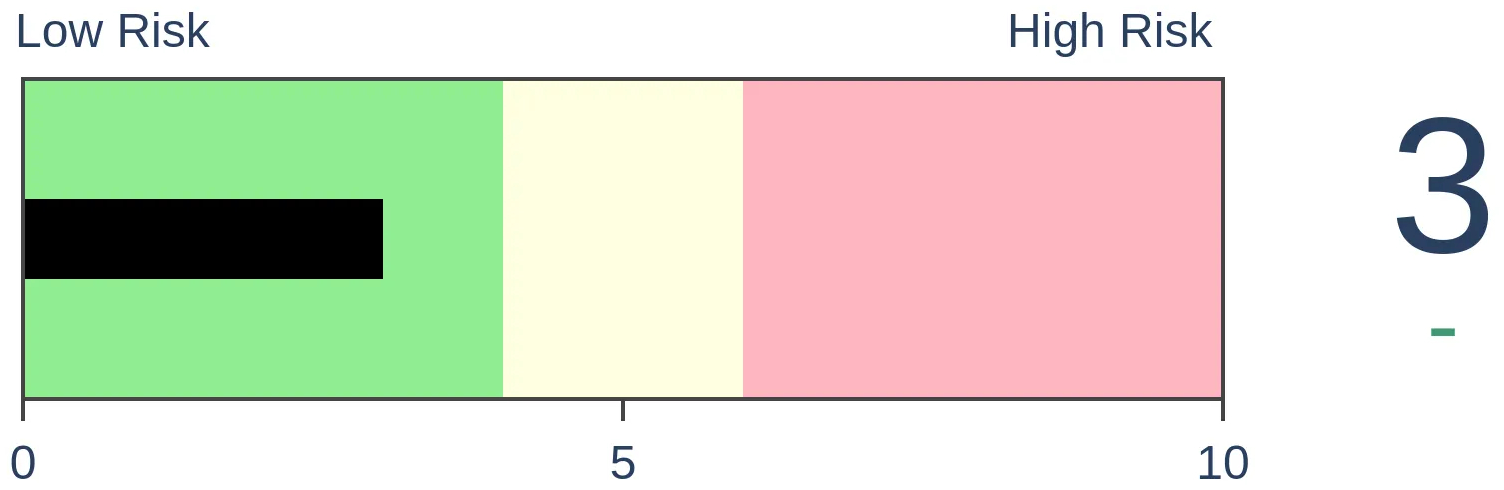
Stocks Medium-Term
|
|
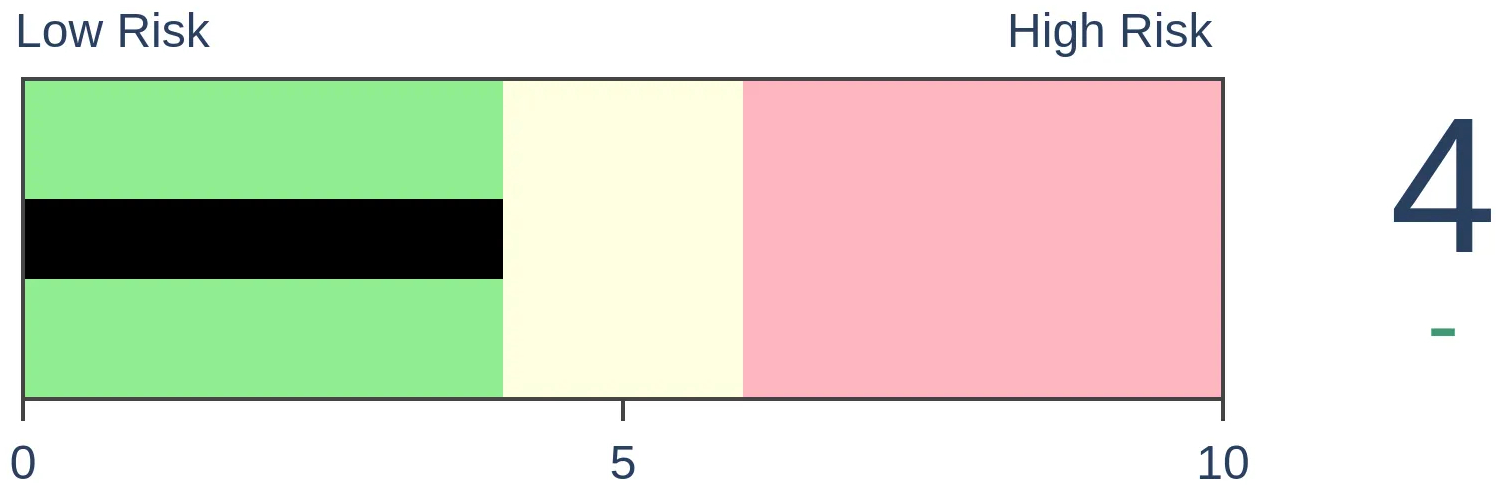
Bonds
|
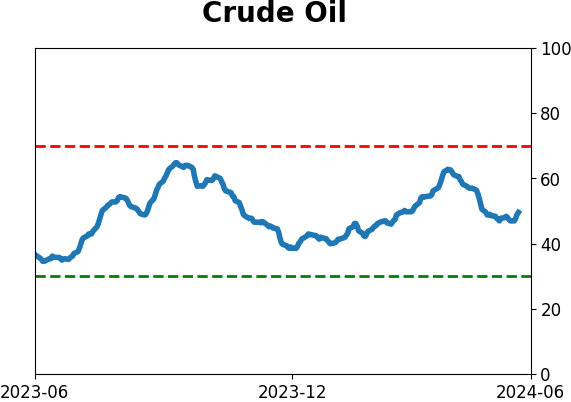
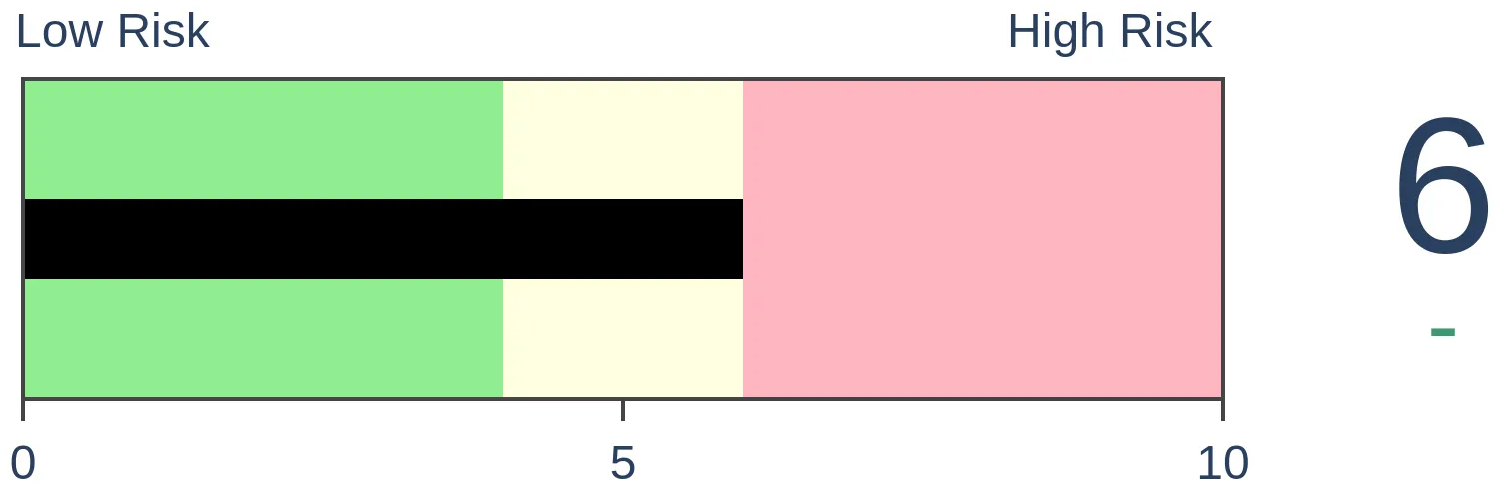
Crude Oil
|
|
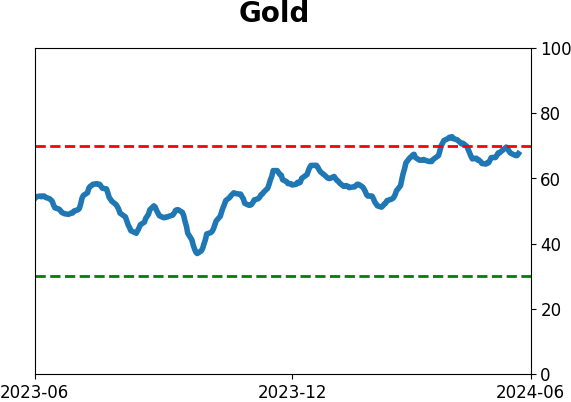
Gold
|
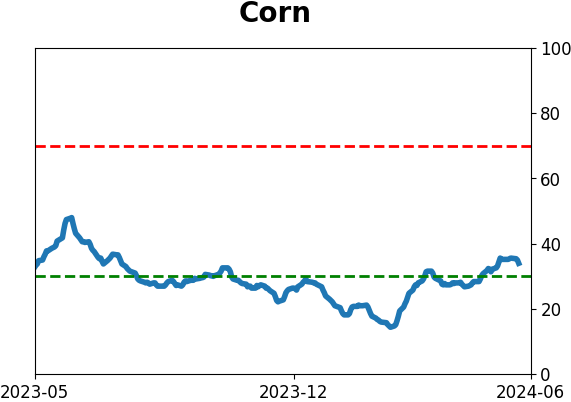
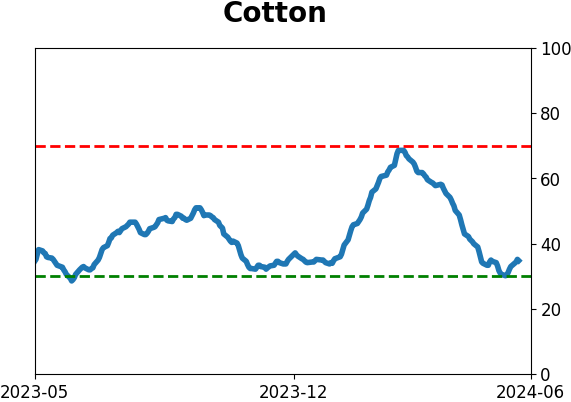
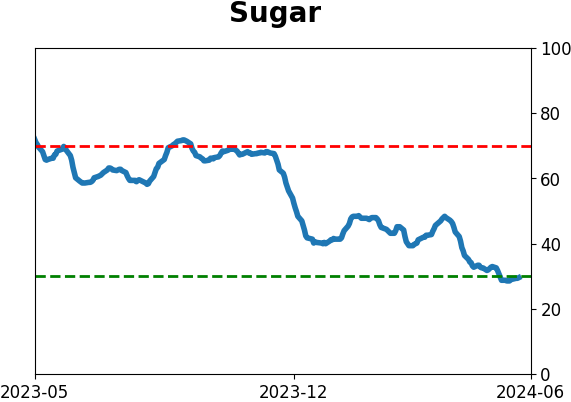
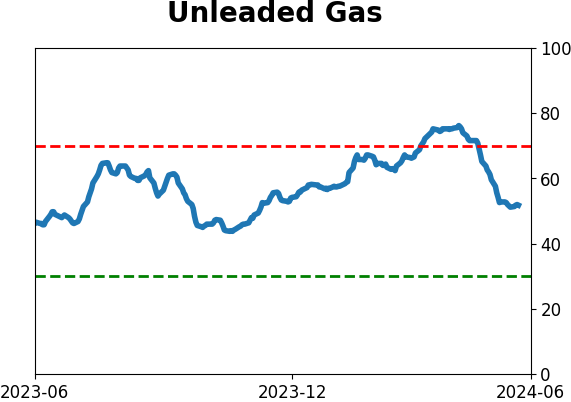
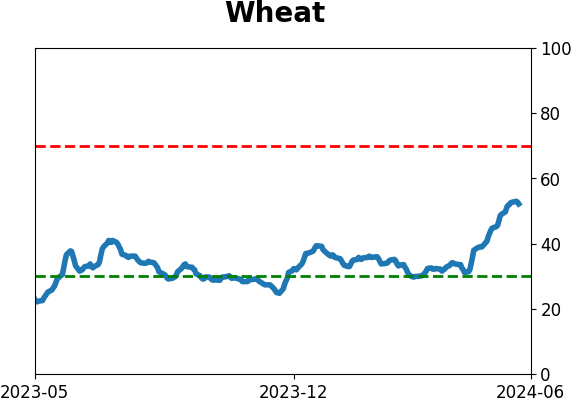
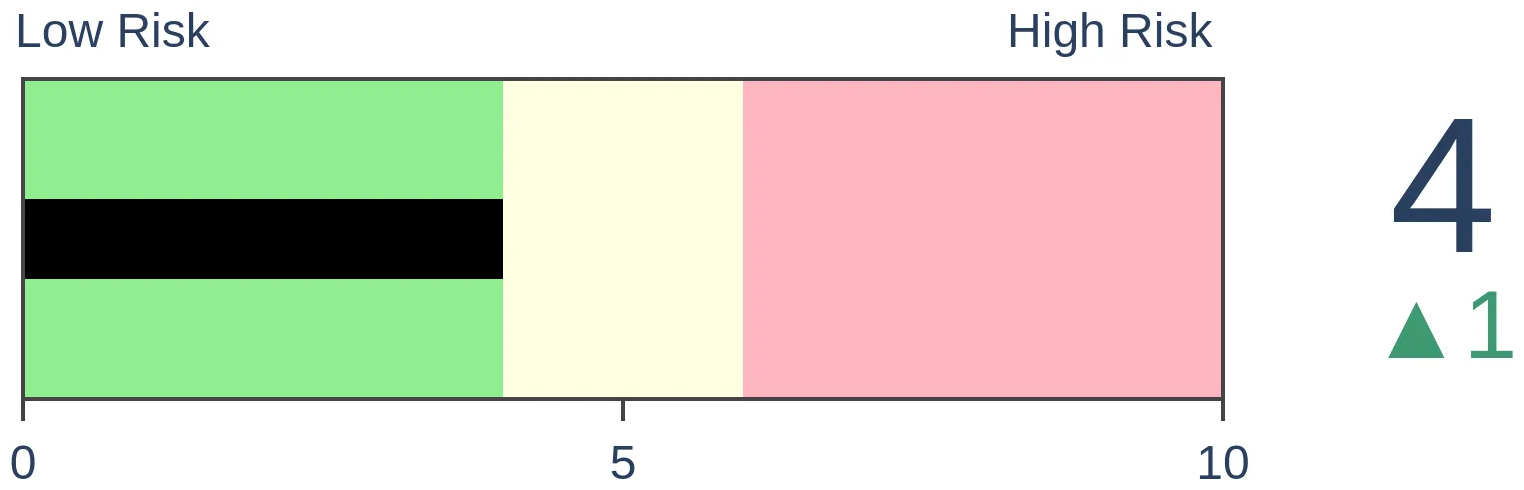
Agriculture
|
|
Research
By Dean Christians
BOTTOM LINE
Two components in the Risk-Off Composite Model issued warnings, hinting at diminishing stock participation. Following comparable signals, the S&P 500 struggled over the ensuing two months.
FORECAST / TIMEFRAME
None
|
Key points:
- Two components in the Risk-Off Composite Model issued warnings, indicating deteriorating stock participation
- Similar precedents preceded negative returns for the S&P 500 over the subsequent two months
- The signal count for the Risk-Off Composite Model rose to 40%, one alert short of a broad composite warning
A model that monitors stock performance relative to a benchmark signals risk-off
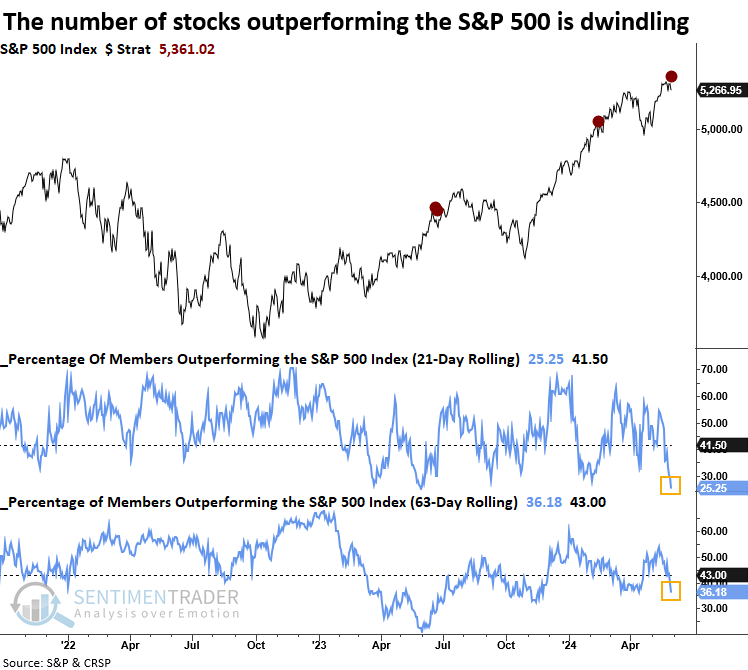
A new signal from a voting member in the Risk-Off Composite Model issued an alert on Wednesday. This component uses the percentage of S&P 500 stocks outperforming the index over rolling 21-and 63-day periods to identify market environments when fewer and fewer stocks match the S&P 500's performance. Similar to breadth-based indicators, a narrowing in performance relative to a benchmark can serve as a warning sign in advance of price deterioration at the index level.
Recent signals, including the one in February, did not lead to a broad market correction. For this reason, I prefer using a composite model instead of standalone indicators.
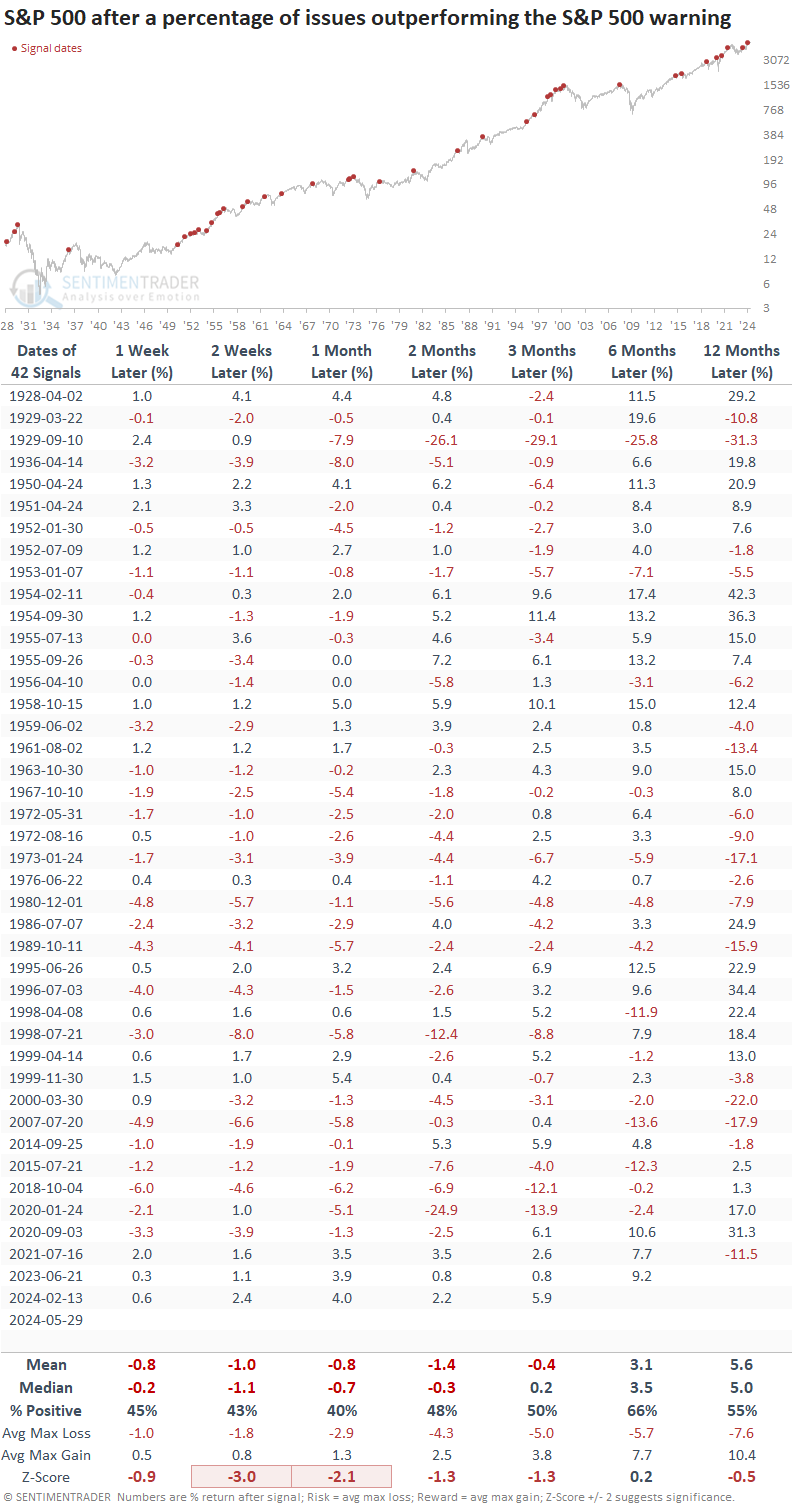
Diminished stock outperformance relative to a benchmark preceded negative returns
Following a signficant contraction in the number of stocks outperforming the S&P 500 index, the world's most benchmarked index tended to struggle over the subsequent two months. Throughout this timeframe, the median maximum loss was consistently higher than the maximum gain. Additionally, returns for the two and four-week periods were significantly worse than random returns over the study period.
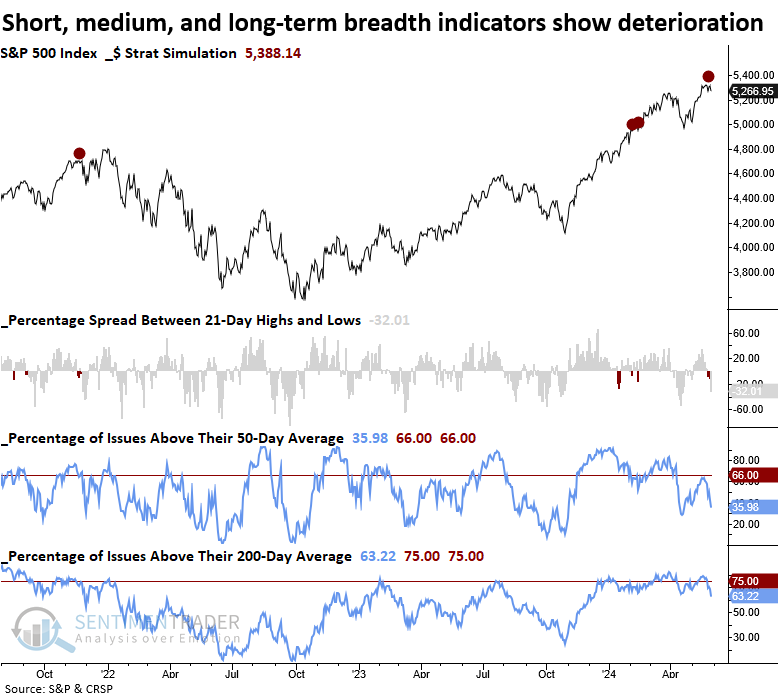
A model incorporating a wide range of breadth indicators signals risk-off
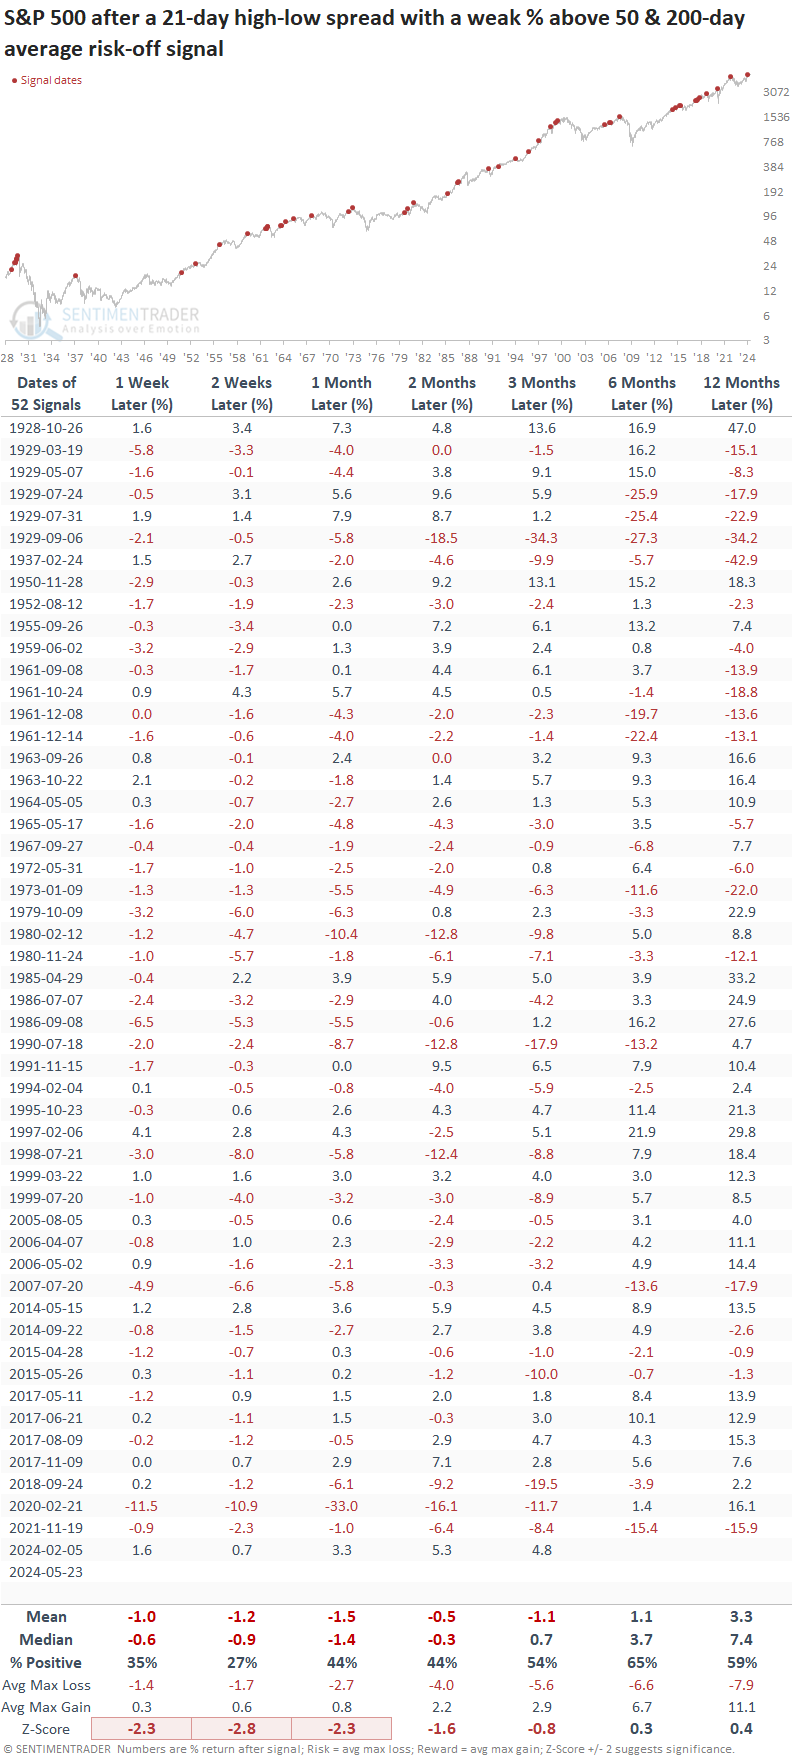
Last week, a new signal from a voting member in the Risk-Off Composite Model issued an alert. The component is called the New High Low Spread with a Weak % Above the 50 & 200-day Average model, and it uses breadth-based indicators to identify a narrowing in stock market participation.
The model requires the following criteria to issue an alert:
- S&P 500 <= 2 days from a 252-day high
- The spread between S&P 500 21-day highs and lows are < -0.5%
- The percentage of S&P 500 members above their 50-day average < 66%
- The percentage of S&P 500 members above their 200-day average < 75%
Similar to the percentage of S&P 500 members outperforming the S&P 500, this one also triggered an alert in February, which turned out to be a whipsaw signal. Once again, this highlights the importance of a weight-of-the-evidence approach.
Similar breadth-based signals preceded negative returns
In precedents where the breadth-based model triggered an alert when it identified a deterioration in S&P 500 participation across several indicators and durations, the world's most benchmarked index struggled over the subsequent two months, displaying a loss in all four horizons.
Returns were significantly worse than random returns over the study period in three out of four intervals, especially in the two-week window.
A single arrow is easily broken, but not ten in a bundle - Japanese proverb
The Risk-Off Composite Model signal count increased to 40% with two new component alerts. Consequently, should one more member issue a warning, the model would activate a risk-off signal.
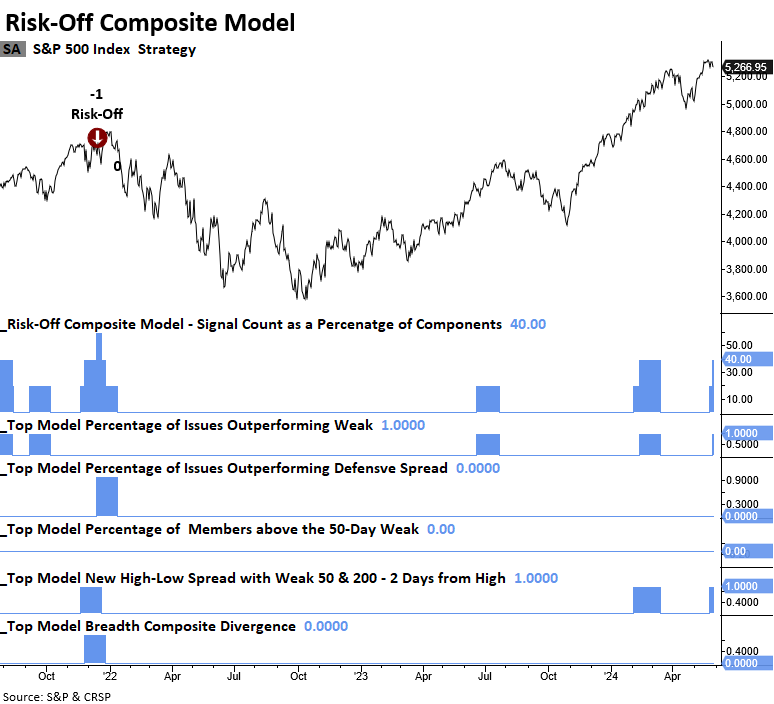
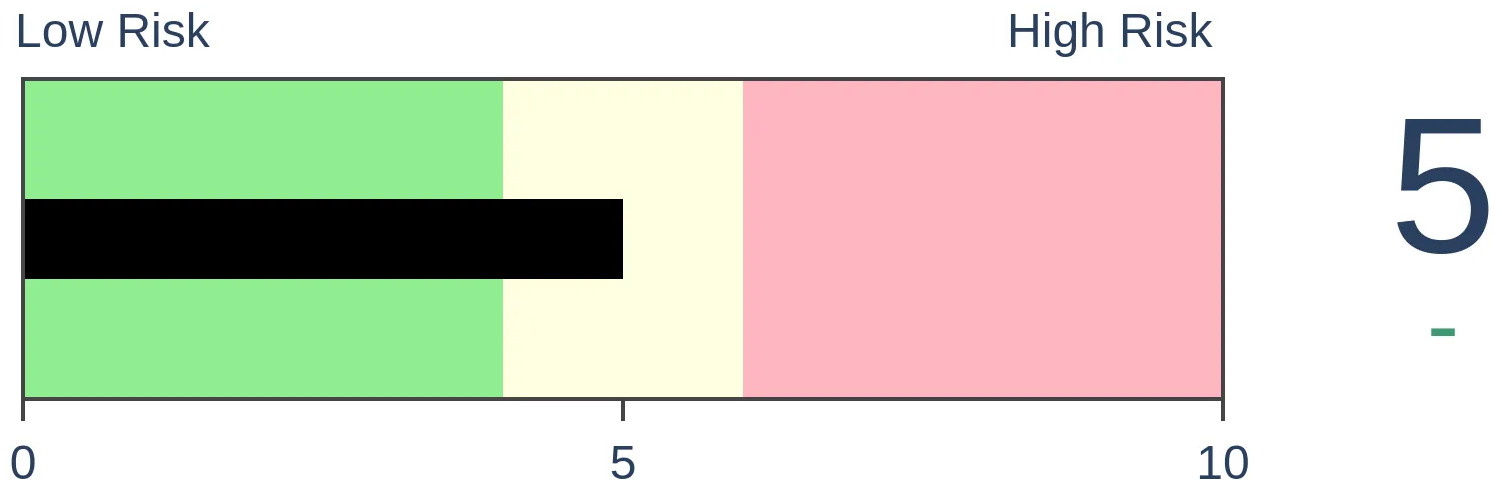
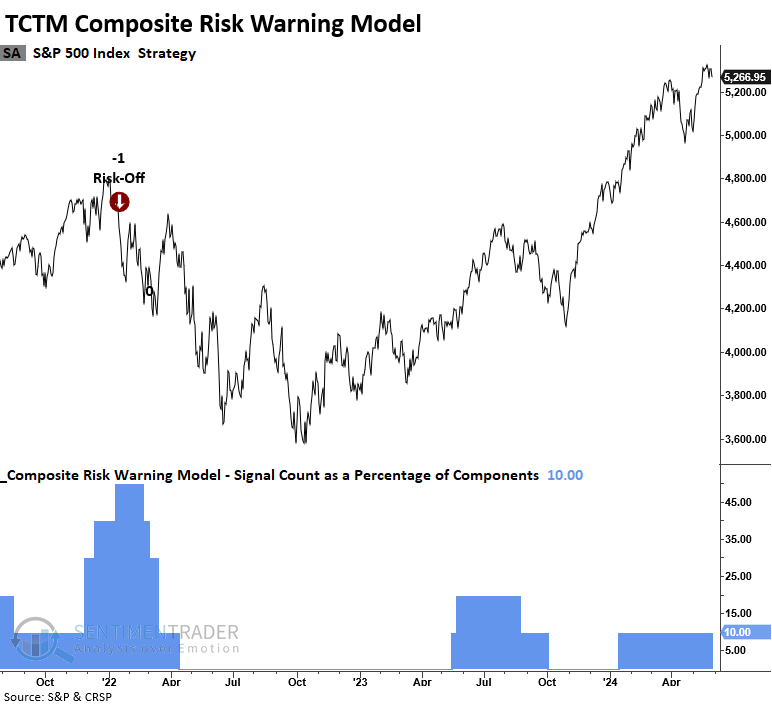
The TCTM Composite Risk Warning Model, designed with big-picture long-term indicators, currently reports a risk level of 10%, comfortably below the trigger point of 50%.
What the research tells us...
Subtle clues questioning the internal strength of the stock market's advance continue to pop up, suggesting a backdrop characterized by a diminishing number of stocks participating in the uptrend. In some cases, these periods signify sector rotation, while in other instances, they hint at a more profound systemic issue. Without additional evidence from big-picture indicators like an expansion in 52-week lows, this most recent episode of dwindling participation most likely fits into the sector rotation category, similar to the signals experienced back in February. The weight of the evidence has not overwhelmingly swung to the bearish side of the ledger. Investors should stay the course but remain vigilant regarding additional risks.
Indicators at Extremes
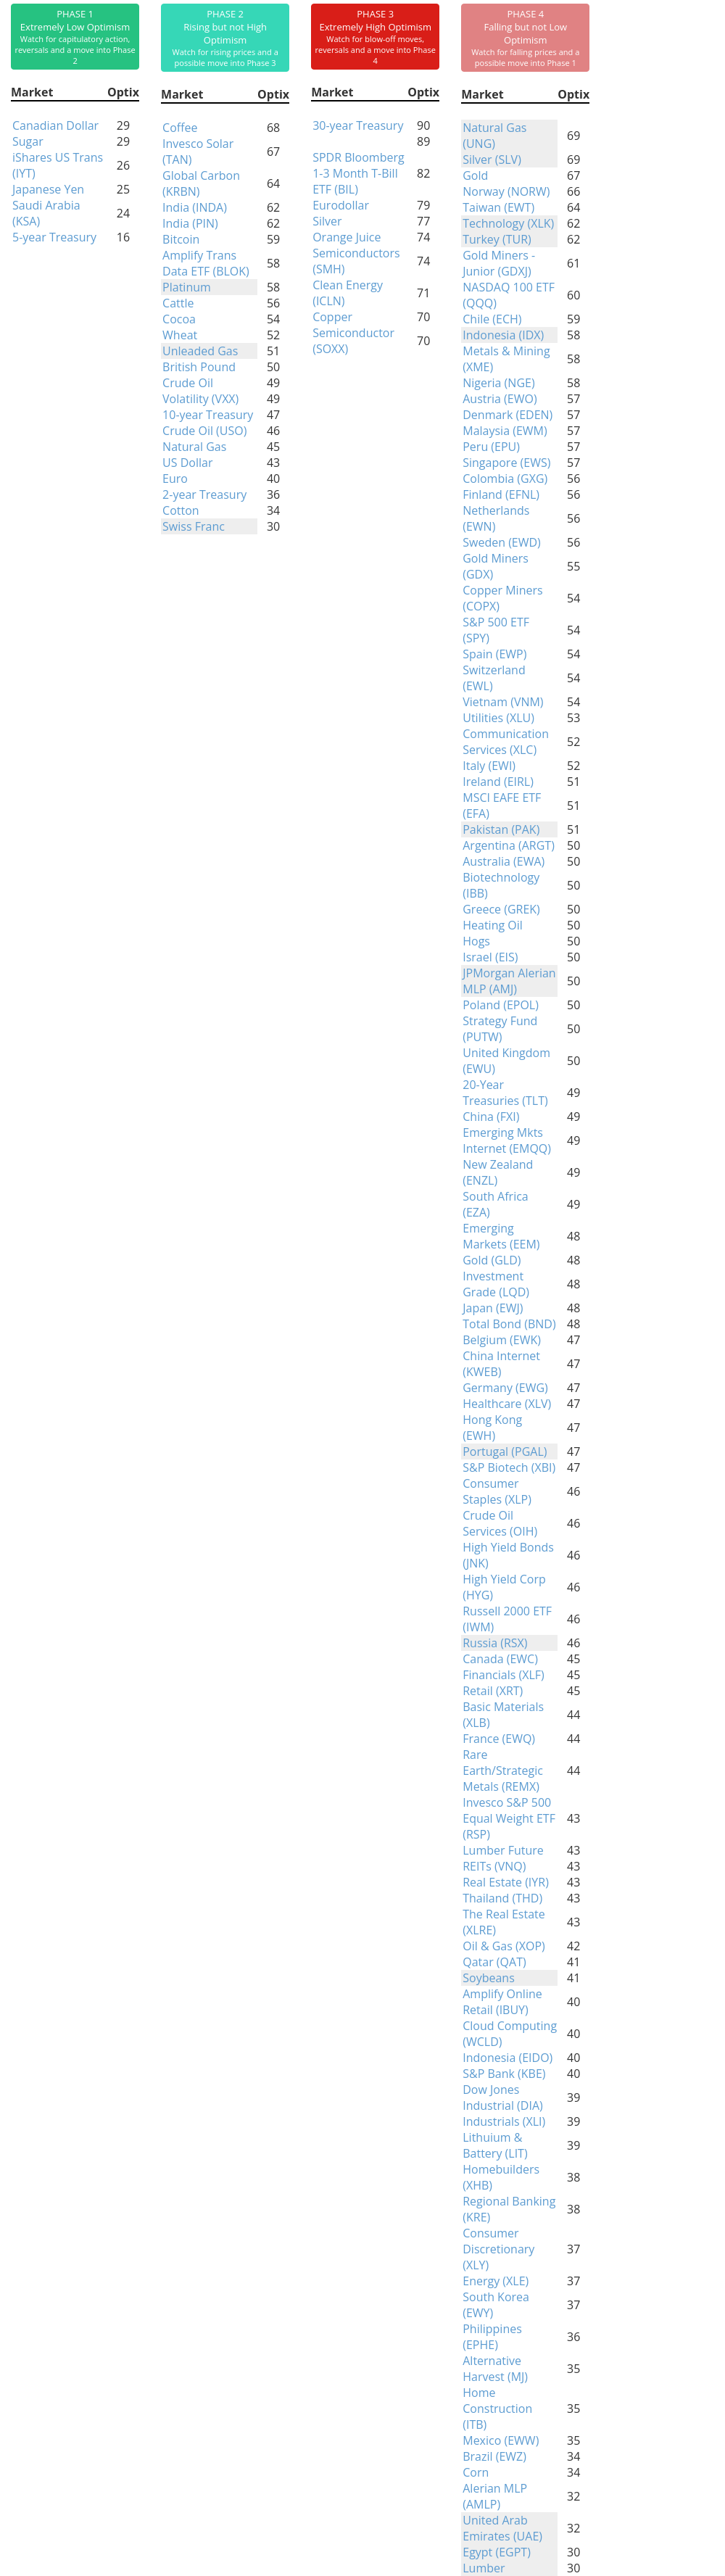
Phase Table
Ranks
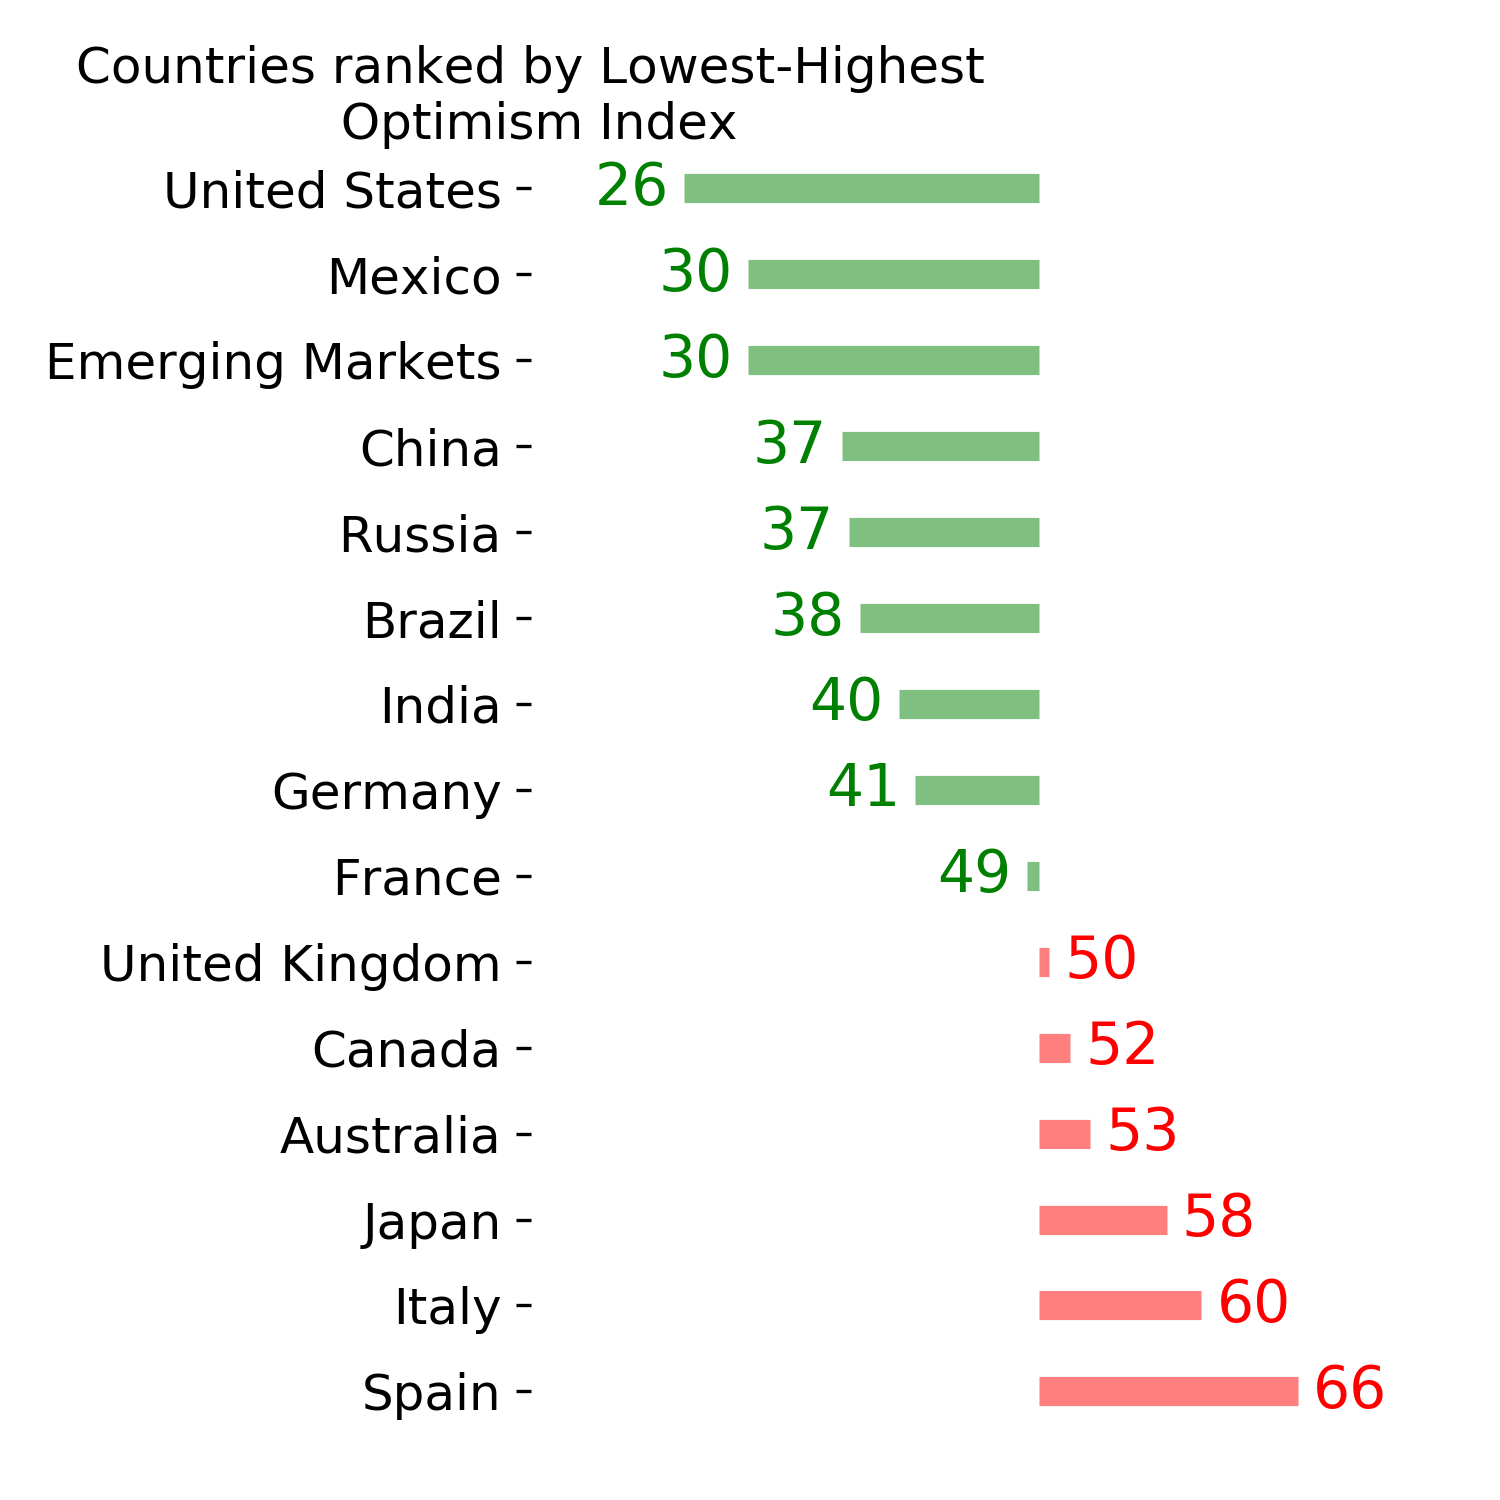
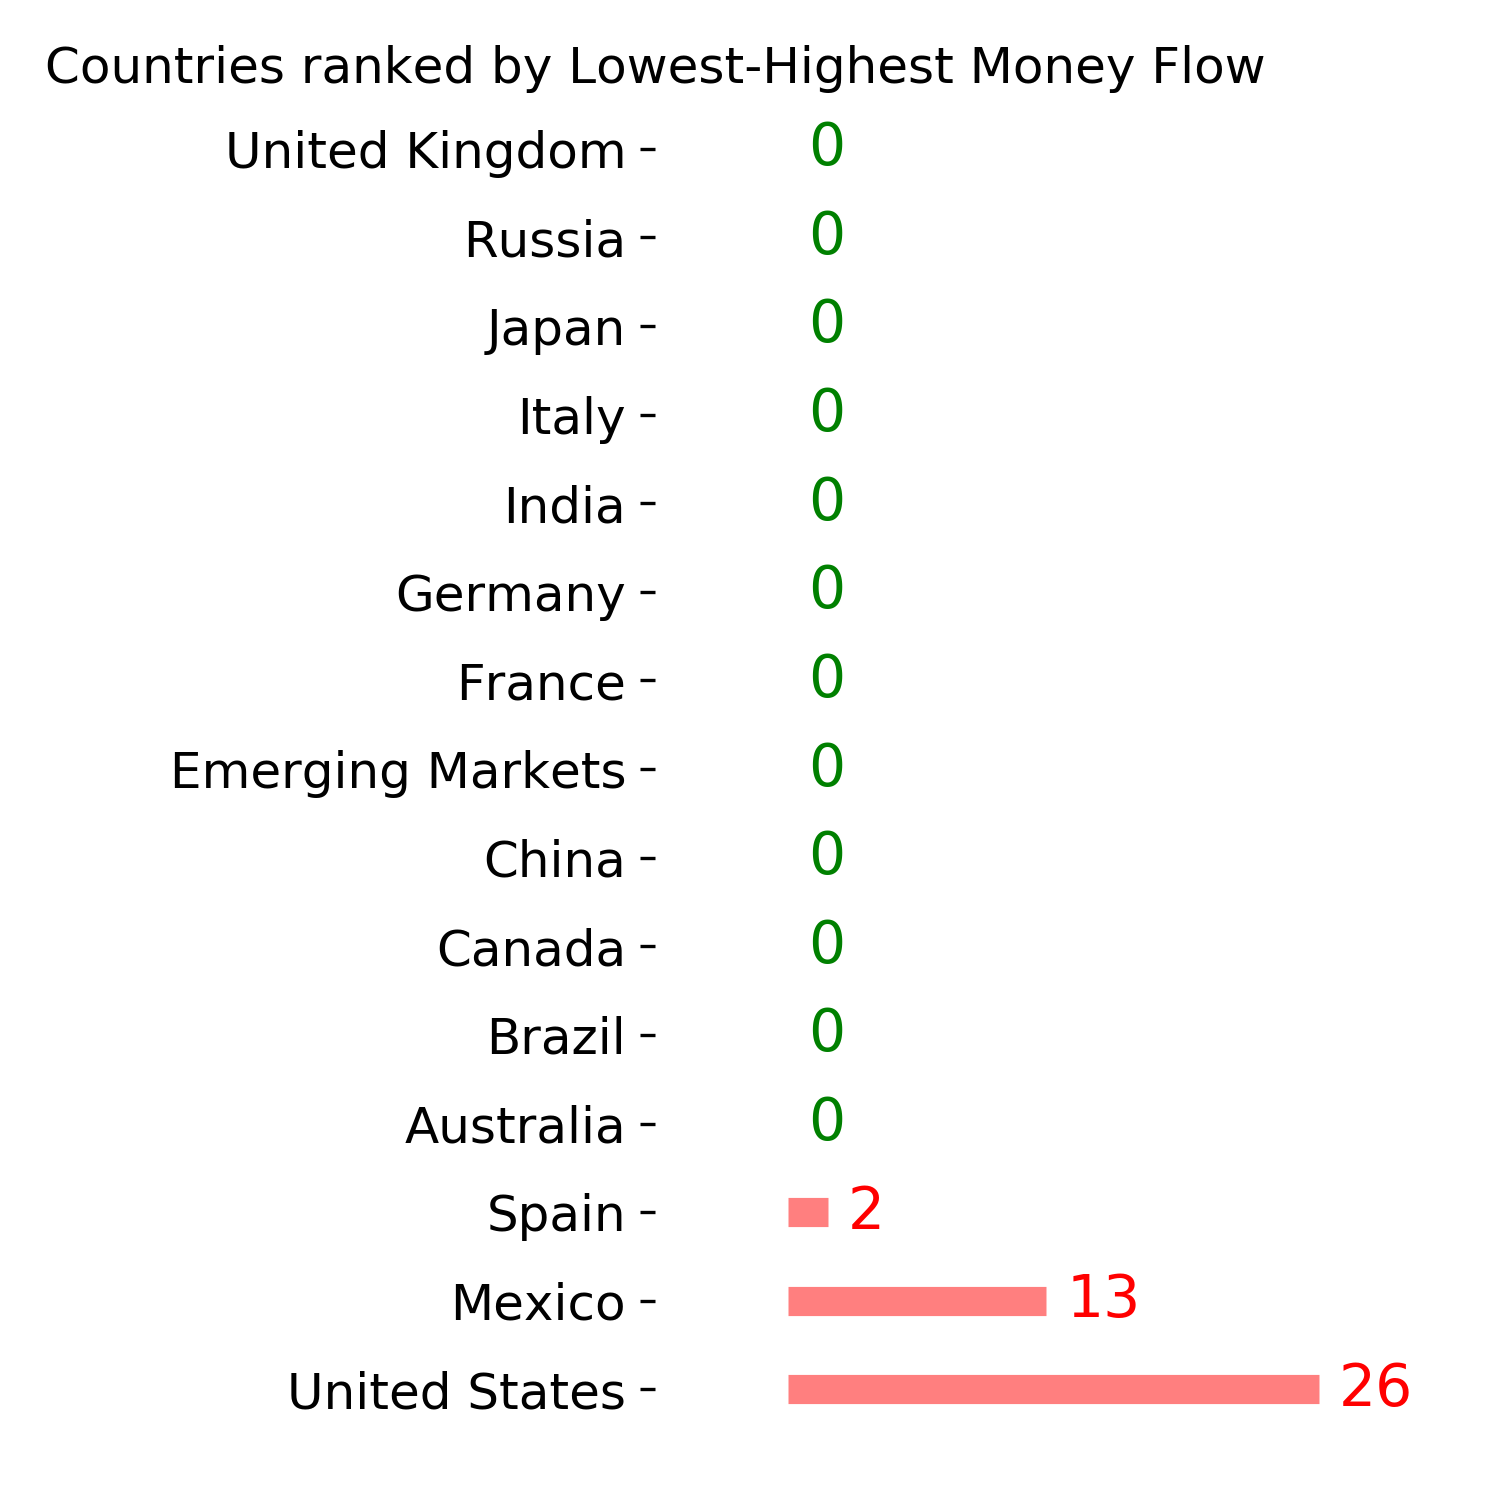
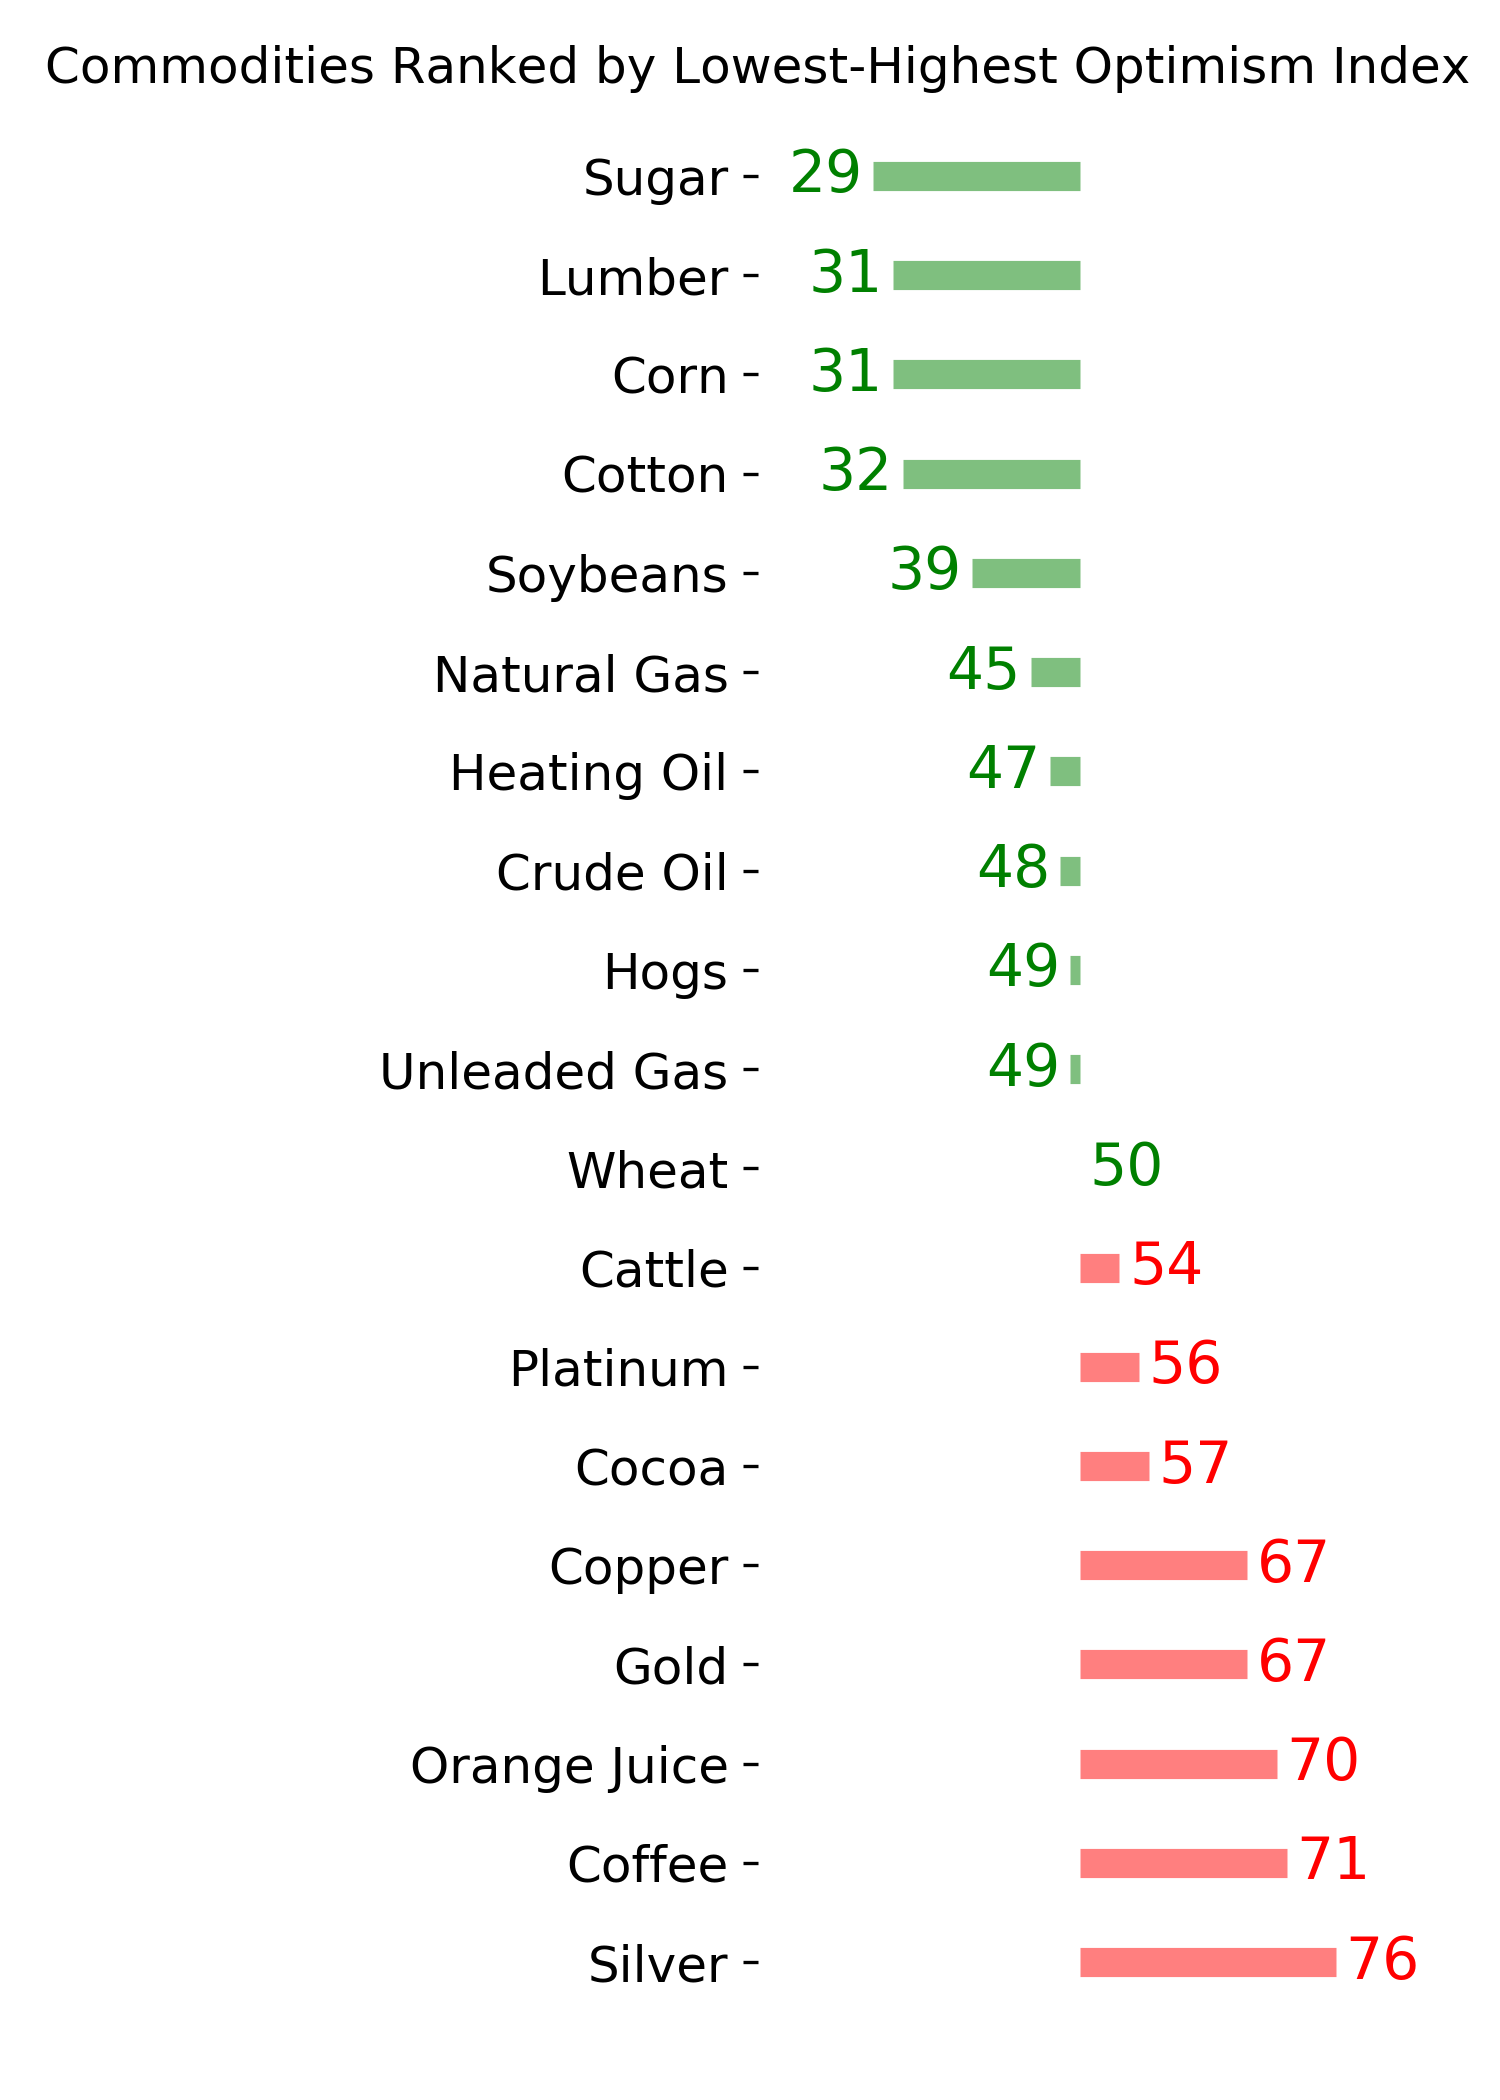
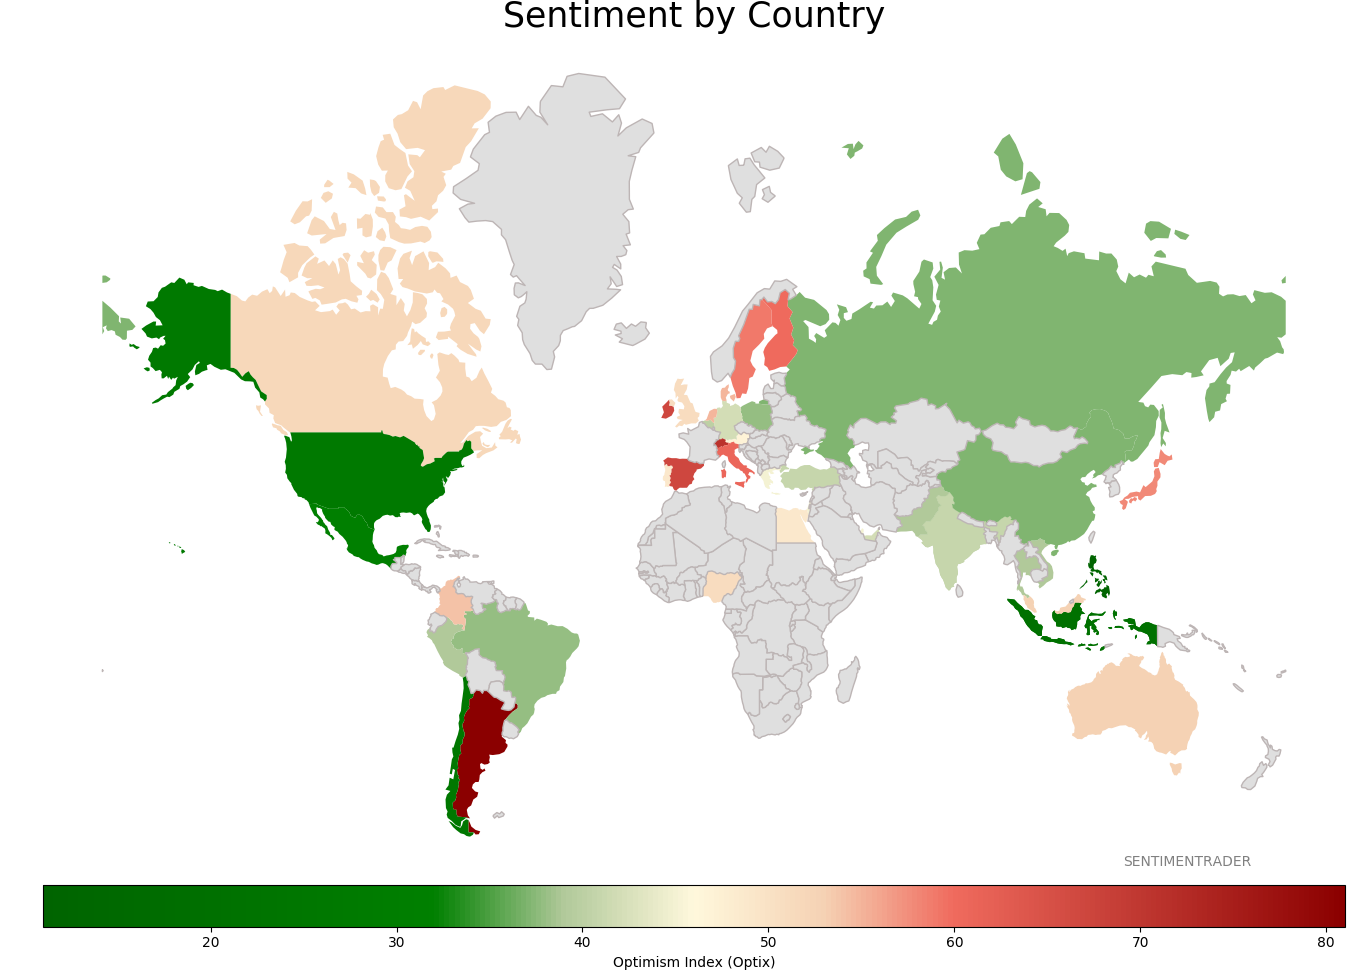
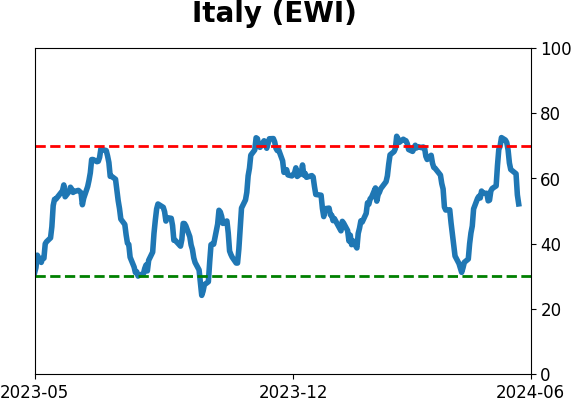
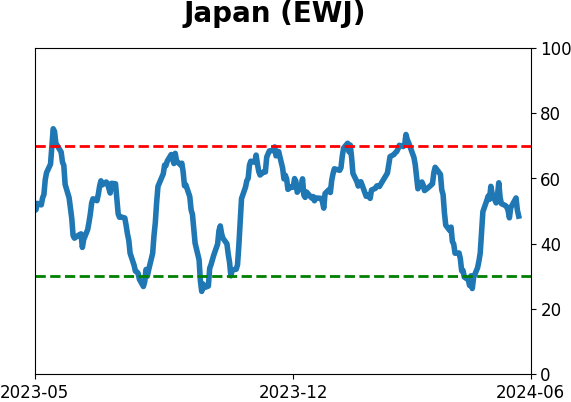
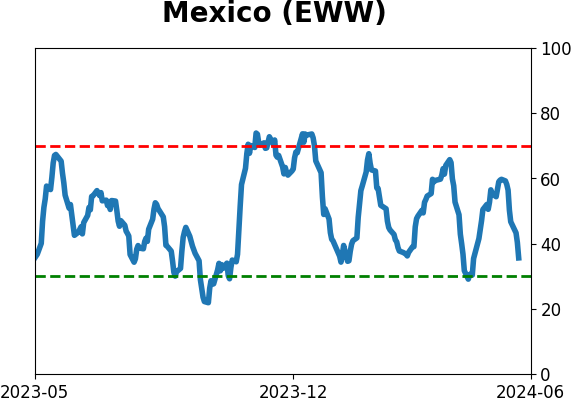
Sentiment Around The World
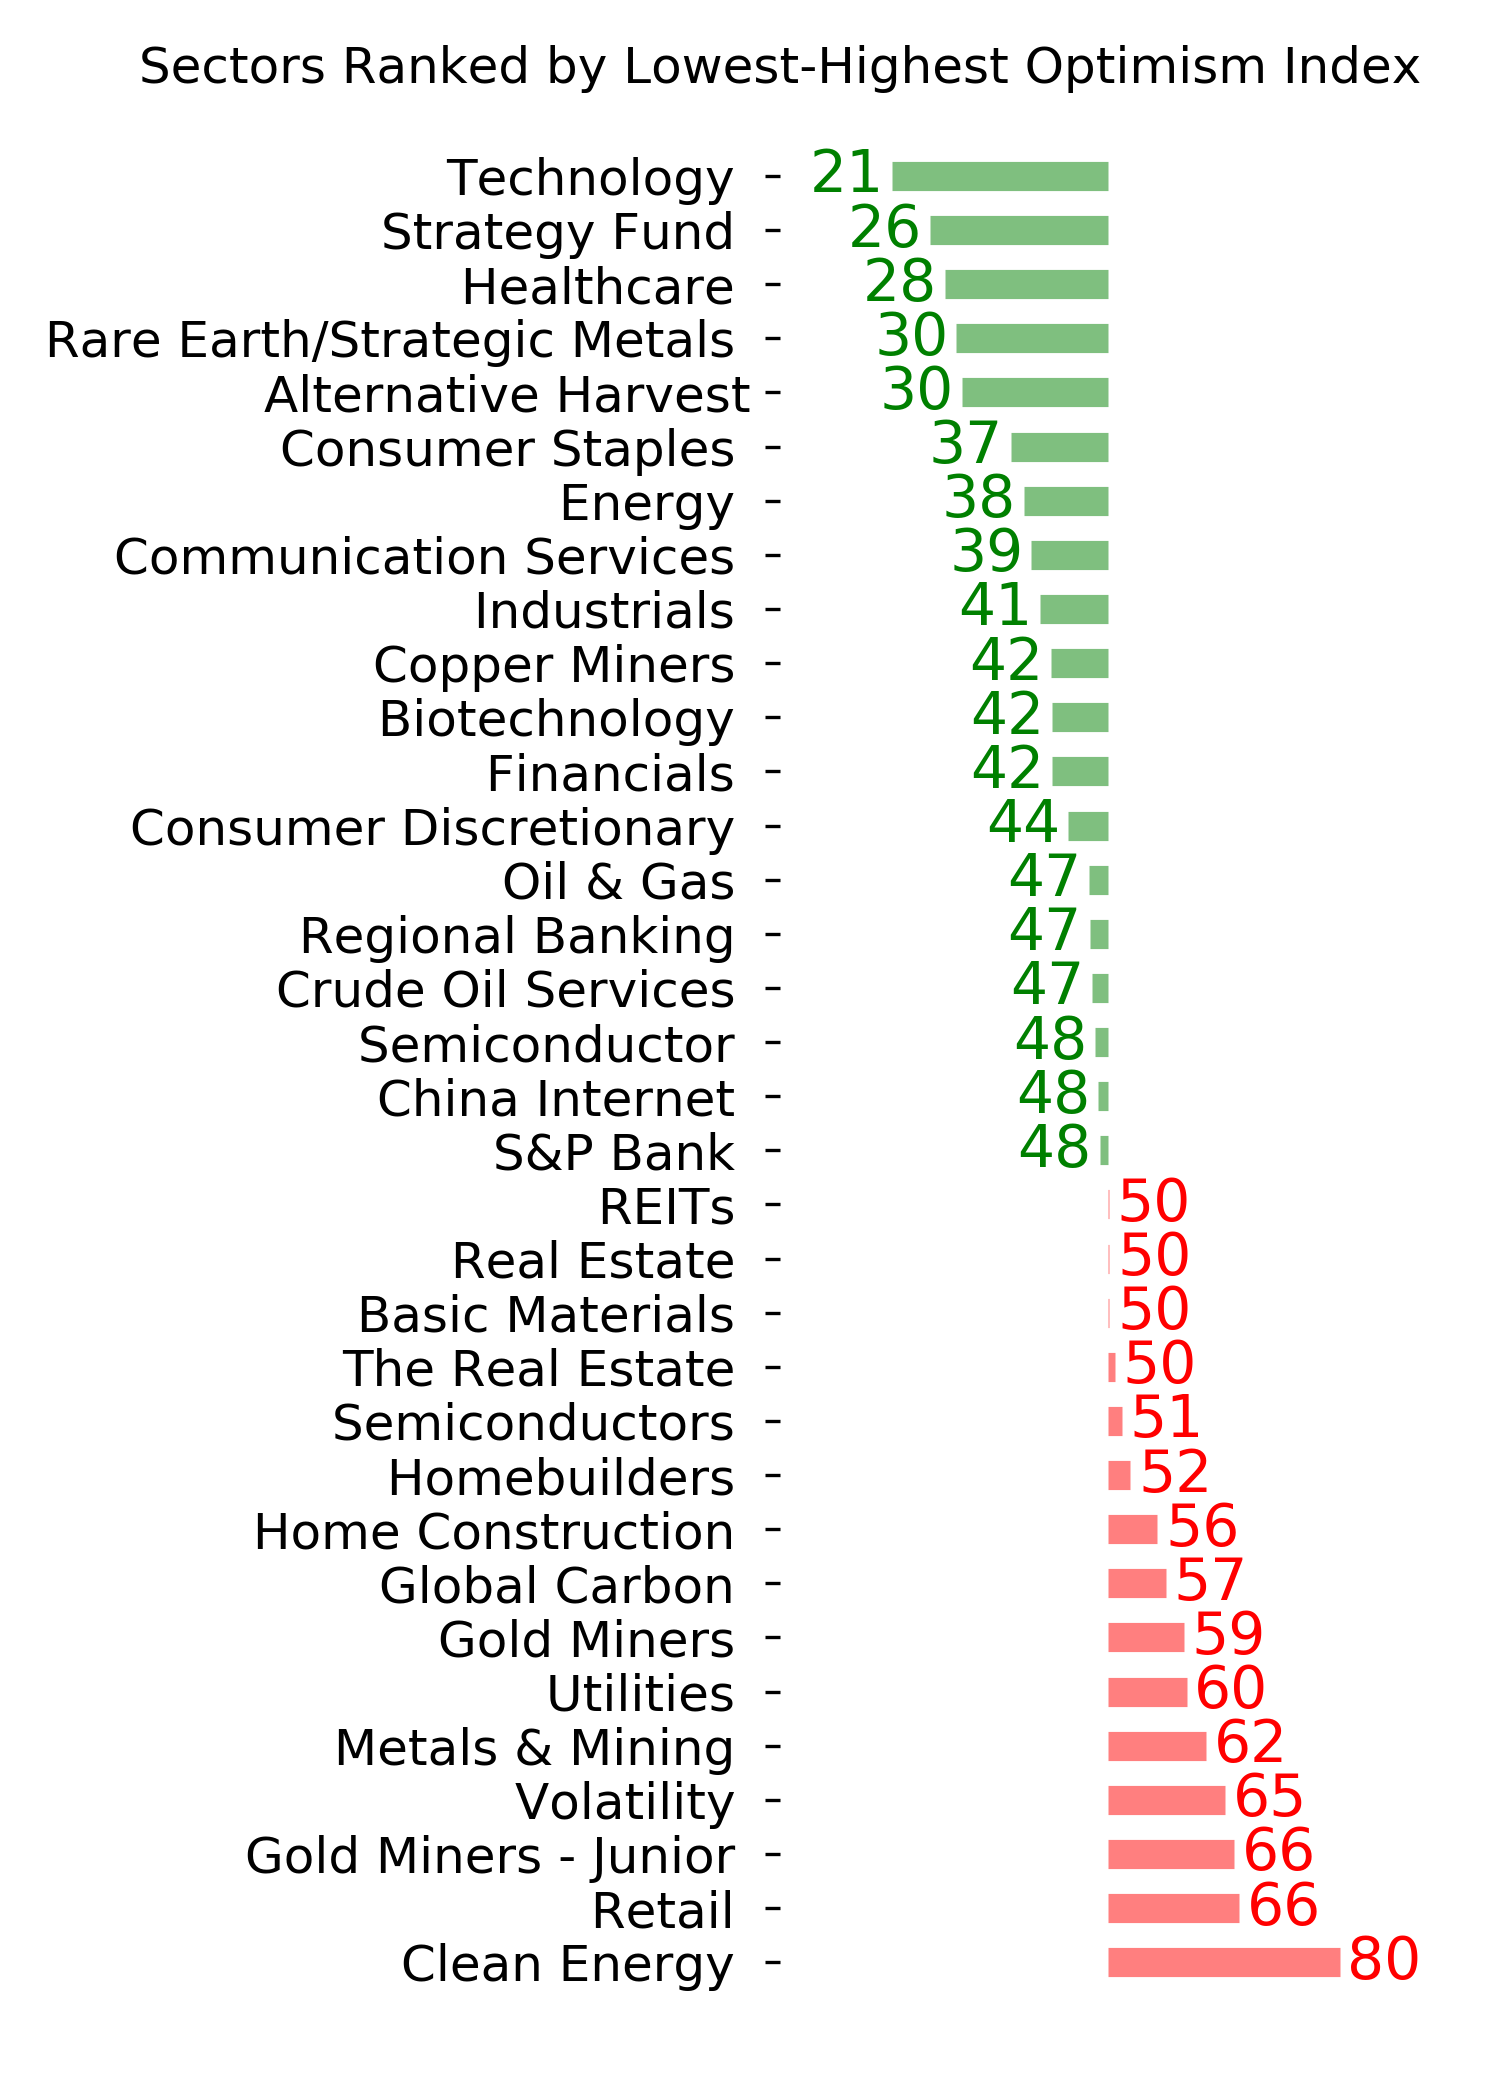
Optimism Index Thumbnails
|
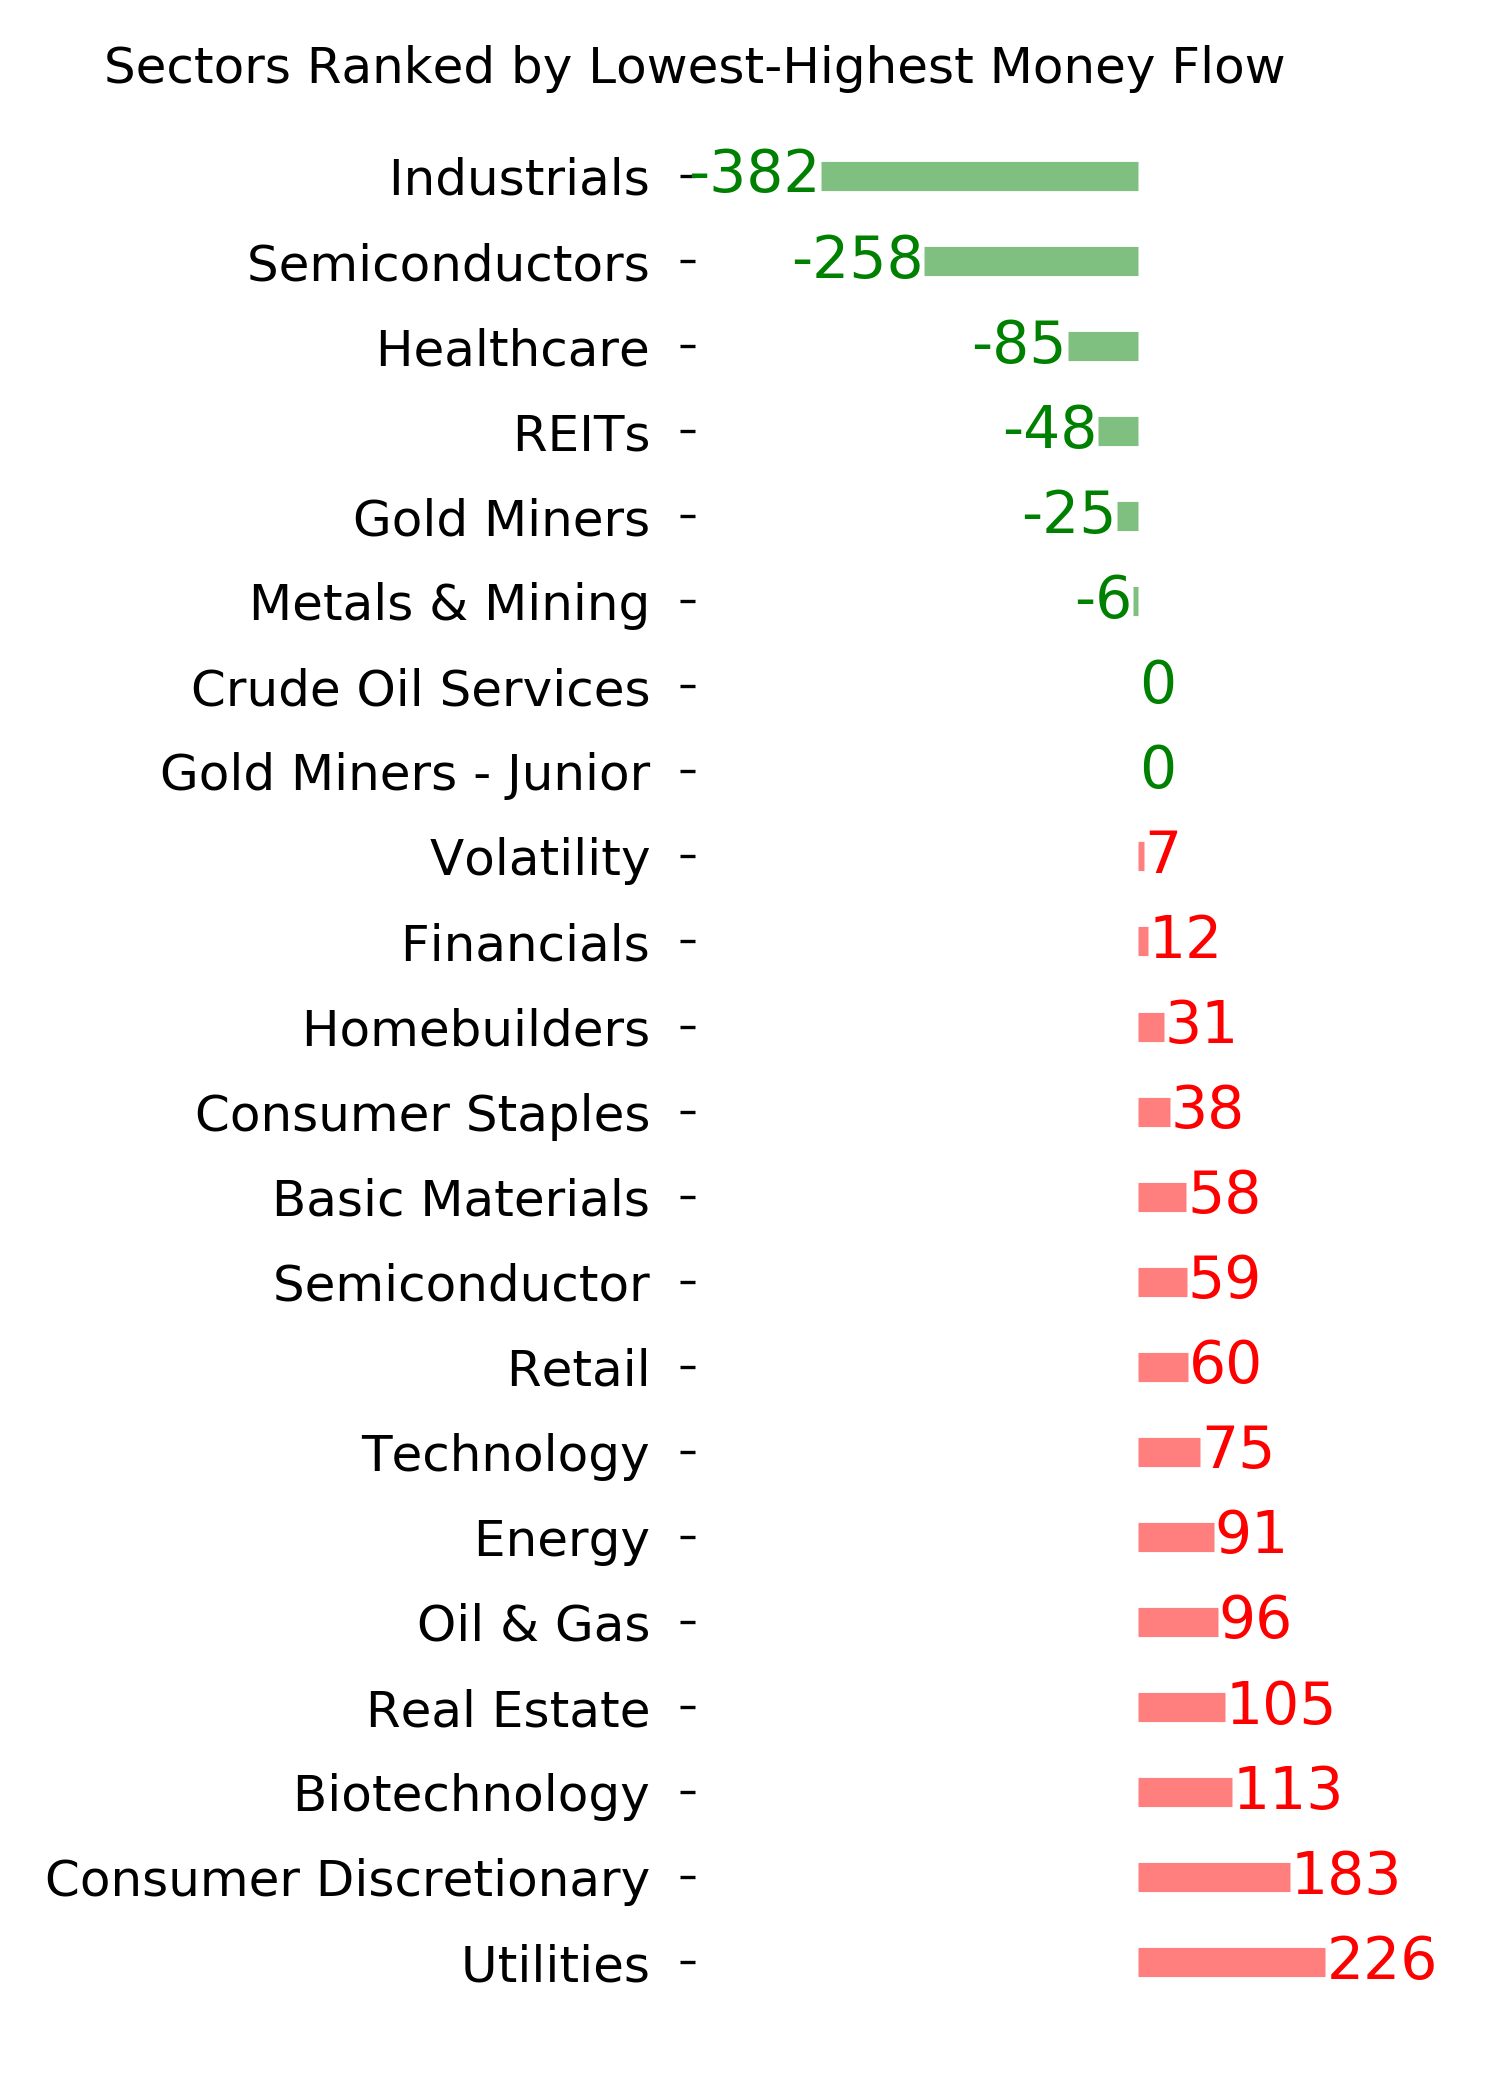
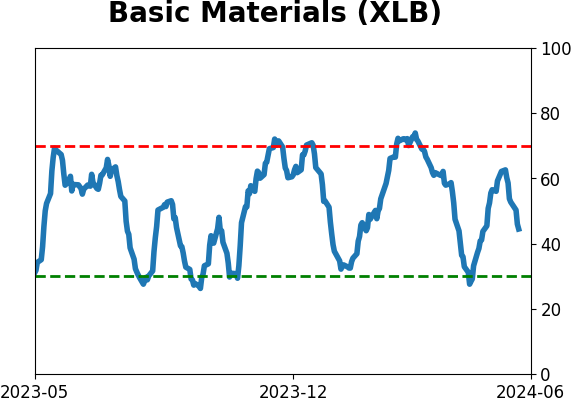
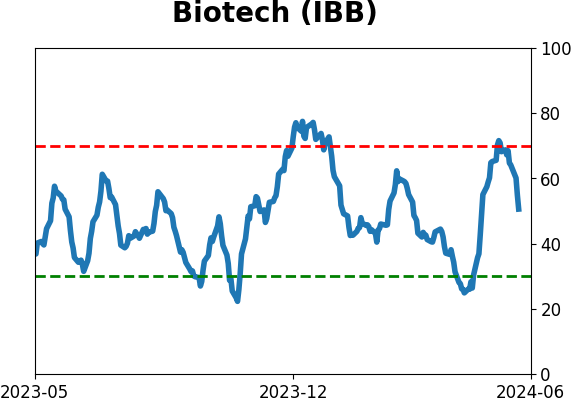
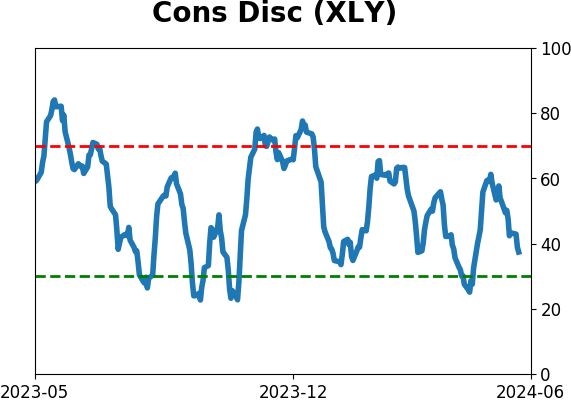
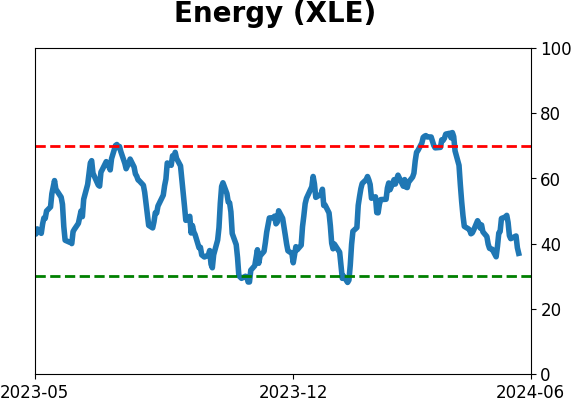
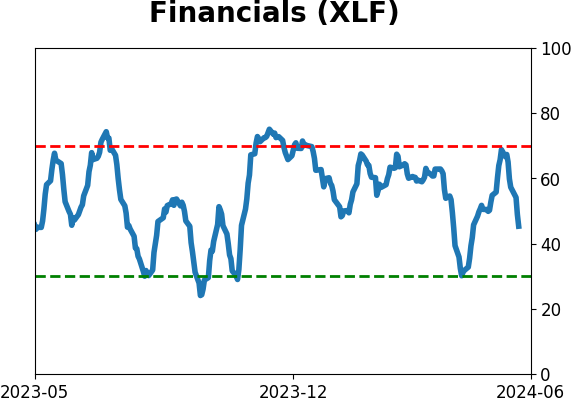
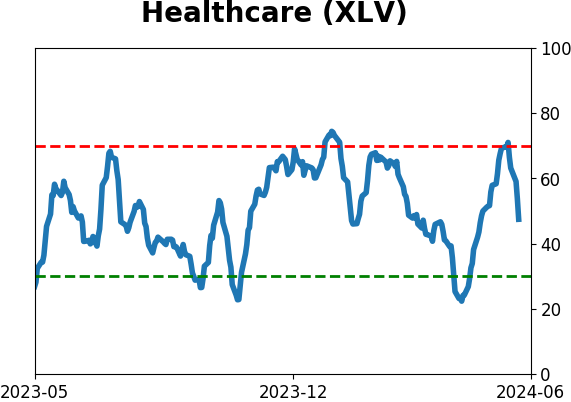
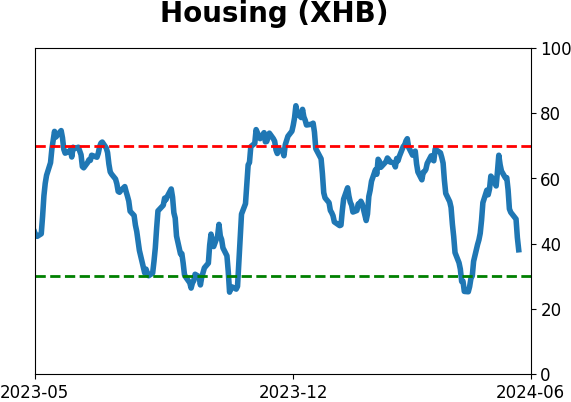
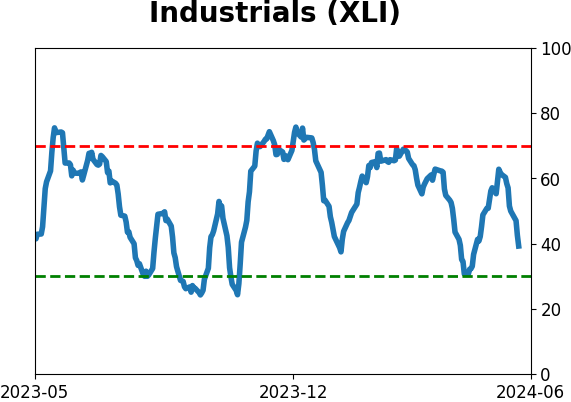
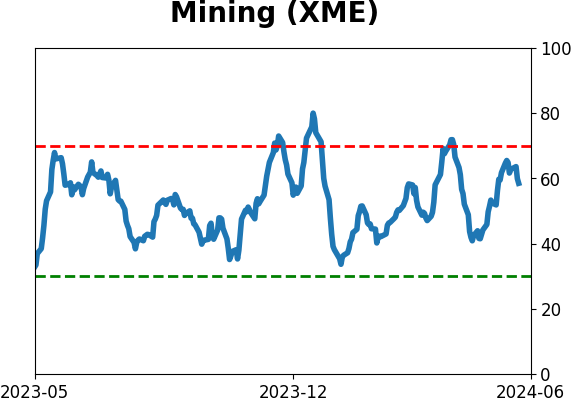
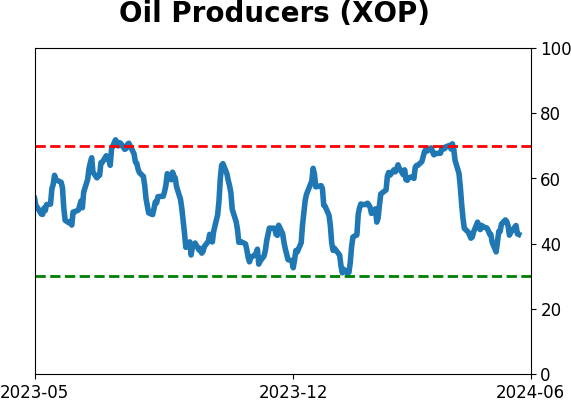
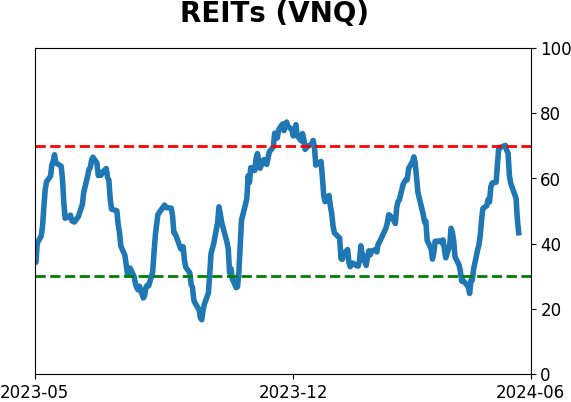
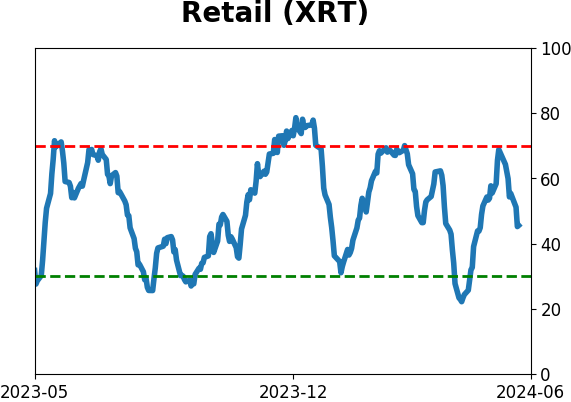
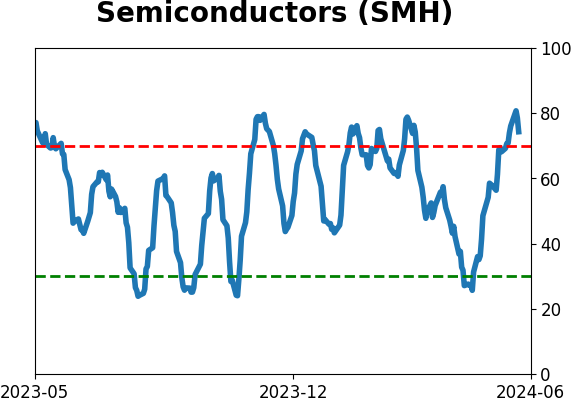
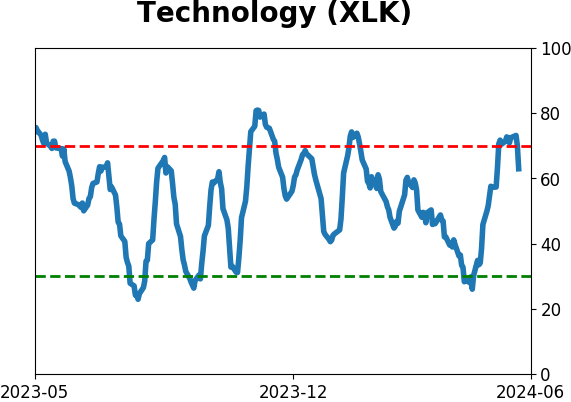
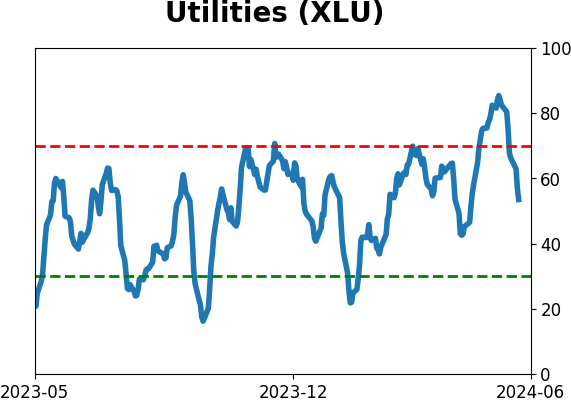
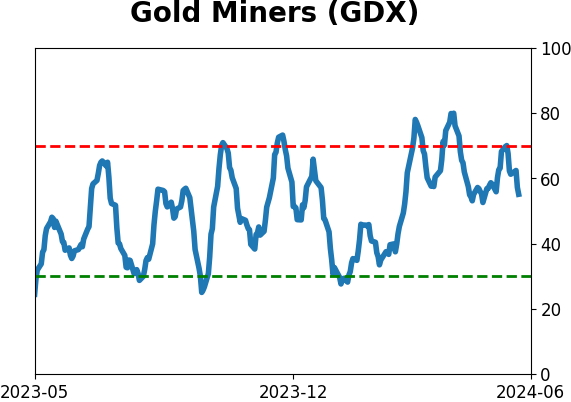
Sector ETF's - 10-Day Moving Average
|
|
|
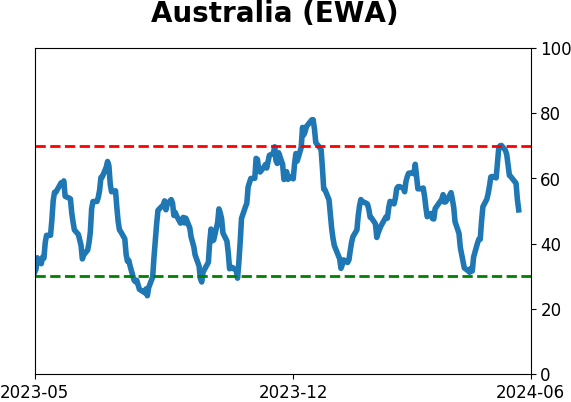
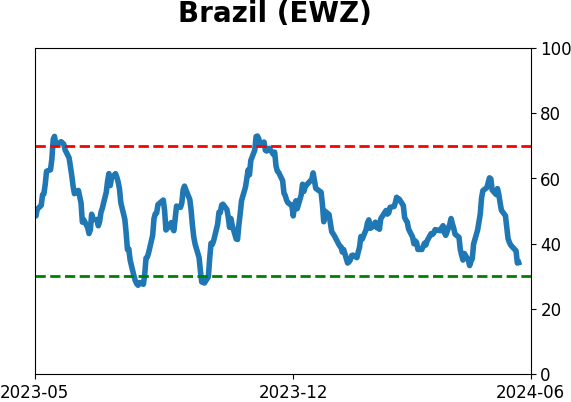
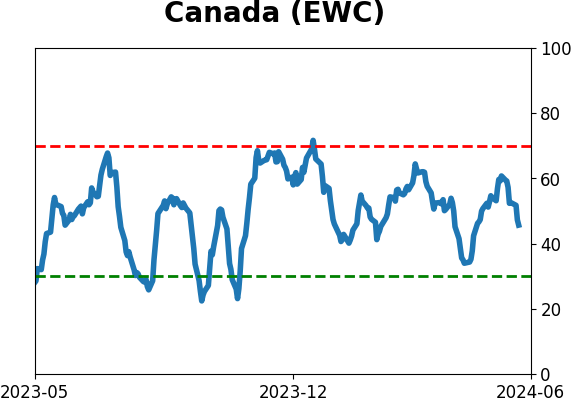
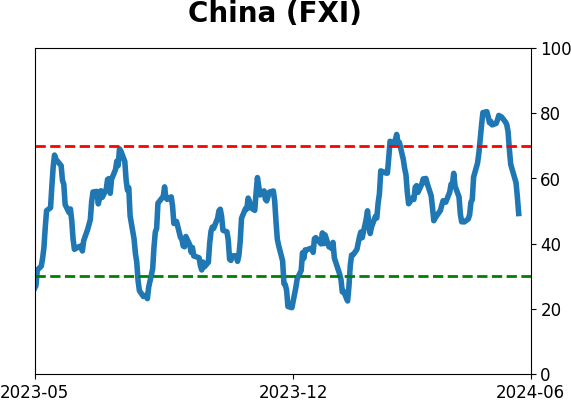
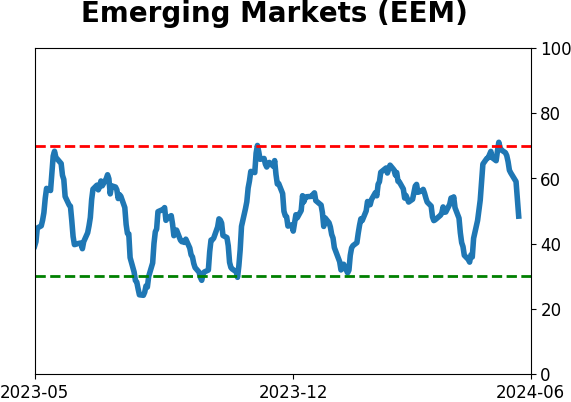
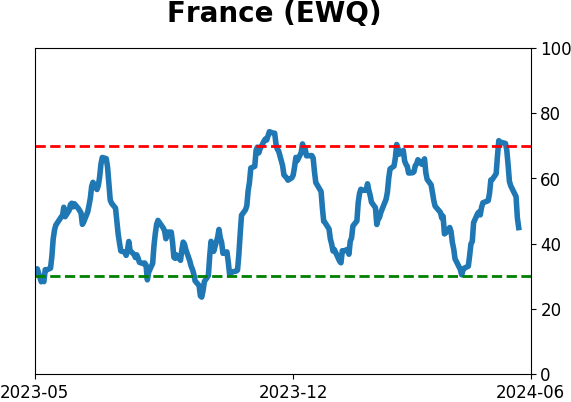
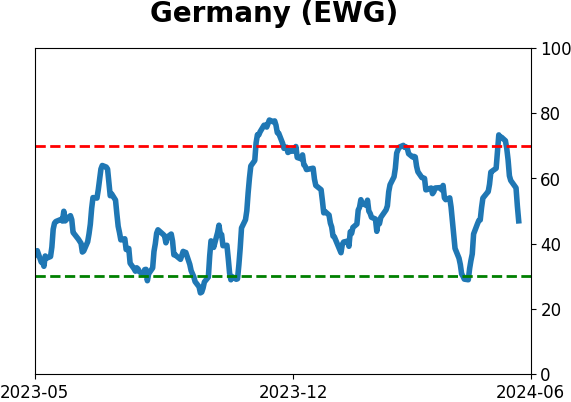
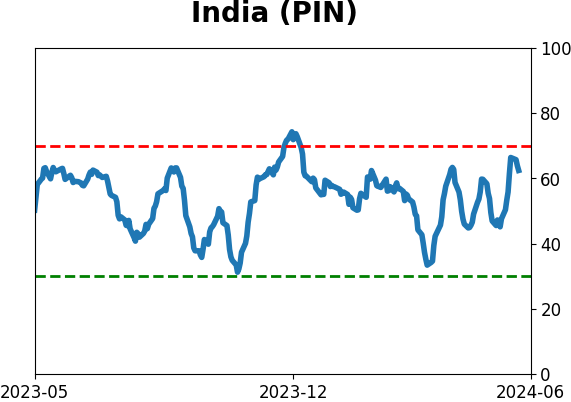
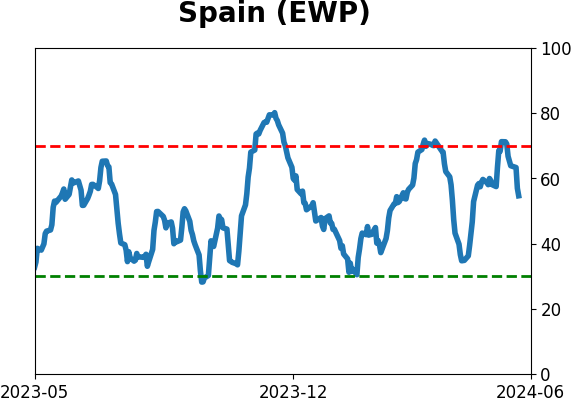
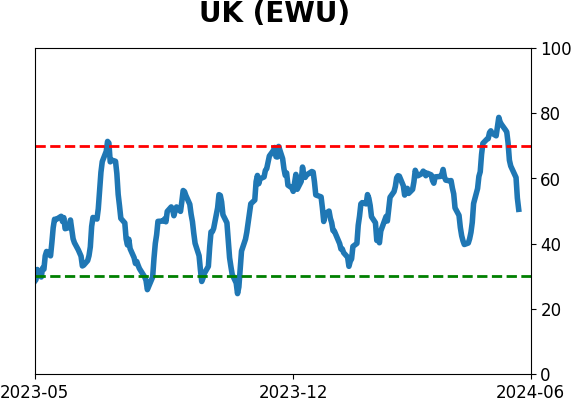
Country ETF's - 10-Day Moving Average
|
|
|
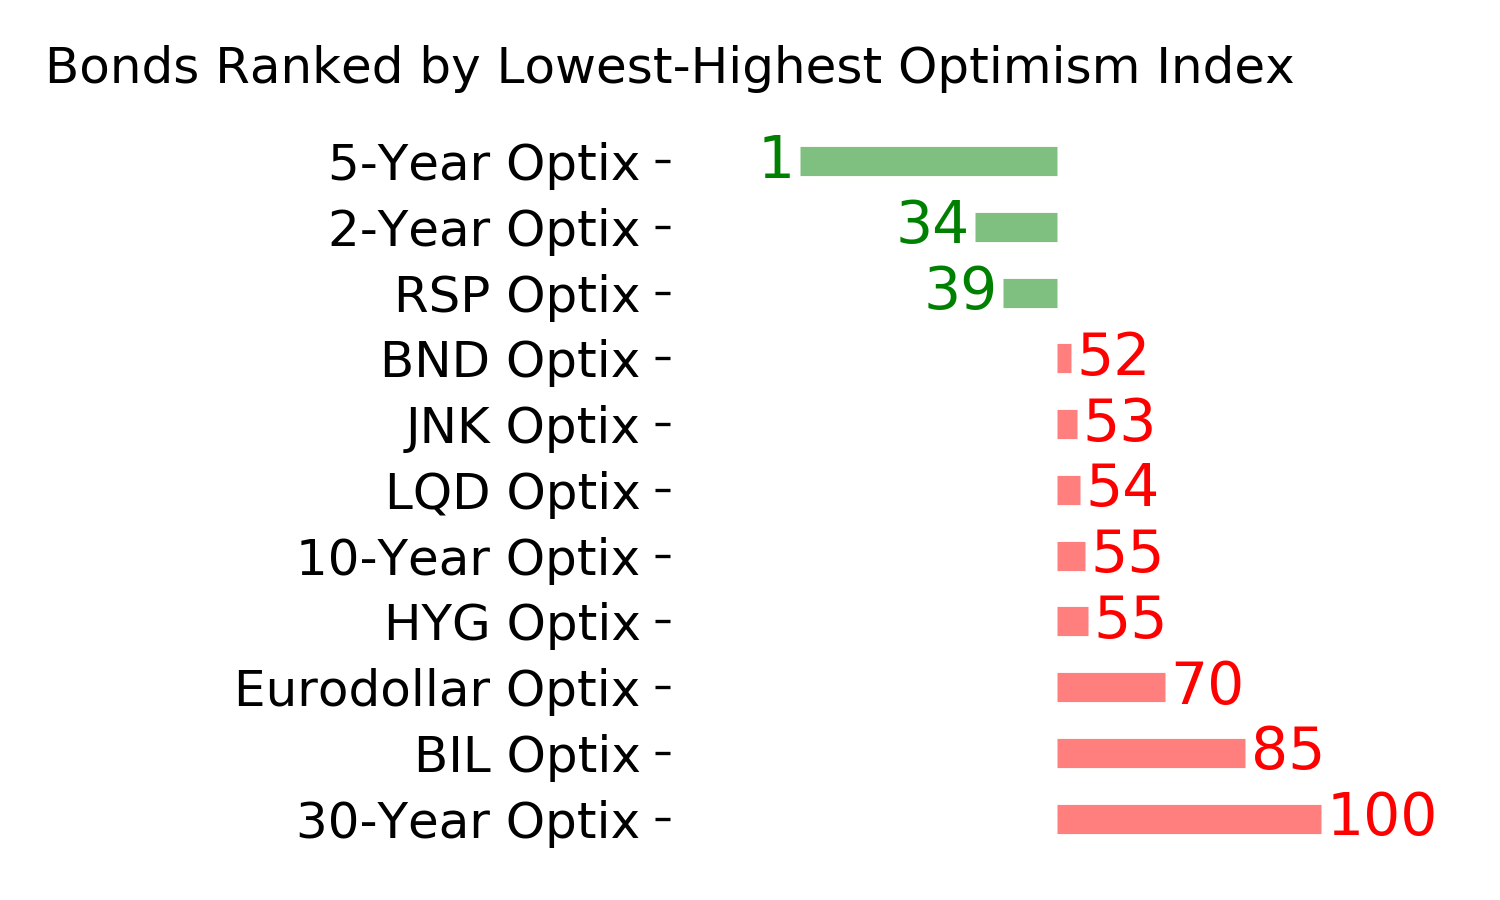
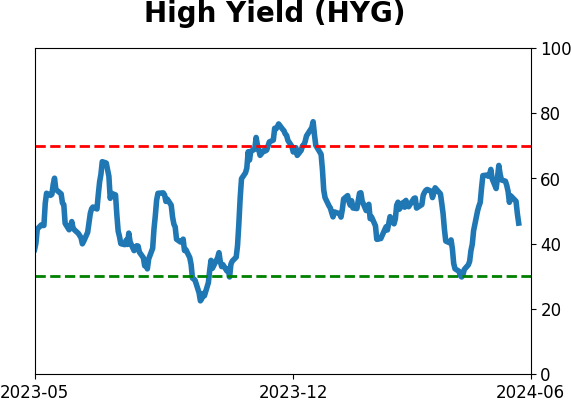
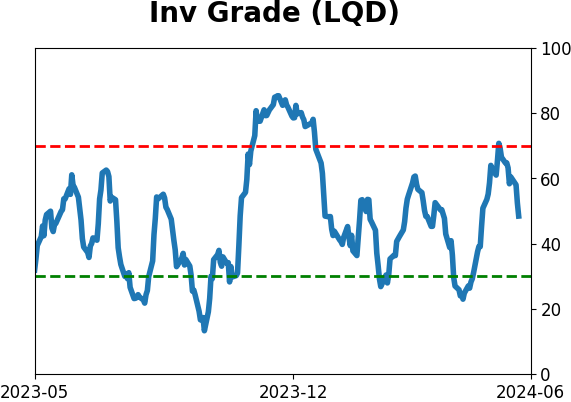
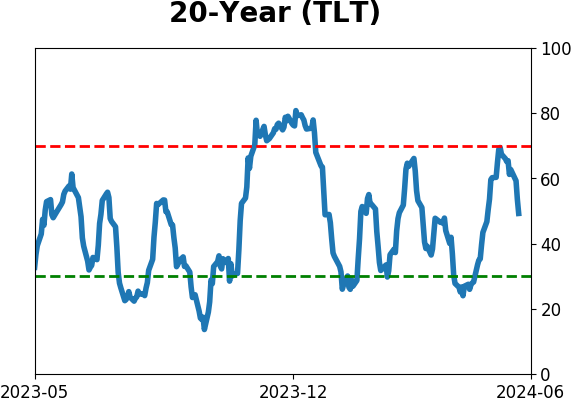
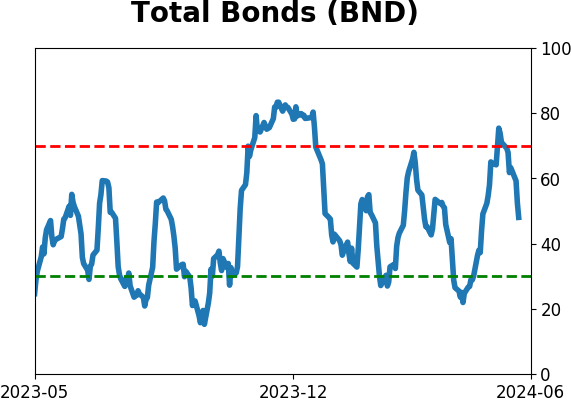
Bond ETF's - 10-Day Moving Average
|
|
|
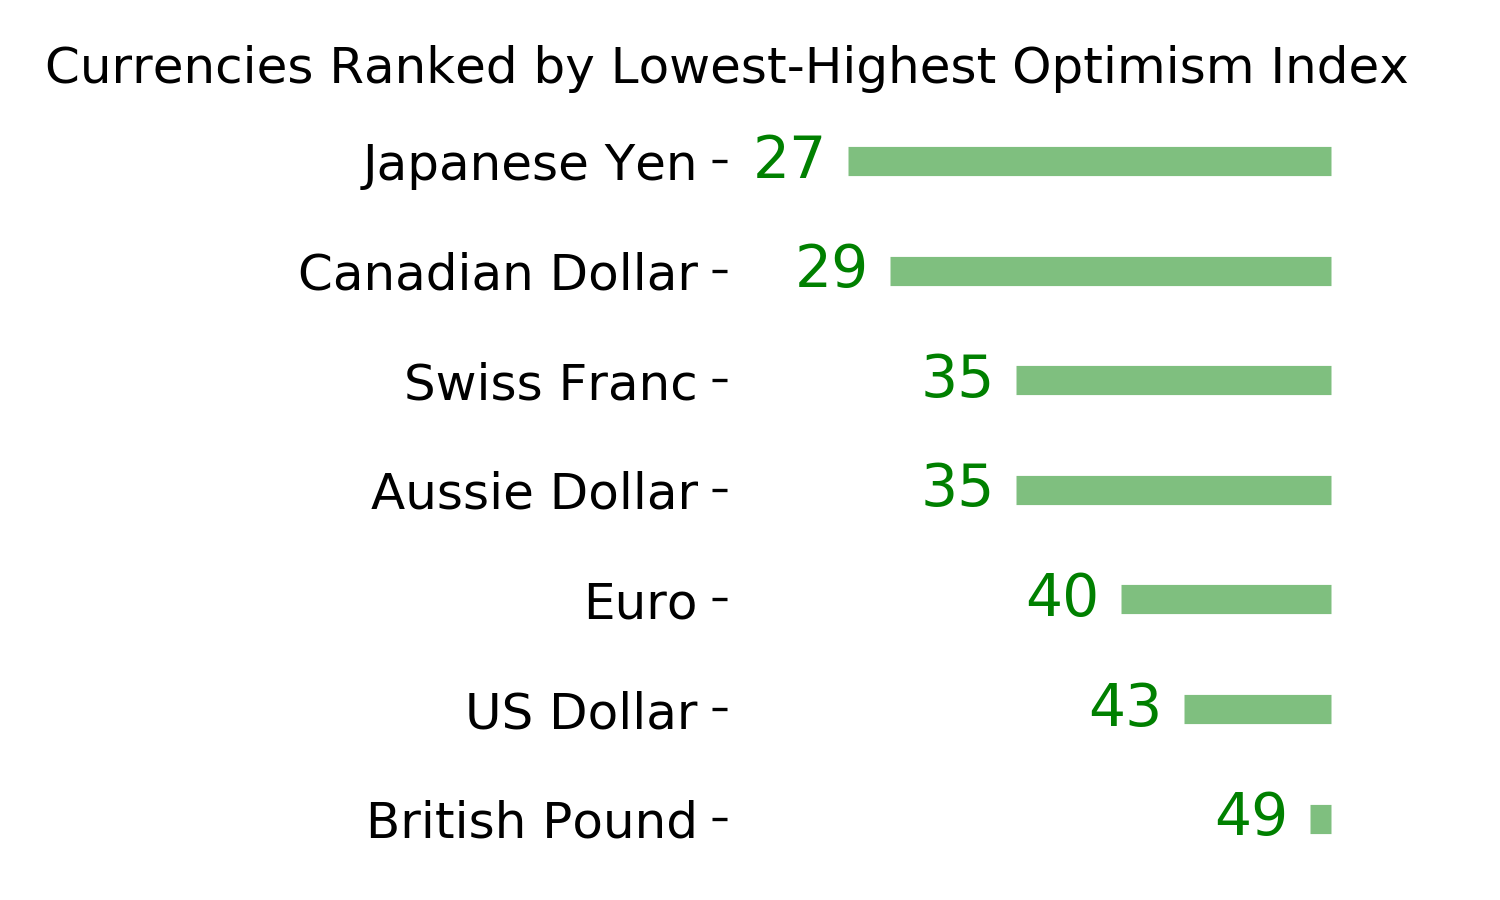
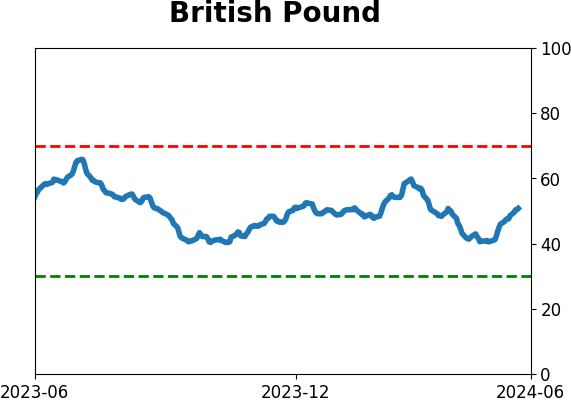
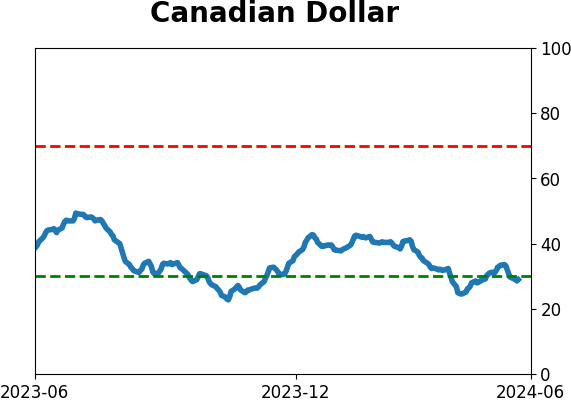
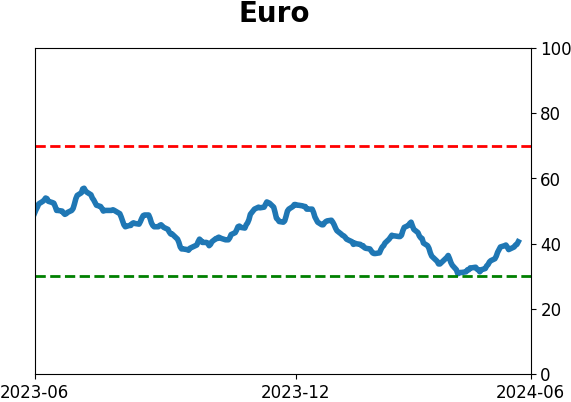
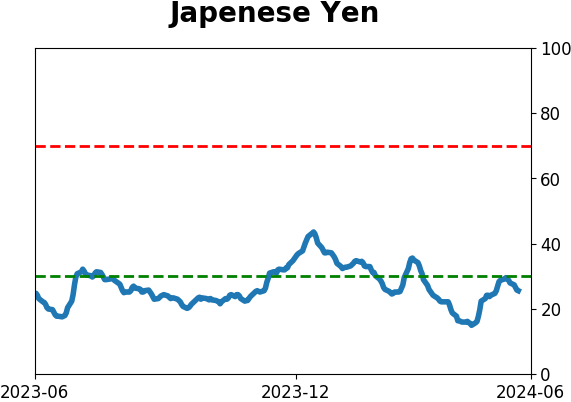
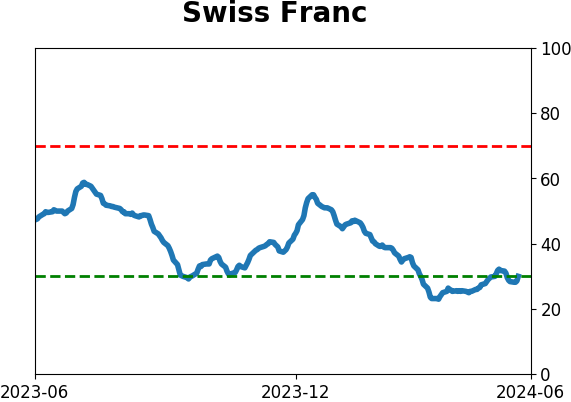
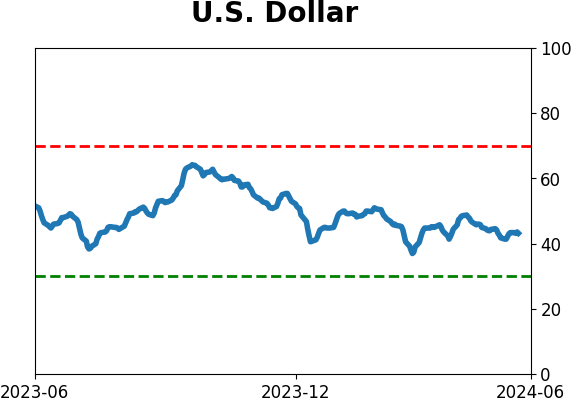
Currency ETF's - 5-Day Moving Average
|
|
|
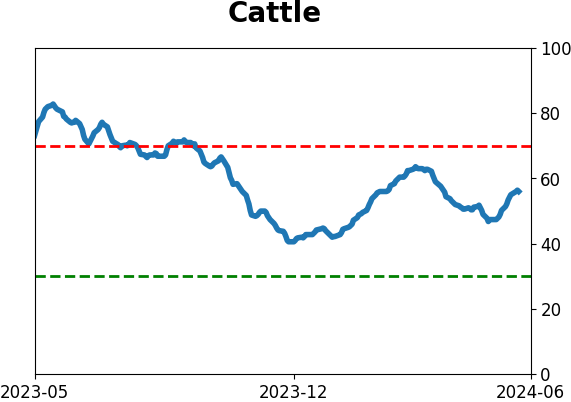
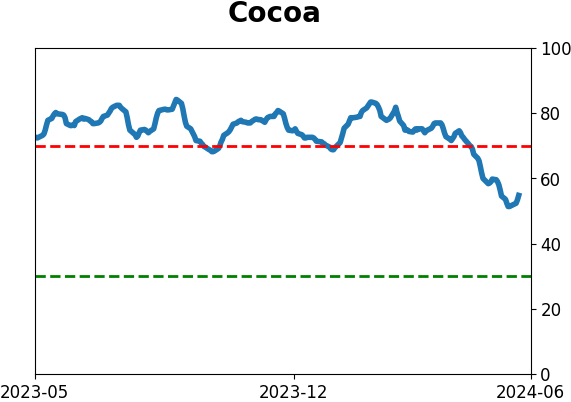
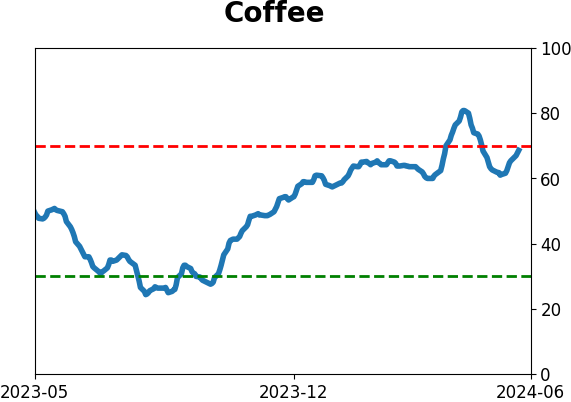
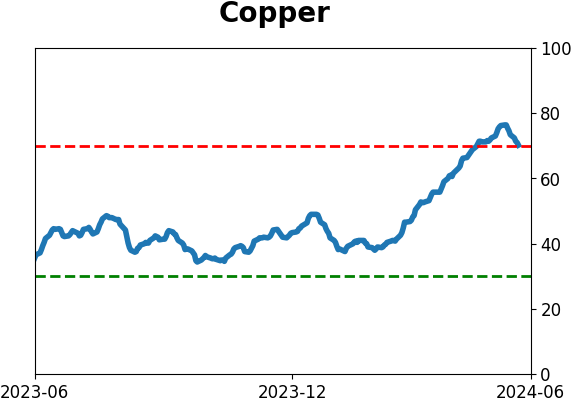
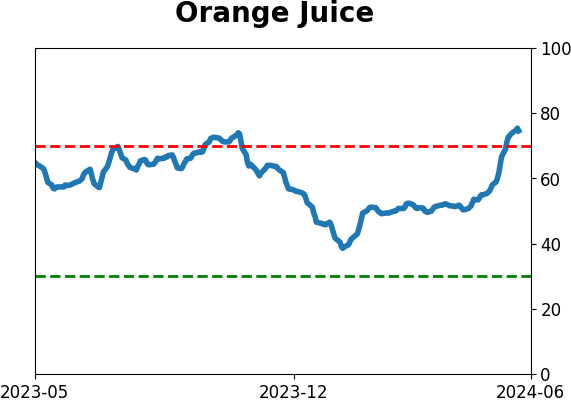
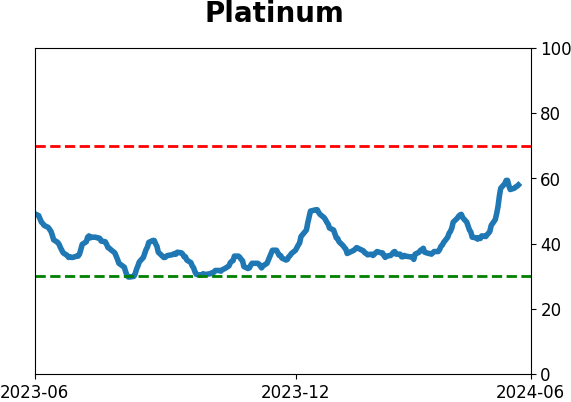
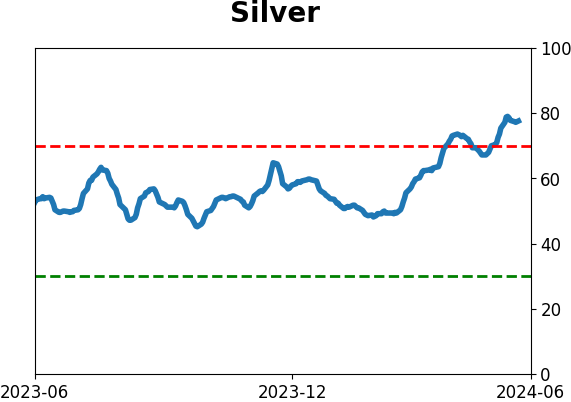
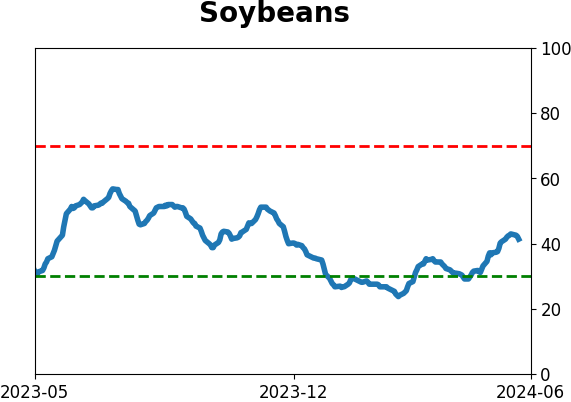
Commodity ETF's - 5-Day Moving Average
|
|