New Risk-Off Composite Model
Over the last few months, I've shared several risk-off models that seek to identify periods when the market is transitioning from a bullish to bearish condition. While the models are suitable as a standalone tool, I always like to use a weight-of-the-evidence approach as a single model is more susceptible to a whipsaw signal.
I want to share a new composite model that contains five risk-off models for managing market exposure in today's note.
The new model contains components from the following notes.
- Percentage of Members Outperforming the Index Risk-Off Model
- Percentage of Members above the 50-Day MA Risk-Off Model
- Percentage of Members Outperfroming Defensive Spread
- New High-Low Spread with Weak 50 & 200-Day MA
- Breadth Composite Divergence
RISK-OFF COMPOSITE MODEL SIGNAL CRITERIA
1.) Composite signal count >= 60%.
2.) If condition1, then start days since true count.
3.) If days since true count <= 5, and the 5-day rate of change for the S&P 500 is <= 0%, signal risk-off.
4.) The composite count resets below 20%. i.e., the reset screens out duplicate signals.
Notes:
- The composite model utilizes a 42-day lookback period for the signal count.
- I want to stress the importance of utilizing a momentum condition in trading signals. I never want to catch a falling knife on down moves or prematurely reduce exposure in a market that is ripping to the upside. This is why I have the 5-day rate of change condition.
Let's take a look at some charts and the historical signal performance.
CURRENT DAY CHART & TRADING STATISTICS
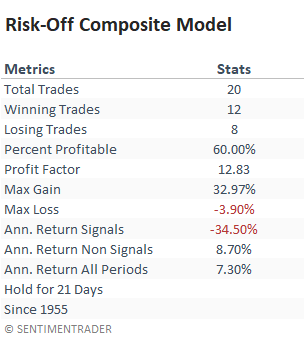
I calculate performance statistics as a short signal, whereas annualized returns result from buying the S&P 500.

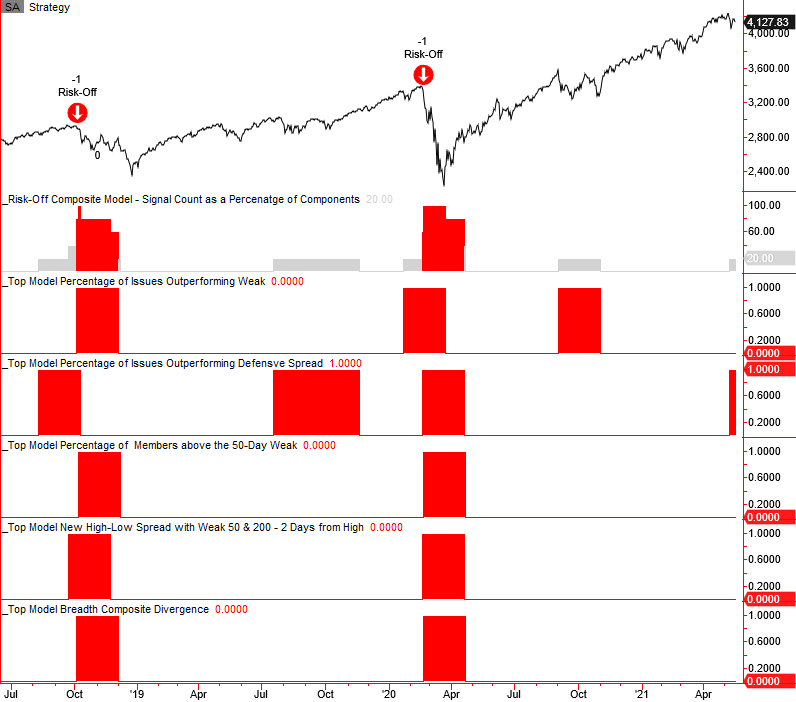
The current day chart reflects a signal count of 20% as the percentage of members outperforming defensive spread model triggered a risk-off warning signal on 5/11/21.
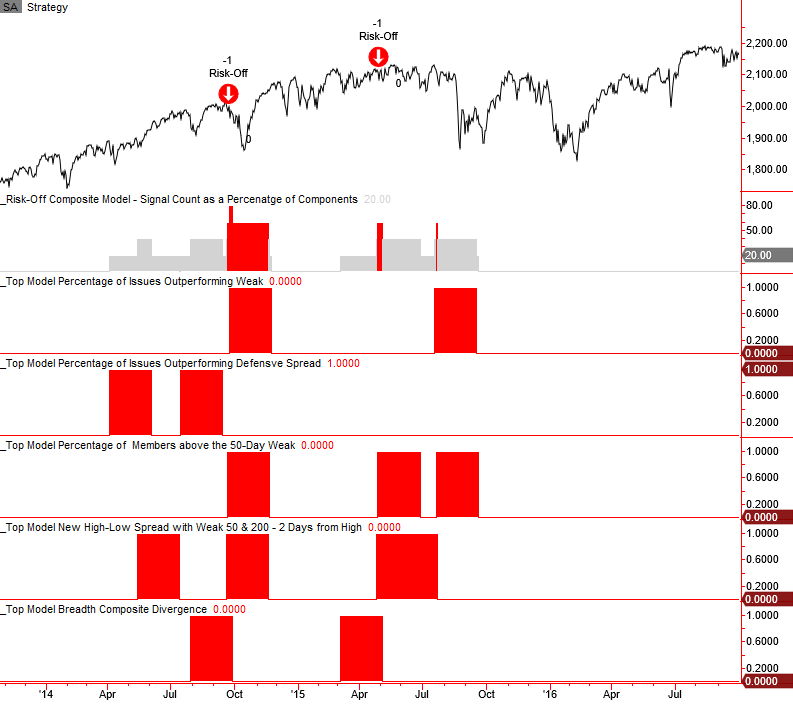
2015-16 CORRECTION
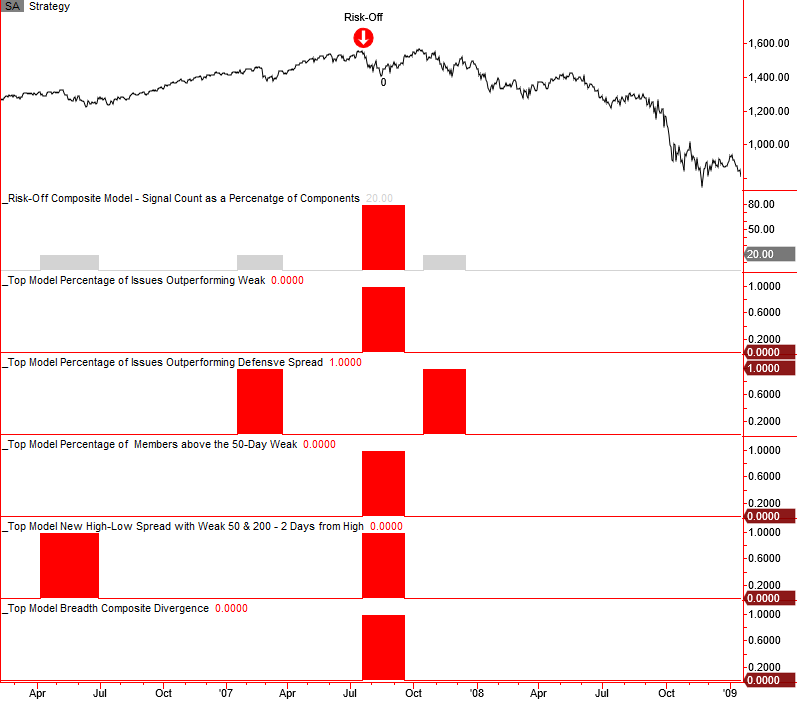
2007-08 Bear Market
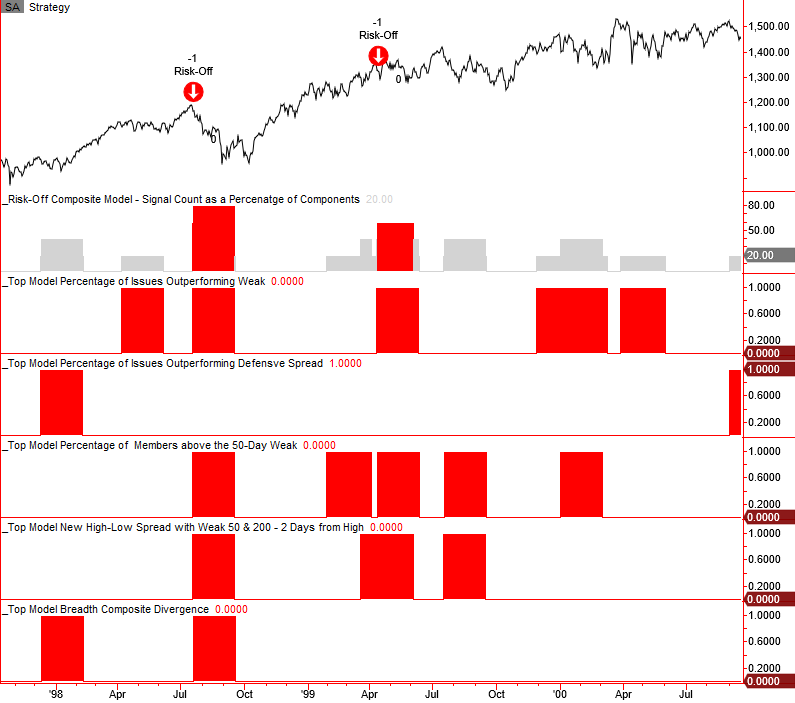
1998 LTCM Correction & 2000-02 BEAR
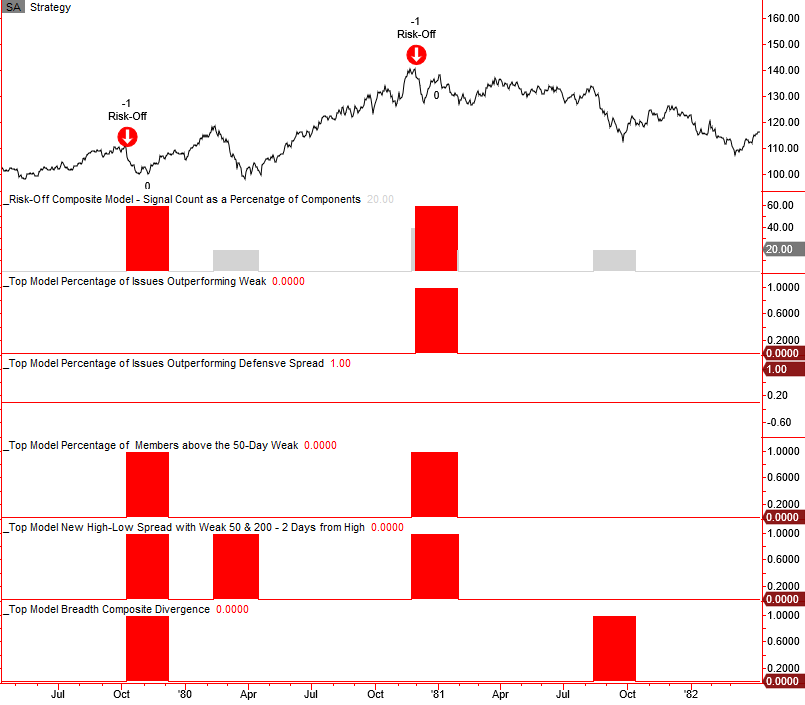
1980-82 BEAR MARKET
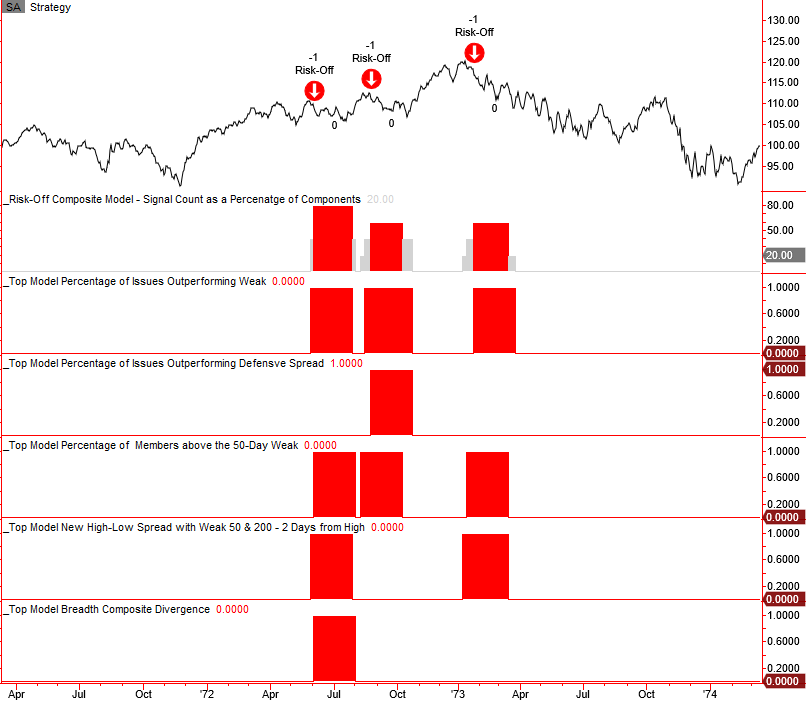
 1973-74 BEAR MARKET
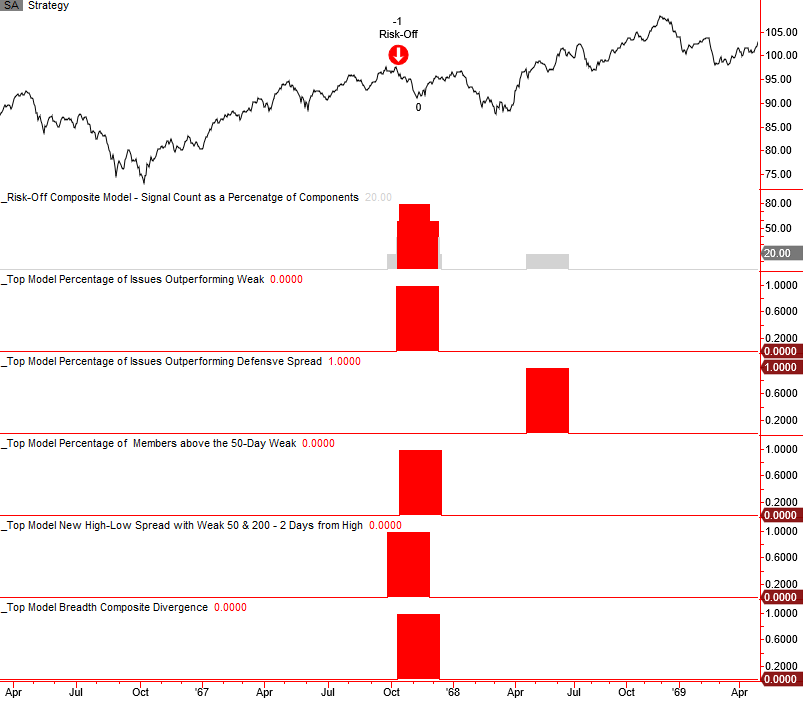
1967-68 CORRECTION
HOW THE SIGNALS PERFORMED
Performance is weak in the 1-4 week timeframe with several notable z-scores.
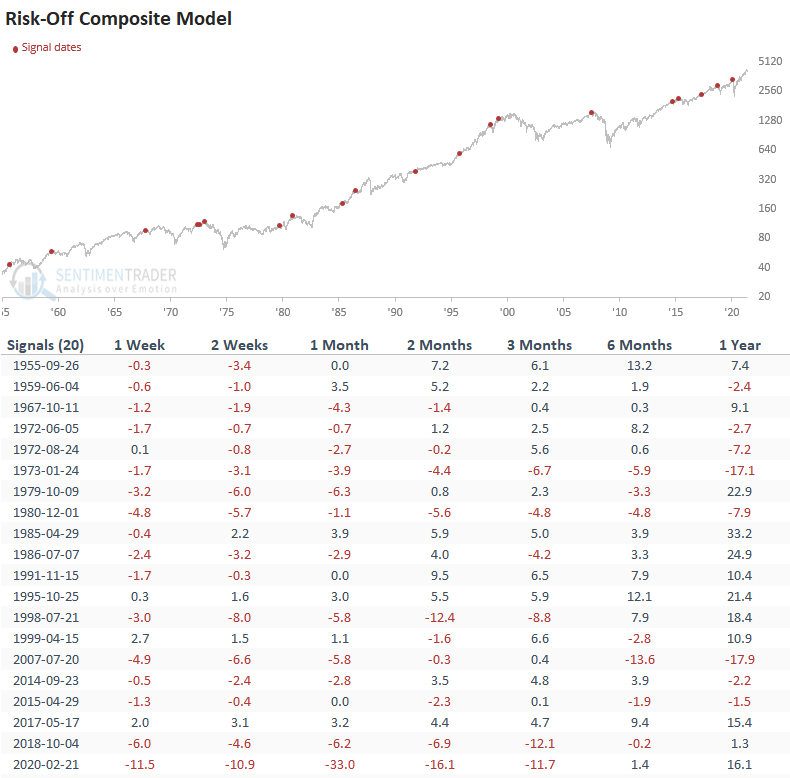

The risk-off composite model is an excellent secondary tool for managing market risk. I will add the current day chart to the TCTM live page on the website to monitor the model alongside the TCTM Risk Warning Model. As of now, It's unlikely that a risk-off signal triggers in the near term.

