Headlines
|
|
A cluster of selling pressure with few signs of relief:
Investors have not been eager to buy after stocks have risen, and they also haven't been eager to buy after declines. This is a stark change from much of the past 12 years. In a recent stretch, we witnessed very low Up Volume and Up Issues, with no subsequent buying thrusts. Similar behavior tended to lead to even more selling.
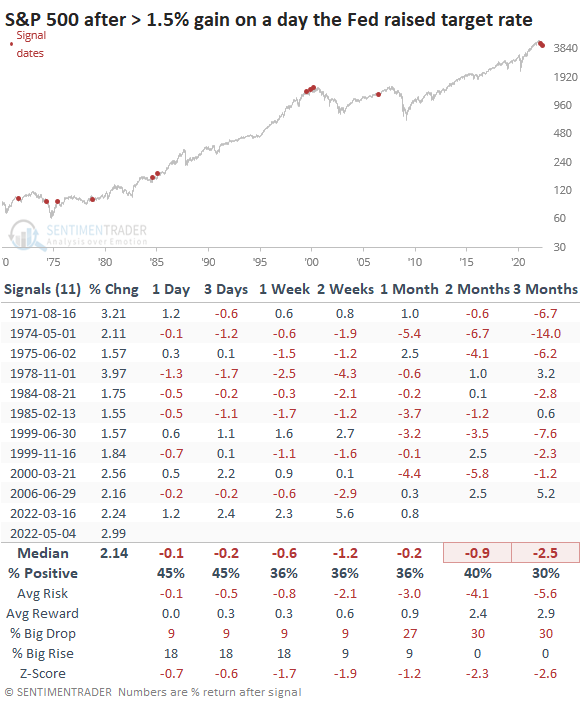
Finally, a thrust...and a rate rise: After weeks without a positive breadth thrust, buyers finally showed up on Wednesday. We'll have to see if there's any follow-through, something that's been lacking this year, and a necessary change as noted in today's report. It's curious that it triggered on a day the FOMC raised its target rate, marking the largest such positive reaction in over 40 years. Other big rallies on the day of a rate increase had a lot of trouble sustaining themselves, though.
|
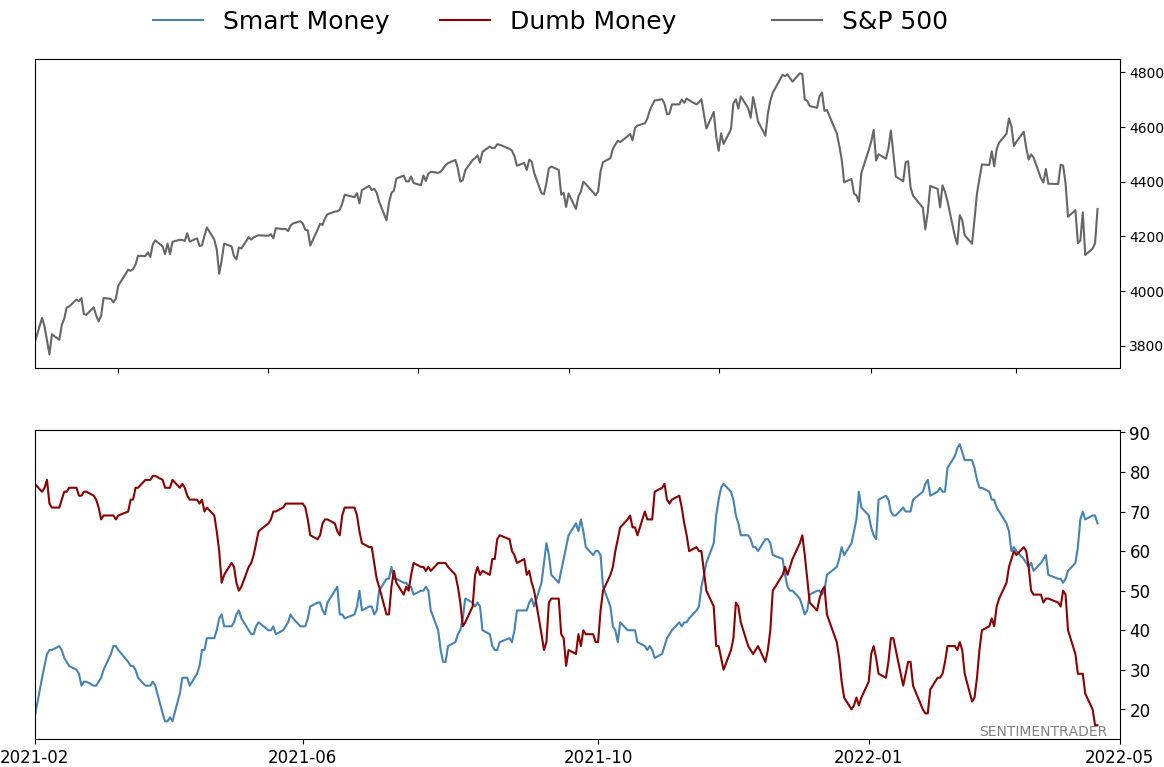
Smart / Dumb Money Confidence
|
Smart Money Confidence: 67%
Dumb Money Confidence: 16%
|
|
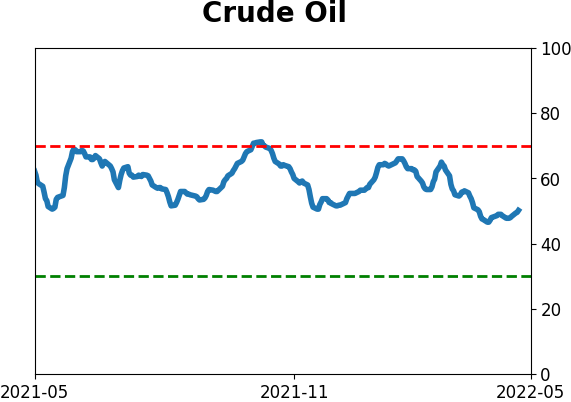
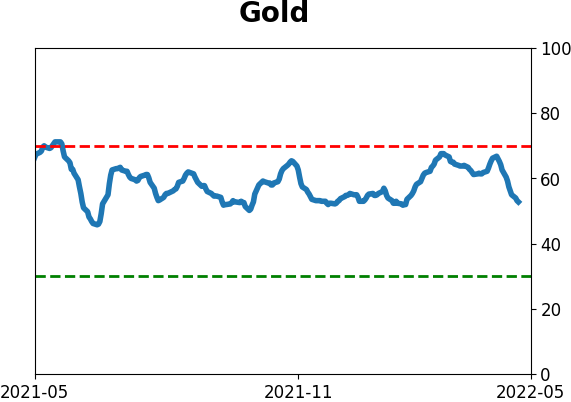
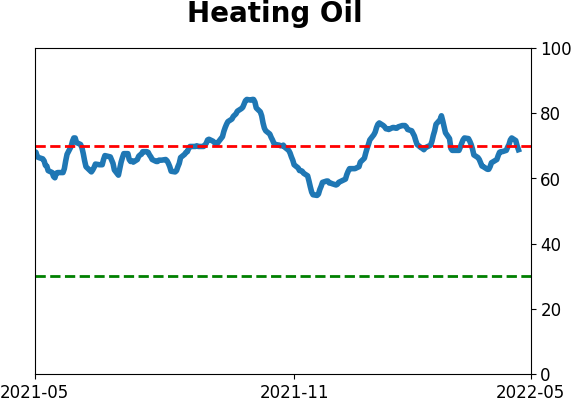
Risk Levels
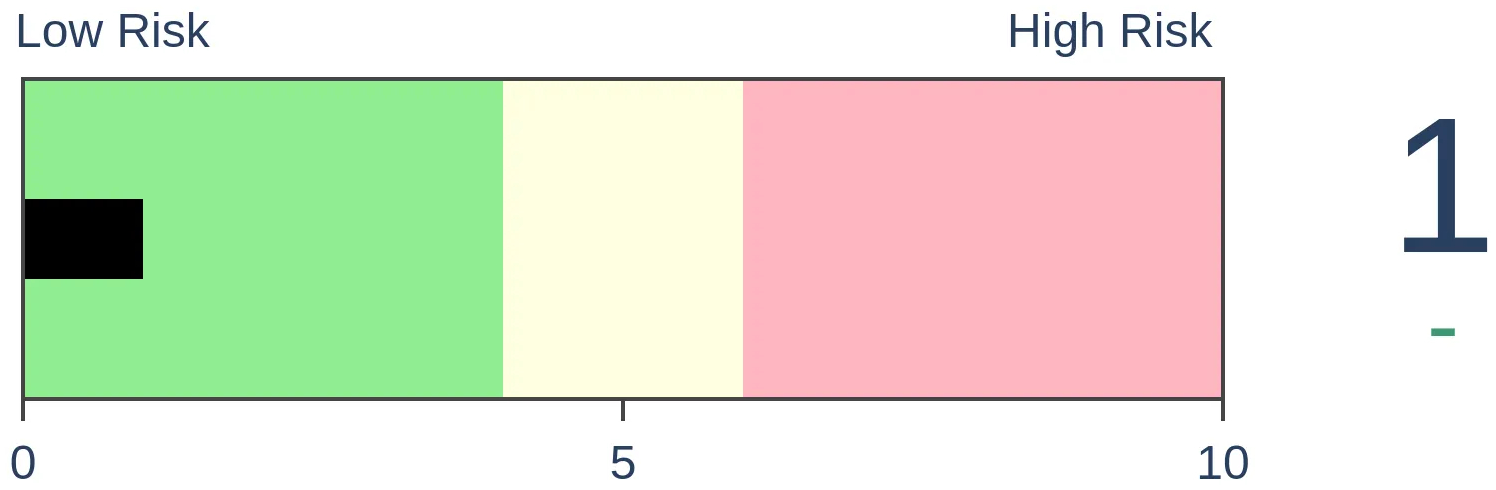
Stocks Short-Term
|
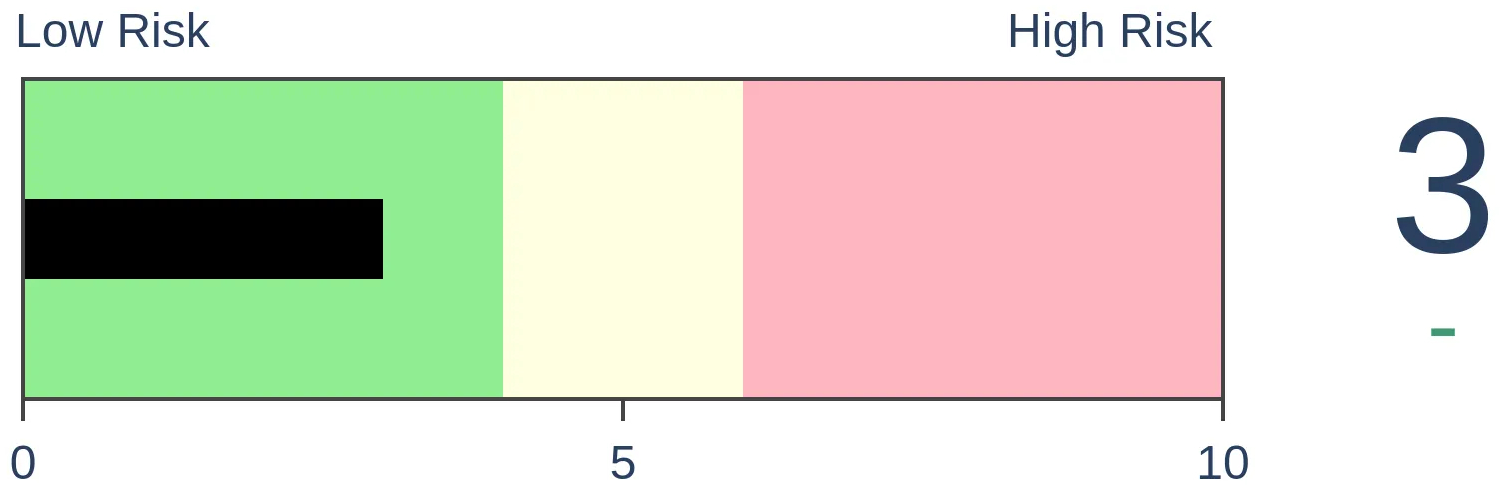
Stocks Medium-Term
|
|
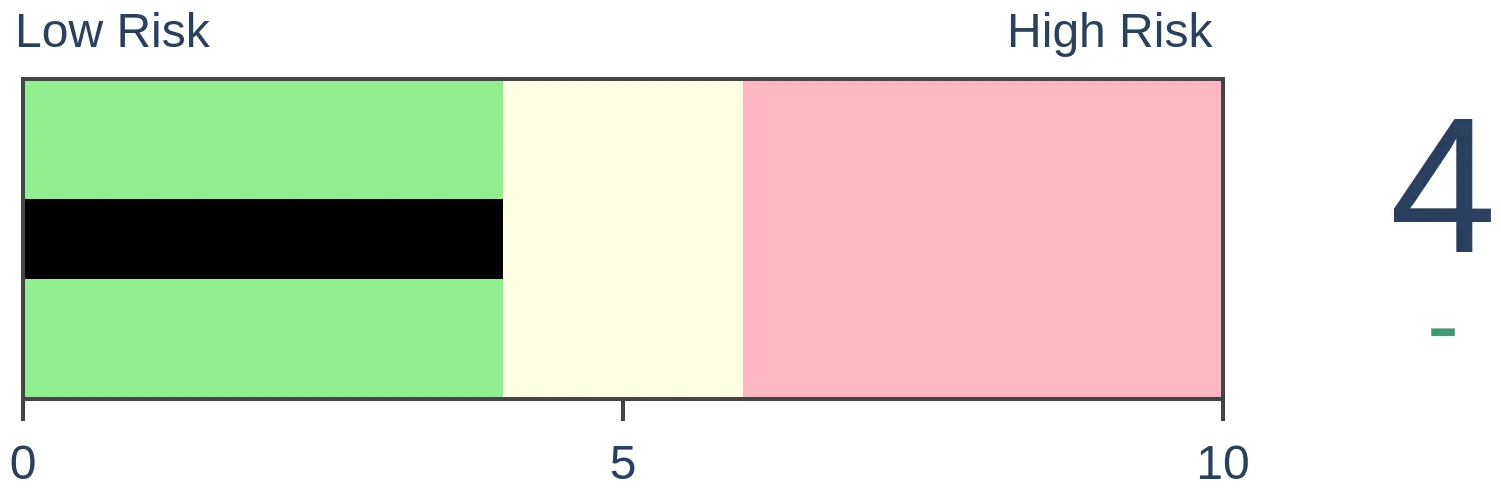
Bonds
|
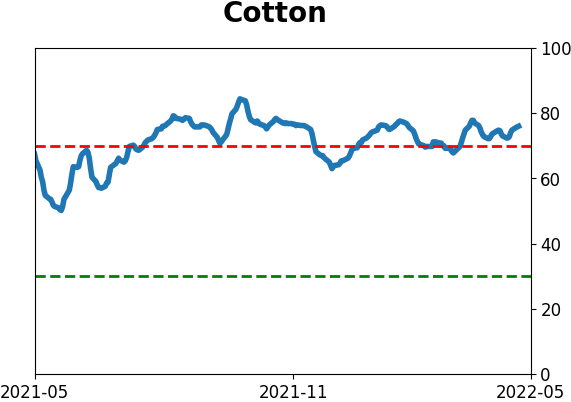
Crude Oil
|
|
Gold

|
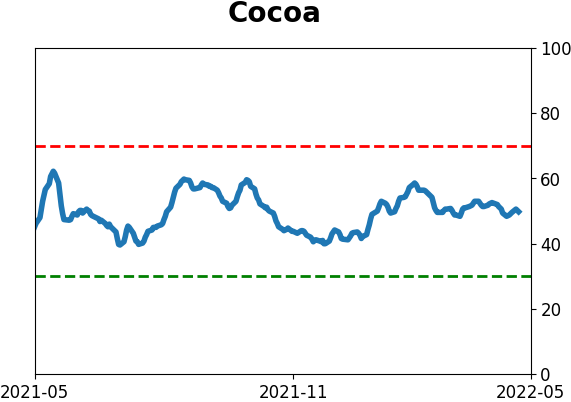
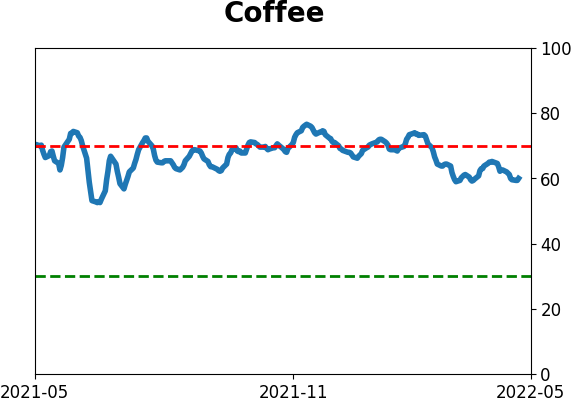
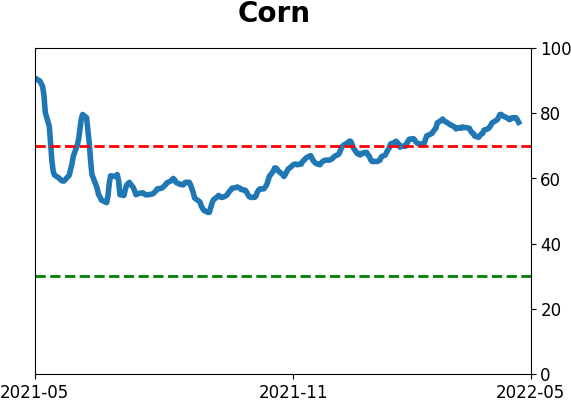
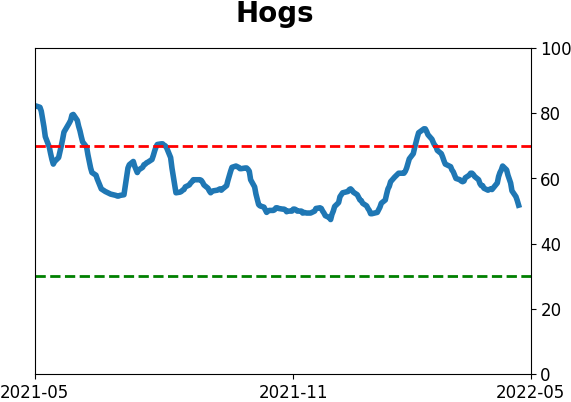
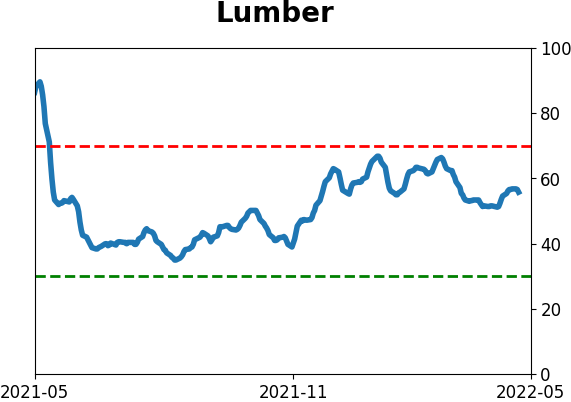
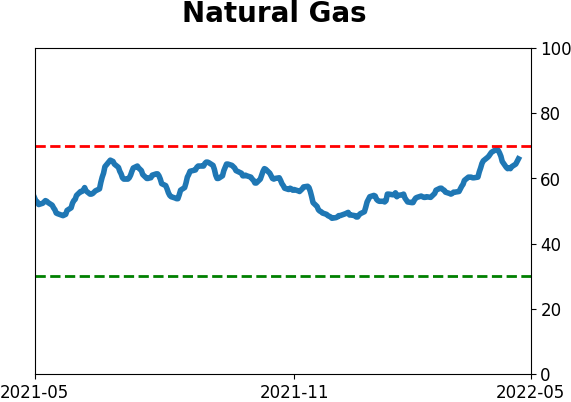
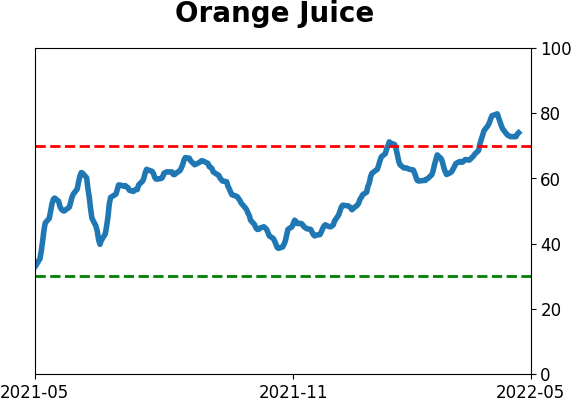
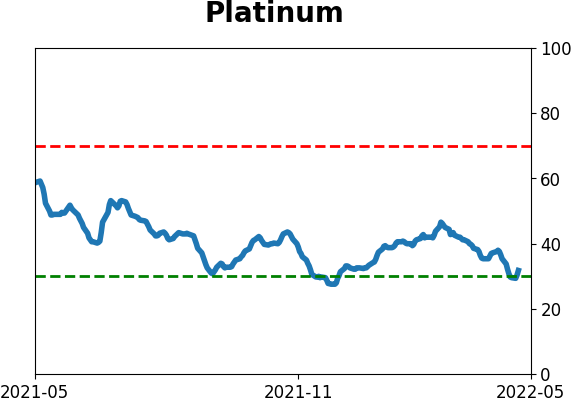
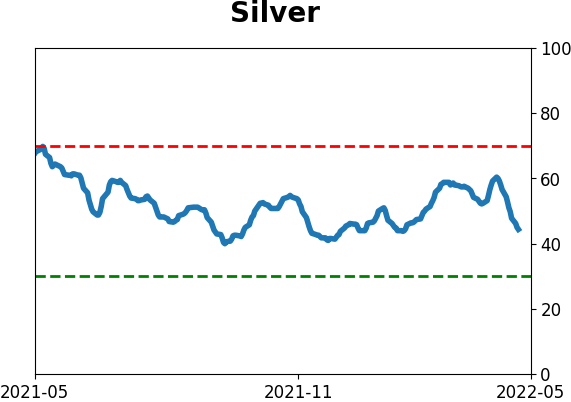
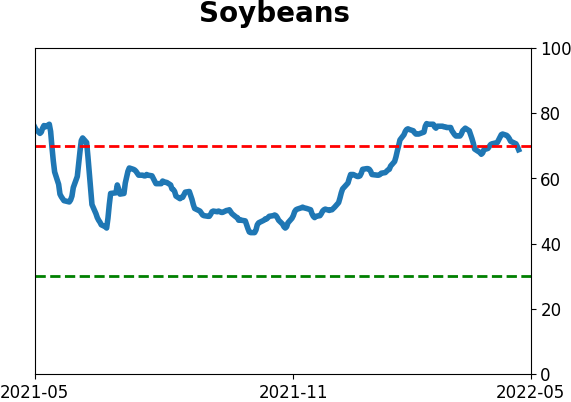
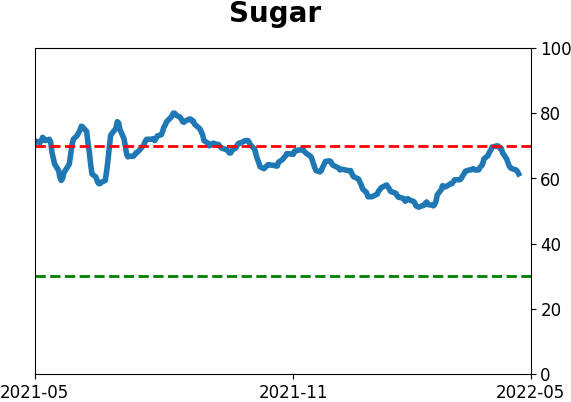
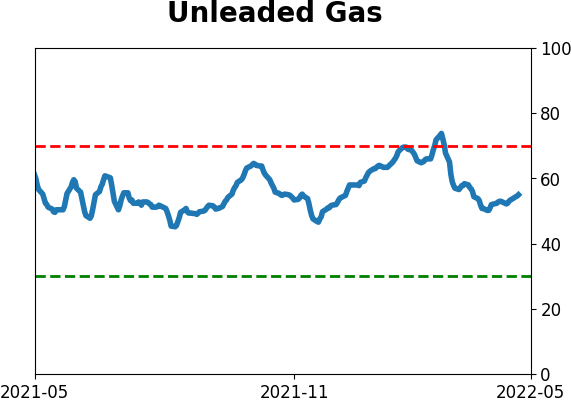
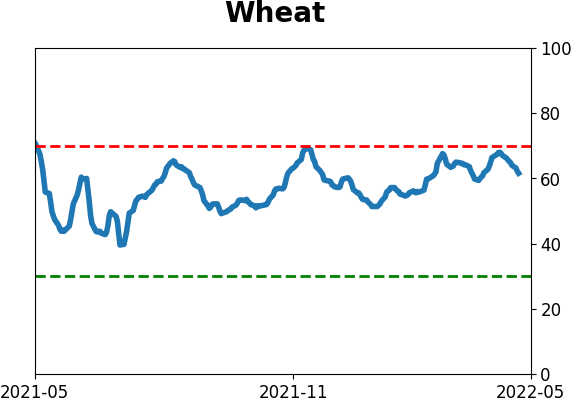
Agriculture

|
|
Research
By Jason Goepfert
BOTTOM LINE
Investors have not been eager to buy after stocks have risen, and they also haven't been eager to buy after declines. This is a stark change from much of the past 12 years. In a recent stretch, we witnessed very low Up Volume and Up Issues, with no subsequent buying thrusts. Similar behavior tended to lead to even more selling.
FORECAST / TIMEFRAME
None
|
Key points:
- Recent buying thrusts have failed, and now we're seeing clusters of heavy selling
- In a recent stretch, 3 out of 6 days witnessed extreme selling pressure, with no intervening buying interest
- Similar behavior tended to lead to poor returns 1-2 months later in the S&P 500
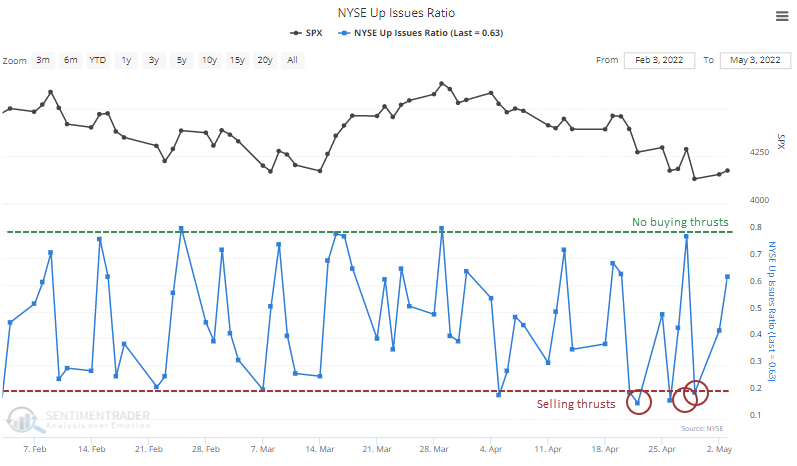
A worrying cluster of heavy selling
We spend a lot of time looking at internal thrusts in sectors, indexes, and even entire exchanges. When there are overwhelming displays of buying interest, it tends to beget more buying. This has been the case for decades, and they remain an effective tool.
They're not infallible. They failed in December and March which is disturbing because it's a change in investor behavior from the past 12 years.
What's also disturbing is that the lack of follow-through on the buying thrusts has led to an increasing number of days with the opposite. As Ed Clissold from NDR pointed out, there have been several recent days with extremely poor breadth on the NYSE. Heading into the end of April, three out of six days had an Up Volume Ratio of less than 15%, and none of the days saw more than 85% Up Volume.
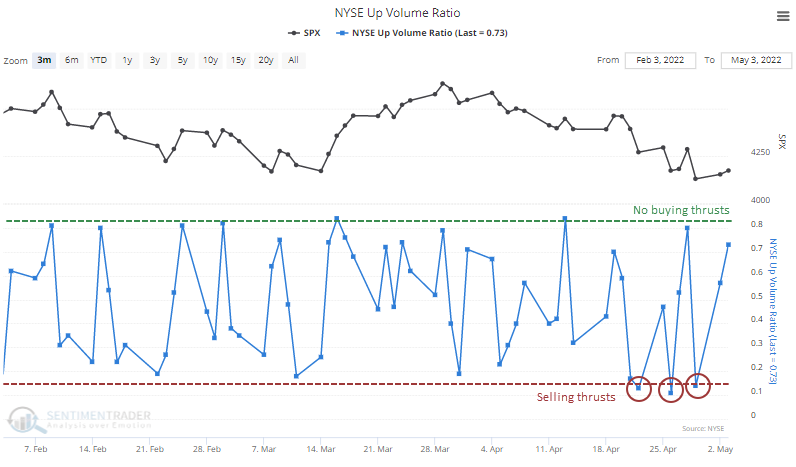
The negative volume was spread out, as the Up Issues Ratio held below 20% on those days, with no days above 80%.
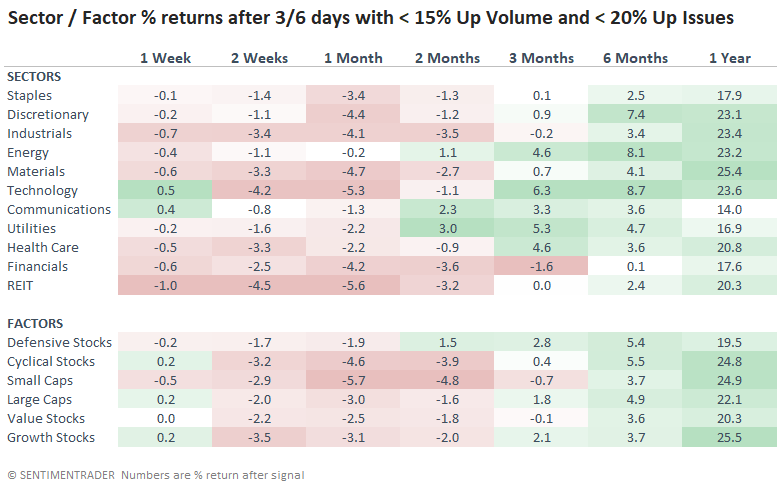
Stocks have struggled when markets have suffered a cluster of heavy selling days with no accompanying days of buying interest. The table below shows every time over the past 60 years when there were at least three out of six days with extremely low Up Volume and Up Issues but no days with the opposite extremes.
In 2013 and 2015, this was a great sign of oversold conditions, and buyers stepped up immediately. I wanted to wait a bit with this study to see if we'd have any follow-through this time, and so far, stocks are lagging. Based on prior signals, this also isn't a great sign.

Jay recently noted that a portfolio of four defensive sectors normally outperforms during the summer months, and that factor did show smaller losses after these signals. The Defensive factor was the only factor with a positive average return during the next two months.
What the research tells us...
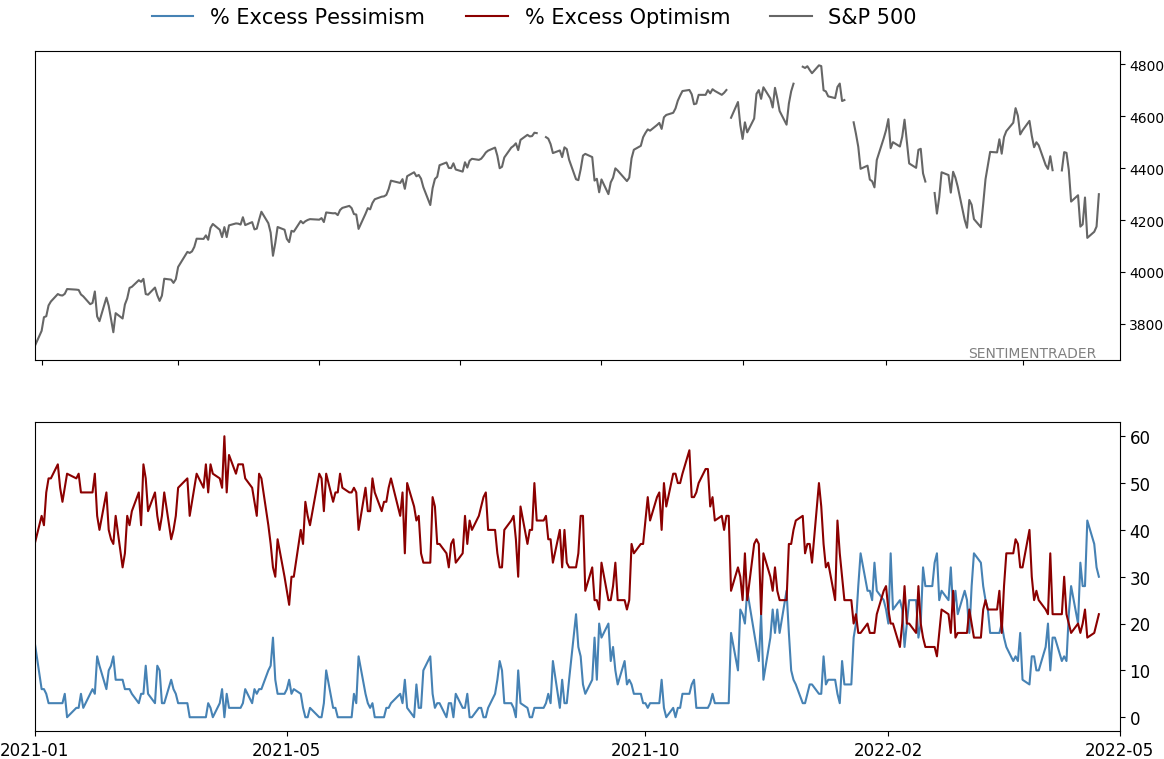
The split market that we've been discussing for months has resolved to the downside, and we see signs of eager selling pressure but not eager buying. When there is buying pressure, it has failed to lead to follow-through. Sentiment is extremely poor, with Dumb Money Confidence below 20% and the percentage of Risk-On/Risk-Off indicators below 10%. This is about all it takes for buyers to see an opportunity and form a bottom during healthy bull markets. During unhealthy bear markets, it's not. Signs are increasing that this is a different environment from much of the past 12 years, and I'm increasingly concerned about relying solely on pessimism as a reason to be bullish.
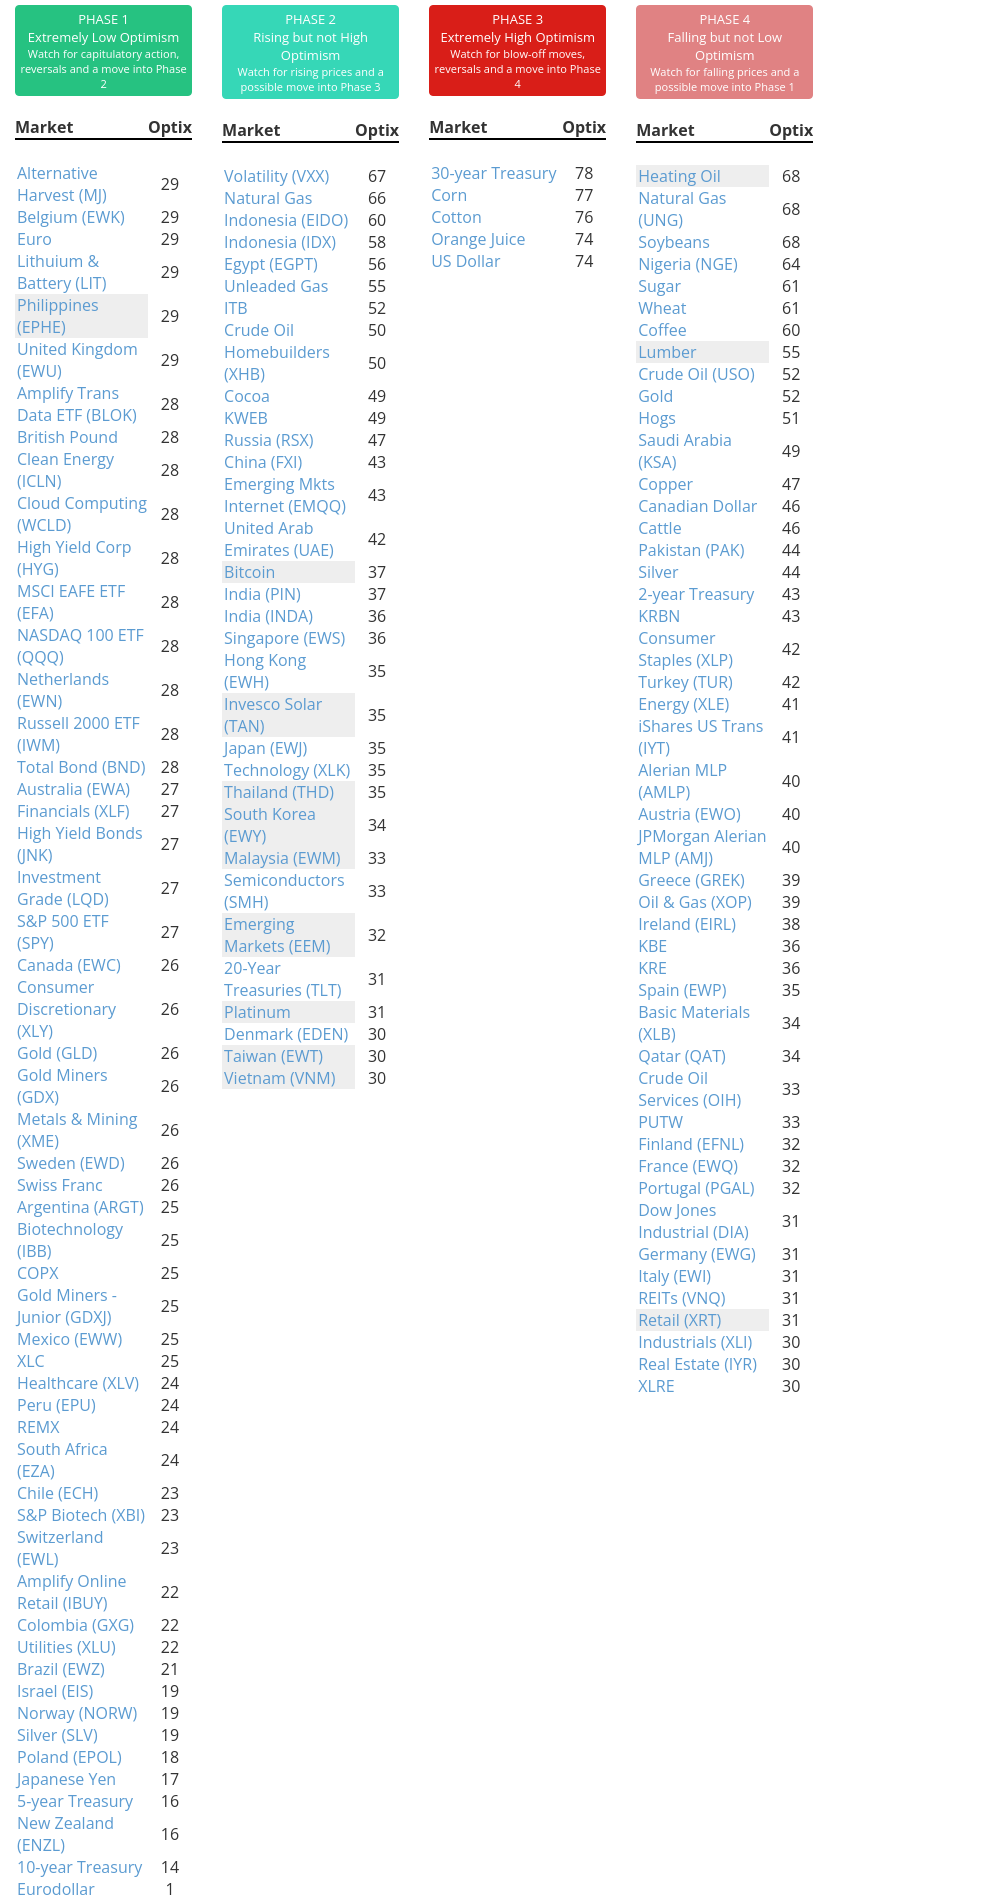
Indicators at Extremes
Phase Table
Ranks
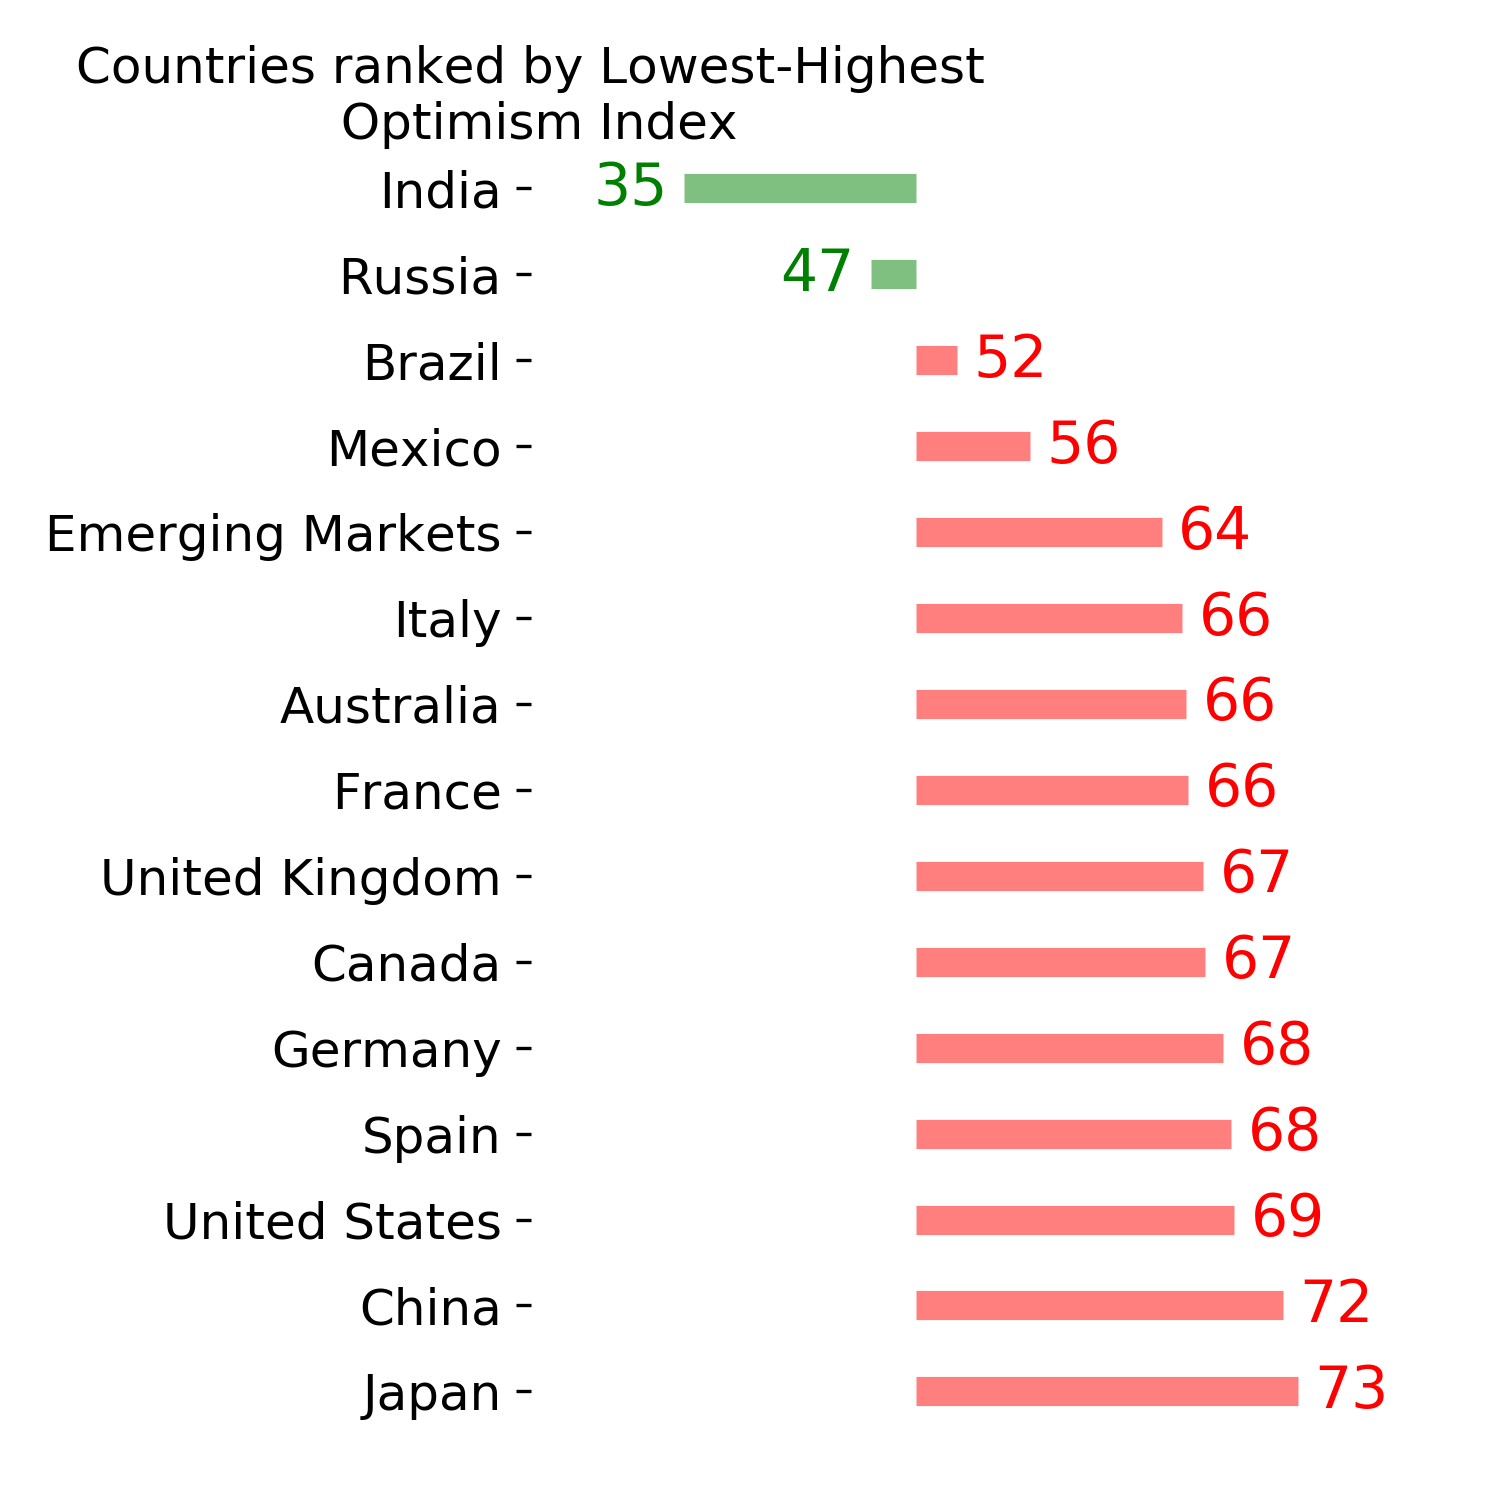
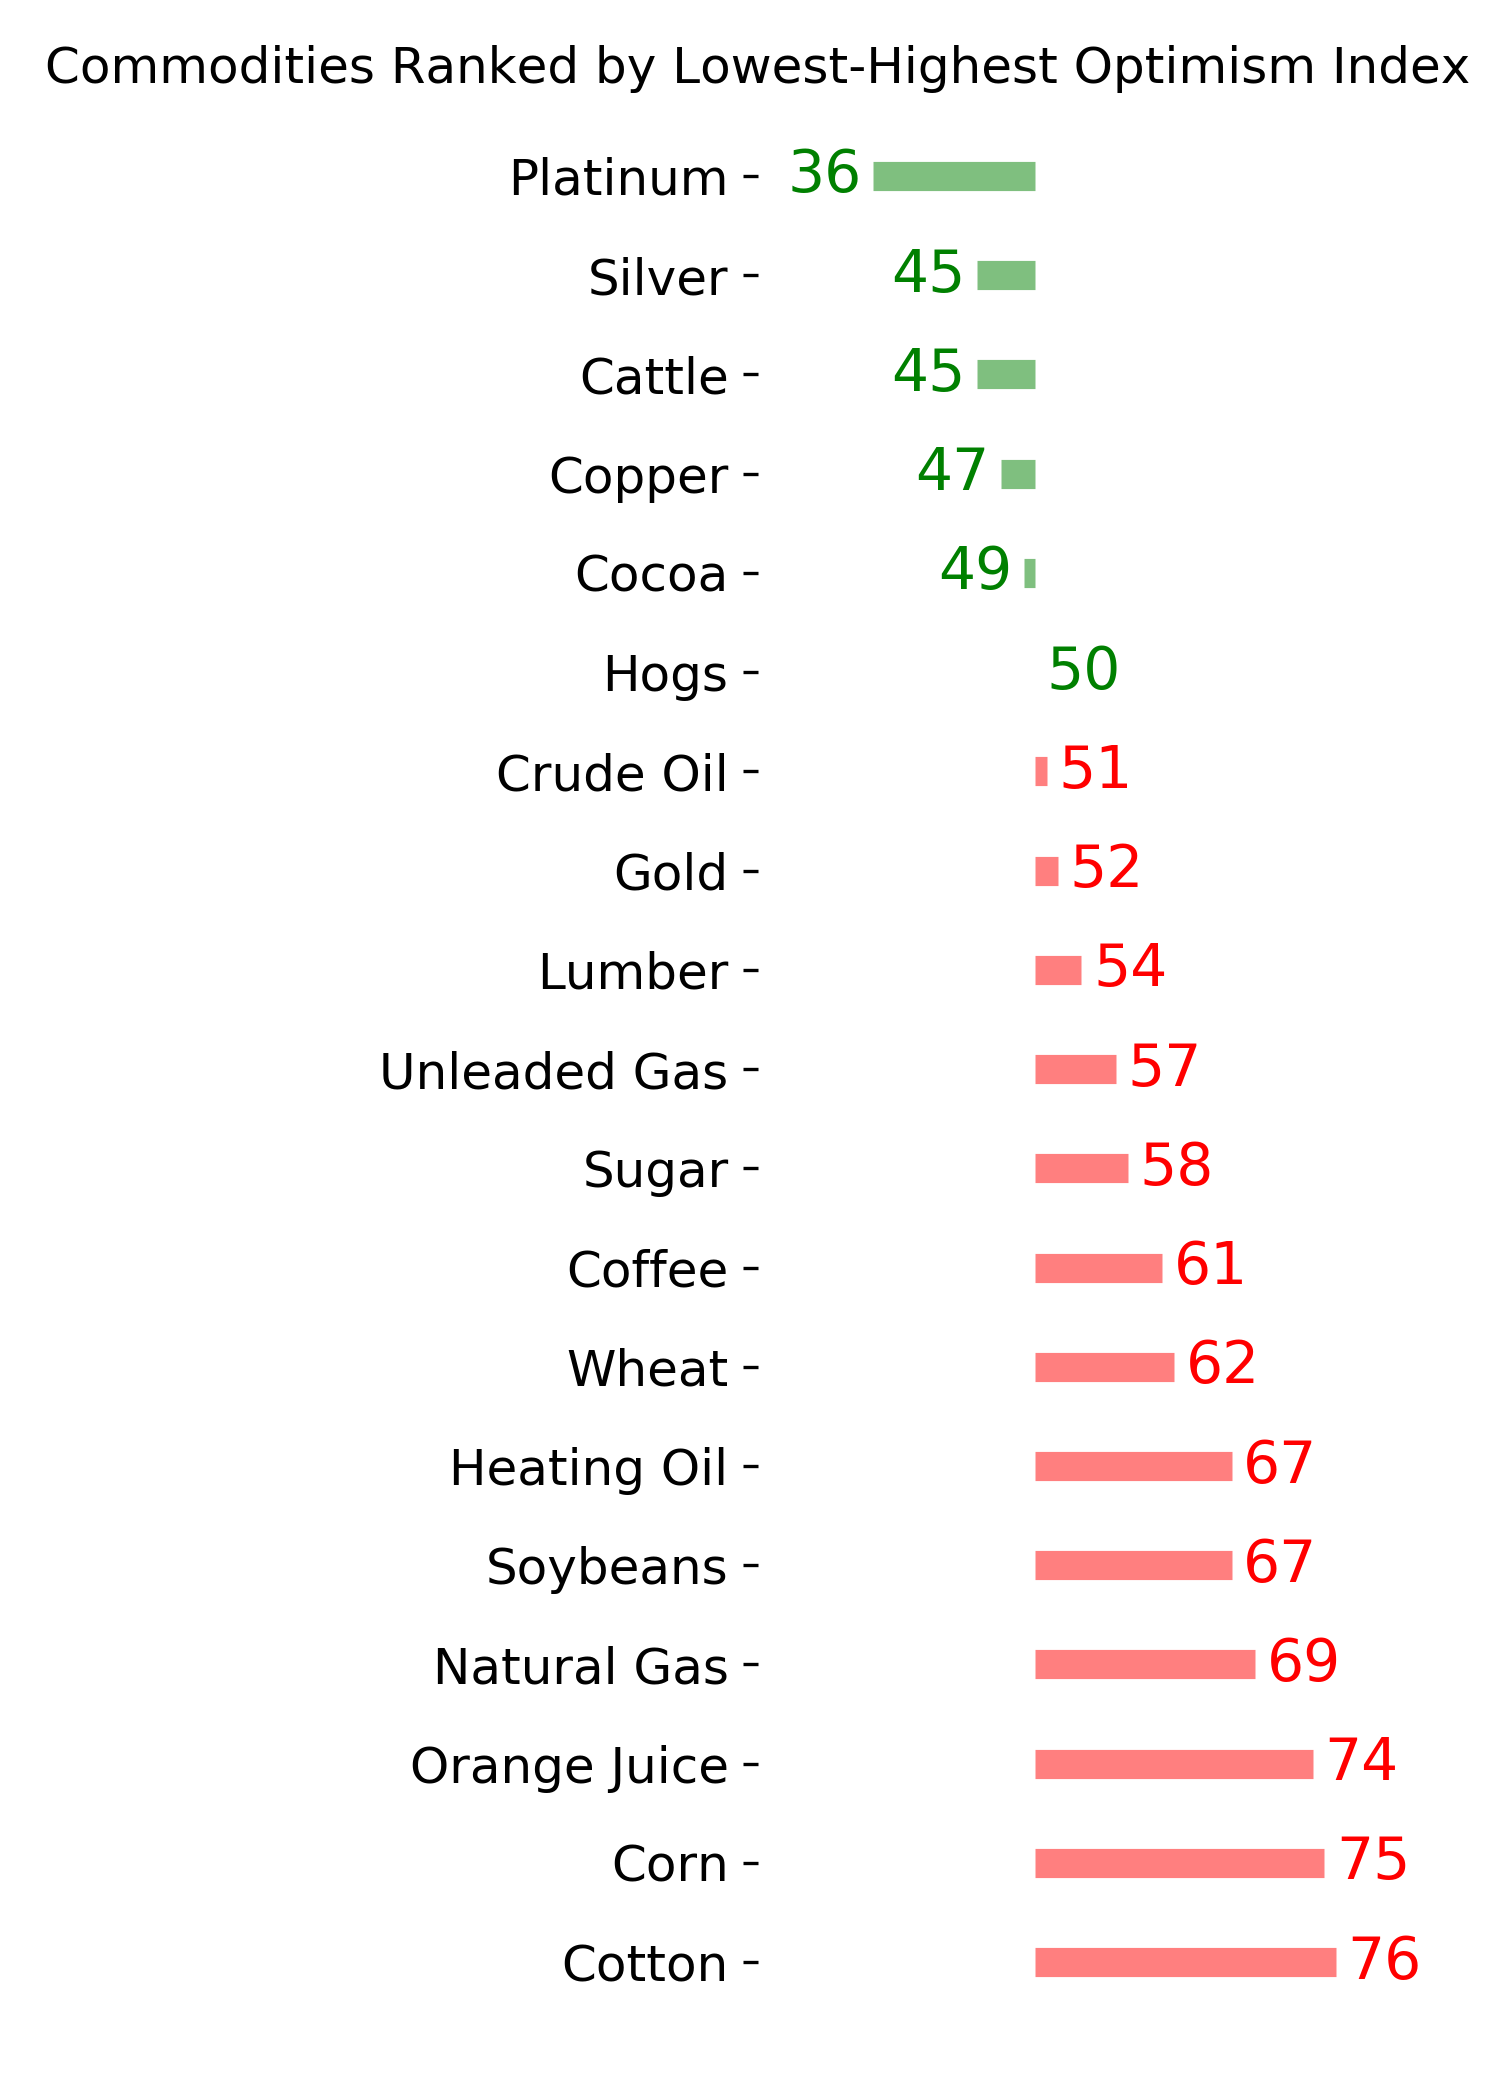
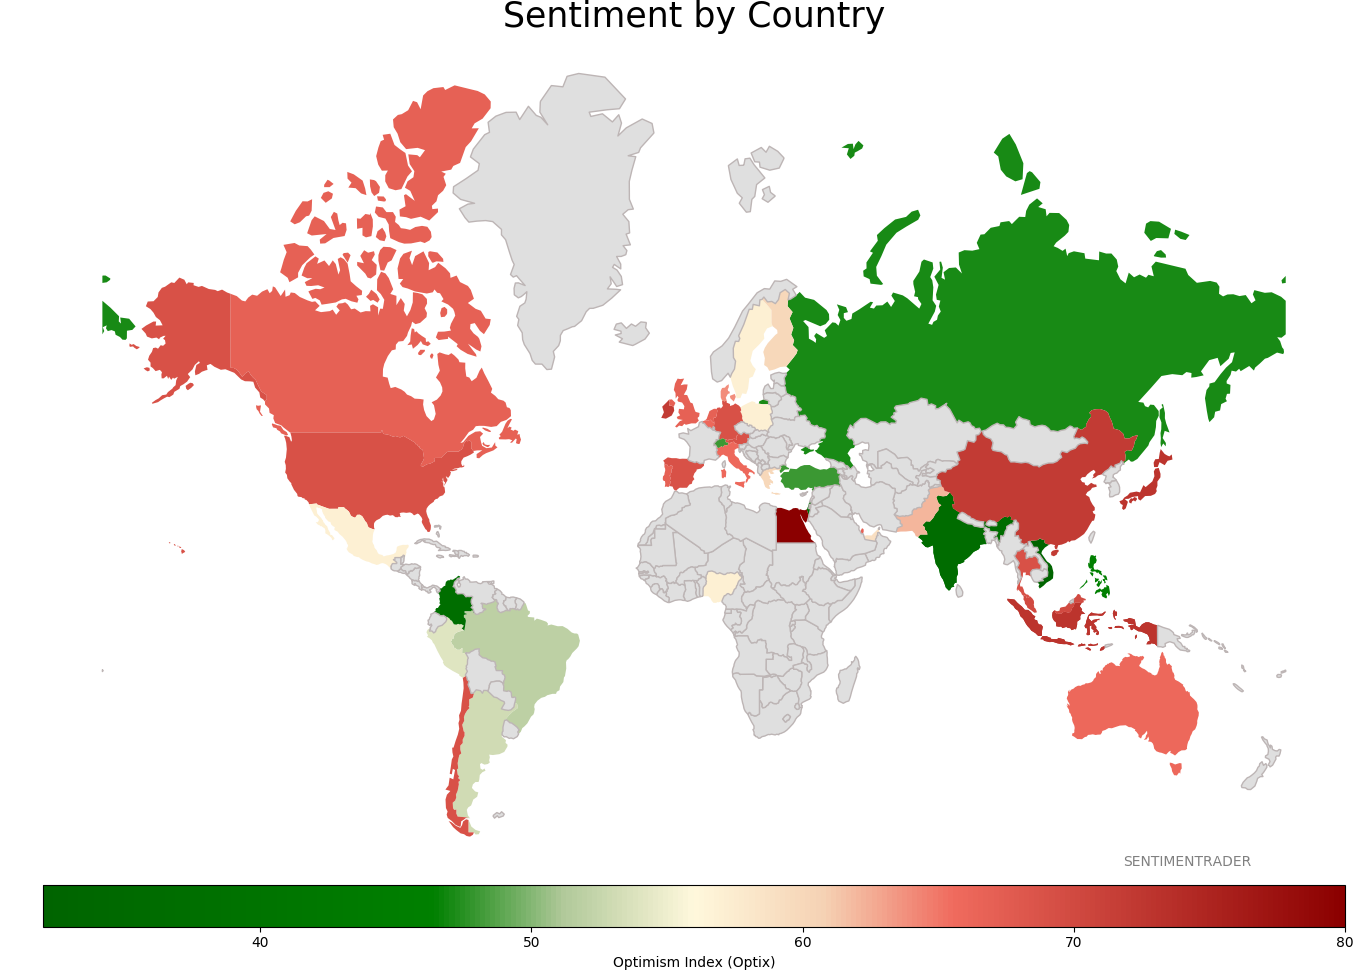
Sentiment Around The World
Optimism Index Thumbnails
|
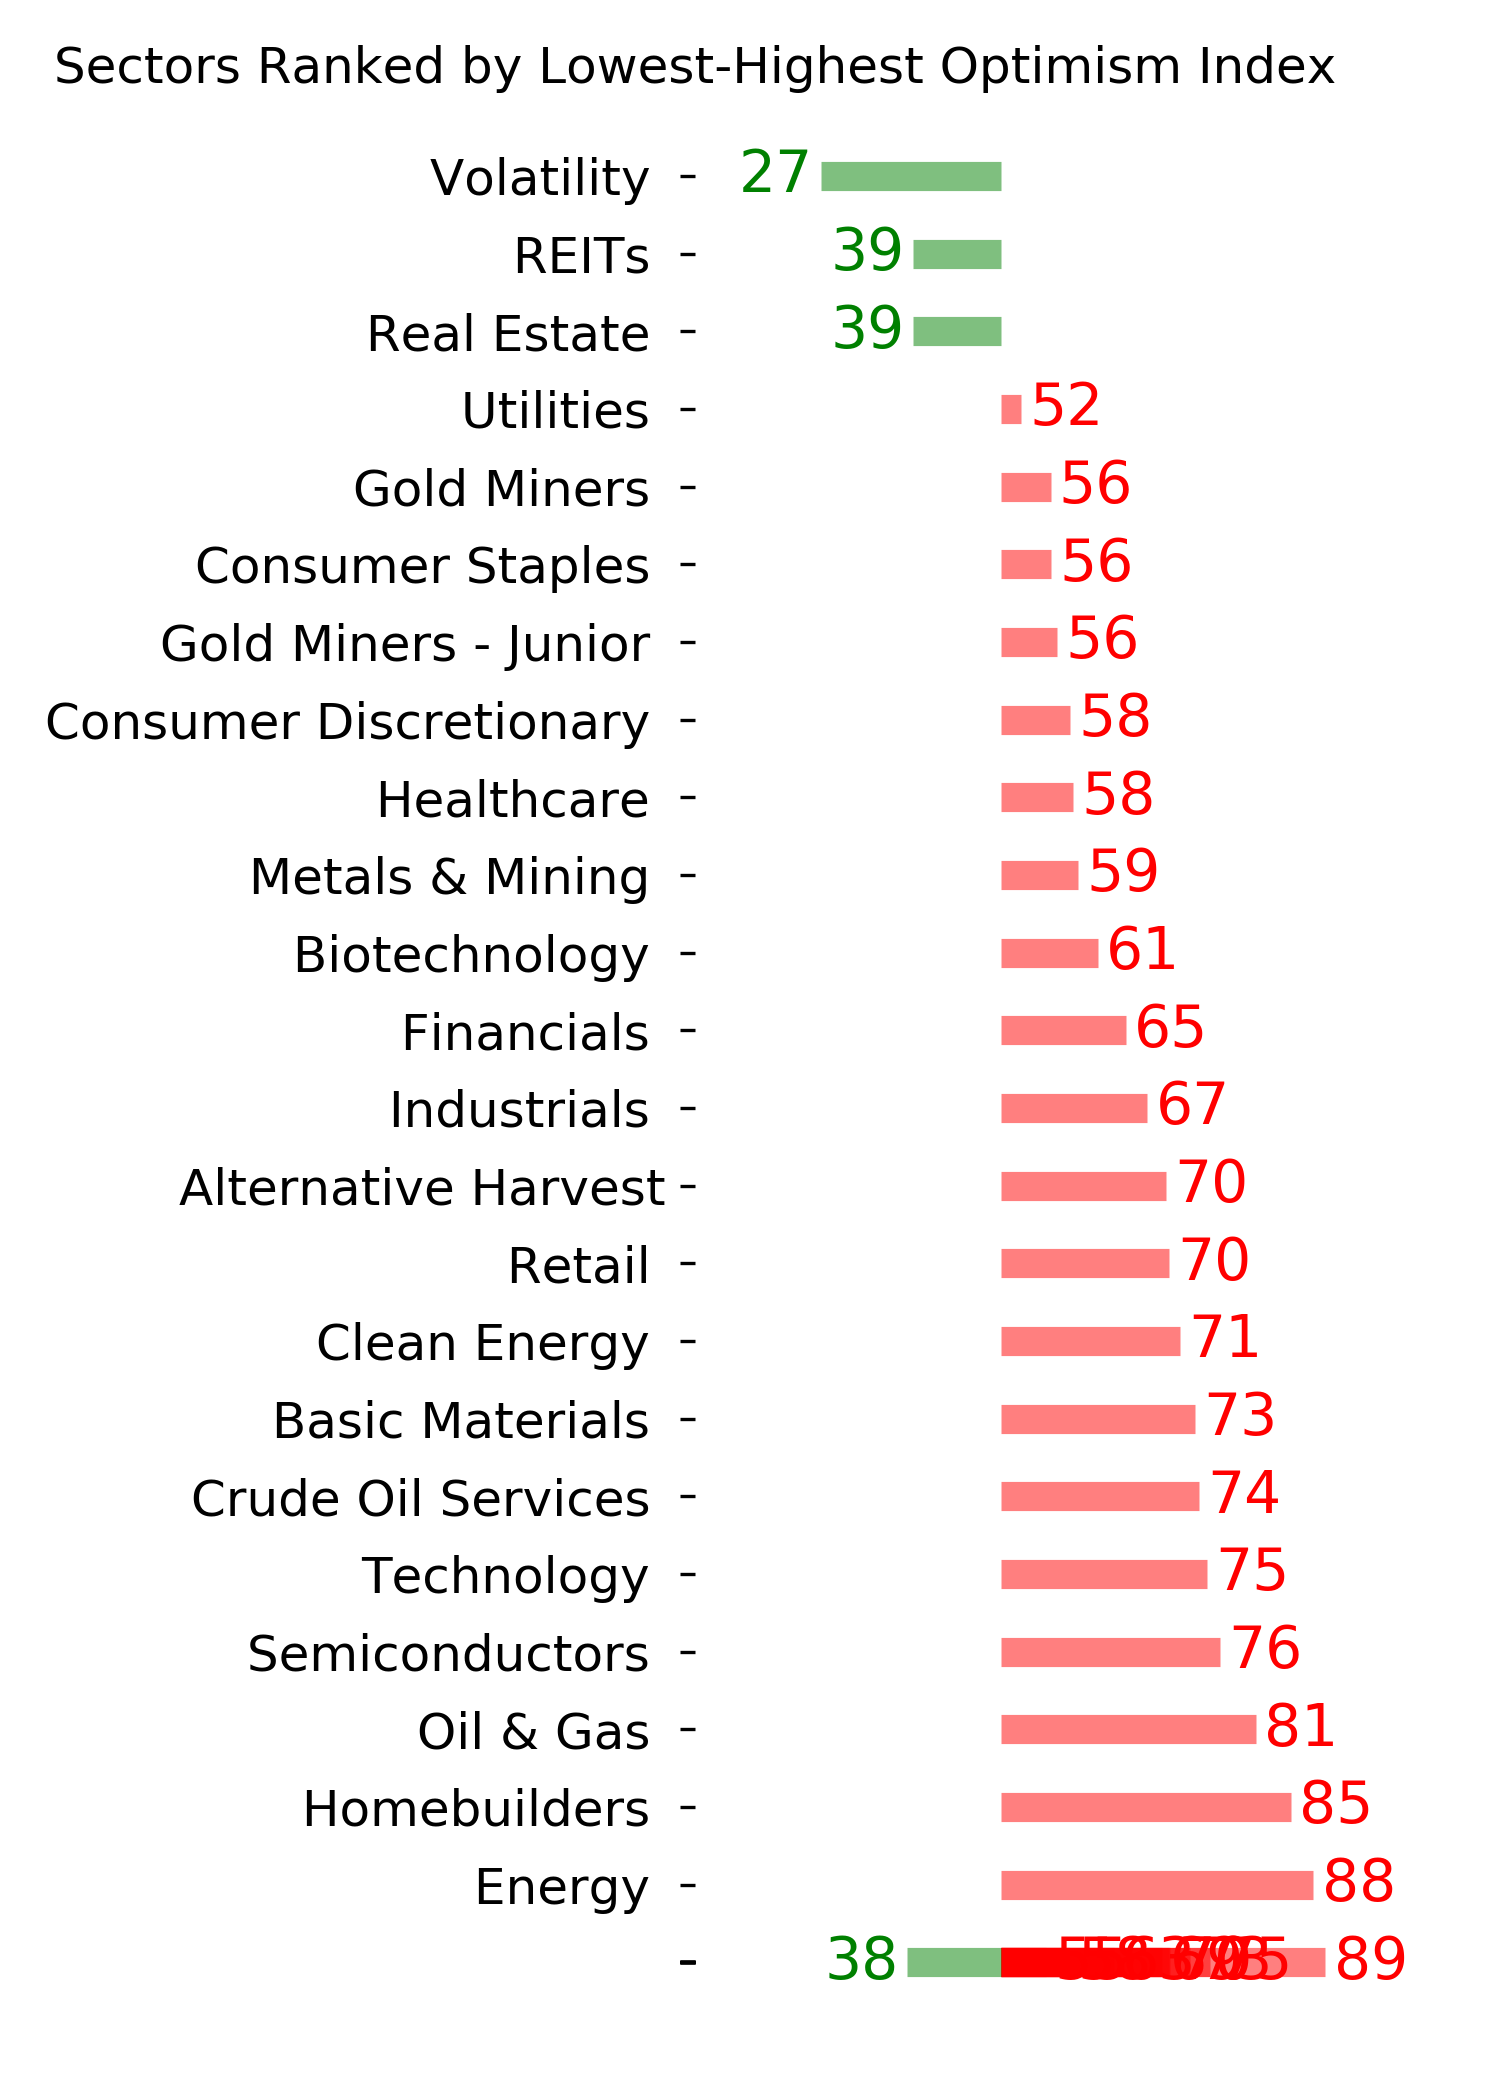
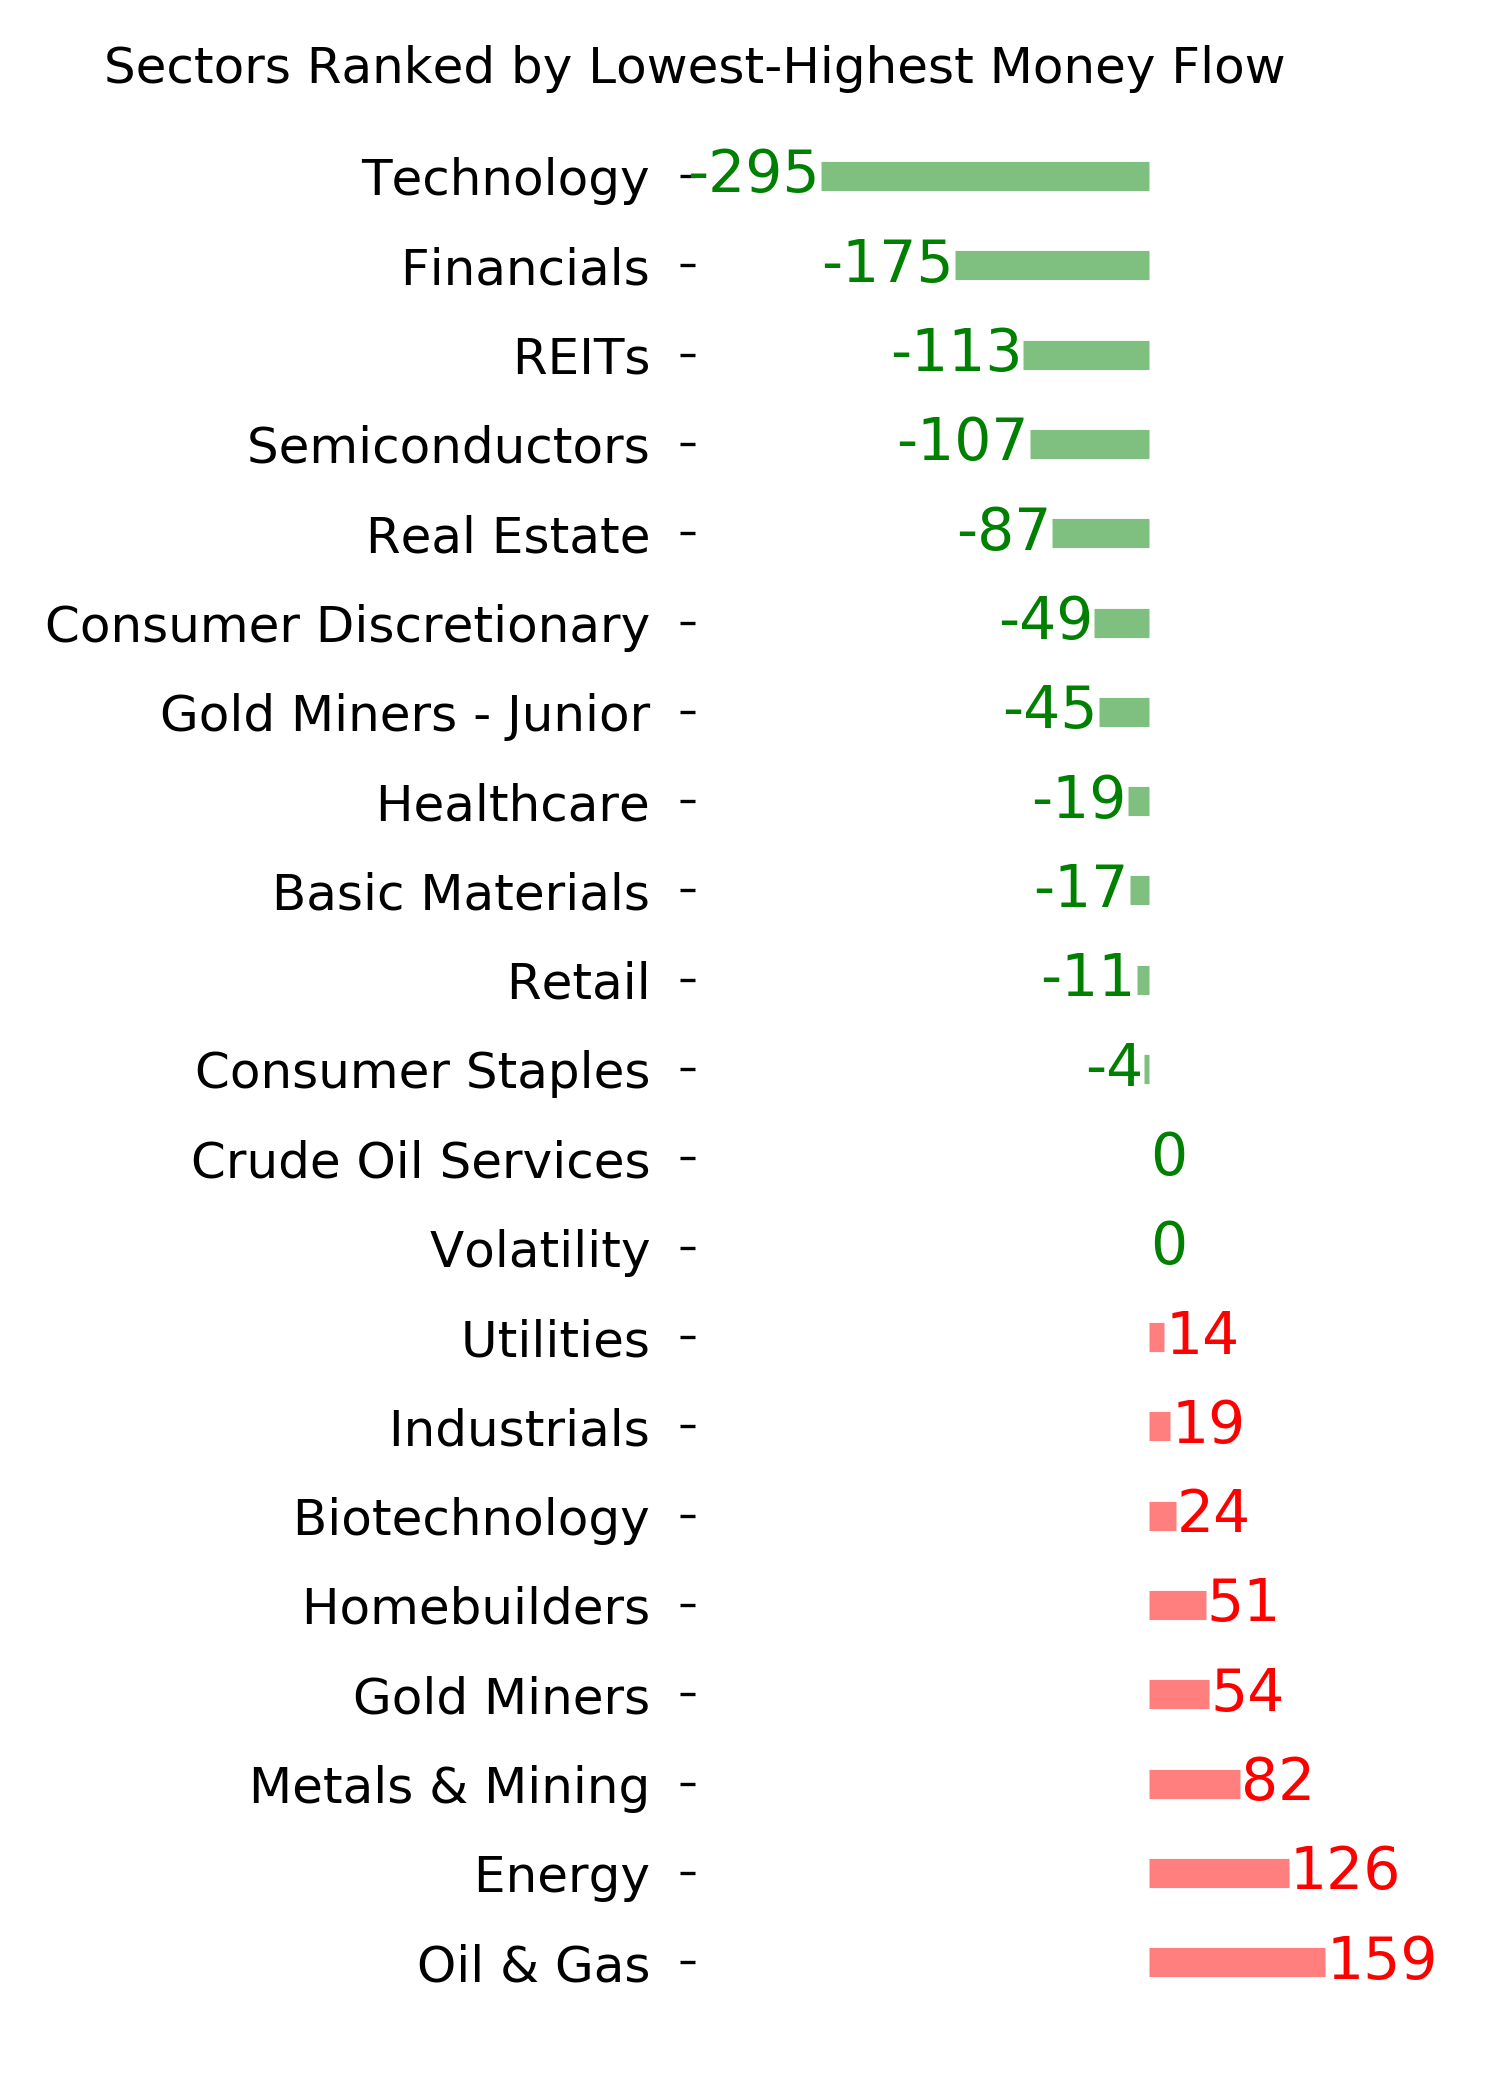
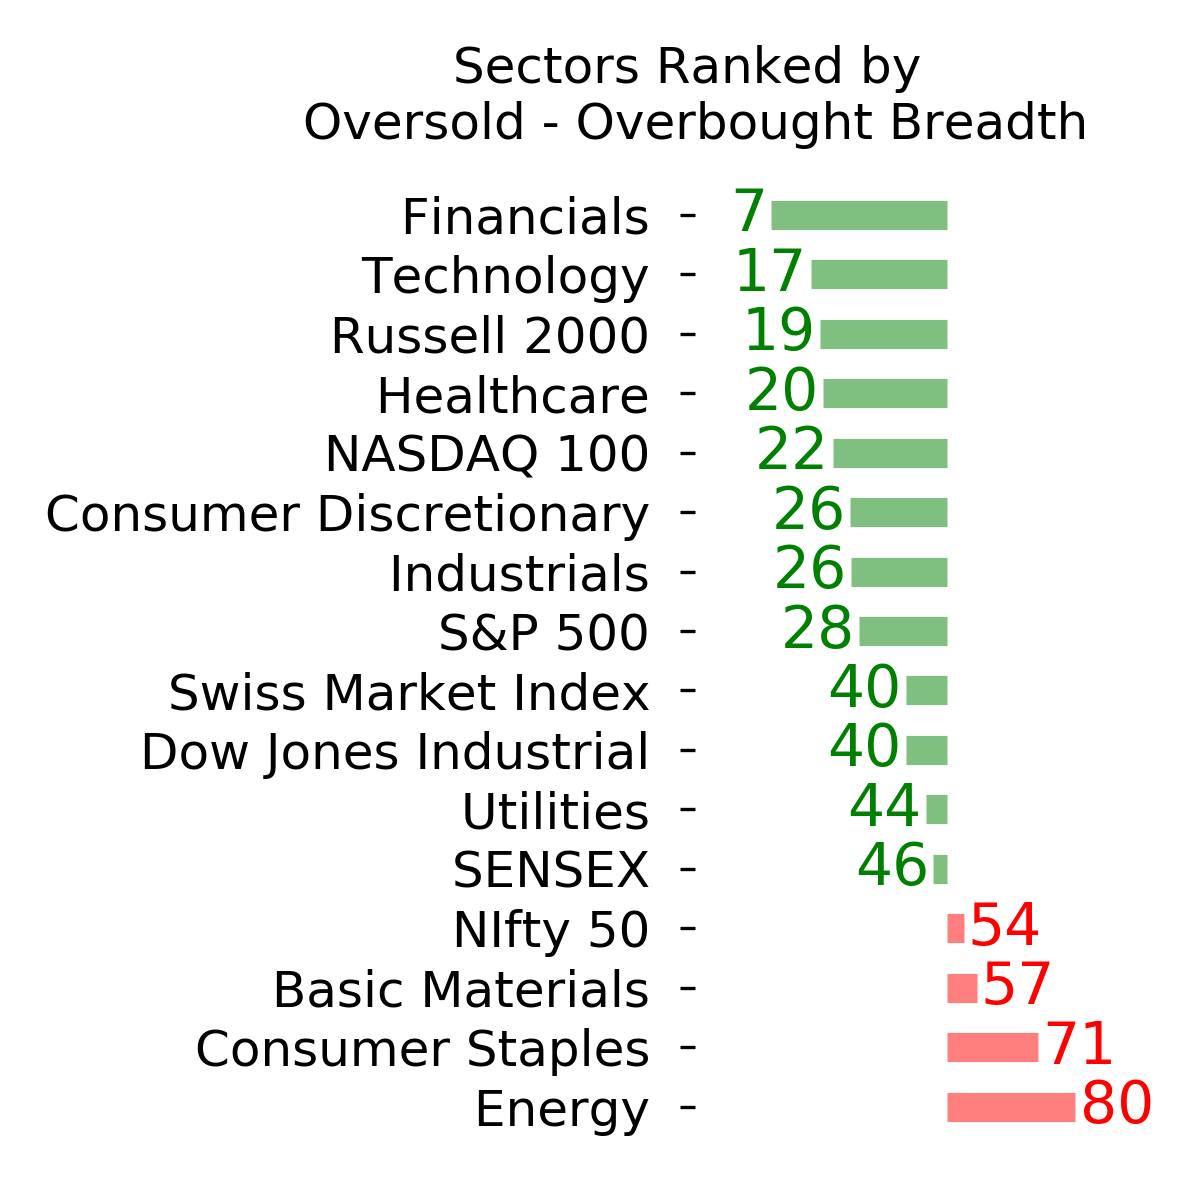
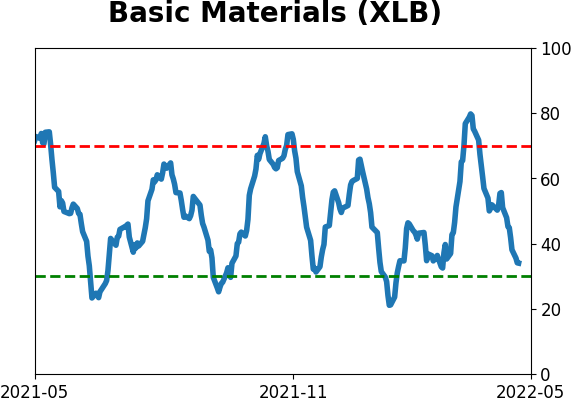
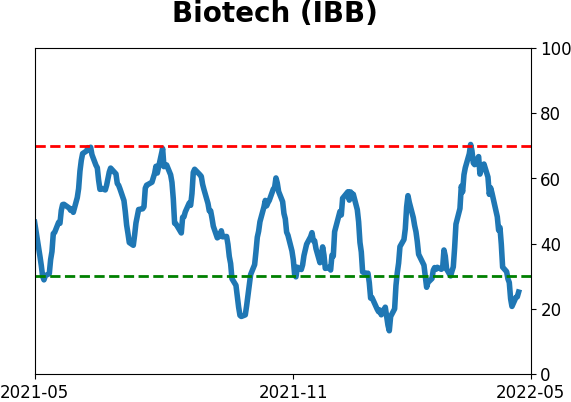
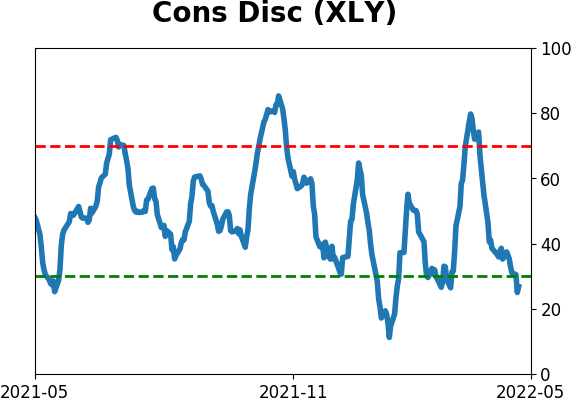
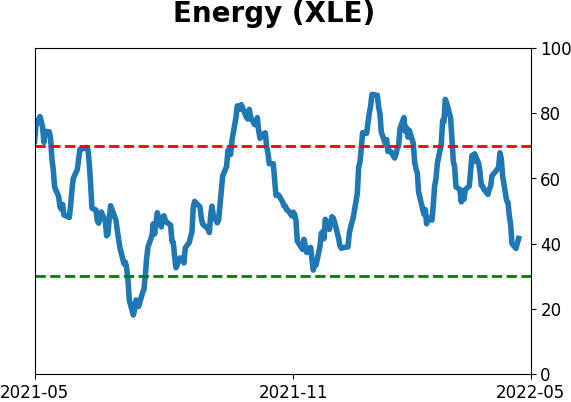
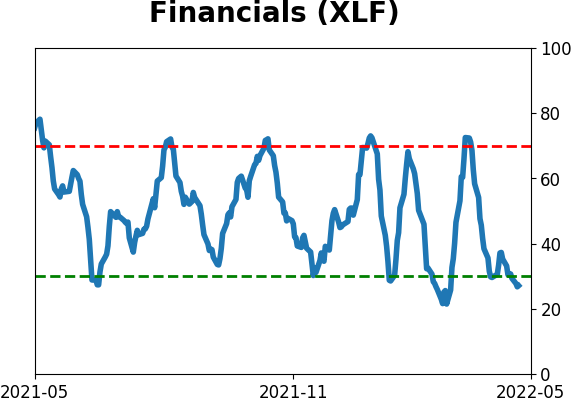
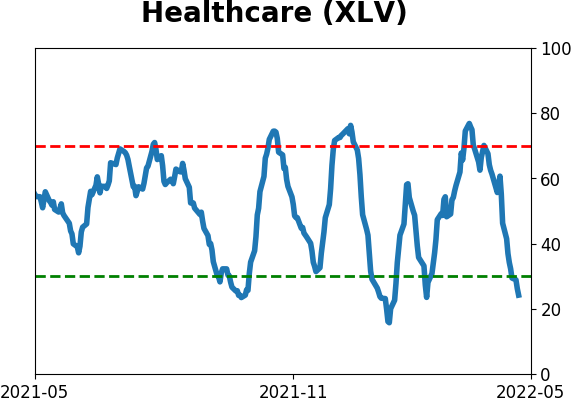
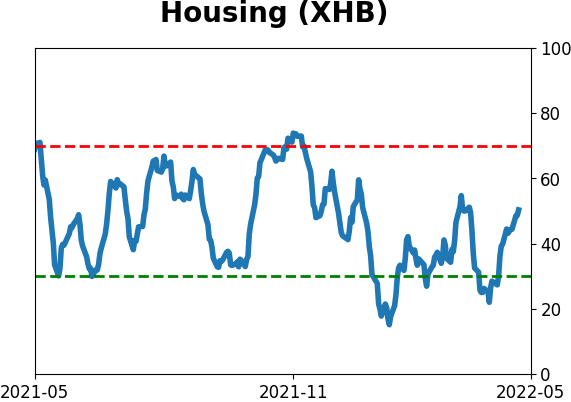
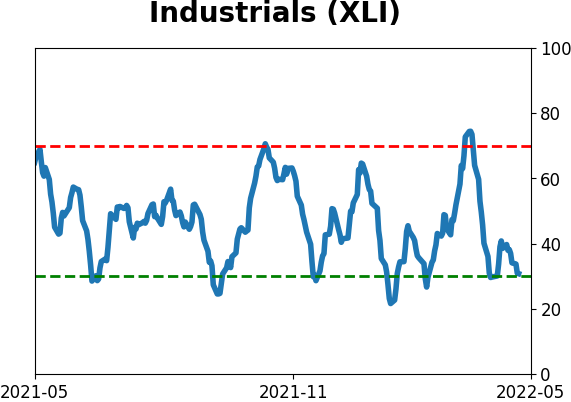
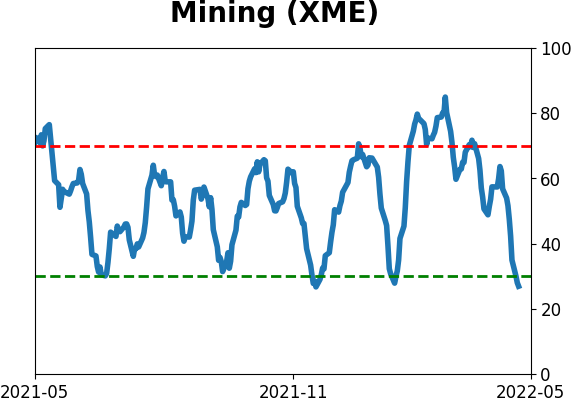
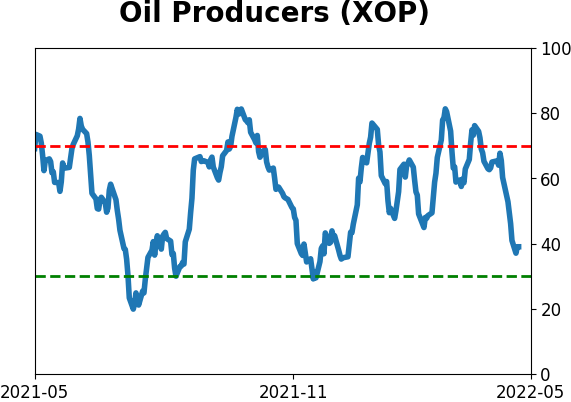
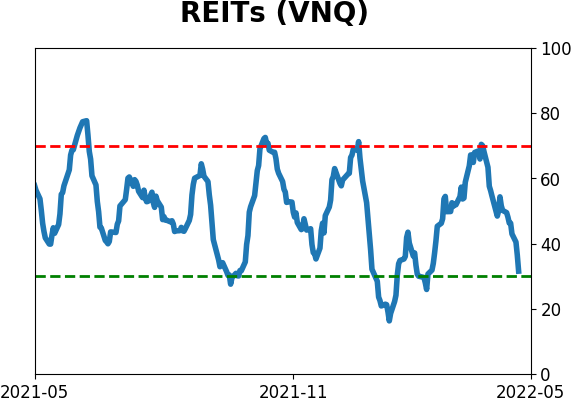
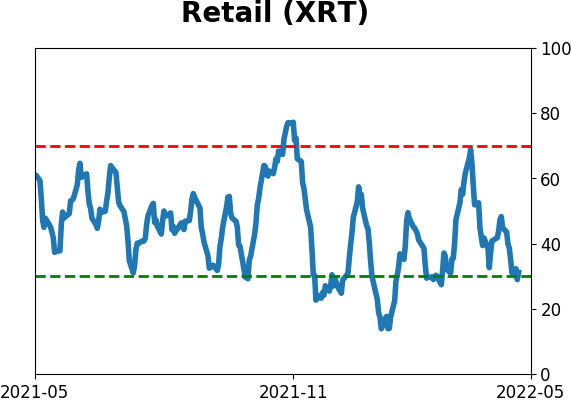
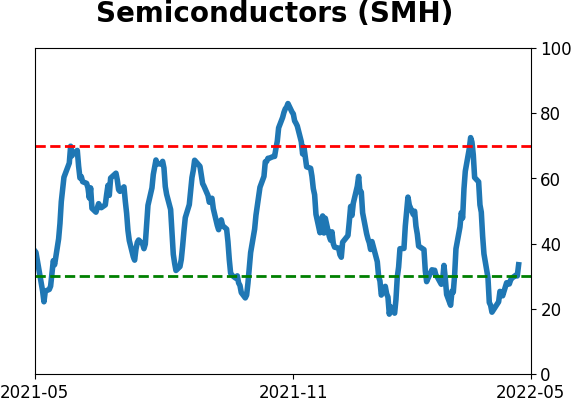
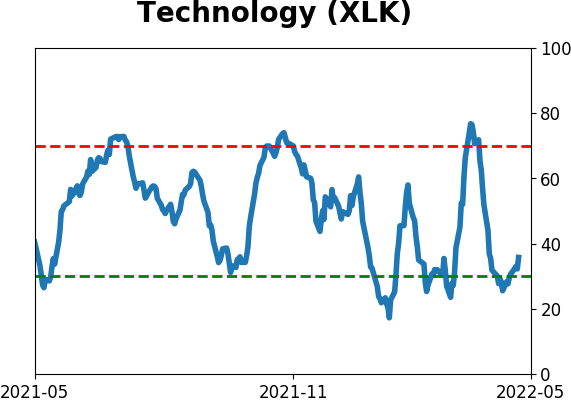
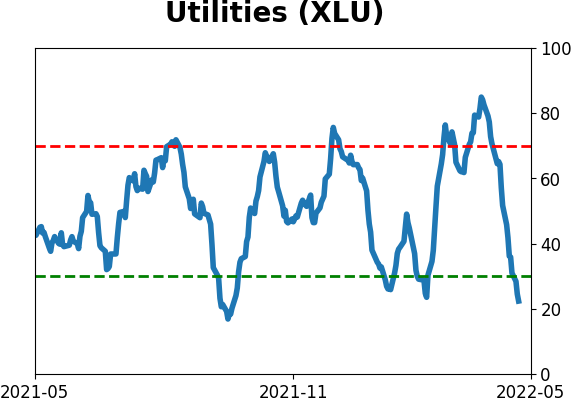
Sector ETF's - 10-Day Moving Average
|
|
|
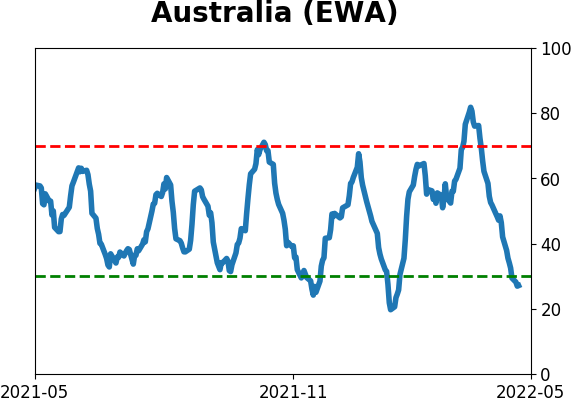
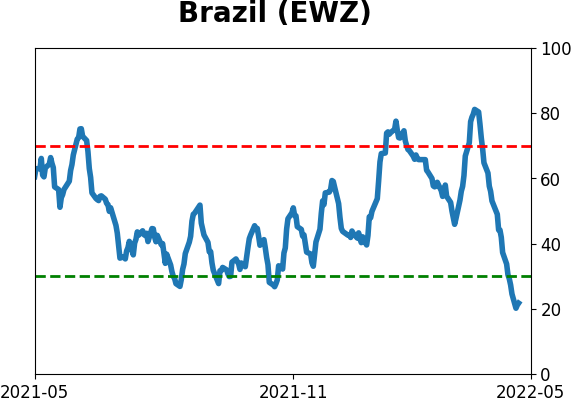
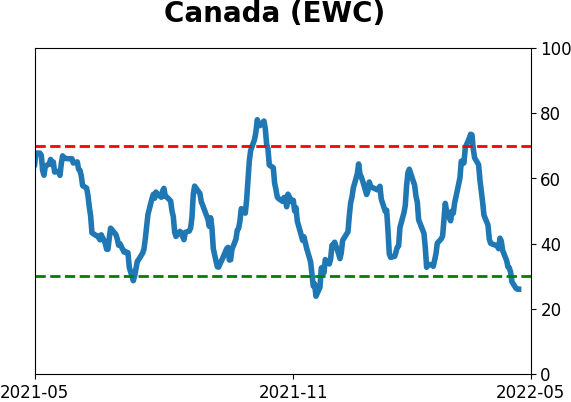
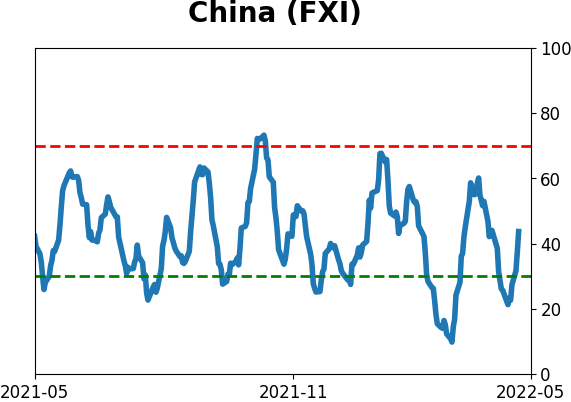
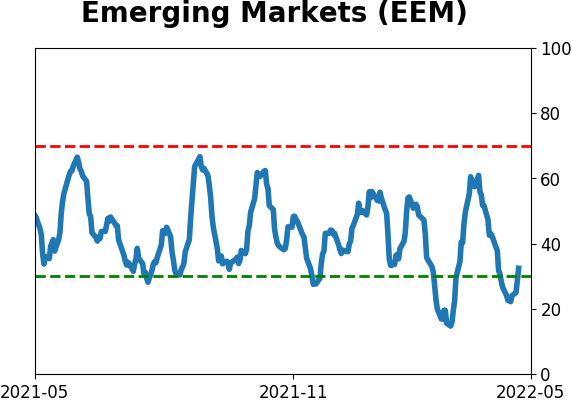
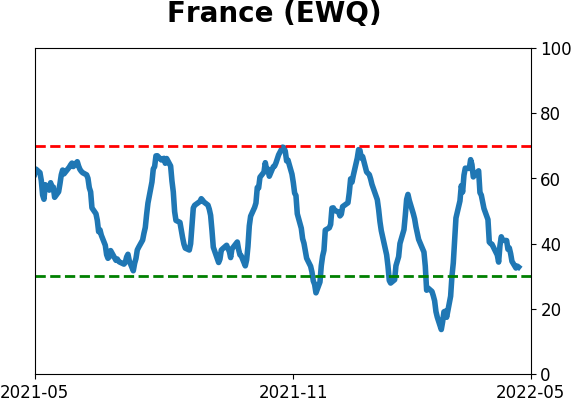
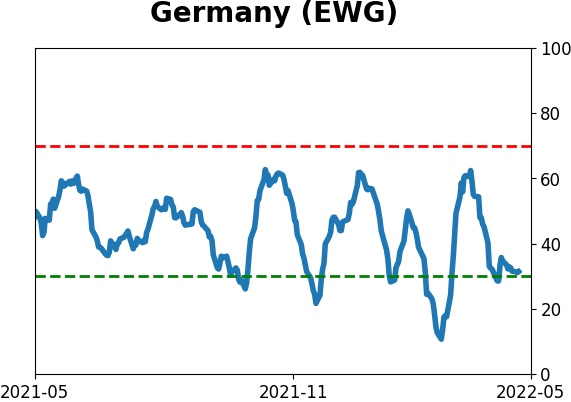
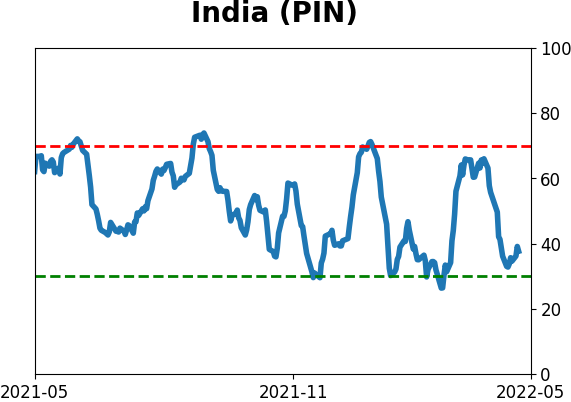
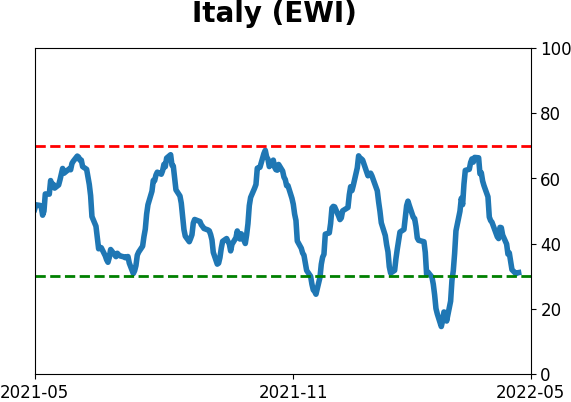
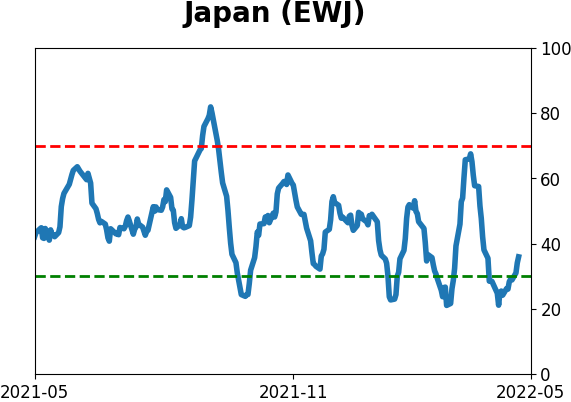
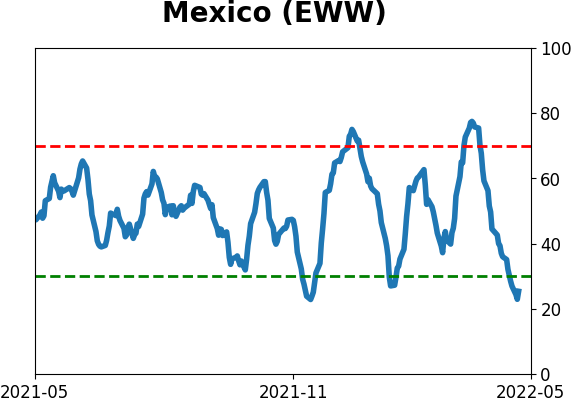
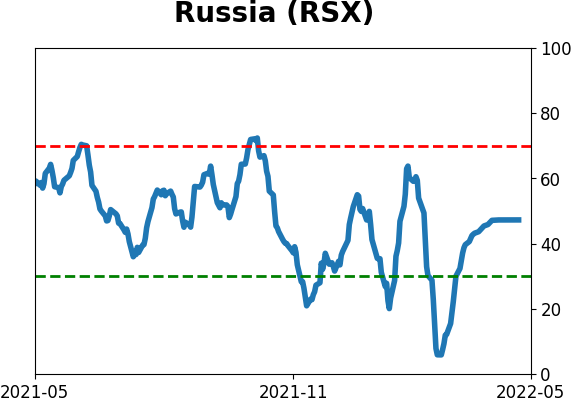
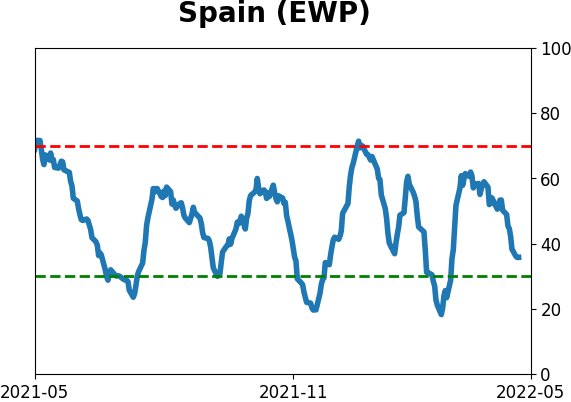
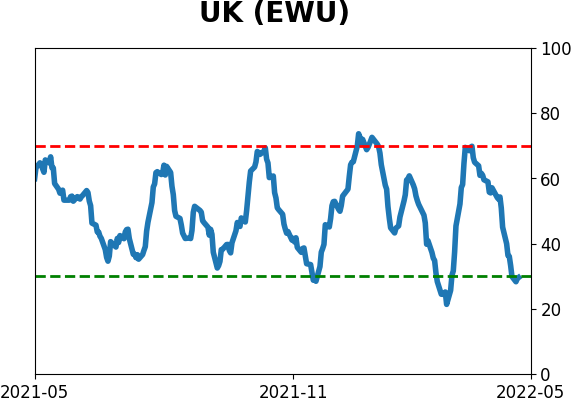
Country ETF's - 10-Day Moving Average
|
|
|
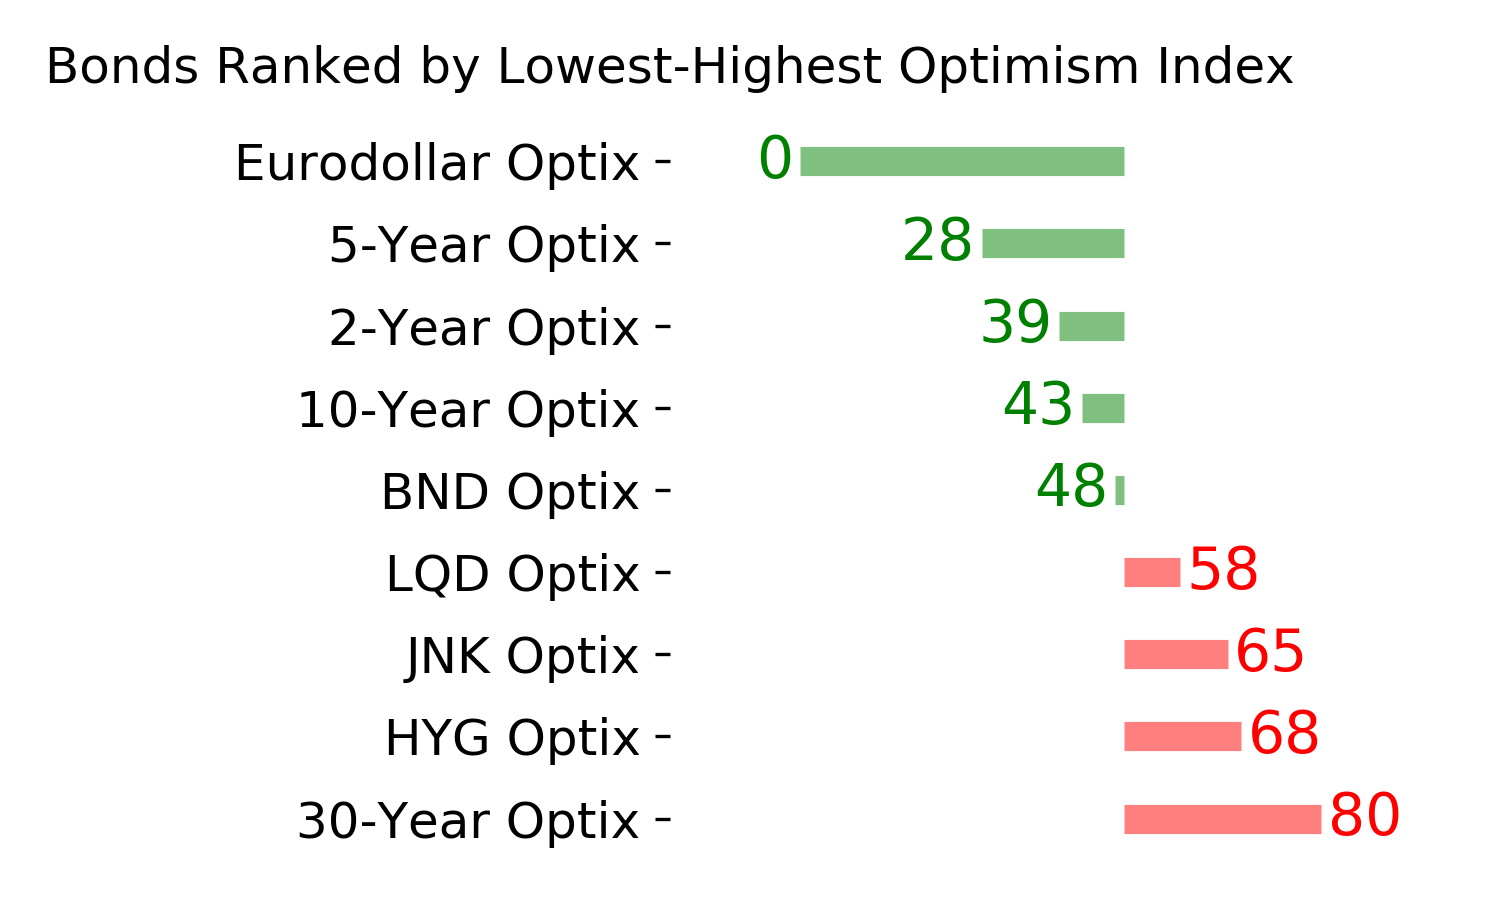
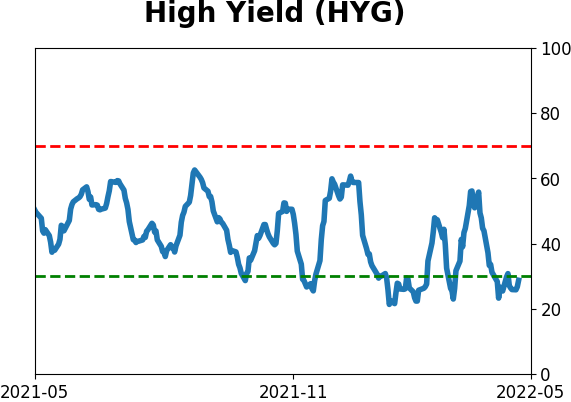
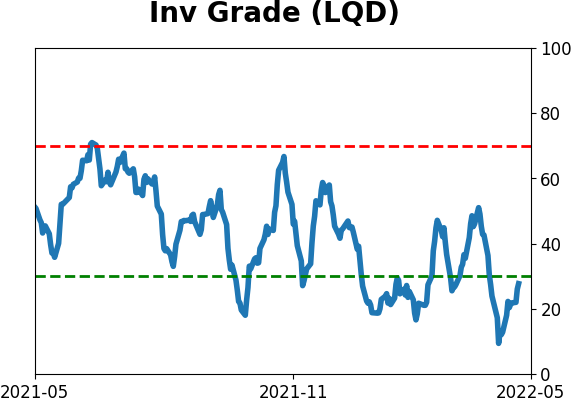
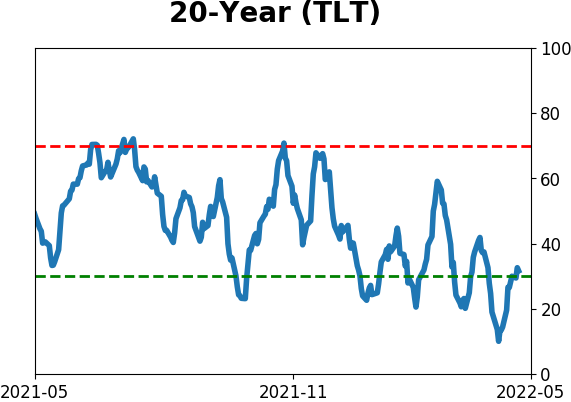
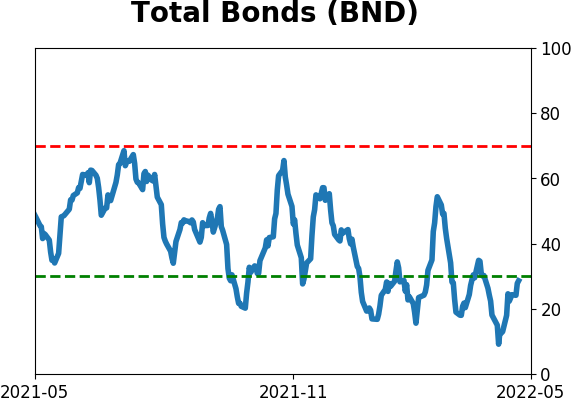
Bond ETF's - 10-Day Moving Average
|
|
|
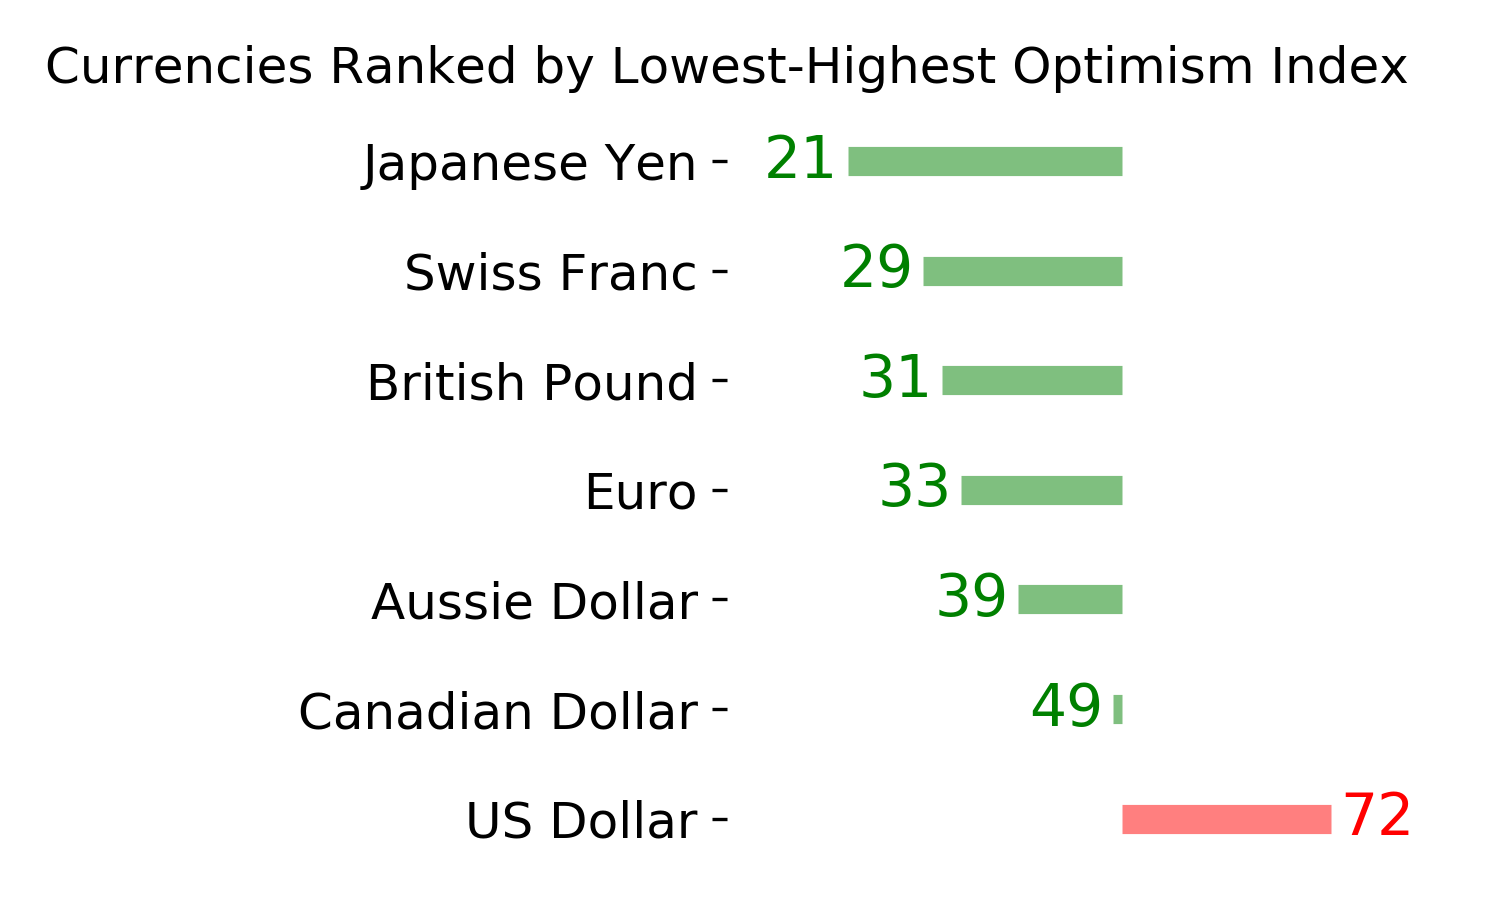
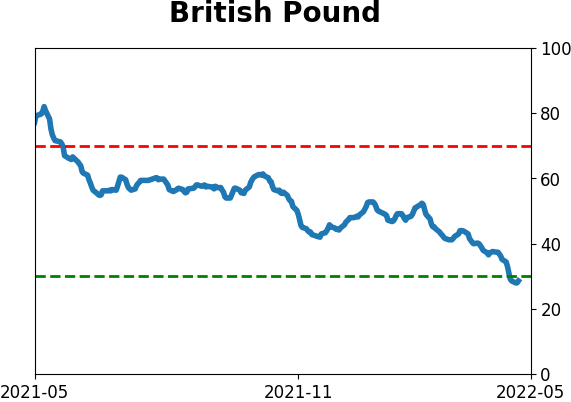
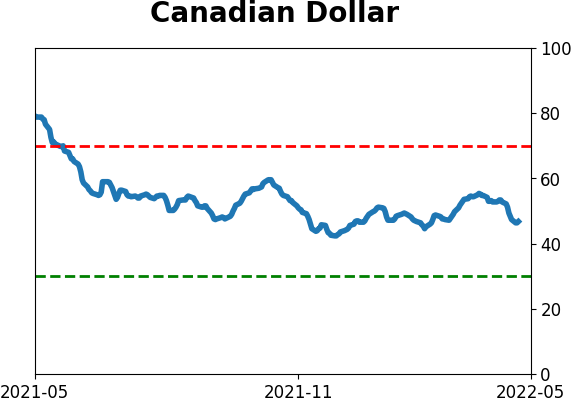
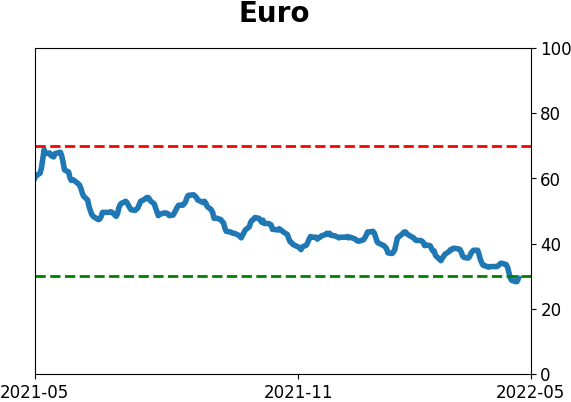
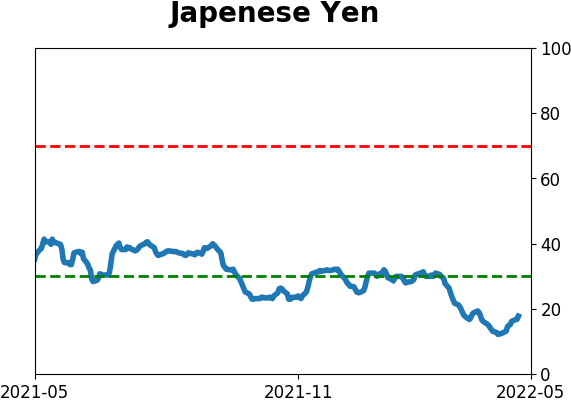
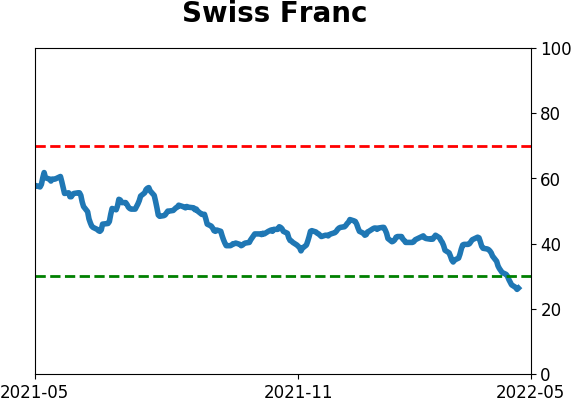
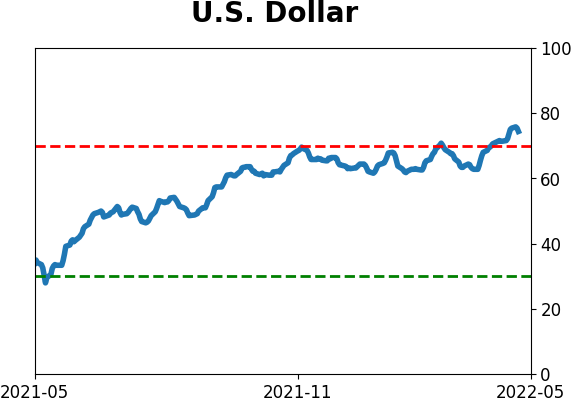
Currency ETF's - 5-Day Moving Average
|
|
|
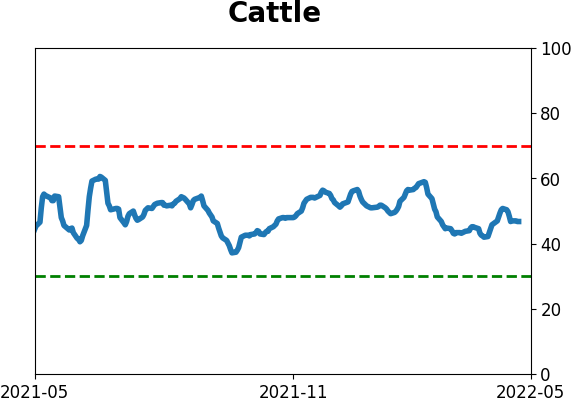
Commodity ETF's - 5-Day Moving Average
|
|