
A piece of the puzzle that has not yet fit into place

Key points:
- It's been more than 200 days since the last surge in net 52-week highs on the NYSE or Nasdaq
- This type of behavior is a hallmark of bear markets, and bulls need to see it change
- On the NYSE, there is still a heavily split market, which consistently precedes poor returns
There has been a lack of a surge in new highs
There have been some nascent signs of buyers eagerly returning to stocks. Indexes have soared, and some breadth metrics are showing quick turnarounds.
One of the critical factors for a healthy market environment and improving sentiment in any sector or index is that the number of issues hitting a 52-week high should outnumber those falling to a 52-week low. Very basic, but very effective.
It has been a struggle to see that on the NYSE or Nasdaq exchanges. It's been even more of a struggle to see any kind of thrust. The NYSE Net High-Low % has been below 10% for more than 200 days. Since last May, there haven't been 10% more securities hitting 52-week highs than falling to 52-week lows.

A run of 200 sessions since the last surge above +10%is the longest since 2018 and ranks among the 20 longest streaks over the past 60 years.
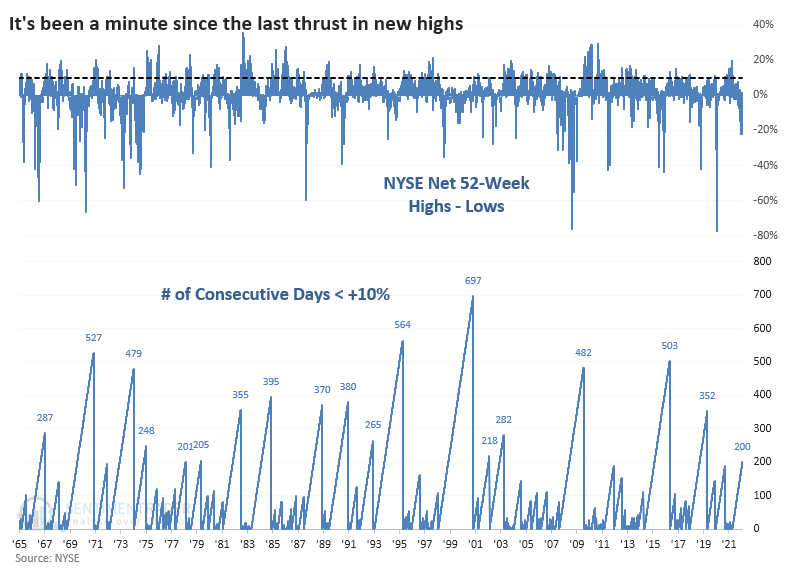
Long streaks without a net new high thrust tended to lead to mediocre returns, and it can be a worry since this is a hallmark of bear markets. We witnessed this behavior before the worst declines in 2008, 2015, and 2018. But it's not so consistent that we can chalk it up as a point in bears' favor - these long streaks also triggered near the bottoms of bear markets a handful of times.

There was a decent correlation (less so in recent years) between short-term and long-term returns. If buyers stepped in over the next couple of weeks, that tended to be a good sign for longer-term returns. But if the weakness just brought out even more sellers or only weak rallies, long-term returns tended to be poor.
It's even worse on the Nasdaq
For the Nasdaq exchange, it's been even more egregious. It's now been more than 200 sessions since the last surge above even +5%.
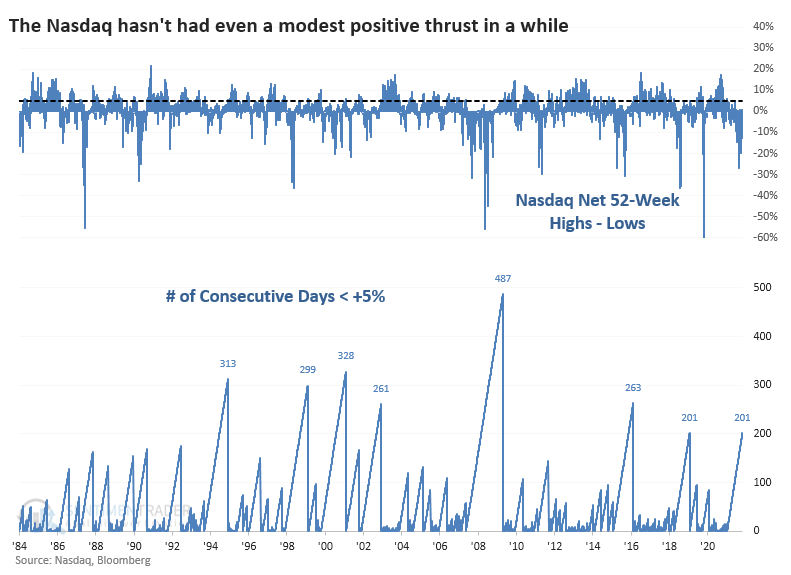
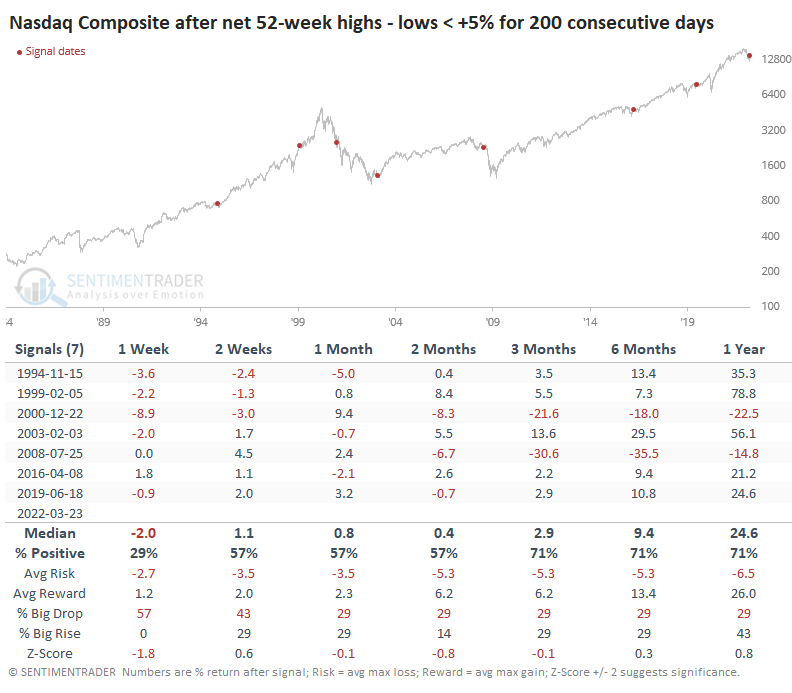
That's been much rarer, with only 7 other streaks this long in the past 40 years. This preceded even more of a binary outcome - either it preceded double-digit gains a year later or double-digit losses (in 2000 and 2008). Unfortunately, there isn't much amid that small sample that would give us a clue as to which outcome we're more likely to see.
The split market is a worry
The battle between 52-week highs and lows hasn't led to a powerful thrust in either direction. But both the number of new highs and new lows has been relatively high, at more than 2.5% of all issues traded on the NYSE.
This split behavior means that the HiLo Logic Index is high. At least it's not at worrying levels on the Nasdaq, having come down from the extremes from last fall.
Bulls should want to see a very low level in this indicator. That means that either there has been an overwhelming surge in 52-week lows (which tends to be a bullish contrary indicator) or an overwhelming surge in 52-week highs (which tends to be a bullish sign of positive momentum).
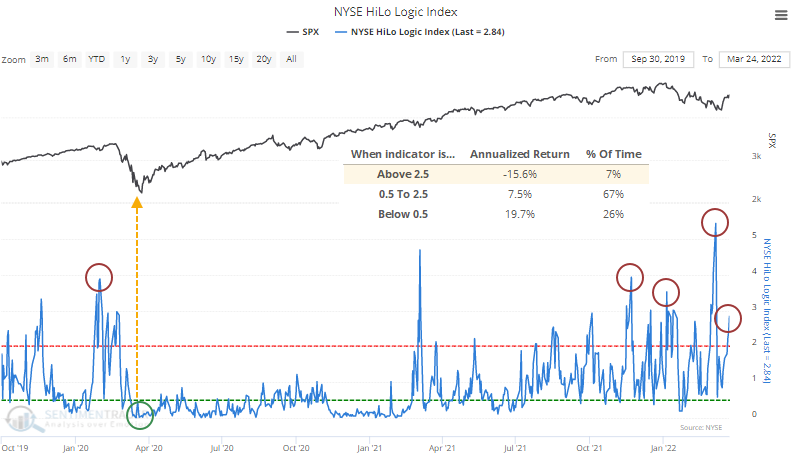
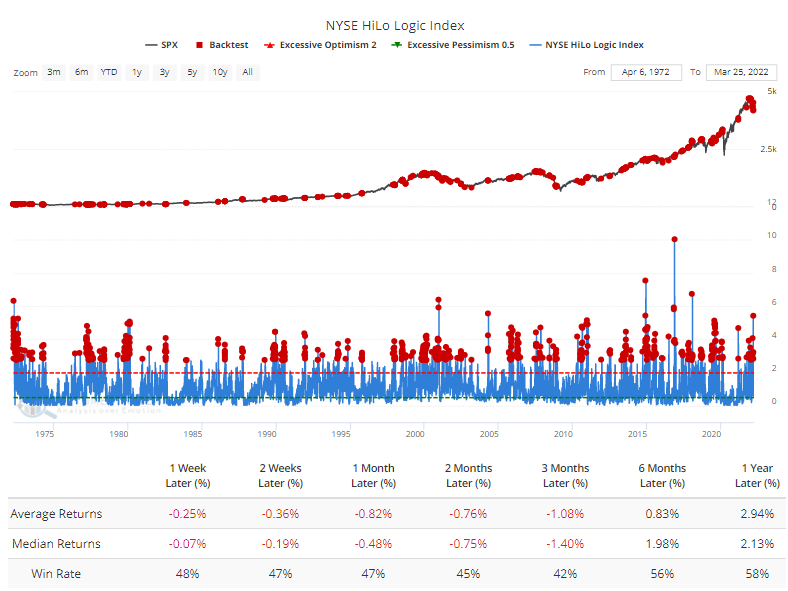
When the HiLo Logic indicator was above 2.5, the S&P 500 returned a horrid -15.6% p.a. That compares to a much more robust +19.7% p.a. when the indicator was below 0.5. The post-pandemic behavior was exactly what bulls should want to see, with an extremely high level - a split market - precipitating a market decline that led to a shallow level that stayed low as 52-week lows gave way to 52-week highs. There have been no signs of that now.
The Backtest Engine shows that after any day with a reading above 2.75, the S&P's returns were poor up to 3 months later.
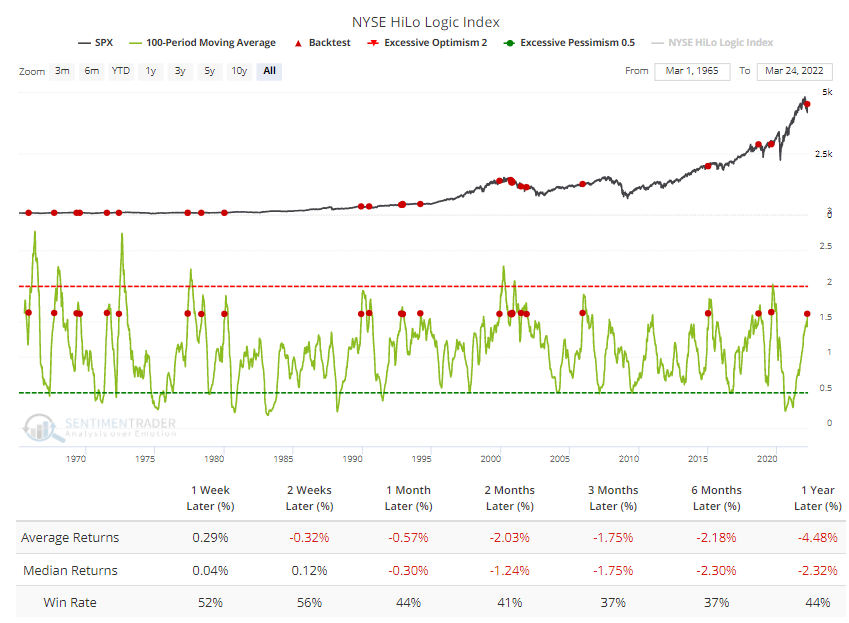
When the 100-day average climbed above 1.6, the Backtest Engine showed even worse returns. This is a headwind for our current environment.
What the research tells us...
The behavior we've looked at over the past few weeks has been pretty clear that the risk/reward for stocks appeared to favor the upside over a time frame of several weeks to months. Strong follow-through last week was another good sign, and we haven't seen too much that argues against it. We need to be watchful for signs that this could be just a temporary rally within an unhealthy environment, and there are certainly signs that's the case. What would change that probability is a sustained and more impressive surge among a broader array of securities - not just stocks but also high-yield bonds. So far, that's been lacking.