Headlines
|
|
Weekly Wrap for Apr 9 - Still no divergence warnings:
This week, we saw that sentiment remains elevated, but we're still not seeing consistent divergence warnings, a theme for months now. Some sectors are entering seasonally favorable periods, as sentiment on the yen dips into pessimistic territory.
The latest Commitments of Traders report was released, covering positions through Tuesday: The 3-Year Min/Max Screen shows that "smart money" commercial hedgers didn't make any major moves following the Good Friday holiday. Most of the contracts that were at extremes showed modest reversals in positioning. In the major equity index futures, hedgers moved back to an almost neutral position but curiously remain net long. They reduced their exposure to precious metals, but are well above their large short exposure from January. A pullback in some agriculture contracts prompted them to cover some shorts, but they're still holding aggressive short exposure there.
Updating weekday returns: In Thursday's note, Why it has paid to buy on Thursday and sell on Tuesday, we highlighted the difference in returns if someone held SPY overnight versus during the day. I was unclear in the note that the day session included the entire day, however, so I've updated the charts to include ONLY the return from the open of regular trading to the close of regular trading.
Bottom Line:
See the Outlook & Allocations page for more details on these summaries STOCKS: Weak sell
The extreme speculation registered in January and February is starting to get wrung out. Internal dynamics have mostly held up, so a return to neutral sentiment conditions would improve the forward risk/reward profile substantially. We're still a ways off from that. BONDS: Weak buy
Various parts of the market have been hit in recent weeks, with mild oversold conditions. The Bond Optimism Index is now about as low as it gets during healthy bond market environments. Fixed income isn't responding well, so that needs to be monitored in case it's transitioning to a longer-term negative market environment. GOLD: Weak buy
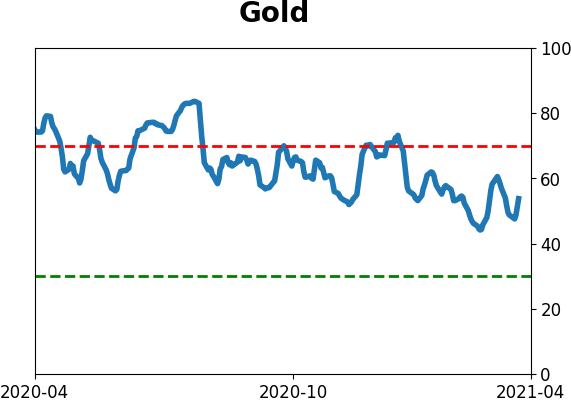
A dollar trying to rebound from a severe short position has weighed on gold and miners. The types of signals they've given in recent weeks, within the context of their recent surge, have usually resulted in higher prices over a medium- to long-term time frame. Like bonds, gold and miners aren't responding very well, and this needs to be monitored.
|
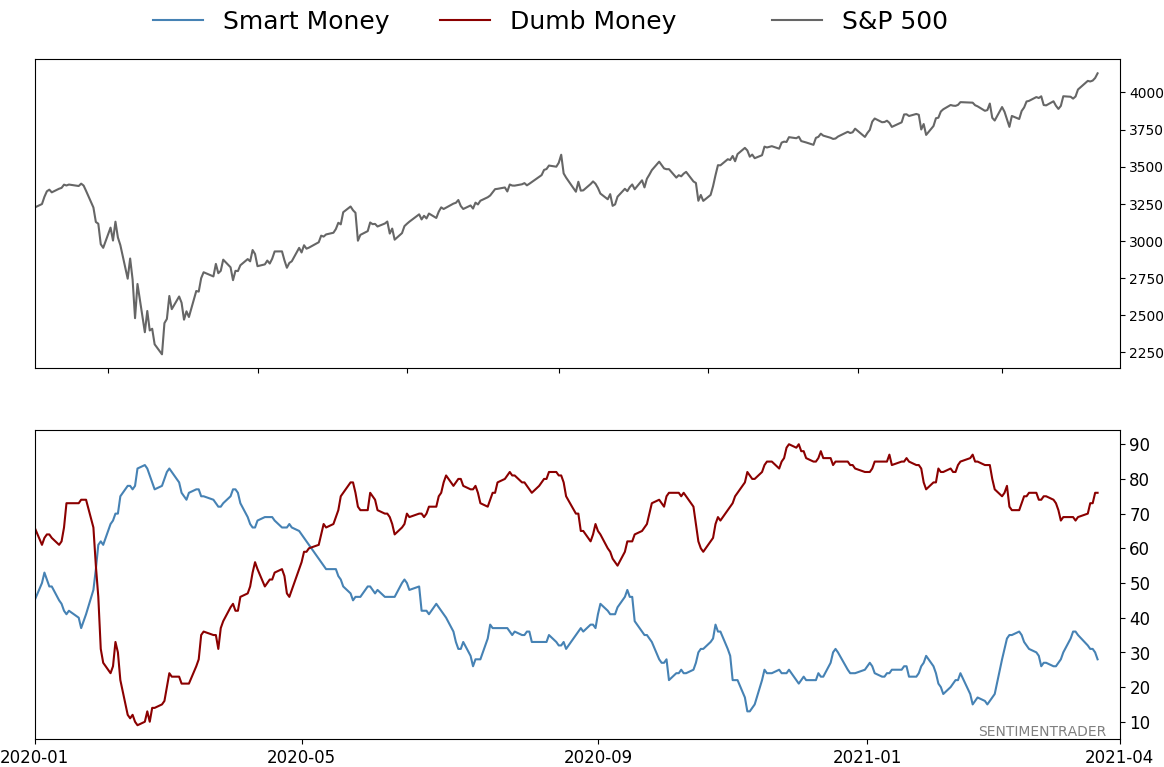
Smart / Dumb Money Confidence
|
Smart Money Confidence: 28%
Dumb Money Confidence: 76%
|
|
Risk Levels
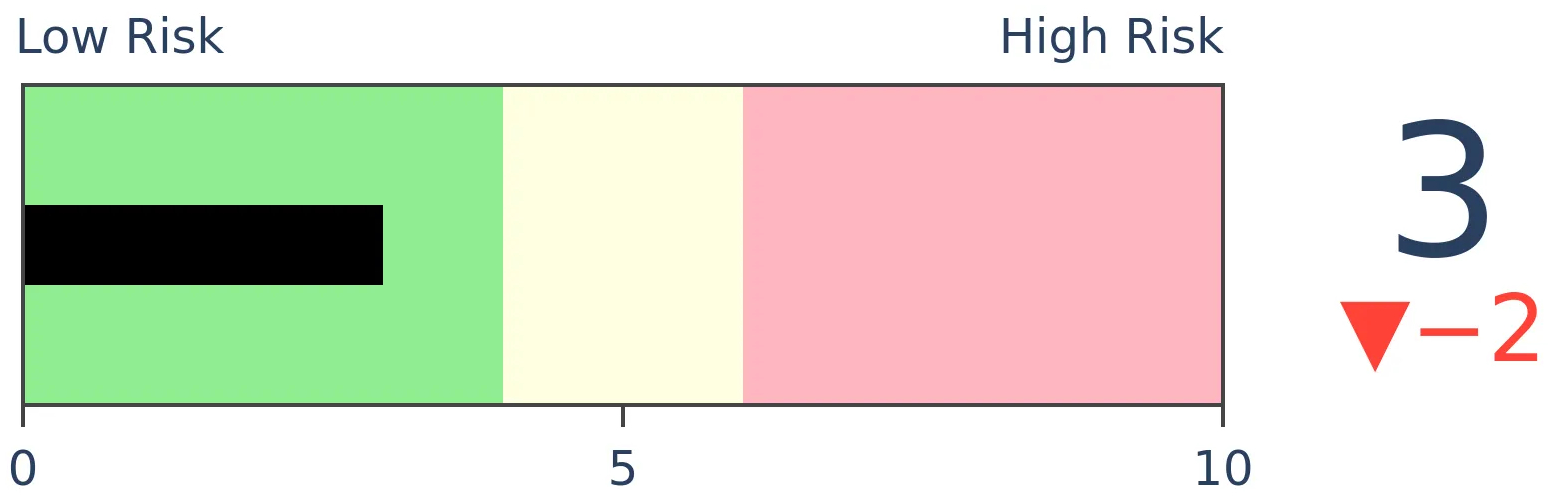
Stocks Short-Term
|
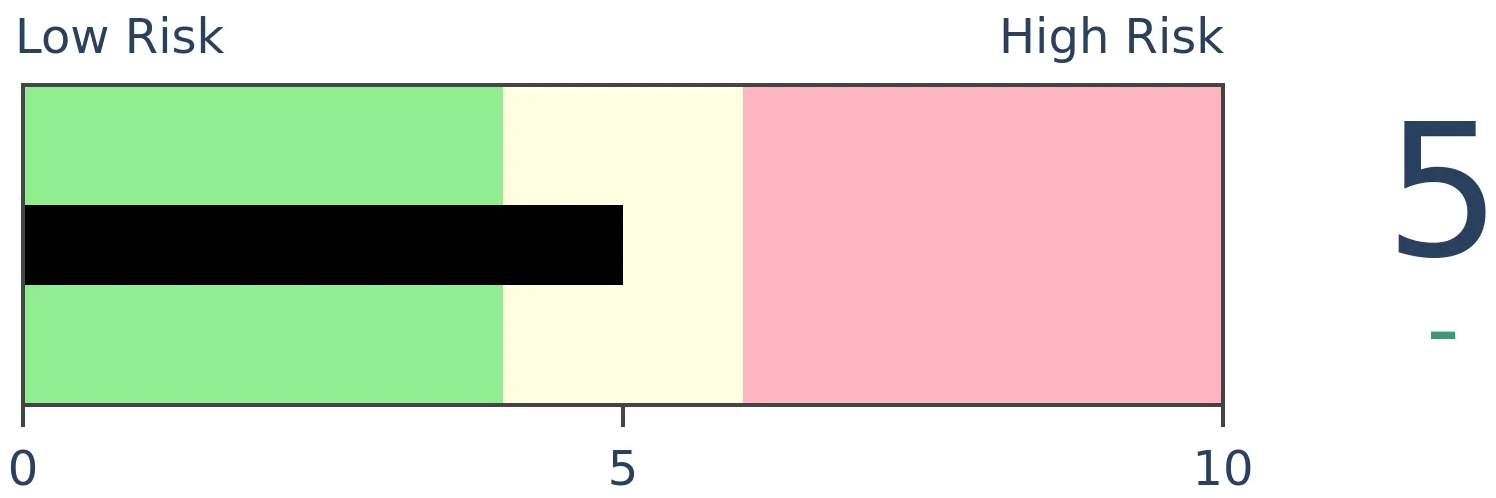
Stocks Medium-Term
|
|
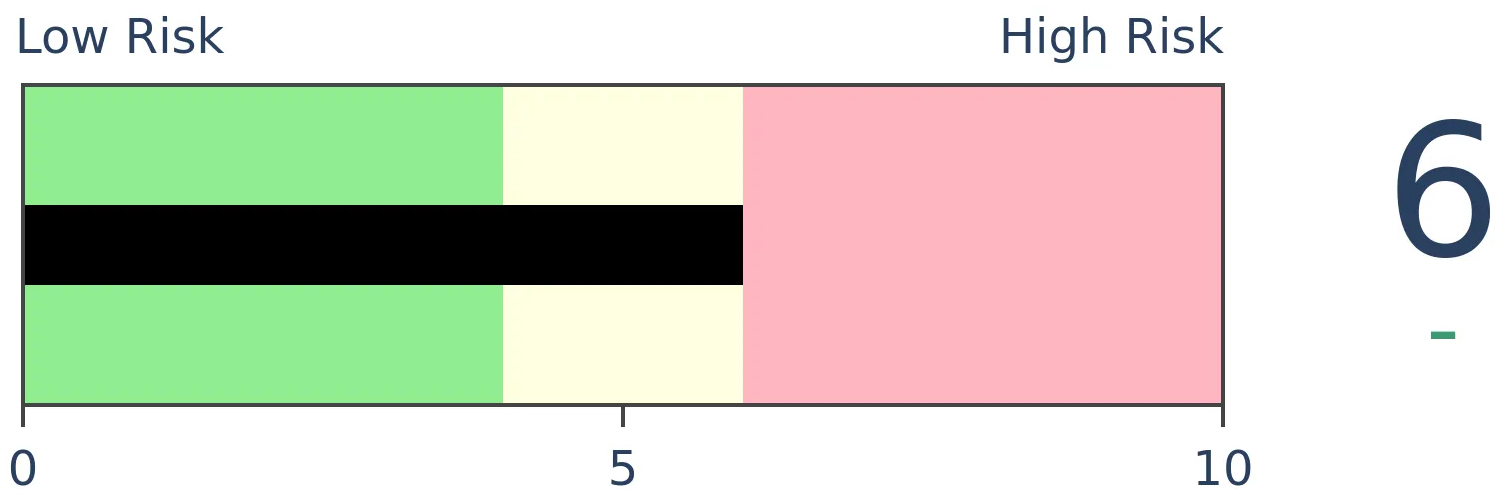
Bonds
|
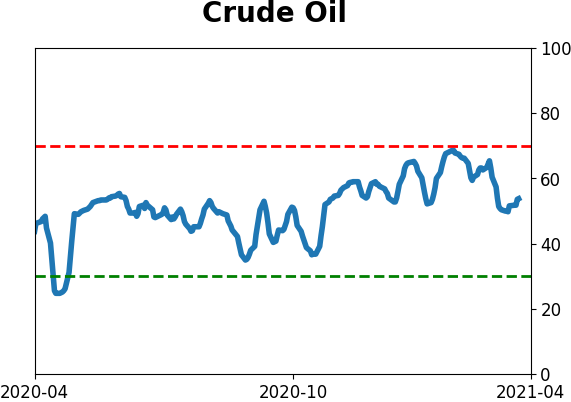
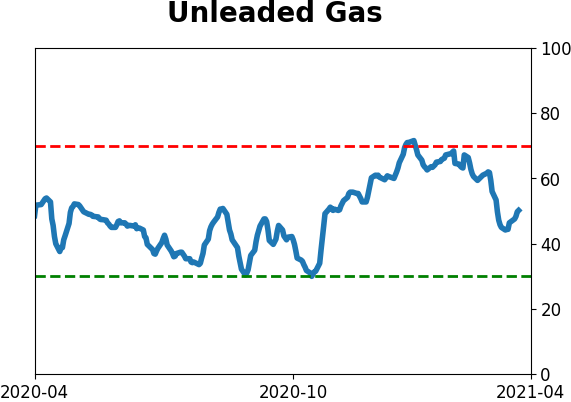
Crude Oil

|
|
Gold
|
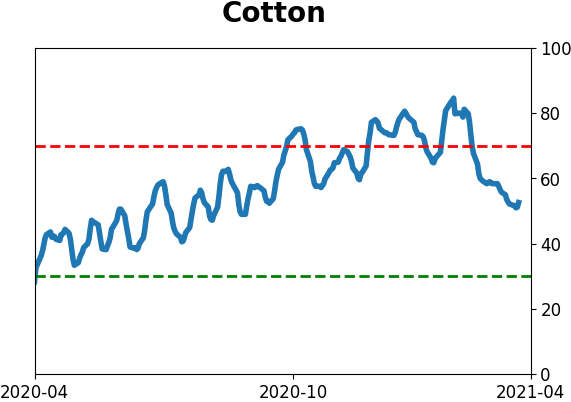
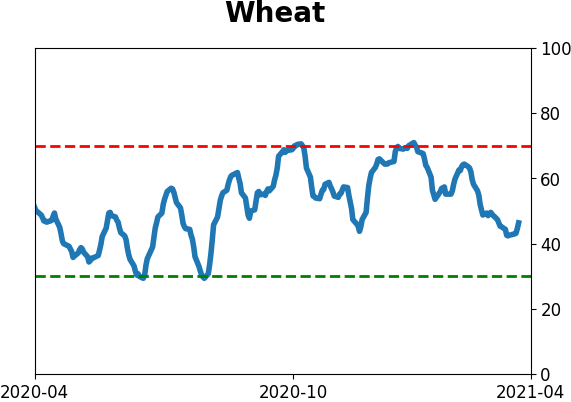
Agriculture
|
|
Research
BOTTOM LINE
This week, we saw that sentiment remains elevated, but we're still not seeing consistent divergence warnings, a theme for months now. Some sectors are entering seasonally favorable periods, as sentiment on the yen dips into pessimistic territory.
FORECAST / TIMEFRAME
None
|
The goal of the Weekly Wrap is to summarize our recent research. Some of it includes premium content (underlined links), but we're highlighting the key focus of the research for all. Sometimes there is a lot to digest, with this summary meant to highlight the highest conviction ideas we discussed. Tags will show any symbols and time frames related to the research.
| STOCKS |
 |
|
|
Little debate that sentiment is still optimistic
Activity in the options market has definitely pulled back from the peak in January when it reached jaw-dropping levels. But in many respects, small trader behavior is still more aggressive than many of the speculative fervors that popped up over the past 20 years, in the most leveraged instruments.
The Option Speculation Index, but looking at only the activity of the smallest traders, rose last week. Looking only at trades for 10 contracts or fewer, there were 59% more bullish options strategies executed than bearish ones.
Prior to the last 6 months, the only weeks that showed more aggressive small-trader behavior were during the peak of the bubble in 2000, again in October 2007, and for a few weeks in January-February 2020.
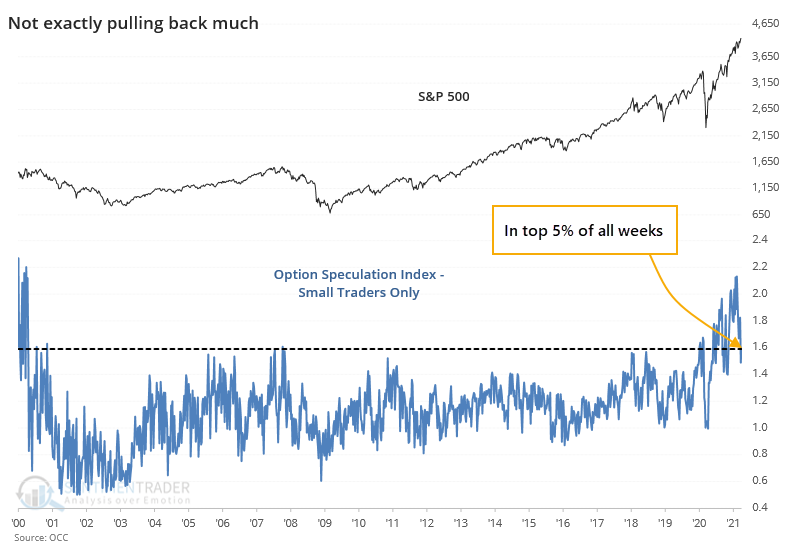
This looks troubling, but it's looked this way for months and yet the S&P 500 just closed at a record high. There has been more churn in many of the most-exposed names, so a rotation to more defensive positioning after the latest surge in speculative activity was beneficial. It just seems premature to declare that "the market" has emerged victorious from a vicious bout of speculative fervor.
Adding to evidence of optimism, the latest release of the Investor's Intelligence survey showed a Bull Ratio of 78.5%, the highest since mid-January. Selling stocks just because this particular survey shows high optimism has not been a great trade-off, though.
The gif below cycles through a scatterplot of forward returns in the S&P 500 for the next 1, 3, 6, and 12 months depending on the value of the Bull Ratio. The R-squared figure gives us a sense of how much the survey predicted forward returns. The higher the R-squared, the more impact the survey (supposedly) had.
We can see from the chart and R-squared that it increased as time went on, with the highest value by far being over the next 12 months. It's still not very strong, but it at least suggests that the survey didn't have all that much impact for shorter-term traders, or really even swing traders.
Jay pointed out the discounting tendency of investors. Many got excited with a high print in the Purchasing Managers survey but at the wrong time.
In the table below we find that while readings above 64 cannot necessarily be categorized as "bearish" for stocks, they are certainly no cause for celebration, with only fair to middling average returns on average in the following year.
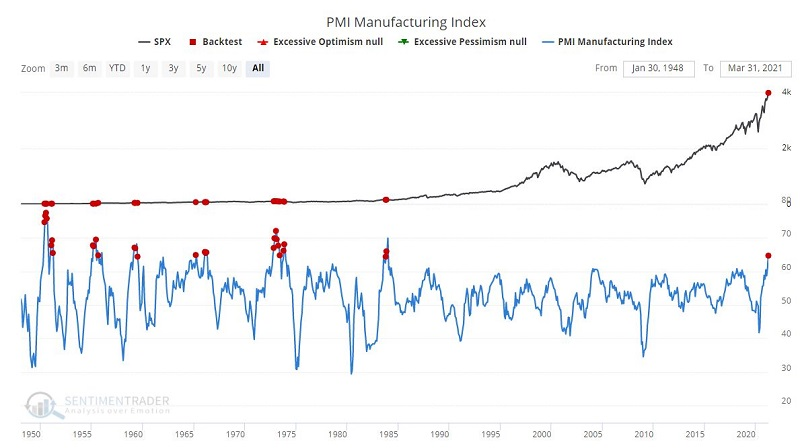
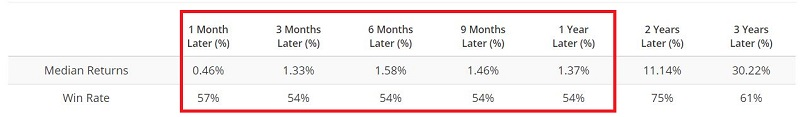
The March 2021 PMI reading of 64.7% is a favorable sign that the economy is performing well. But the results here strongly suggest that most of this good news has already been discounted by the stock market during the rally since the March 2020 low.
In terms of when traders are seeing gains, last May, we saw how stark the difference was between activity outside of regular trading hours versus the daytime session. Excluding transaction costs, a trader would have enjoyed massive gains by buying at the close each day and selling at the open the next day. Someone exposed to stocks only during the day wouldn't have participated in any gains in almost 30 years. I
When putting them all together for the overnight session, we can see just how stark of a difference there is between days of the week. A hyperactive trader would have earned nearly 3x their money holding overnight into Tuesday mornings than they would have by holding overnight into Thursday mornings.
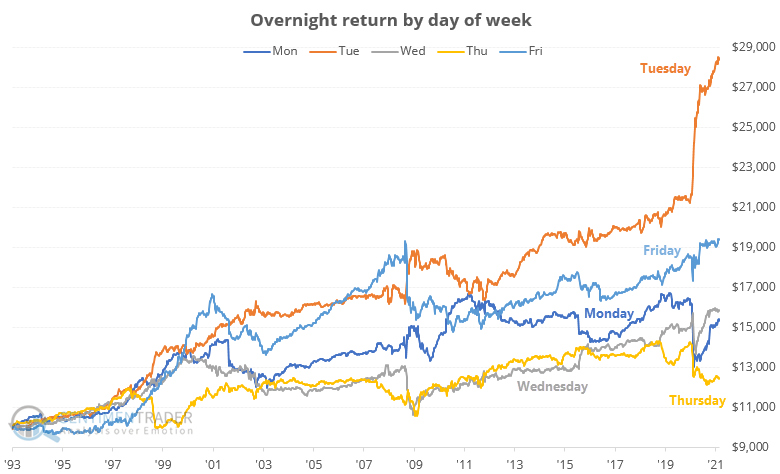
For shorter-term traders, it's remarkable how consistent the bias has been, especially comparing Tuesday to Thursday. So if planning an entry, perhaps waiting for Thursday's close would give a better entry at a lower price, or waiting for Tuesday's close to exit would give sellers an edge. This can, of course, vary wildly from week to week, but over time it has been a consistent enough phenomenon to note.
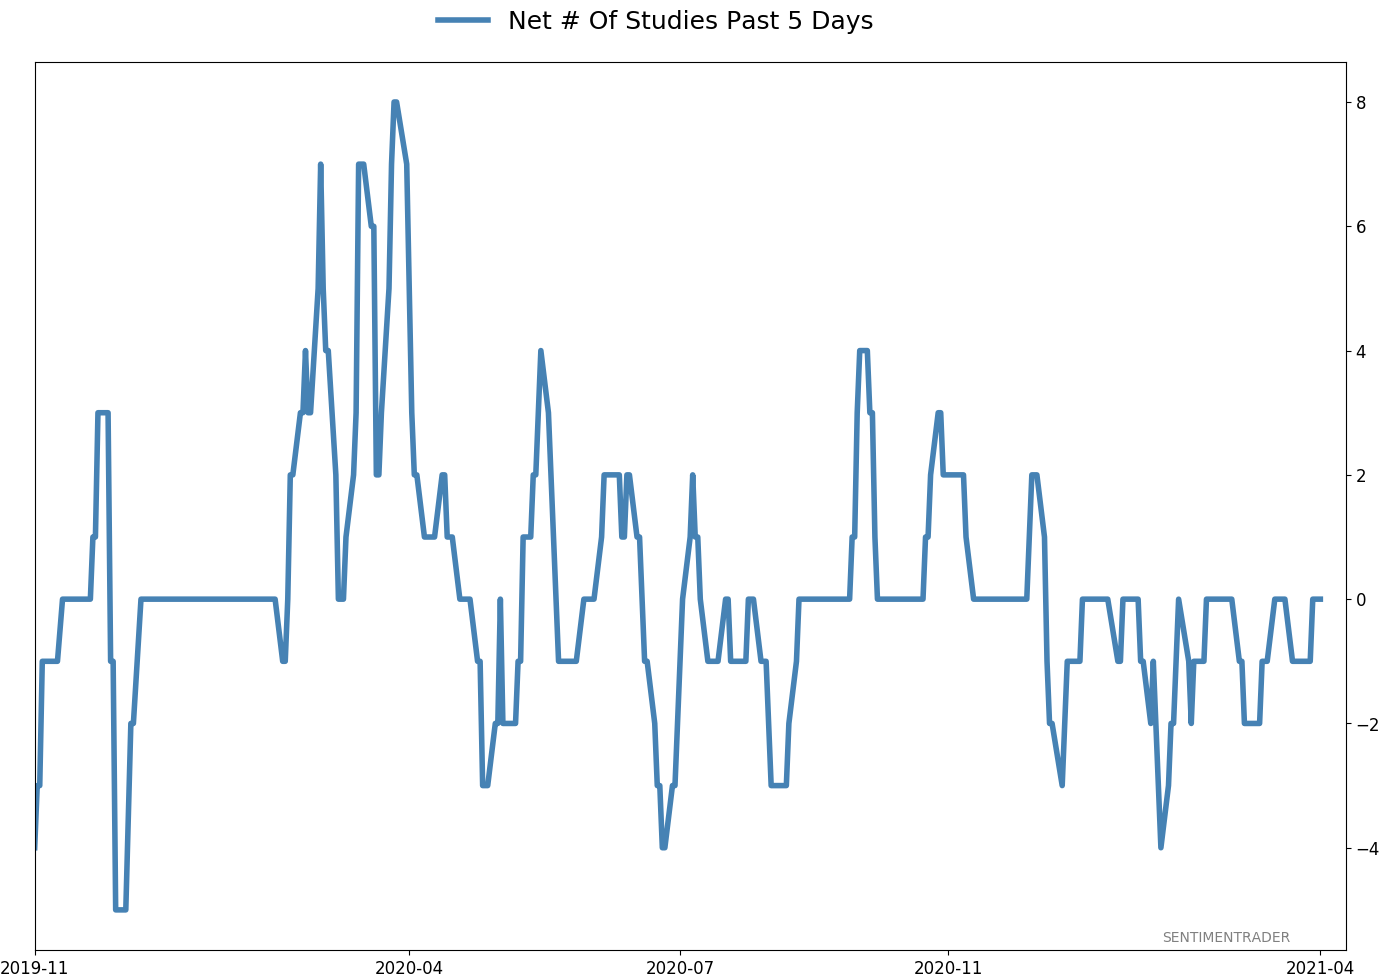
But we're STILL not registering consistent divergence signals
Dean has been updating some of the risk models, which still aren't triggering. Among them is the New Low Spike Model.
The new low spike model seeks to identify instances in history when the percentage of S&P 500 members registering a 252-day low exceeds a user-defined threshold as the S&P 500 Index is still near a 252-day high.
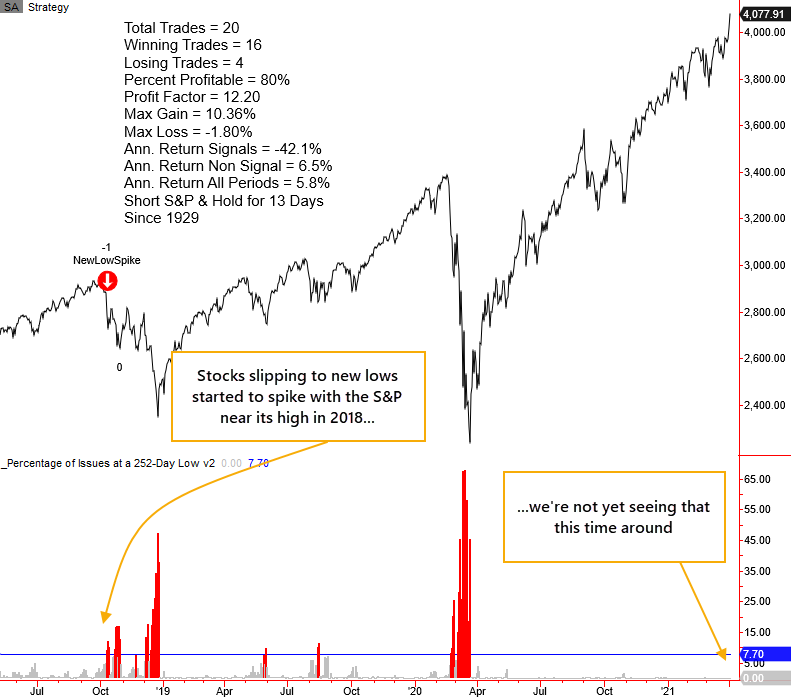
This model is unlikely to trigger a new signal anytime soon as a majority of index members are trading significantly above their lows following the surge off the pandemic low.
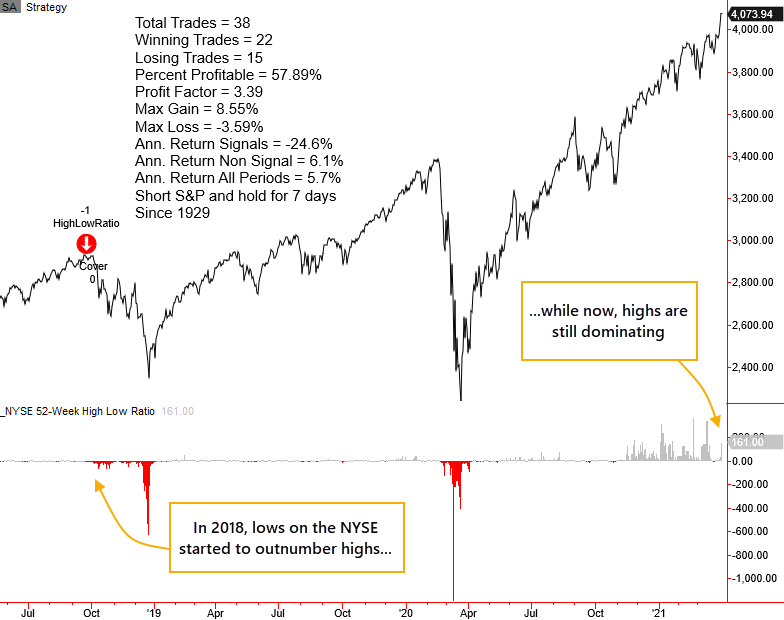
Dean also reviewed a similar model using all issues traded on the NYSE. That model seeks to identify instances when new lows exceed new highs by a certain ratio when the S&P 500 index is trading within days of a 252-day high.
We've been watching carefully for months to see if the extremes in sentiment would lead to a deterioration in participation among stocks and bonds underlying the main indexes. So far, there have been only isolated pockets, and just when it seems like we would get major warning bells, the market recovered.
We track some unique breath measures, not only looking at stocks within indexes but also indexes within groups. And in the past couple of days, those have reached near-record impressiveness. Among industries, sectors, and global indexes, we are now seeing among the best participation on record.
If we average all the positive metrics and subtract the negative ones, then we can get a breadth aggregate. For the 20+ major industries in the U.S., and the 10 major sectors, this aggregate just hit +80, among the highest readings in 30 years.
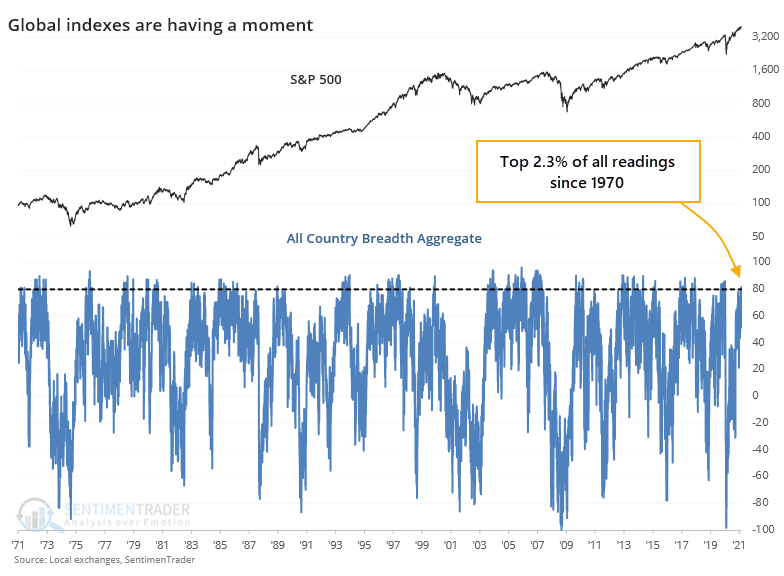
It's not just the U.S. that's participating. Among major global indexes, we're also seeing one of the most impressive thrusts in breadth, this time going back more than 50 years.
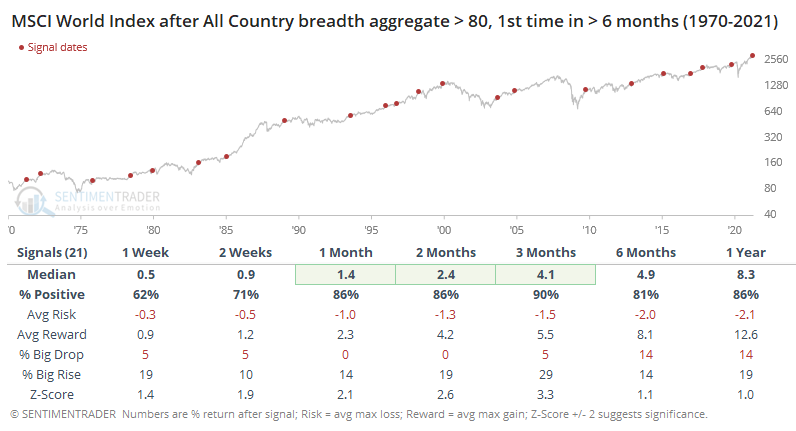
For the MSCI World Index, that preceded further gains over the next 1-3 months almost every time, and those rare losses were extremely small. It's hard to note anything negative about this at all, other than a few of them gave up the gains over the longer-term.
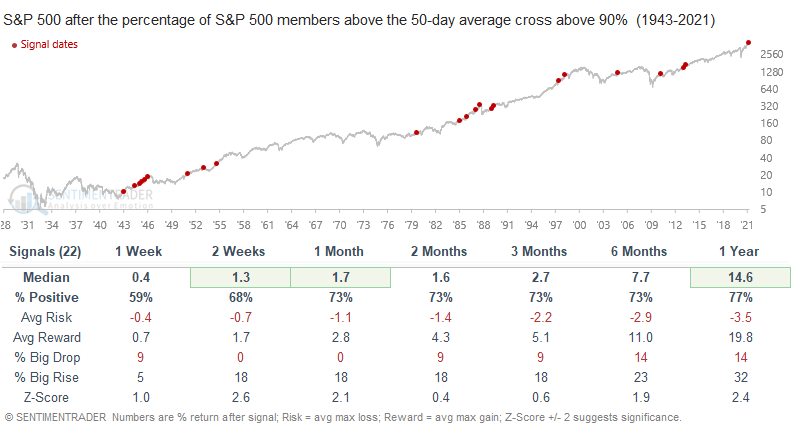
Even within just the S&P 500 itself, Dean noted that more than 90% of members are now trading above their 50-day moving averages. Such a thrust is almost always a great sign to see when coming out of oversold conditions, and while returns were quite a bit less robust when the S&P was sitting at a new high, they were still positive.
So, we're seeing a type of conflict that really hasn't happened before, at least not that we can find. Many of the measures related to thrusts, momentum, and breadth, are the types that only trigger during the first phase of a multi-year bear market recovery. But most of the sentiment-related measures have generated signals that typically only trigger near the ends of multi-year bull markets.
That means there isn't much of a change in the dynamic we've had to wrestle with for months now - impressive, even historic, breadth and momentum that's being met with some of the most optimistic investor behavior on record. A typical market response to lesser conflicts has been choppy conditions in major indexes, with further gains eventually given back. That's been the outlook for a while and seems like it's continuing.
A sector seasonal bias
Jay noted that a certain sector is entering a consistently favorable period.
The Fidelity Select Biotech sector fund is an actively managed fund and does not track an index. For our testing purposes, we will use this fund as a proxy for the biotech industry.
FBIOX started trading in December 1985. The seasonally favorable period we will consider extends from the close on April trading day #10 through the close on June trading day #3.
The chart below displays the cumulative % price return for FBIOX during this period from 1986 through 2020.
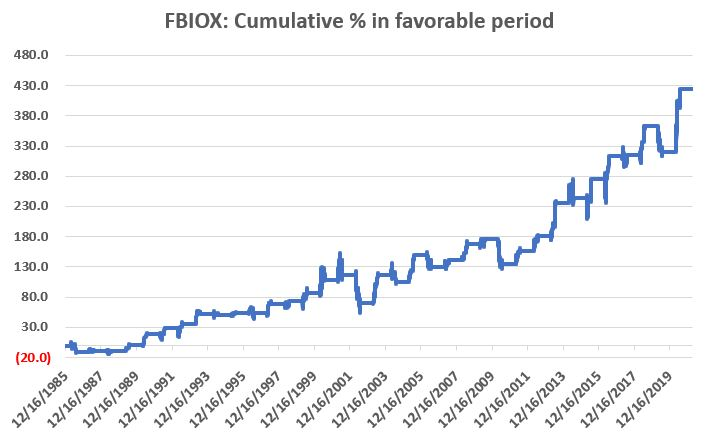
This favorable period in 2021 extends from the close on 4/15 through the close on June 3rd. Does any of this mean that biotech stocks are set to move higher? Not necessarily. But historically speaking, during the upcoming timeframe that's been the way to bet.
Jay pointed out that the bond market has been a terrific wealth generator over the last almost 40 years as interest rates have declined from over 15% to less than 1%. Unfortunately, there is no way for this performance to be duplicated in the years ahead. As a result, "picking one's spots" in the bond market will take on added importance in the years directly ahead.
Over the past roughly 50 years the bond market has operated on a roughly 45-month cycle. Within the last roughly 40 years this cycle has played out within the context of a longer-term bull market due to the aforementioned long-term decline in interest rates.
The chart below displays the cumulative total return for the long treasury bond index ONLY during "Less Favorable" months from August 1973 through March 2021. The total cumulative gain during Less Favorable months was +105%.
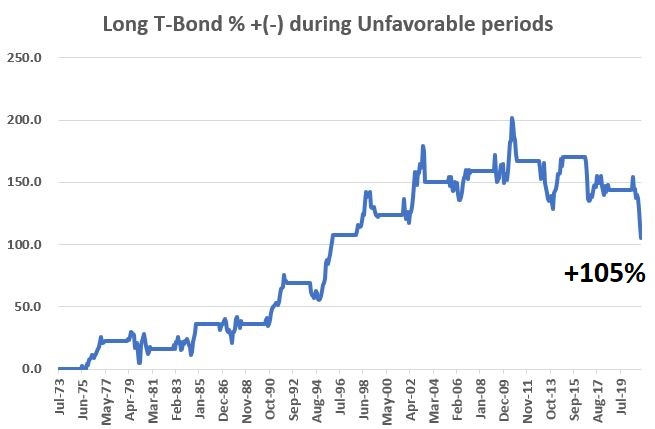
It would be incorrect to deem these results as outright "bearish". A gain of 105% is a gain of 105%. However, if you were looking to maximize your profitability in bonds you would clearly have favored the first 22 months of the 45-month cycle. This particular Less Favorable phase will last through the end of April 2022
Does this mean t-bonds cannot rally in the days, weeks, and months ahead? Not at all. But at least for the next 12+ months, any rally in bonds will be into the headwind of the 45-month cycle.
| COMMODITIES |
|  |  |
Jay has been discussing seasonality for oil and oil stocks in April. Many traders use funds like DBO as a proxy.
Futures or energy stocks are often a more "pure" investment, but in this piece, we will look at the performance of an ETF substitute. As our proxy, we will use ticker DBO (Invesco DB Oil Fund), which holds crude oil futures contracts 12 months out (which tend to be less volatile than those for the near - or spot - month) secured by various treasury and government securities as collateral.
The chart below displays the hypothetical cumulative % gain/loss achieved by buying and holding DBO ONLY during the month of April every year since it started trading in 2006.
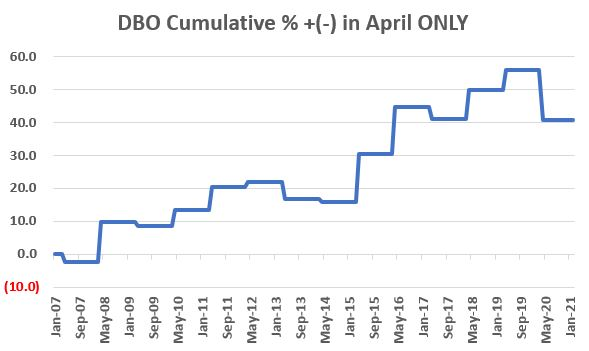
The good news is that the equity curve generally works its way up and to the right. However, we can also see that despite being the best month overall for crude oil, it is by no means a "sure thing" for this ETF.
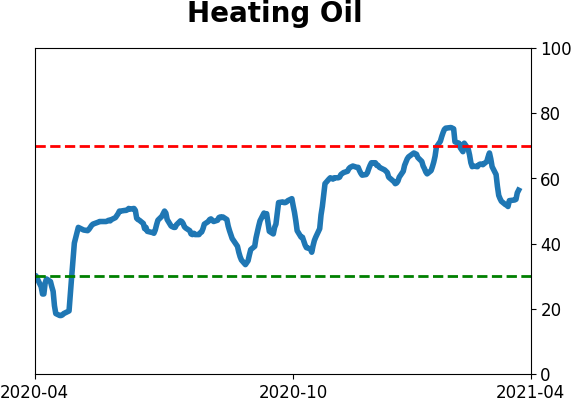
Jay also looked at an energy fund with decades of history.
For testing and illustrative purpose, we will use monthly total return data for the Fidelity Select Energy mutual fund since inception in 1981 as a proxy for the broader energy sector.
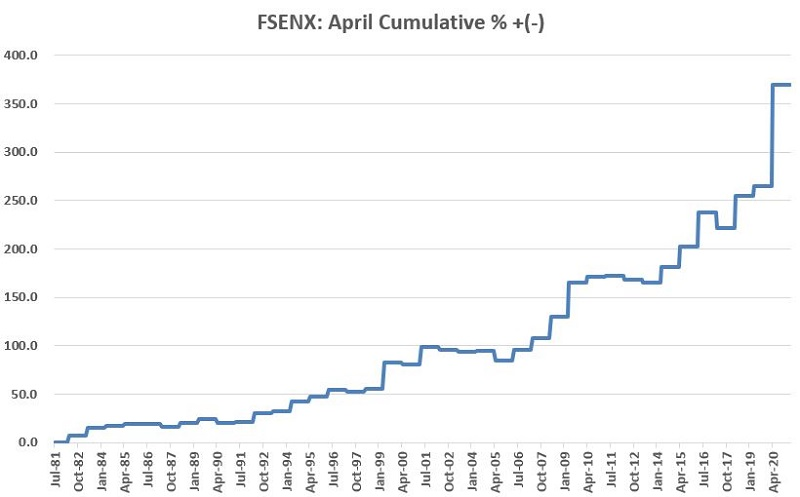
The good news is that FSENX has clearly been a stellar performer historically during the month of April. The bad news - as always - is that there is absolutely no guarantee that FSENX (or anything else energy-related) will necessarily perform well during April of 2021.
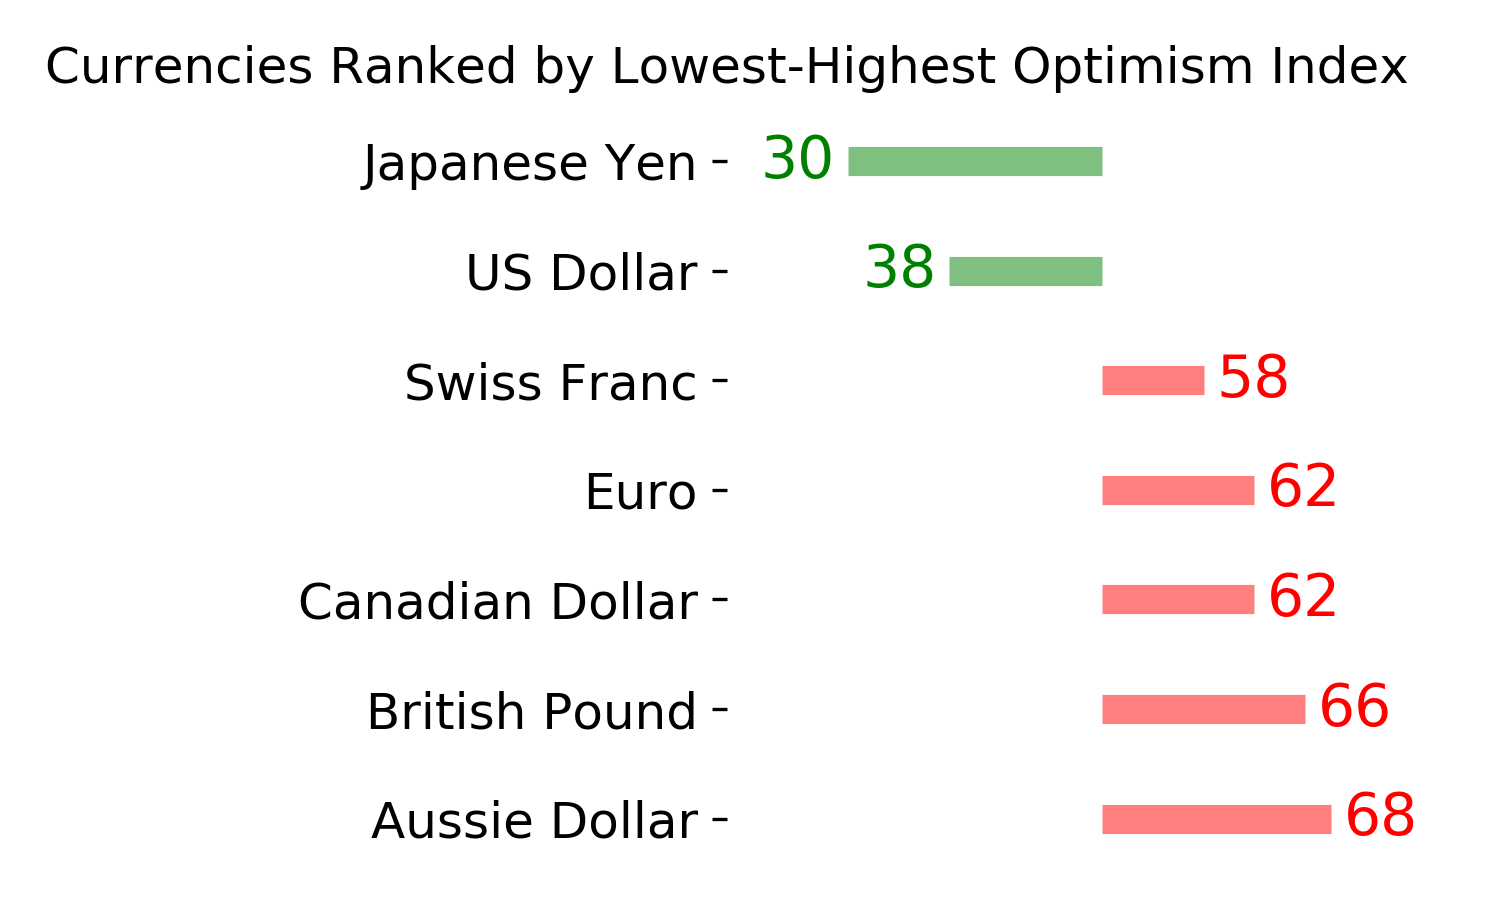
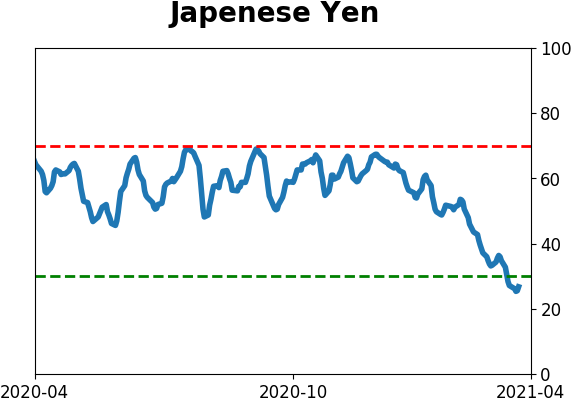
Energy has tended to do well this time of year, as has the Japanese yen. This week marked the start of the best seasonal window in that market. Over the past 50 years in the JPYUSD cross, buying day #67 (early April) and selling day #26 (mid-October) has had a win rate was 62%, with the average win quite a bit higher than the average loss.
This is particularly interesting now because sentiment on the yen is about as depressed as it has been at any point in over 5 years. The Optimism Index recently dropped below 25 for only the 2nd time since 2015. The other was early October 2018, marking a major low for the currency.
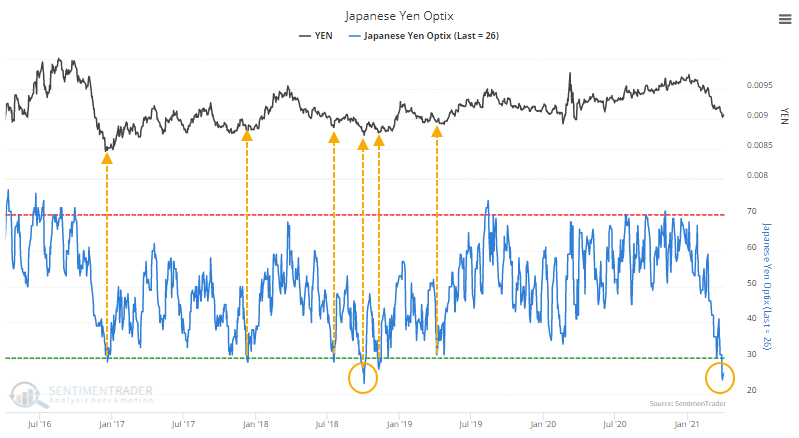
Here's the biggest caveat - optimism in the yen is low only by bull market or trading range standards. In a structural bear market, optimism this low has not been a reason to buy. If anything, it's been a better signal to sell. If the yen can't rally from this setup, then it will suggest the yen is once again mired in a structural bear market.
Interestingly, the positive seasonality, and evidence of pessimism, in the yen has often directly translated to rising gold prices.
Active Studies
| Time Frame | Bullish | Bearish | | Short-Term | 0 | 0 | | Medium-Term | 0 | 10 | | Long-Term | 11 | 4 |
|
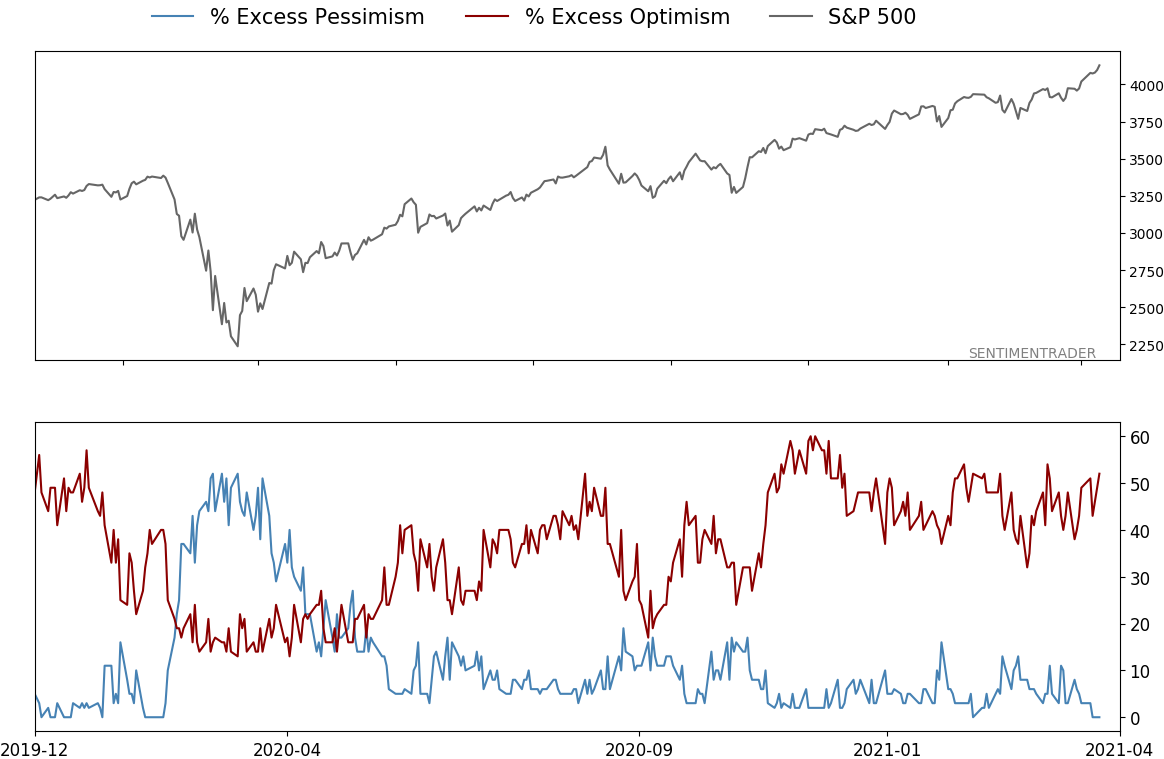
Indicators at Extremes
|
% Showing Pessimism: 0%
Bullish for Stocks
|
|
Portfolio
| Position | Description | Weight % | Added / Reduced | Date | | Stocks | RSP | 4.9 | Reduced 4% | 2021-02-09 | | Bonds | 30.0% BND, 8.8% SCHP | 38.8 | Added 15.1% | 2021-02-18 | | Commodities | GCC | 2.3 | Reduced 2.1%
| 2020-09-04 | | Precious Metals | GDX | 9.0 | Added 0.1% | 2021-02-18 | | Special Situations | 7.3% XLE, 4.8% PSCE | 12.1 | Reduced 5.6% | 2021-02-18 | | Cash | | 32.8 | | |
|
Updates (Changes made today are underlined)
With a market that has seen the kinds of broad participation and big breath thrusts like we did in the fall, it's hard to become too negative. Those kinds of conditions have consistently preceded higher returns over the next 6-12 months. It's the interim that's more of an issue. Even conditions like that haven't prevented some shorter-term pullbacks. And when we combine an environment where speculation is rampant and recent days have seen an increase in cracks under the surface of the indexes, it's enough to become more defensive over a short- to medium-term time frame. We still don't have much confirmation from the price action in the indexes, so those who are more conservative would likely wait before increasing cash levels. I've decreased risk exposure a bit more, mainly in terms of energy stocks and the ANGL fund, while adding more to the broader bond market. RETURN YTD: 6.5% 2020: 8.1%, 2019: 12.6%, 2018: 0.6%, 2017: 3.8%, 2016: 17.1%, 2015: 9.2%, 2014: 14.5%, 2013: 2.2%, 2012: 10.8%, 2011: 16.5%, 2010: 15.3%, 2009: 23.9%, 2008: 16.2%, 2007: 7.8%
|
|
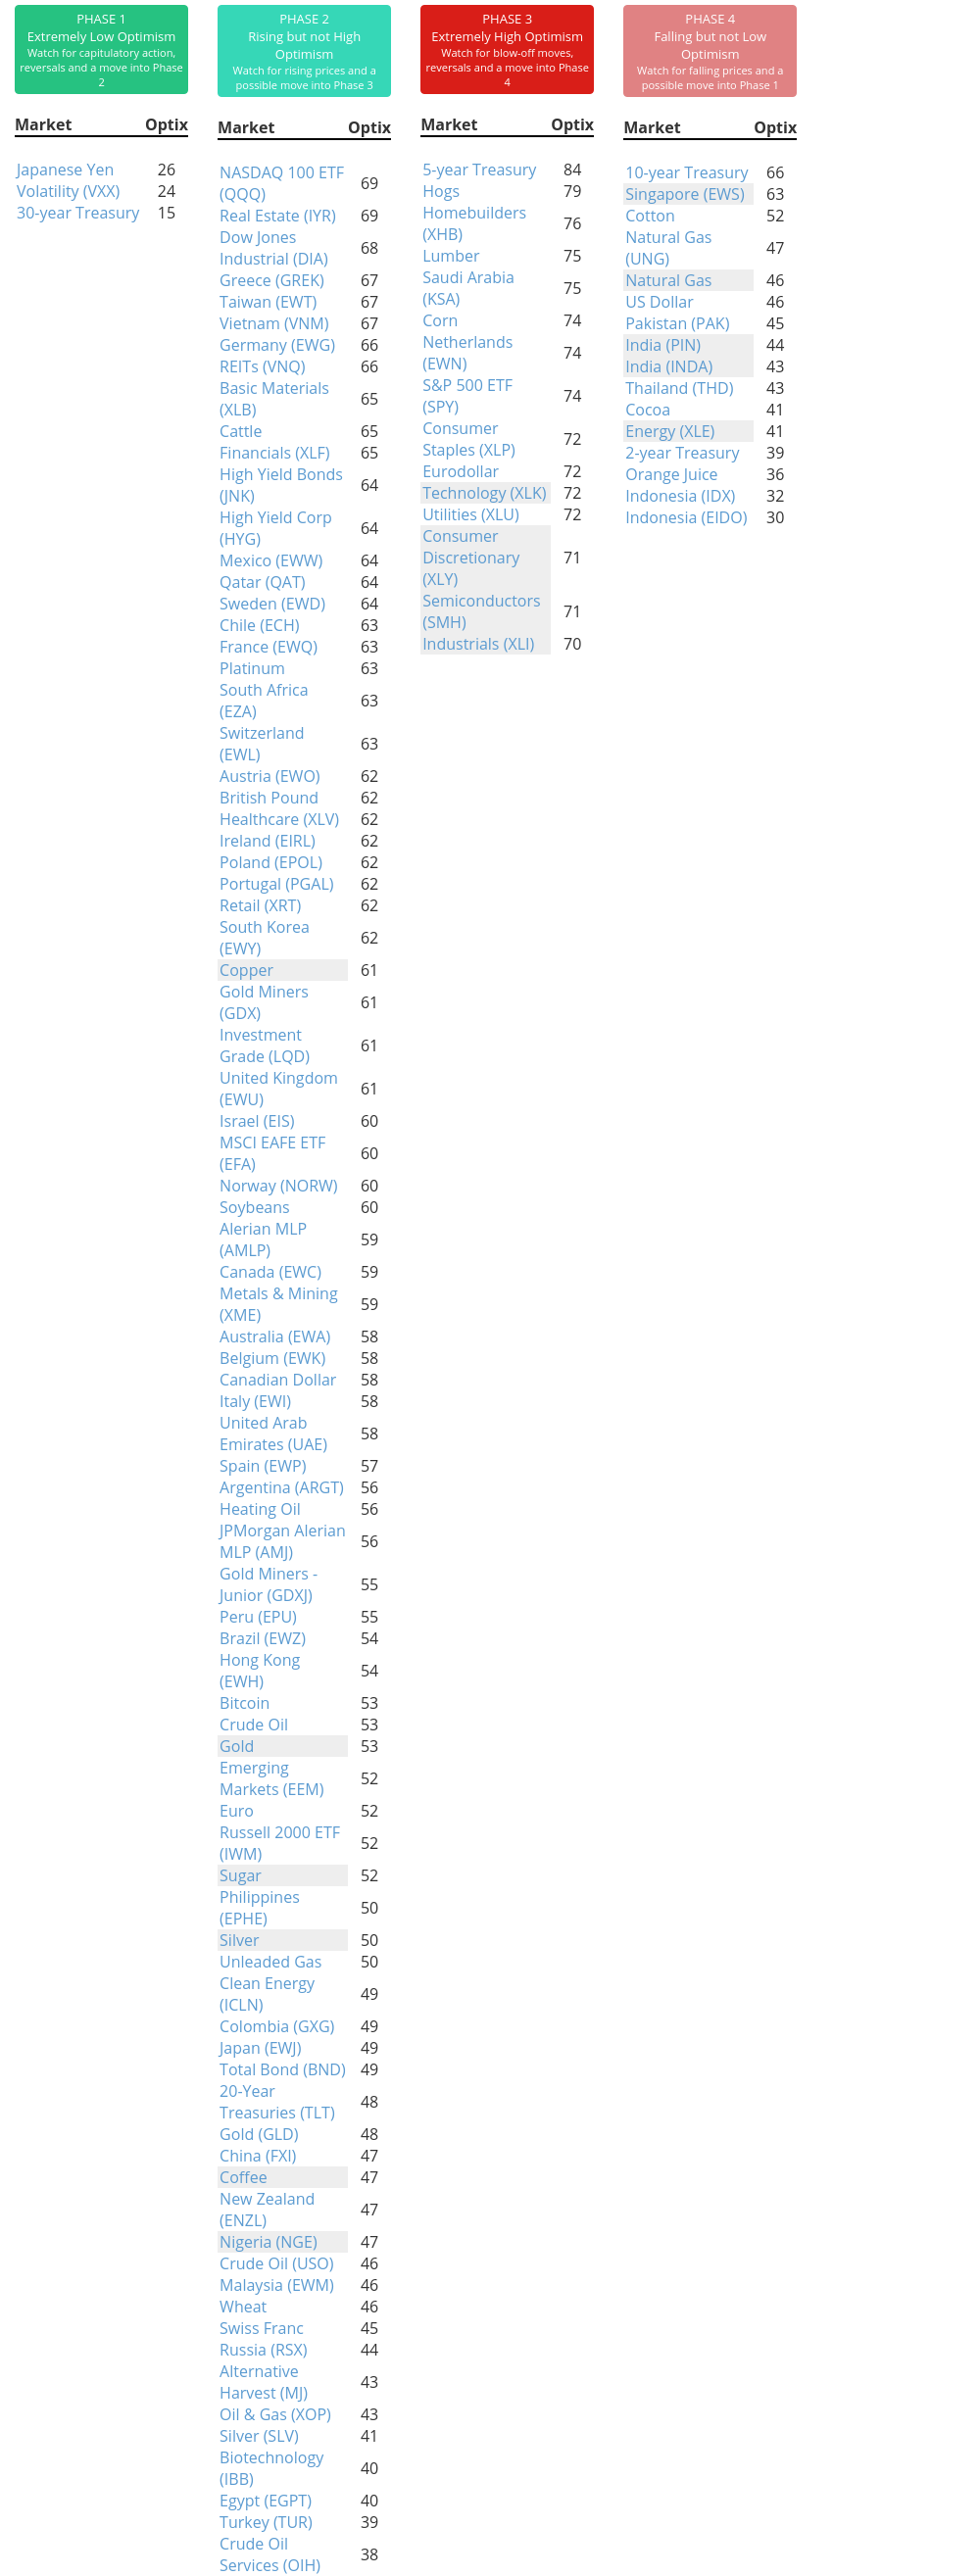
Phase Table
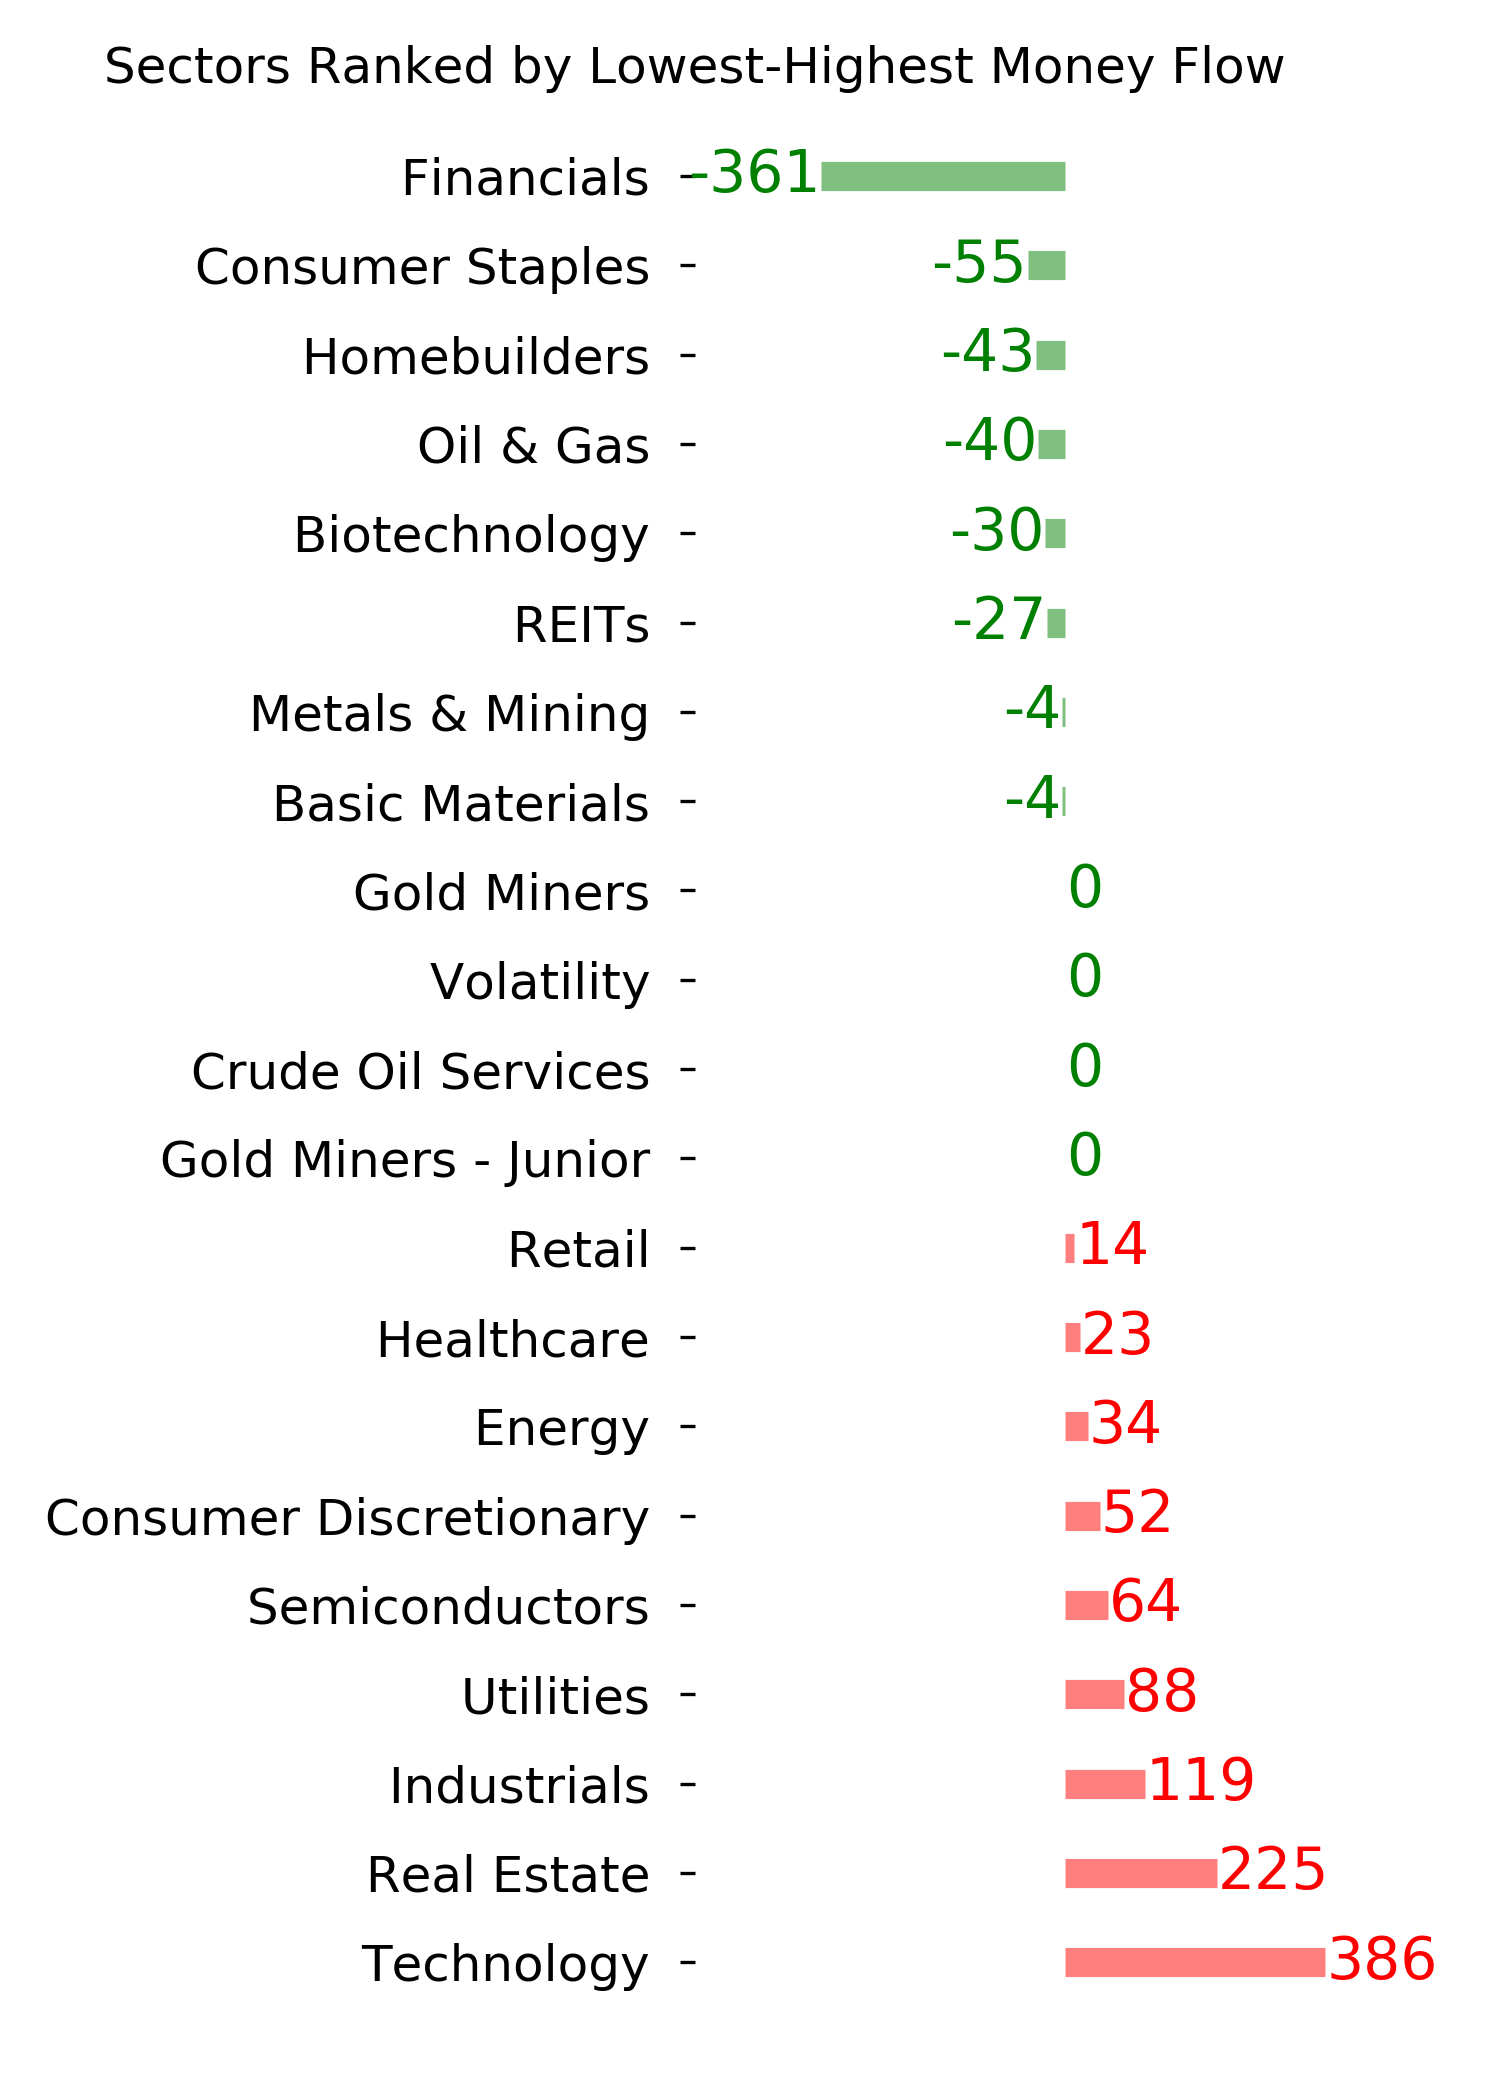
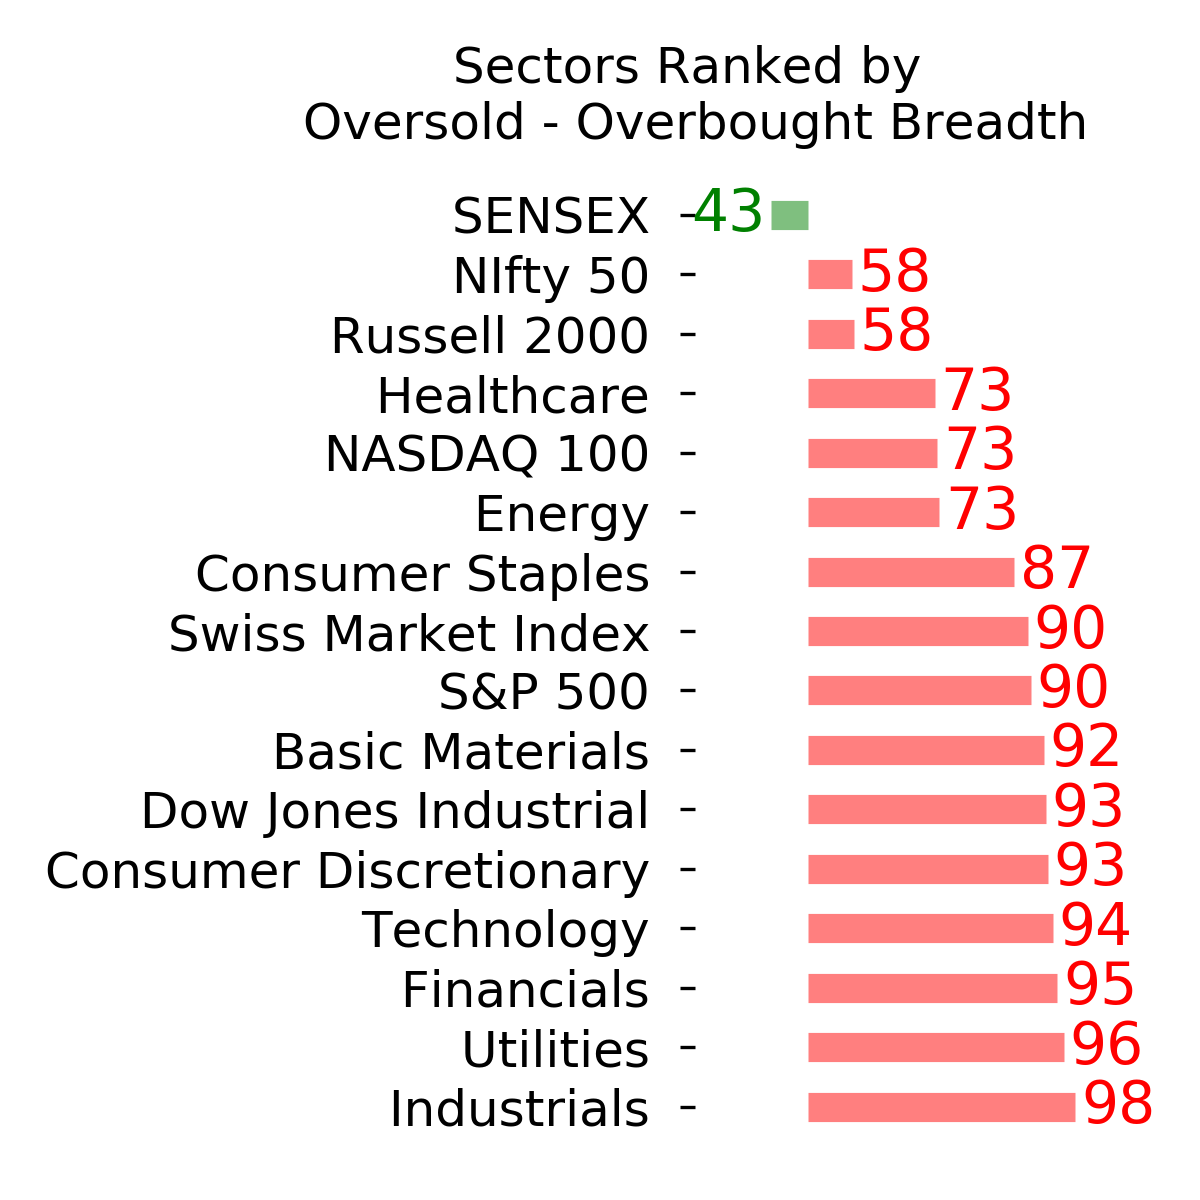
Ranks
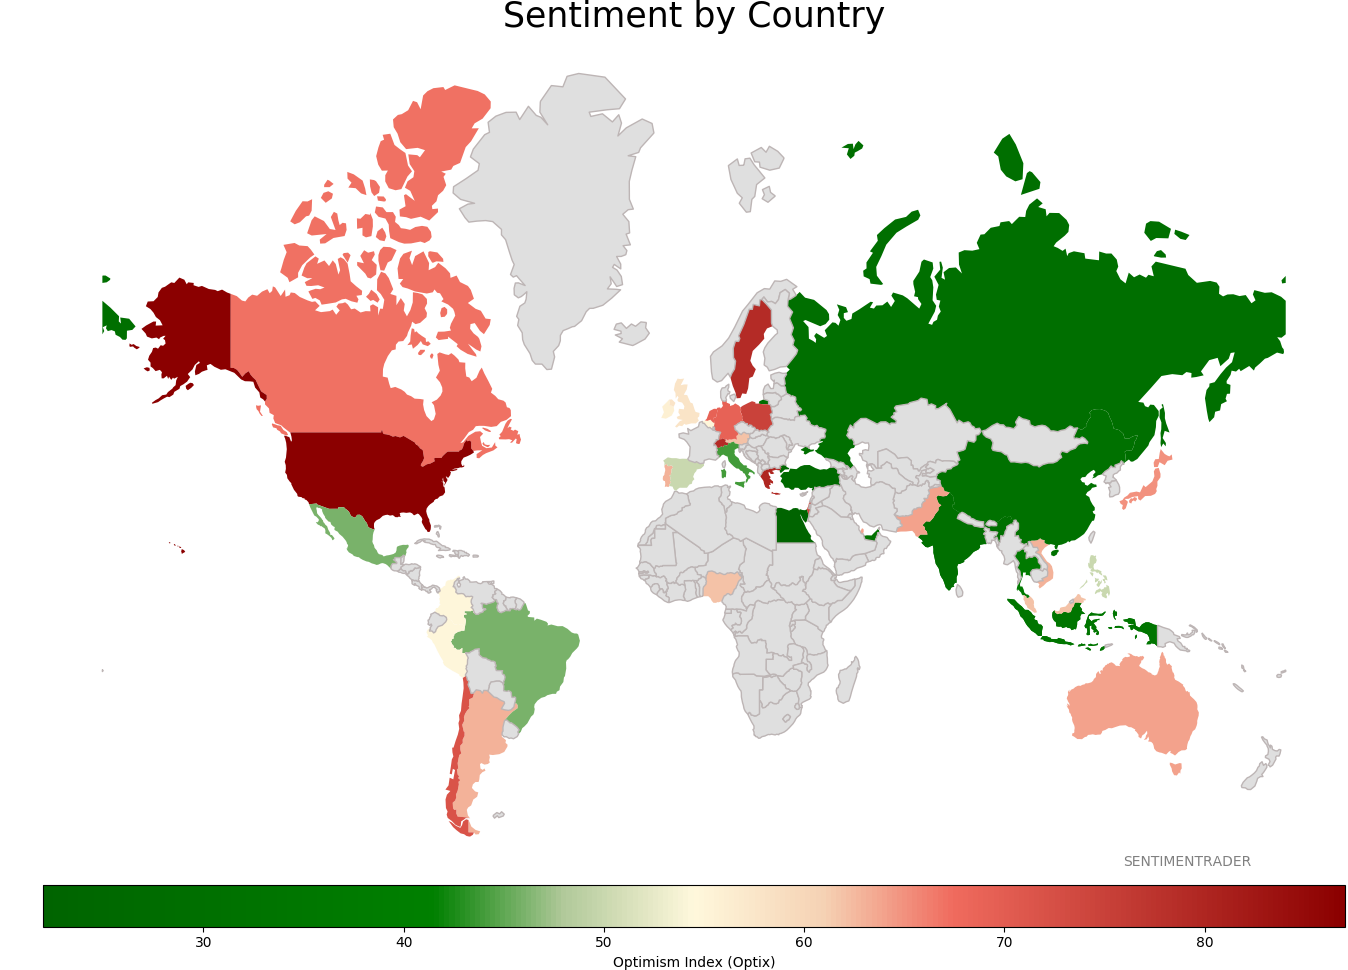
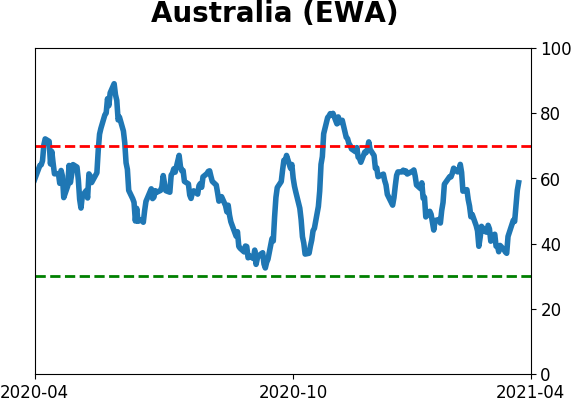
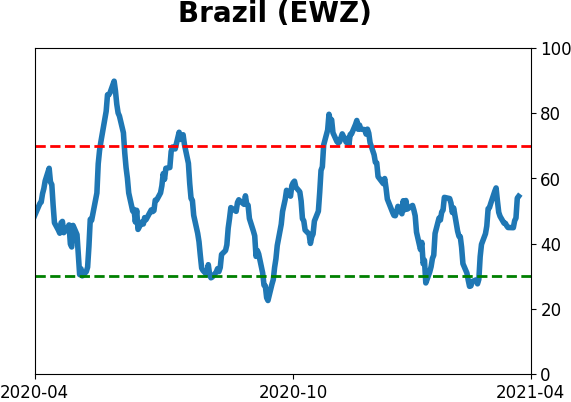
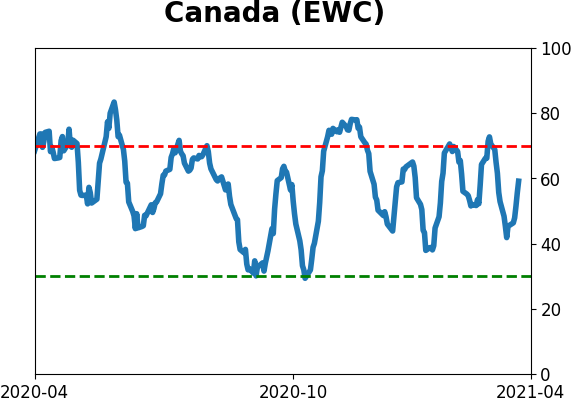
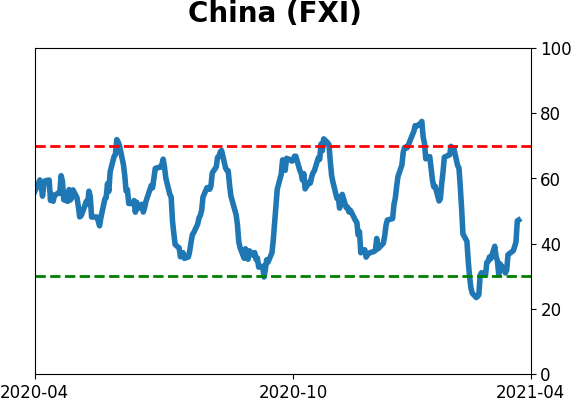
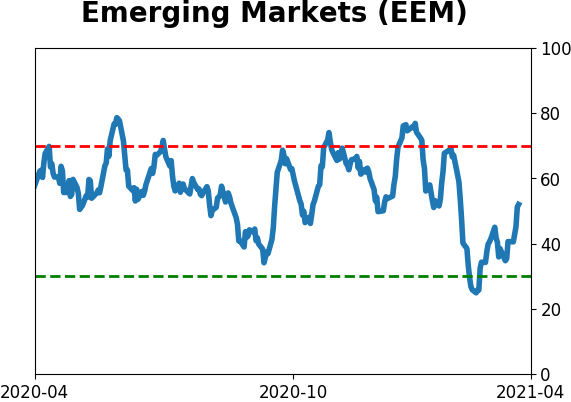
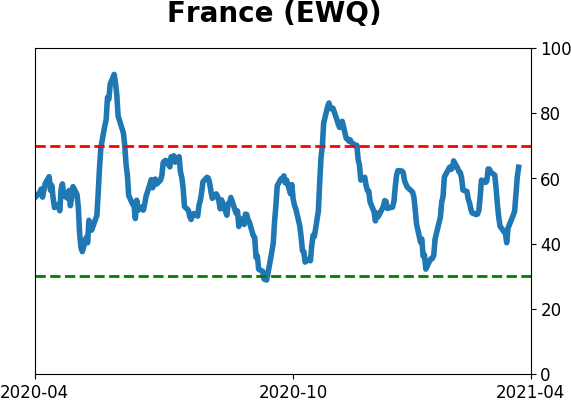
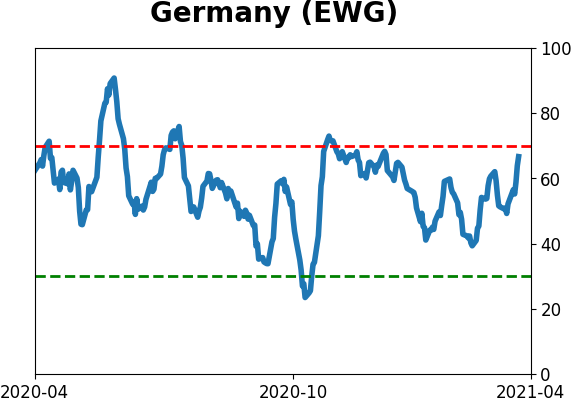
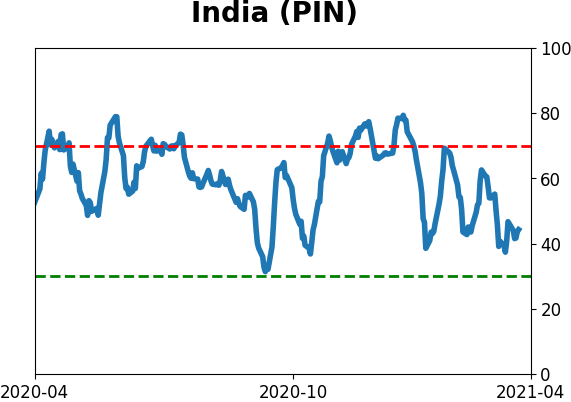
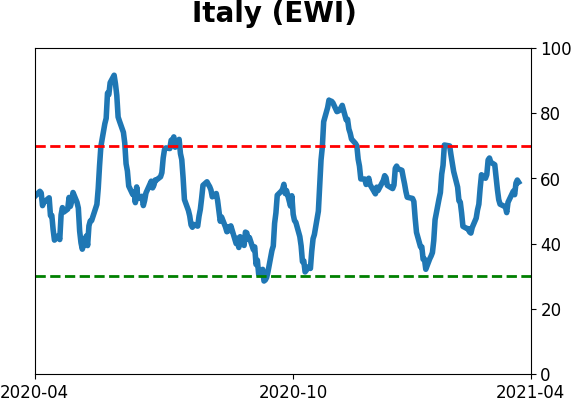
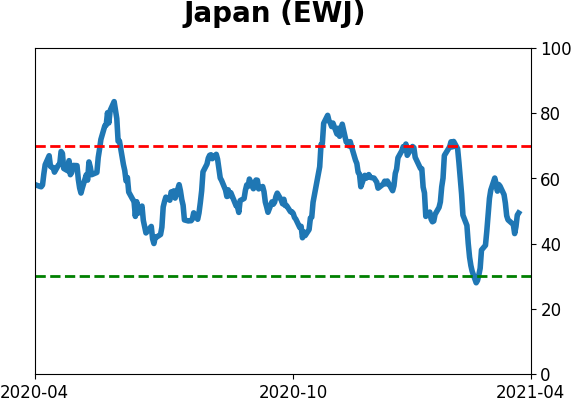
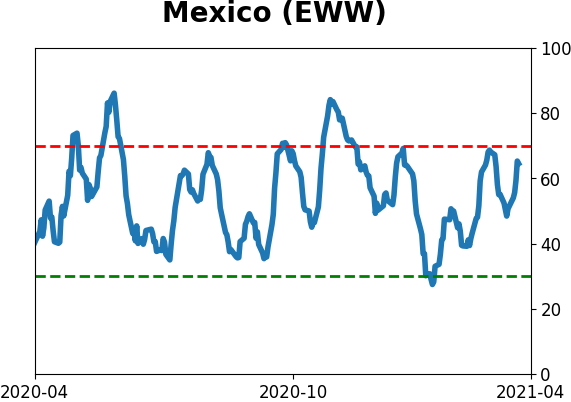
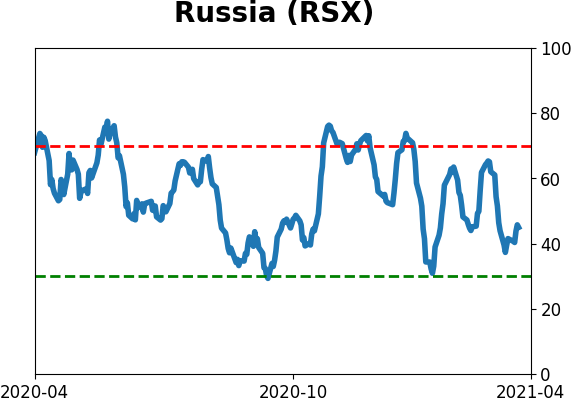
Sentiment Around The World
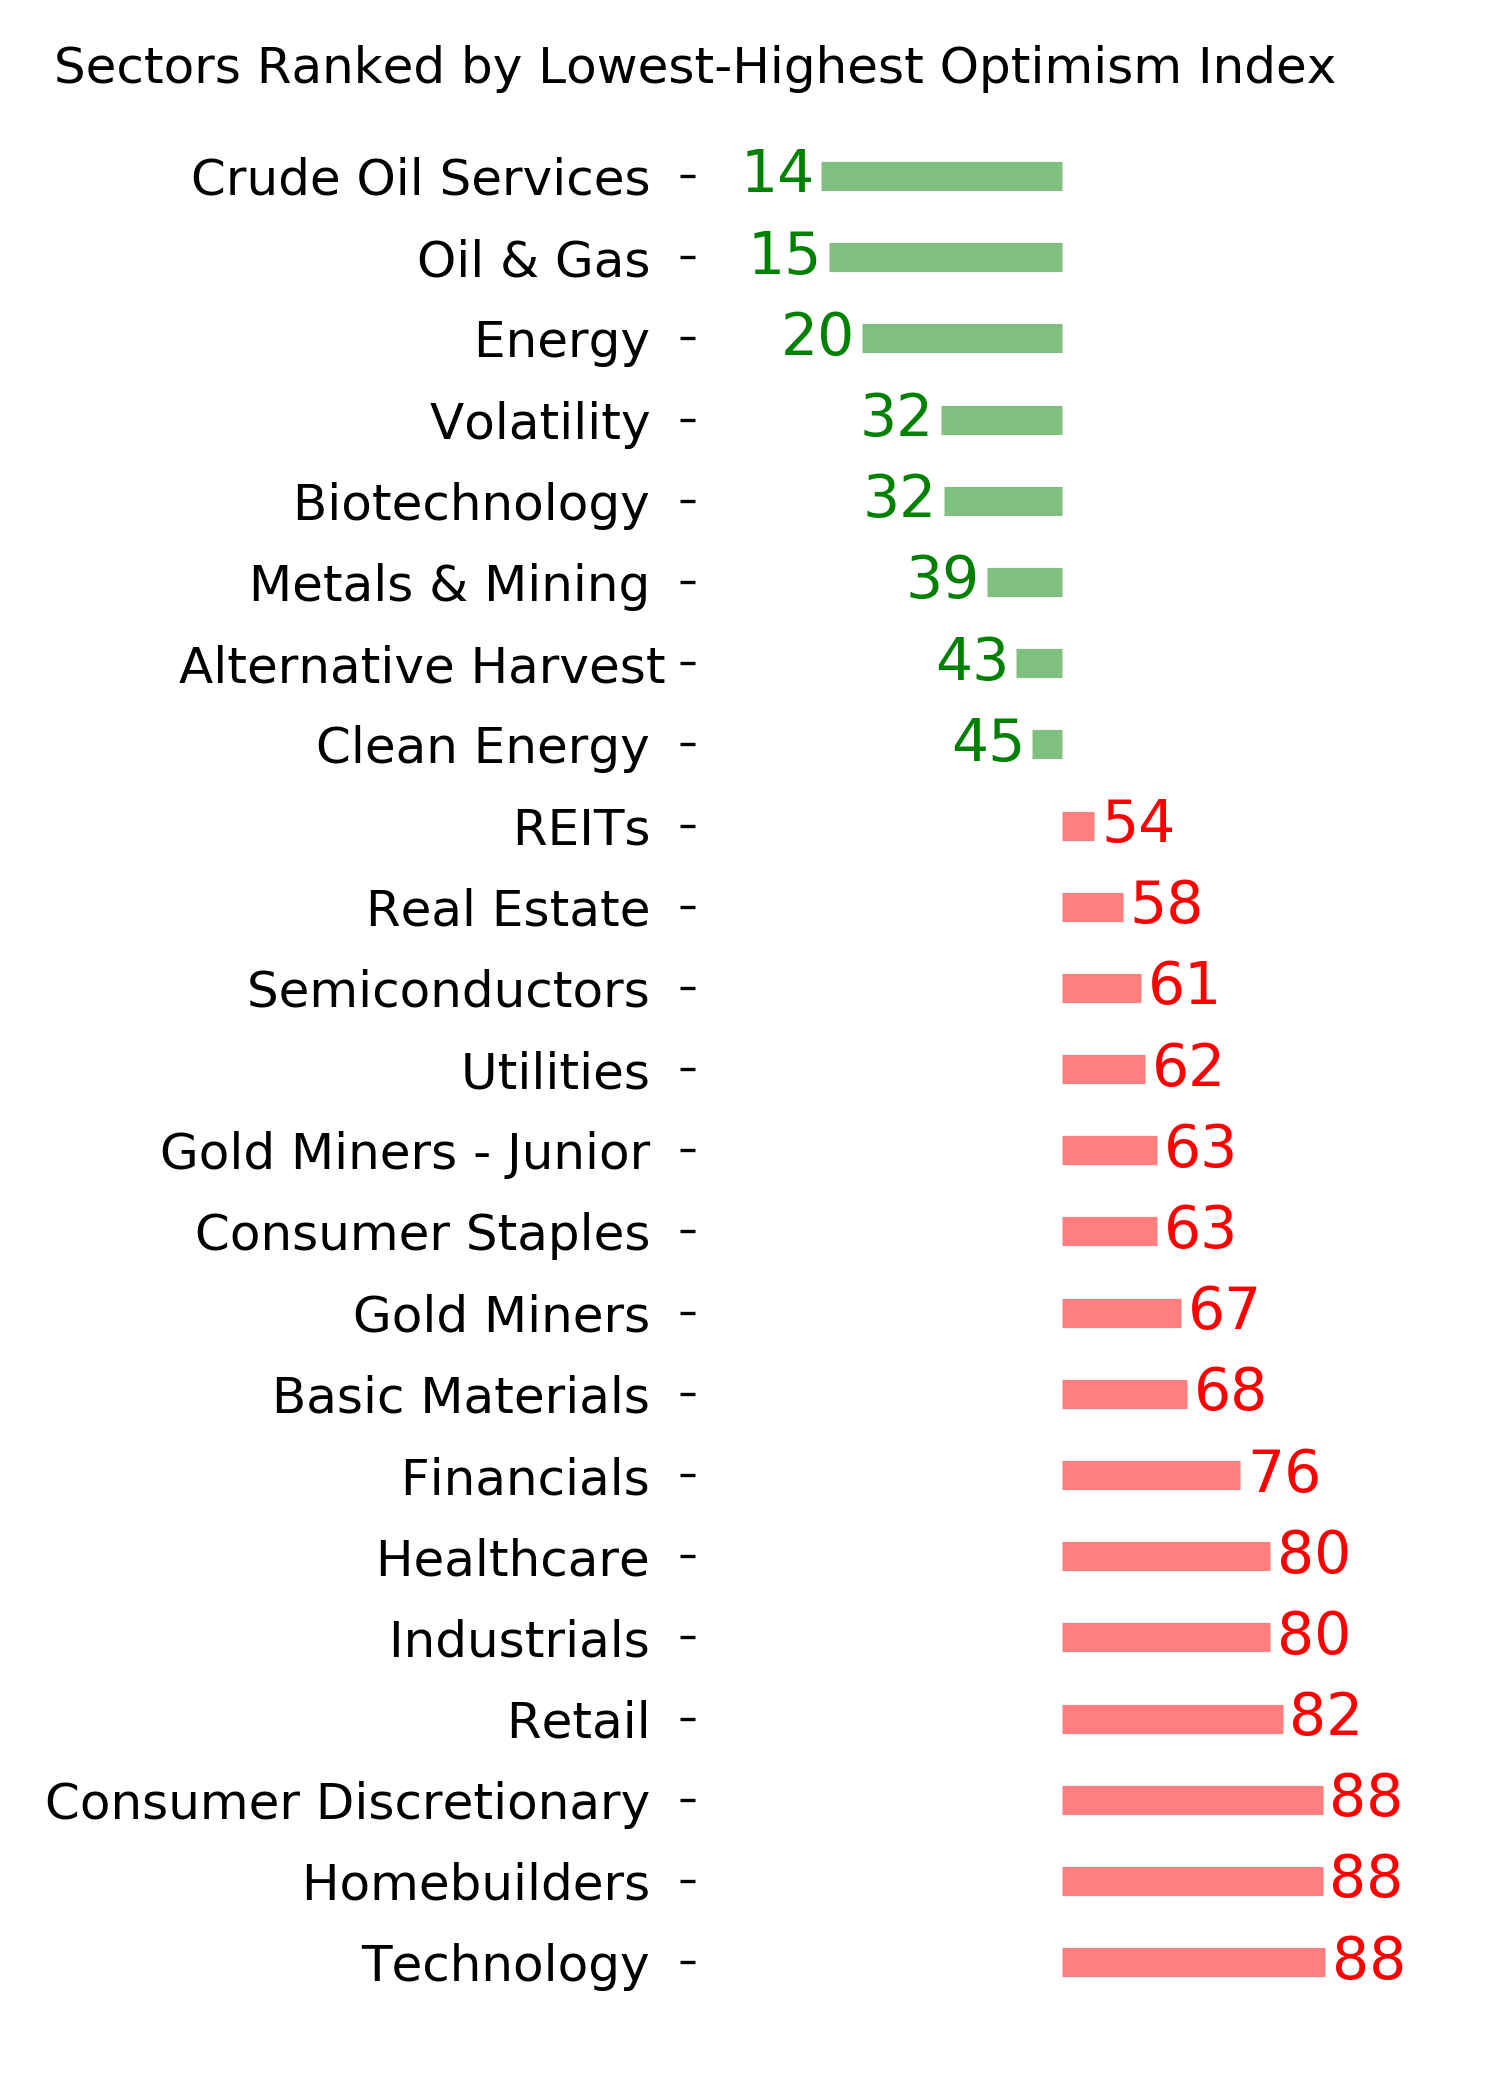
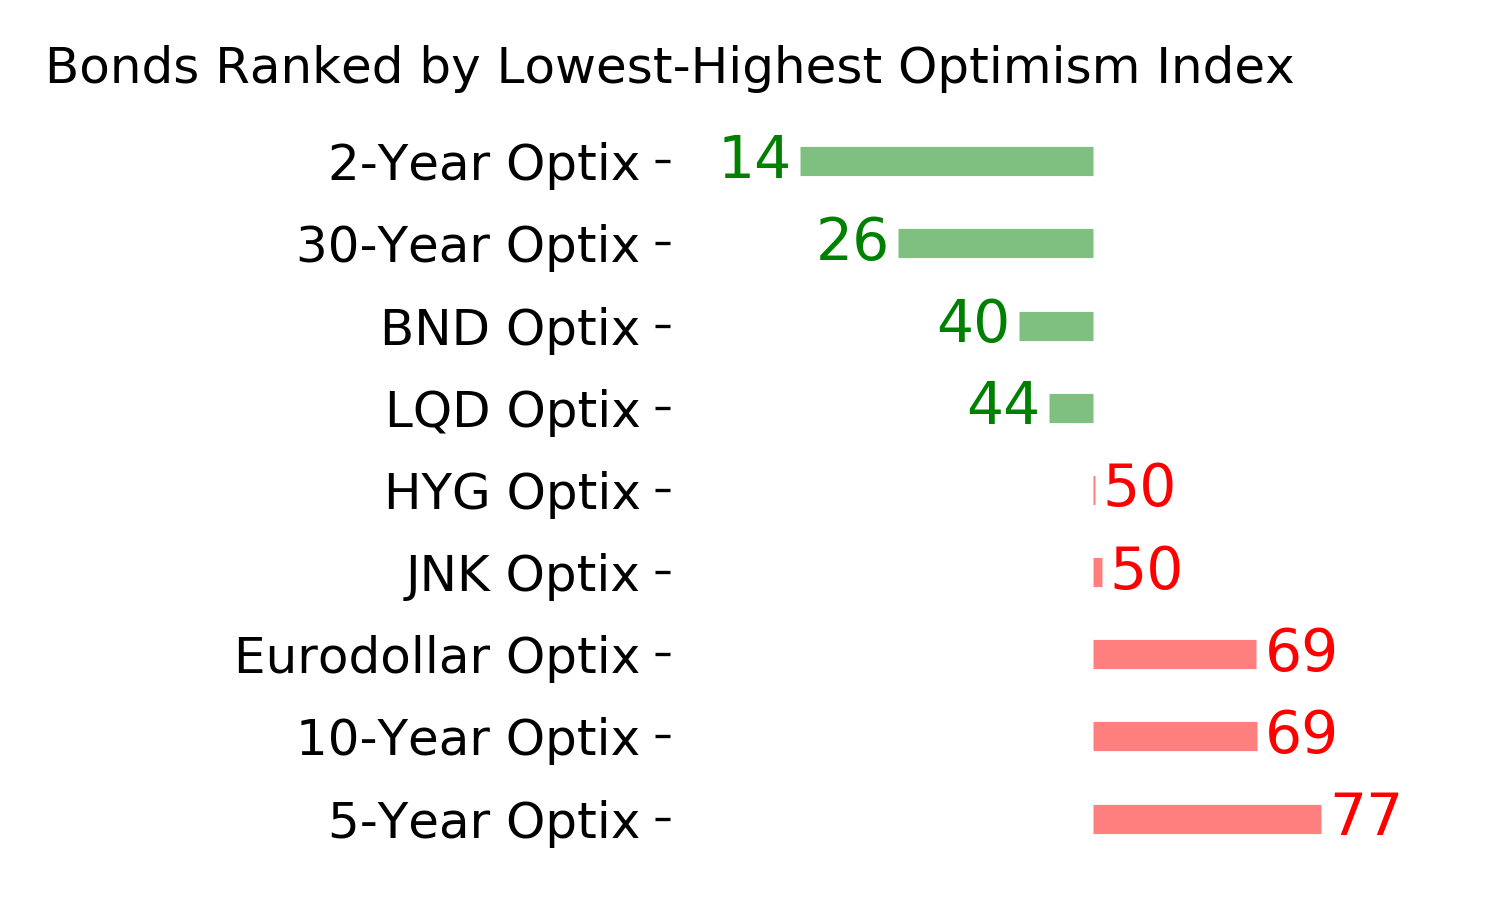
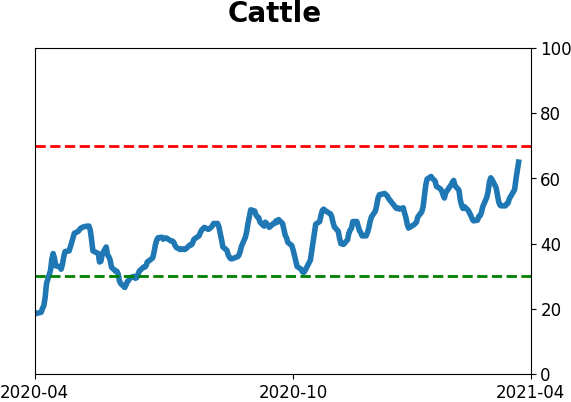
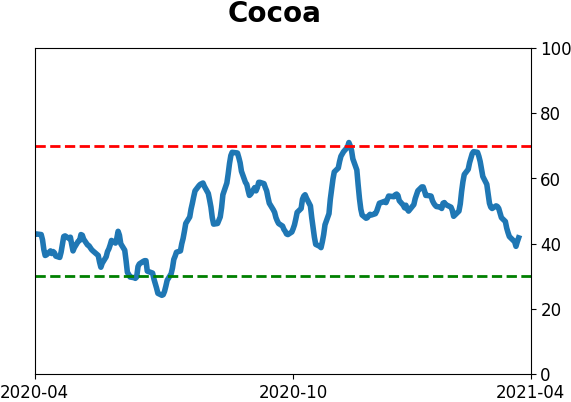
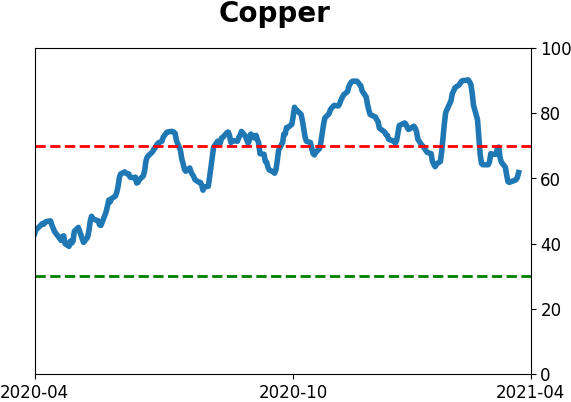
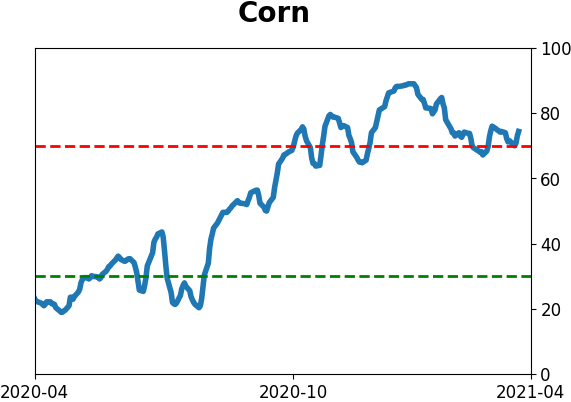
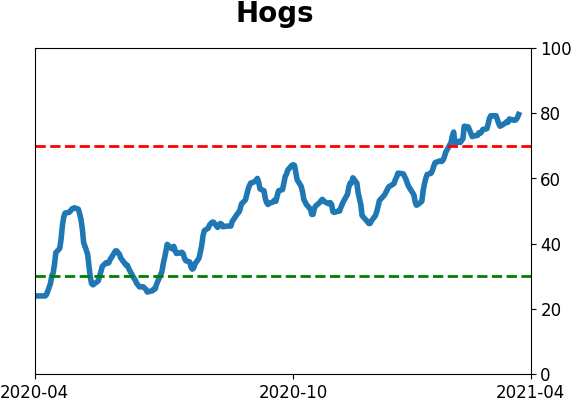
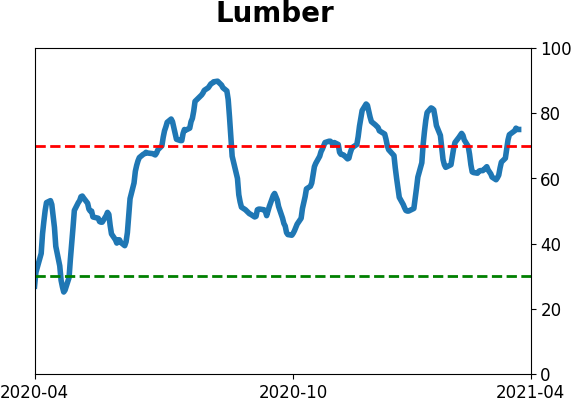
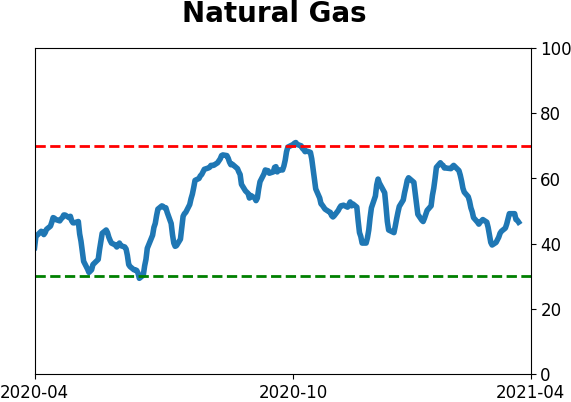
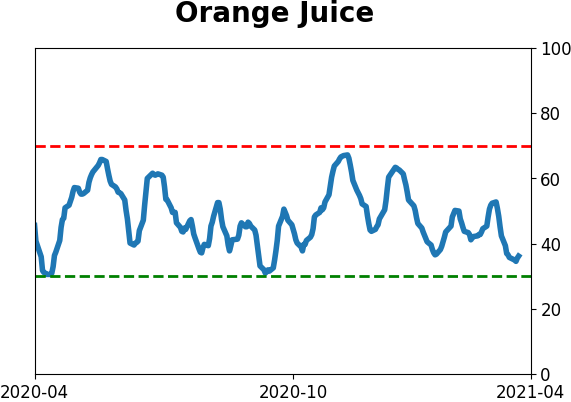
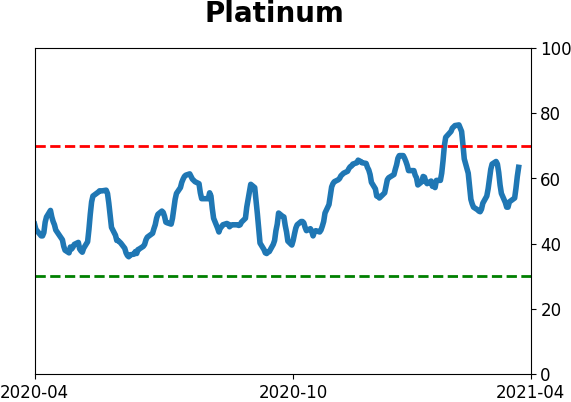
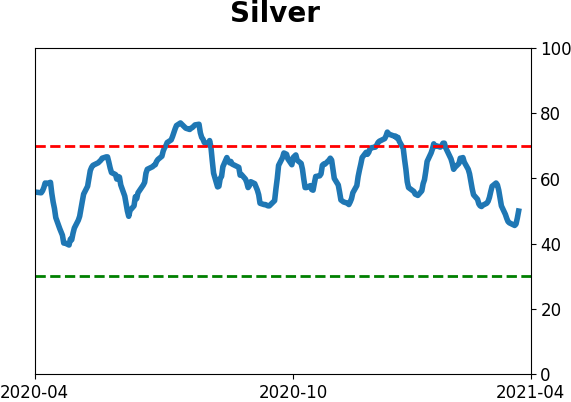
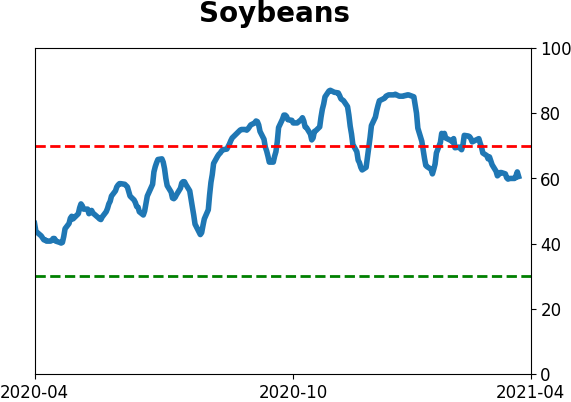
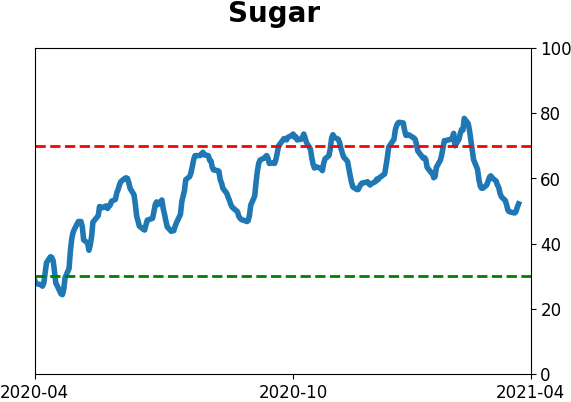
Optimism Index Thumbnails
|
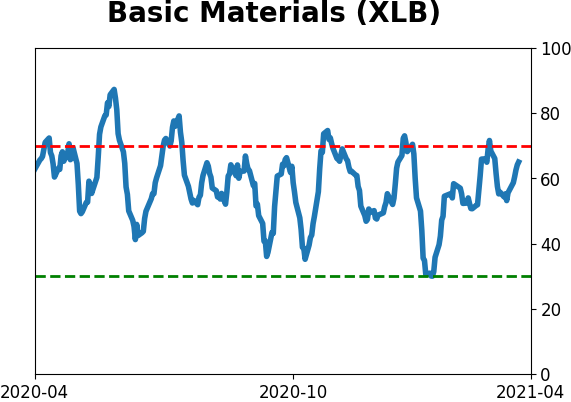
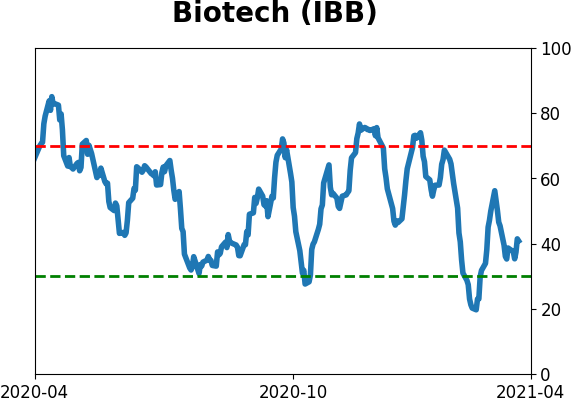
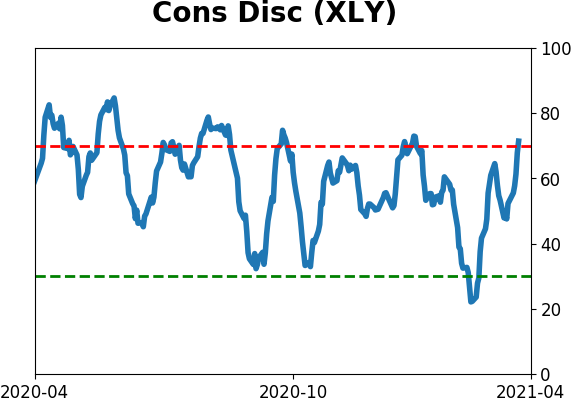
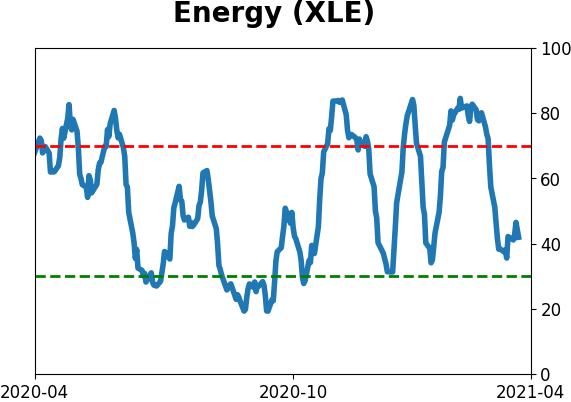
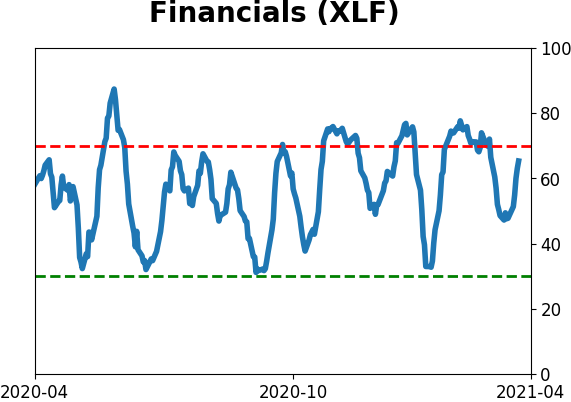
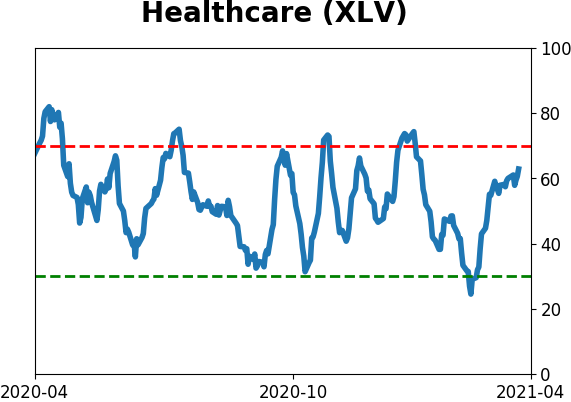
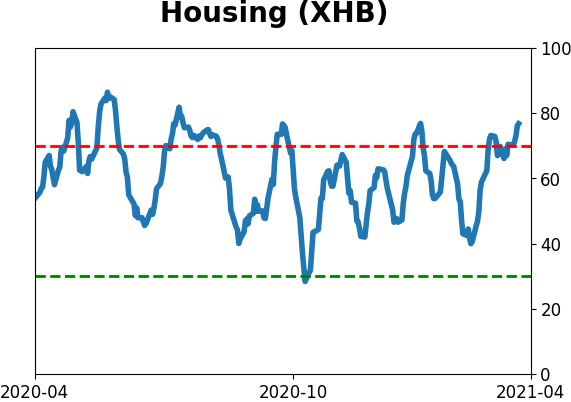
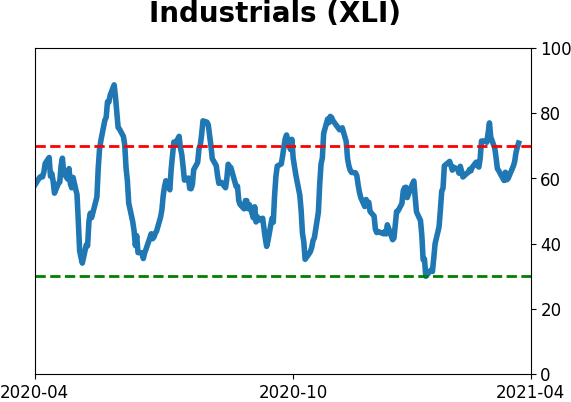
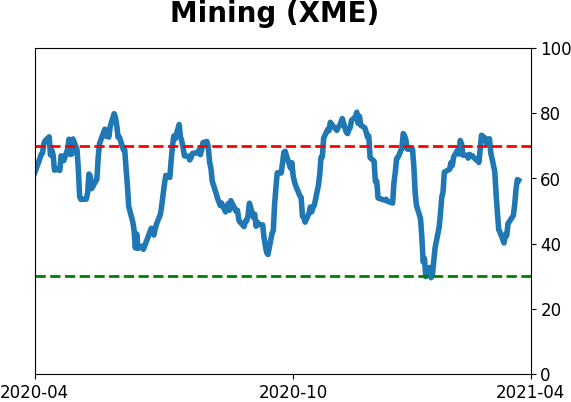
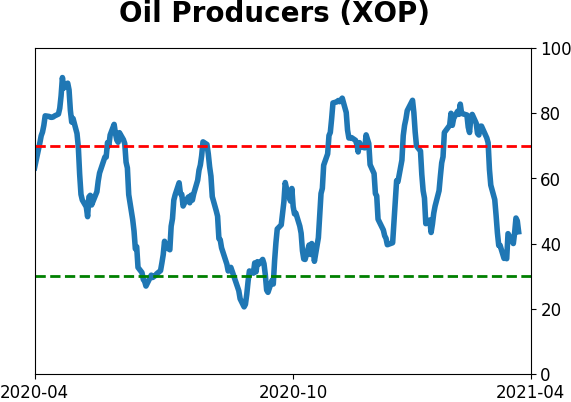
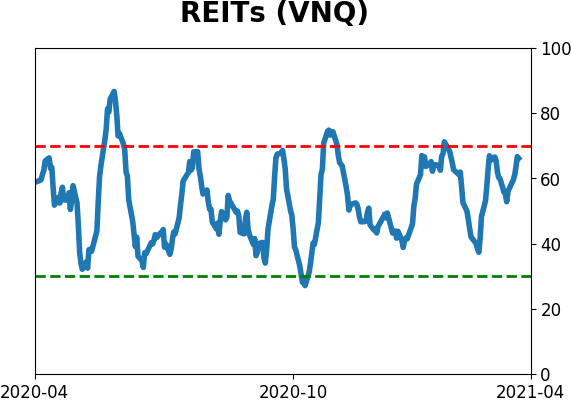
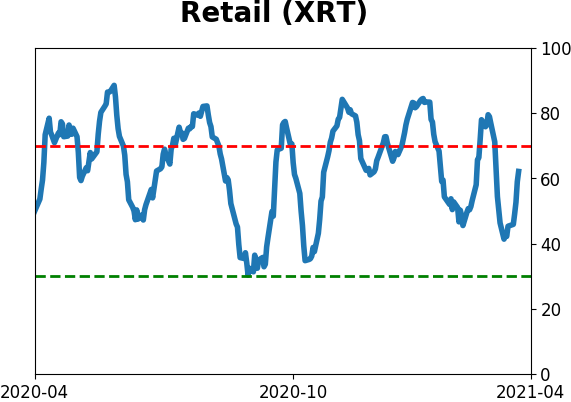
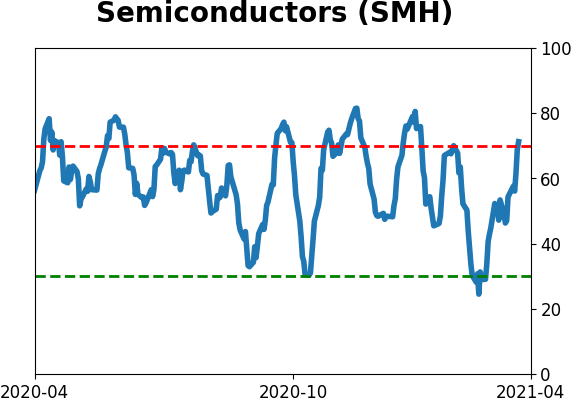
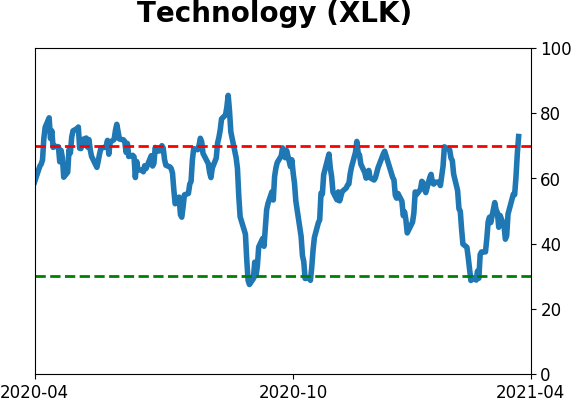
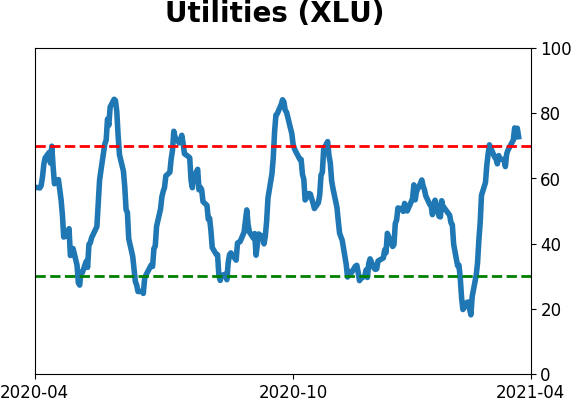
Sector ETF's - 10-Day Moving Average
|
|
|
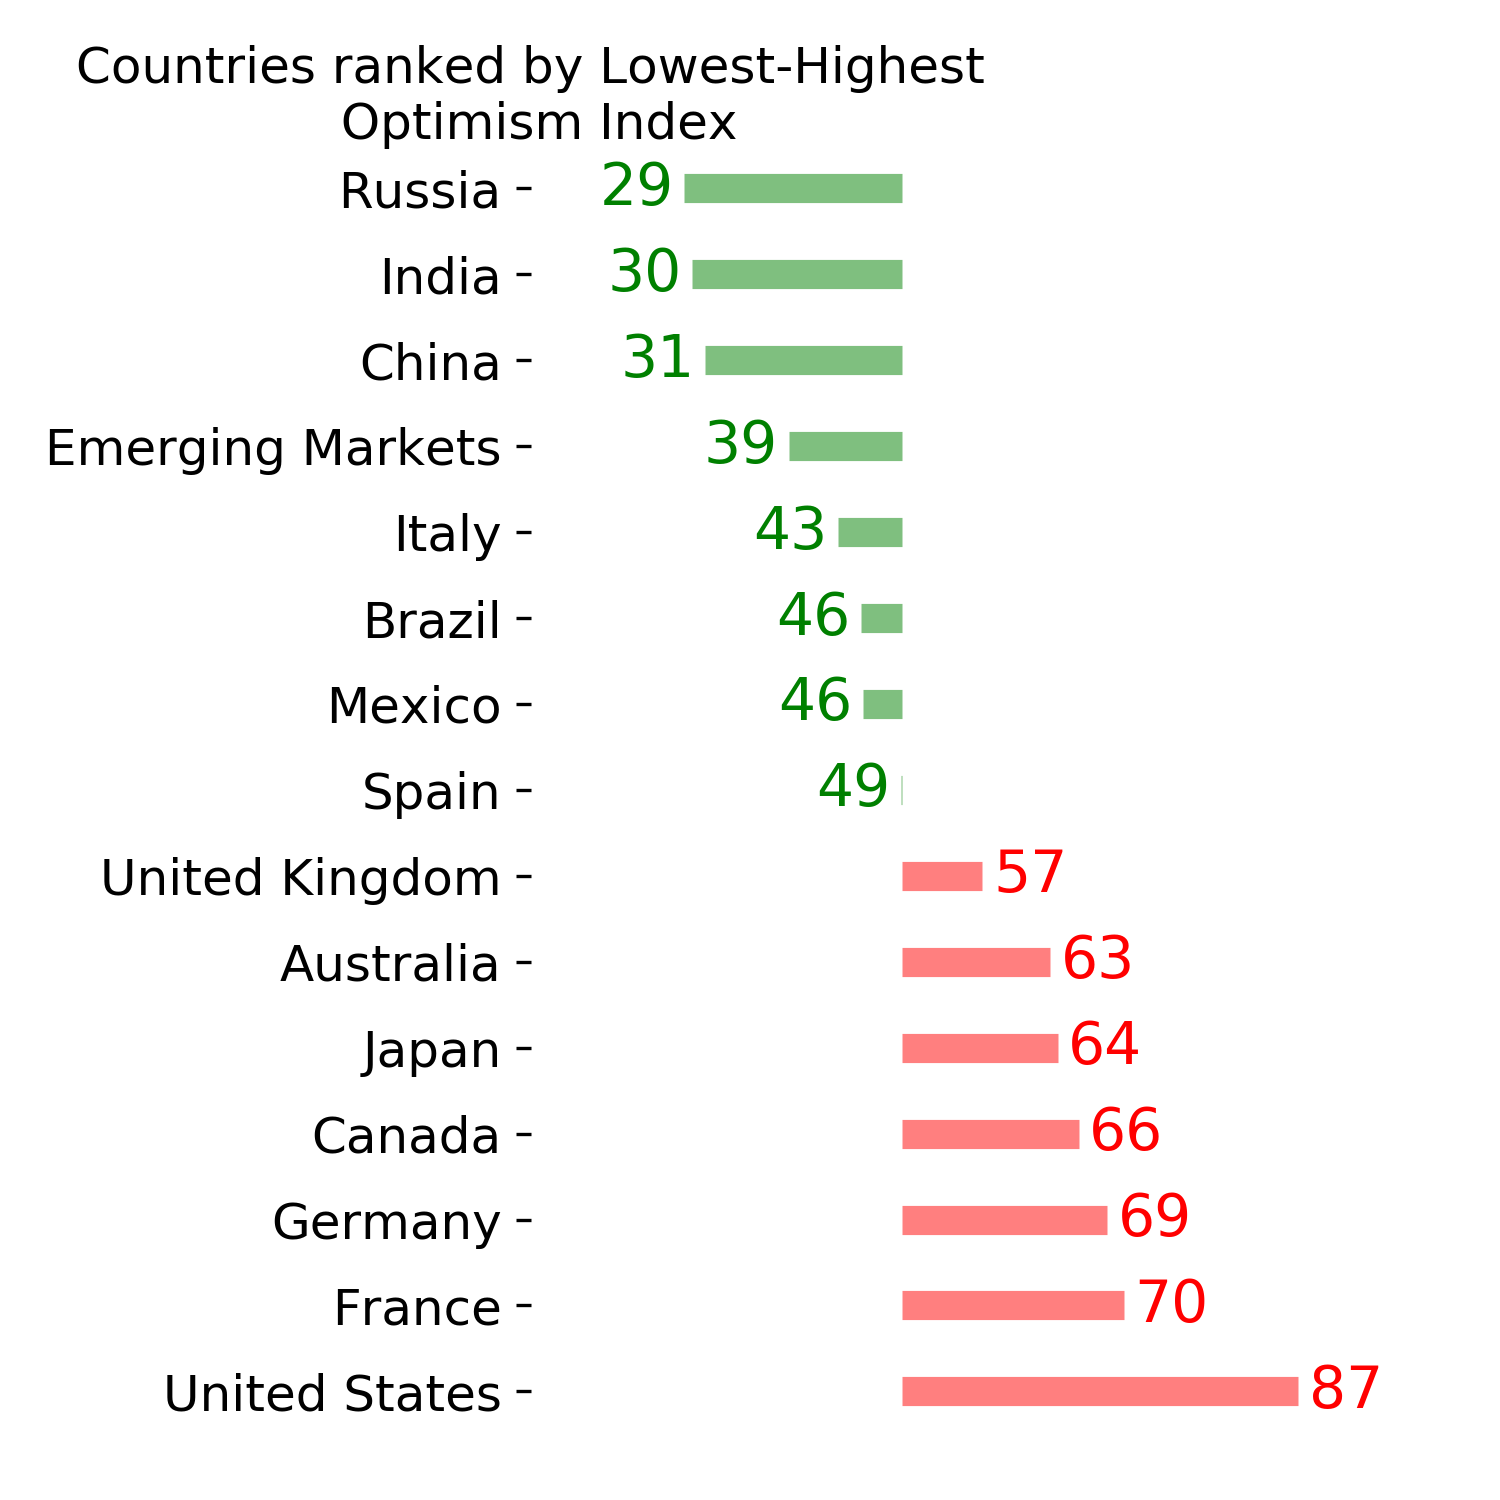
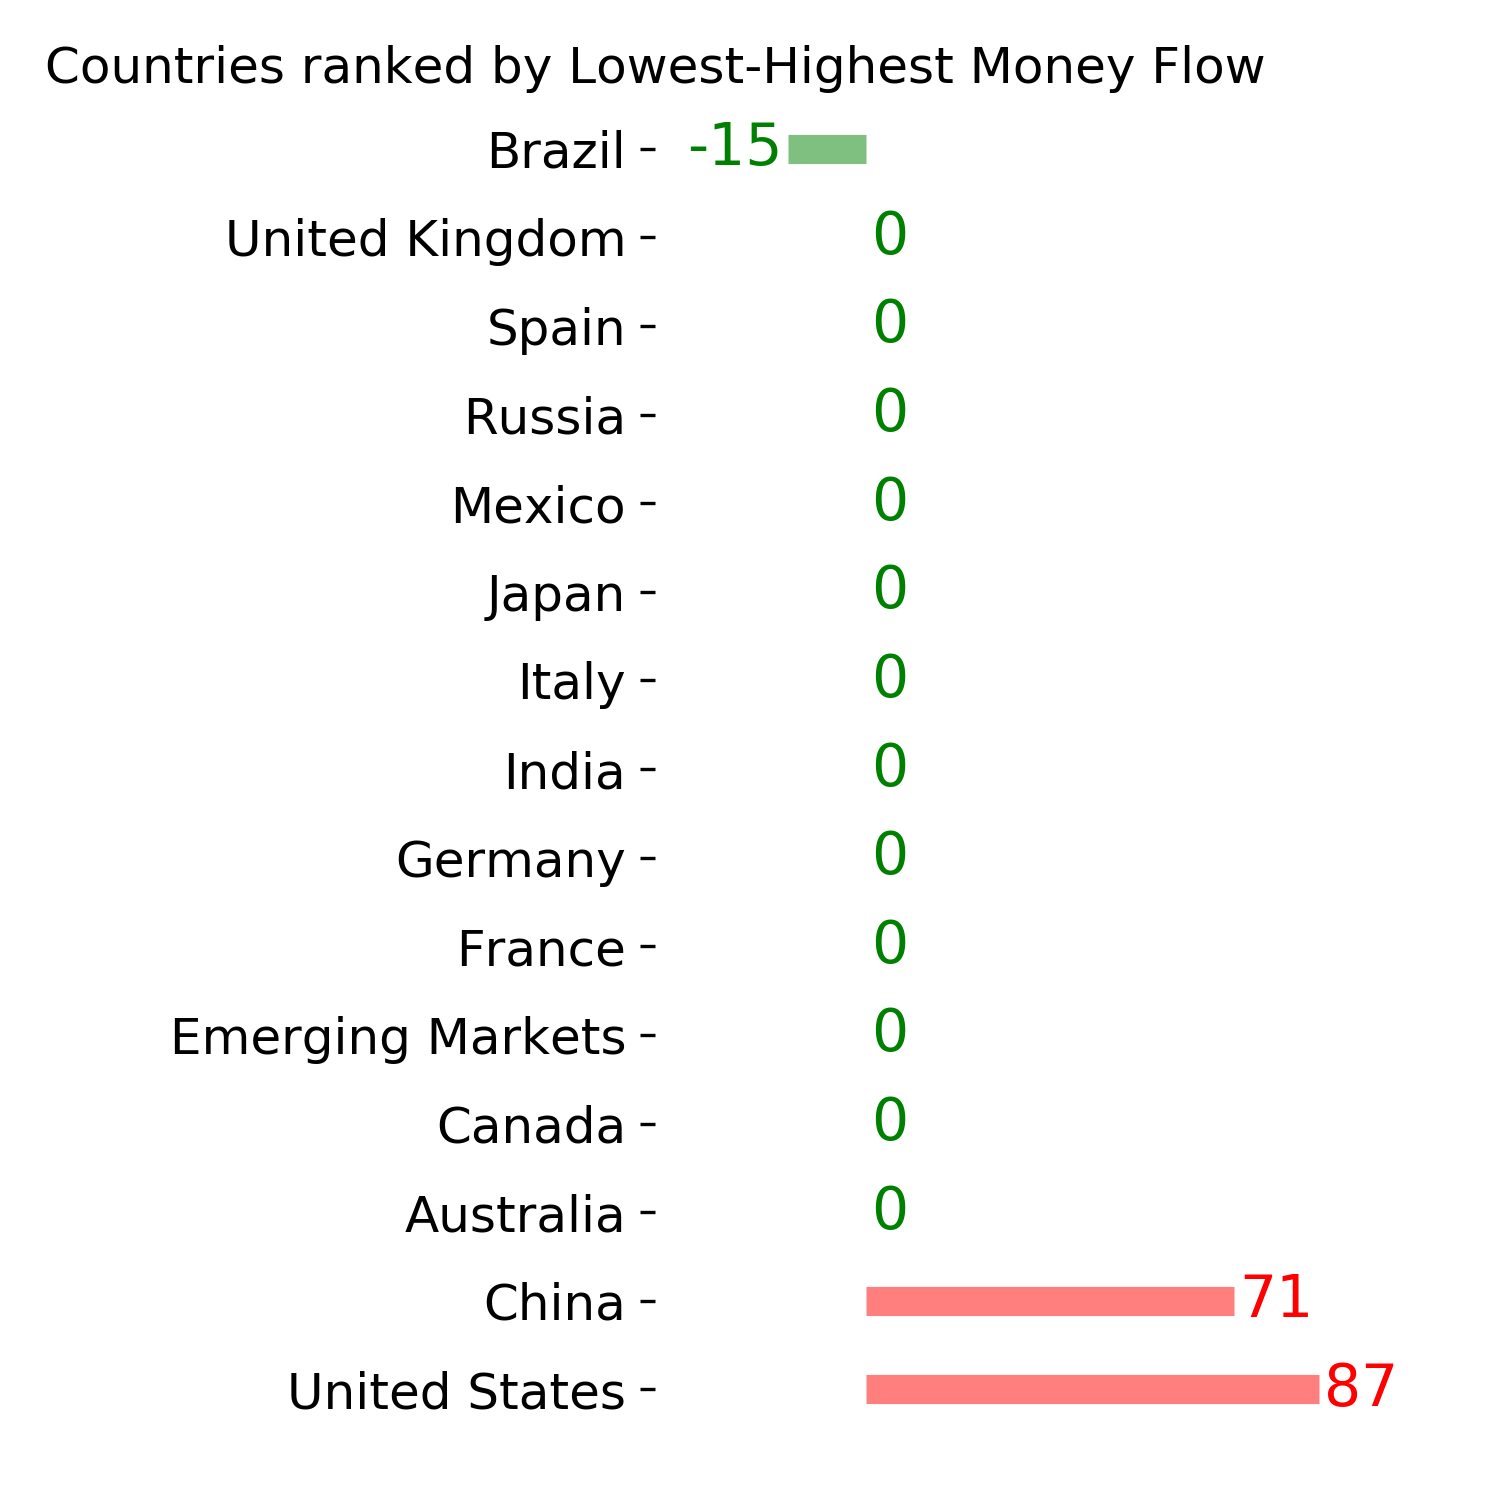
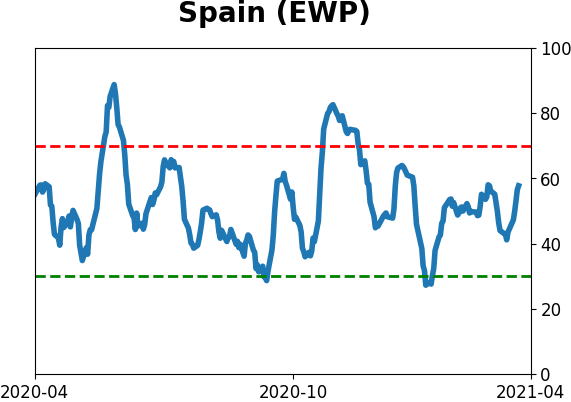
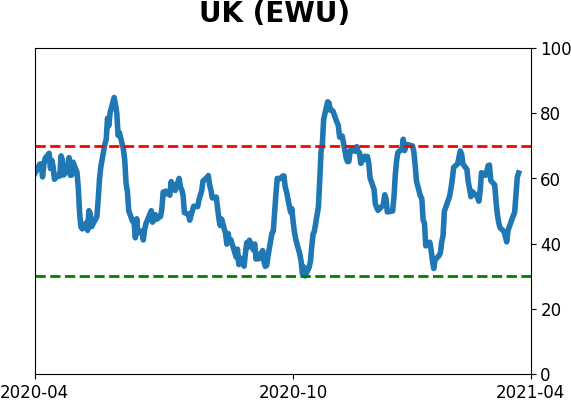
Country ETF's - 10-Day Moving Average
|
|
|
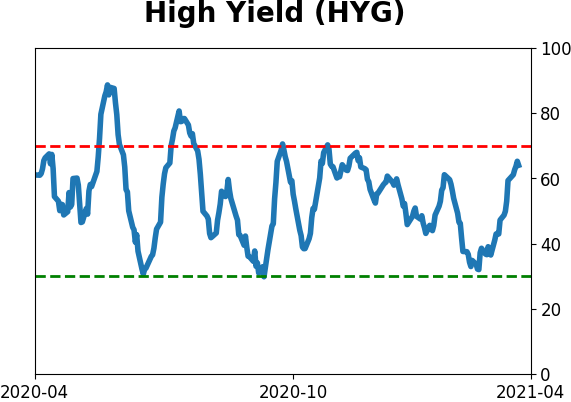
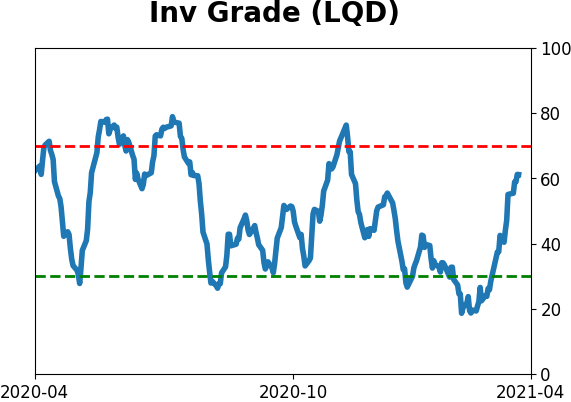
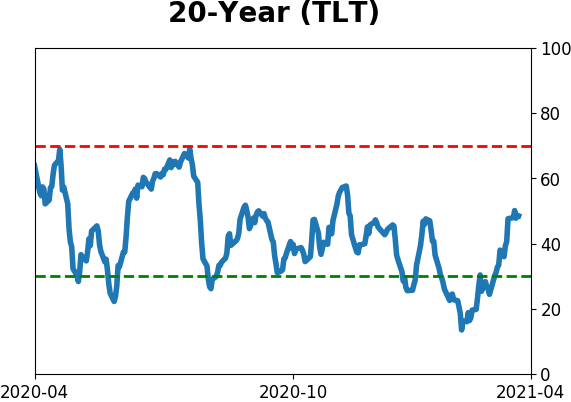
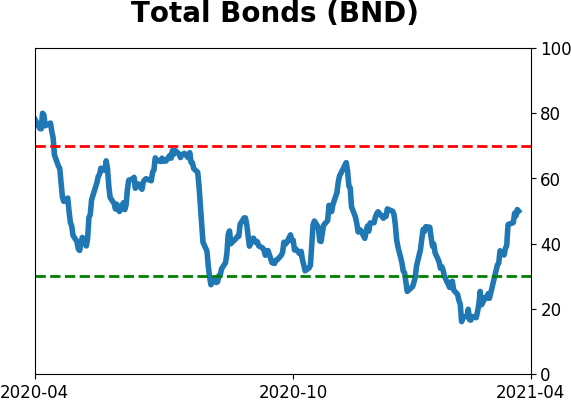
Bond ETF's - 10-Day Moving Average
|
|
|
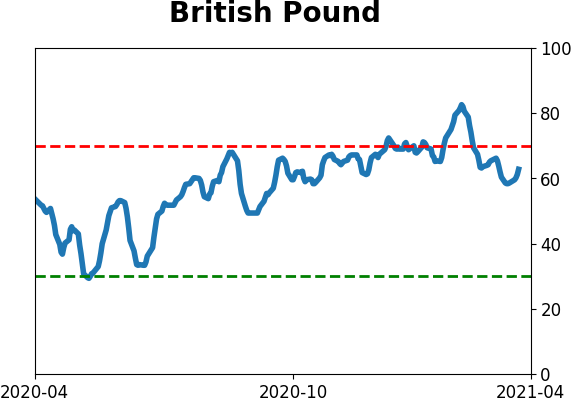
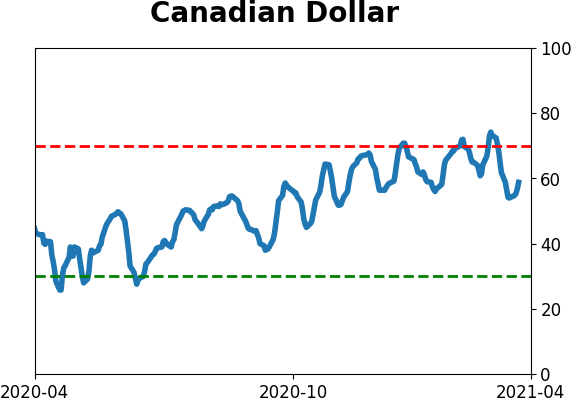
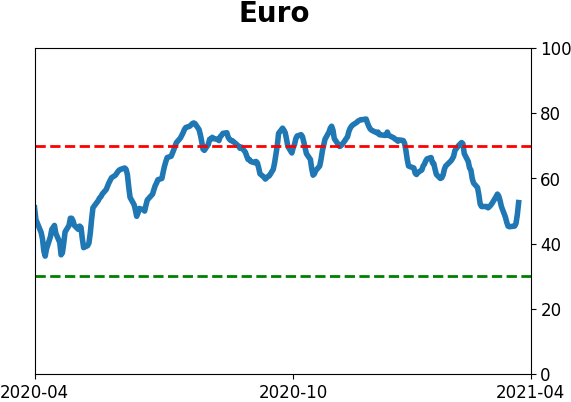
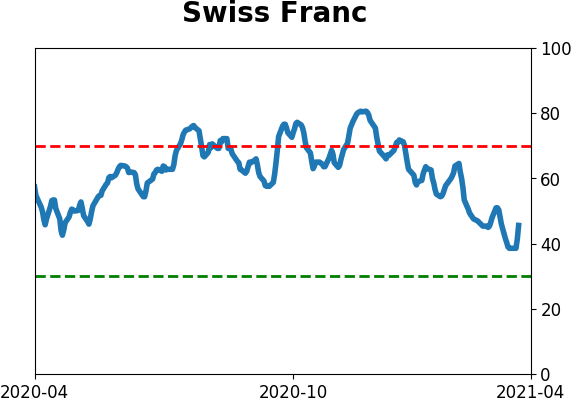
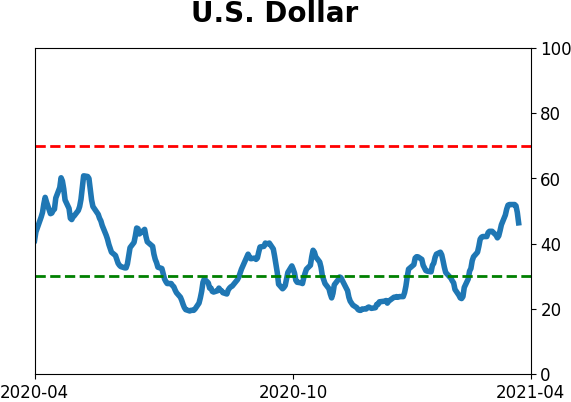
Currency ETF's - 5-Day Moving Average
|
|
|
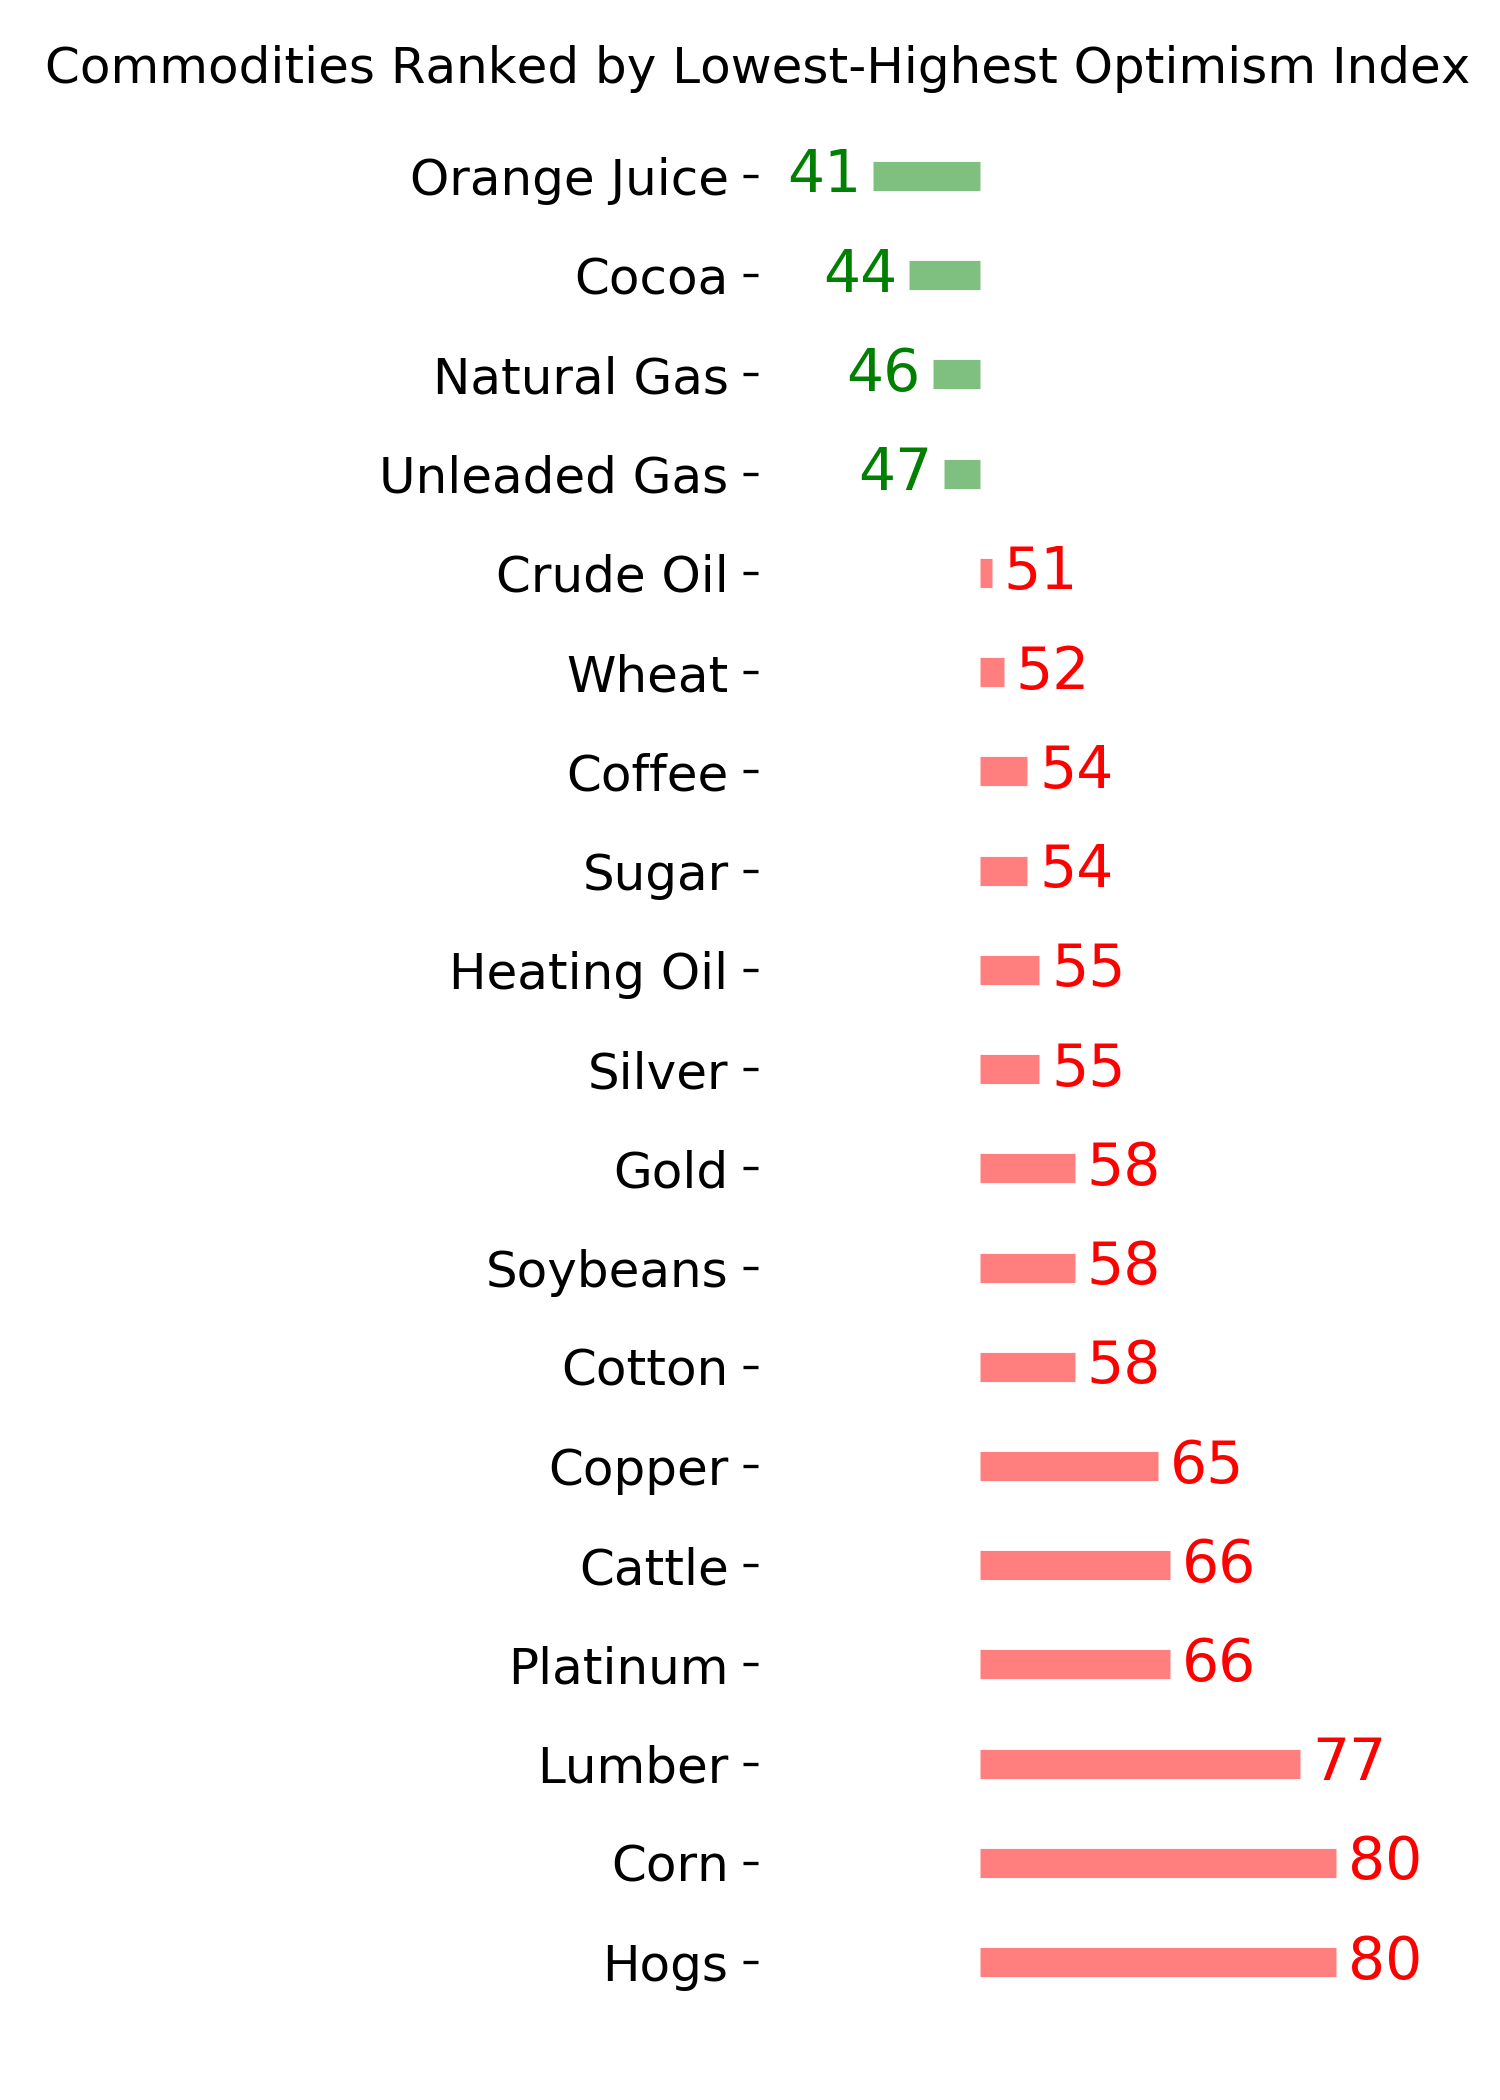
Commodity ETF's - 5-Day Moving Average
|
|