Headlines
|
|
New lows tick higher even with historic year-ago comparisons:
With some weakness this week, there was a flip in the percentage of securities trading at 52-week lows versus those at 52-week highs. There hasn't been a protracted divergence, often seen near major peaks, but it's not necessary. And it likely won't happen given how far the median stock is above its 52-week low.
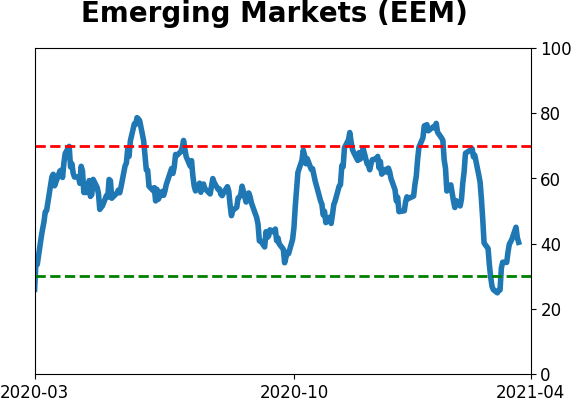
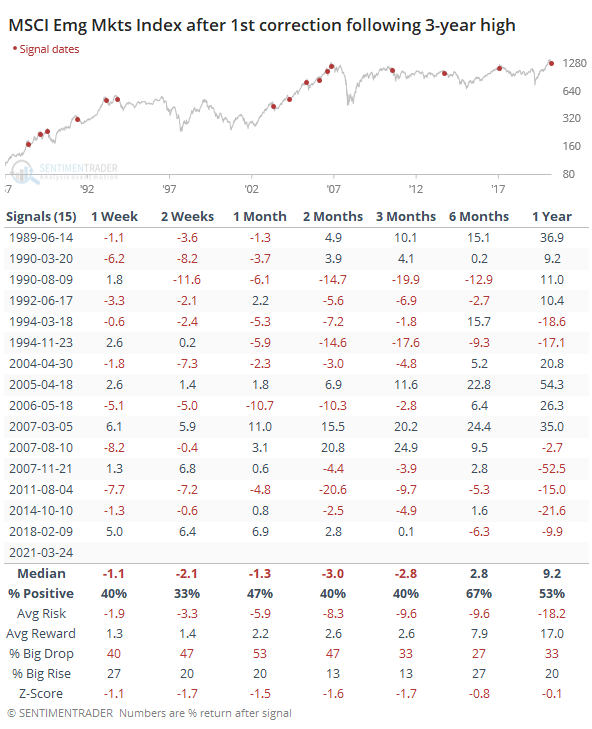
Emerging downtrend: Emerging market stocks have been getting hit hard with a rise in the dollar. The EEM fund is now down 10% from its peak. Using an index with more history, the MSCI Emerging Markets Index, it has suffered 15 other corrections following at least a 3-year high. Based on its prior behavior, bulls have to hope the current decline will unfold differently than the base case.
Bottom Line:
See the Outlook & Allocations page for more details on these summaries STOCKS: Weak sell
The extreme speculation registered in January and February is starting to get wrung out. Internal dynamics have mostly held up, so a return to neutral sentiment conditions would improve the forward risk/reward profile substantially. We're still a ways off from that. BONDS: Weak buy
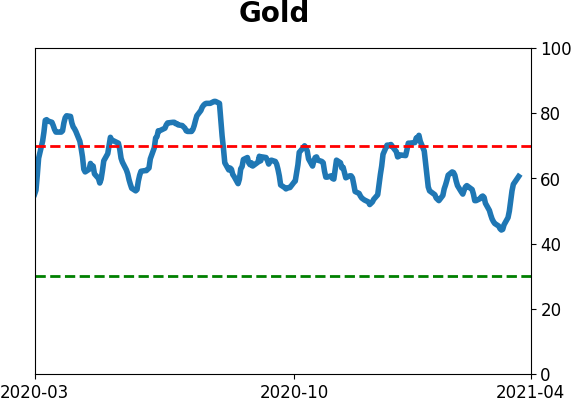
Various parts of the market have been hit in recent weeks, with mild oversold conditions. The Bond Optimism Index is now about as low as it gets during healthy bond market environments. Fixed income isn't responding well, so that needs to be monitored in case it's transitioning to a longer-term negative market environment. GOLD: Weak buy
A dollar trying to rebound from a severe short position has weighed on gold and miners. The types of signals they've given in recent weeks, within the context of their recent surge, have usually resulted in higher prices over a medium- to long-term time frame. Like bonds, gold and miners aren't responding very well, and this needs to be monitored.
|
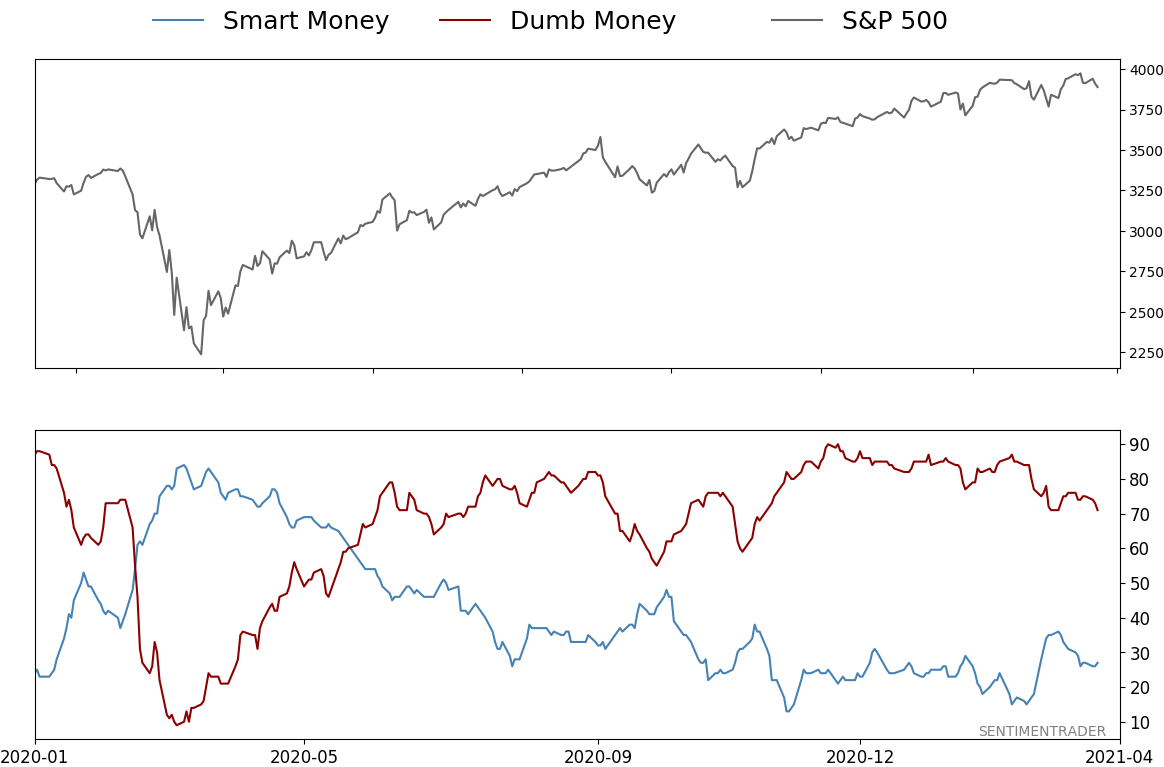
Smart / Dumb Money Confidence
|
Smart Money Confidence: 27%
Dumb Money Confidence: 71%
|
|
Risk Levels
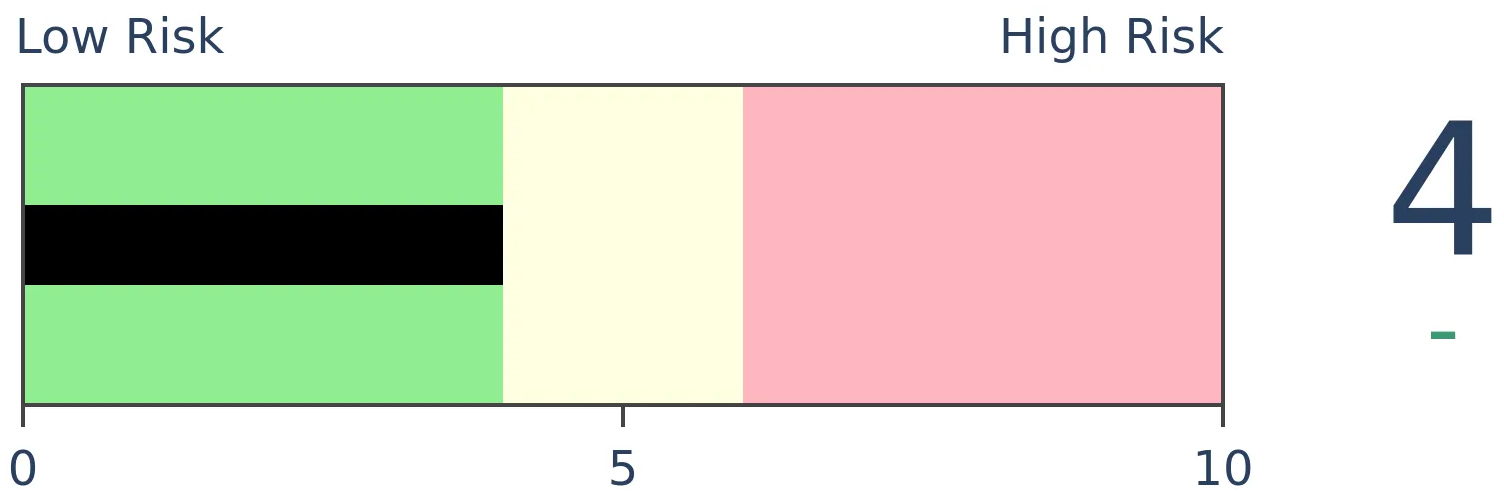
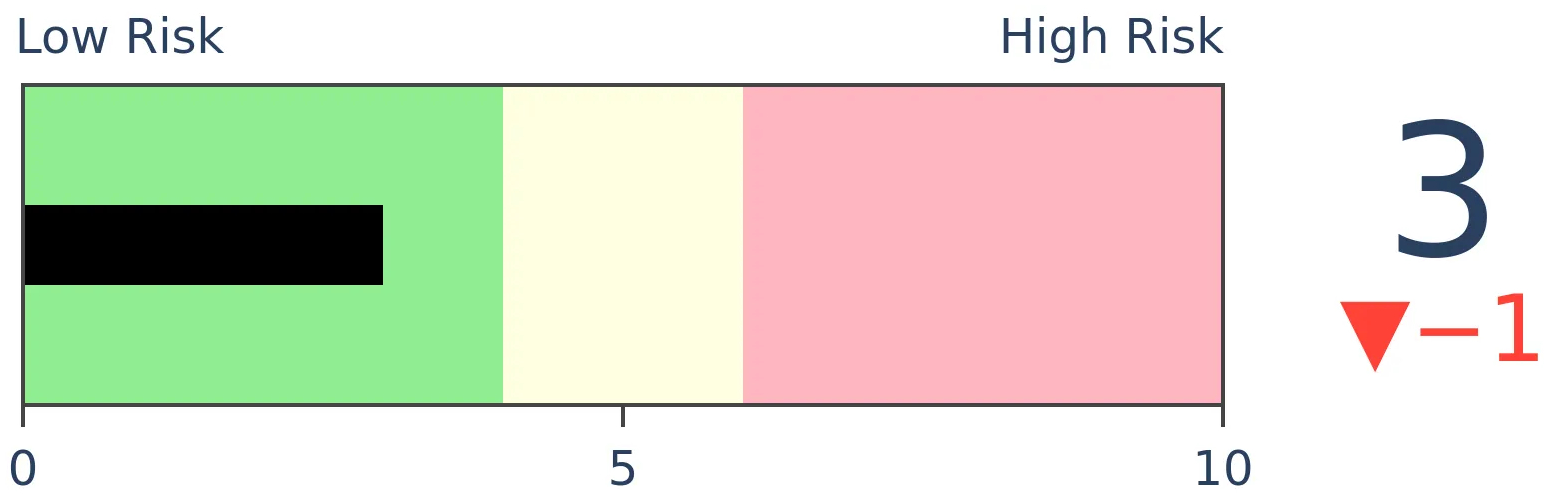
Stocks Short-Term
|
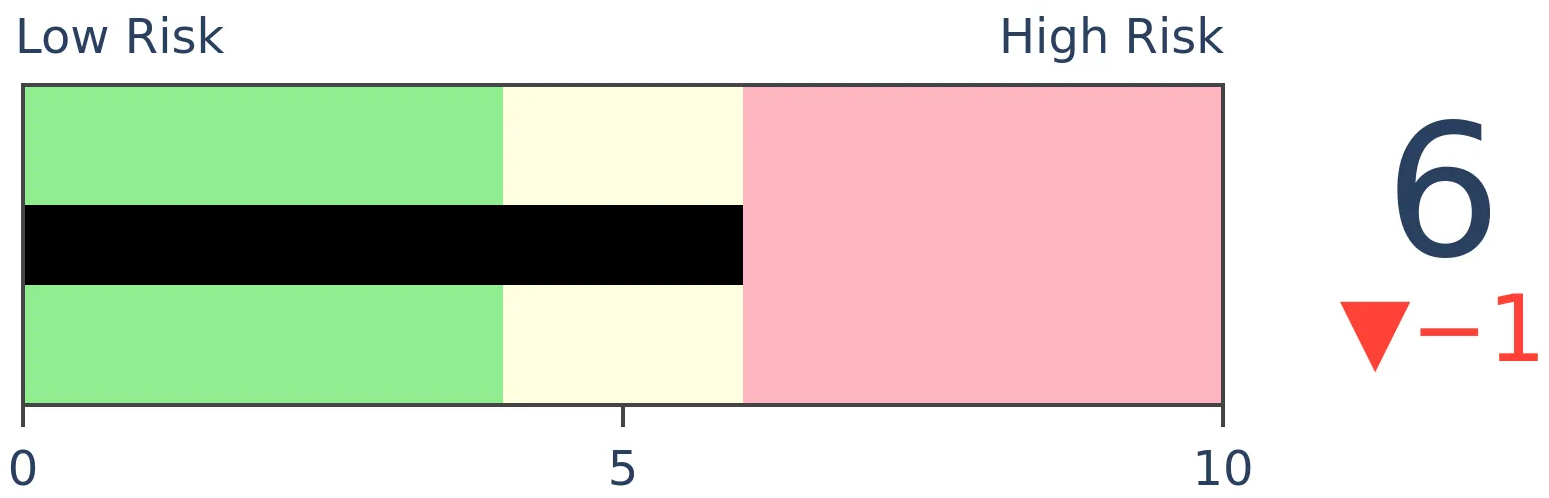
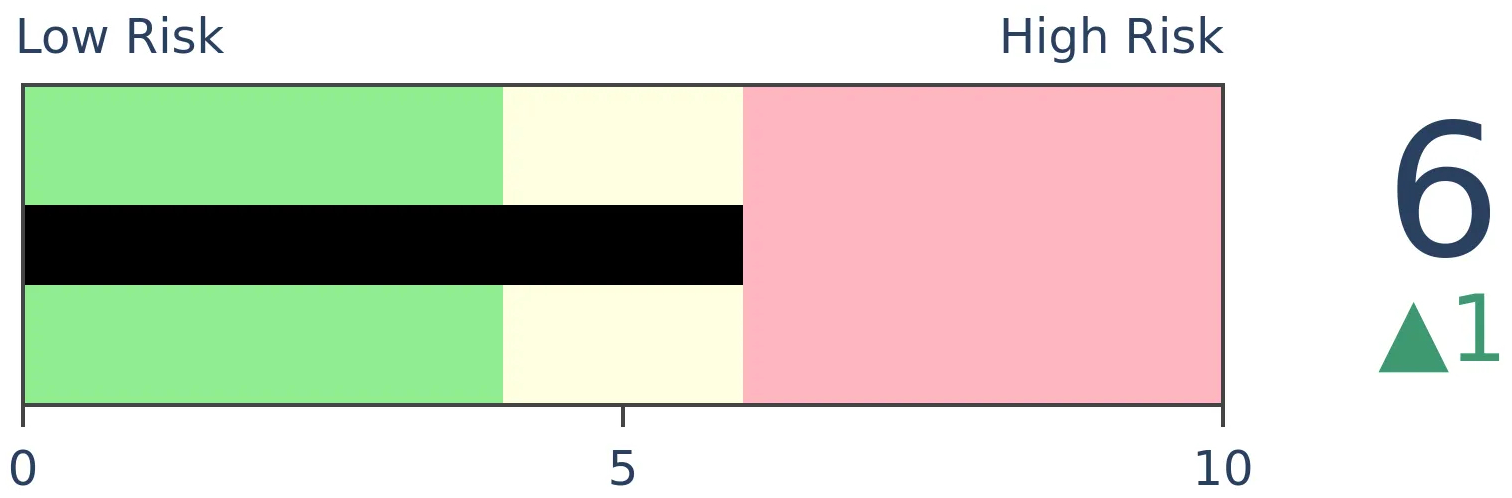
Stocks Medium-Term
|
|
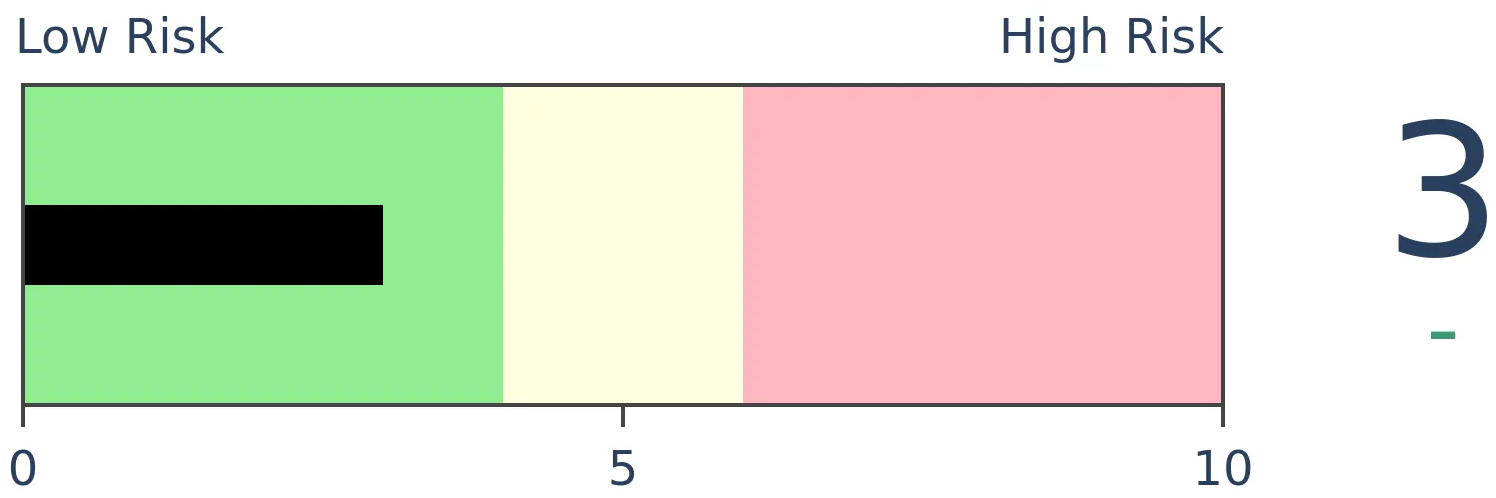
Bonds
|
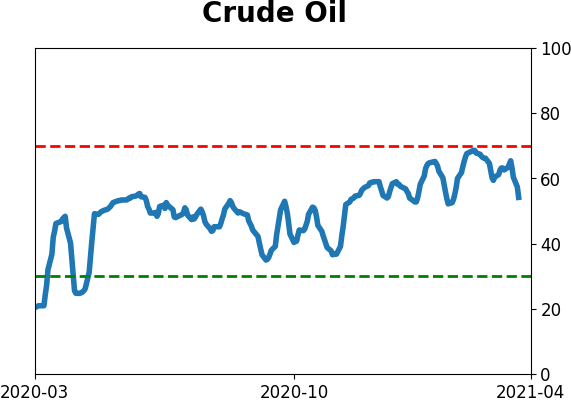
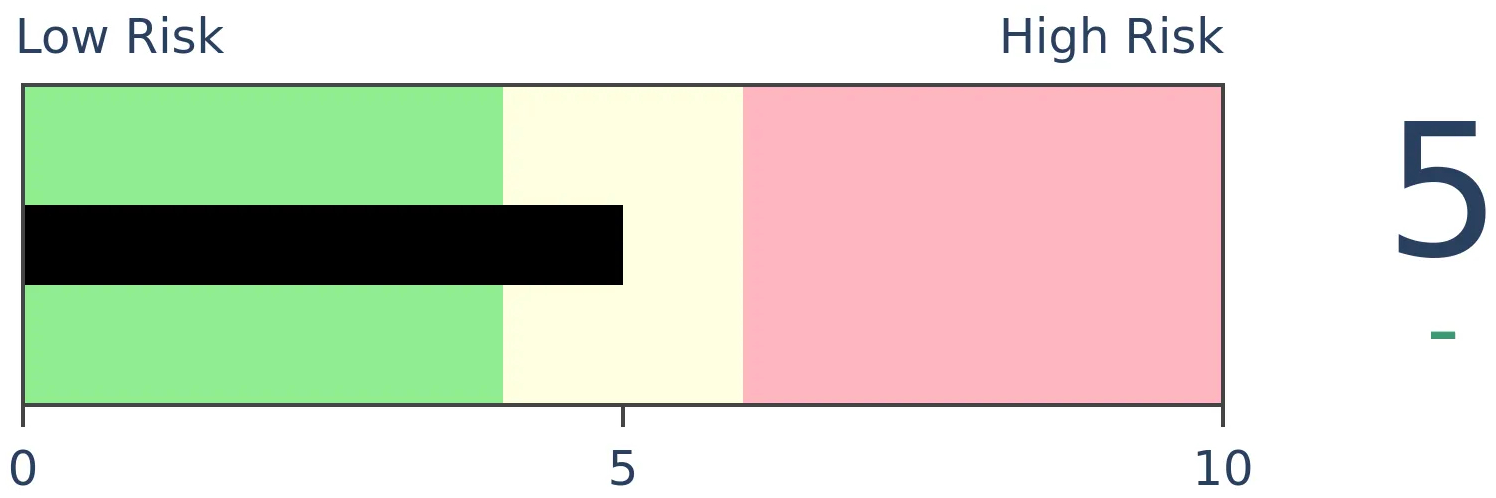
Crude Oil
|
|
Gold
|
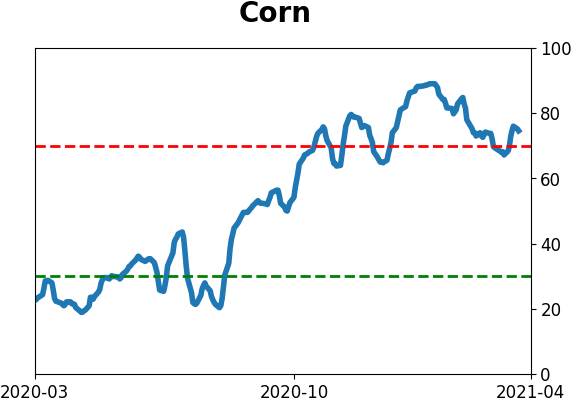
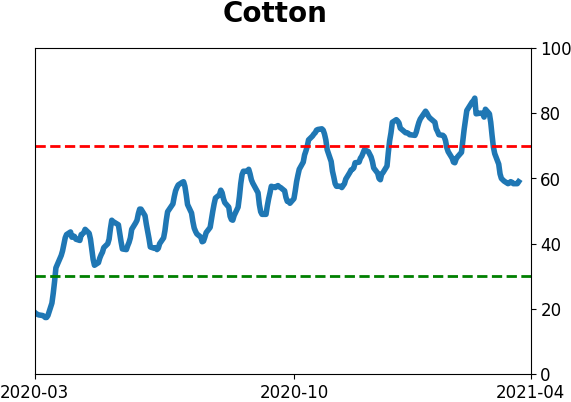
Agriculture
|
|
Research
BOTTOM LINE
With some weakness this week, there was a flip in the percentage of securities trading at 52-week lows versus those at 52-week highs. There hasn't been a protracted divergence, often seen near major peaks, but it's not necessary. And it likely won't happen given how far the median stock is above its 52-week low.
FORECAST / TIMEFRAME
None
|
One of the major developments we've been watching for ever since there was overwhelming evidence of excessive optimism is weakening internals.
That can take any number of forms, and for the most part, we haven't really seen it.
One of the clearest ways to look for this is the net percentage of securities on the NYSE that reach 52-week highs versus 52-week lows. After the surge in new highs in early March, there was a minor divergence as those figures weakened even as the S&P 500 made a new high, but it wasn't major.
More concerning is that by Tuesday, there were more 52-week lows than 52-week highs. We can see the stark difference in forward returns in the chart below when this metric is below zero. It's also a worry that this has flipped so soon after a new high in the S&P, triggering the Titanic Syndrome noted in Tuesday's Daily Report.
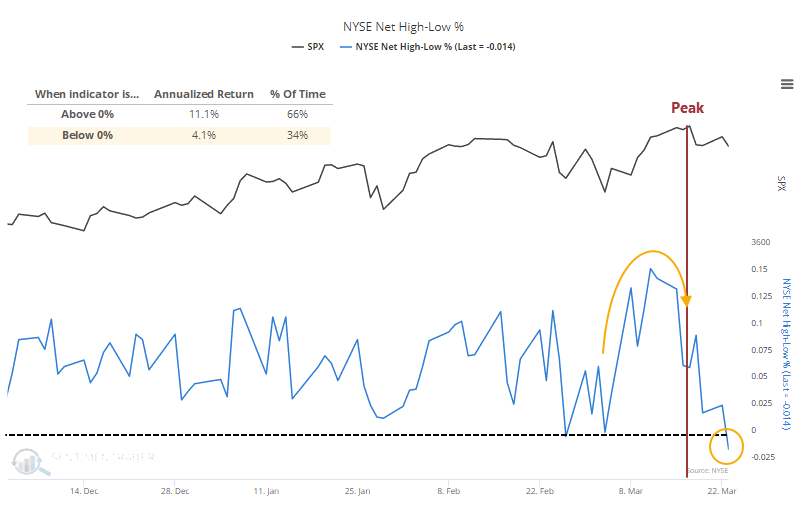
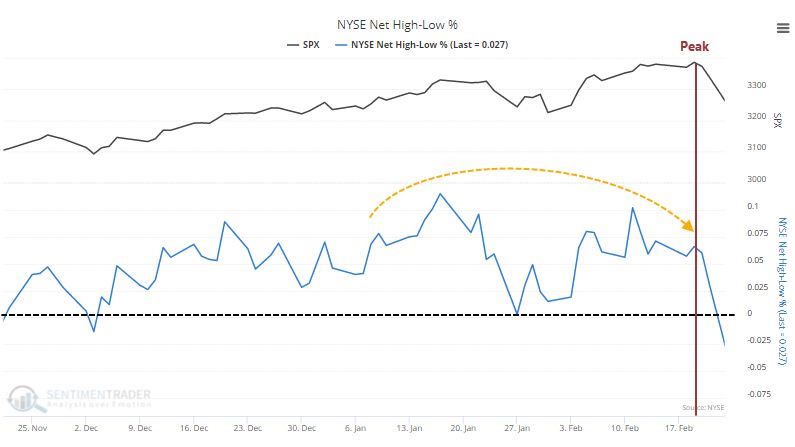
When the S&P peaked last year, there was more of a divergence but even that wasn't too major. And when stocks peaked, there were still many more issues hitting new highs than new lows.
The peak prior to that, in September 2018, was much more pronounced. Even as stocks were hitting new highs, there were actually more new lows on the NYSE than new highs. Major warning sign.
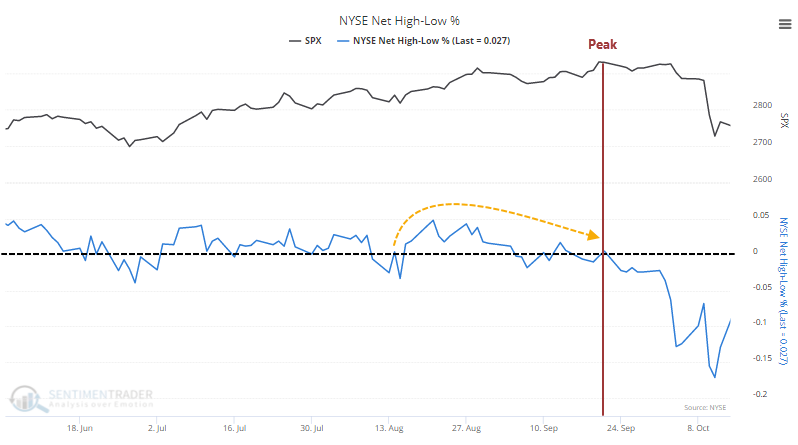
The big rally at the end of 2017 and into early 2018 didn't show any major divergence before stocks peaked.
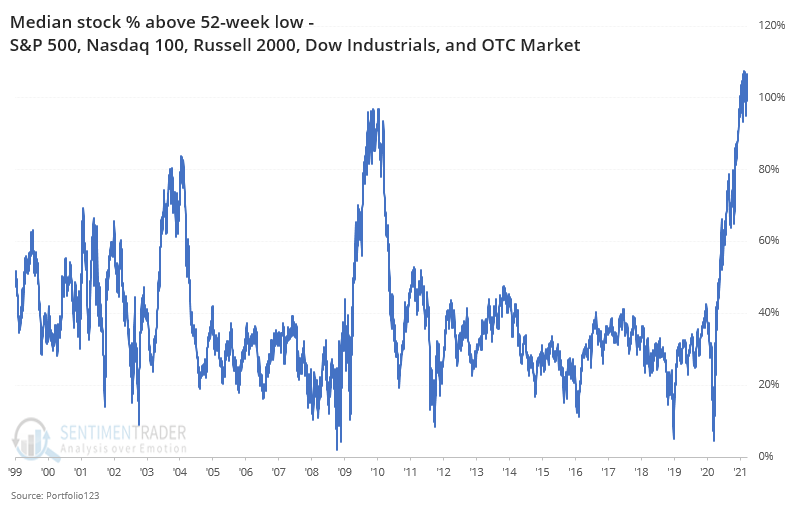
The reason we shouldn't expect a divergence this time is simply how far stocks have traveled. Across all the major equity indexes, and throwing in over-the-counter stocks just because they have seen such a tremendous surge of interest, the median stock is up more than 100% from its lows.
That's more than the initial recoveries off the bear market bottoms in 2003 and 2009.
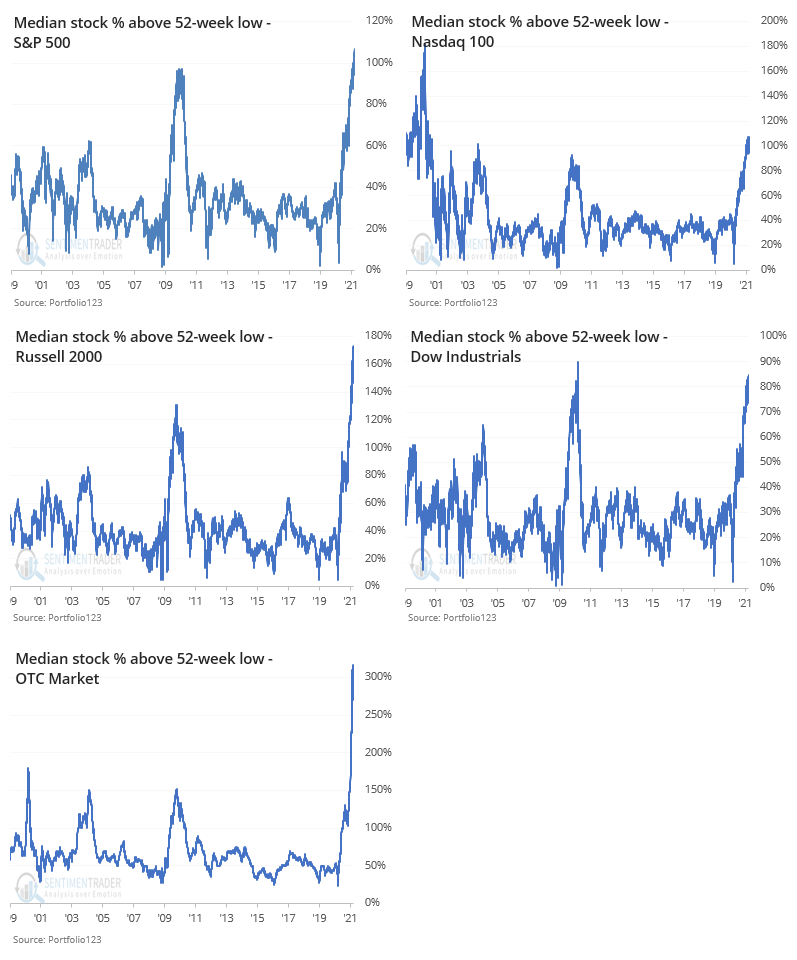
Among the indexes, we can see just how much the average stock has rallied.
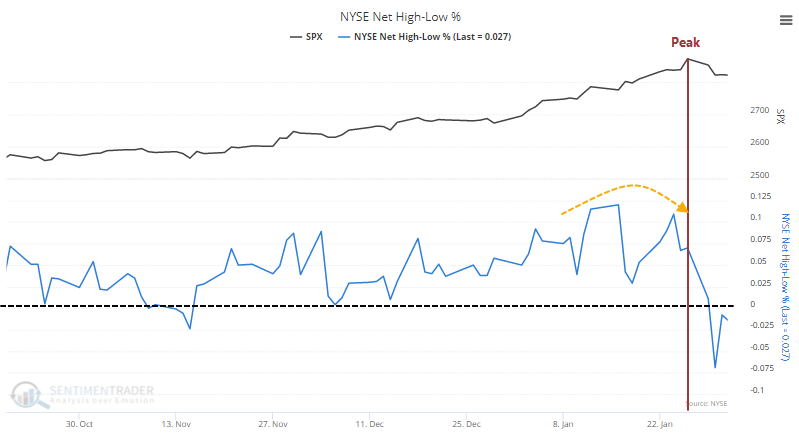
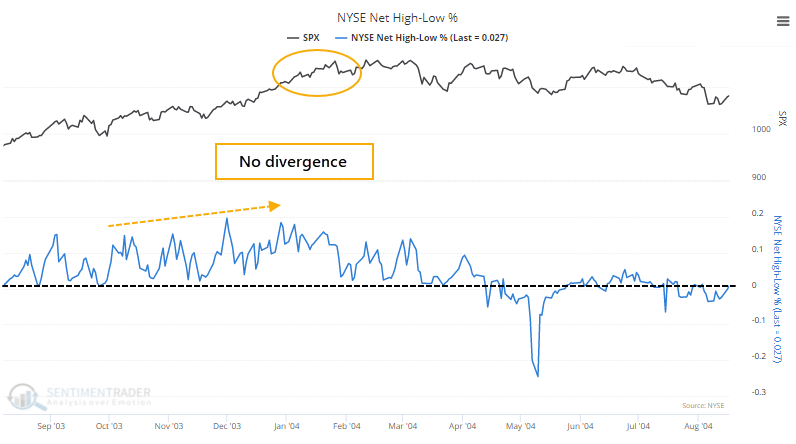
If we go back to the other two times when the median stock was at least 80% above its 52-week low, then we can see if there were divergences then between the S&P 500 and the NYSE Net New High / New Low line.
In early 2004, when the median stock was more than 80% above its low, breadth was still very strong and there was no divergence before stocks slumped into months of choppy downside.
Same goes for early 2010, when the median stock had doubled off its financial crisis low.
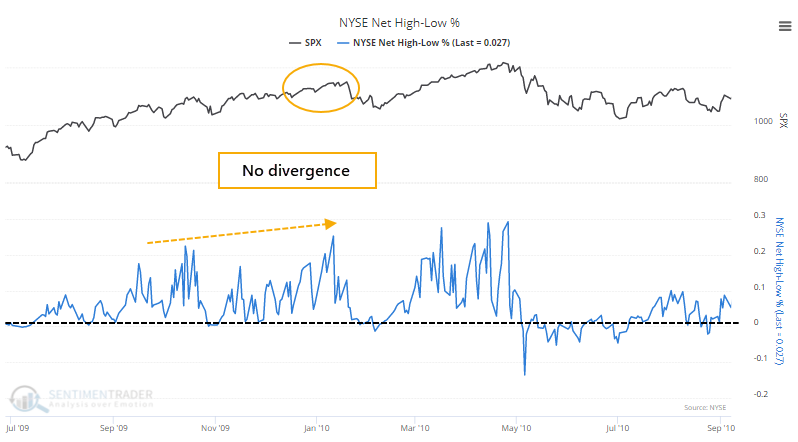
Based on this, we're not likely to see the 52-week low list grow any time soon. The average stock has skyrocketed off its low from a year ago, so it will take either a massive decline, or simply more time to generate easier 52-week comparisons, before the list will grow and potentially trigger a divergence with indexes like the S&P. Those divergences, while a warning sign if present, are not required before stocks correct. The more the net percentage of securities remains below zero, the more risk there is of a weakening market.
Active Studies
| Time Frame | Bullish | Bearish | | Short-Term | 0 | 0 | | Medium-Term | 2 | 10 | | Long-Term | 16 | 4 |
|
Indicators at Extremes
Portfolio
| Position | Description | Weight % | Added / Reduced | Date | | Stocks | RSP | 4.9 | Reduced 4% | 2021-02-09 | | Bonds | 30.0% BND, 8.8% SCHP | 38.8 | Added 15.1% | 2021-02-18 | | Commodities | GCC | 2.3 | Reduced 2.1%
| 2020-09-04 | | Precious Metals | GDX | 9.0 | Added 0.1% | 2021-02-18 | | Special Situations | 7.3% XLE, 4.8% PSCE | 12.1 | Reduced 5.6% | 2021-02-18 | | Cash | | 32.8 | | |
|
Updates (Changes made today are underlined)
With a market that has seen the kinds of broad participation and big breath thrusts like we did in the fall, it's hard to become too negative. Those kinds of conditions have consistently preceded higher returns over the next 6-12 months. It's the interim that's more of an issue. Even conditions like that haven't prevented some shorter-term pullbacks. And when we combine an environment where speculation is rampant and recent days have seen an increase in cracks under the surface of the indexes, it's enough to become more defensive over a short- to medium-term time frame. We still don't have much confirmation from the price action in the indexes, so those who are more conservative would likely wait before increasing cash levels. I've decreased risk exposure a bit more, mainly in terms of energy stocks and the ANGL fund, while adding more to the broader bond market. RETURN YTD: 5.4% 2020: 8.1%, 2019: 12.6%, 2018: 0.6%, 2017: 3.8%, 2016: 17.1%, 2015: 9.2%, 2014: 14.5%, 2013: 2.2%, 2012: 10.8%, 2011: 16.5%, 2010: 15.3%, 2009: 23.9%, 2008: 16.2%, 2007: 7.8%
|
|
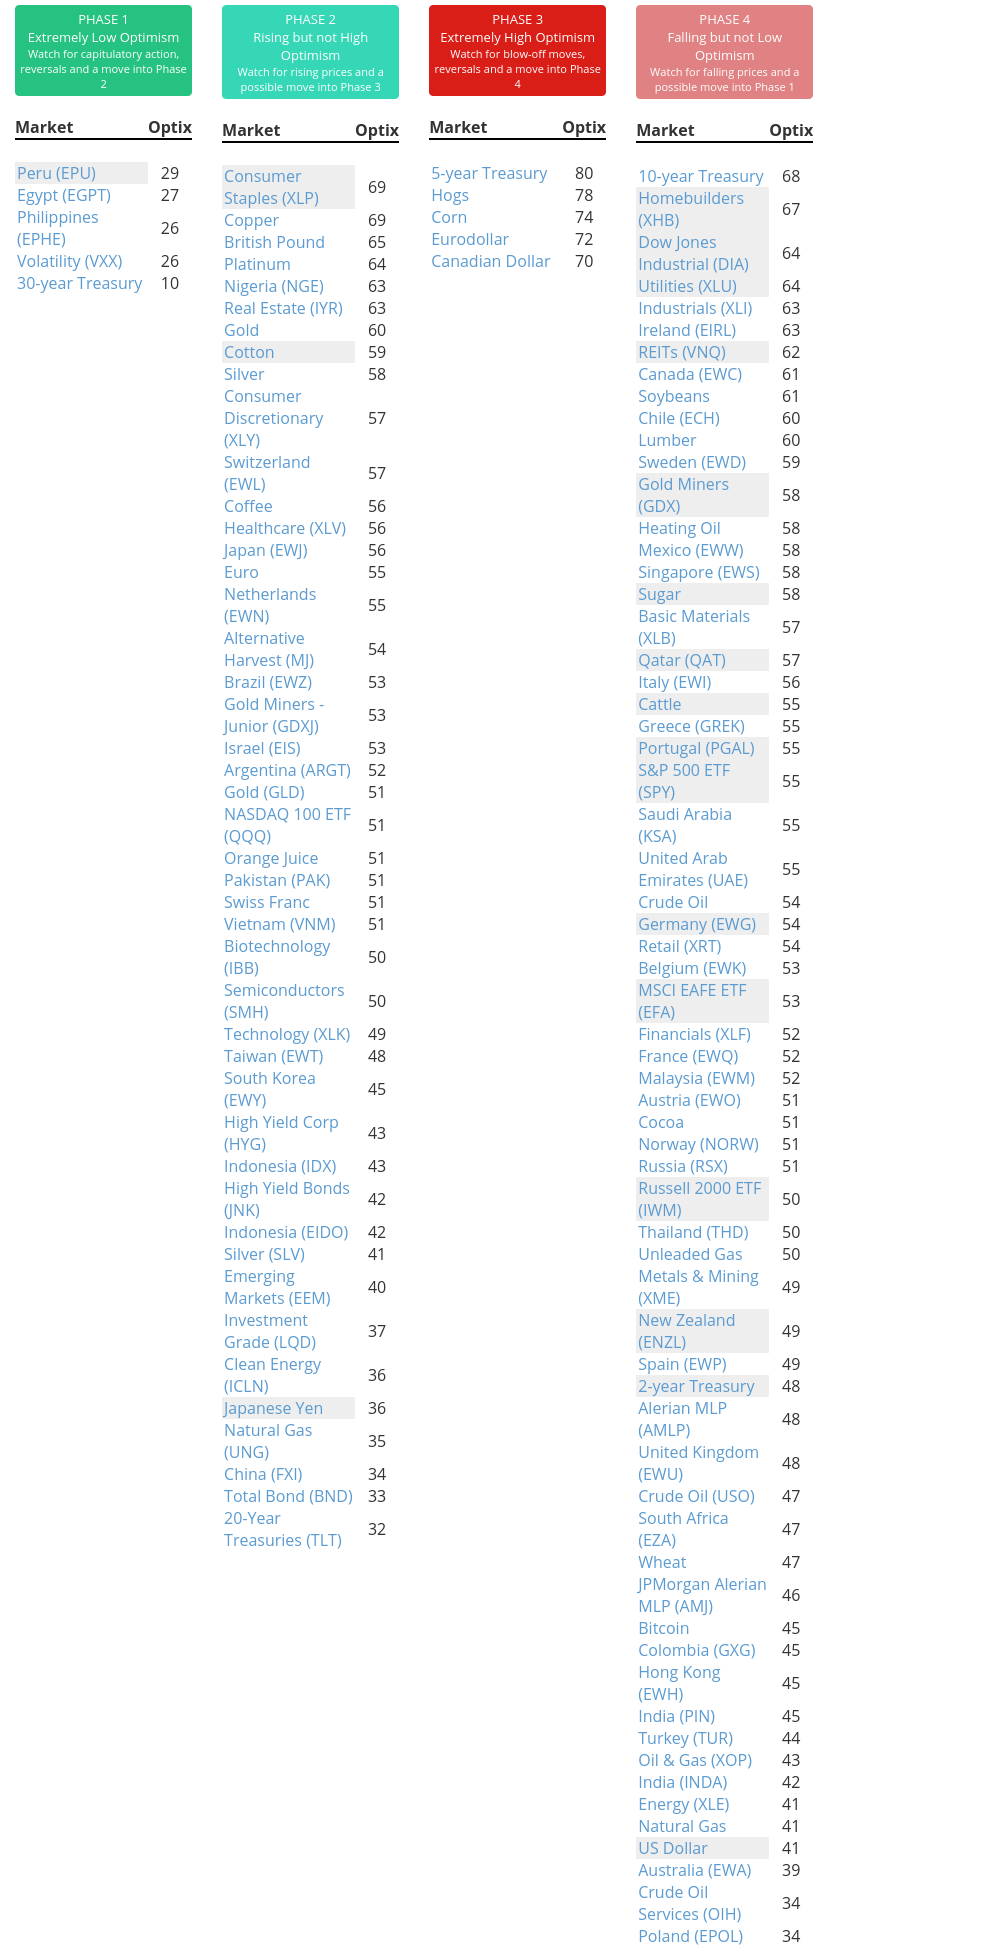
Phase Table
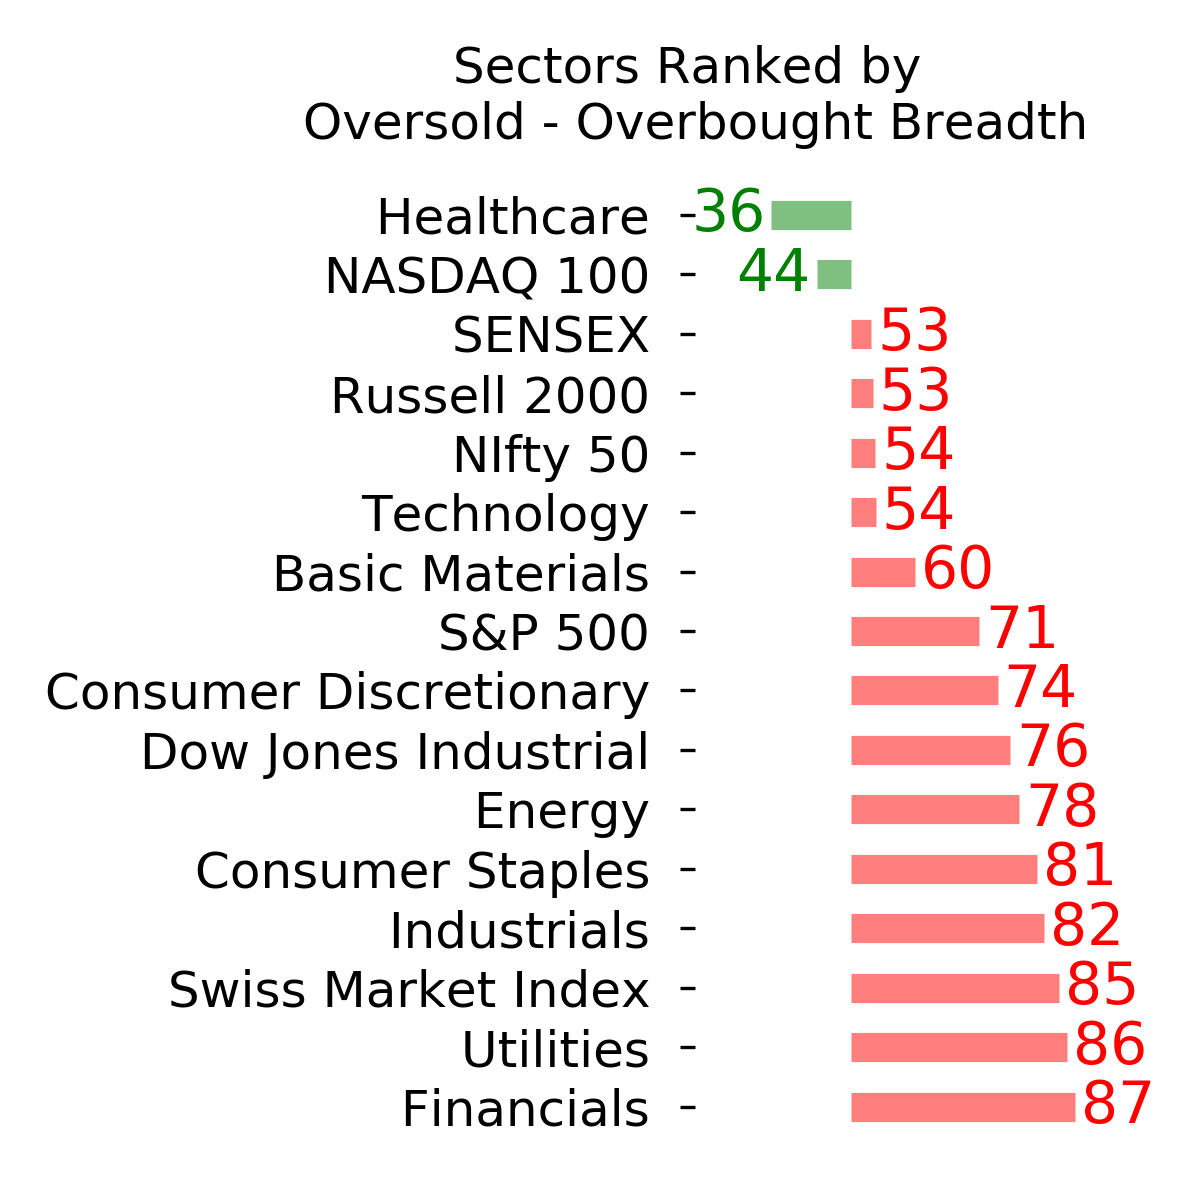
Ranks
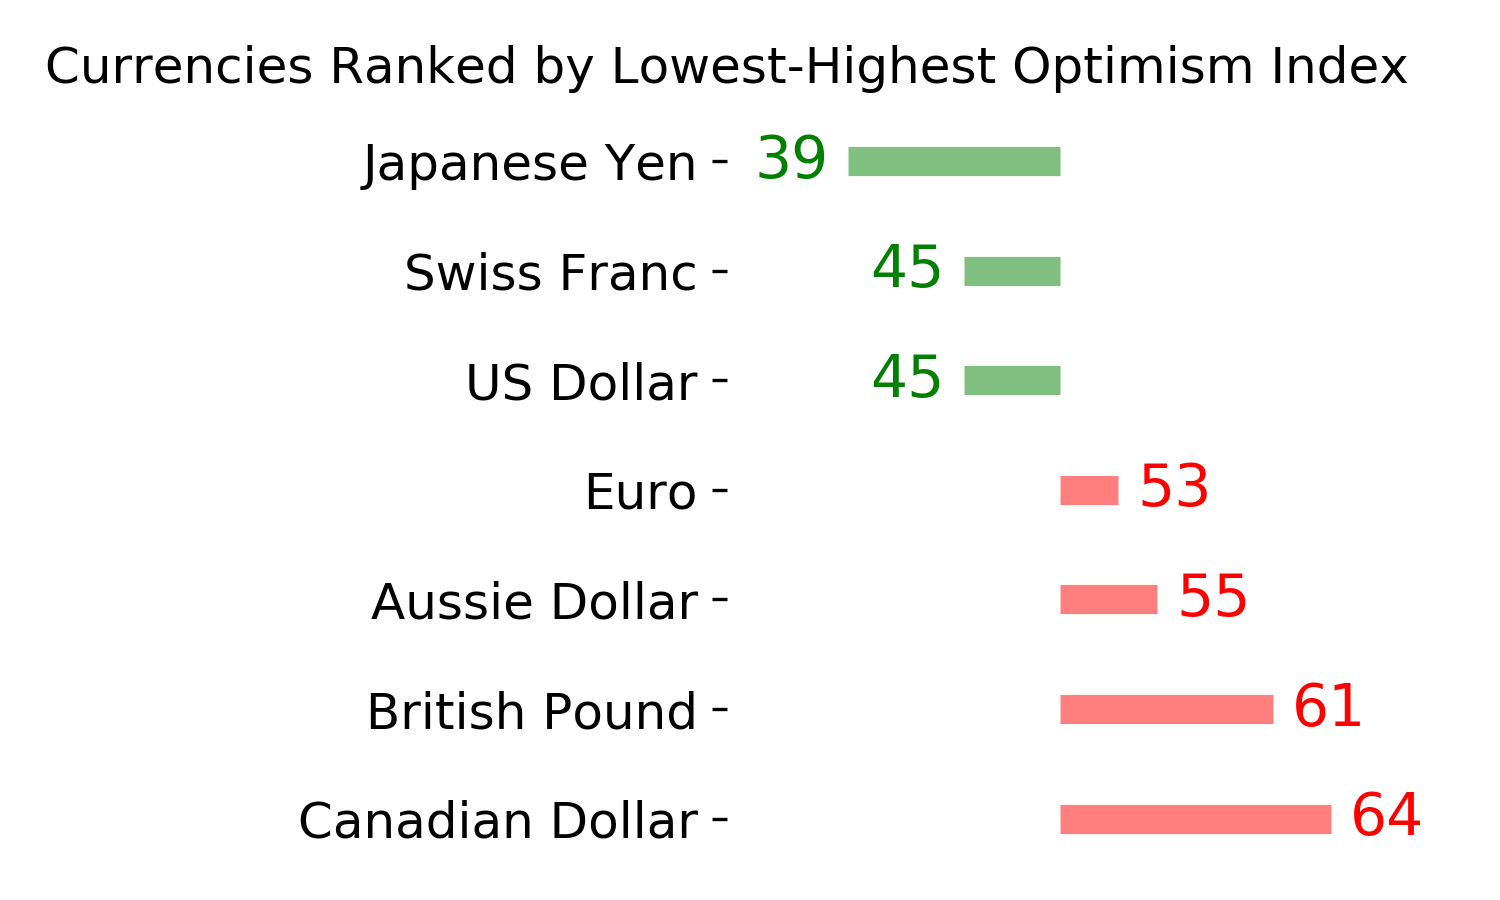
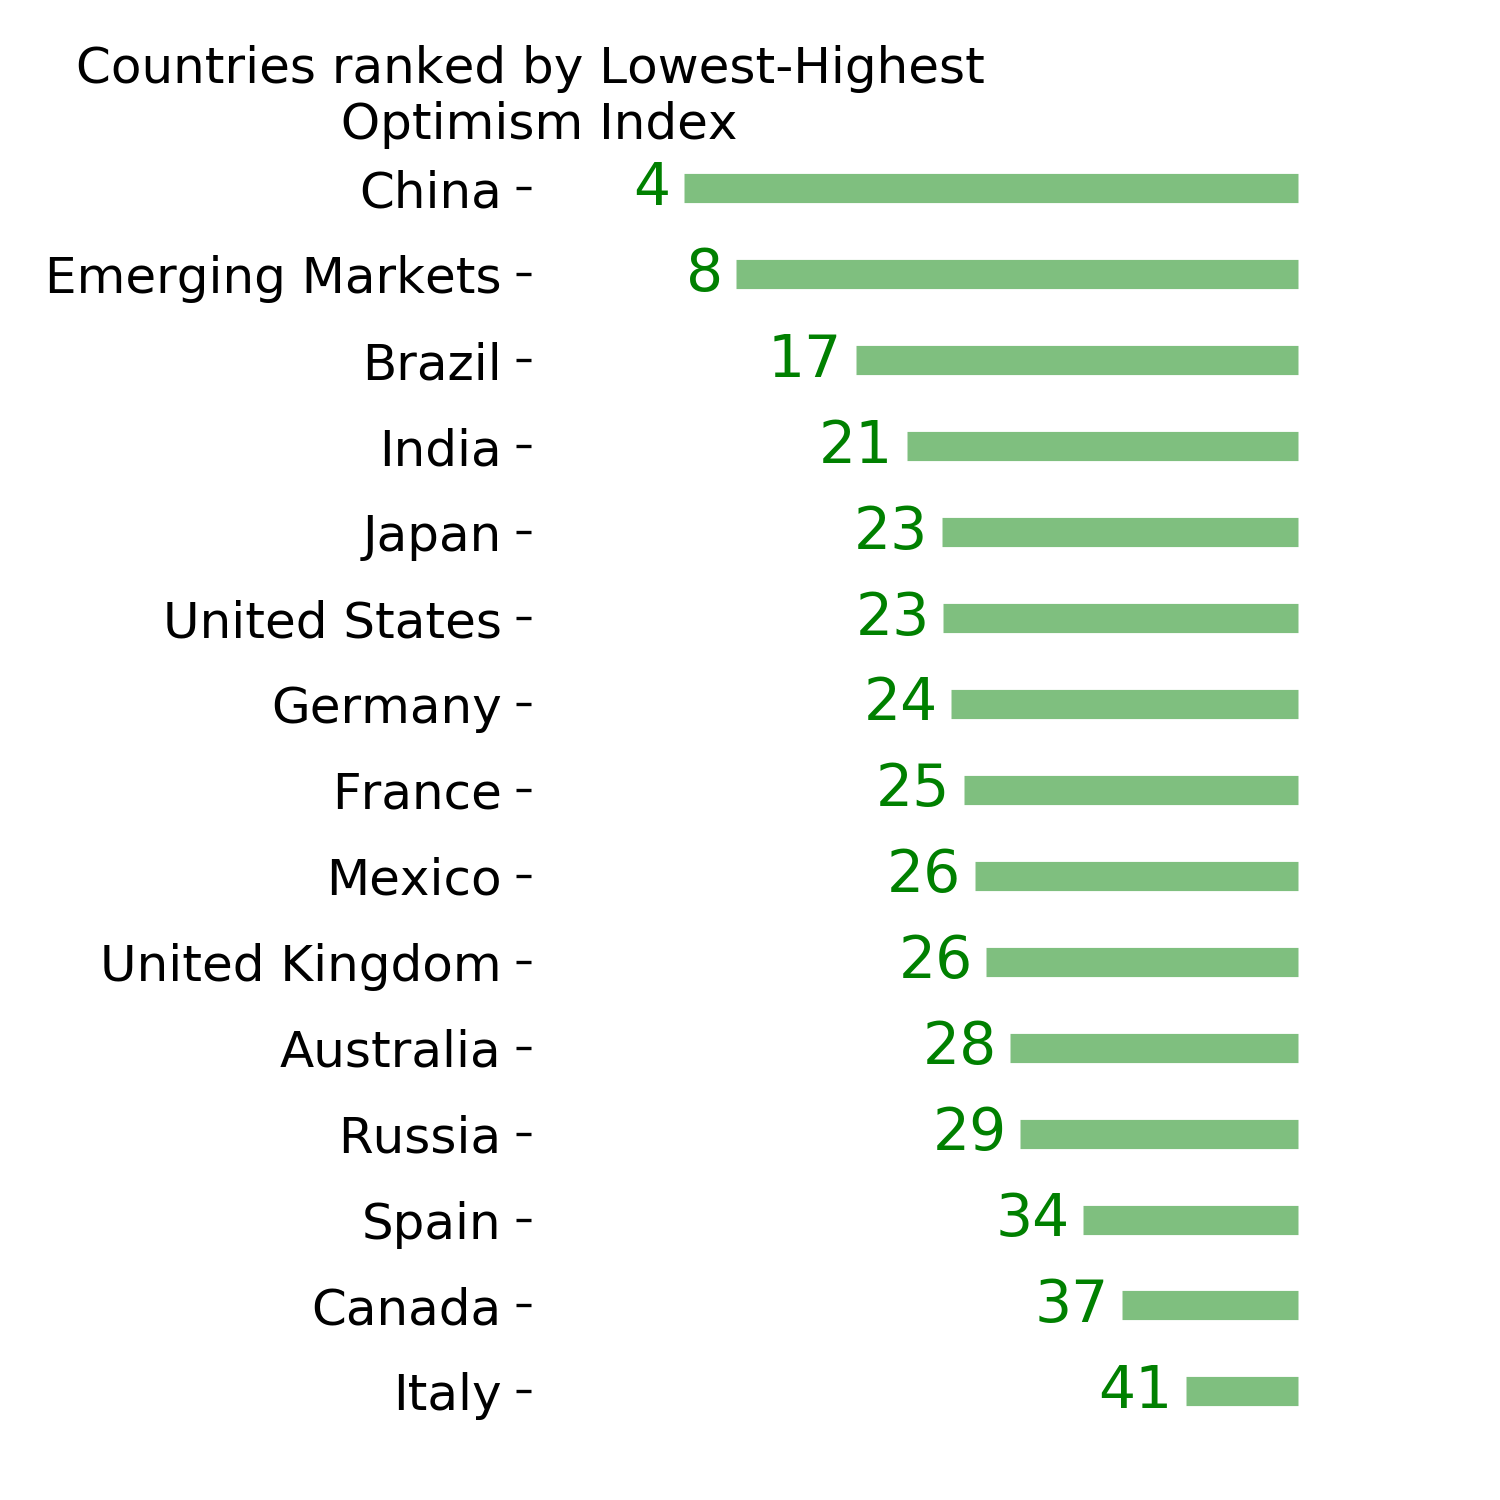
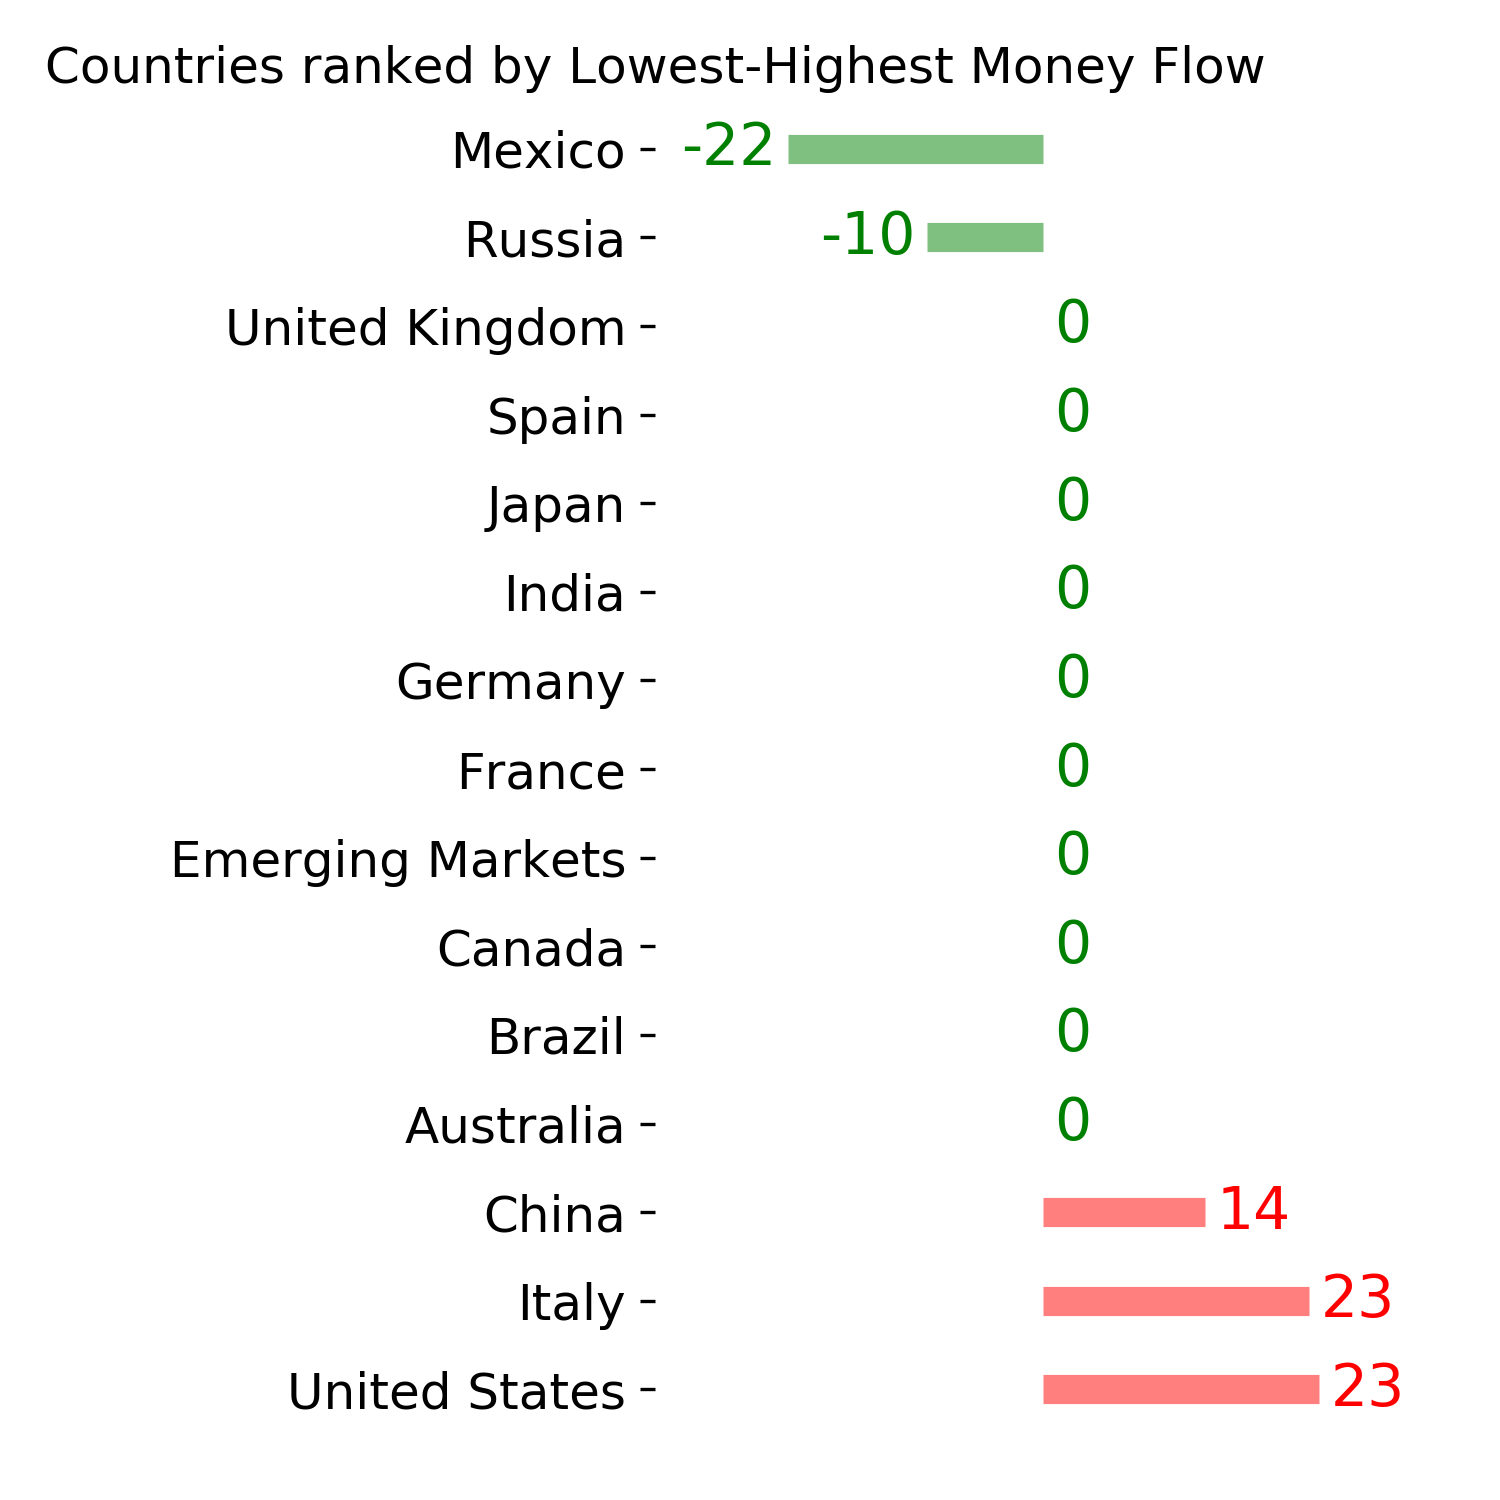
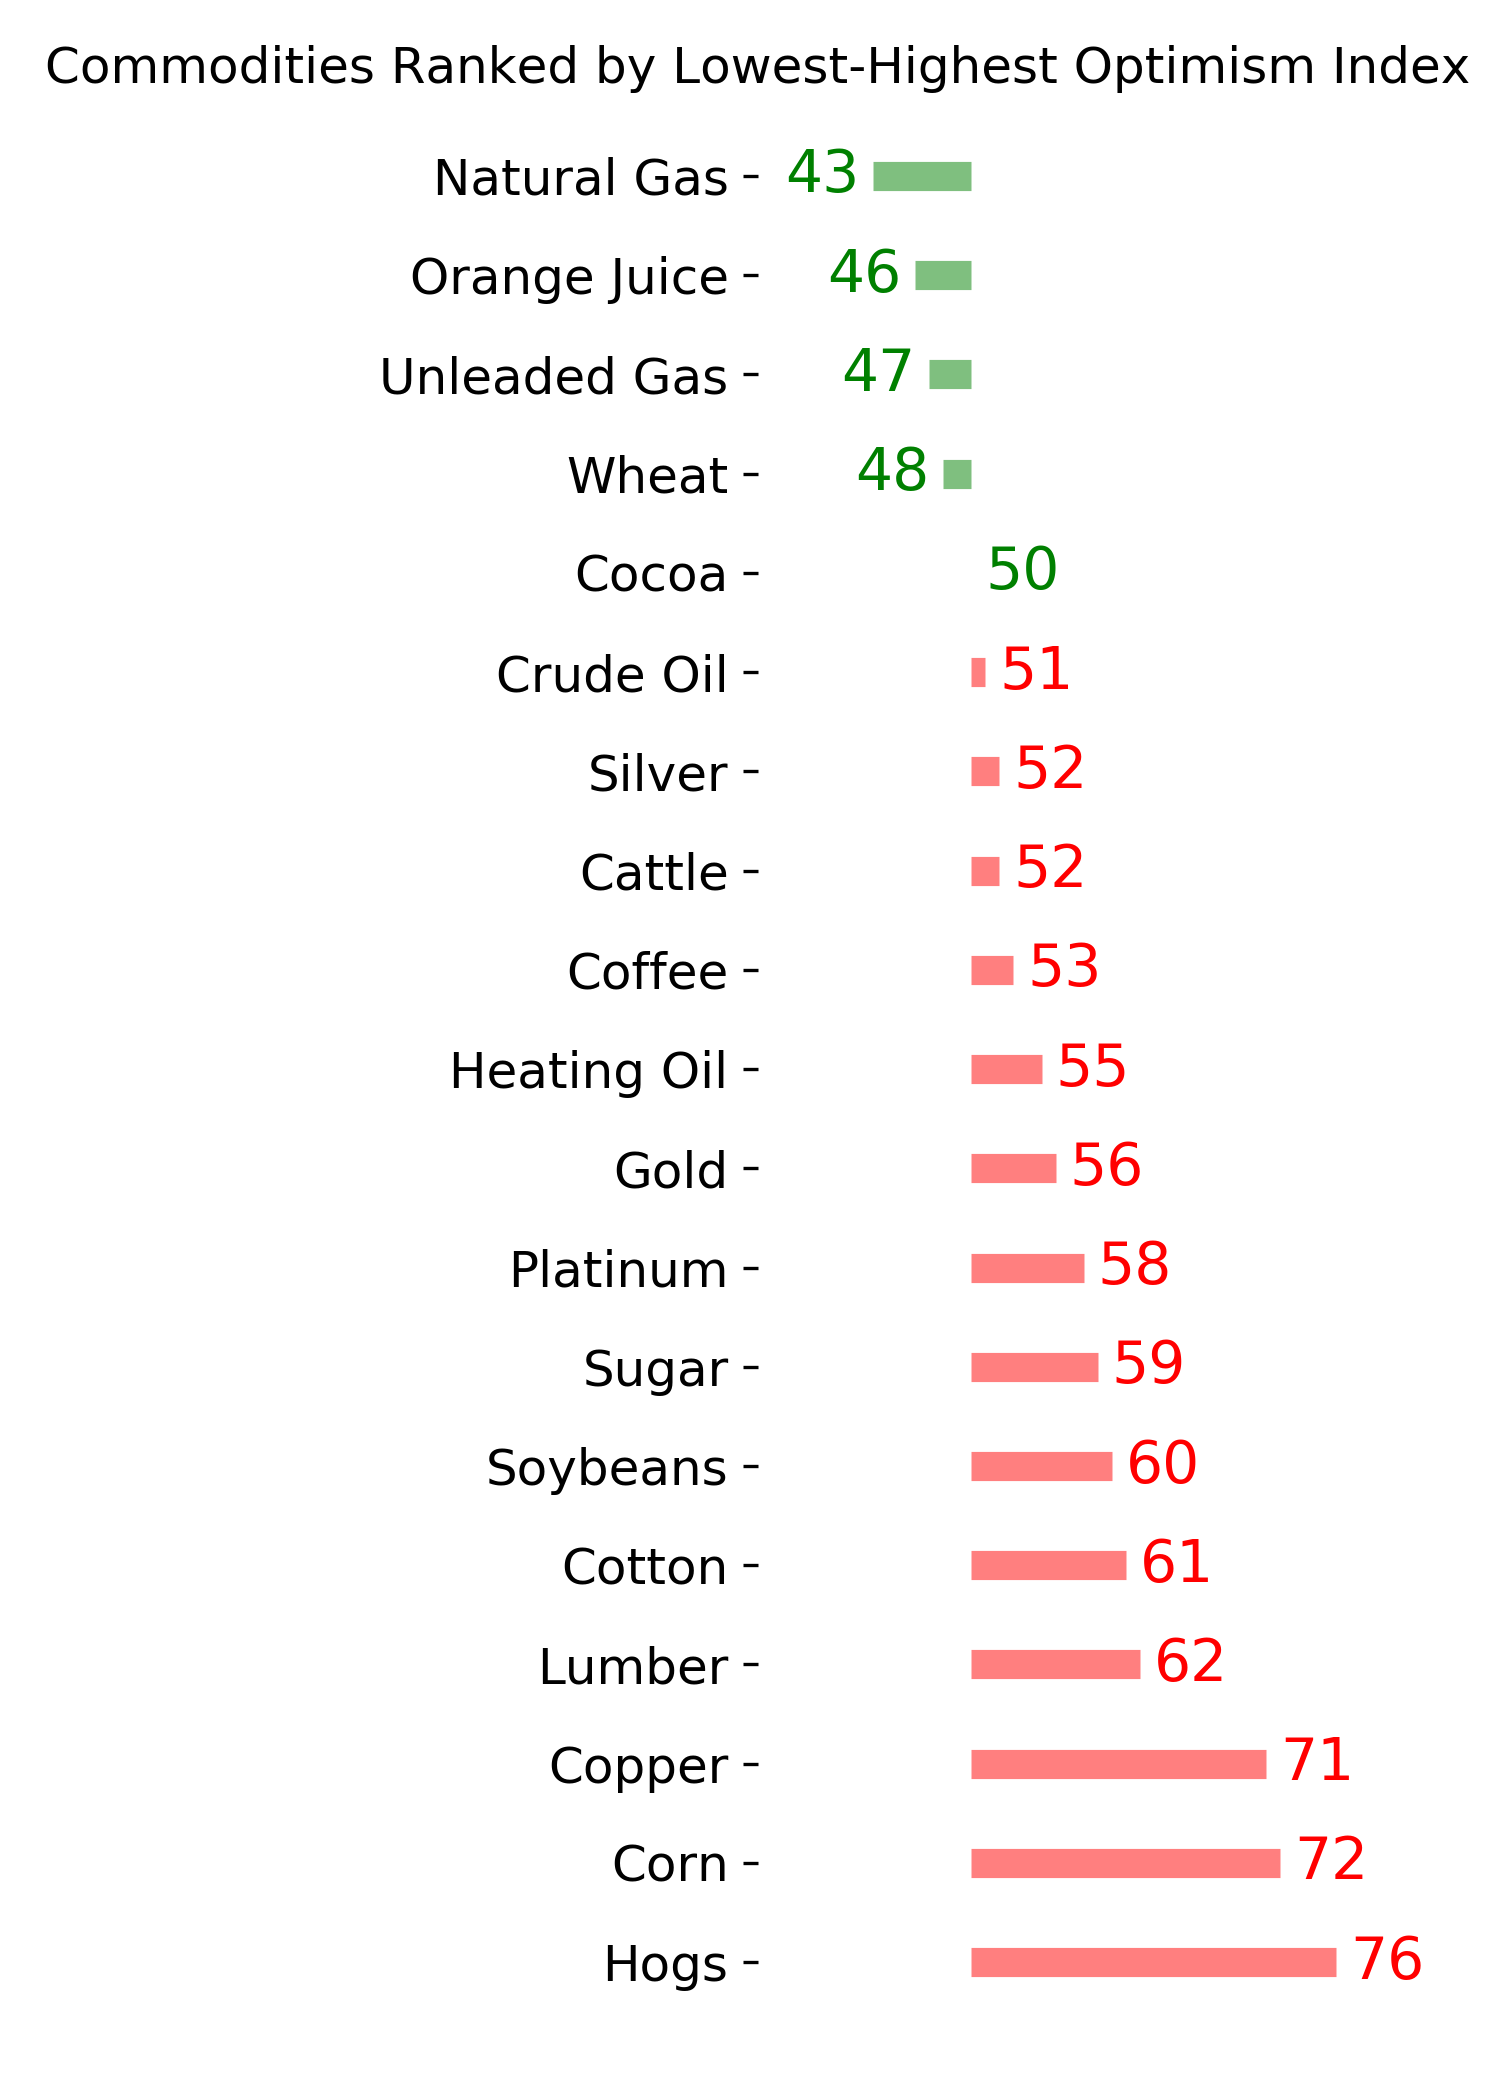
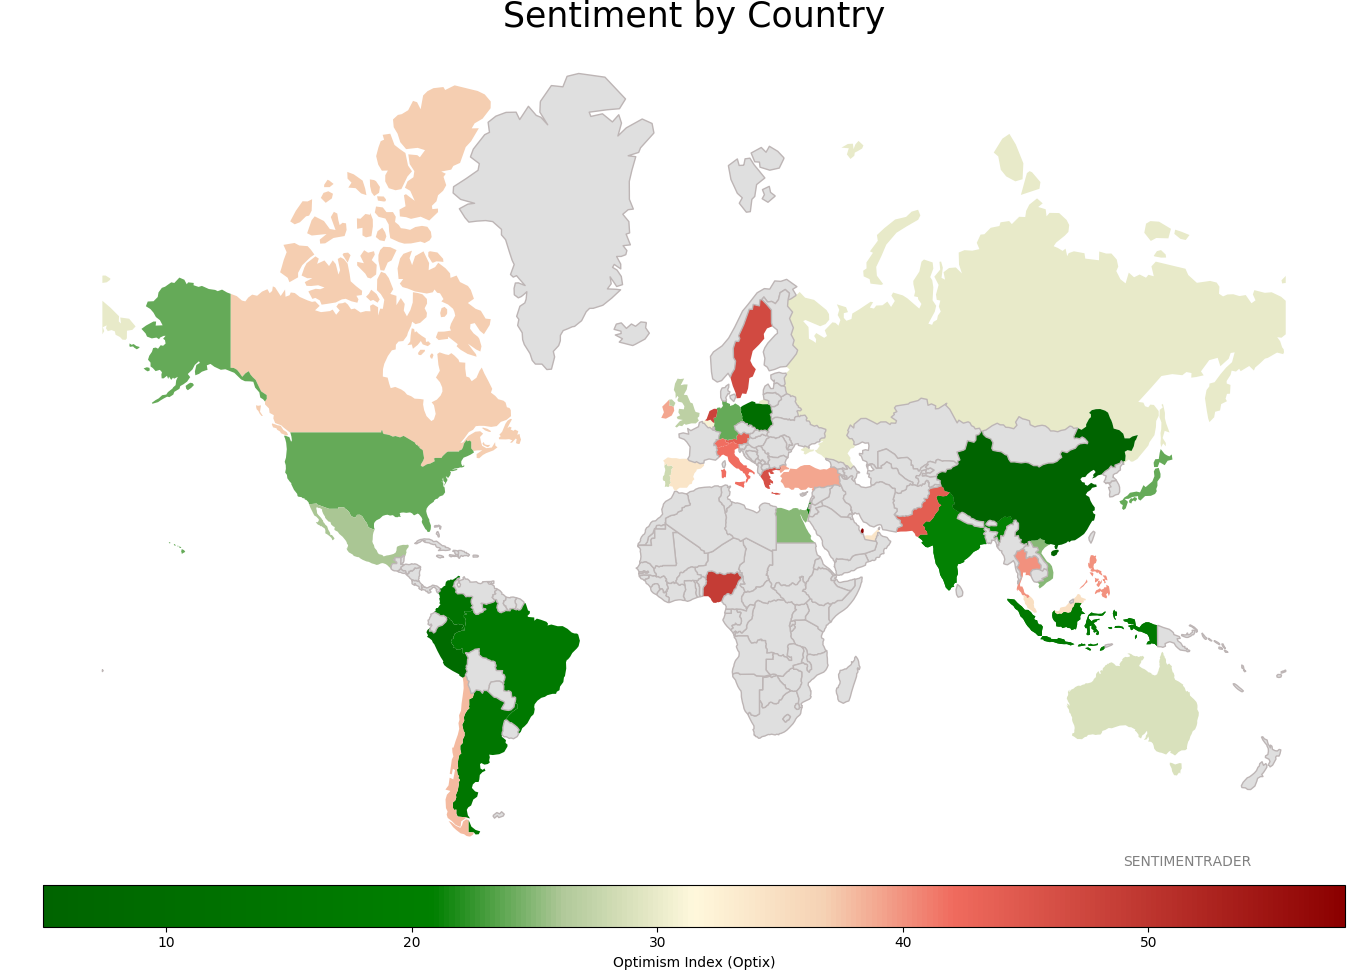
Sentiment Around The World
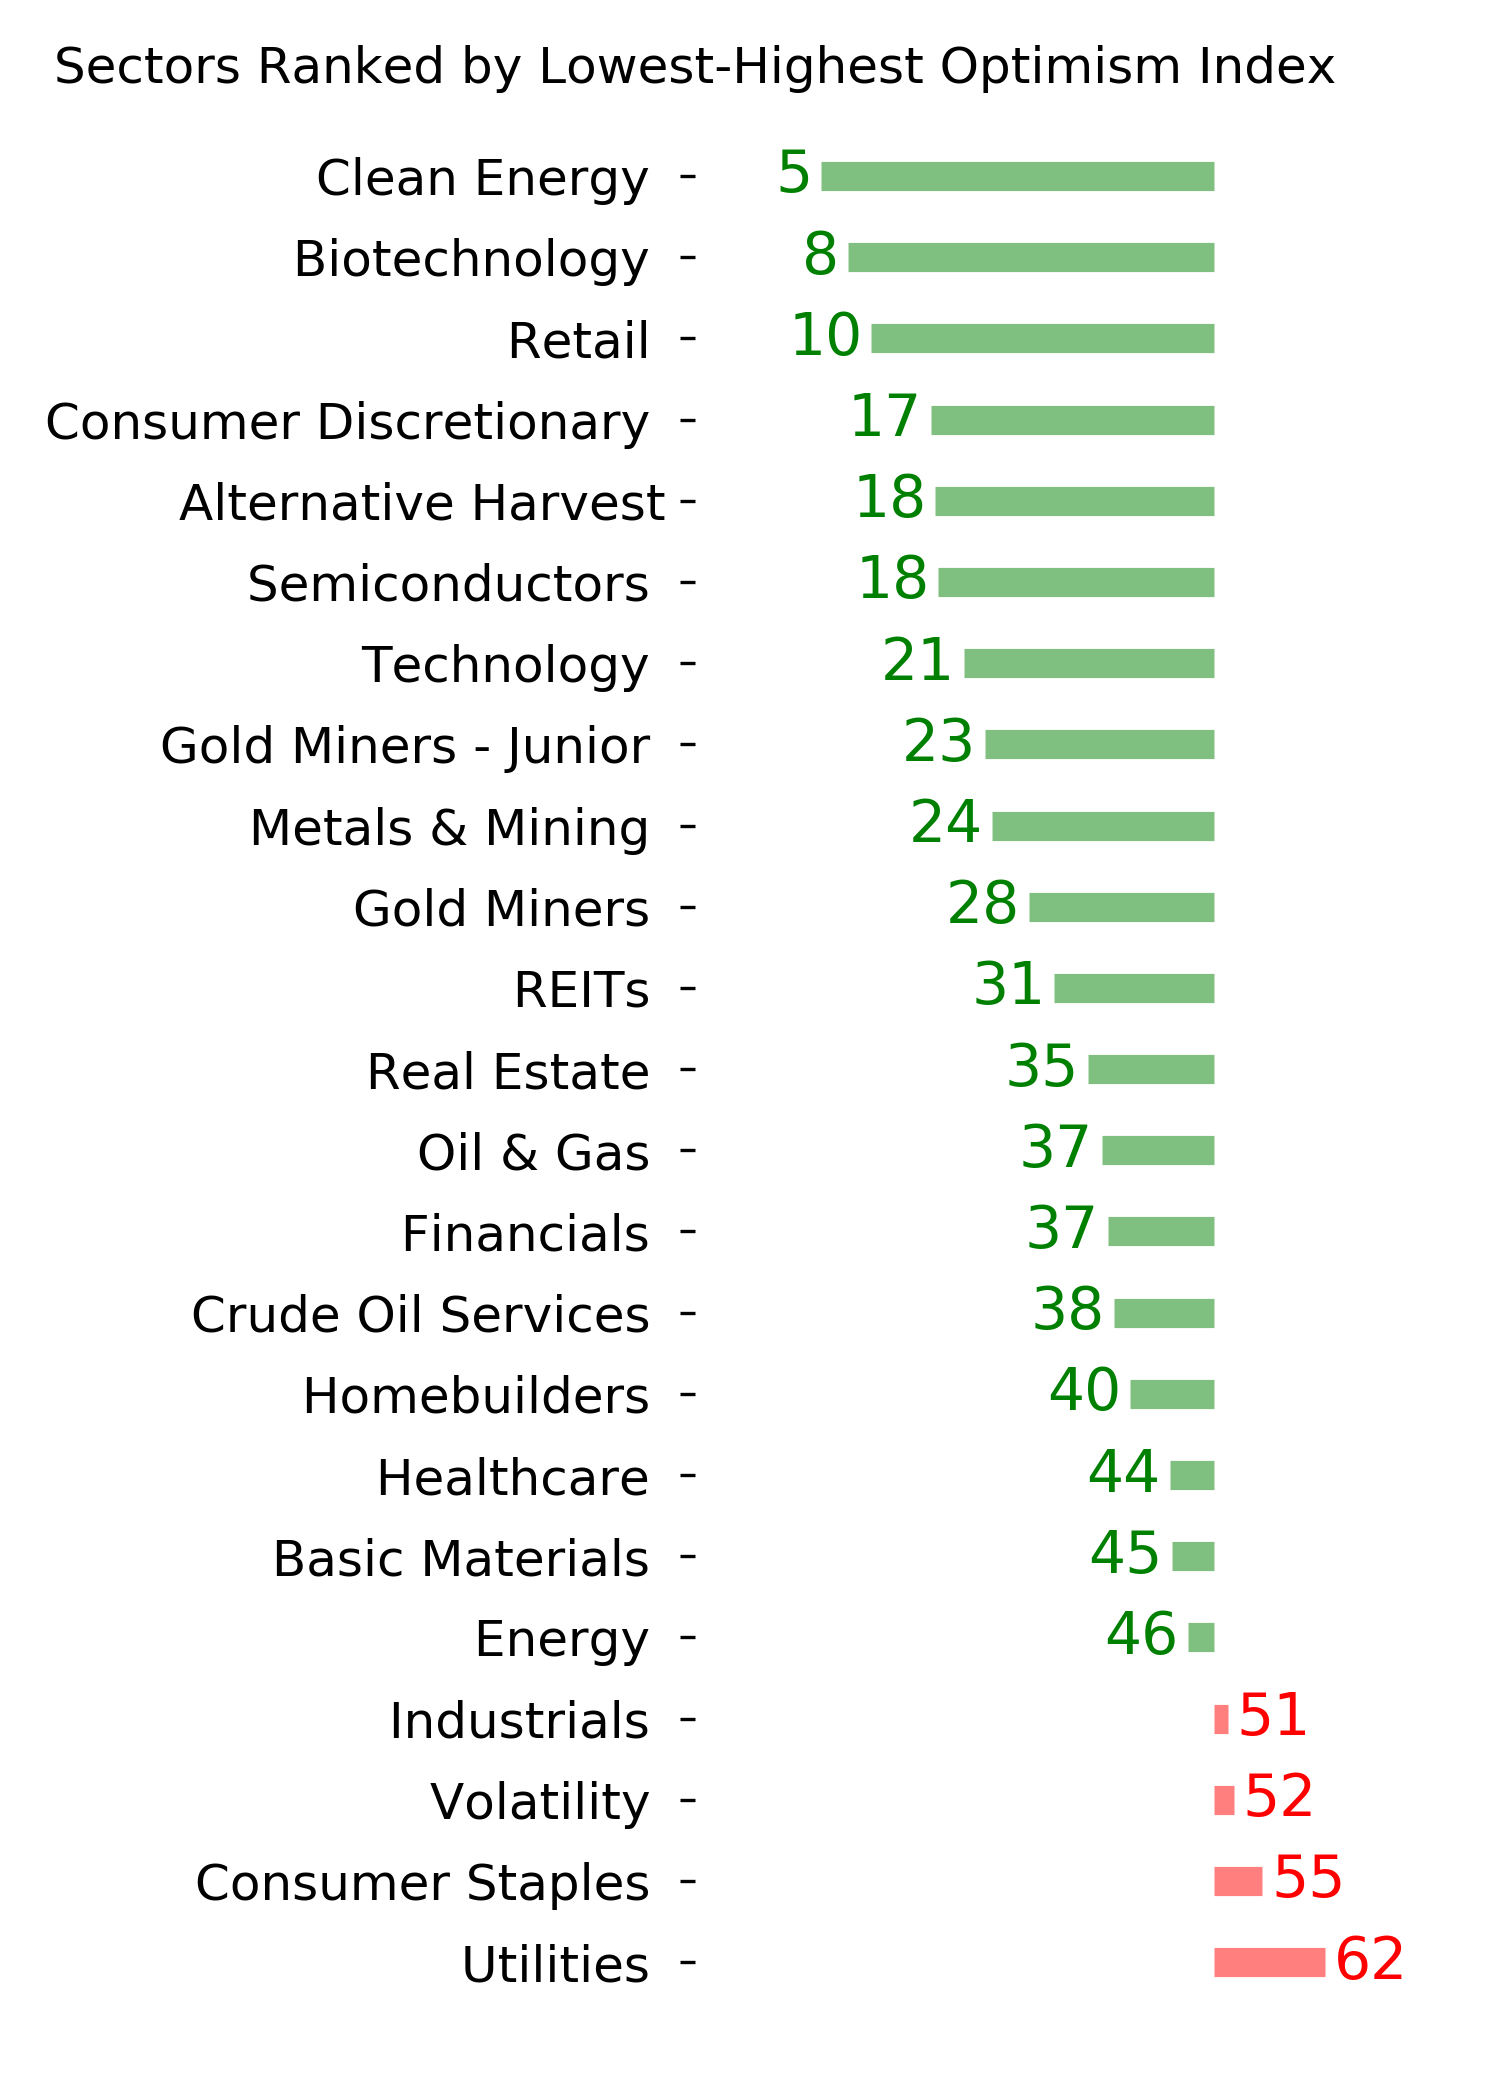
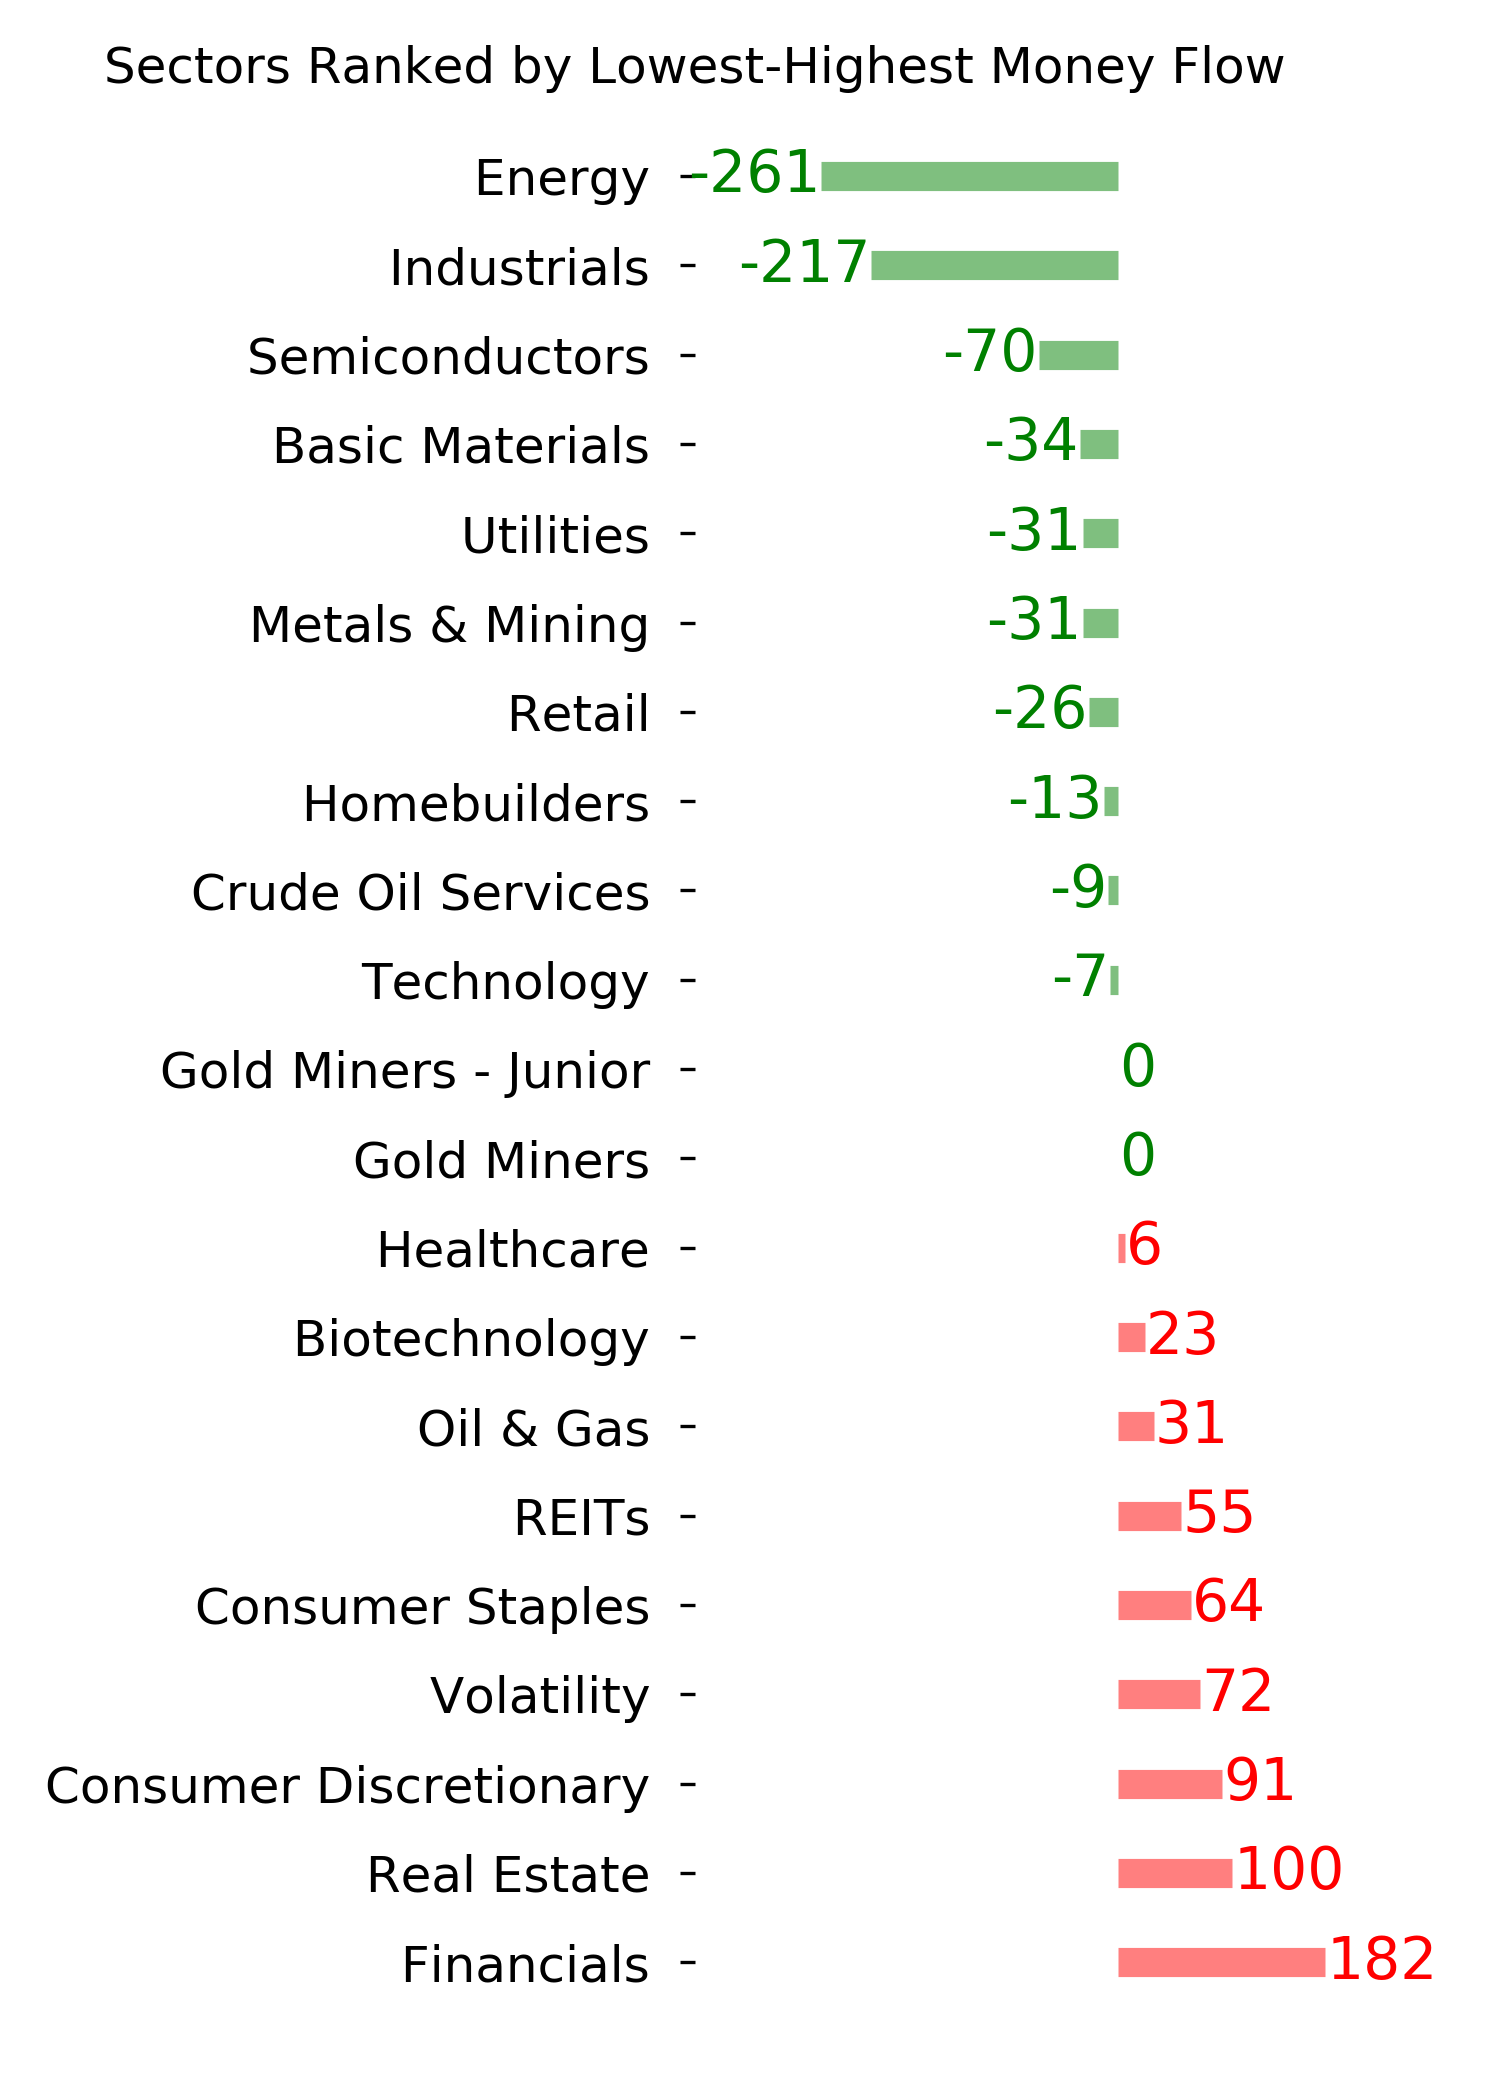
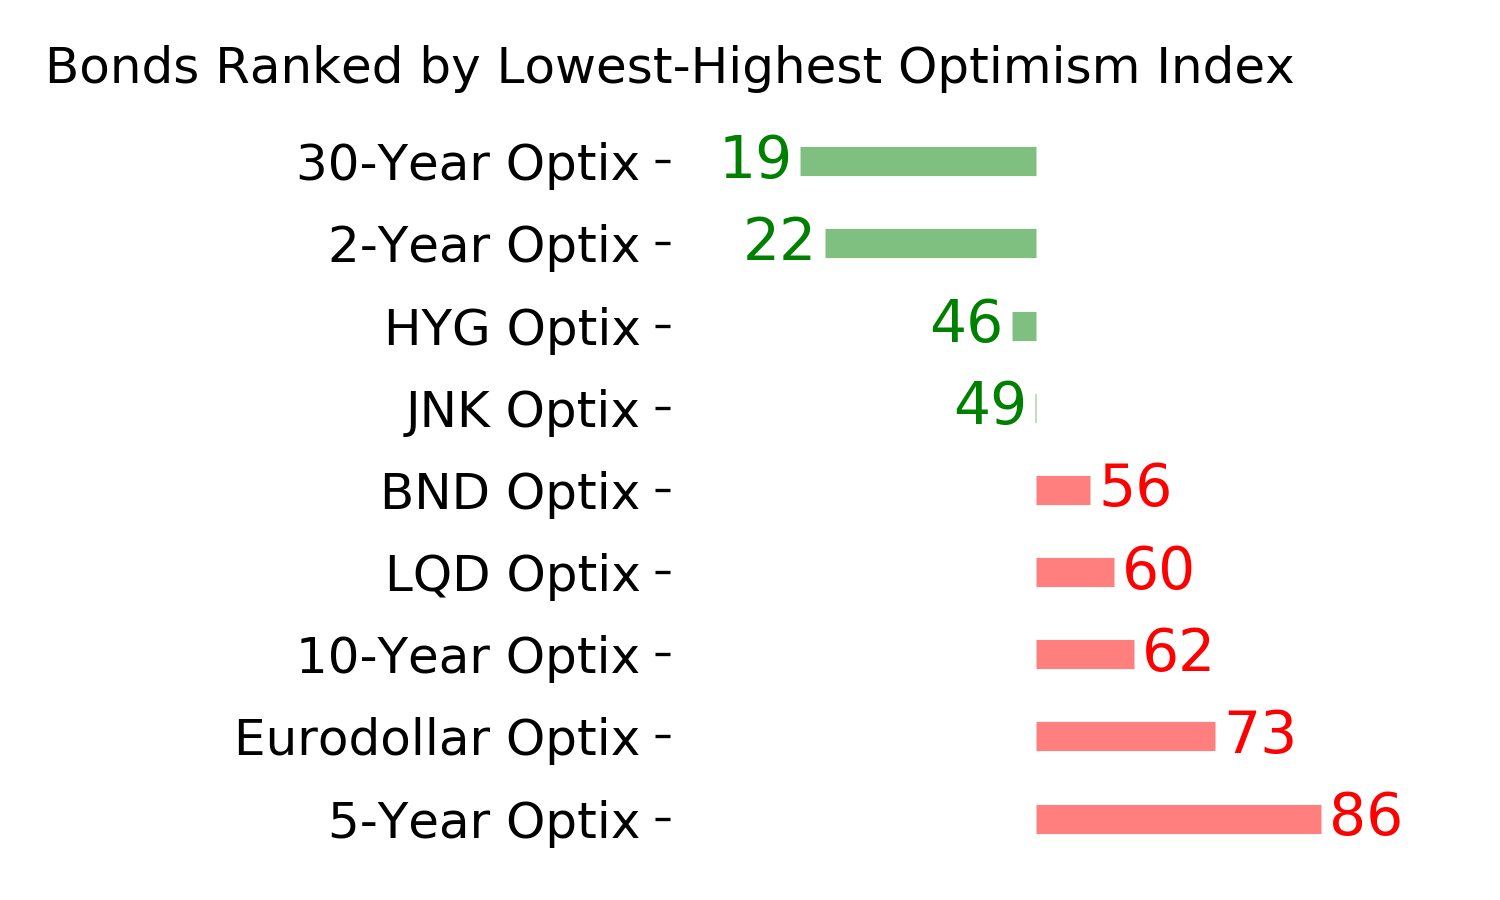
Optimism Index Thumbnails
|
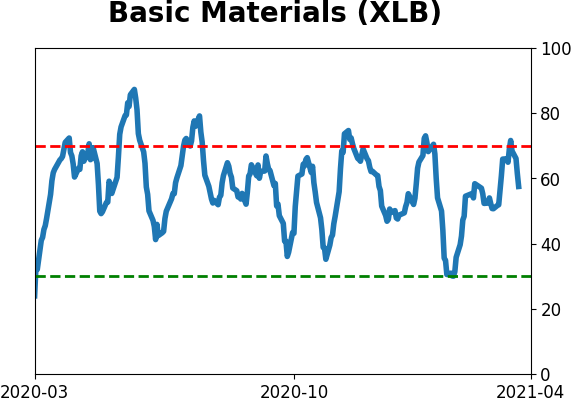
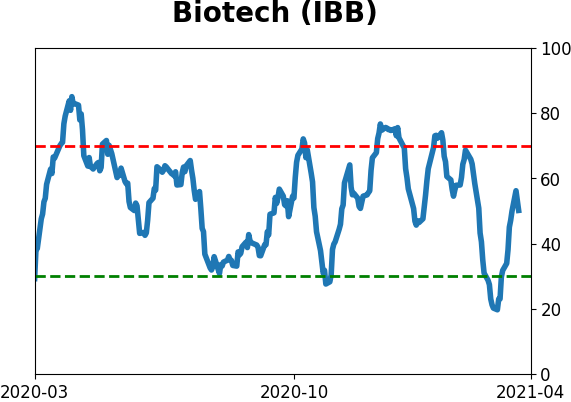
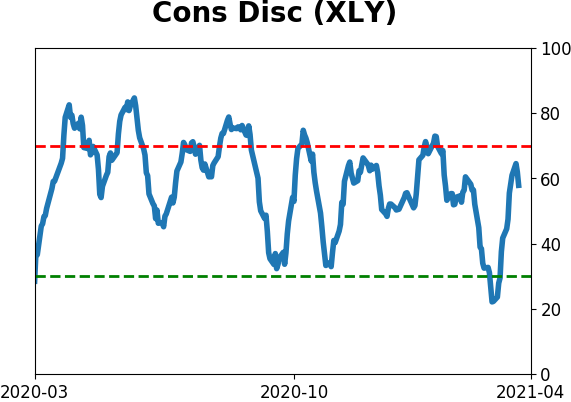
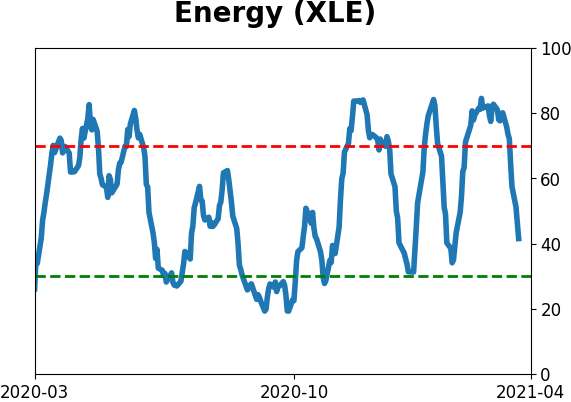
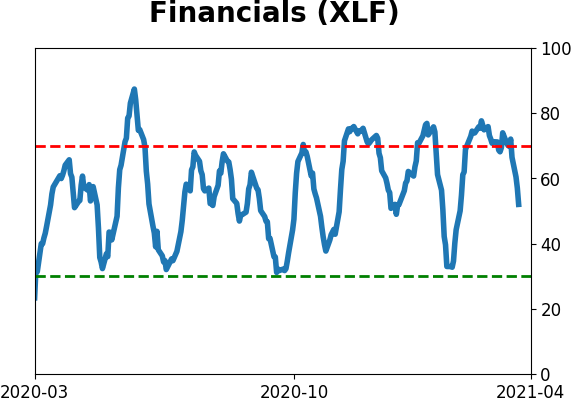
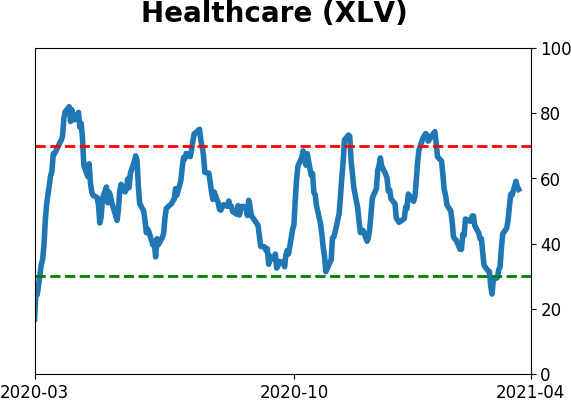
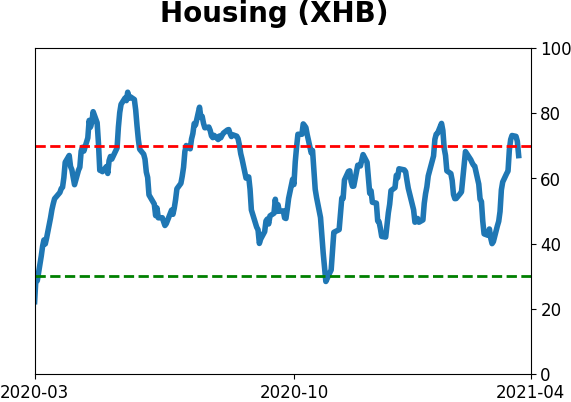
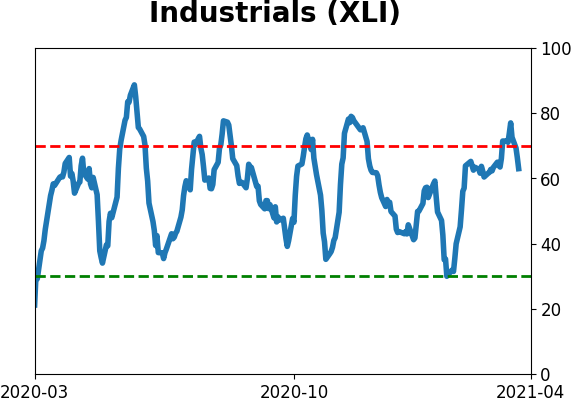
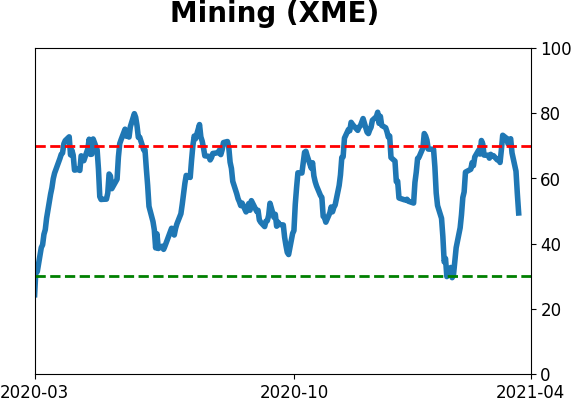
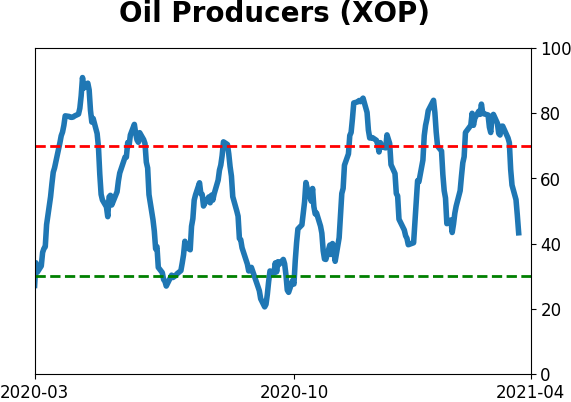
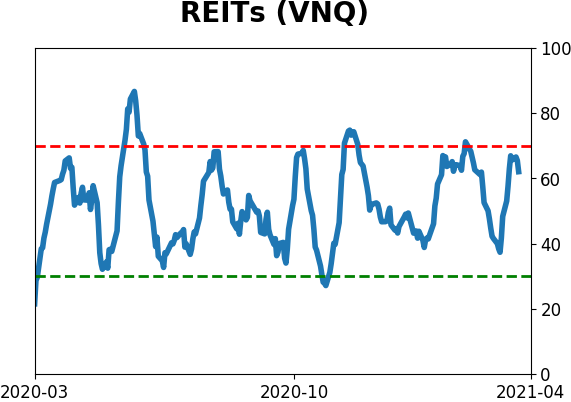
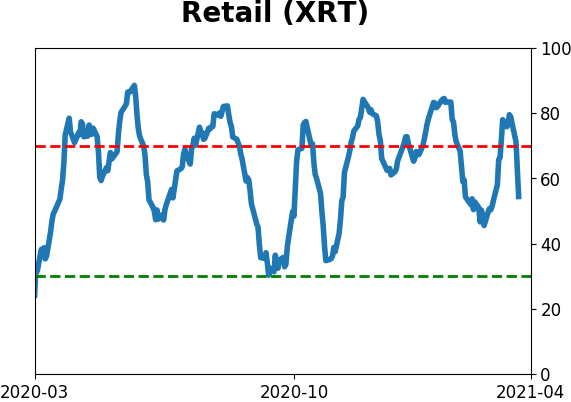
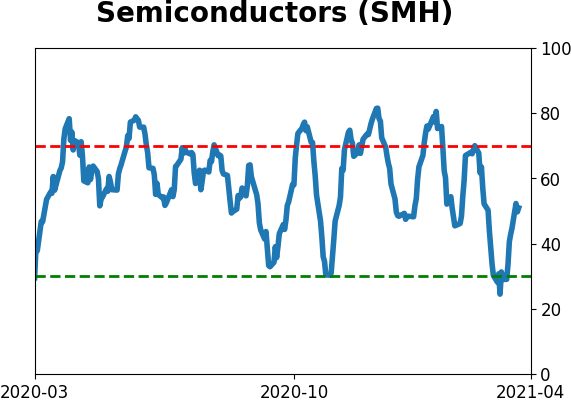
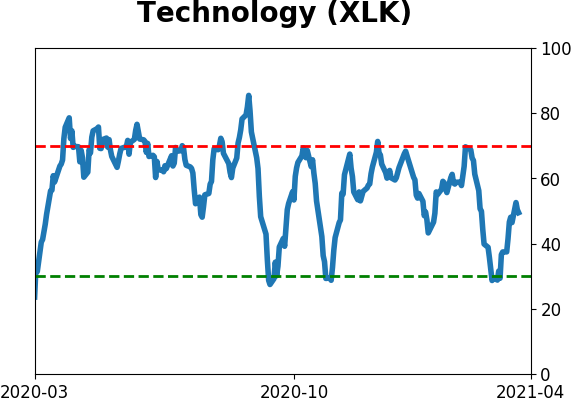
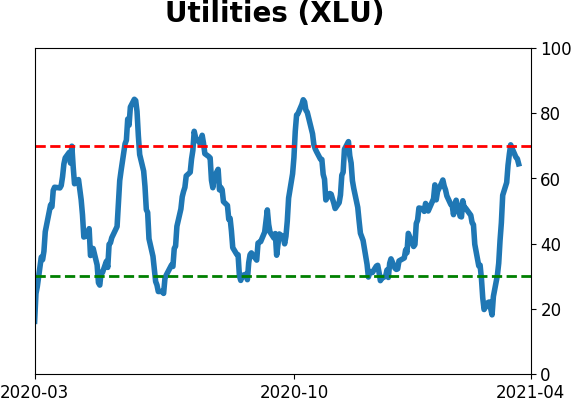
Sector ETF's - 10-Day Moving Average
|
|
|
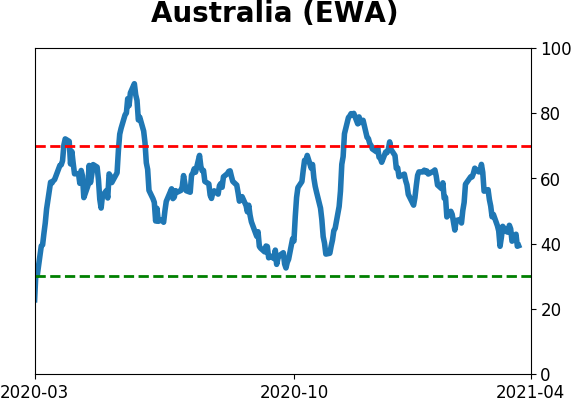
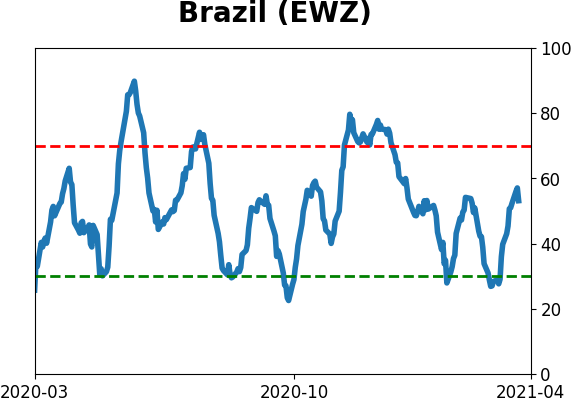
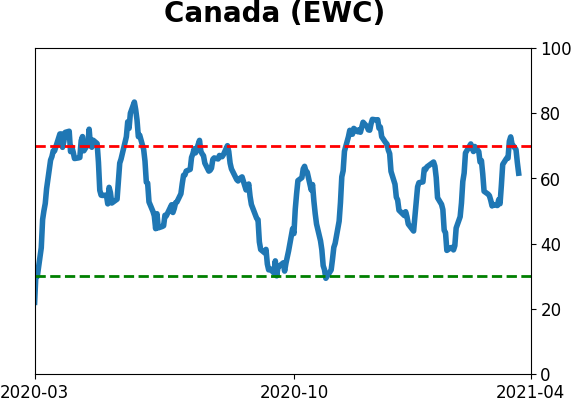
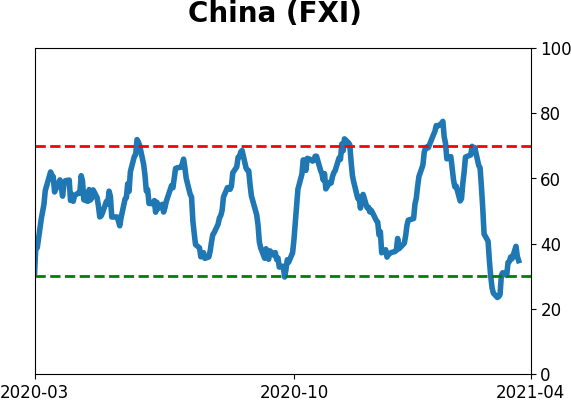
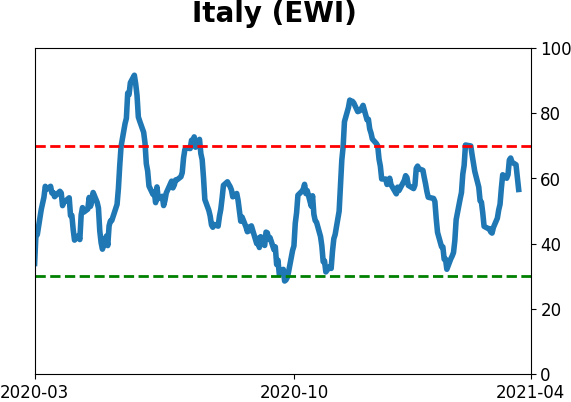
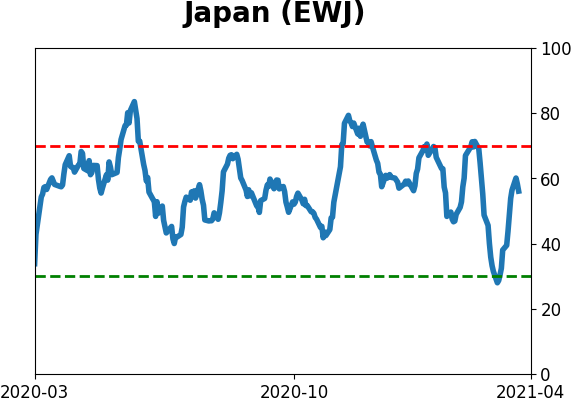
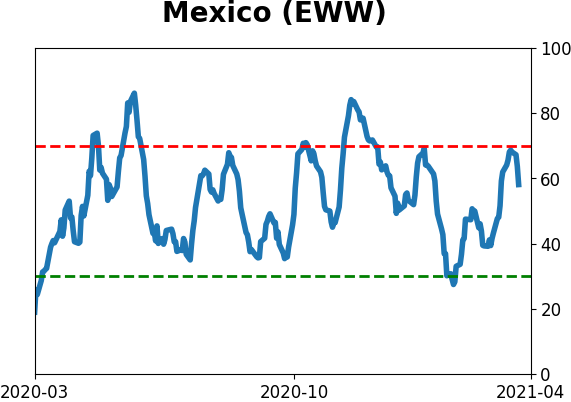
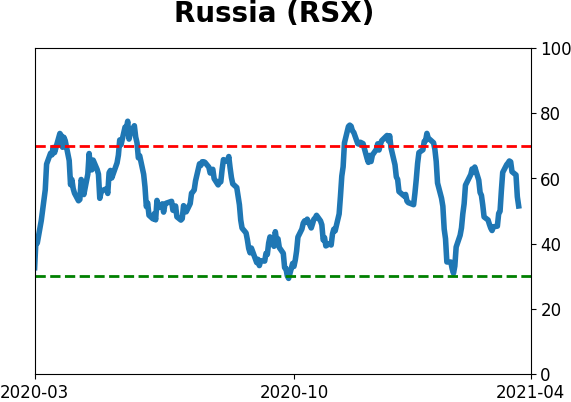
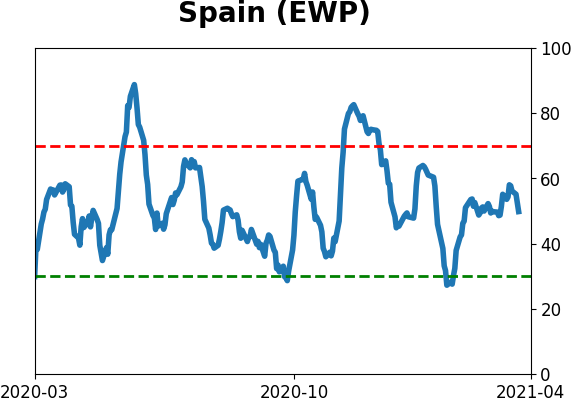
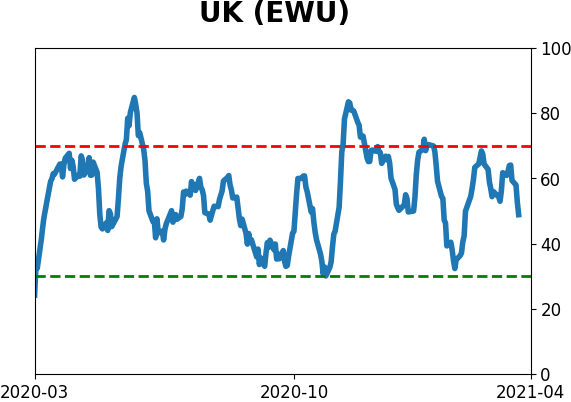
Country ETF's - 10-Day Moving Average
|
|
|
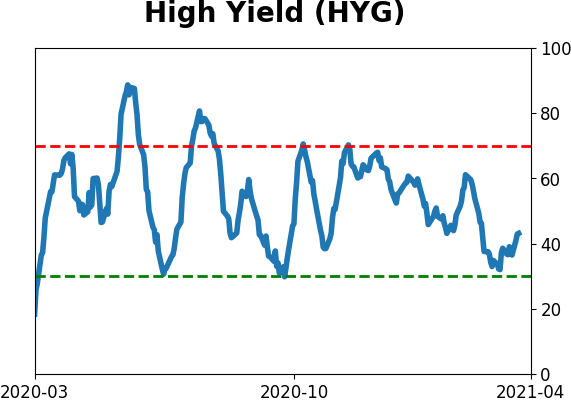
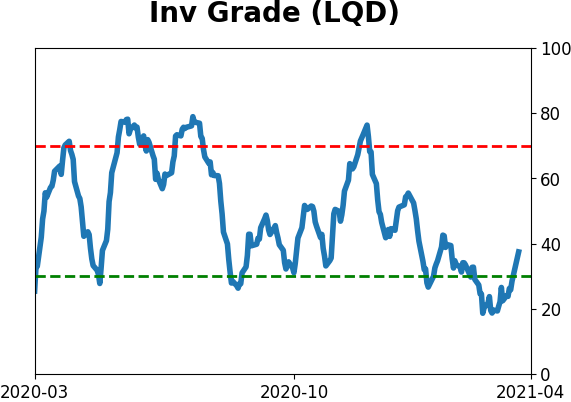
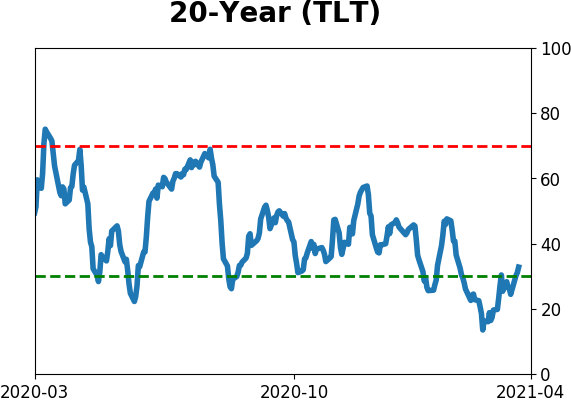
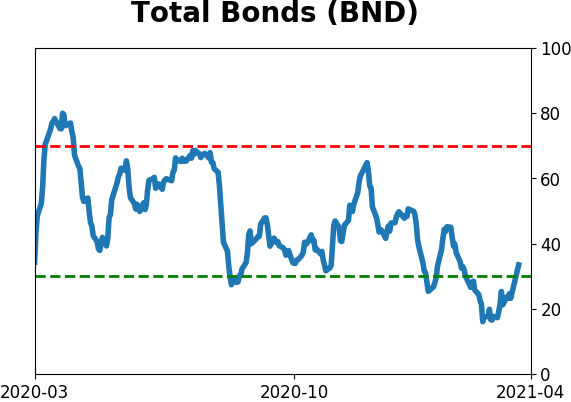
Bond ETF's - 10-Day Moving Average
|
|
|
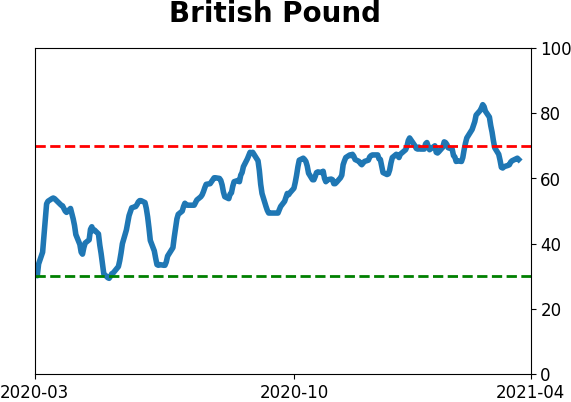
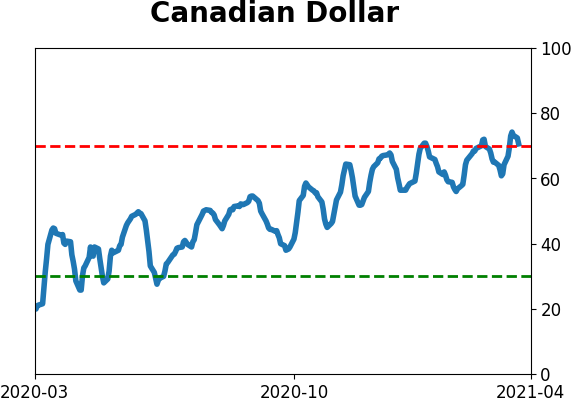
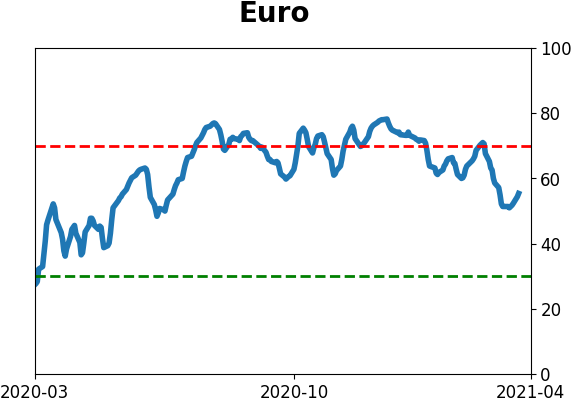
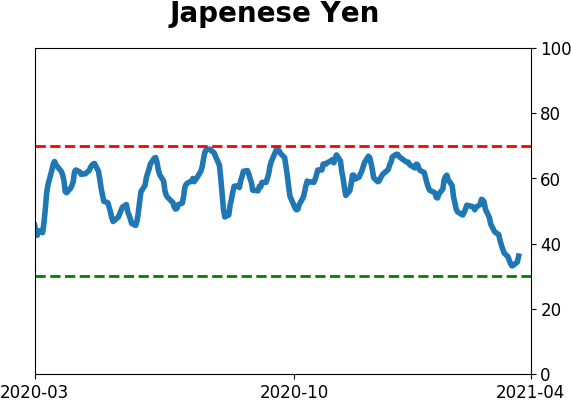
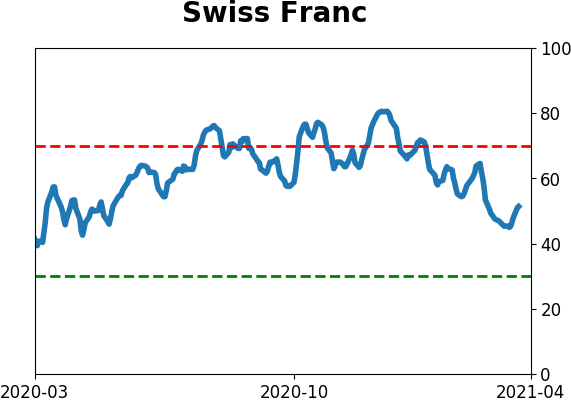
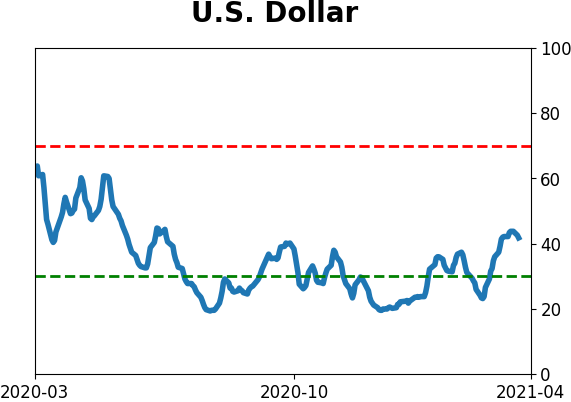
Currency ETF's - 5-Day Moving Average
|
|
|
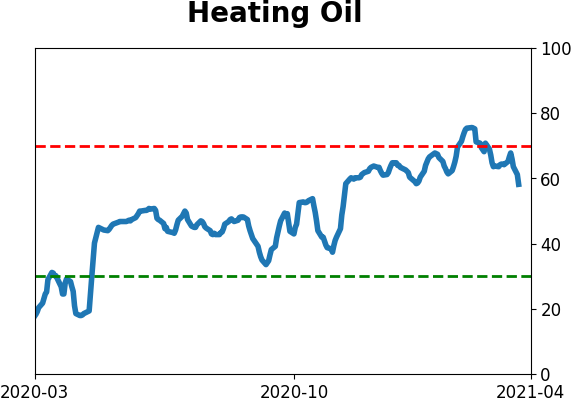
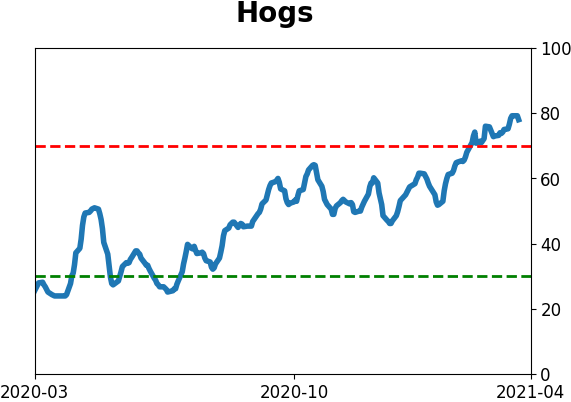
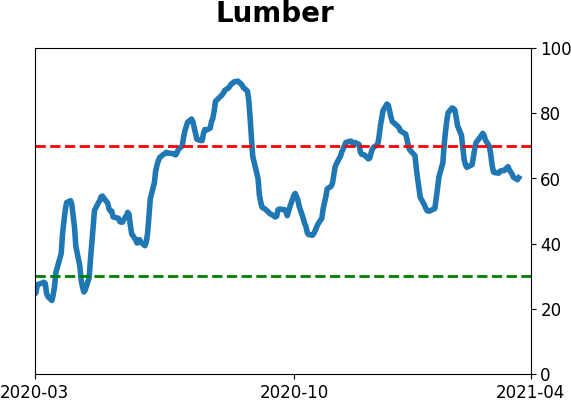
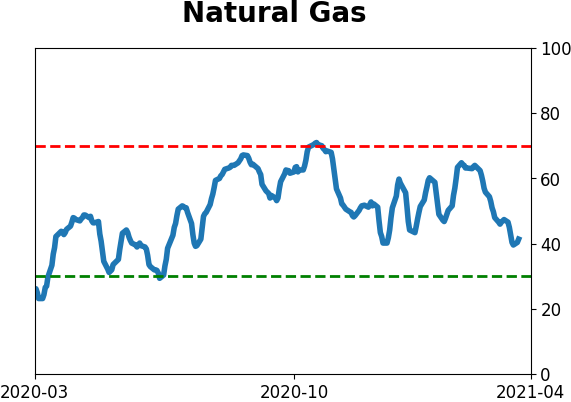
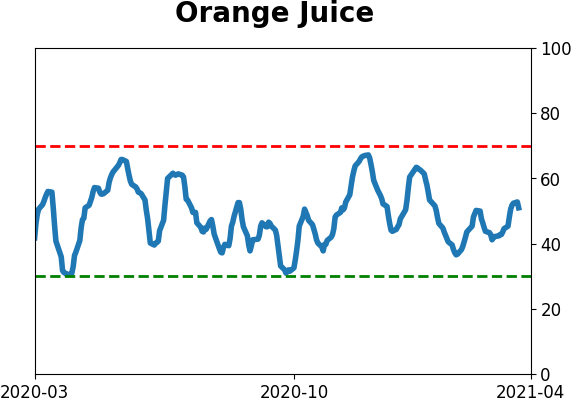
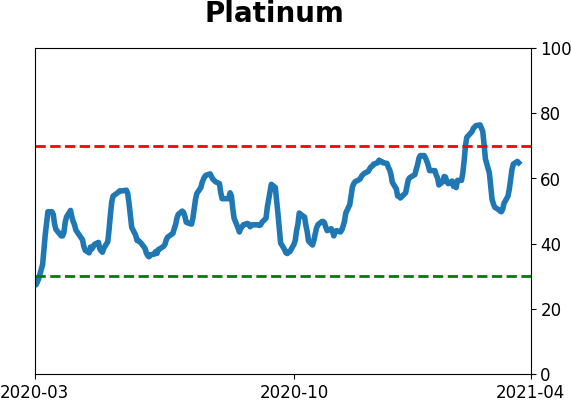
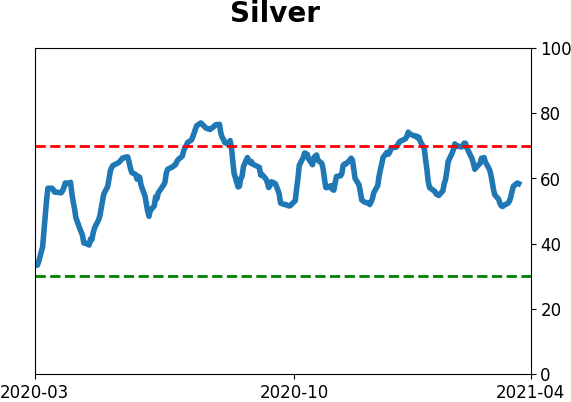
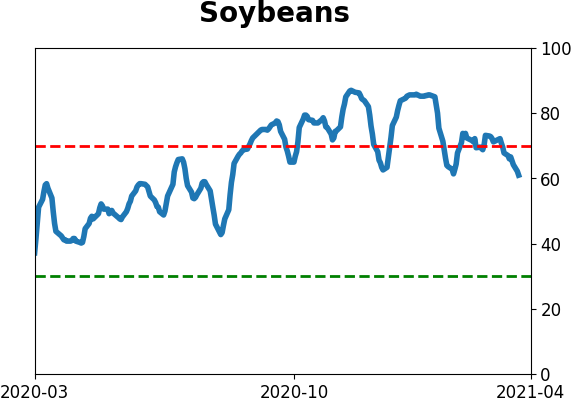
Commodity ETF's - 5-Day Moving Average
|
|