Headlines
|
|
A near record month for Value vs Growth:
Value stocks returned more than +5% over the past month, while Growth stocks dropped by more than -5%. This kind of spread in performance has typically ended other prolonged periods of Value under-performance over a long time frame. The signals tended to be negative for the broader market, though.
Behind the Charts: Dave Keller of StockCharts is a great guy, better analyst, and excellent interviewer. I enjoyed talking with him about my background and experiences starting SentimenTrader. Click here for the interview.
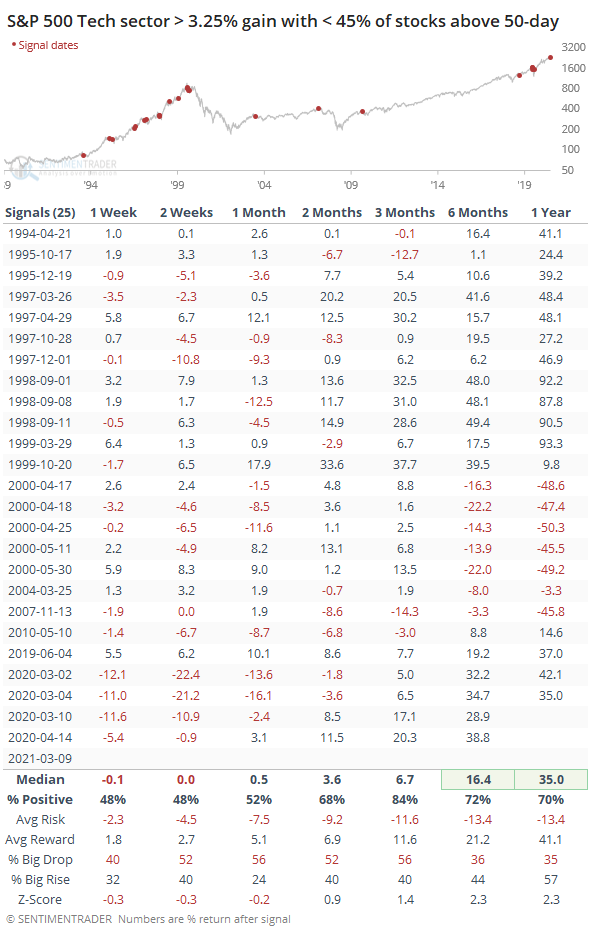
Tech rebound: The S&P 500 Tech sector enjoyed a large gain on Tuesday, but it didn't prompt a big move in the percentage of stocks in the sector that are trading above their 50-day moving averages. Even after the jump in the index, fewer than 45% of the stocks are in medium-term uptrends. During long-term uptrending markets, this has preceded somewhat weak shorter-term returns, but good longer-term ones (except for the latter instances in 2000 and 2007).
Bottom Line:
See the Outlook & Allocations page for more details on these summaries STOCKS: Weak sell
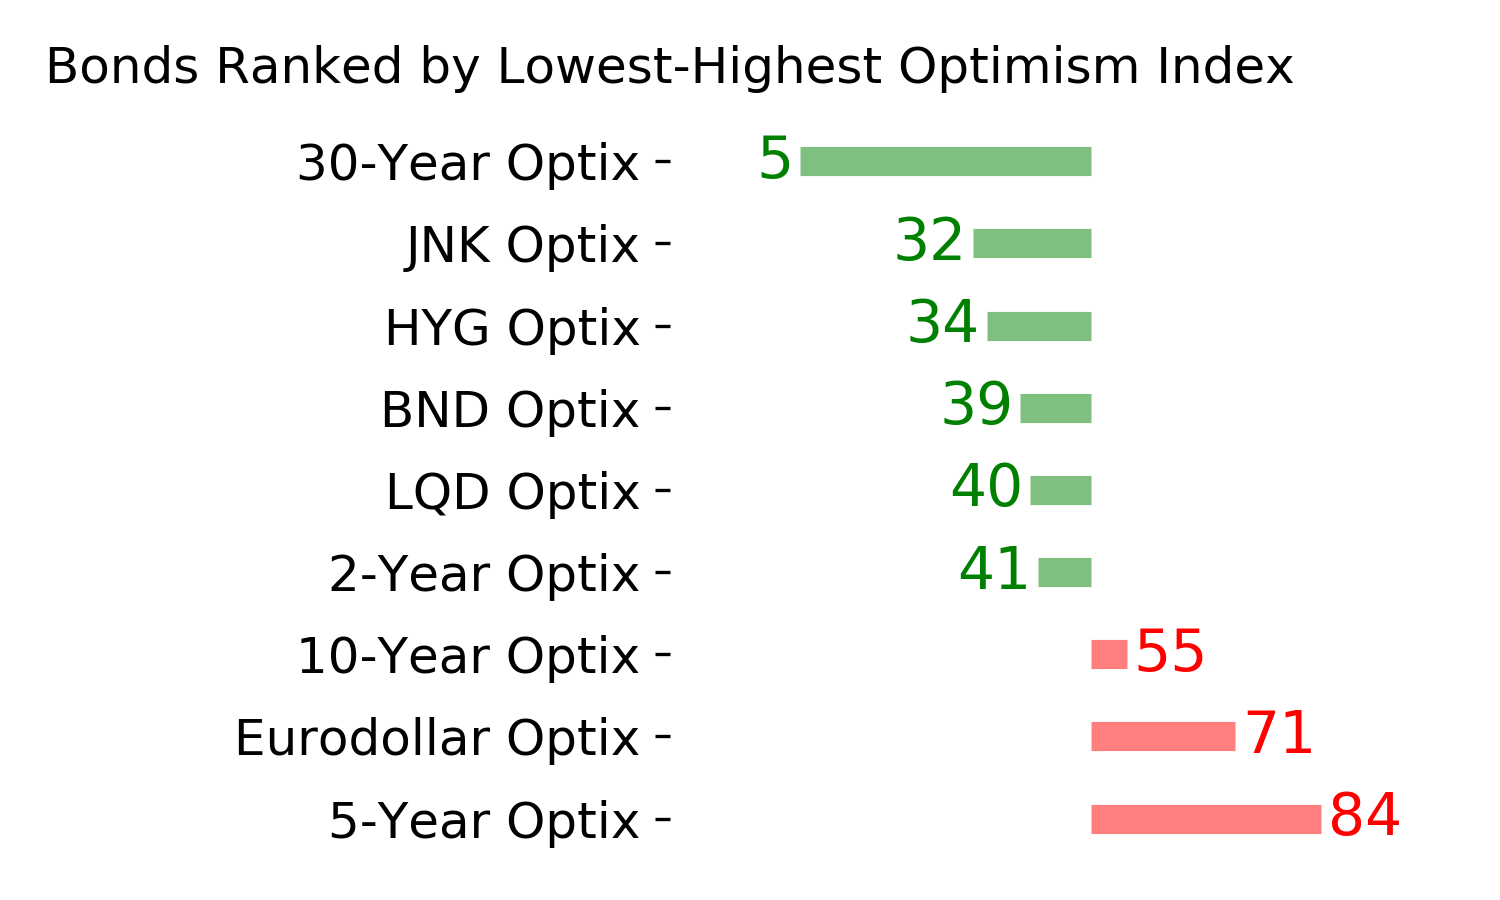
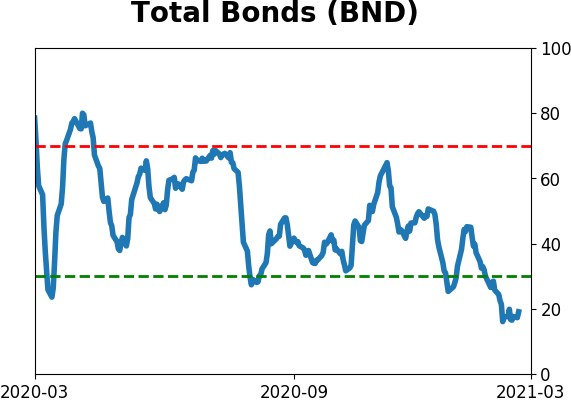
The extreme speculation registered in January and February is starting to get wrung out. Internal dynamics have mostly held up, so a return to neutral sentiment conditions would improve the forward risk/reward profile substantially. We're still a ways off from that. BONDS: Weak buy
Various parts of the market have been hit in recent weeks, with mild oversold conditions. The Bond Optimism Index is now about as low as it gets during healthy bond market environments. Fixed income isn't responding well, so that needs to be monitored in case it's transitioning to a longer-term negative market environment. GOLD: Weak buy
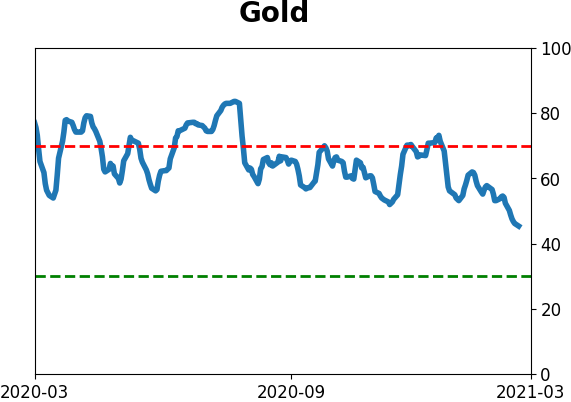
A dollar trying to rebound from a severe short position has weighed on gold and miners. The types of signals they've given in recent weeks, within the context of their recent surge, have usually resulted in higher prices over a medium- to long-term time frame. Like bonds, gold and miners aren't responding very well, and this needs to be monitored.
|
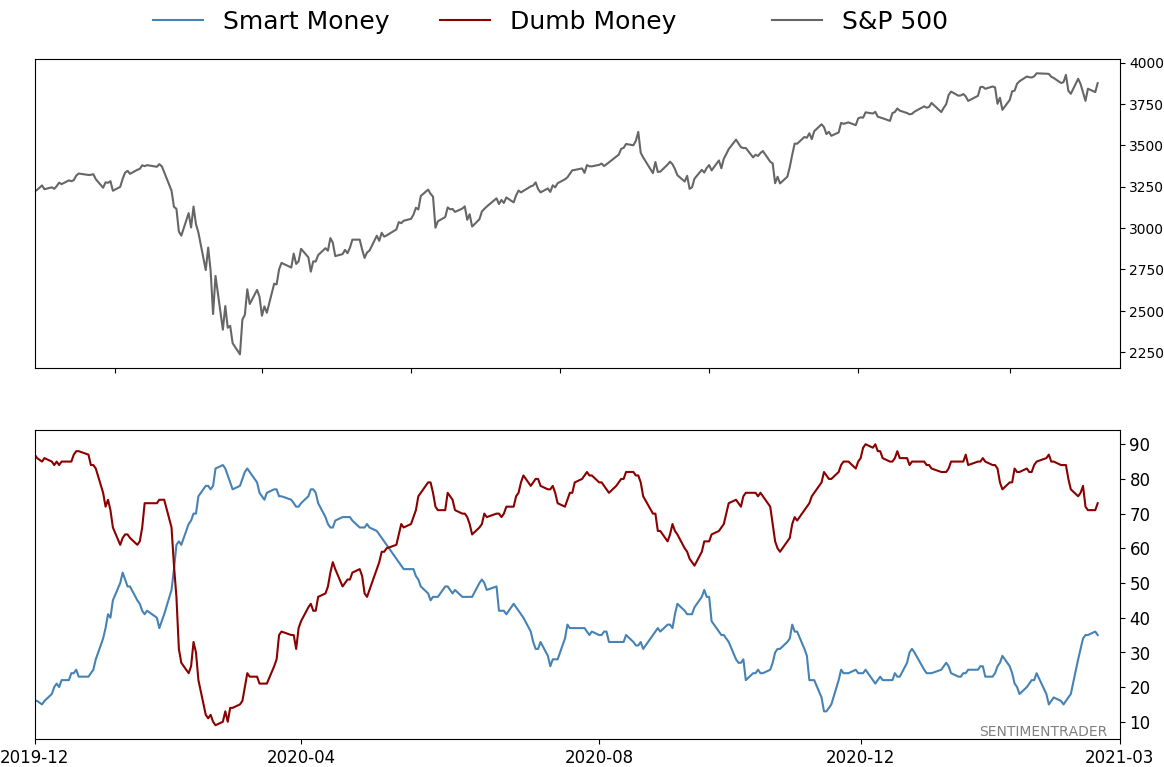
Smart / Dumb Money Confidence
|
Smart Money Confidence: 35%
Dumb Money Confidence: 73%
|
|
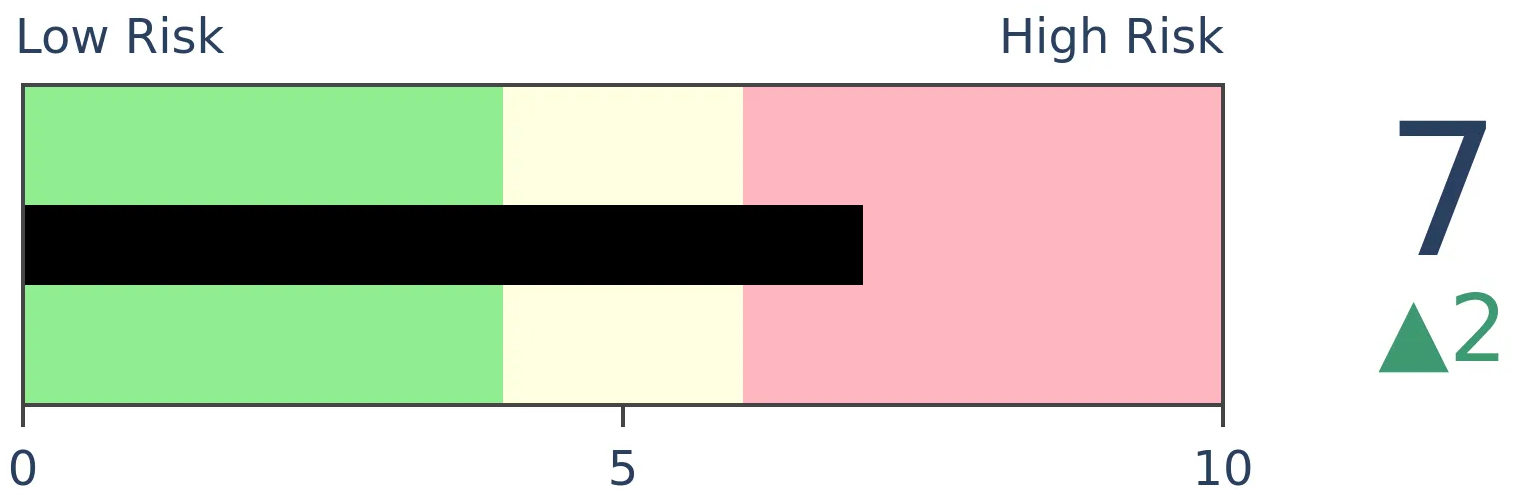
Risk Levels
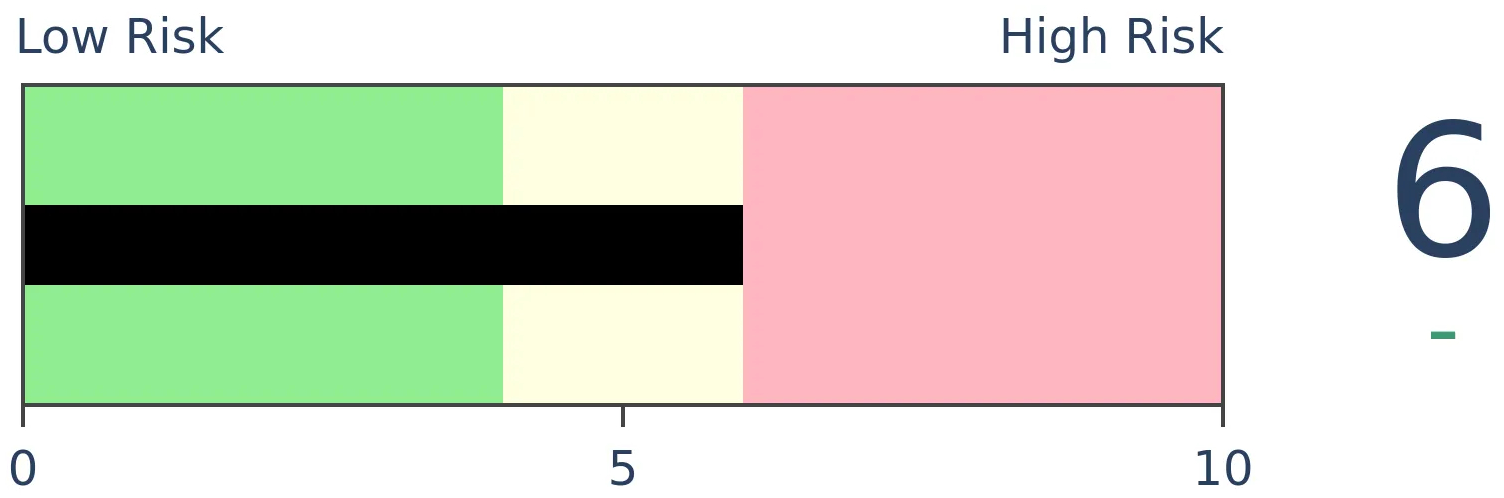
Stocks Short-Term
|
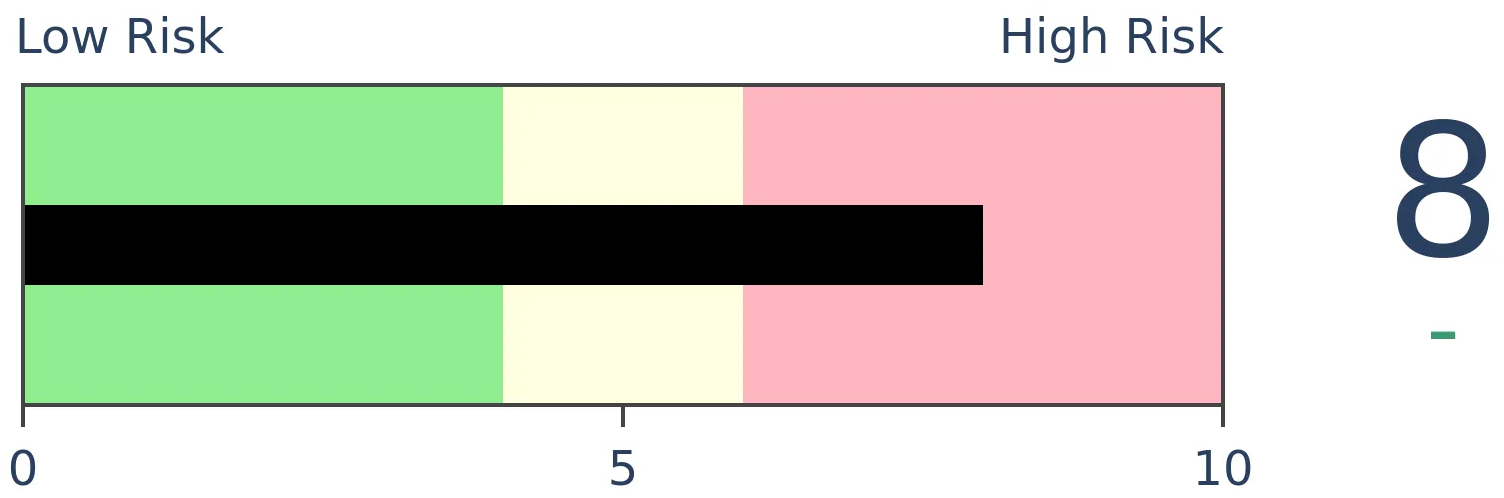
Stocks Medium-Term
|
|
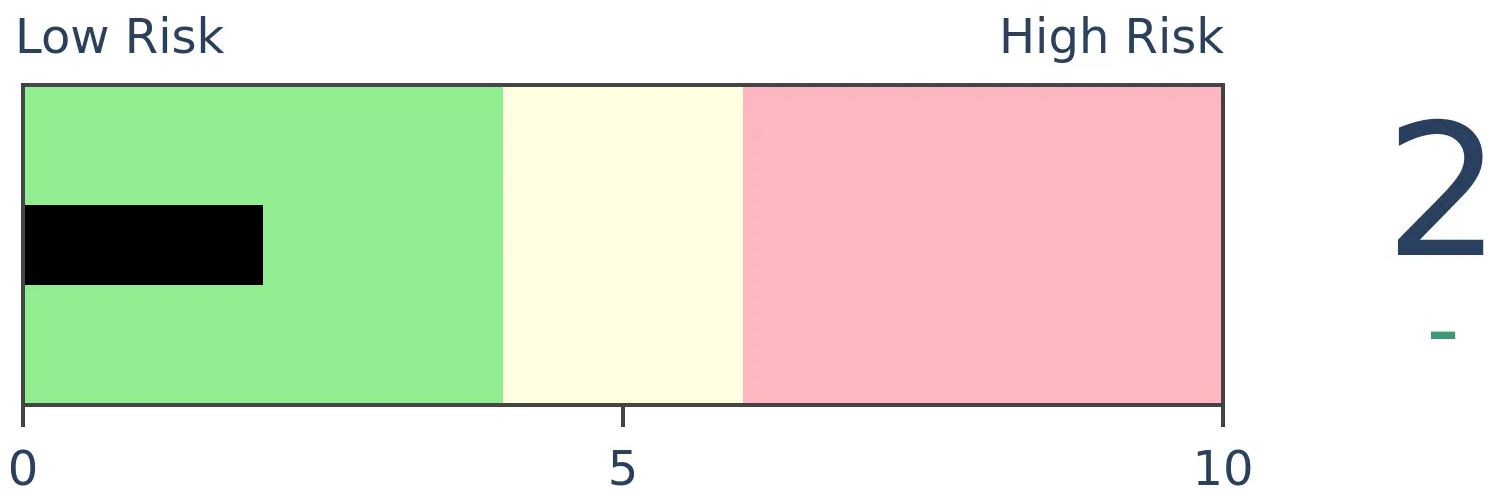
Bonds

|
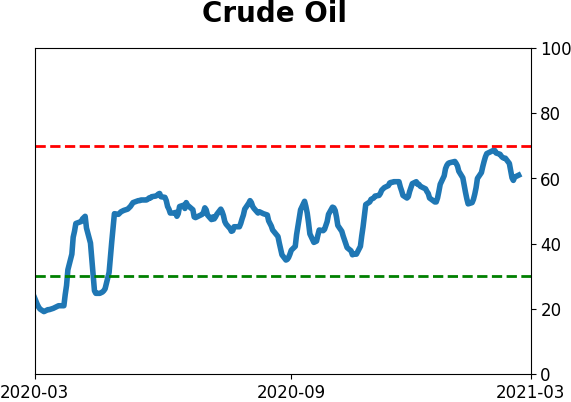
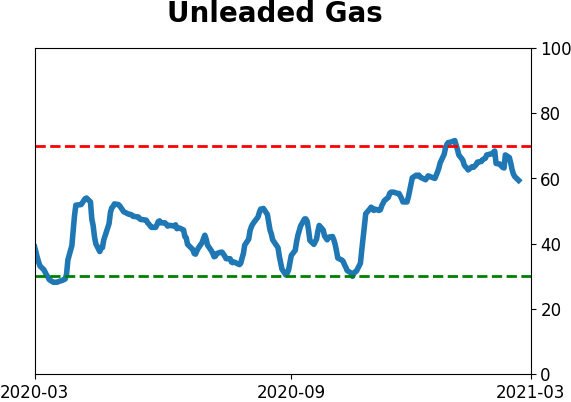
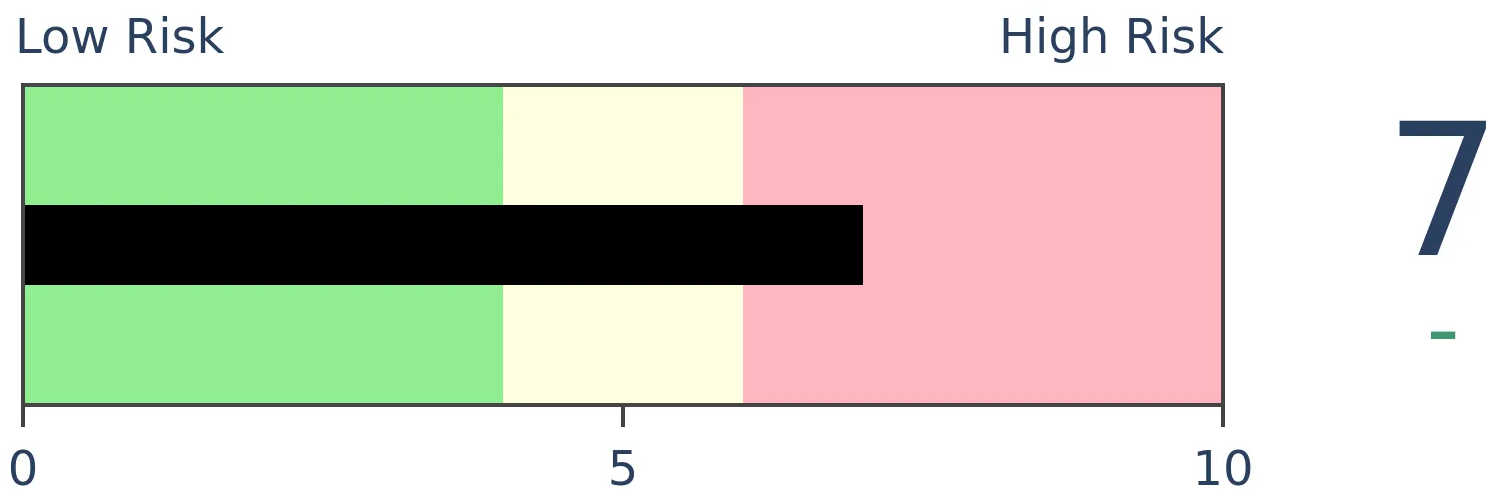
Crude Oil
|
|
Gold
|
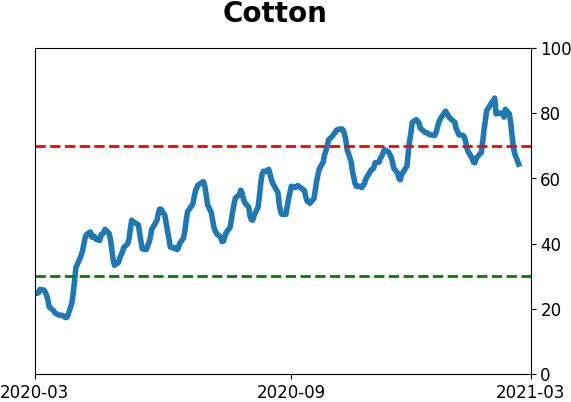
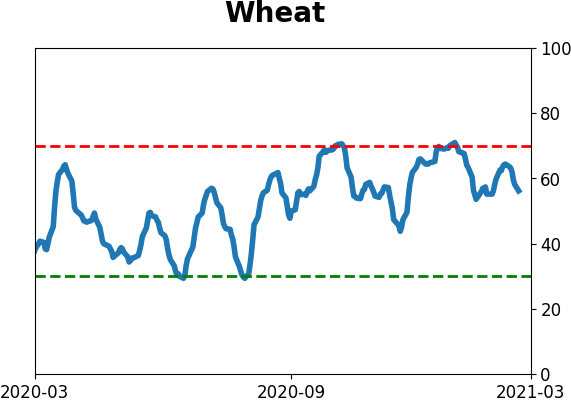
Agriculture
|
|
Research
BOTTOM LINE
Value stocks returned more than +5% over the past month, while Growth stocks dropped by more than -5%. This kind of spread in performance has typically ended other prolonged periods of Value under-performance over a long time frame. The signals tended to be negative for the broader market, though.
FORECAST / TIMEFRAME
None
|
Even though there is a reversal of the trend today, there has been a momentous shift in momentum over the past month. Former highflyers lost altitude while stocks that had been left behind stormed back.
We saw this in the extreme movements between Technology and Financials, and on Monday, Dean noted the incredible thrust in Energy.
All of these shifts have triggered a massive move in Value stocks relative to Growth. Over a rolling 1-month period, the total return on value is more than 10% greater than the total return on growth, one of the largest spreads in 30 years.
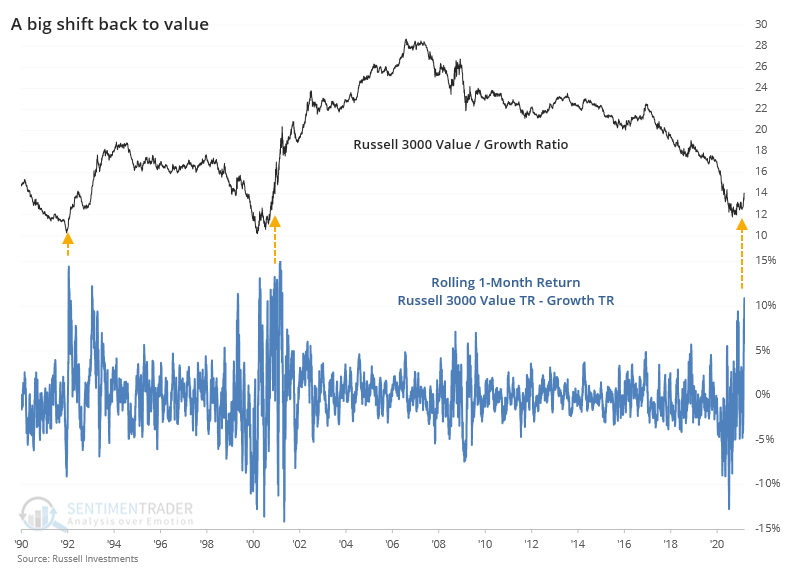
The last two shifts were notable, because they marked the ends of long periods of Value stock under-performance. In the years following those thrusts, Value stocks crushed Growth stocks.
It turns out that's more the rule than the exception.
The table below shows every time since 1928 when the total return on Value stocks over a rolling 21-day period was more than +5%, while the total return on Growth stocks was less than -5%.
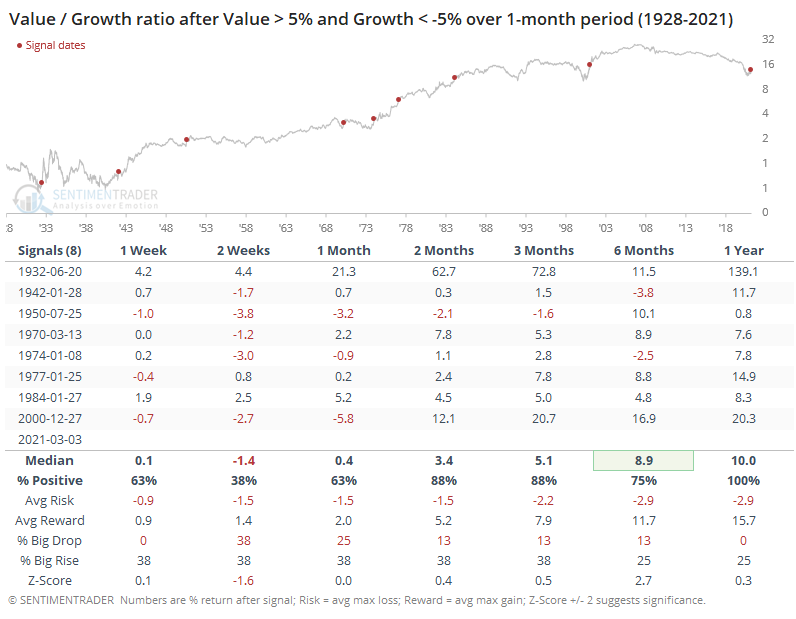
There was some back-and-forth in the shorter-term, and Value under-performed Growth over the next couple of weeks. Other than that, there was a clear and increasing bias toward Value. By a year later, Value had out-performed Growth every time. The returns were especially stark when emerging from multiple years of under-performance like now.
In terms of actual returns, they weren't all that impressive. The total return on Value was negative across most time frames.
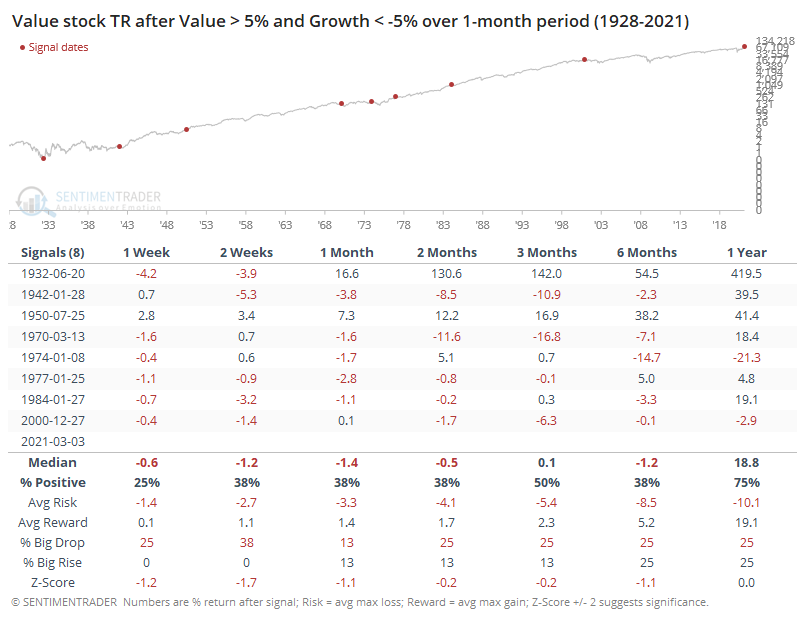
We know that Value tended to out-perform Growth, so this means that returns on Growth stocks must have been even worse. Indeed.
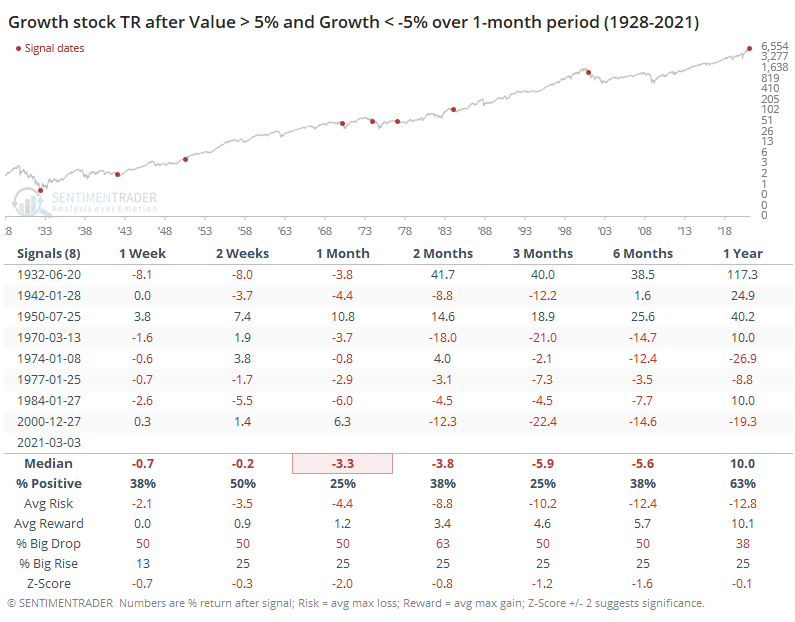
Because of the S&P 500's general bias toward Growth stocks, this means that the most widely benchmarked index in the world tended to perform pretty poorly after these signals.
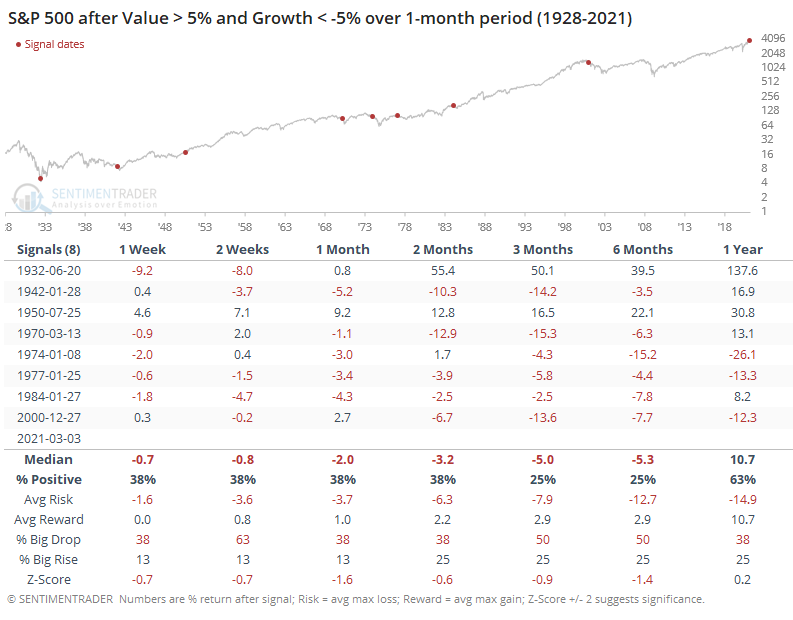
There have been a lot of false starts for Value in recent years, every time beaten back by a resurgence in momentum stocks. Maybe the next round of stimulus payments, a decent portion of which seems destined for the stock market, will cause that to happen again. Historically, though, the surge in Value relative to Growth has been stark enough that it has ended other prolonged bouts of under-performance. And that's been a warning for the broader market.
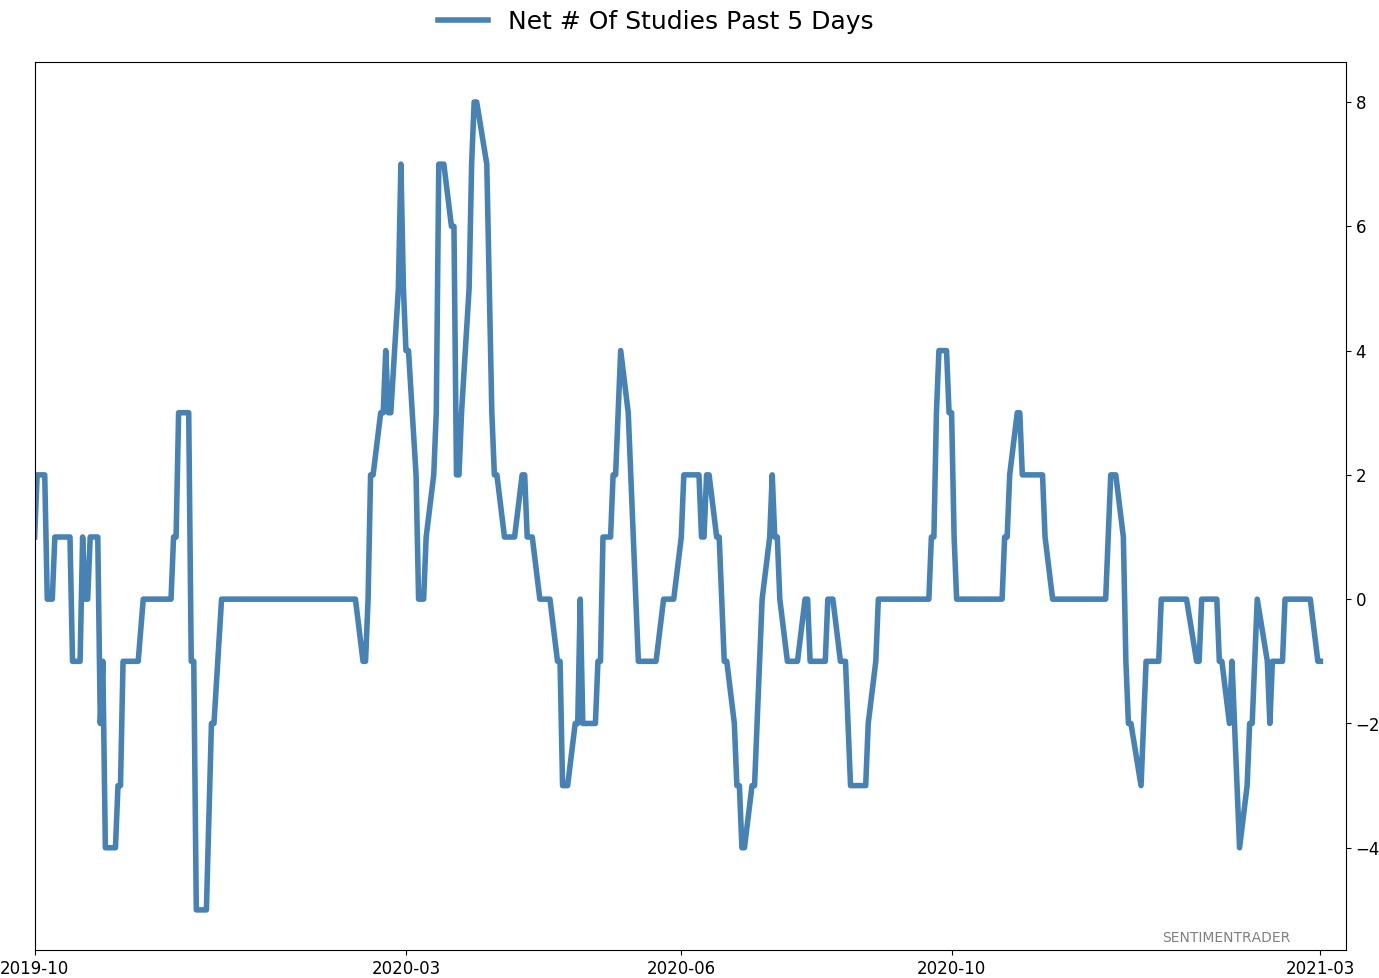
Active Studies
| Time Frame | Bullish | Bearish | | Short-Term | 0 | 0 | | Medium-Term | 2 | 9 | | Long-Term | 16 | 3 |
|
Indicators at Extremes
Portfolio
| Position | Description | Weight % | Added / Reduced | Date | | Stocks | RSP | 4.9 | Reduced 4% | 2021-02-09 | | Bonds | 30.0% BND, 8.8% SCHP | 38.8 | Added 15.1% | 2021-02-18 | | Commodities | GCC | 2.3 | Reduced 2.1%
| 2020-09-04 | | Precious Metals | GDX | 9.0 | Added 0.1% | 2021-02-18 | | Special Situations | 7.3% XLE, 4.8% PSCE | 12.1 | Reduced 5.6% | 2021-02-18 | | Cash | | 32.8 | | |
|
Updates (Changes made today are underlined)
With a market that has seen the kinds of broad participation and big breath thrusts like we did in the fall, it's hard to become too negative. Those kinds of conditions have consistently preceded higher returns over the next 6-12 months. It's the interim that's more of an issue. Even conditions like that haven't prevented some shorter-term pullbacks. And when we combine an environment where speculation is rampant and recent days have seen an increase in cracks under the surface of the indexes, it's enough to become more defensive over a short- to medium-term time frame. We still don't have much confirmation from the price action in the indexes, so those who are more conservative would likely wait before increasing cash levels. I've decreased risk exposure a bit more, mainly in terms of energy stocks and the ANGL fund, while adding more to the broader bond market. RETURN YTD: 6.5% 2020: 8.1%, 2019: 12.6%, 2018: 0.6%, 2017: 3.8%, 2016: 17.1%, 2015: 9.2%, 2014: 14.5%, 2013: 2.2%, 2012: 10.8%, 2011: 16.5%, 2010: 15.3%, 2009: 23.9%, 2008: 16.2%, 2007: 7.8%
|
|
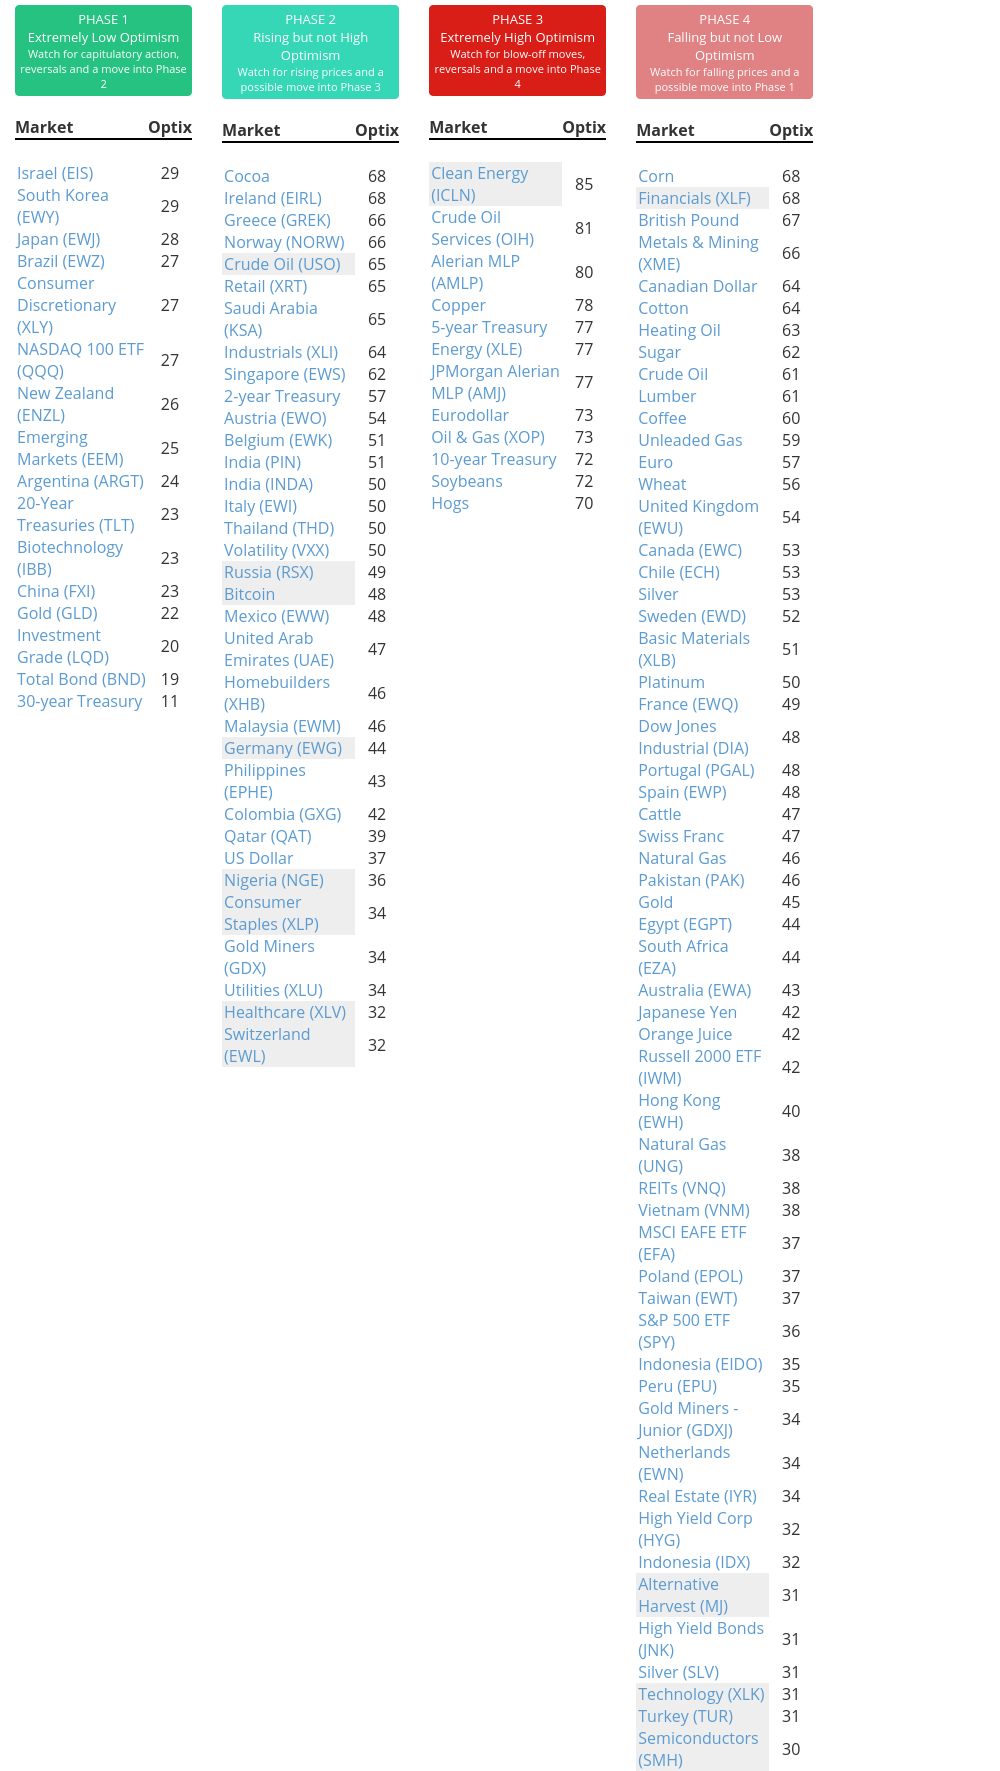
Phase Table
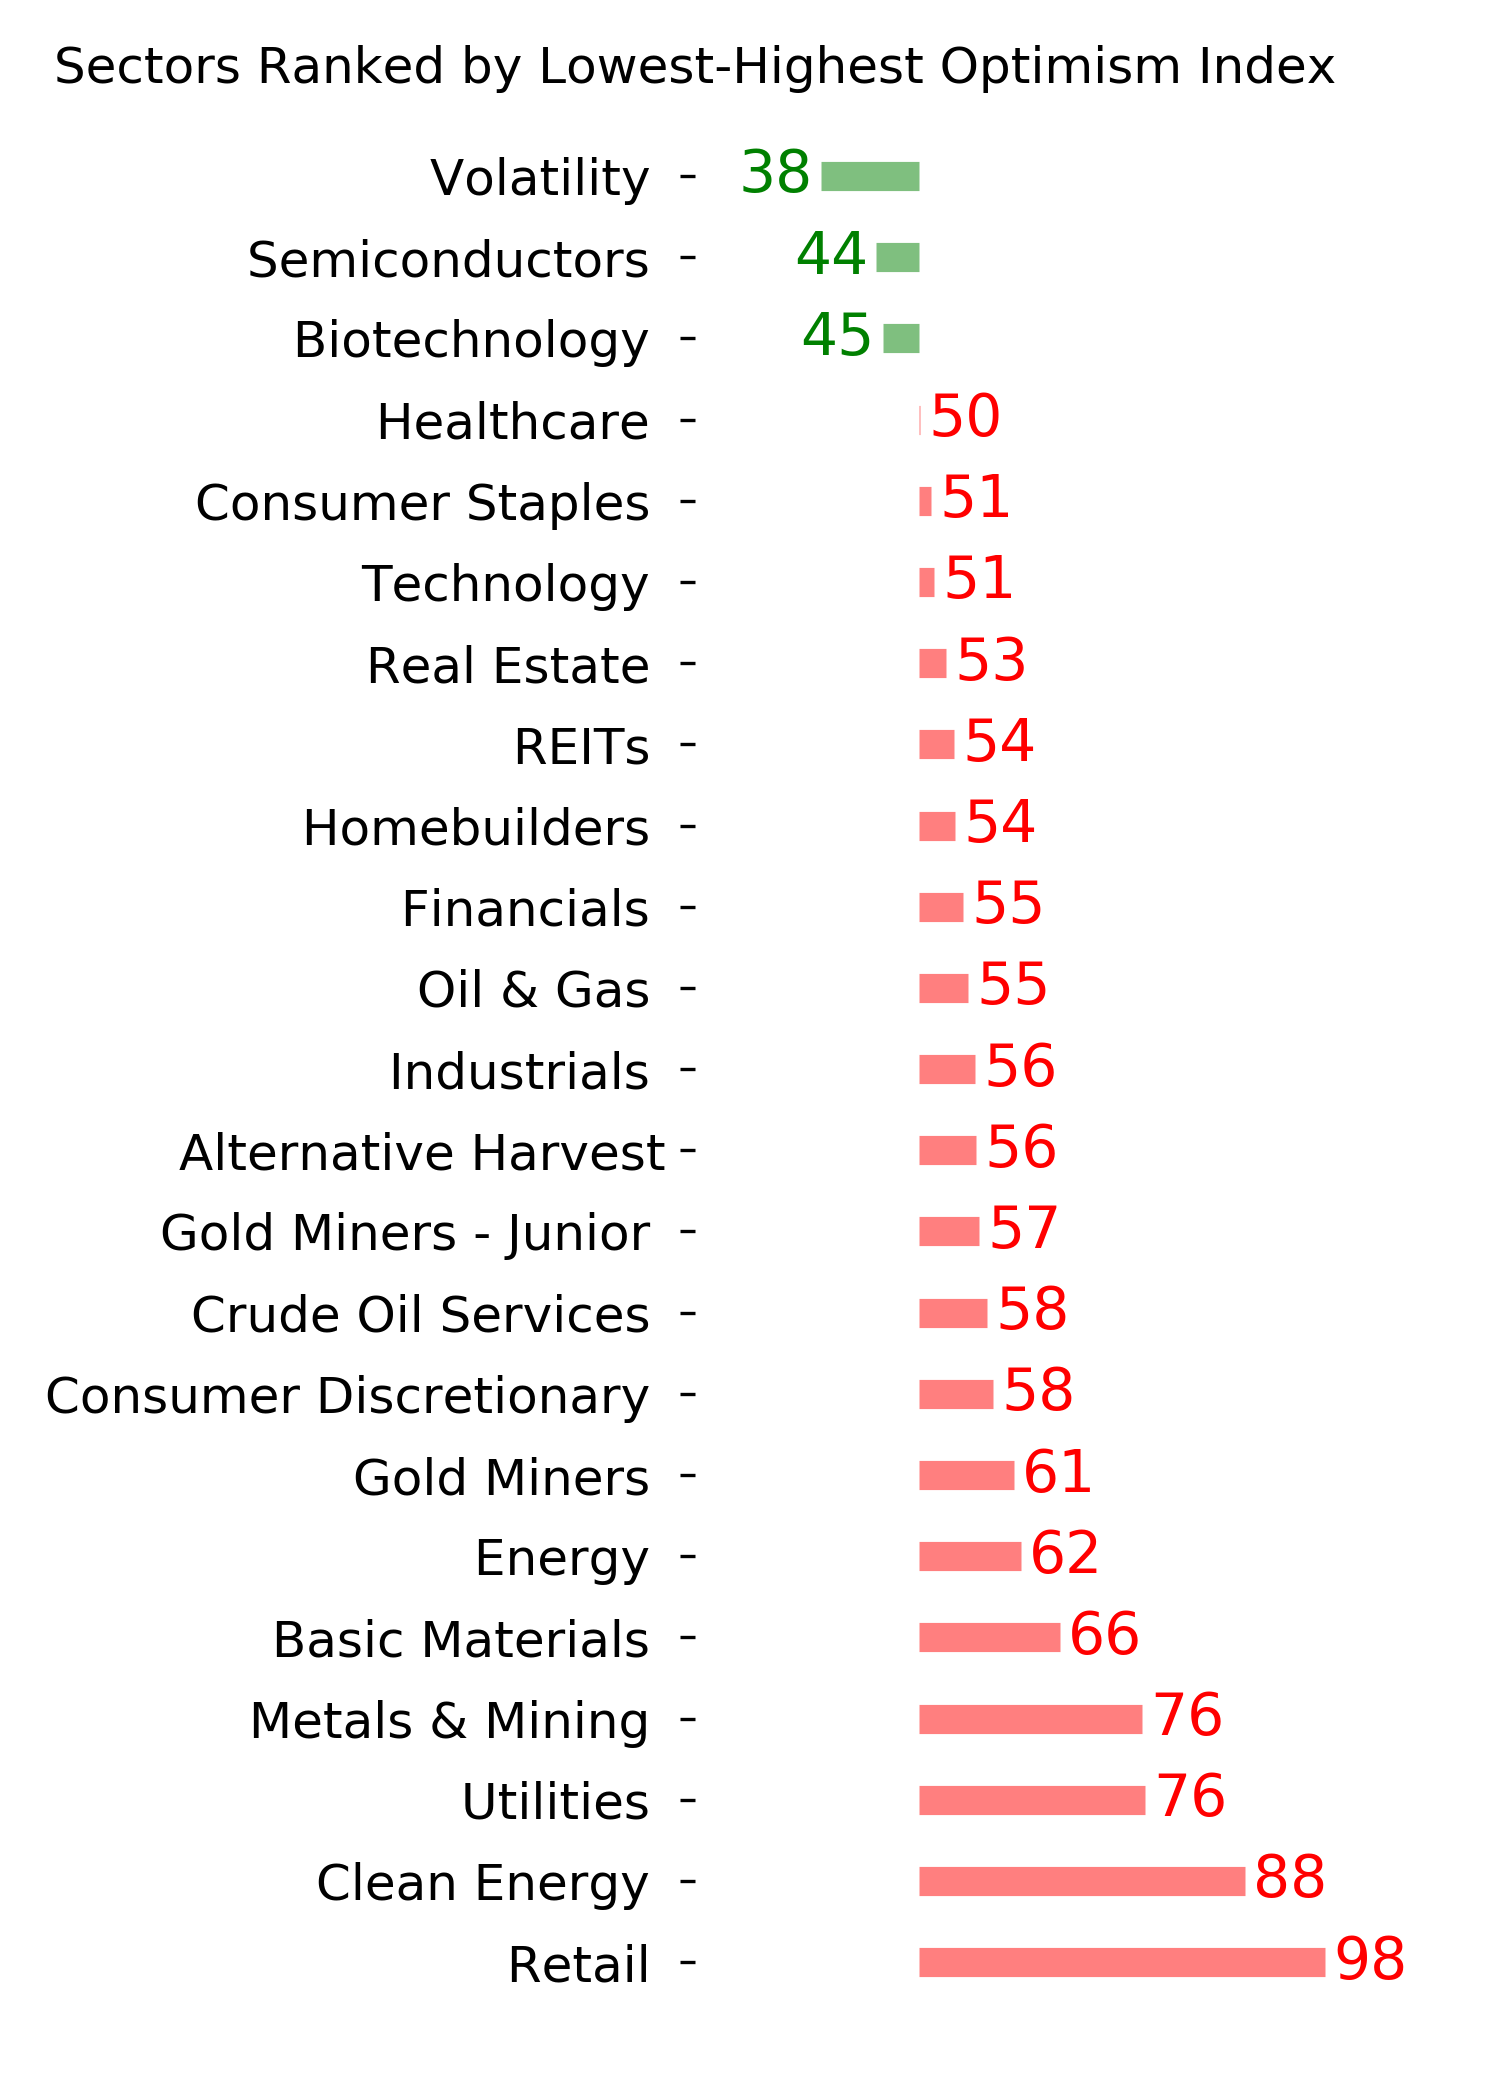
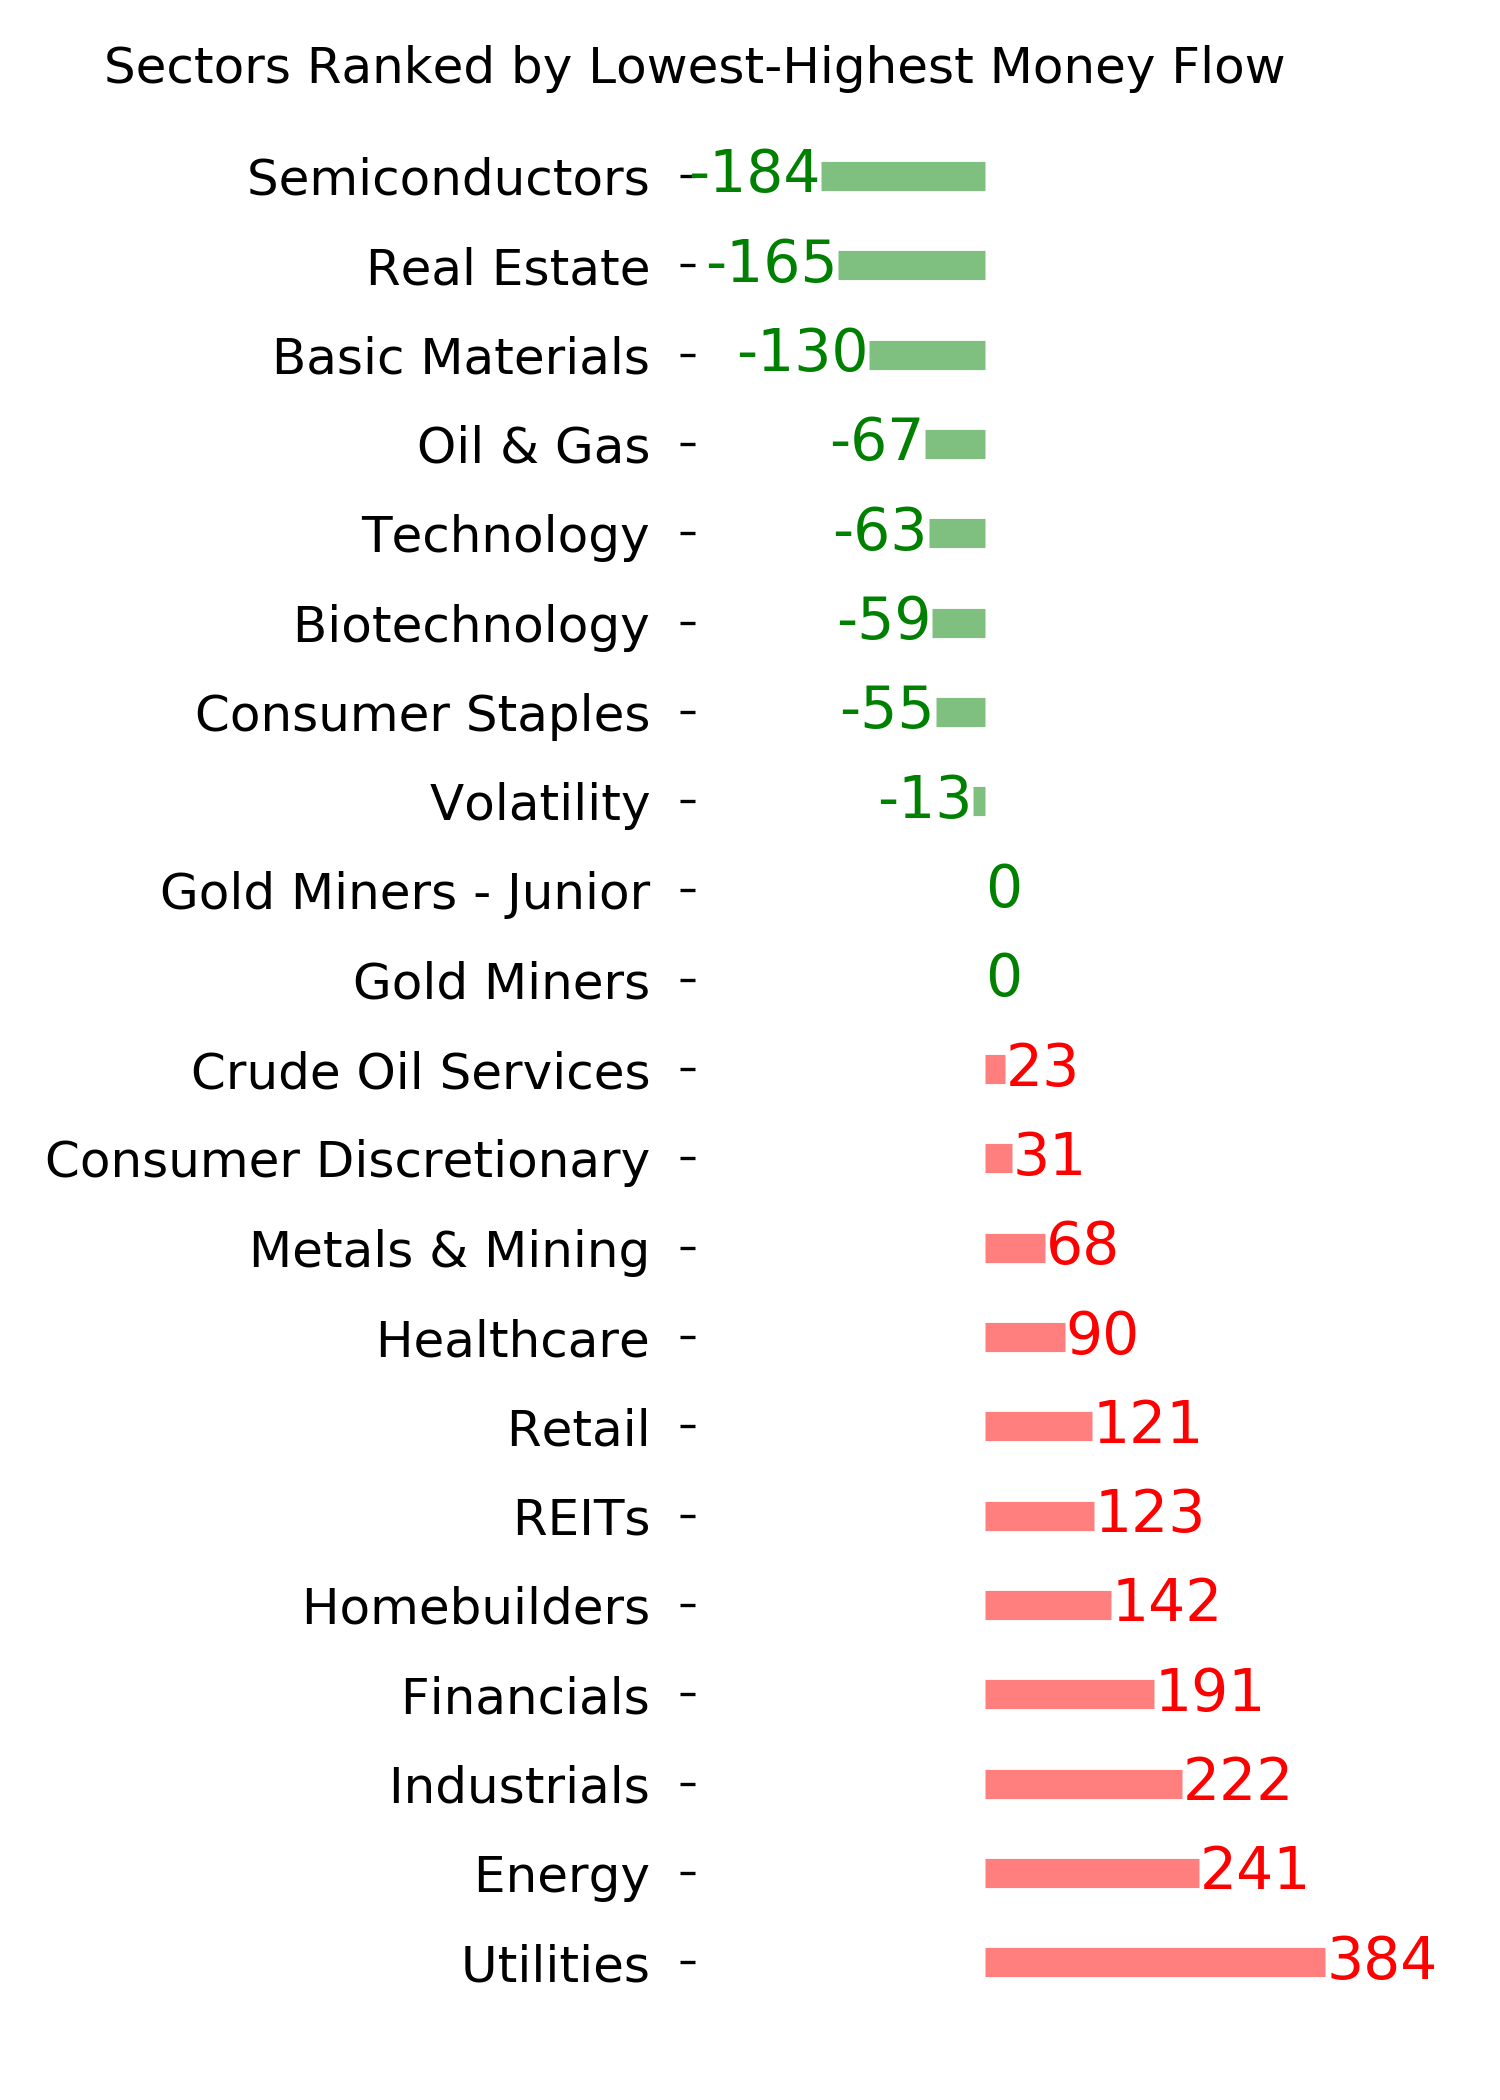
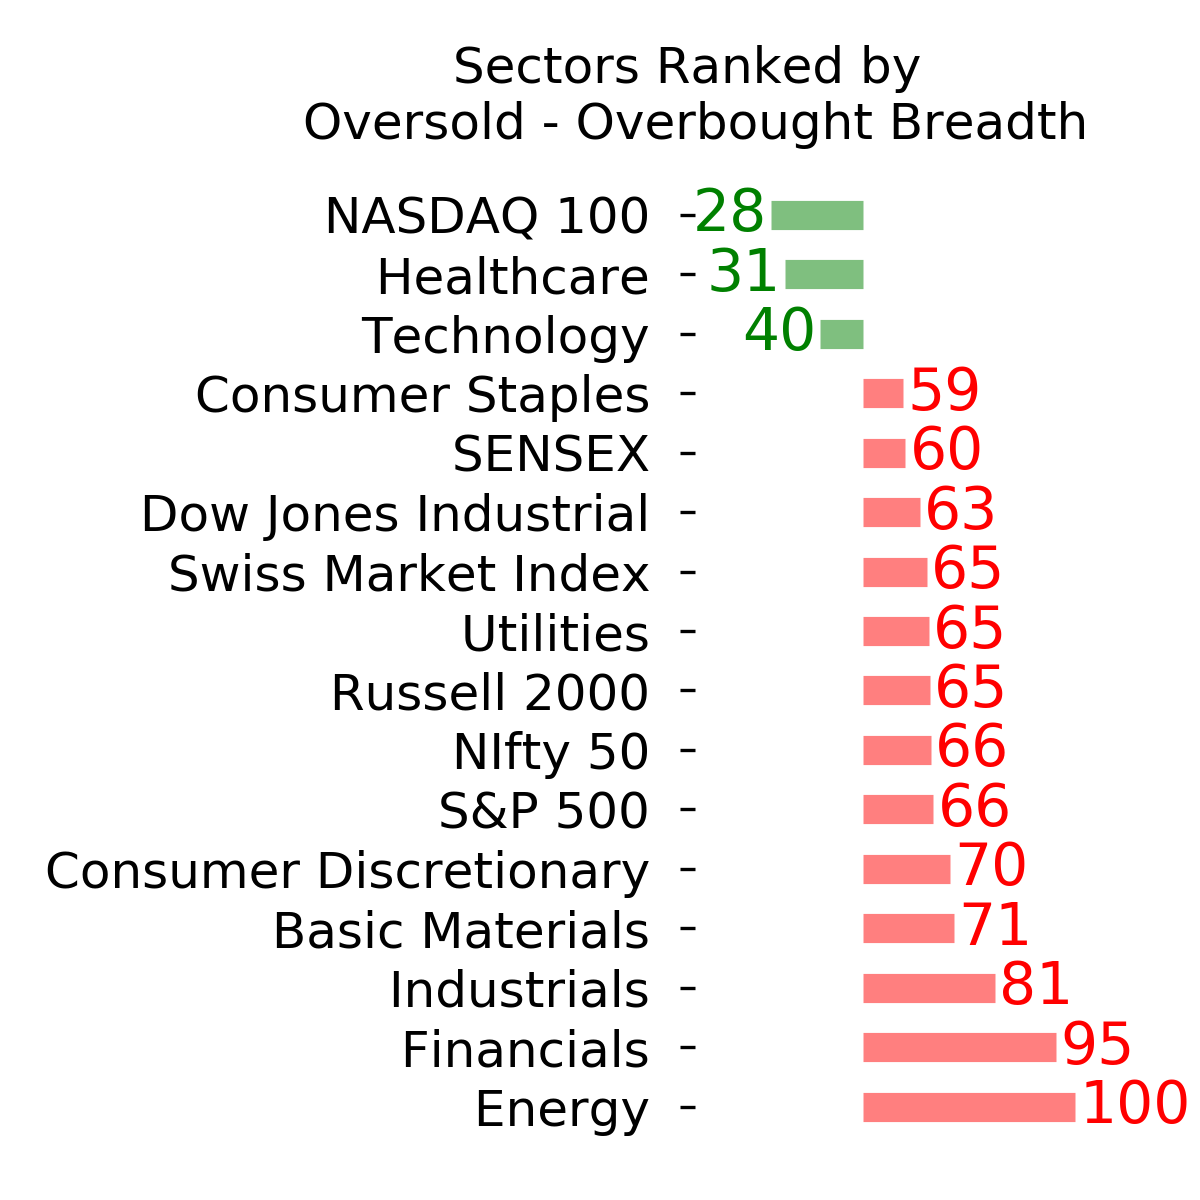
Ranks
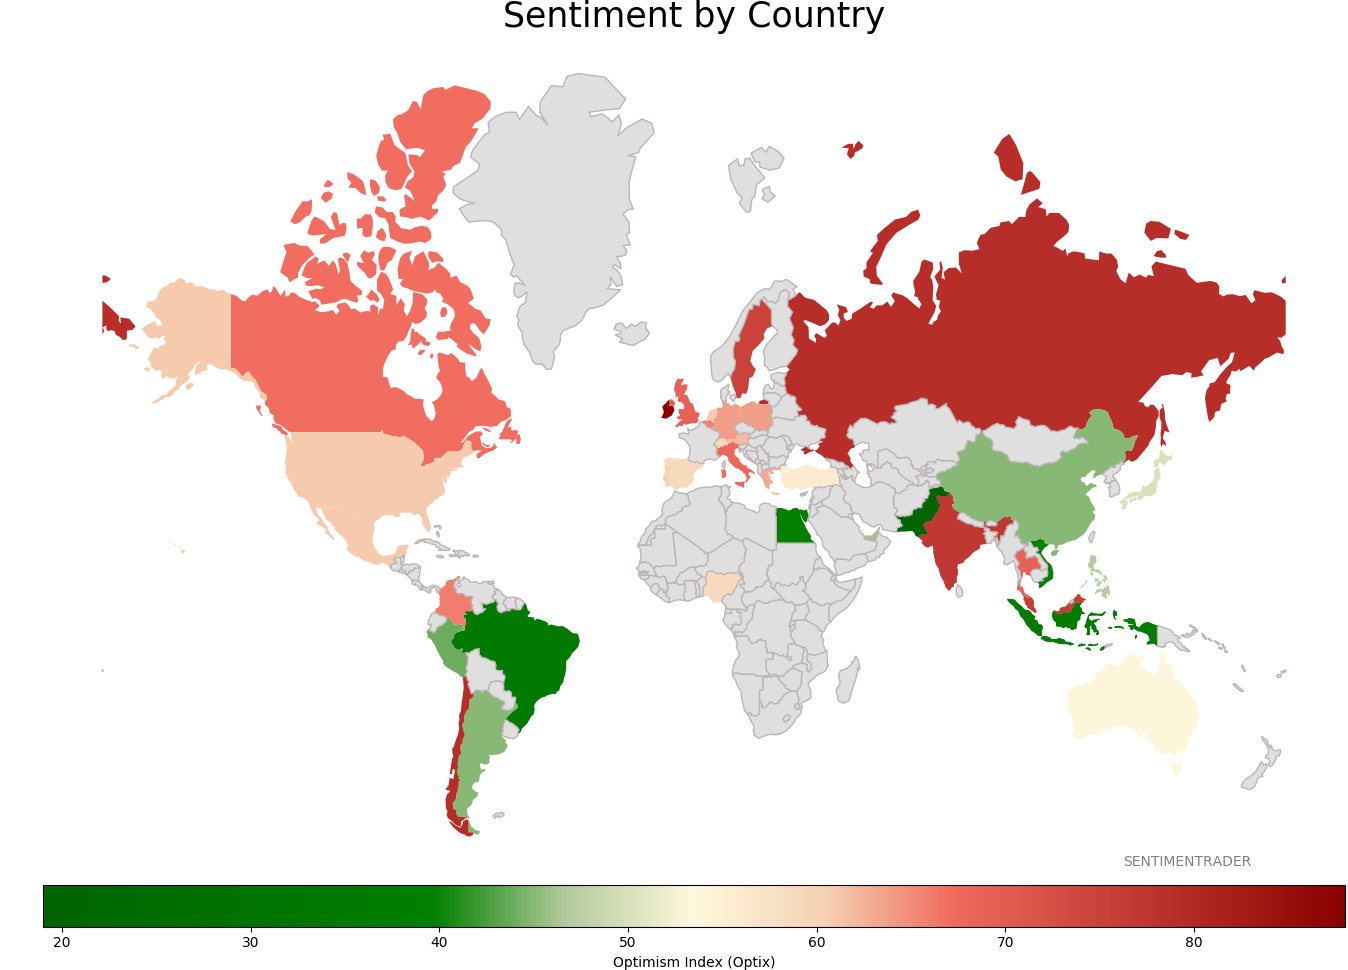
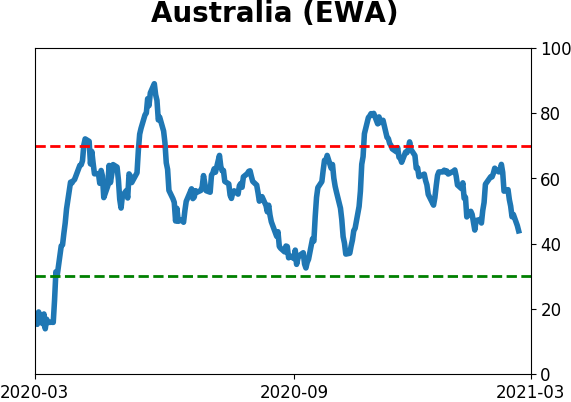
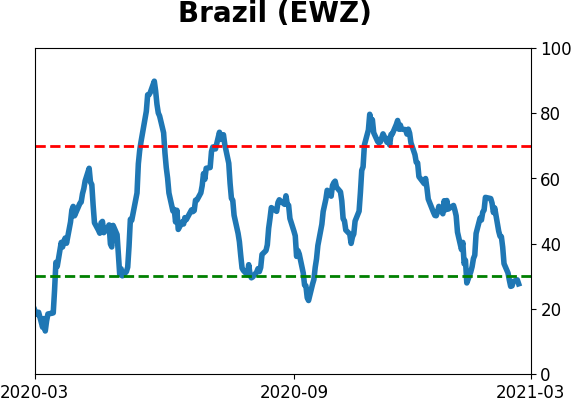
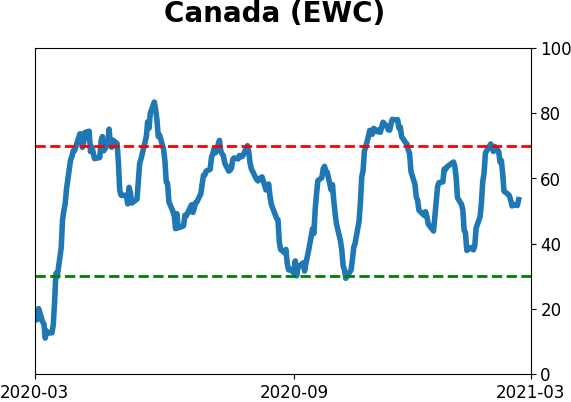
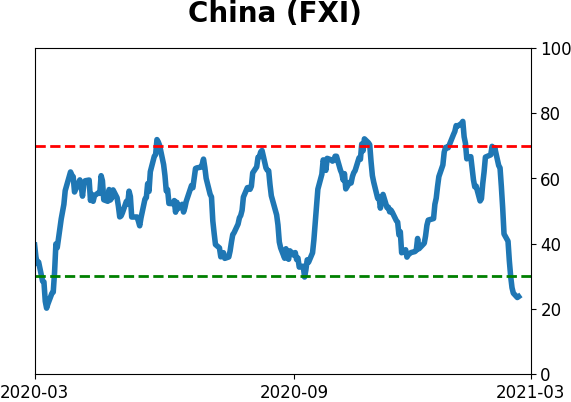
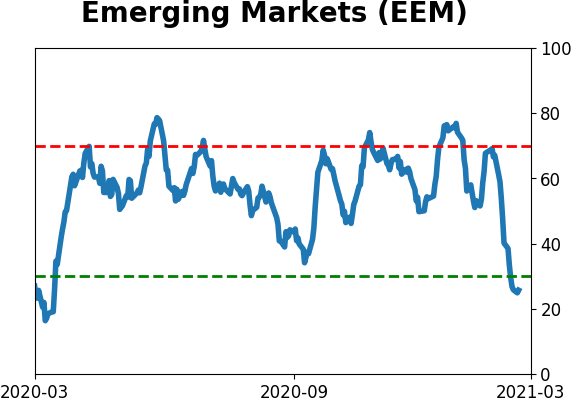
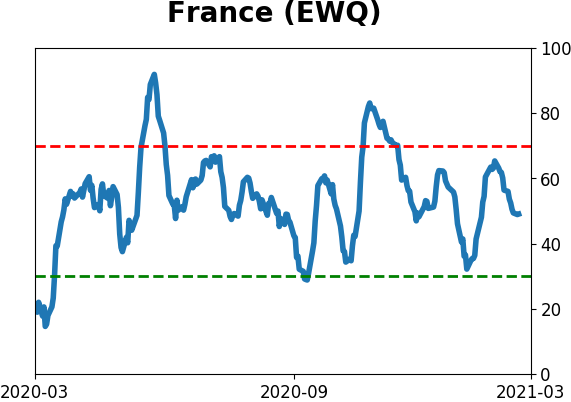
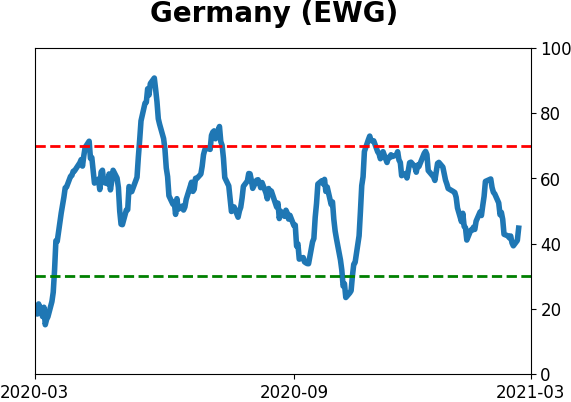
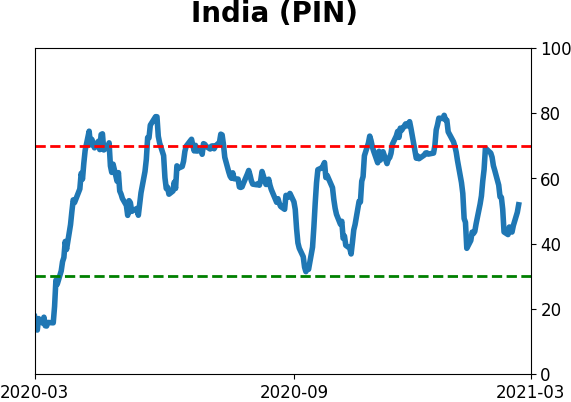
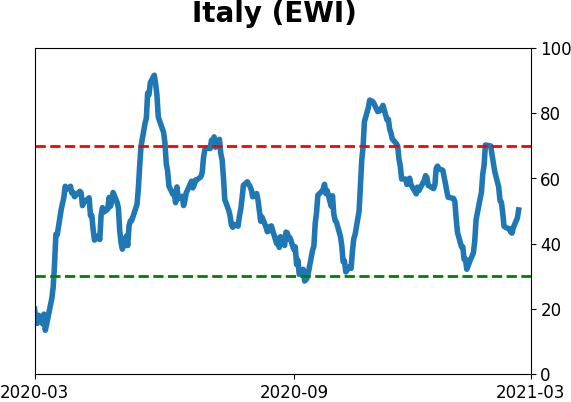
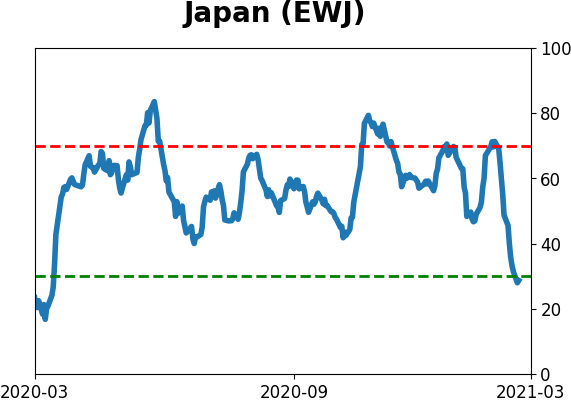
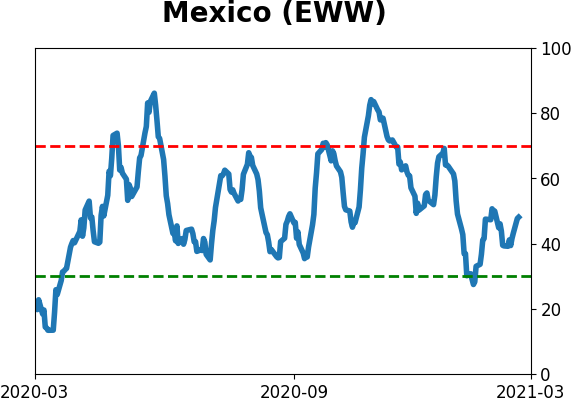
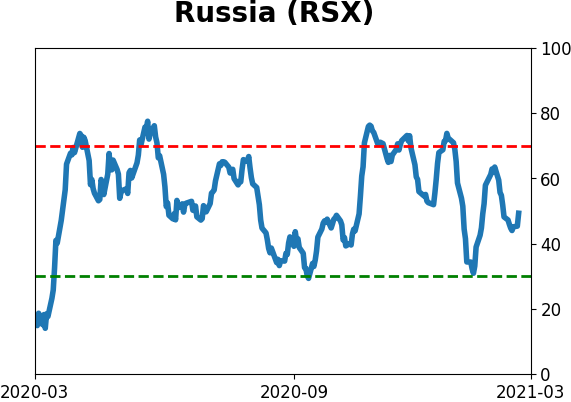
Sentiment Around The World
Optimism Index Thumbnails
|
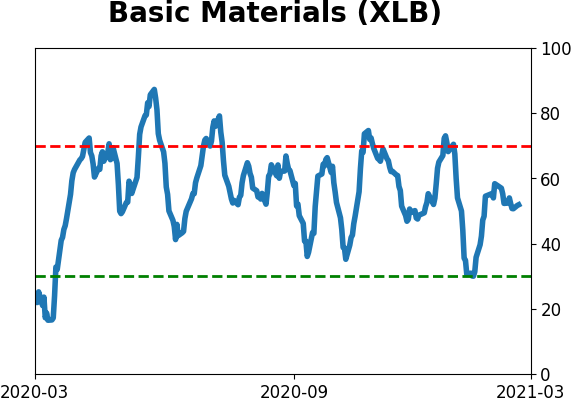
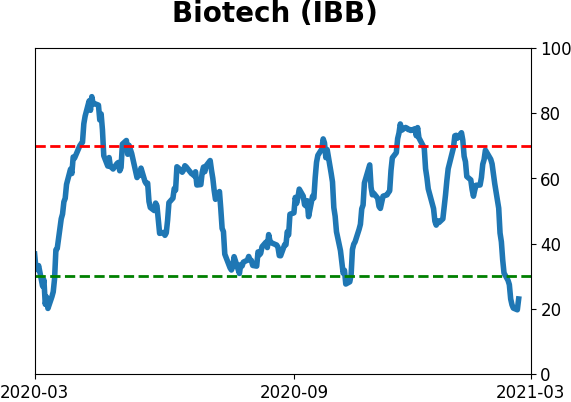
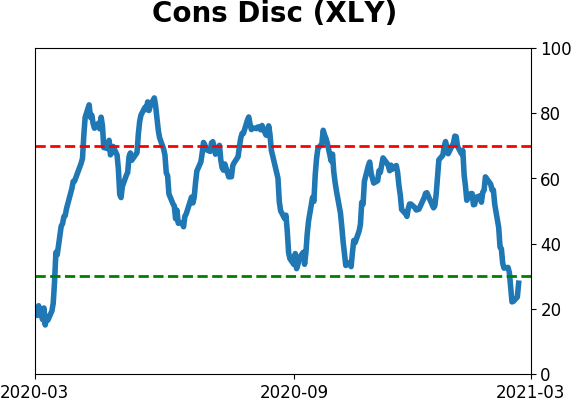
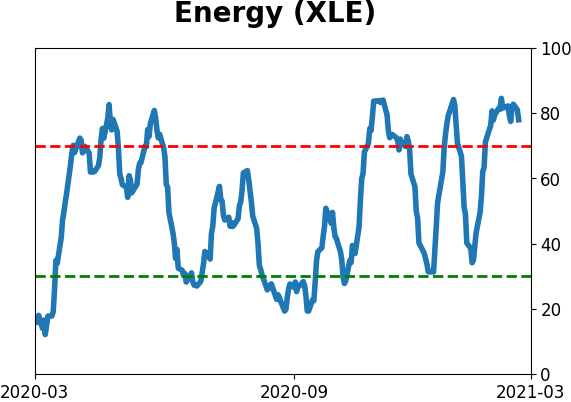
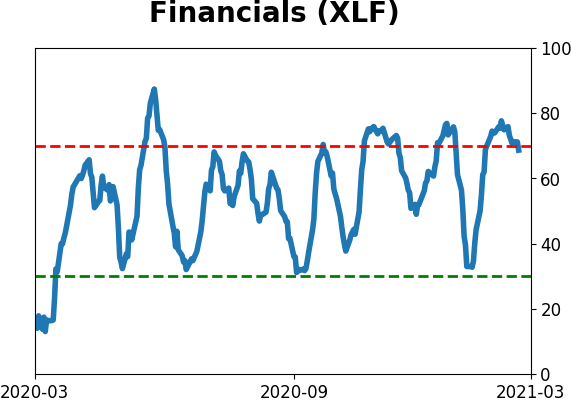
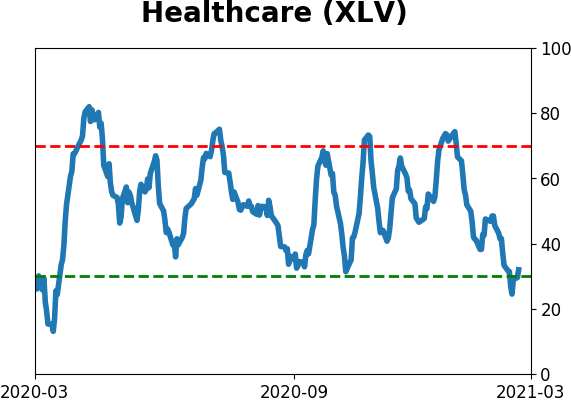
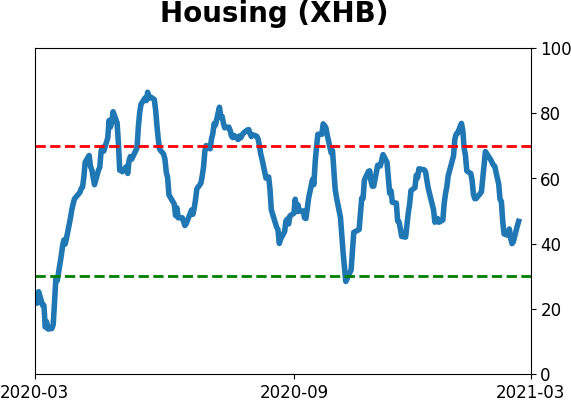
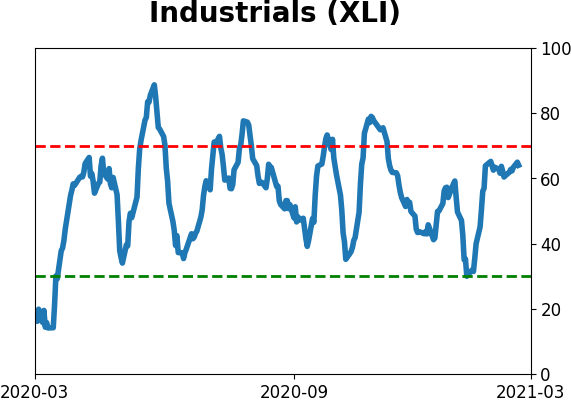
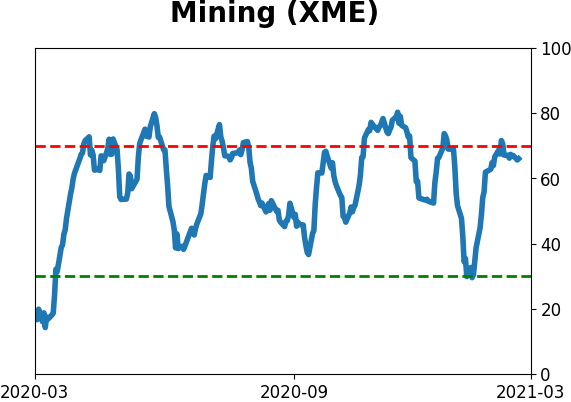
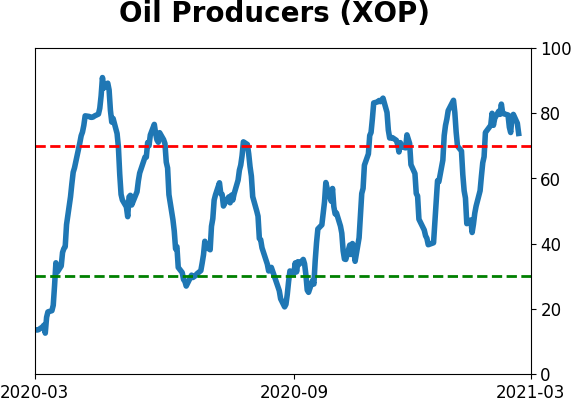
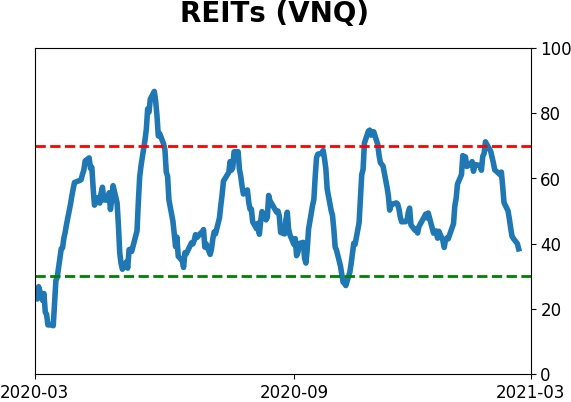
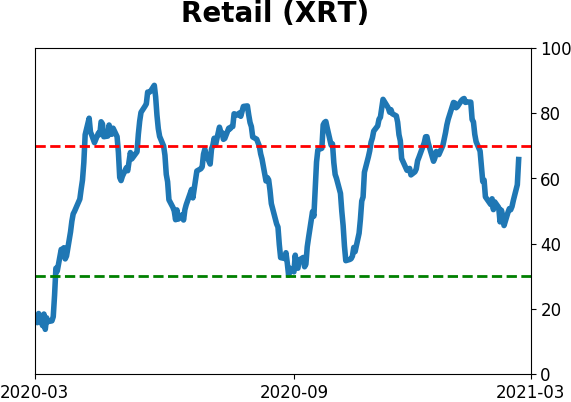
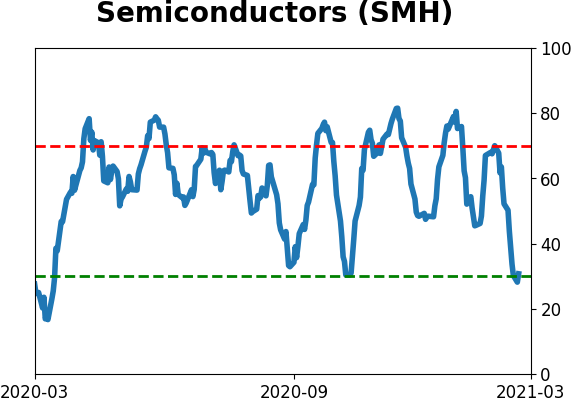
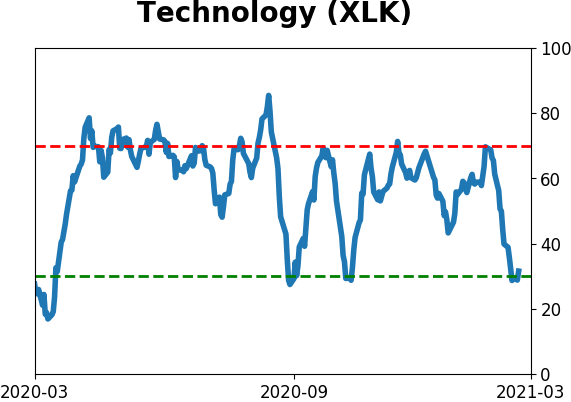
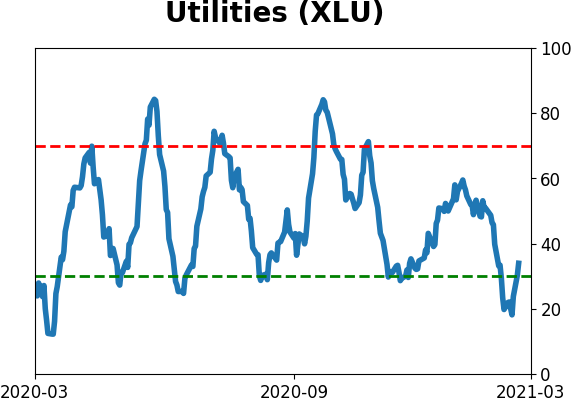
Sector ETF's - 10-Day Moving Average
|
|
|
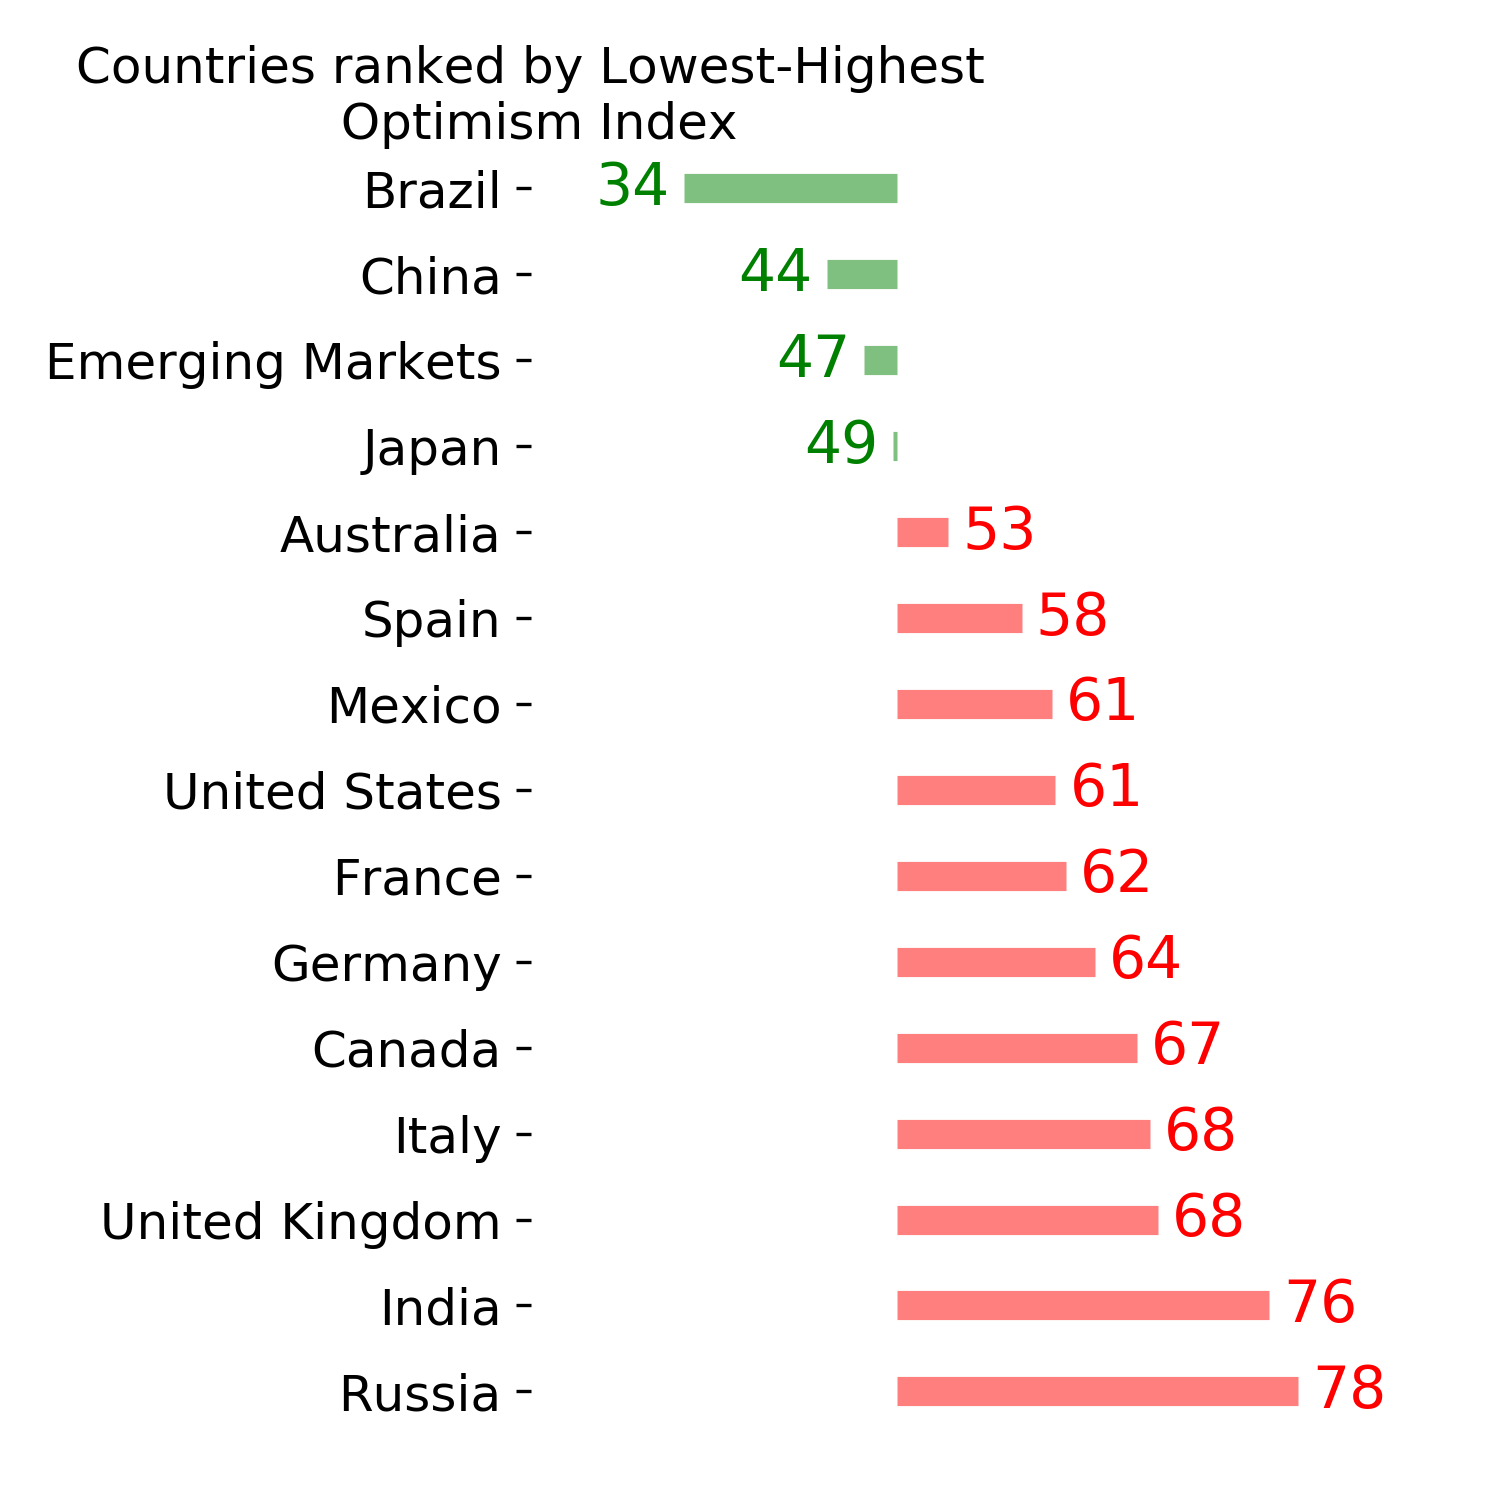
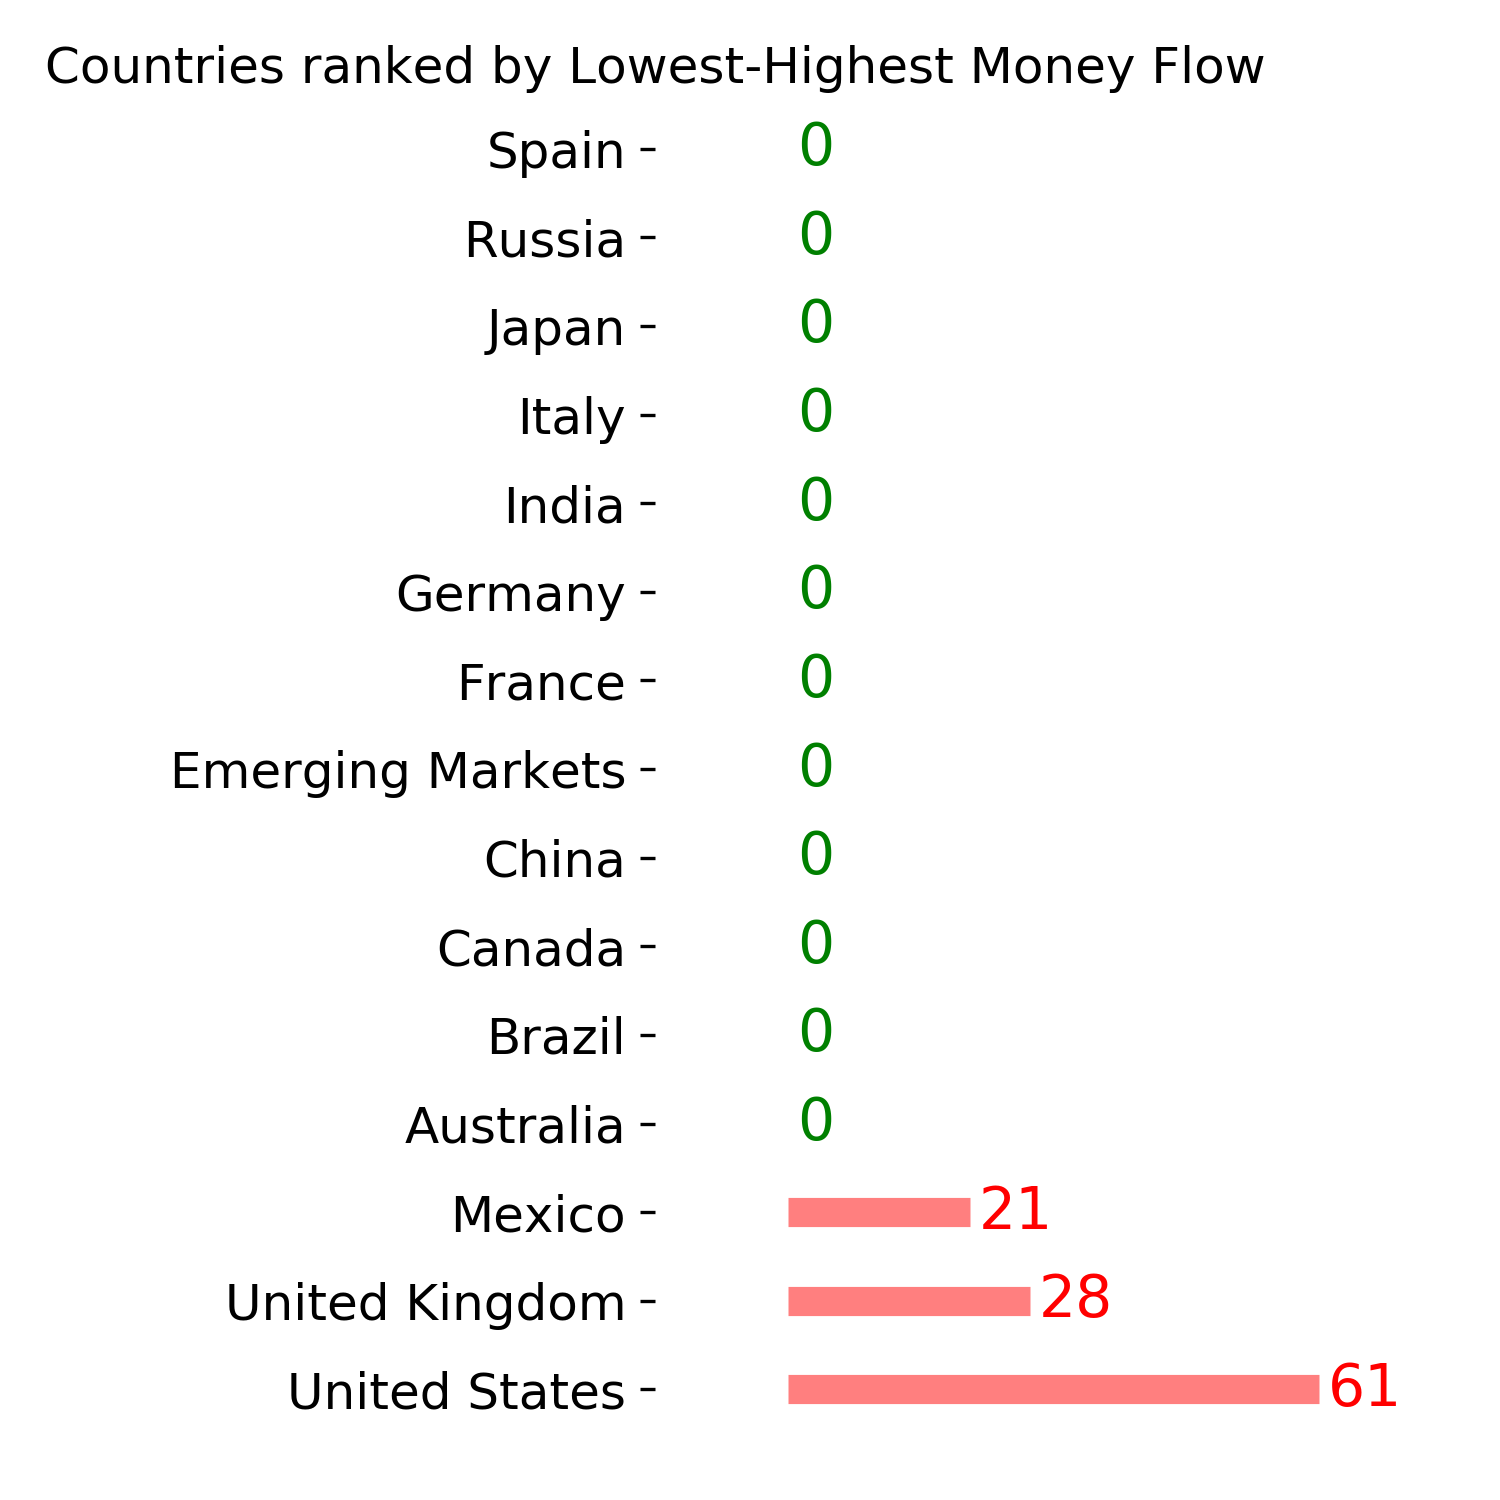
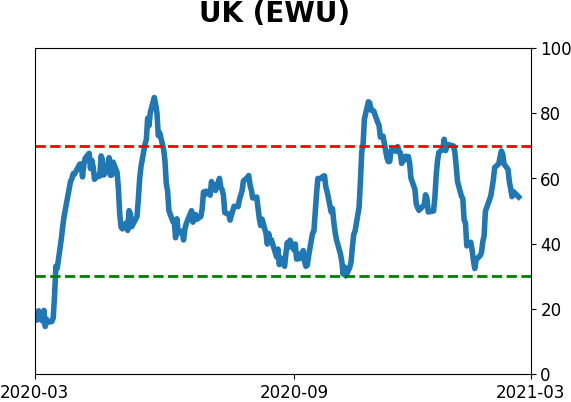
Country ETF's - 10-Day Moving Average
|
|
|
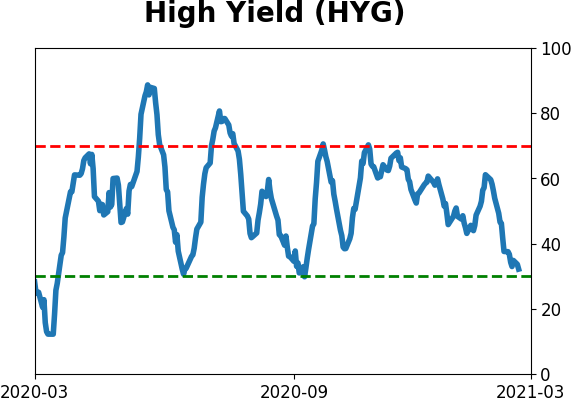
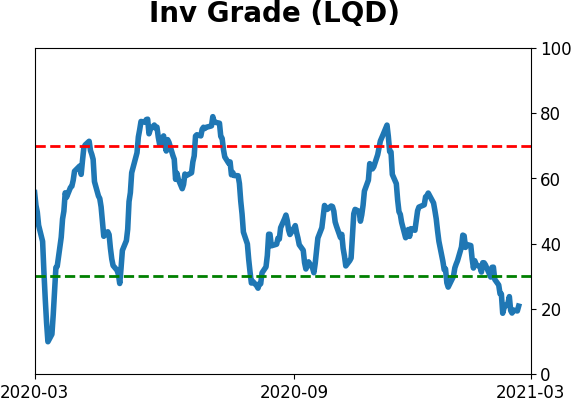
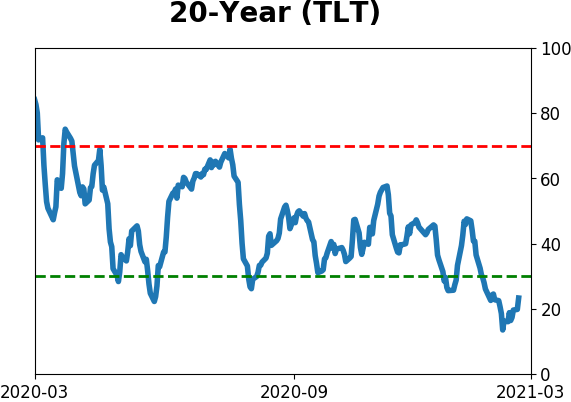
Bond ETF's - 10-Day Moving Average
|
|
|
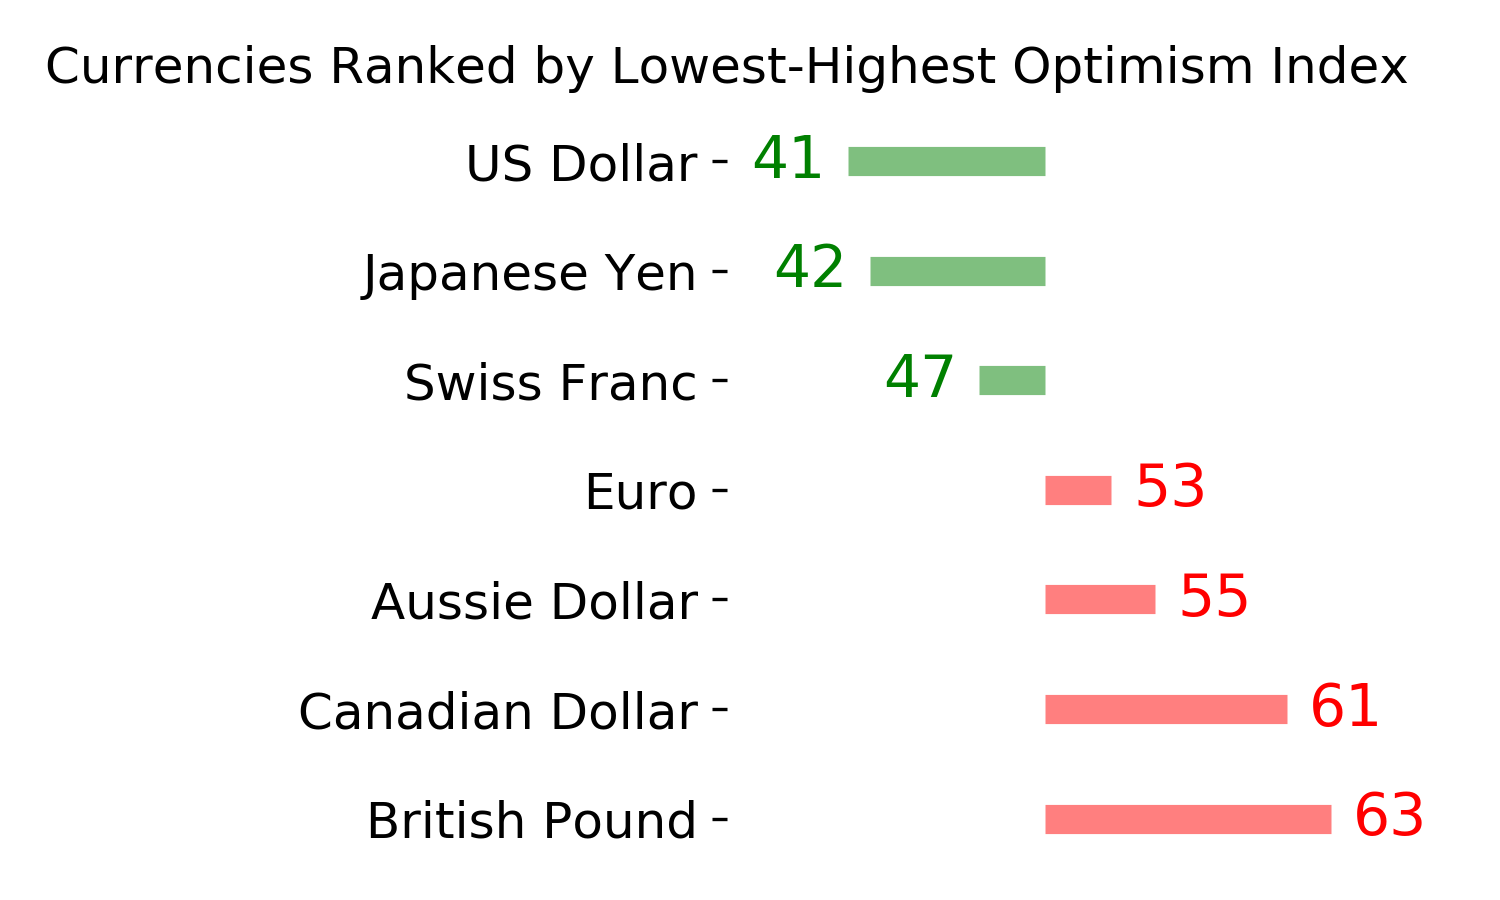
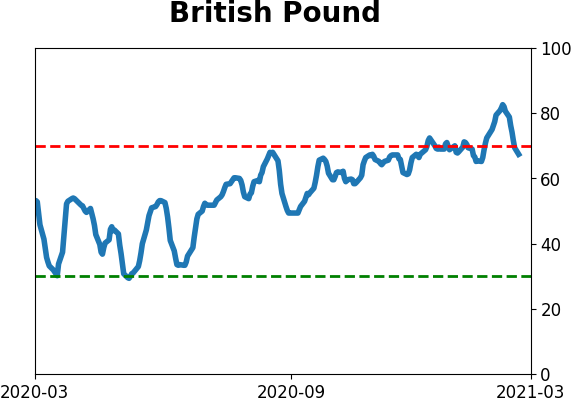
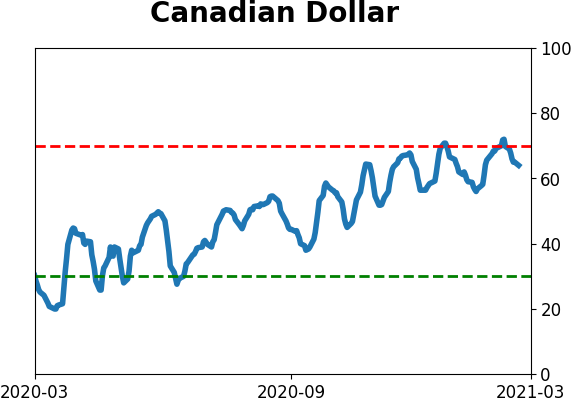
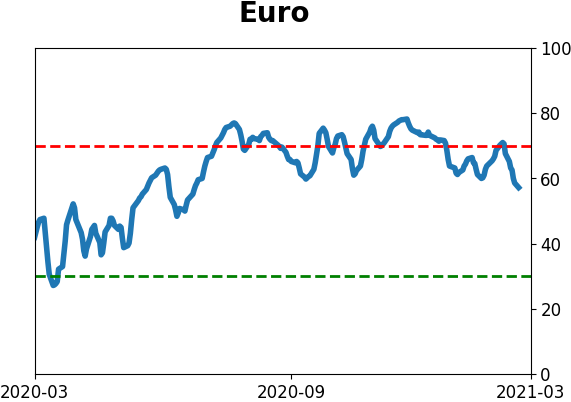
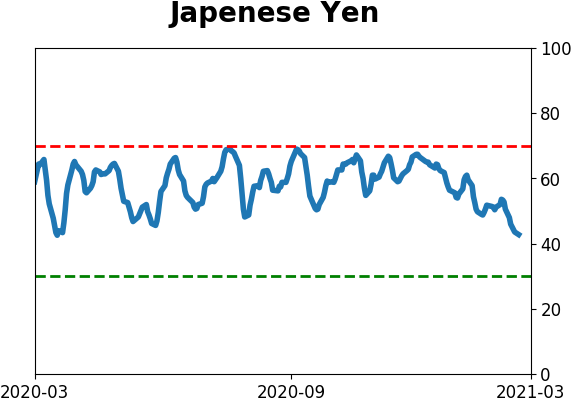
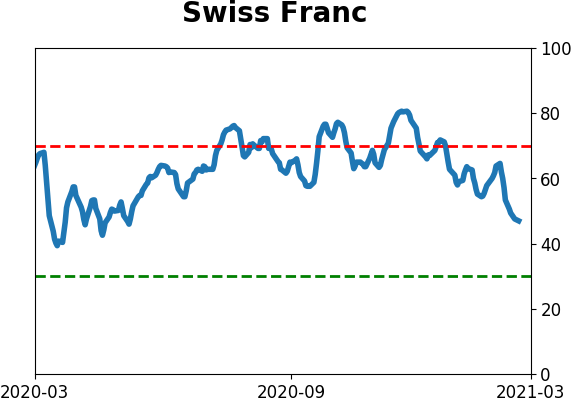
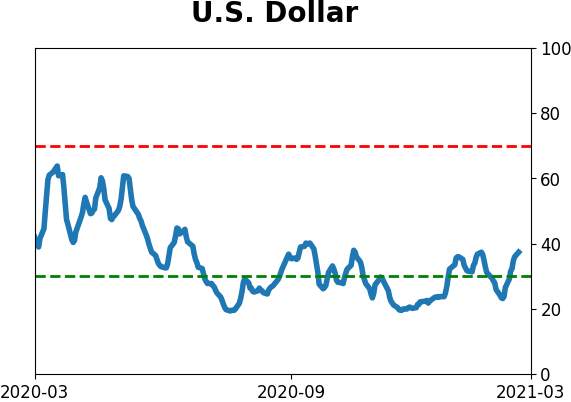
Currency ETF's - 5-Day Moving Average
|
|
|
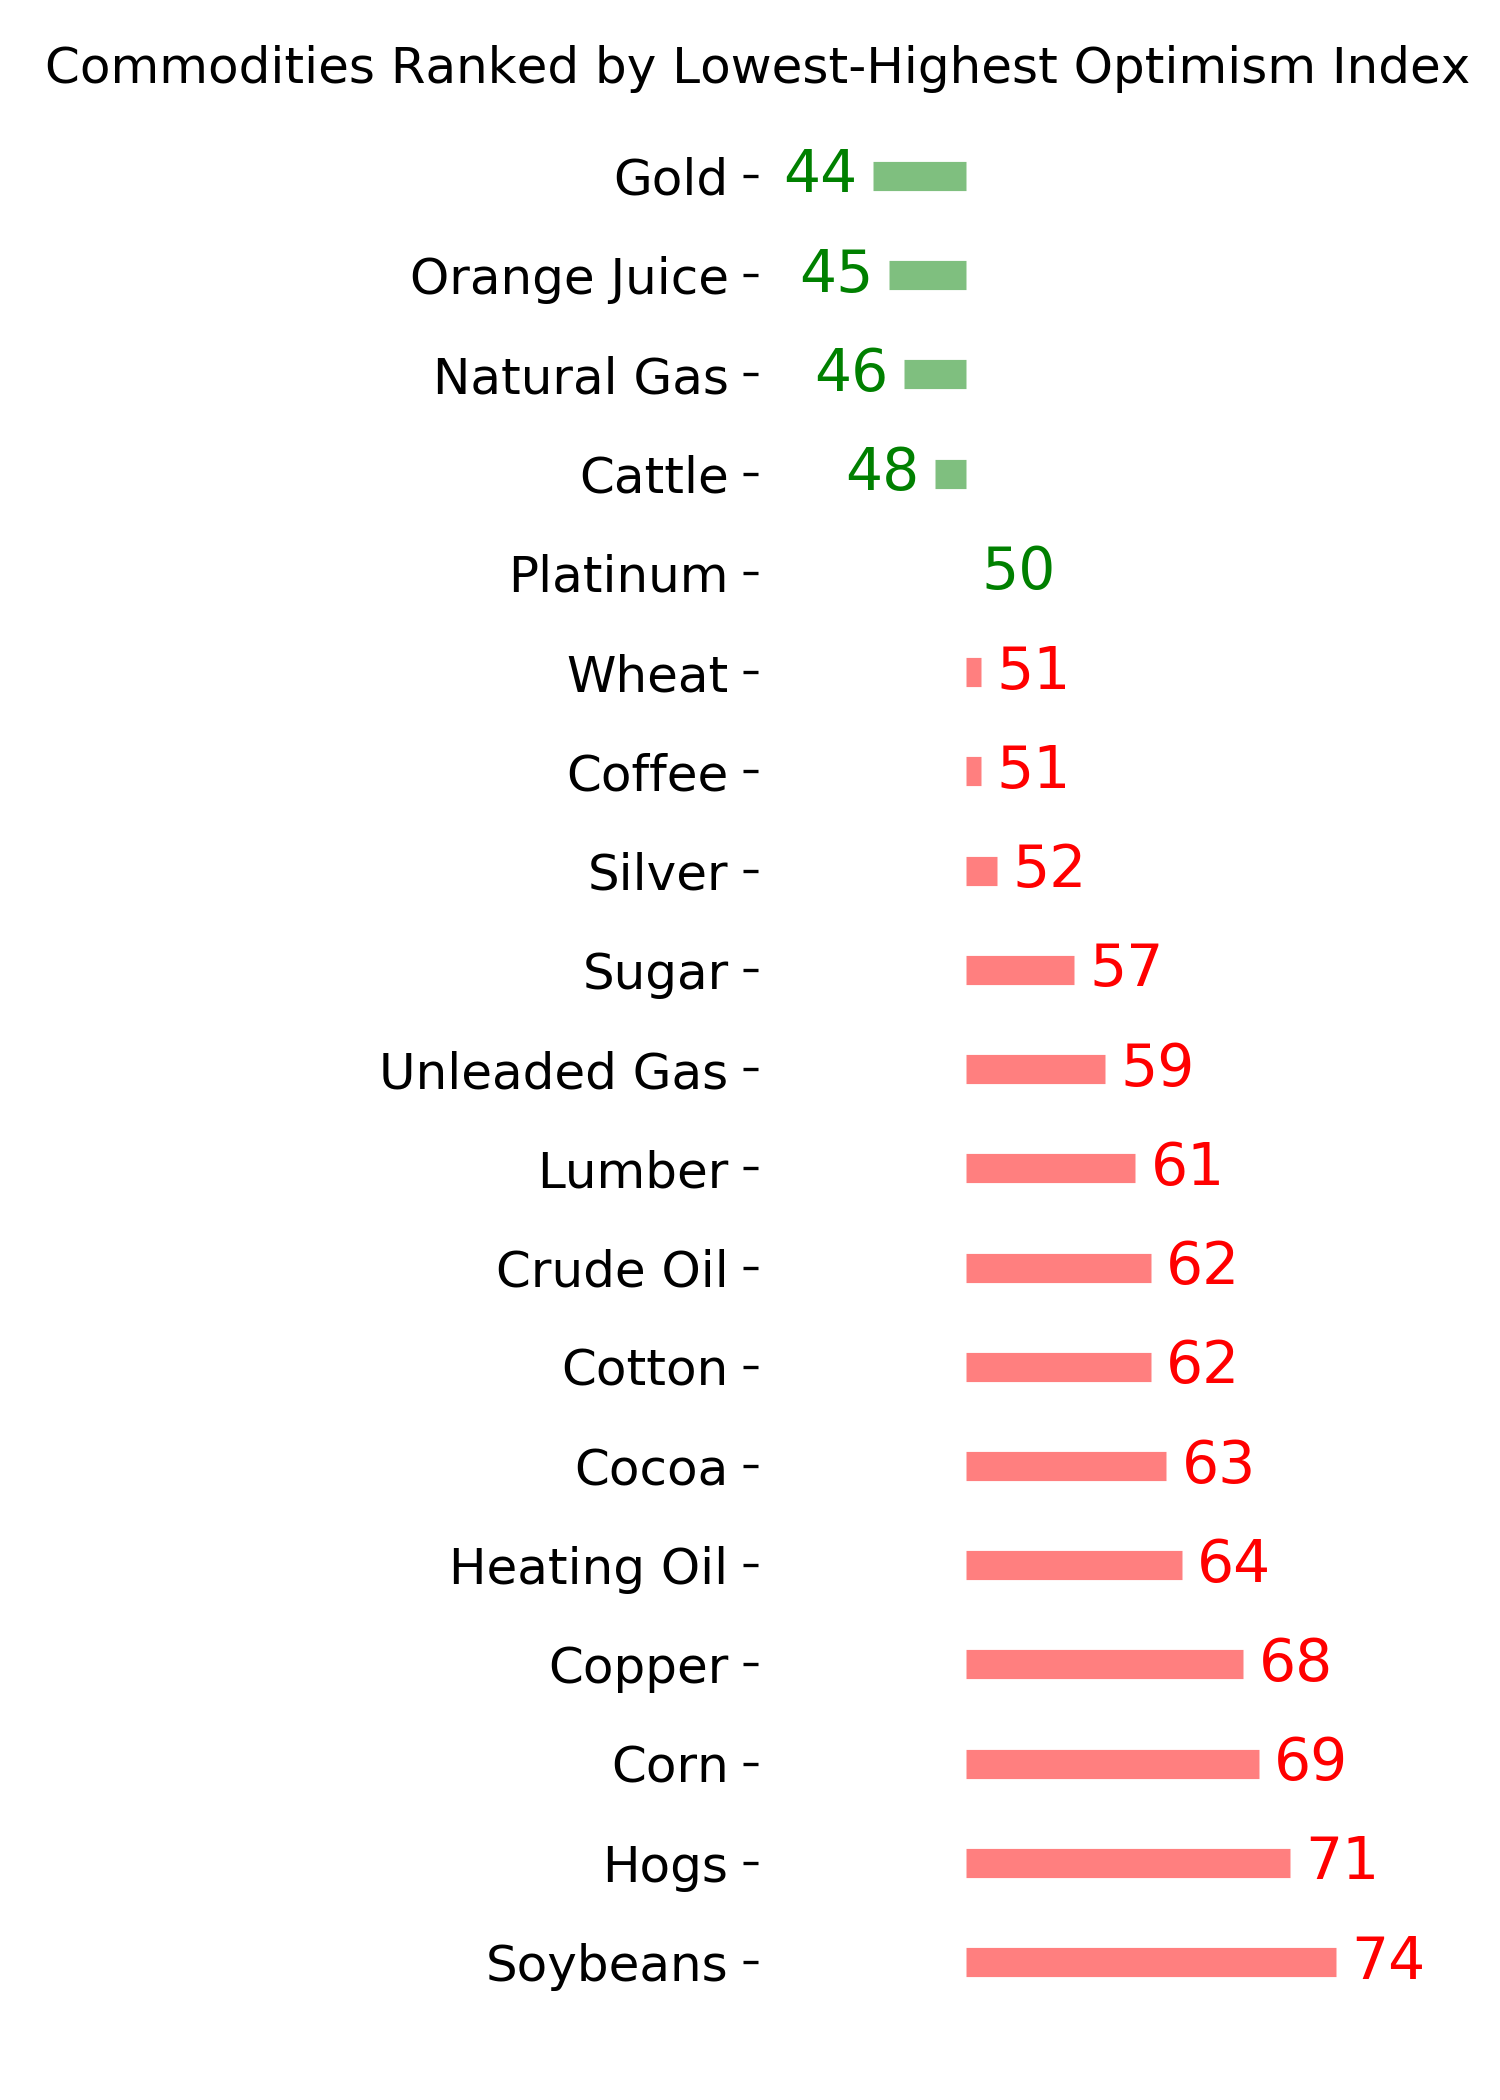
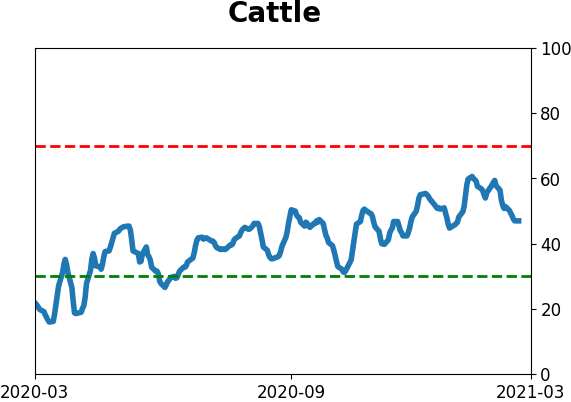
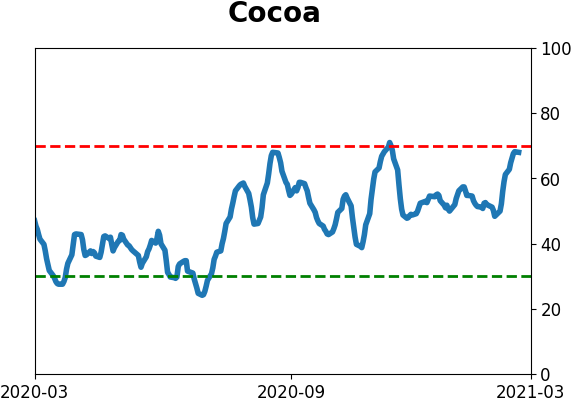
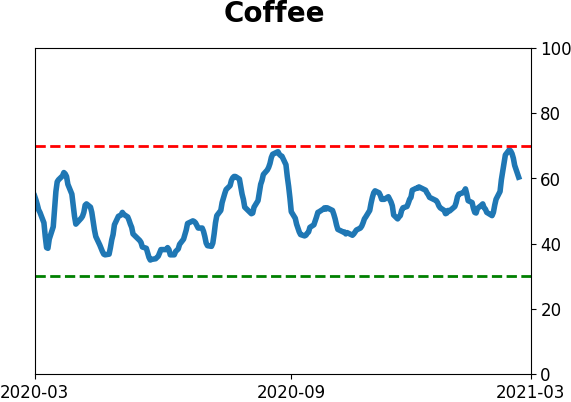
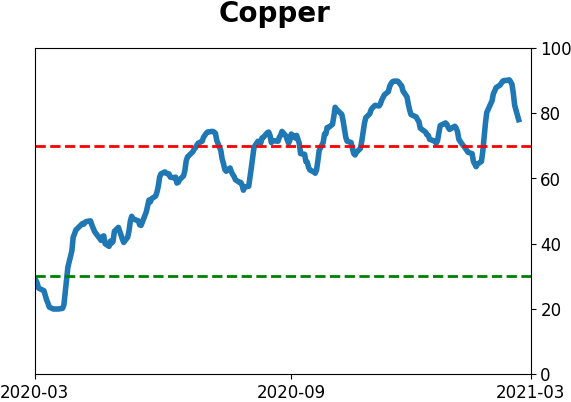
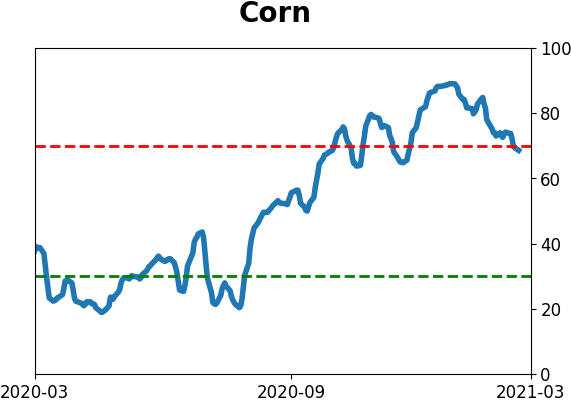
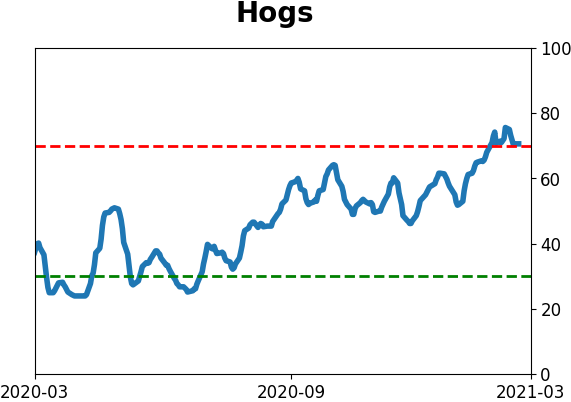
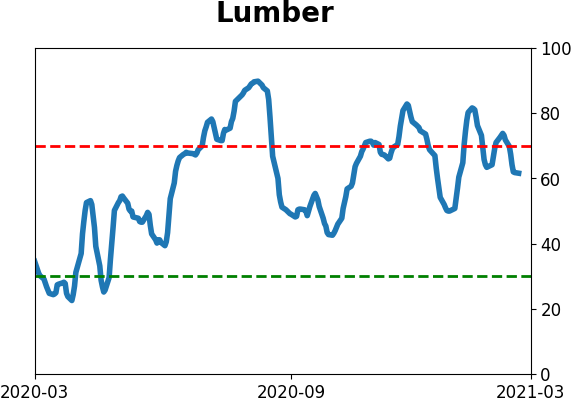
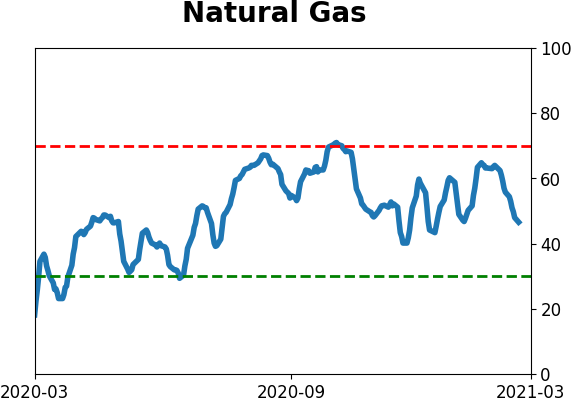
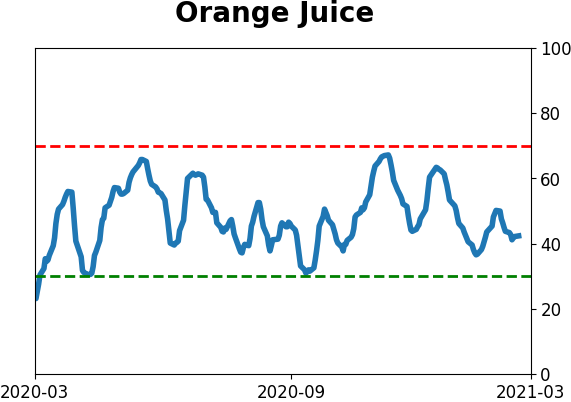
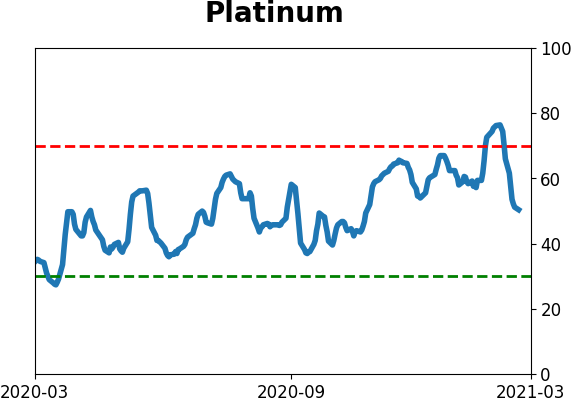
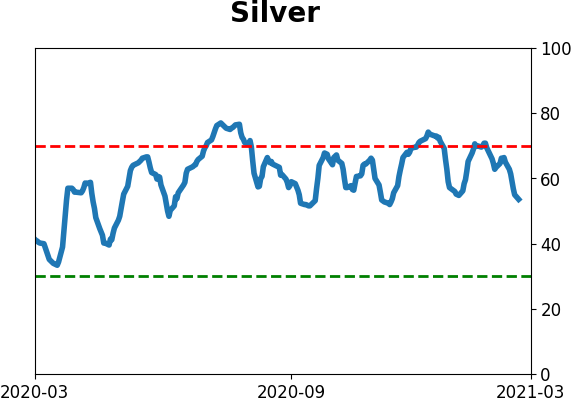
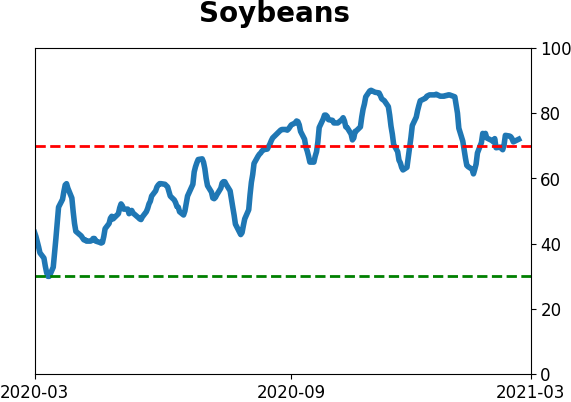
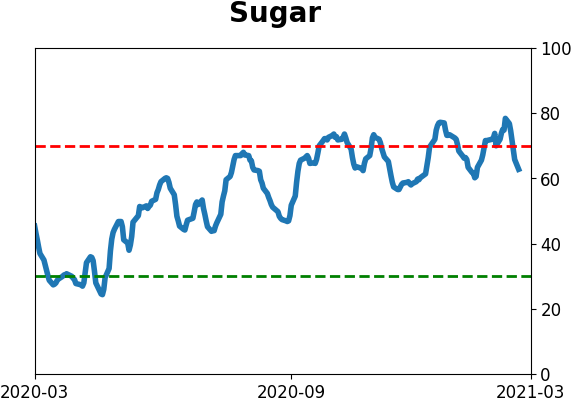
Commodity ETF's - 5-Day Moving Average
|
|