Headlines
|
|
Companies, and bankers, satisfy an eager market:
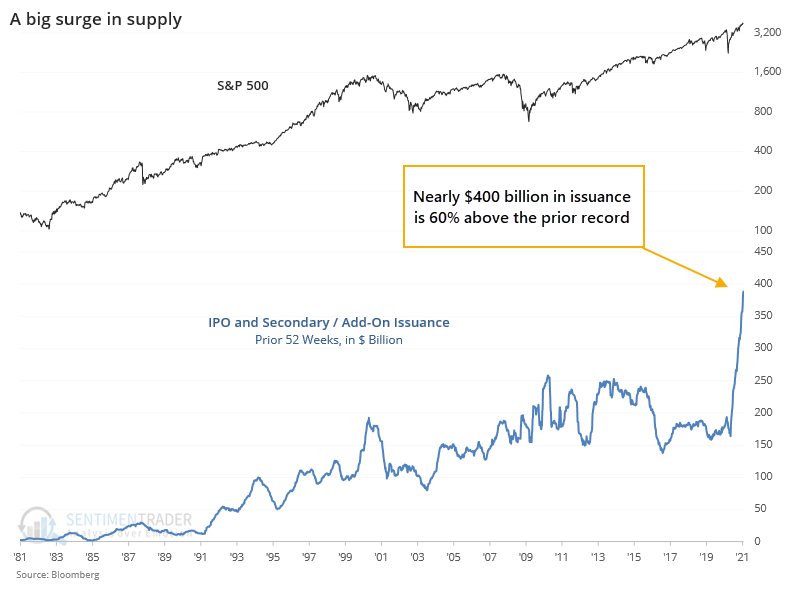
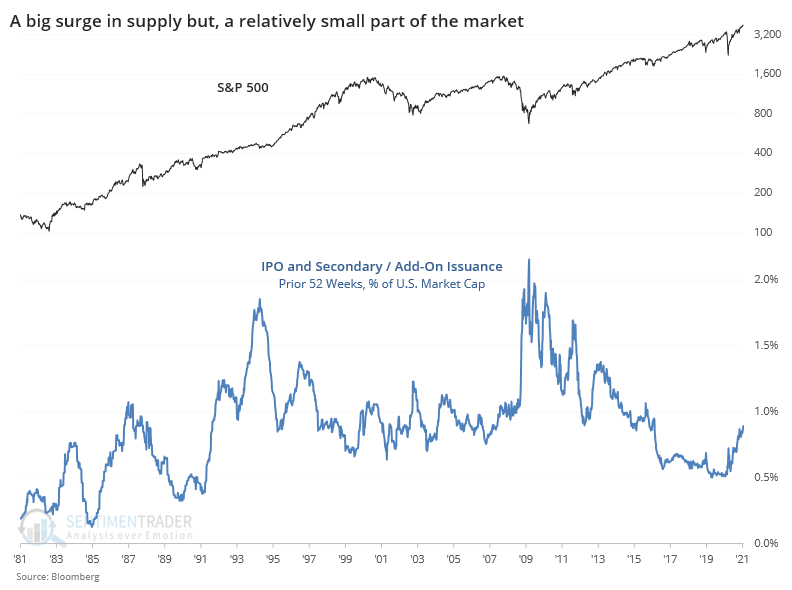
Over the past year, U.S. companies have issued almost $400 billion in shares through IPOs or additional offerings. As a percentage of the market, it's not setting records, and it has a spotty record of being a warning sign of excess.
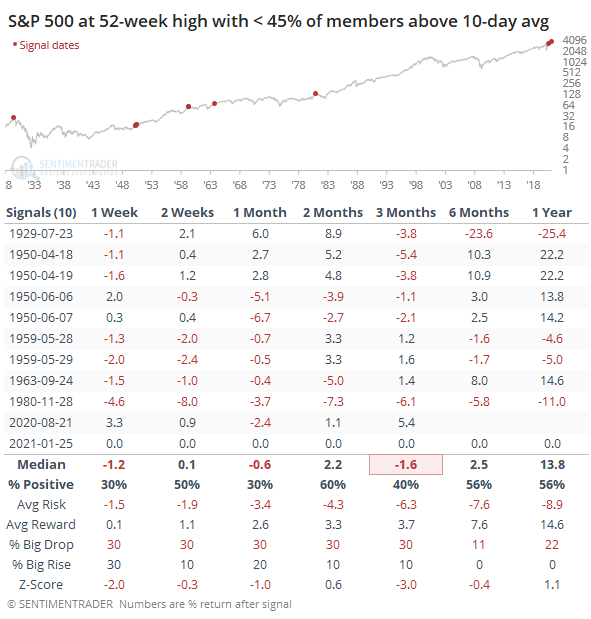
Oddities increase: We've noted repeatedly that up until recently, participation in the rally has been stellar. That's changed in the last week or so as fewer stocks are keeping up with the index. Preliminary data shows that the S&P 500 closed at a 52-week high on Monday and yet fewer than 45% of its member stocks managed to close above their short-term 10-day moving averages. That's happened only 10 times since 1928. This kind of sketchy behavior is exactly what bulls do not want to see consistently given the record level of speculative activity.
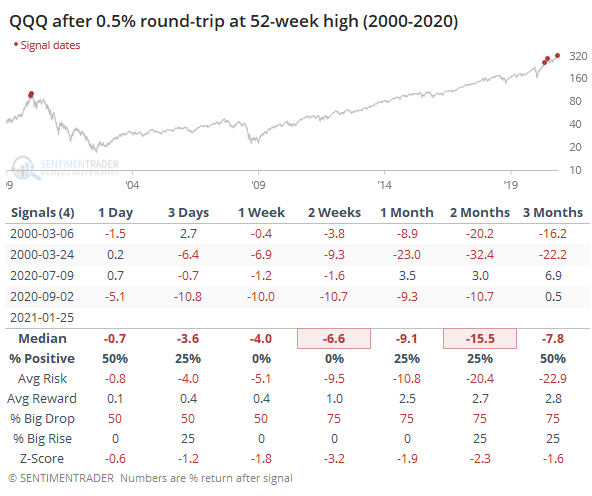
Round trip: Big tech made a big round trip on Monday. The Nasdaq 100 fund, QQQ, gapped up more than 0.75%, fell enough to show more than a 0.75% loss at the low, then rallied to once again show a gain of more than 0.75% by the close and a 52-week high. It has done that only twice before, on March 24, 2000 and September 2, 2020. Round-trips of 0.5% or more are shown below, still rare.
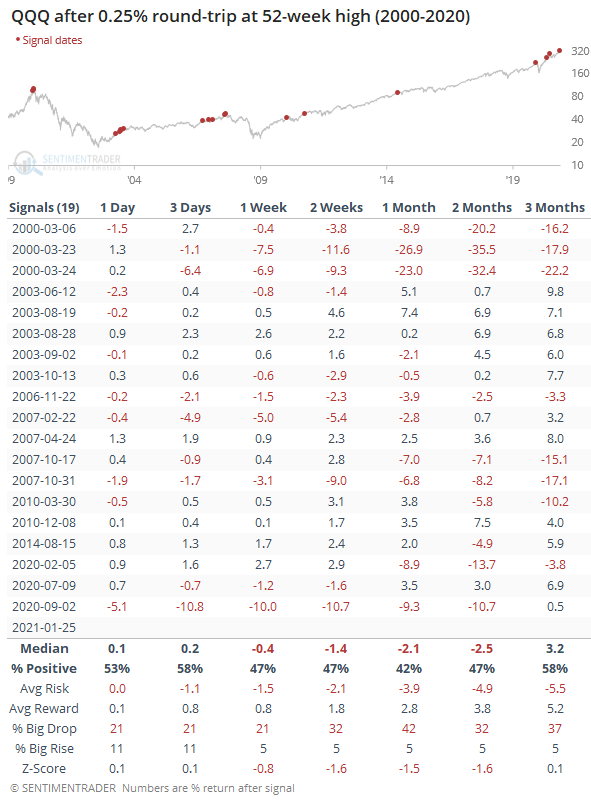
 That's a tiny sample size, so if we relax it to 0.25% round-trips, it still had a mostly negative bias, especially over the next 2-4 weeks. That's a tiny sample size, so if we relax it to 0.25% round-trips, it still had a mostly negative bias, especially over the next 2-4 weeks.
Bottom Line:
The market environment is pristine, with only sporadic signs of internal deterioration, but with near-historic optimism, gains tend to be muted, with a high probability of being reversed at some point over the ensuing weeks. | Other Sectors and Assets |
| | Positives | Negatives | | 1. Energy (here, here, and here) | 1. Skewed tech (here and here) |
|
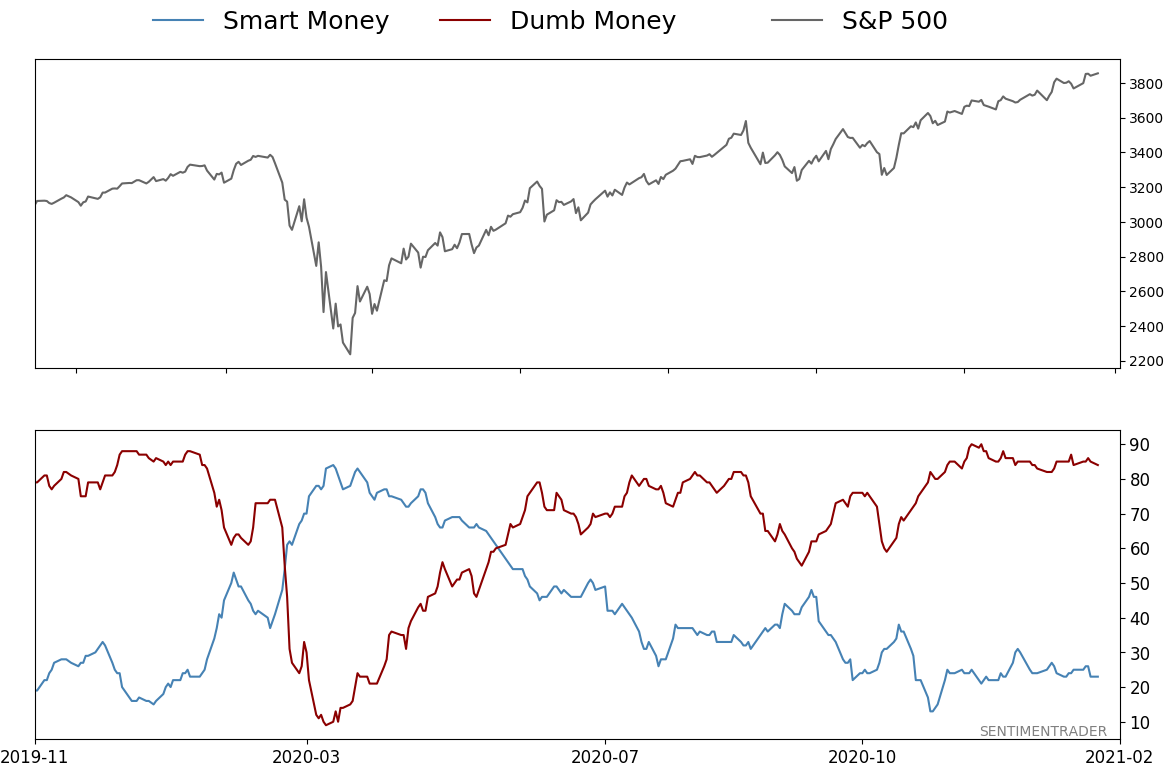
Smart / Dumb Money Confidence
|
Smart Money Confidence: 23%
Dumb Money Confidence: 84%
|
|
Risk Levels
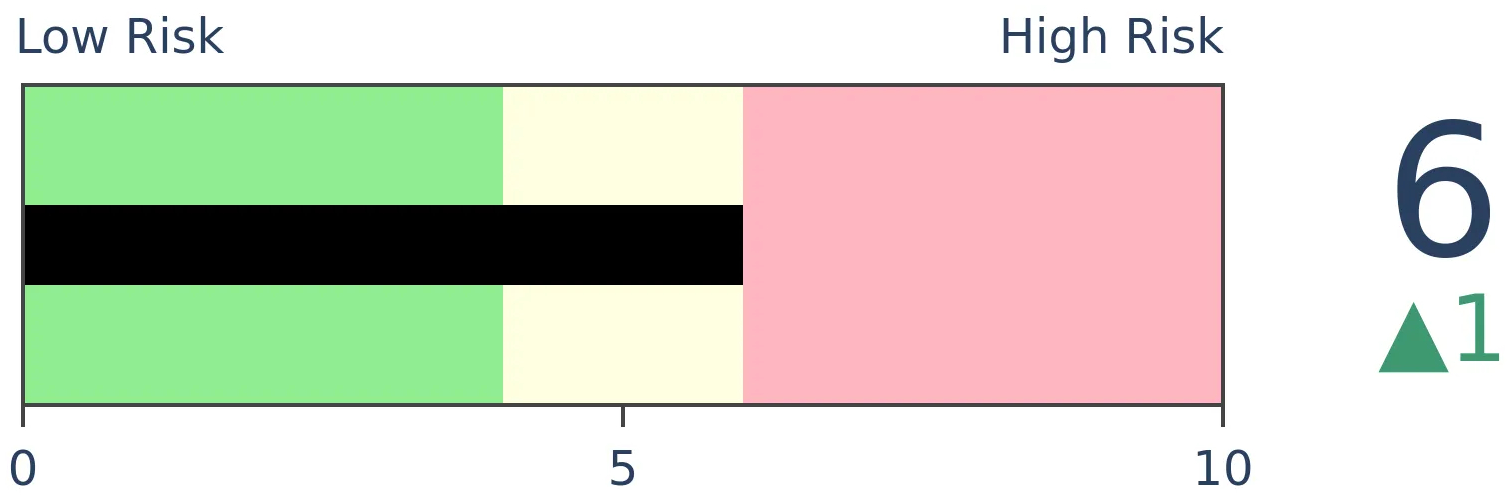
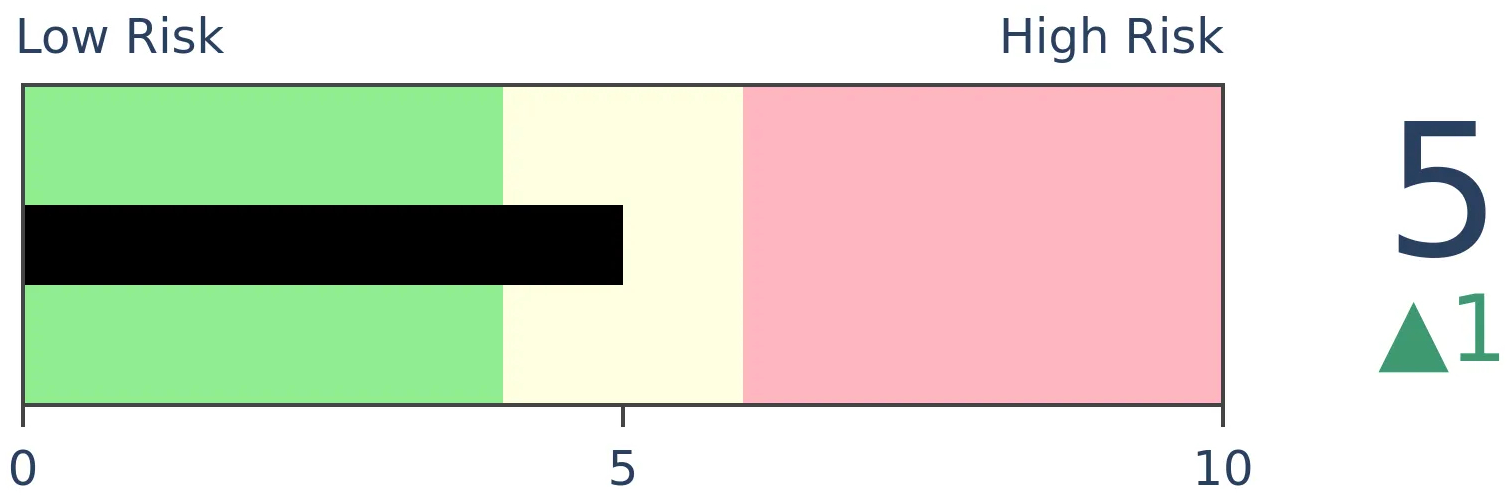
Stocks Short-Term
|
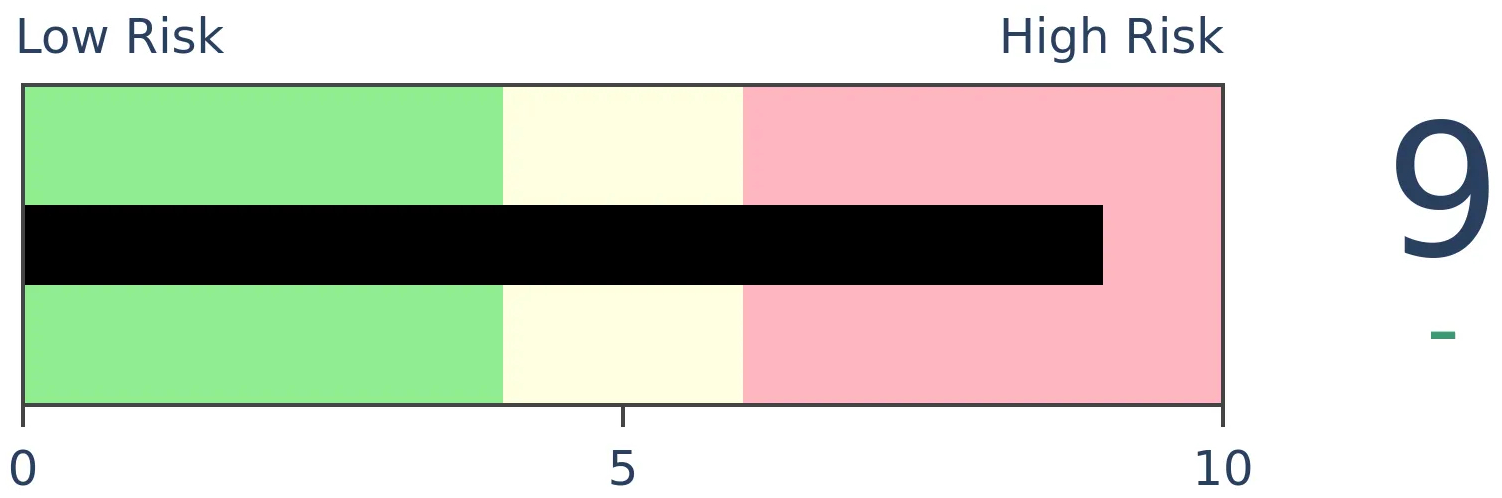
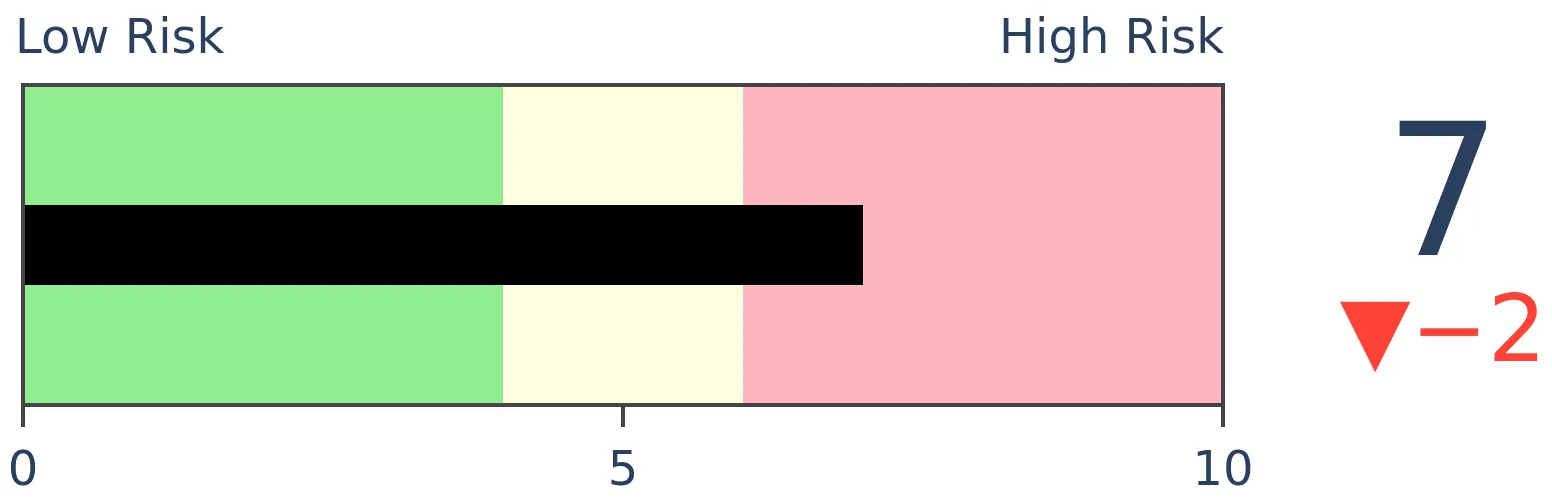
Stocks Medium-Term
|
|
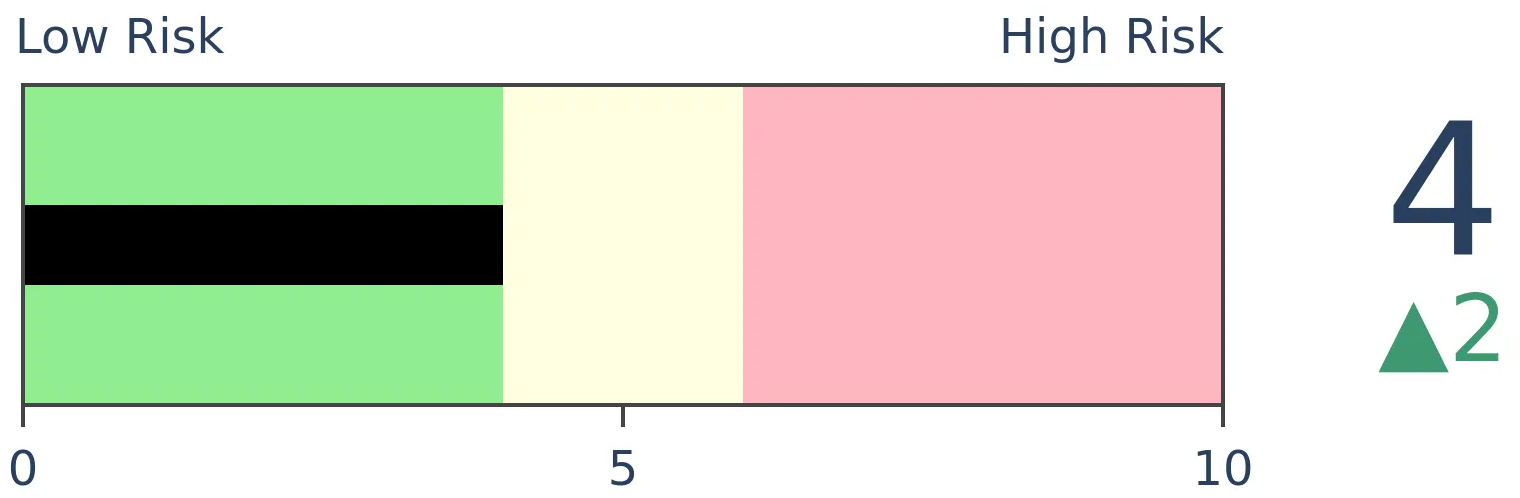
Bonds
|
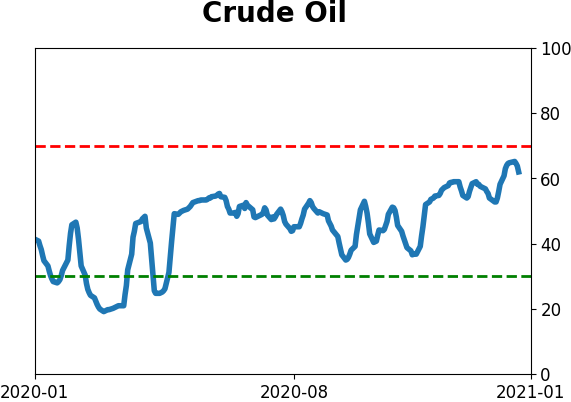
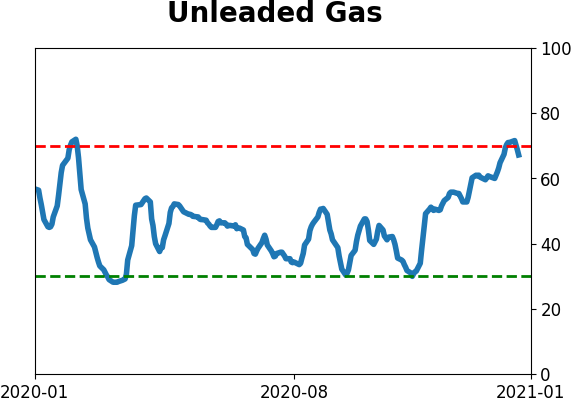
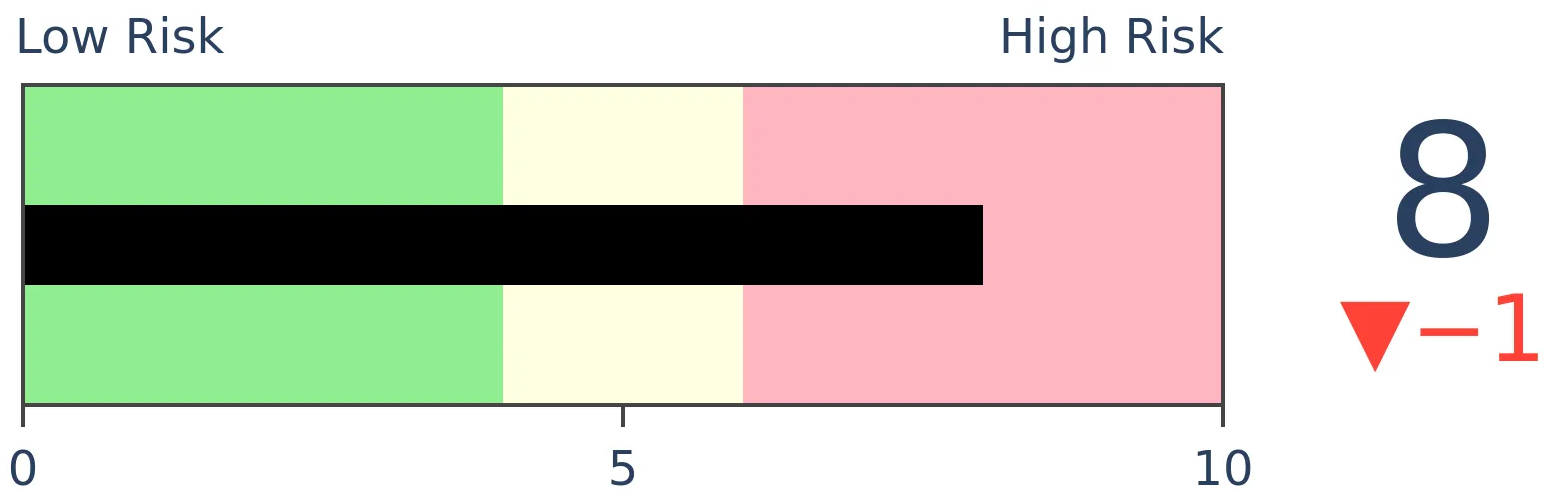
Crude Oil
|
|
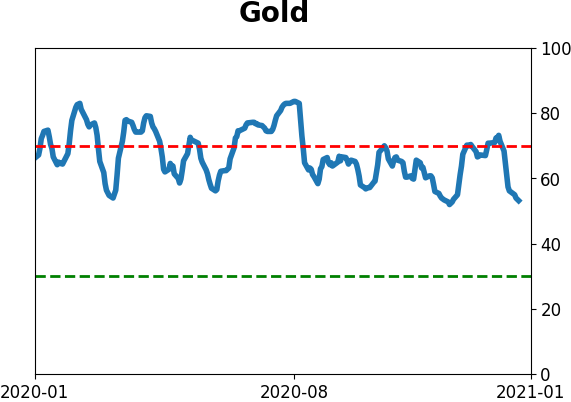
Gold
|
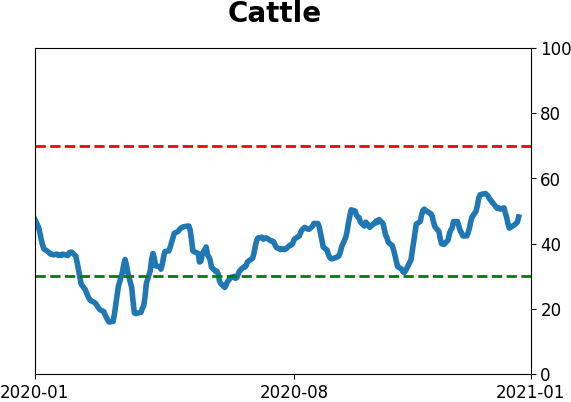
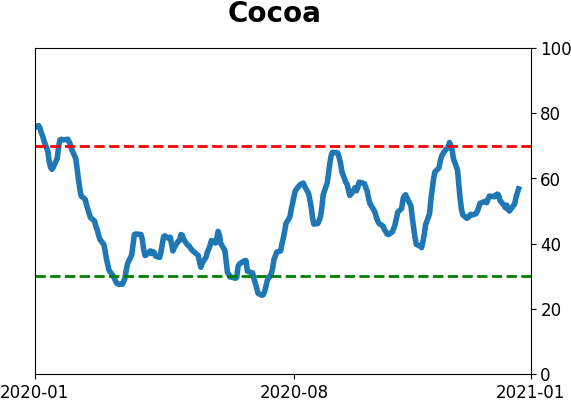
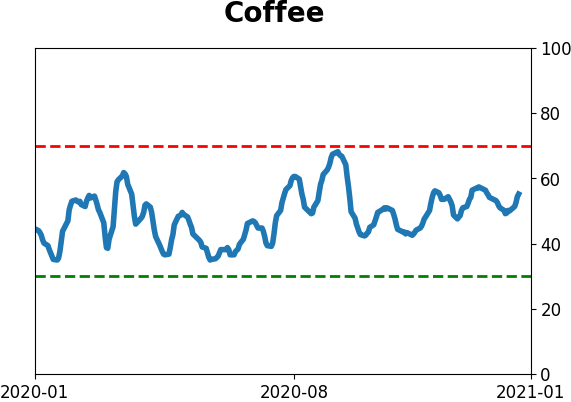
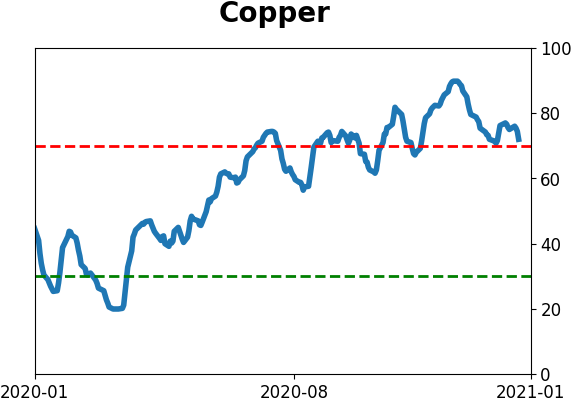
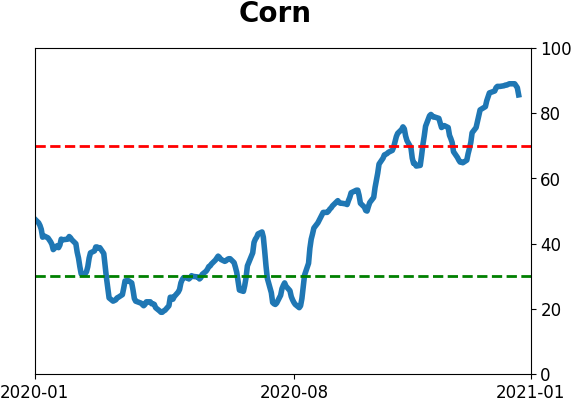
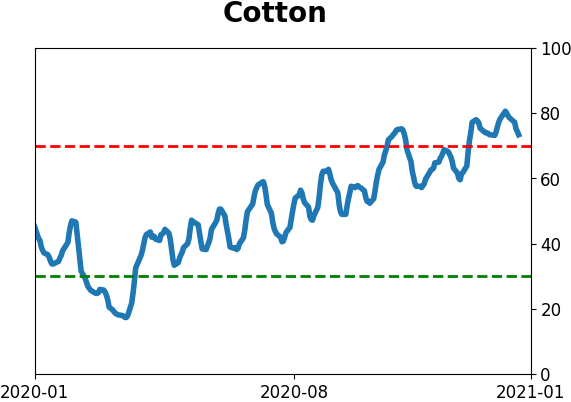
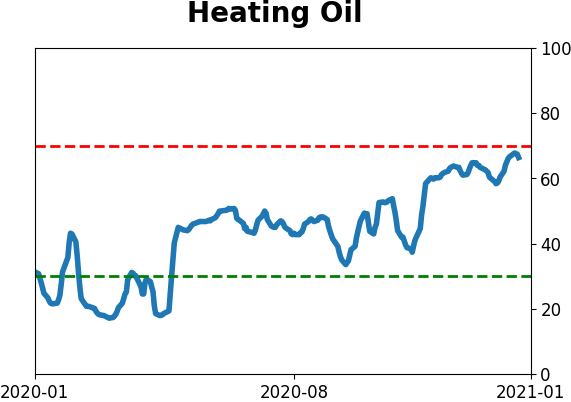
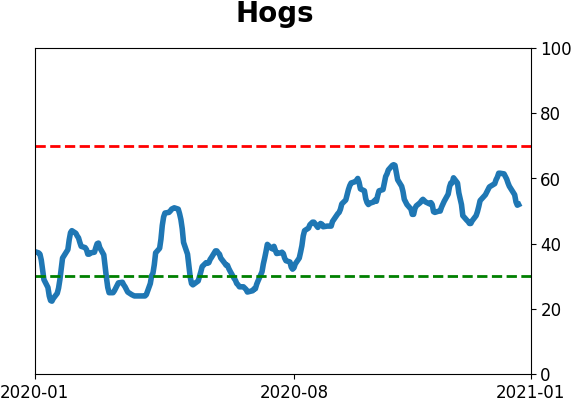
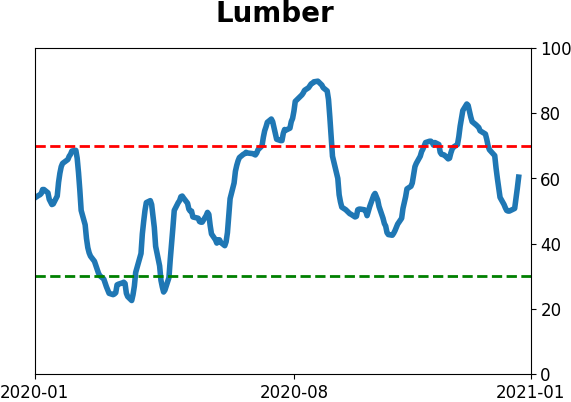
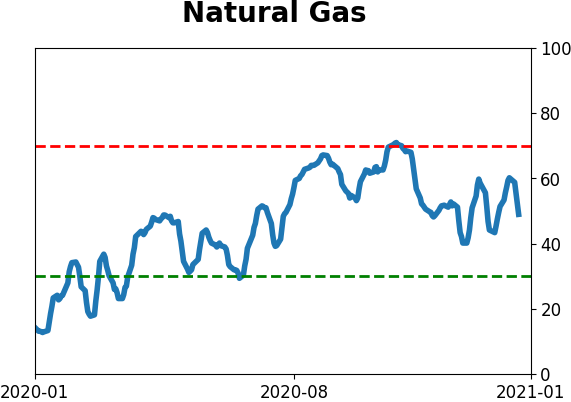
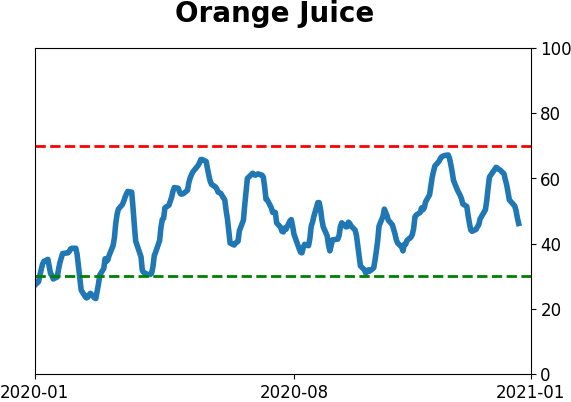
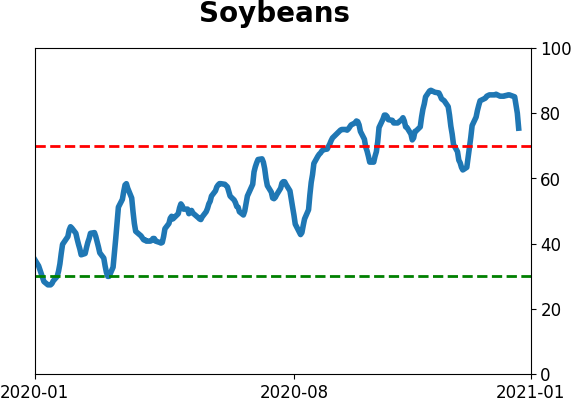
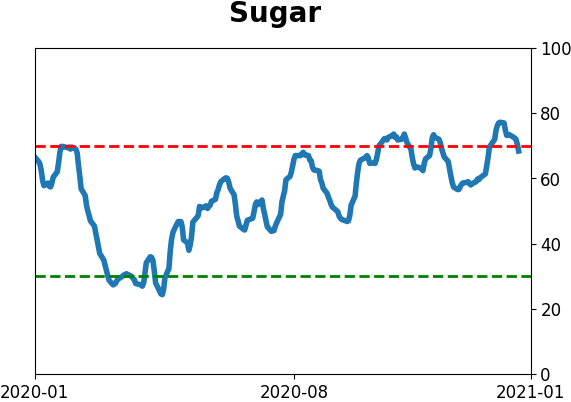
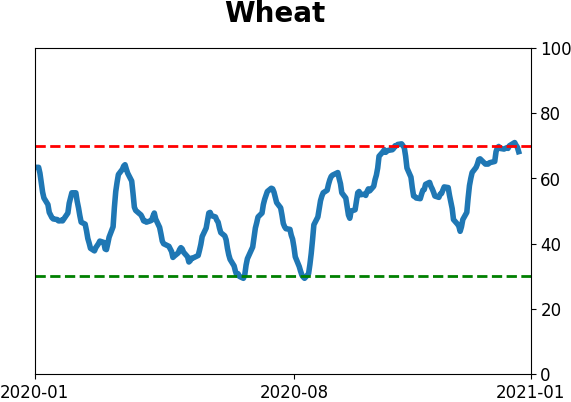
Agriculture
|
|
Research
BOTTOM LINE
Over the past year, U.S. companies have issued almost $400 billion in shares through IPOs or additional offerings. As a percentage of the market, it's not setting records, and it has a spotty record of being a warning sign of excess.
FORECAST / TIMEFRAME
None
|
Among the most opportunistic groups on Wall Street are investment bankers. If they see an appetite for something, they will work tirelessly to fulfill it. They've been busy over the past year, and there's no letup so far.
As the Wall Street Journal notes:
"There's a tremendous appetite for equity, both U.S. and now increasingly international," said Jerry Braakman, chief investment officer at First American Trust. "When you have such investor demand for equities and continued cash flow into the market, it's a great time to issue—initial offerings as well as obviously secondary and follow-up offerings."
We noted the rise in IPOs, and their performance, in December. We've neared or exceeded the prior bubble peak in most metrics that count. As the Journal notes, it's not just IPOs, but additional offerings like secondaries that are enjoying open arms among investors.
Over the past year, there has been nearly $400 billion in issuance according to Bloomberg data.
Markets have grown - a lot - so as a percentage of the total market capitalization of U.S. stocks, this issuance is not nearly as extreme.
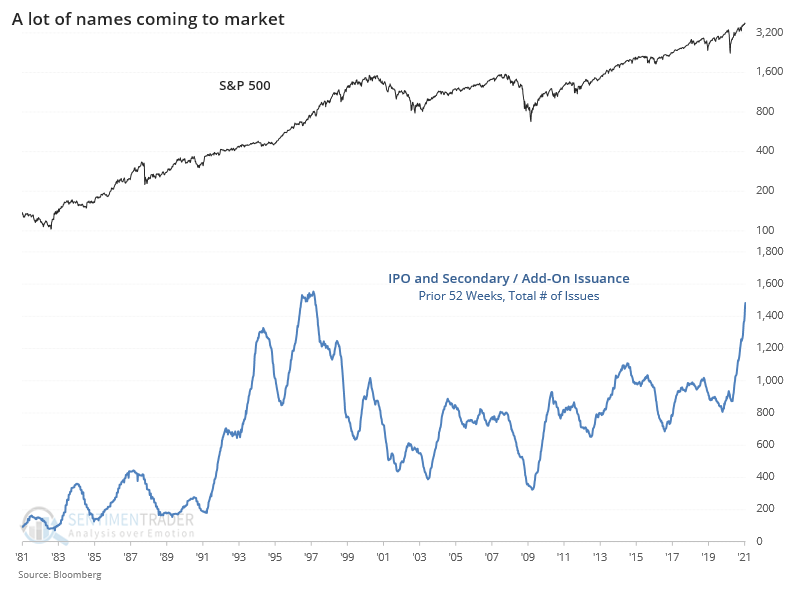
It hasn't just been a few mega stocks issuing shares that caused the rise in issuance; the number of issues has also skyrocketed.
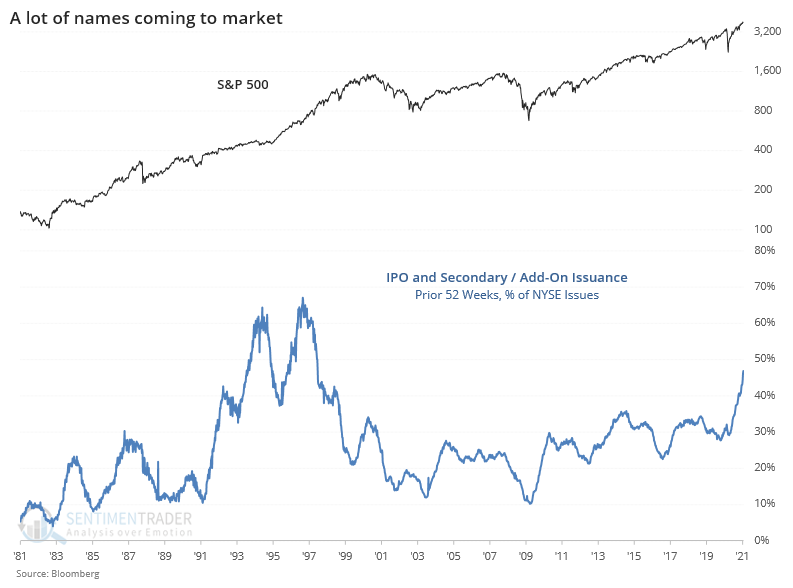
As a percentage of total issues, it's less extreme but still up there.
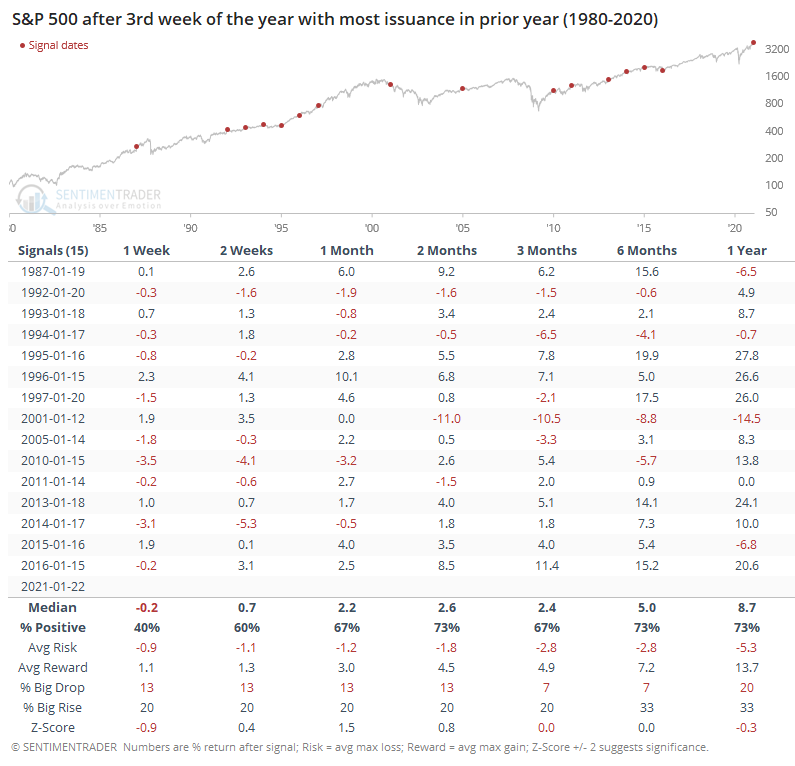
Looking at comparable times of the year with the most combined issuance (dollars and number of issues), forward returns were about in line with random. The jump in supply didn't seem to be a major limiting factor. The S&P 500 didn't go gangbusters to the upside in the months following most of these signals, but neither did it tend to collapse from the overhang of supply.
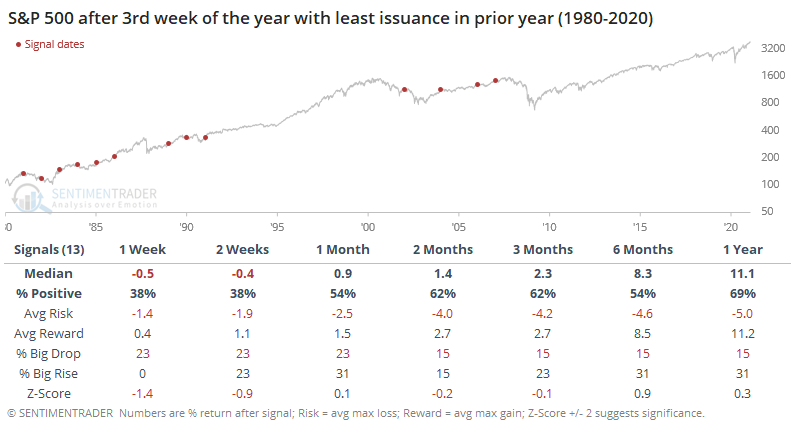
Following years with the lowest issuance, returns were worse shorter-term but a bit better longer-term, if less consistent.
There are a whole host of things we should be worried about right now, including record valuations and poor seasonality coupled with a historic bout of speculation. In recent days, there have also been a few cracks in what had been the steel-plated armor of this market - broad-based and thrusty participation among stocks and high-yield bonds. We're not yet seeing consistent sell signals in those metrics, but if we continue to see signs of deterioration, it will be time to become fully defensive. We just shouldn't use the jump in issuance as a potential crutch for sell orders.
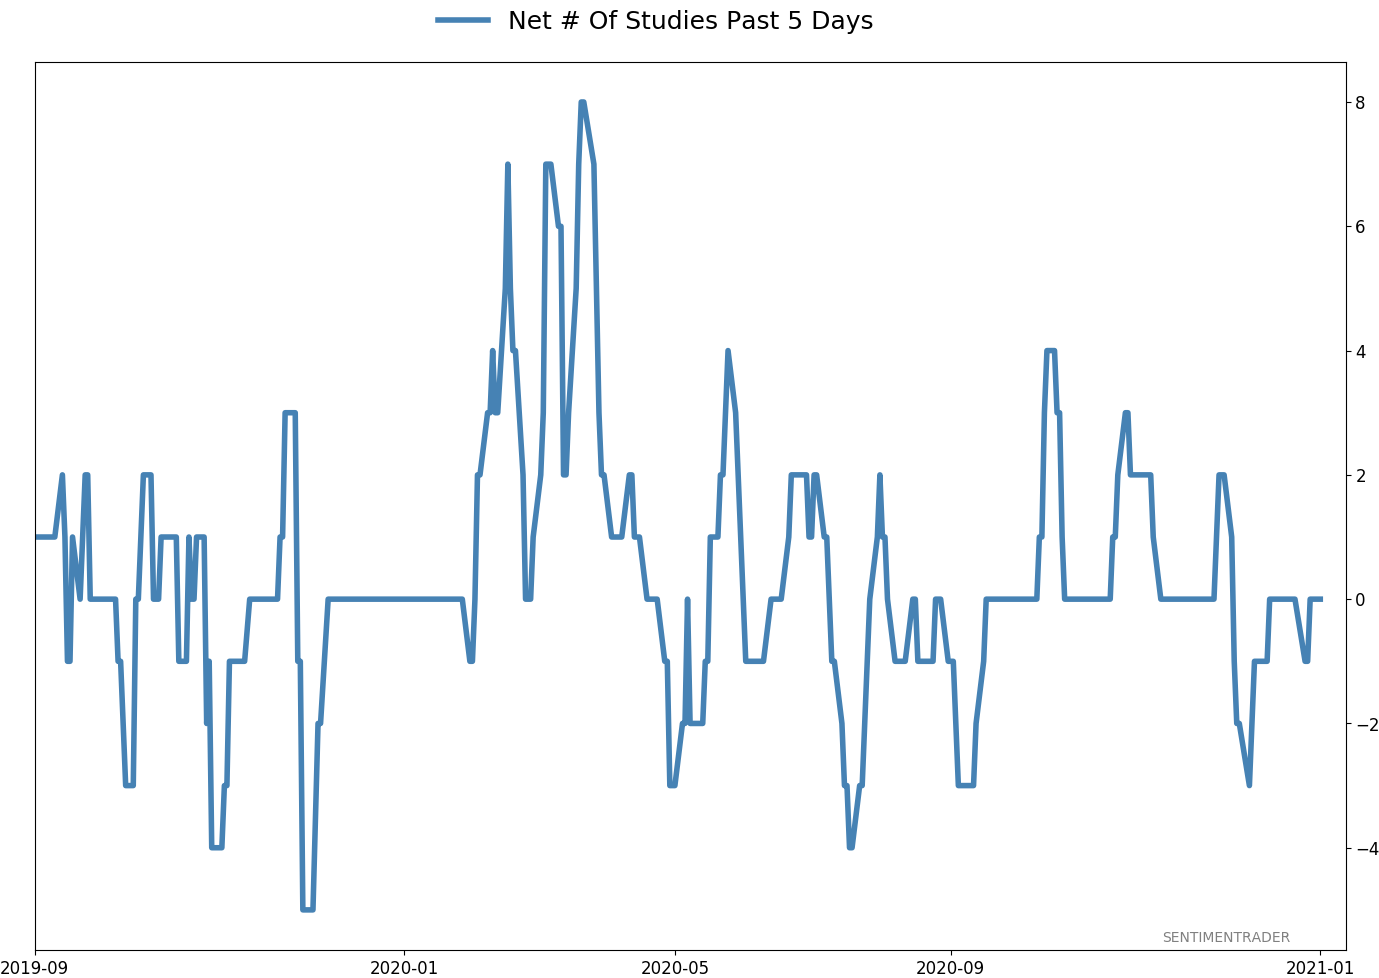
Active Studies
| Time Frame | Bullish | Bearish | | Short-Term | 0 | 0 | | Medium-Term | 2 | 2 | | Long-Term | 15 | 2 |
|
Indicators at Extremes
Portfolio
| Position | Description | Weight % | Added / Reduced | Date | | Stocks | 10.6% VWO, 10.1% XLE, 8.5% RSP, 8.3% PSCE | 37.5 | Added 3% | 2021-01-05 | | Bonds | 10% BND, 10% SCHP, 10% ANGL | 27.8 | Reduced 0.1% | 2020-10-02 | | Commodities | GCC | 2.3 | Reduced 2.1%
| 2020-09-04 | | Precious Metals | GDX | 9.8 | Added 4.8% | 2020-12-01 | | Special Situations | | 0.0 | Reduced 5% | 2020-10-02 | | Cash | | 22.6 | | |
|
Updates (Changes made today are underlined)
There hasn't been much that changed in recent weeks, with sky-high sentiment on many measures receding a bit, but that's not necessarily a good sign, just ask February 2020. We still have the lingering positives from all the breadth thrust last year, as late as October and November. Those have a very good historical record at preceding higher prices over a longer time frame. Of more immediate concern is the explosion in speculation in the most leveraged parts of the market. So far, that hasn't translated to price troubles, though there have been more oddities n the latter half of December than we'd seen since August, like the major indexes rising but on very poor breadth. I continue to avoid tech- and cap-heavy indexes, and don't see that changing any time soon. Energy stocks are doing what they should, and I added a bit more there. I'm not a momentum trader and do not focus on pyramiding positions in this account - it's more about protecting capital - but I like the setup on a long-term time frame. RETURN YTD: 3.5% 2020: 8.1%, 2019: 12.6%, 2018: 0.6%, 2017: 3.8%, 2016: 17.1%, 2015: 9.2%, 2014: 14.5%, 2013: 2.2%, 2012: 10.8%, 2011: 16.5%, 2010: 15.3%, 2009: 23.9%, 2008: 16.2%, 2007: 7.8%
|
|
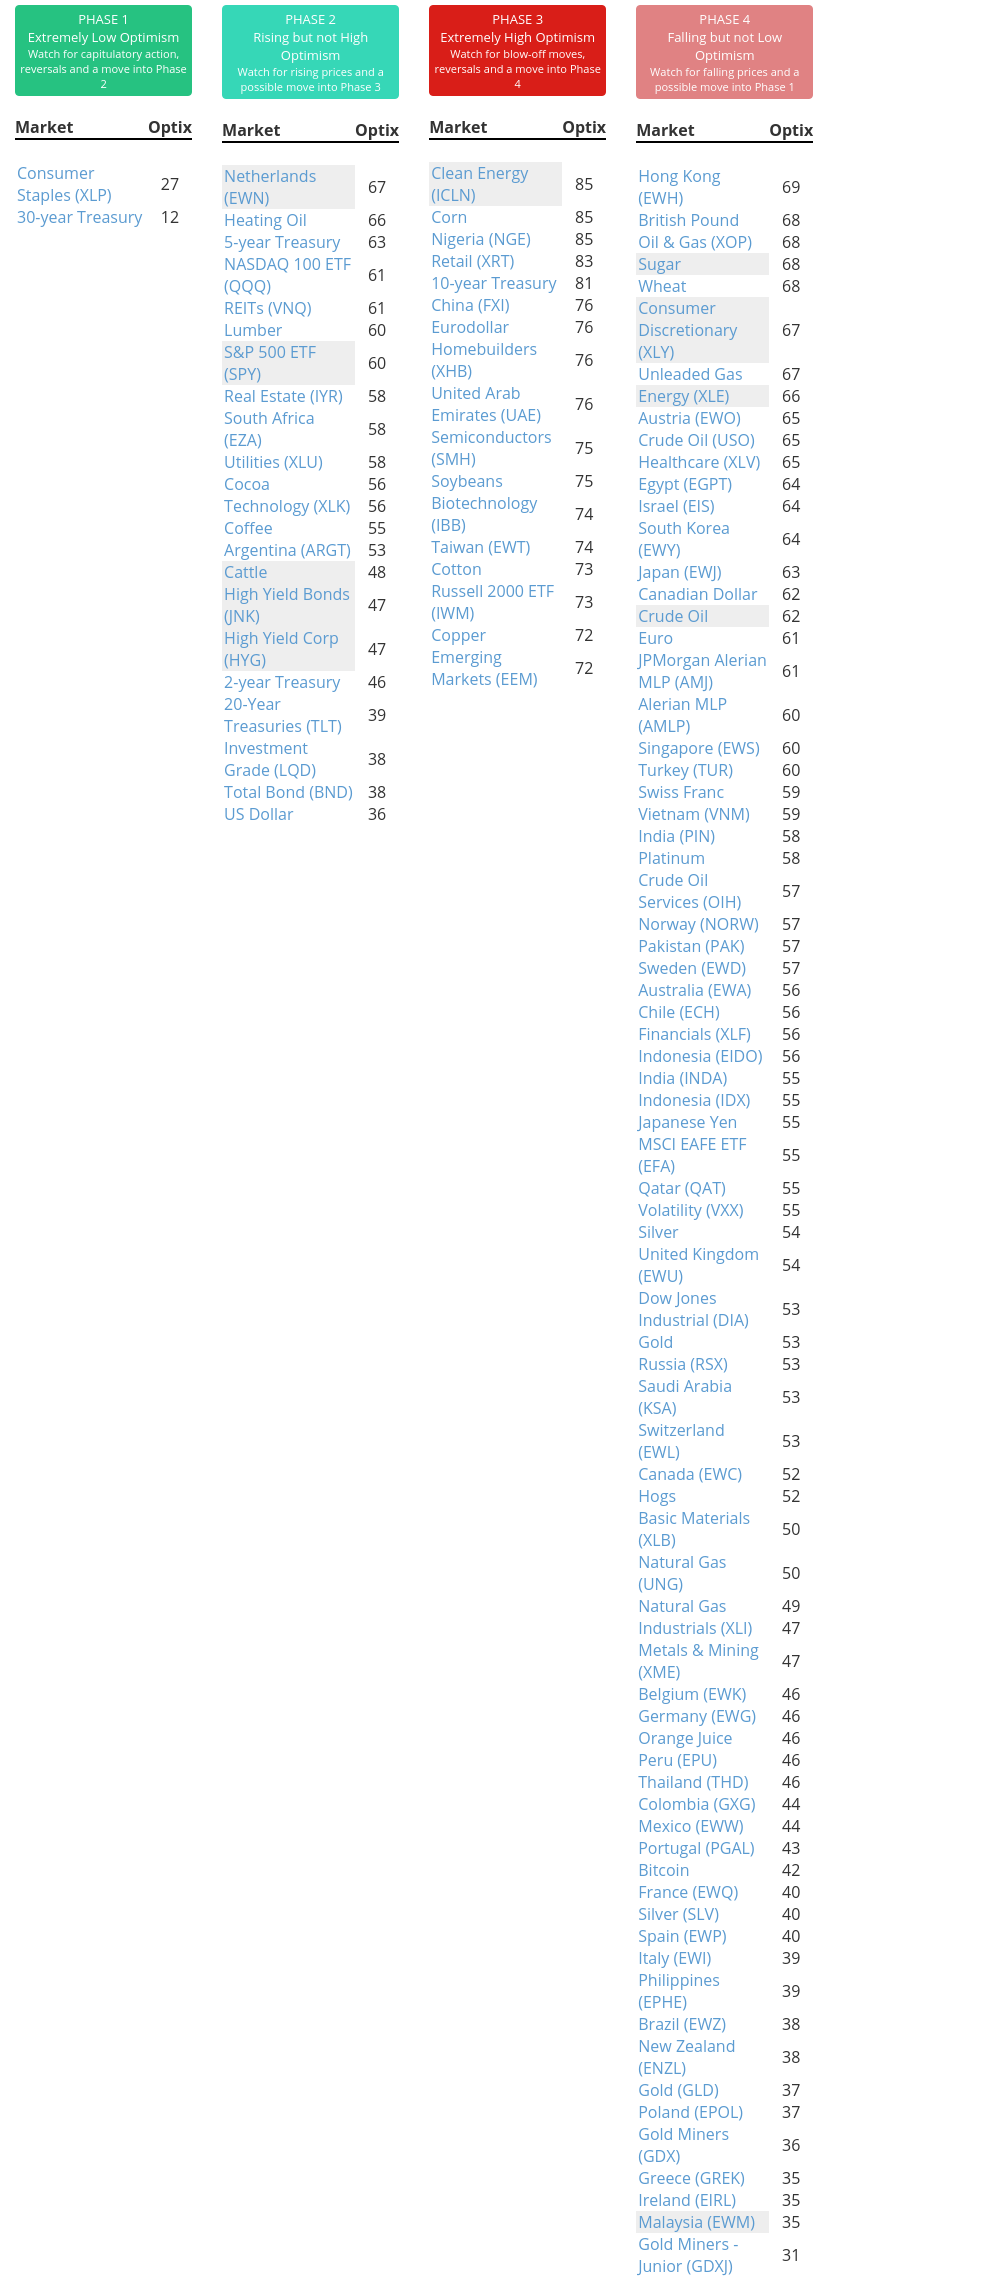
Phase Table
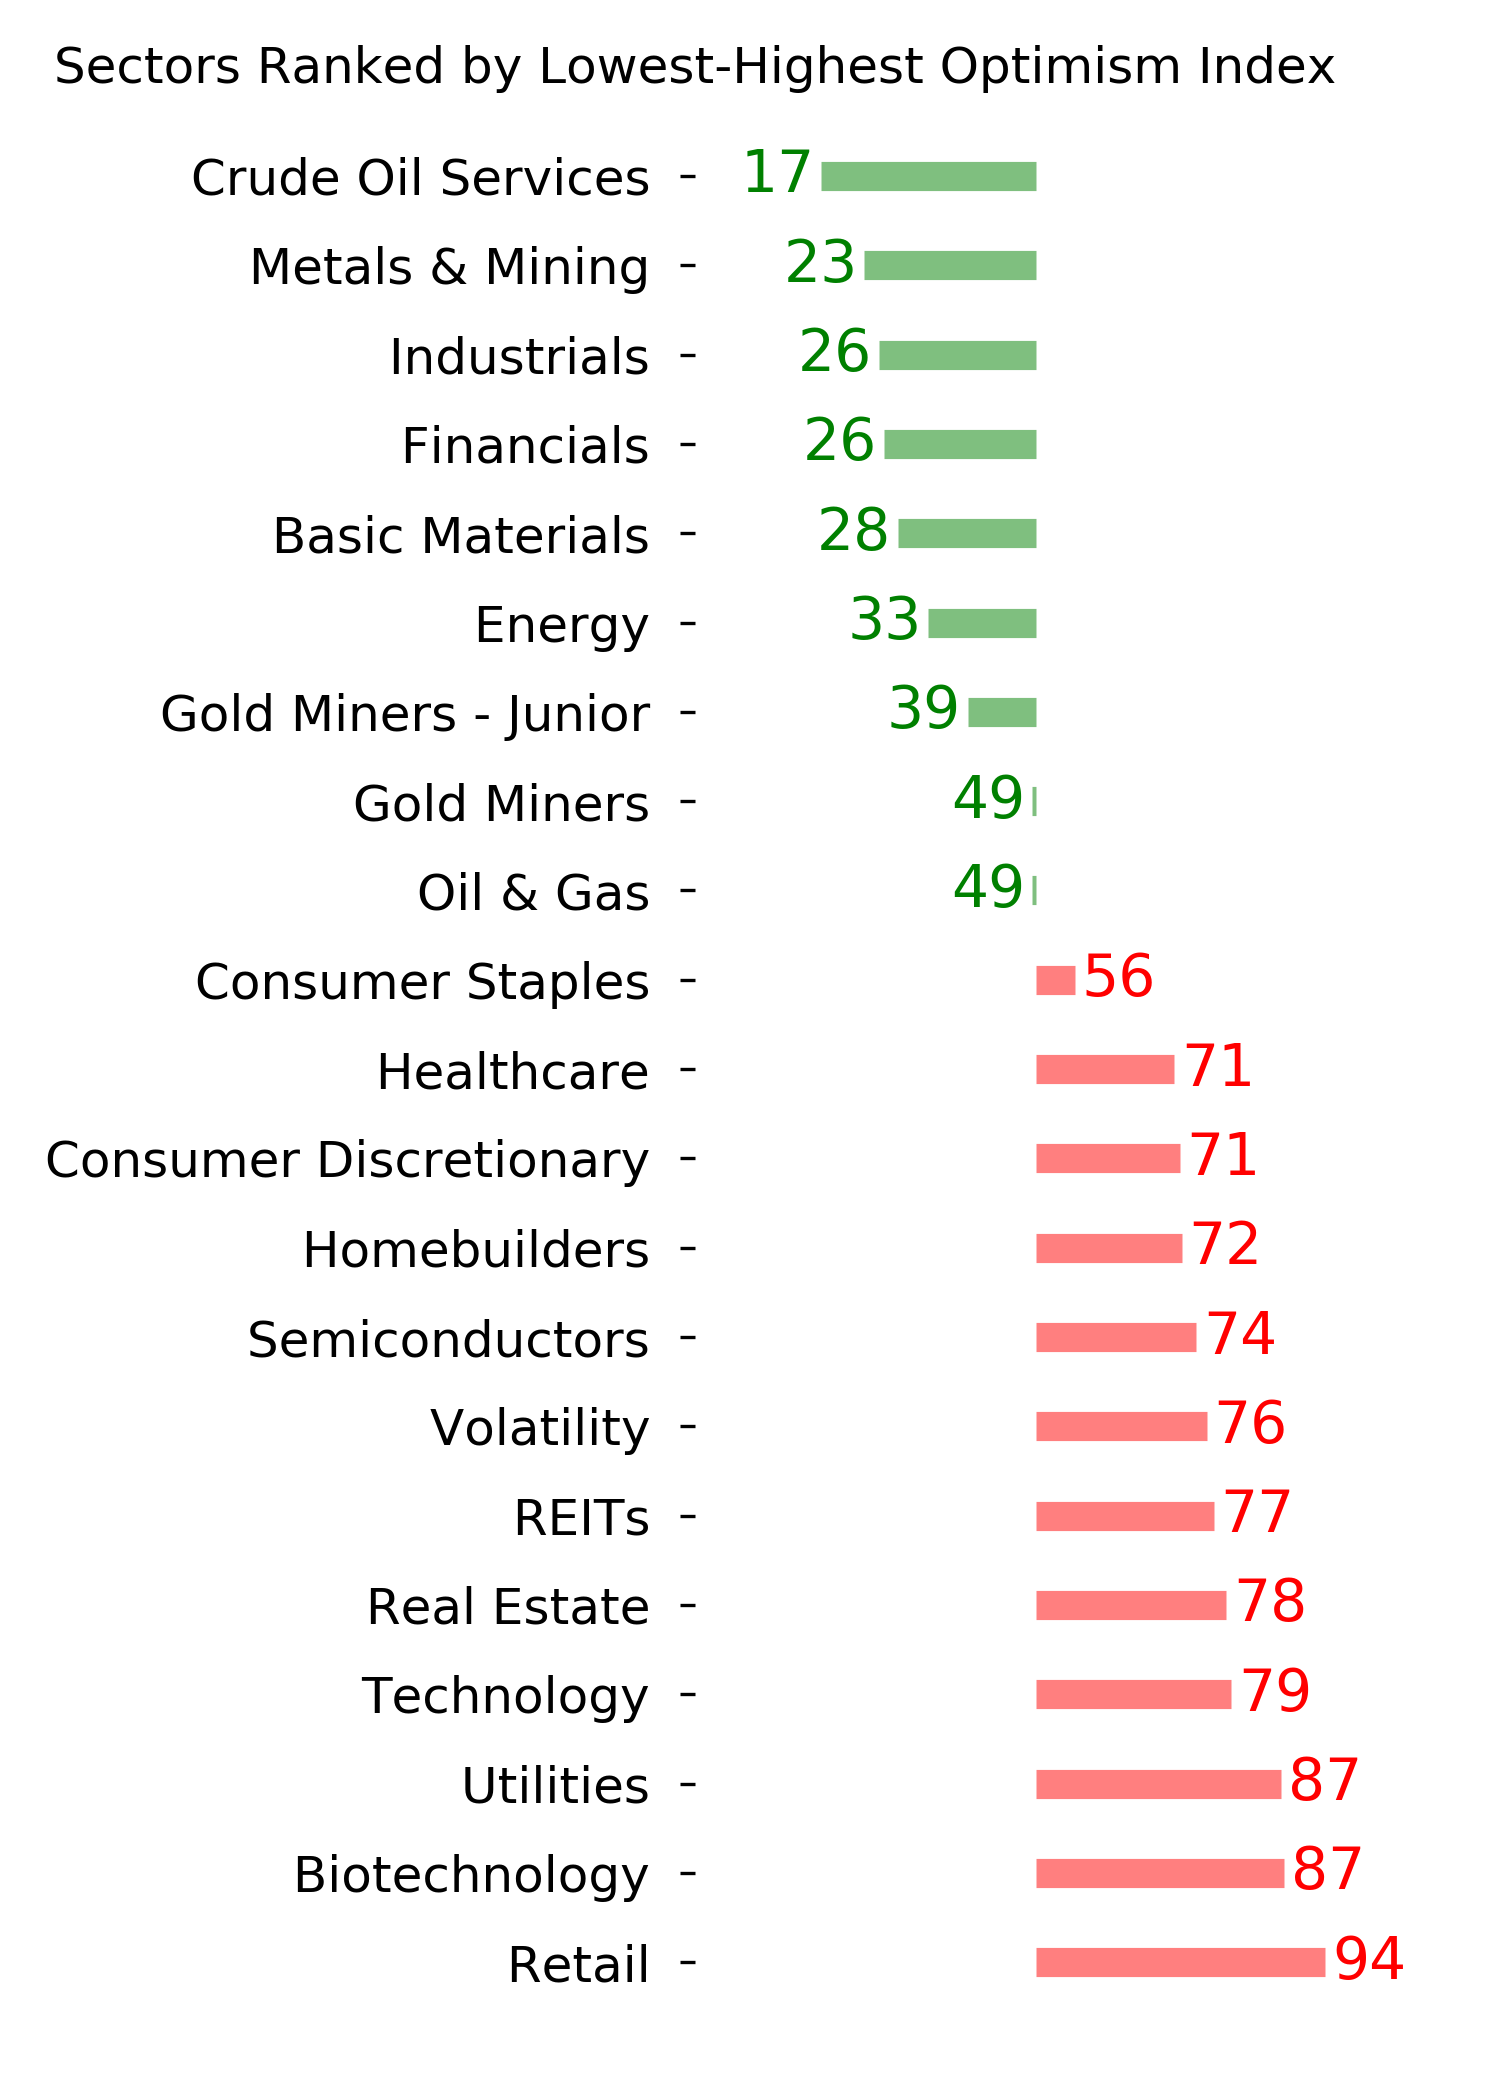
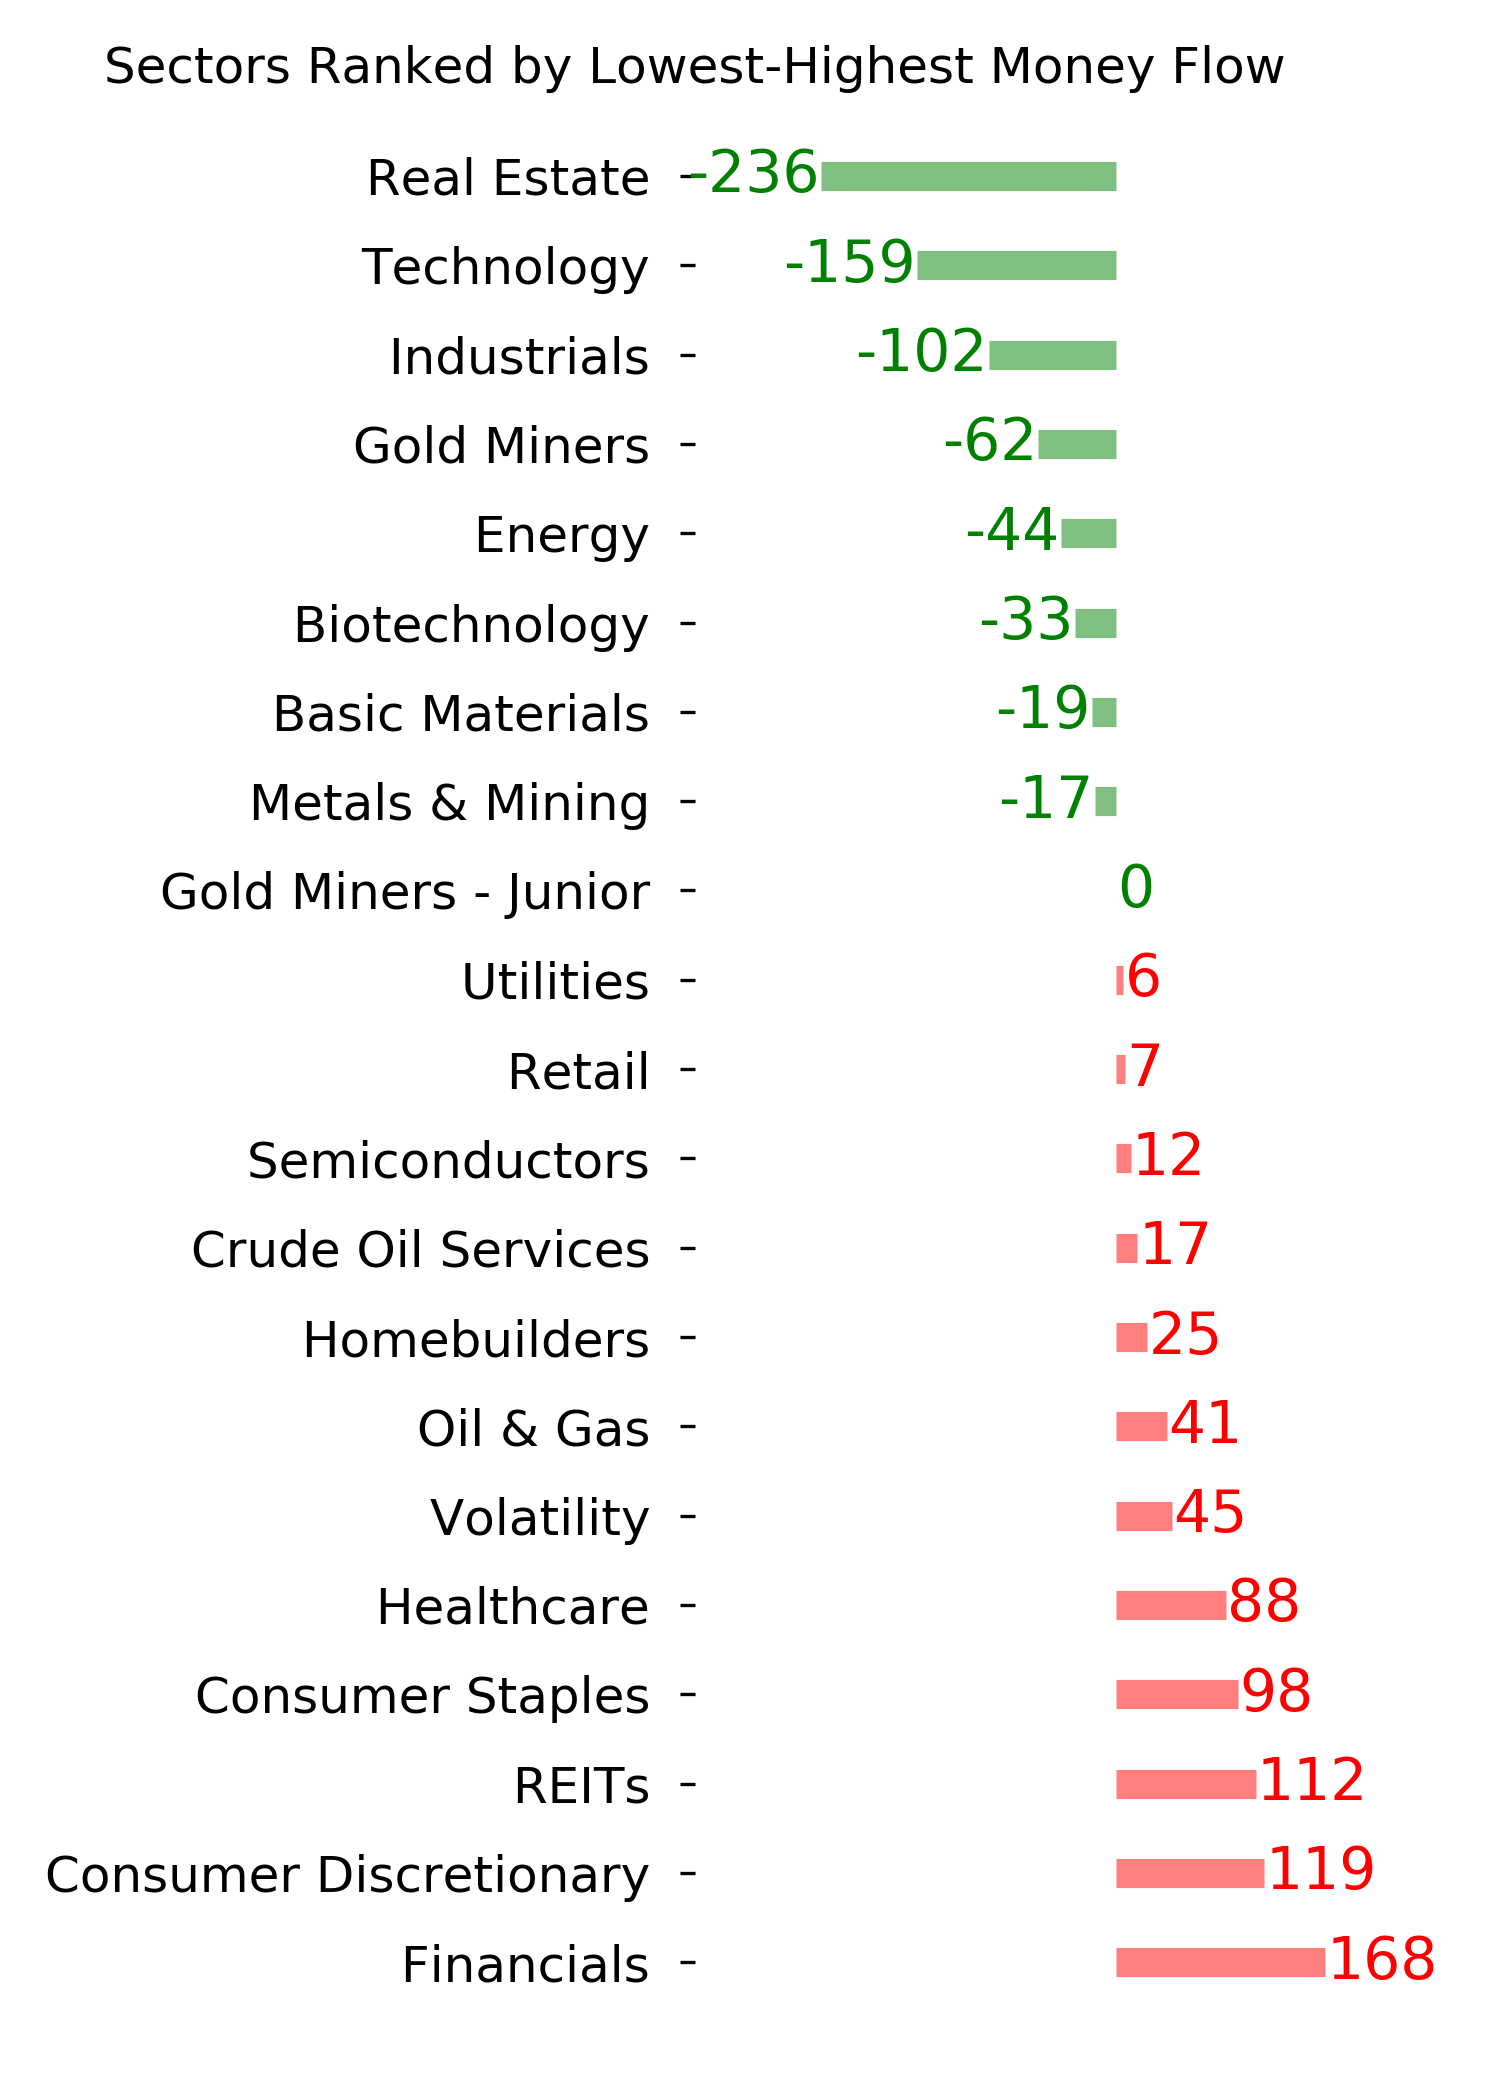
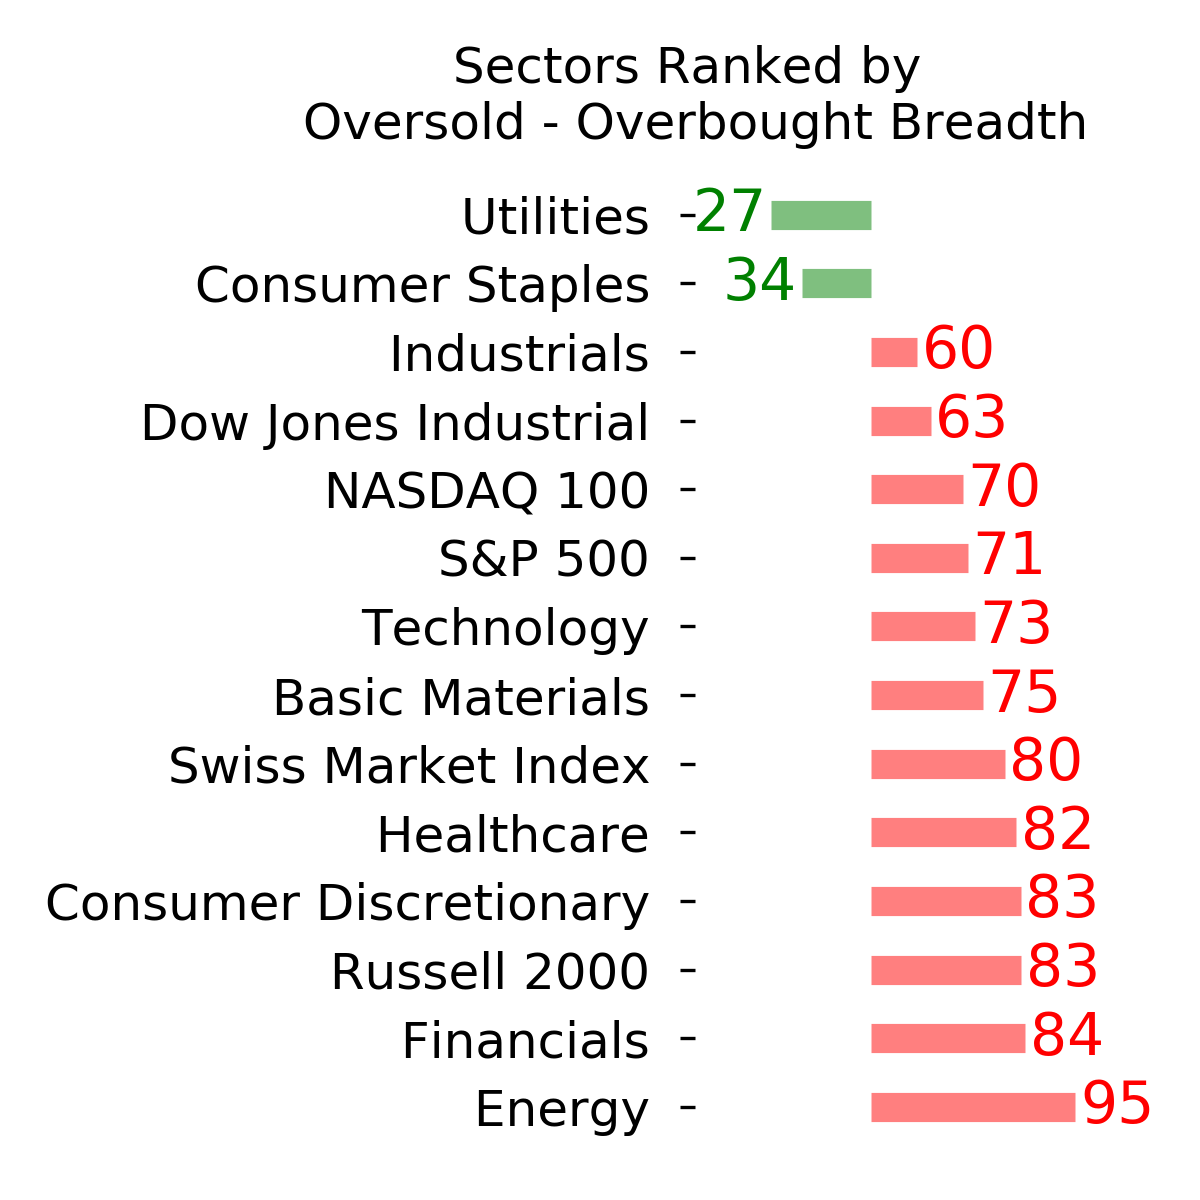
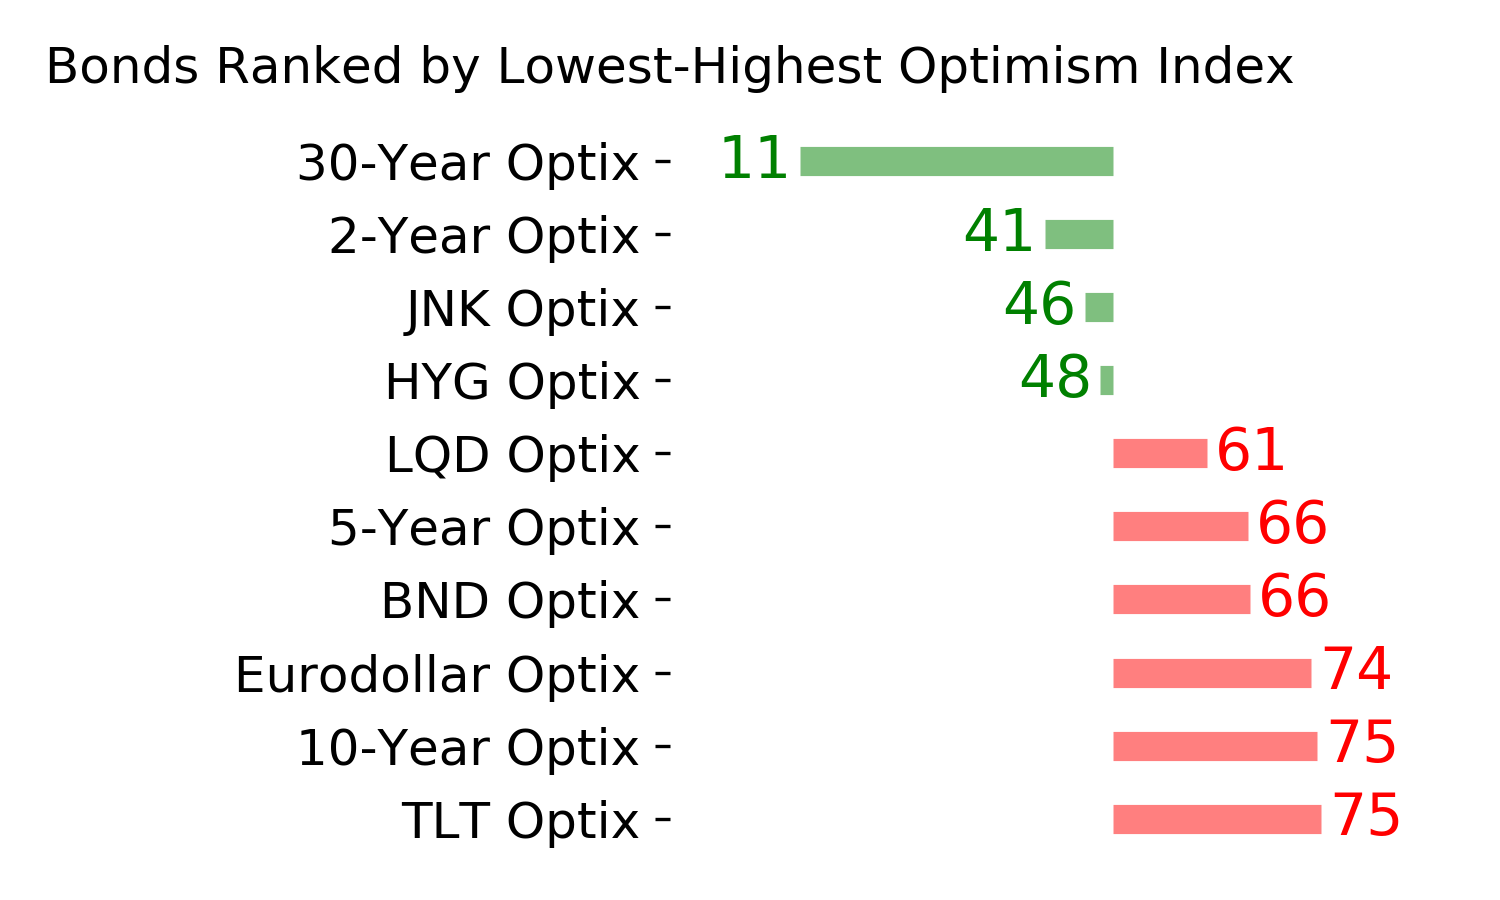
Ranks
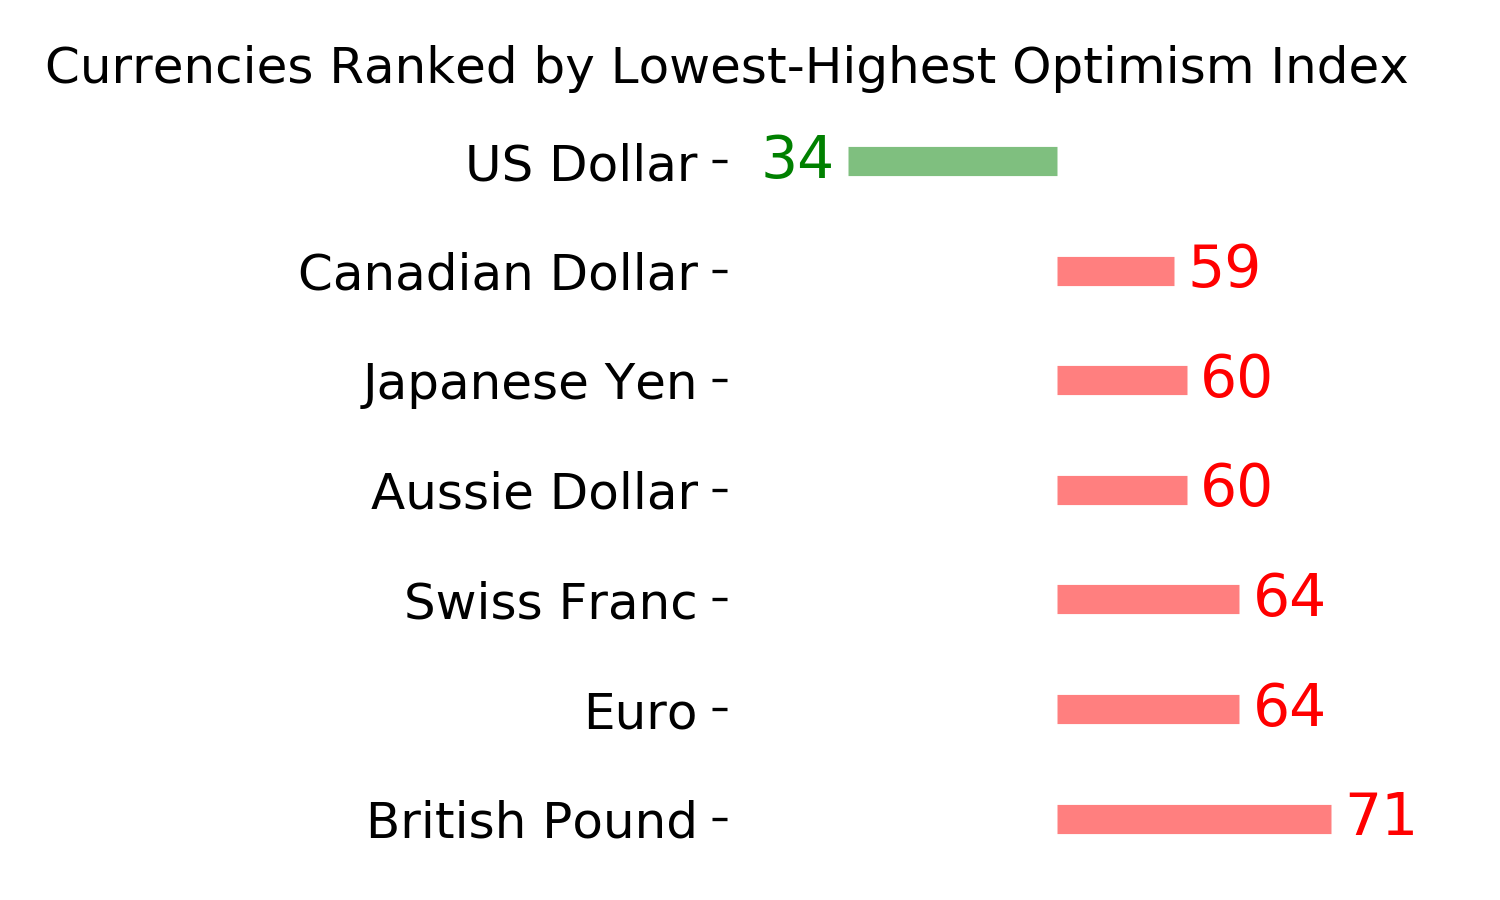
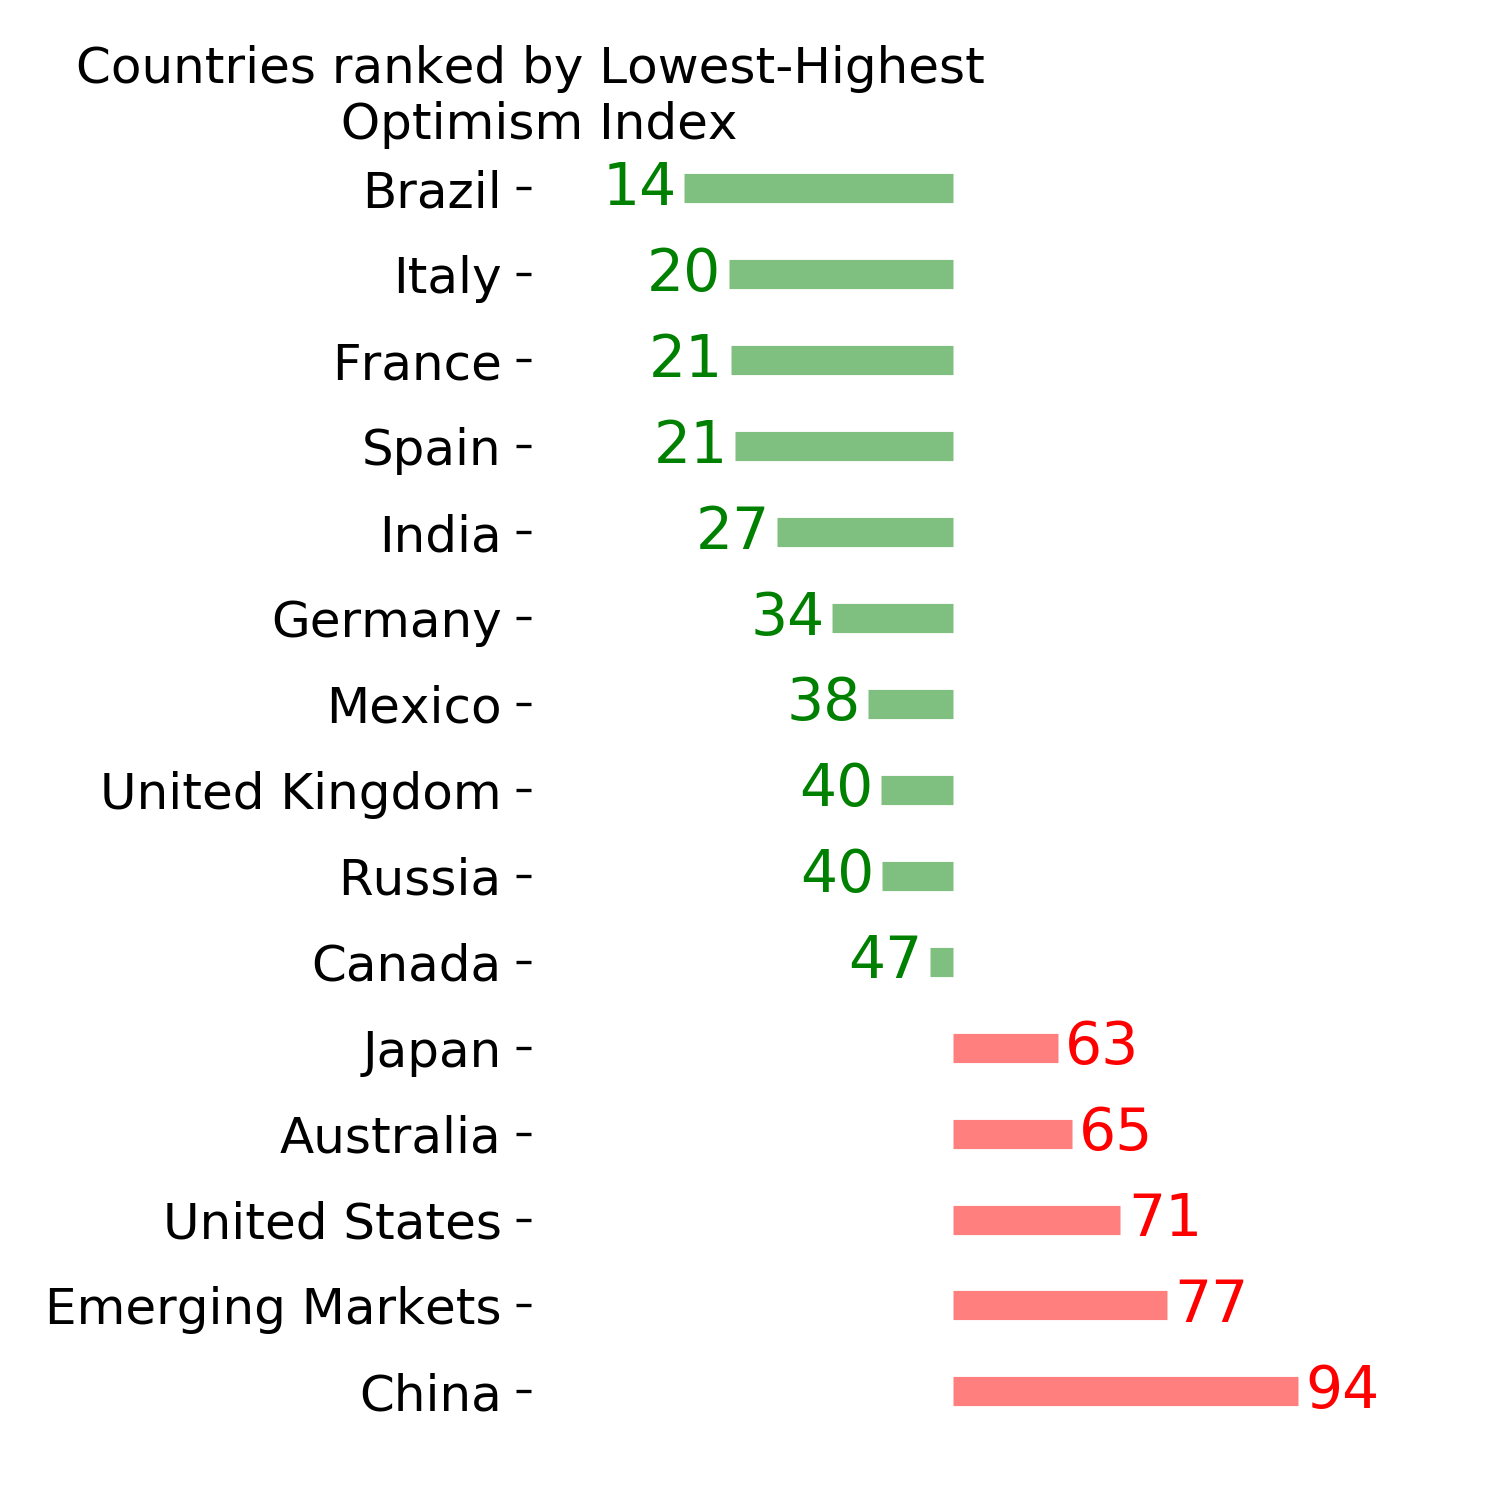
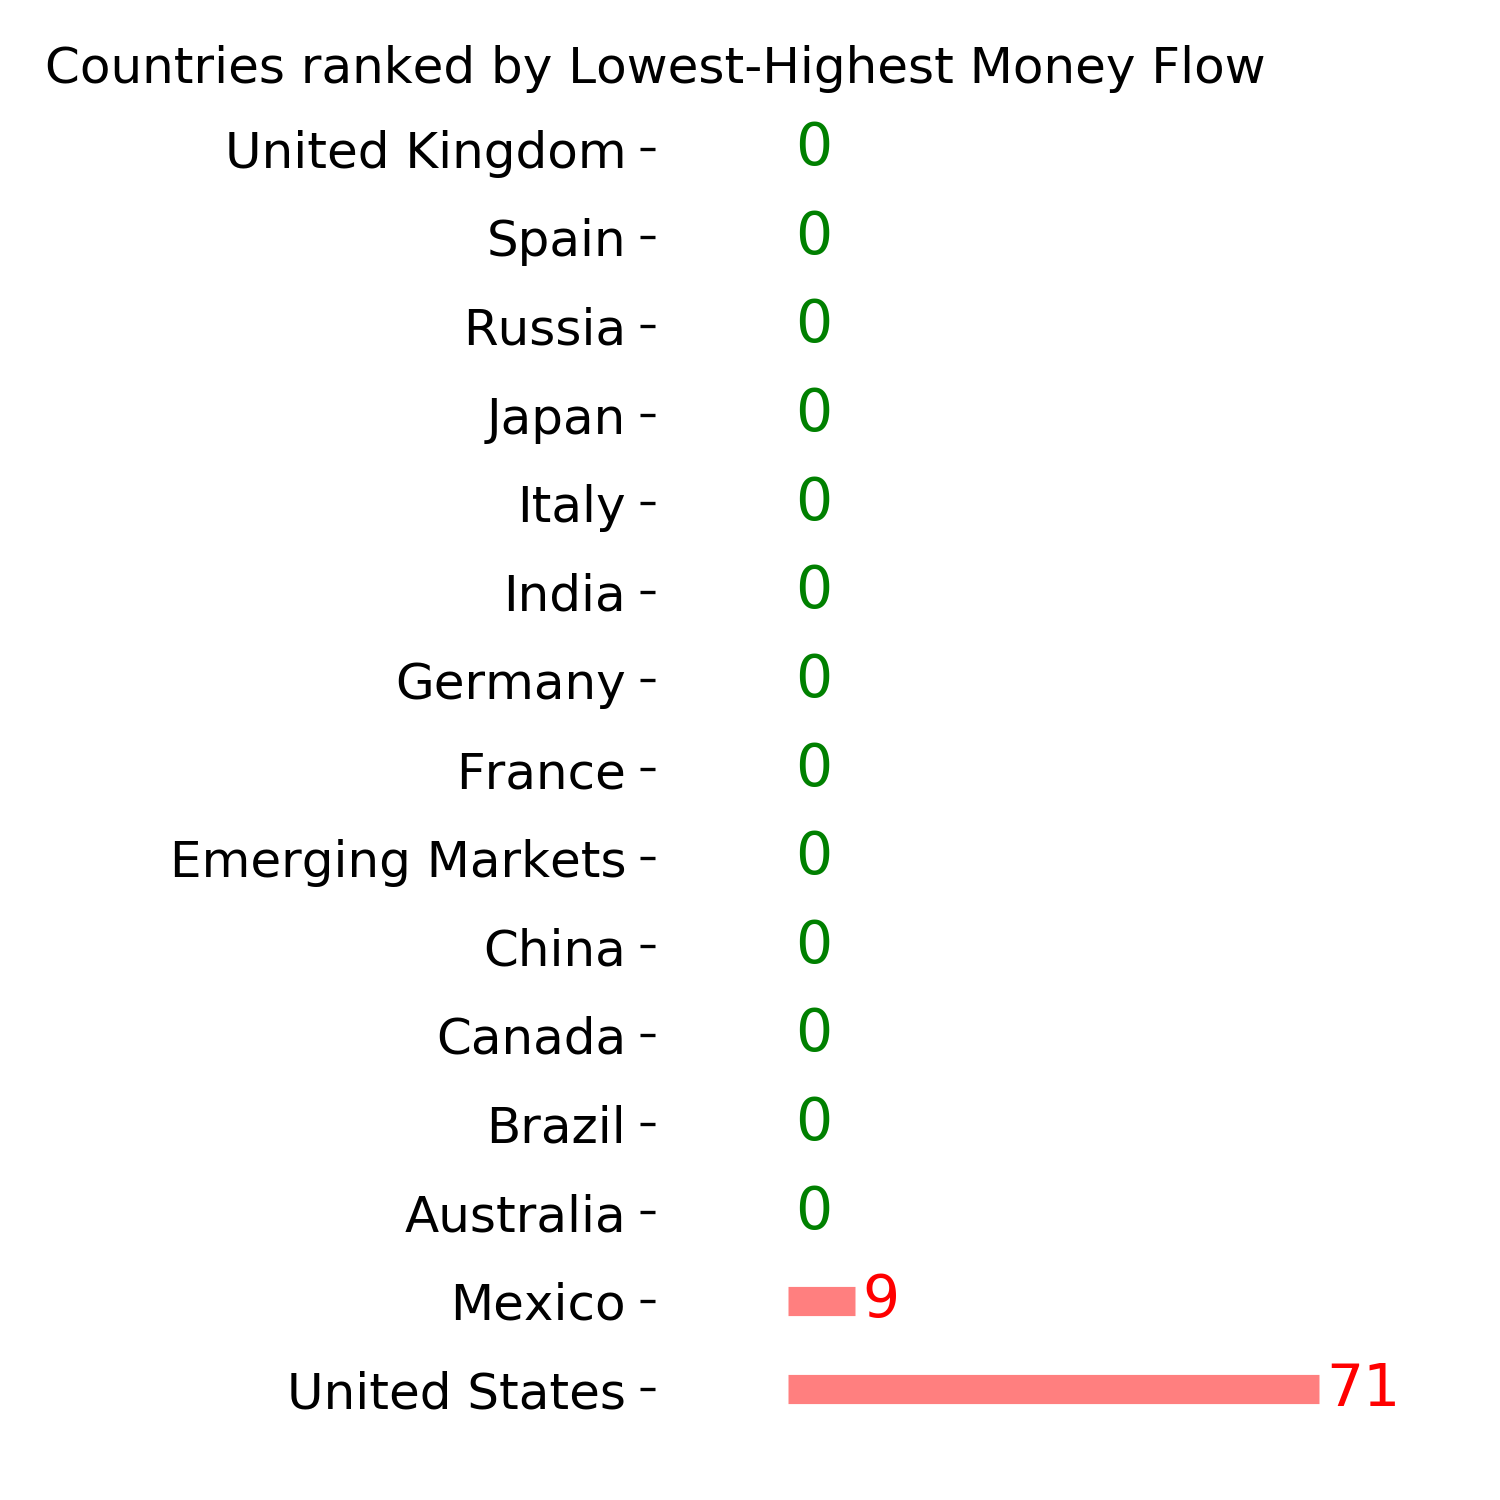
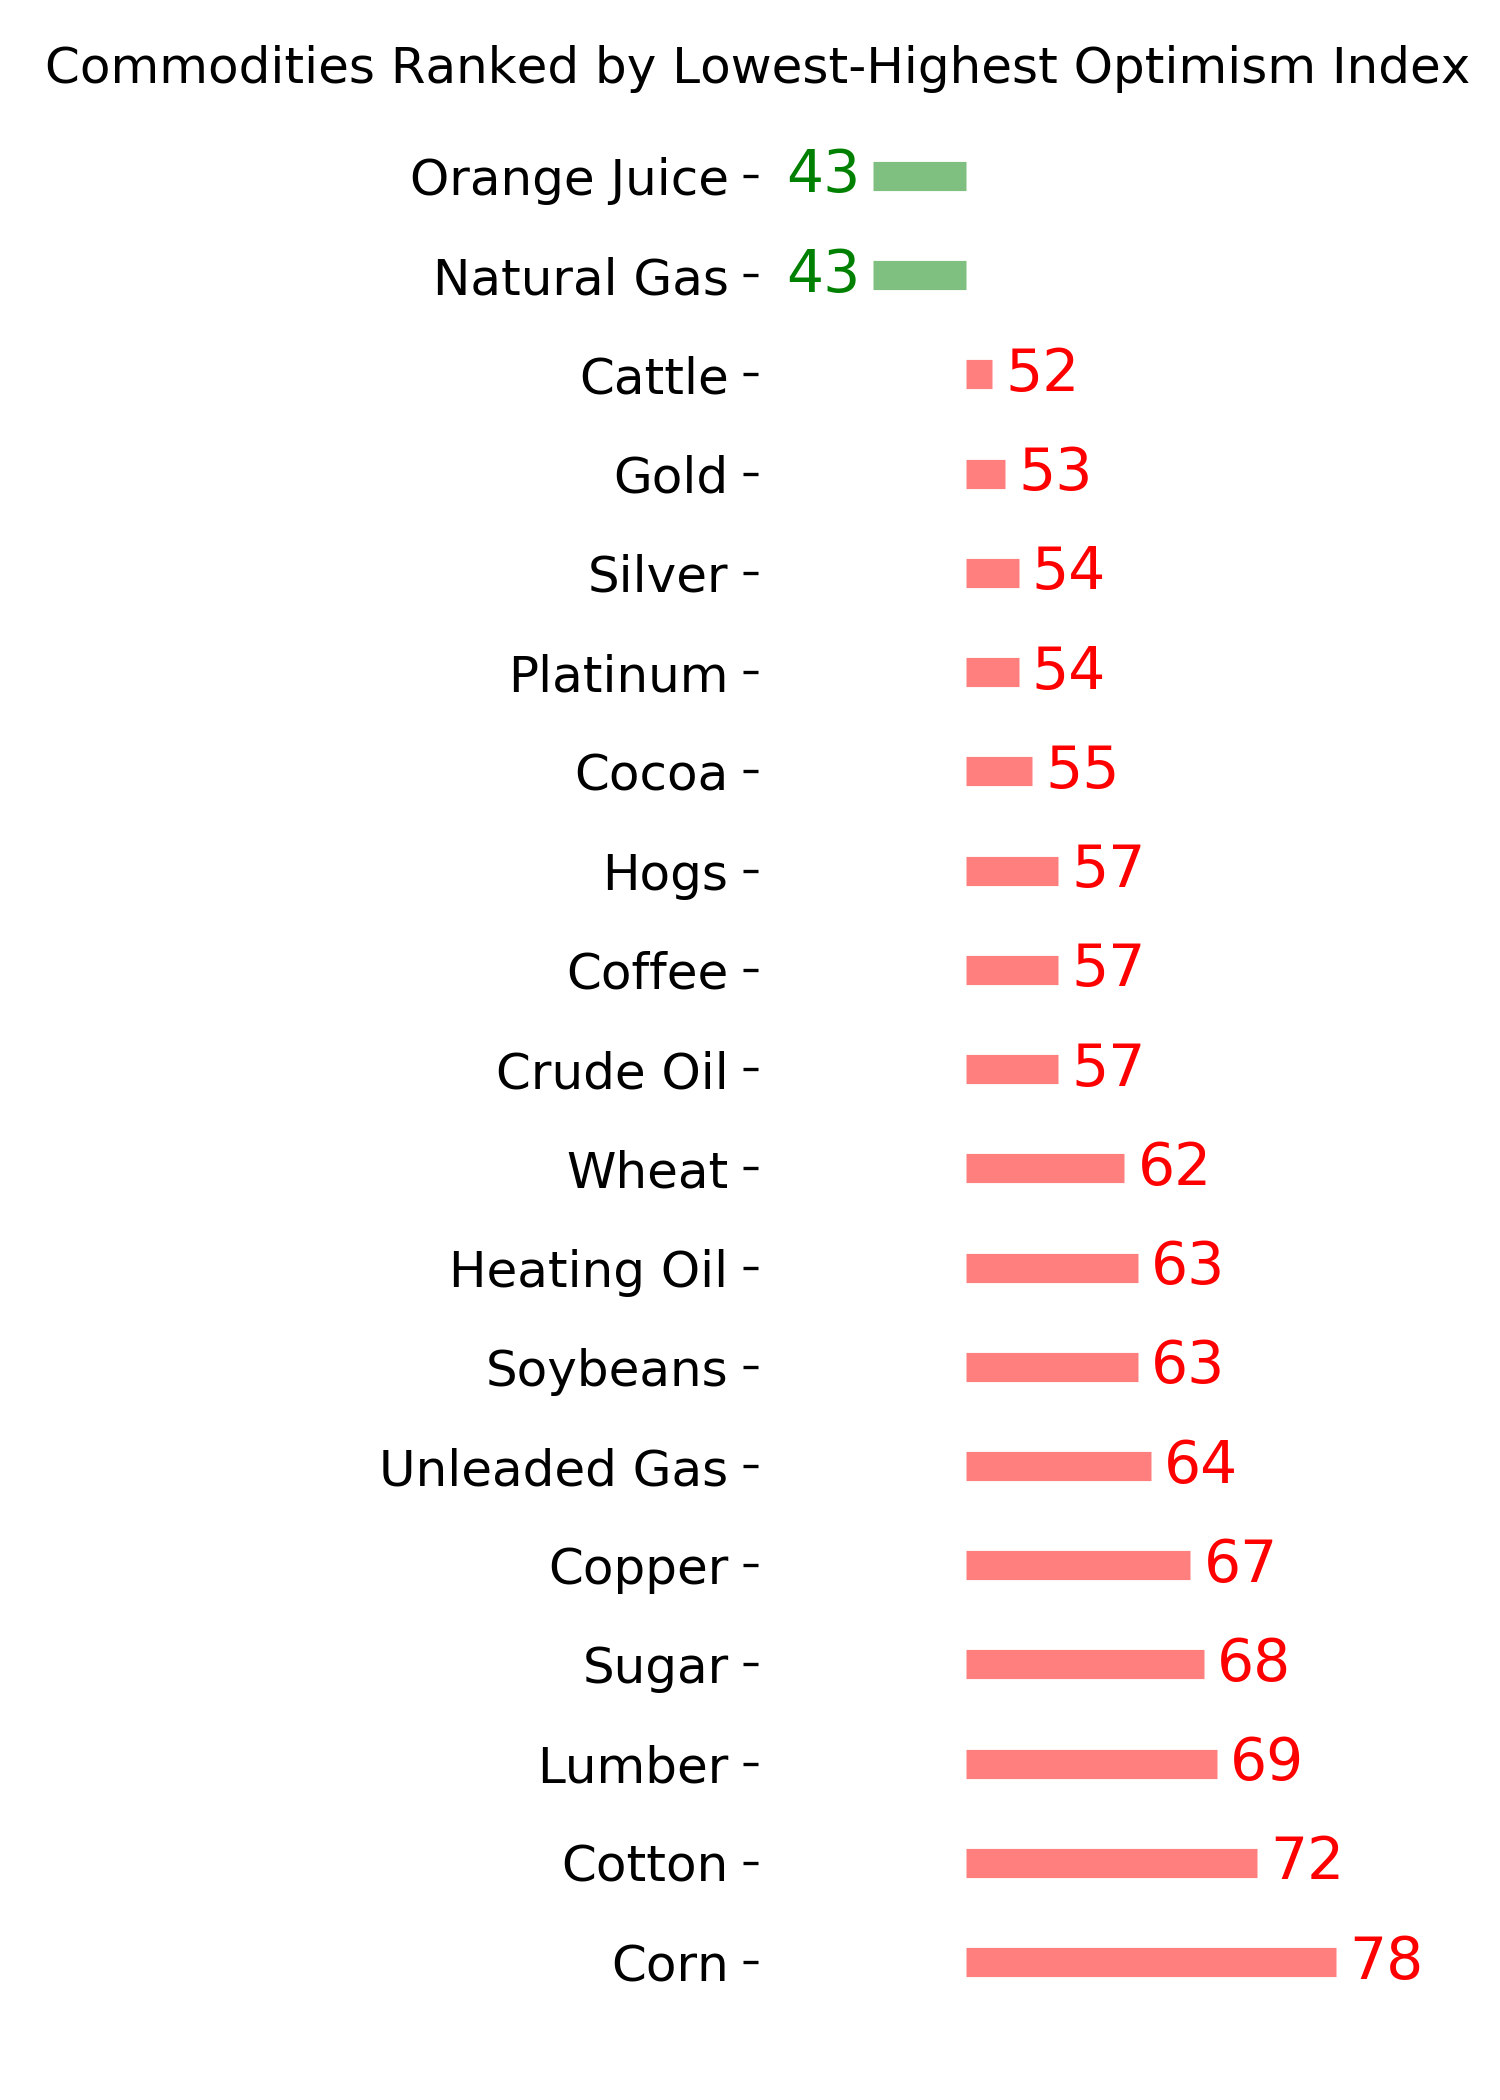
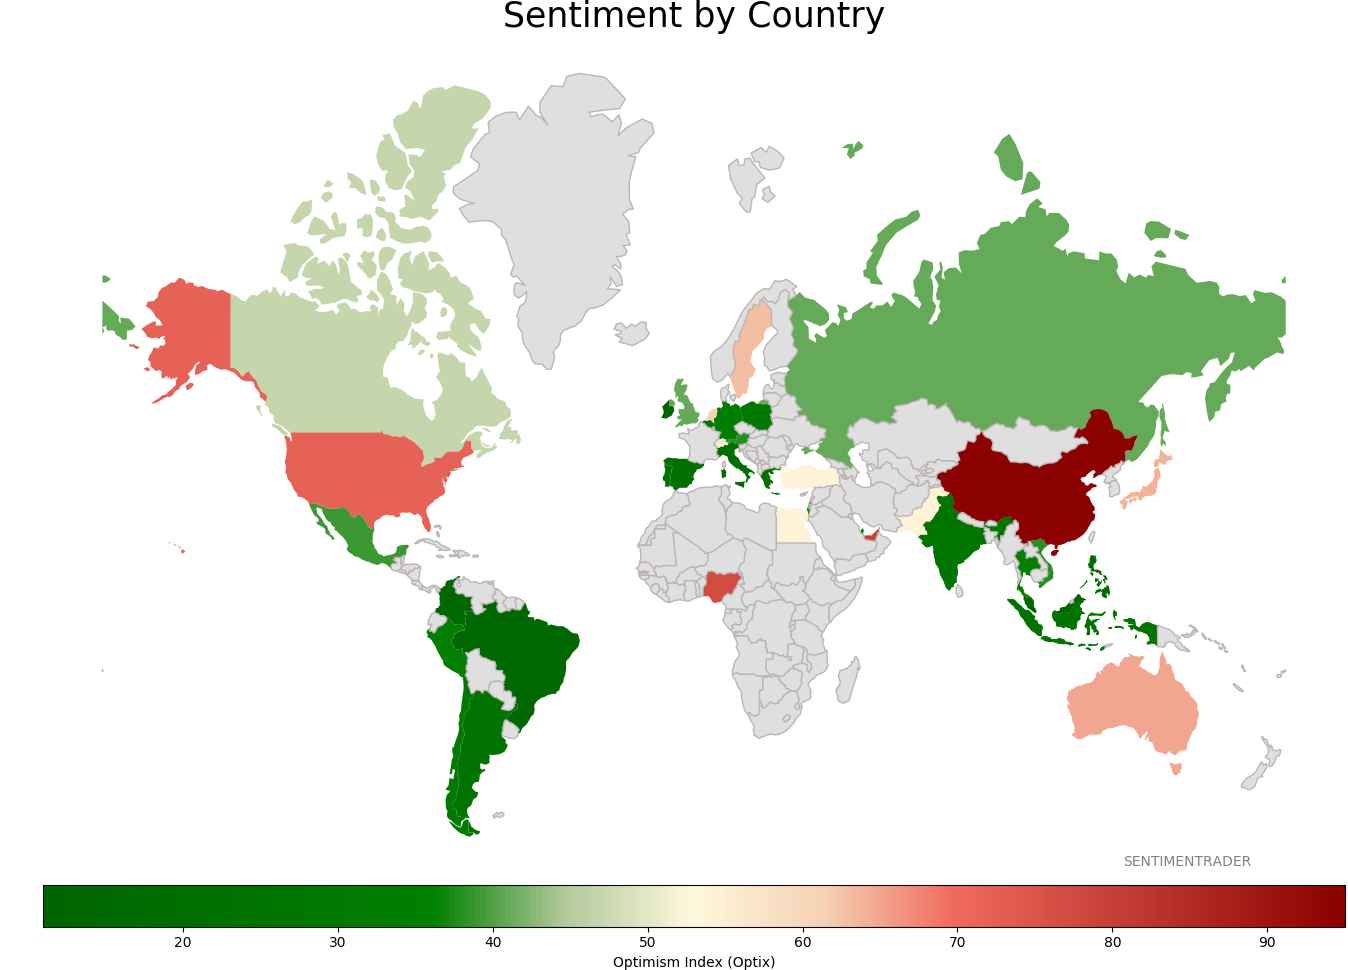
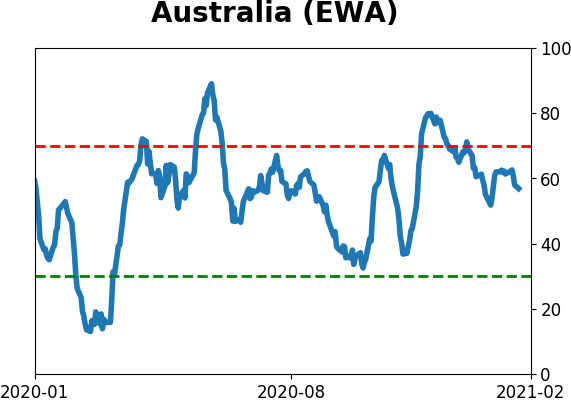
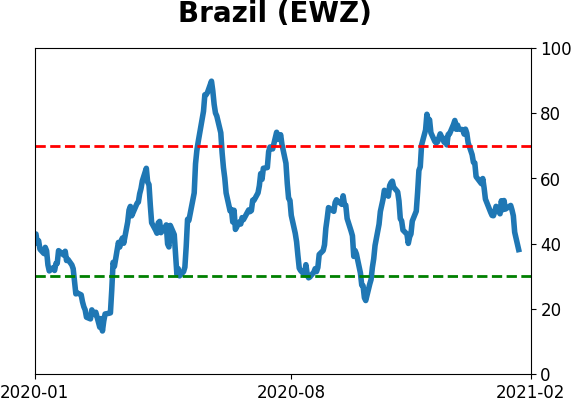
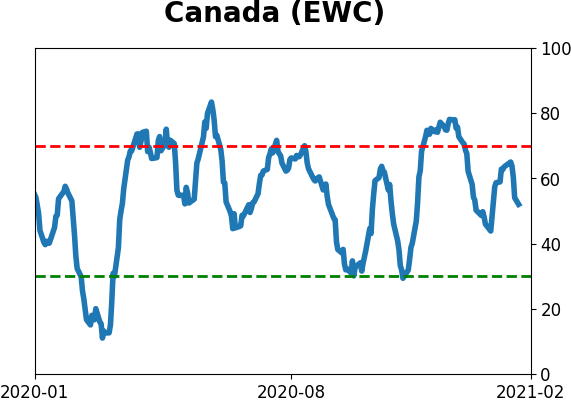
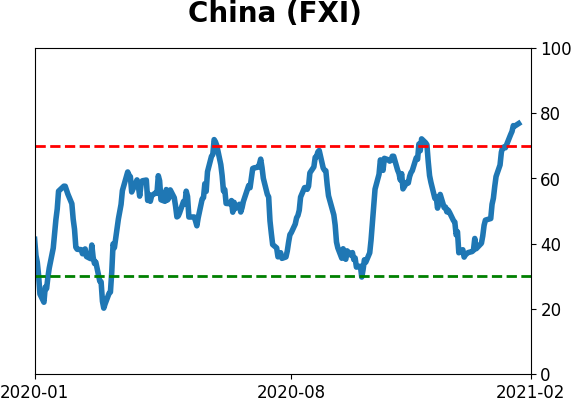
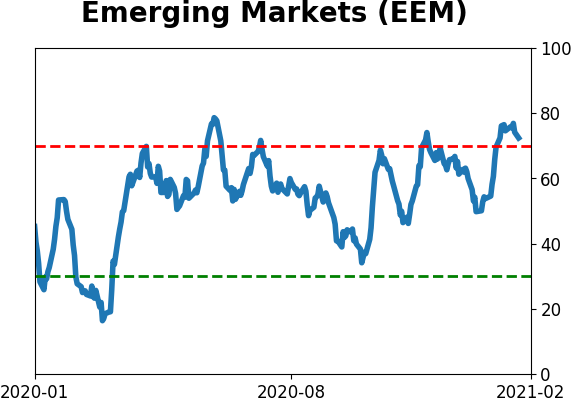
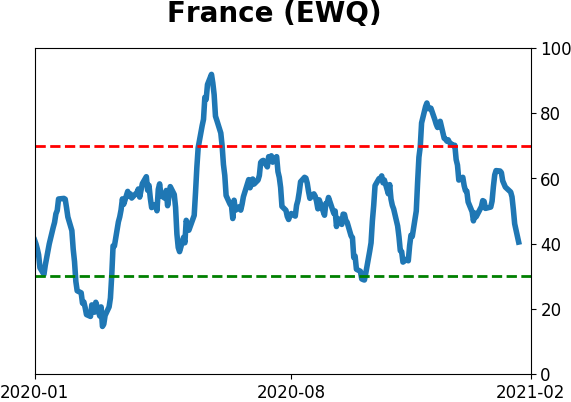
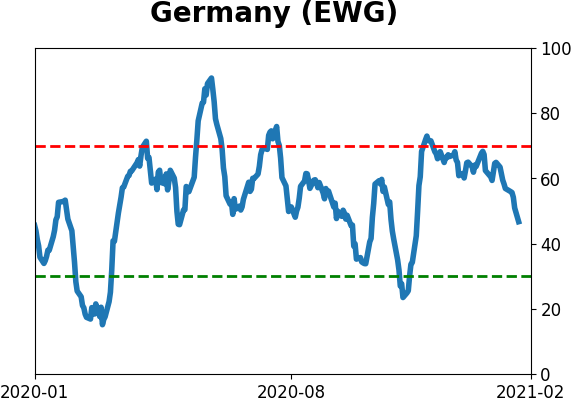
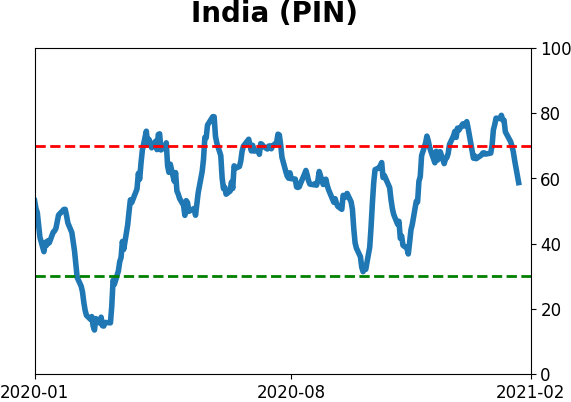
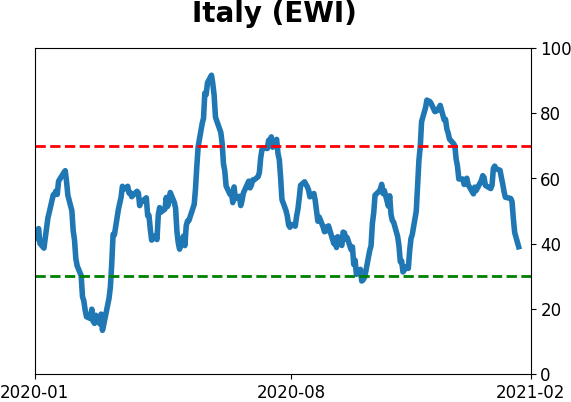
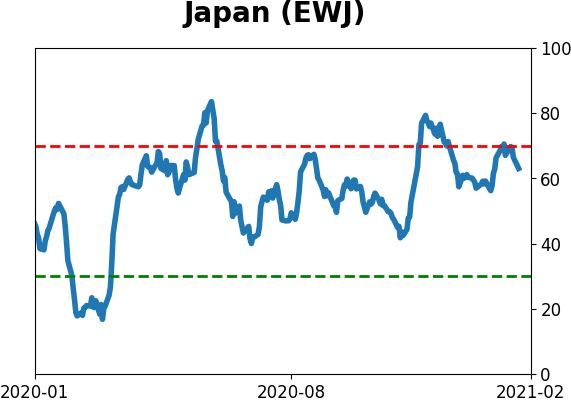
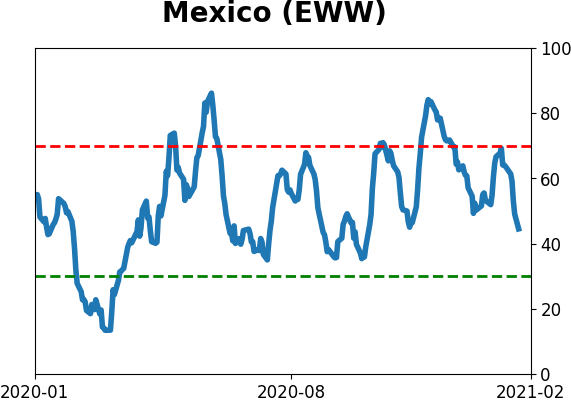
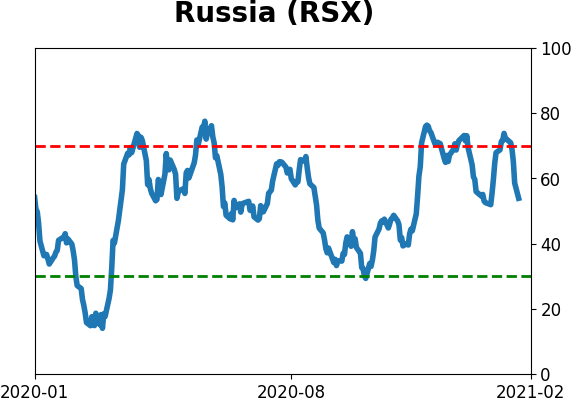
Sentiment Around The World
Optimism Index Thumbnails
|
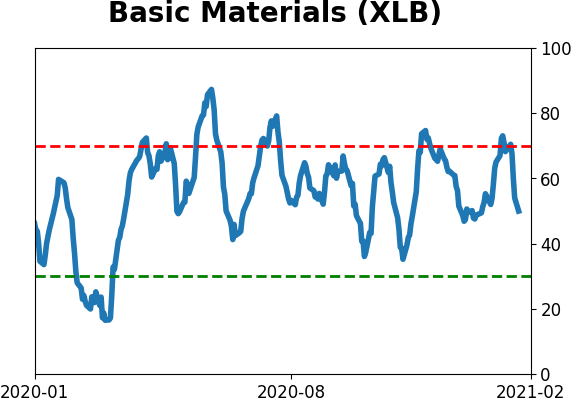
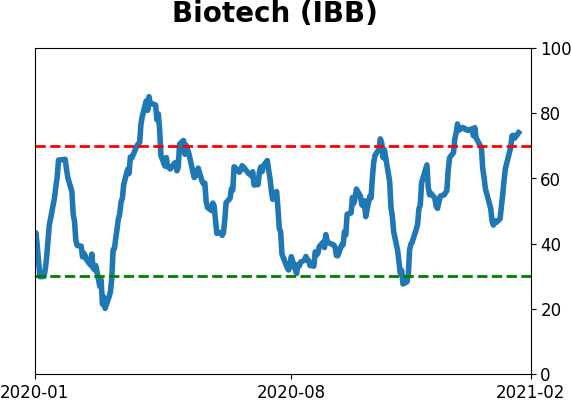
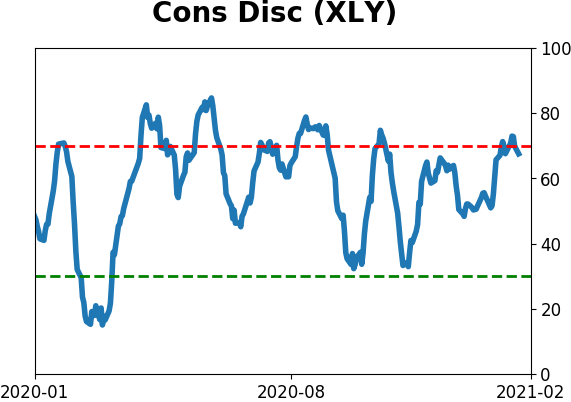
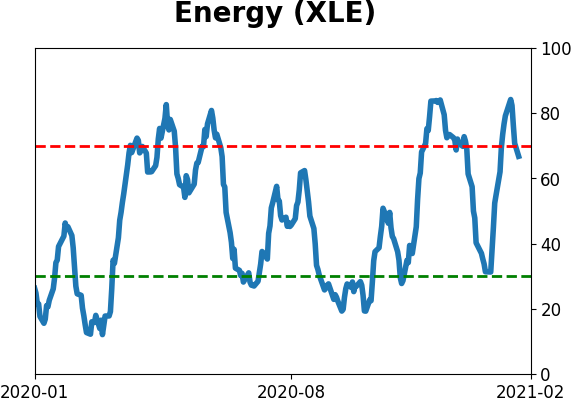
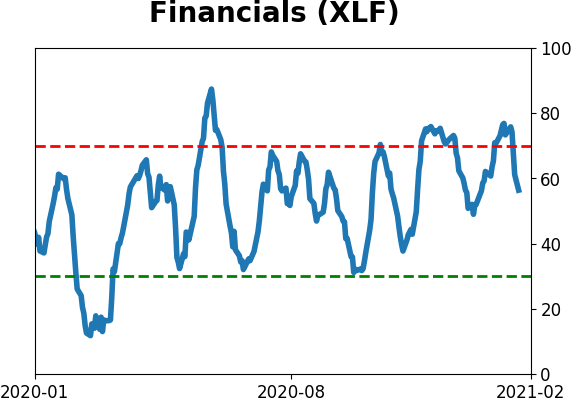
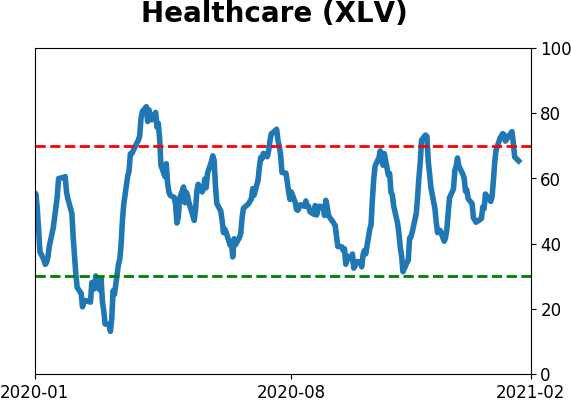
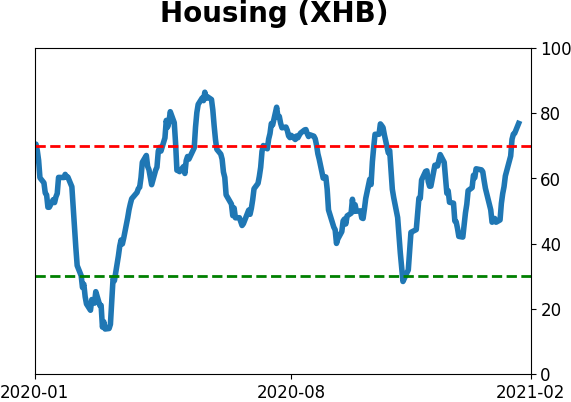
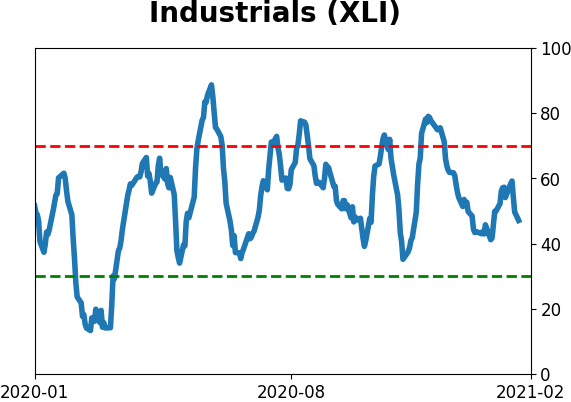
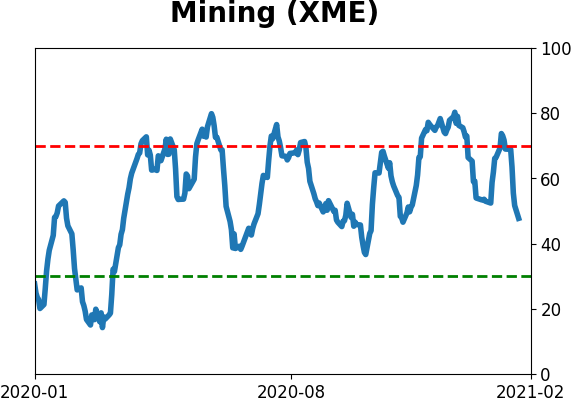
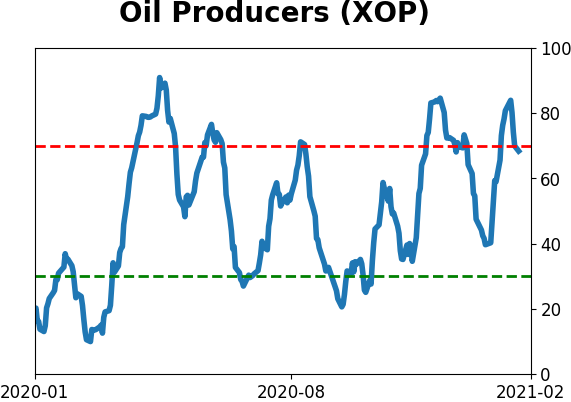
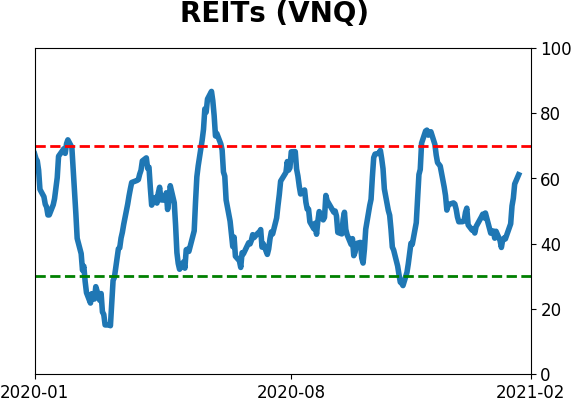
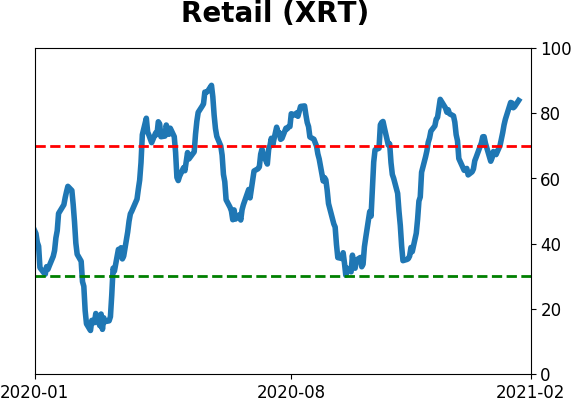
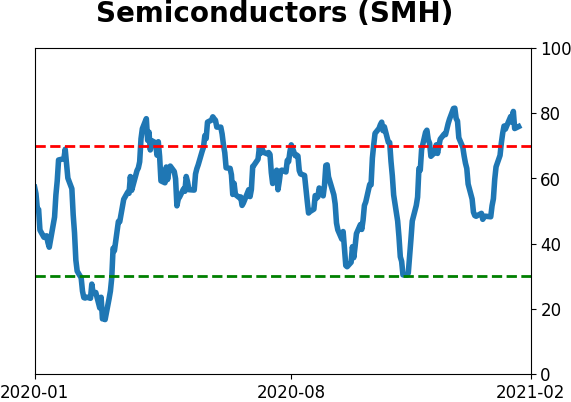
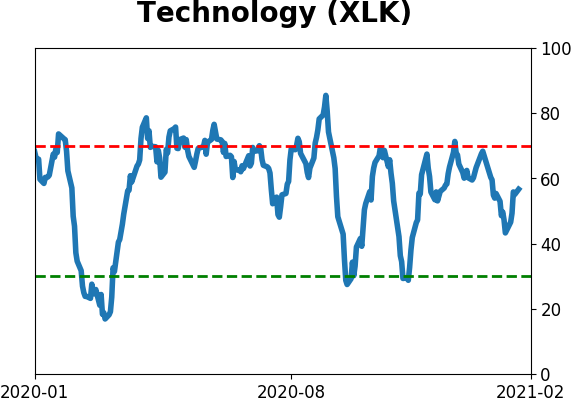
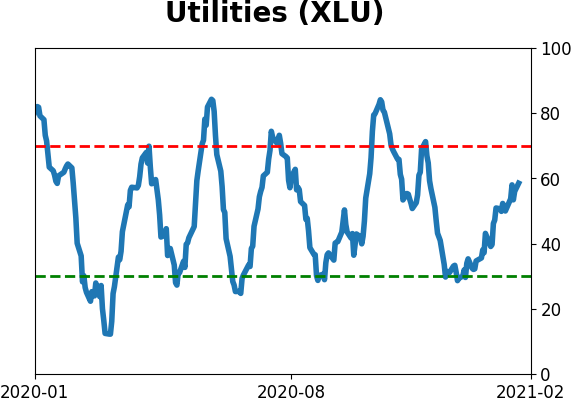
Sector ETF's - 10-Day Moving Average
|
|
|
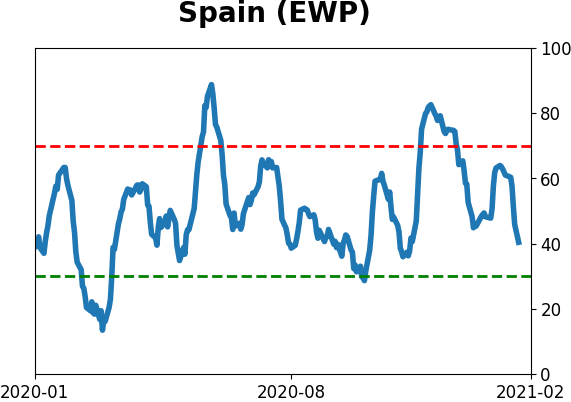
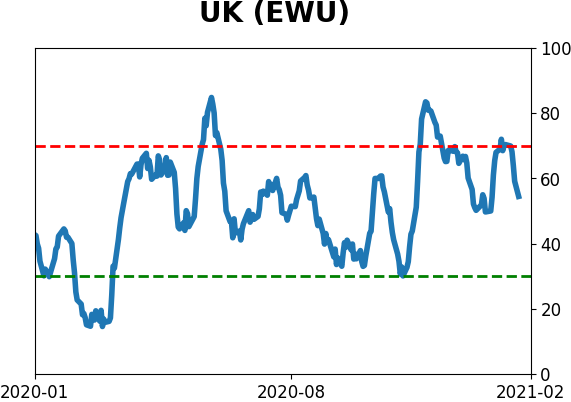
Country ETF's - 10-Day Moving Average
|
|
|
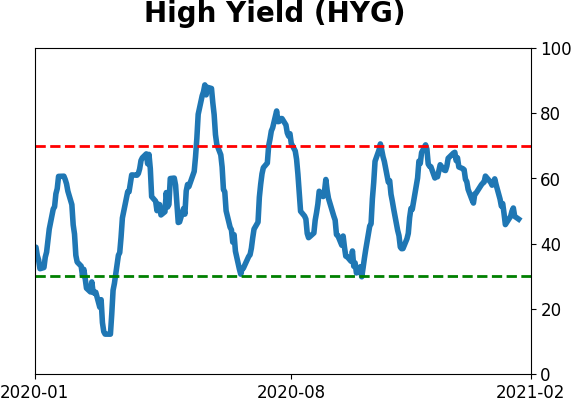
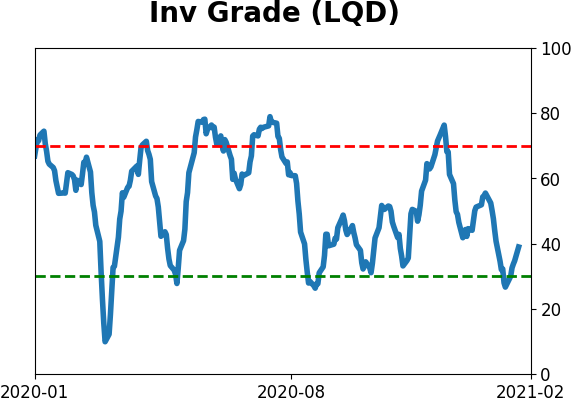
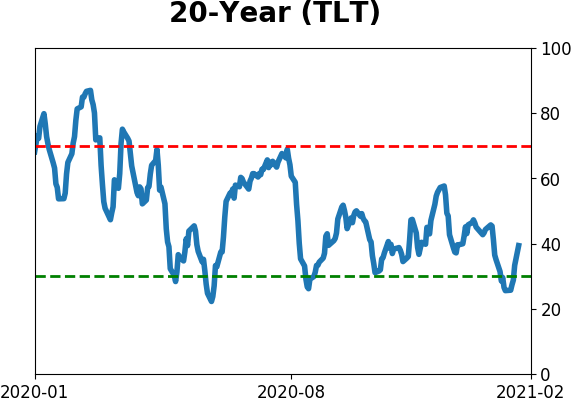
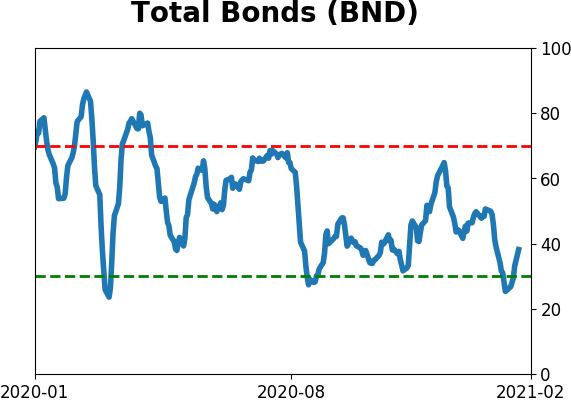
Bond ETF's - 10-Day Moving Average
|
|
|
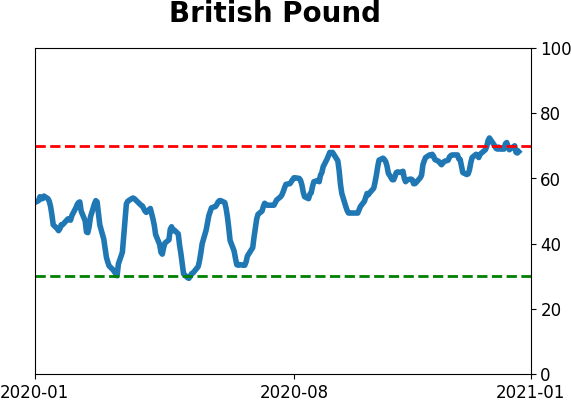
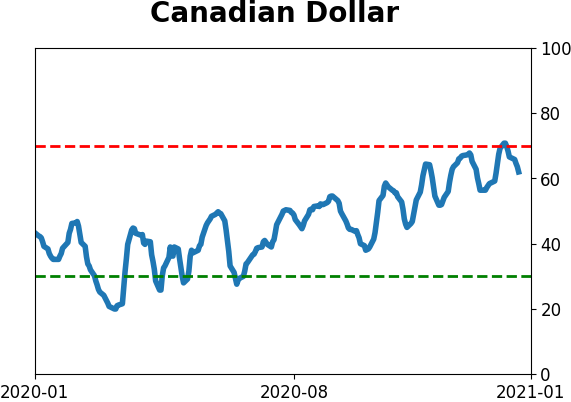
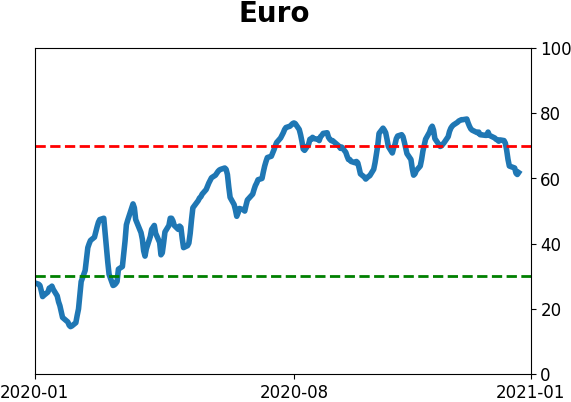
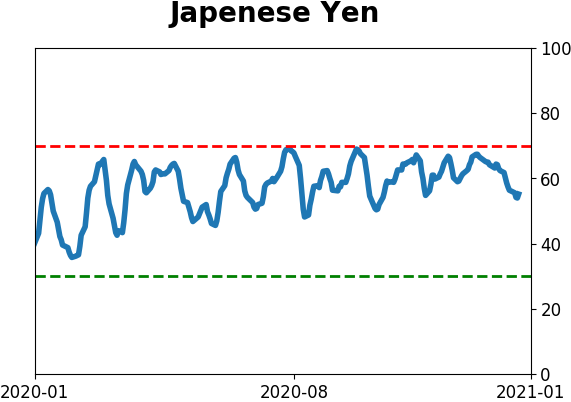
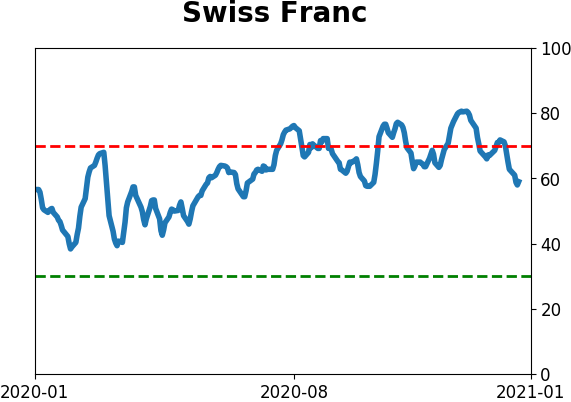
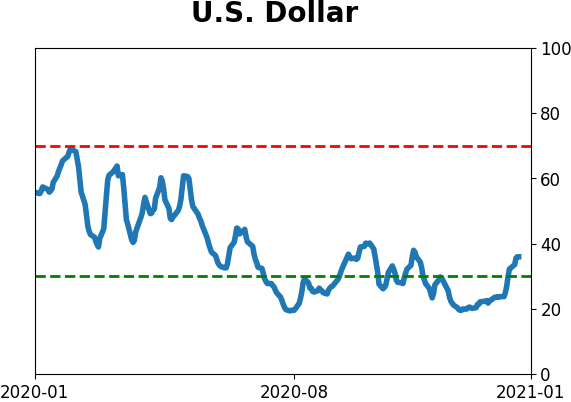
Currency ETF's - 5-Day Moving Average
|
|
|
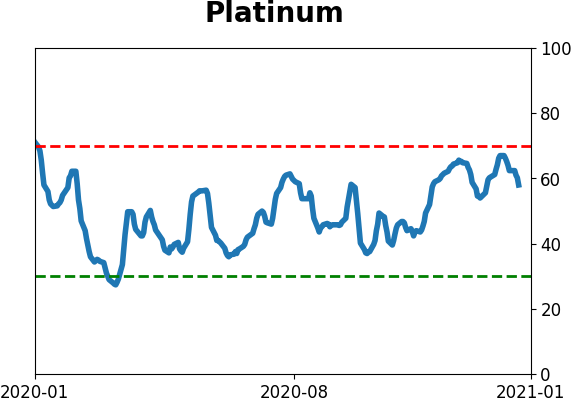
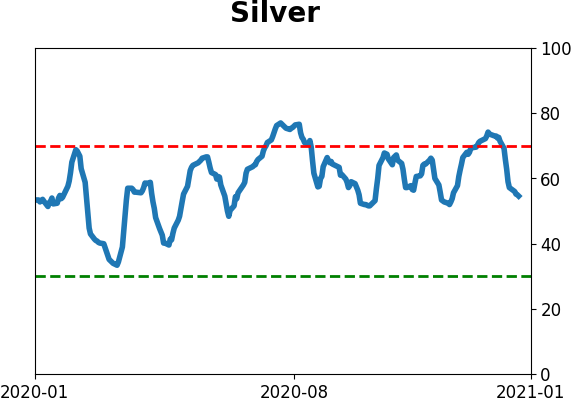
Commodity ETF's - 5-Day Moving Average
|
|