Headlines
|
|
Weekly Wrap for Jan 22 - More speculation, and a further recovery:
More signs of speculative activity in stocks. Overall breadth figures have shown a continued long-term recovery, which bodes well longer-term, but in recent days there have been more oddities triggering.
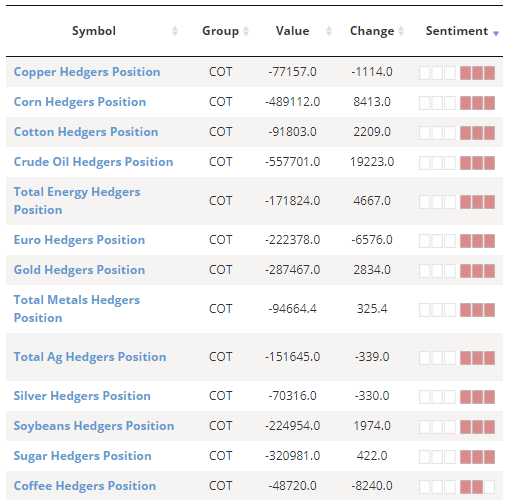
The latest Commitments of Traders report was released, covering positions through Tuesday: The 3-Year Min/Max Screen shows that "smart money" commercial hedgers didn't establish any new extremes for the week. In stocks, they sold more major equity index futures and are now net short about $22 billion worth of contracts, the 5th-most since last March but is not particularly extreme compared to the longer-term range. Among extremes, it's the same cast of characters are recent weeks, with heavy shorts against most commodities, as they're still net long the dollar.
Bottom Line:
The market environment is pristine, with only sporadic signs of internal deterioration, but with near-historic optimism, gains tend to be muted, with a high probability of being reversed at some point over the ensuing weeks. | Other Sectors and Assets |
| | Positives | Negatives | | 1. Energy (here, here, and here) | 1. Skewed tech (here and here) |
|
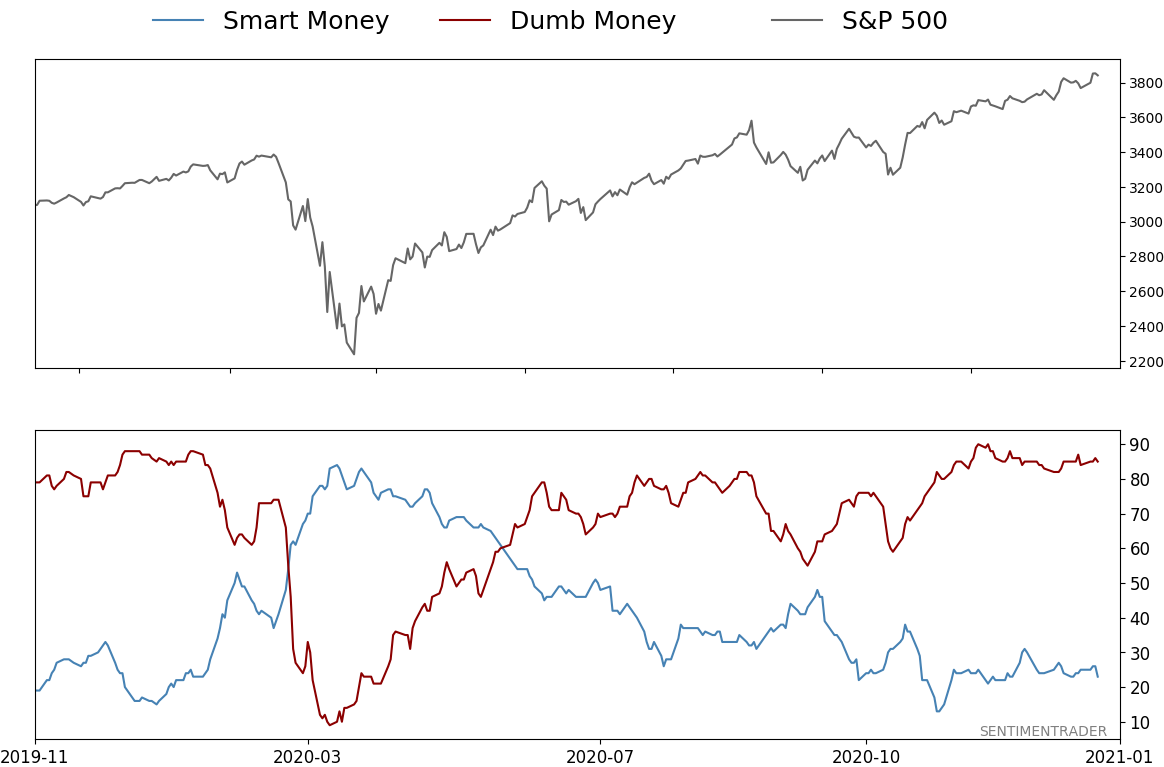
Smart / Dumb Money Confidence
|
Smart Money Confidence: 23%
Dumb Money Confidence: 85%
|
|
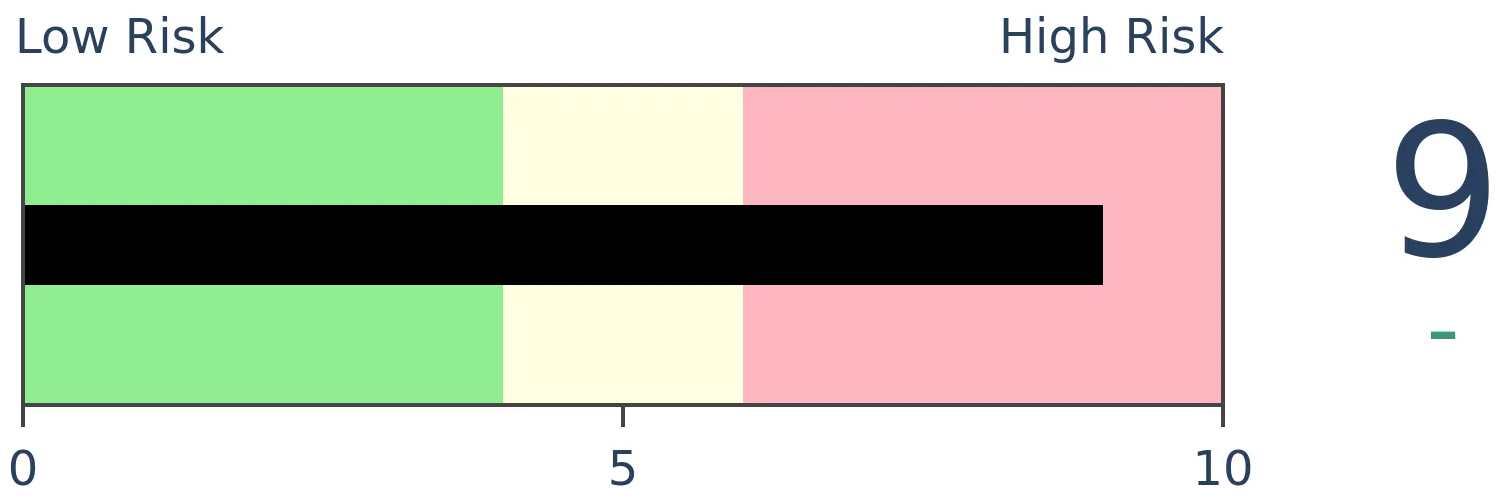
Risk Levels
Stocks Short-Term
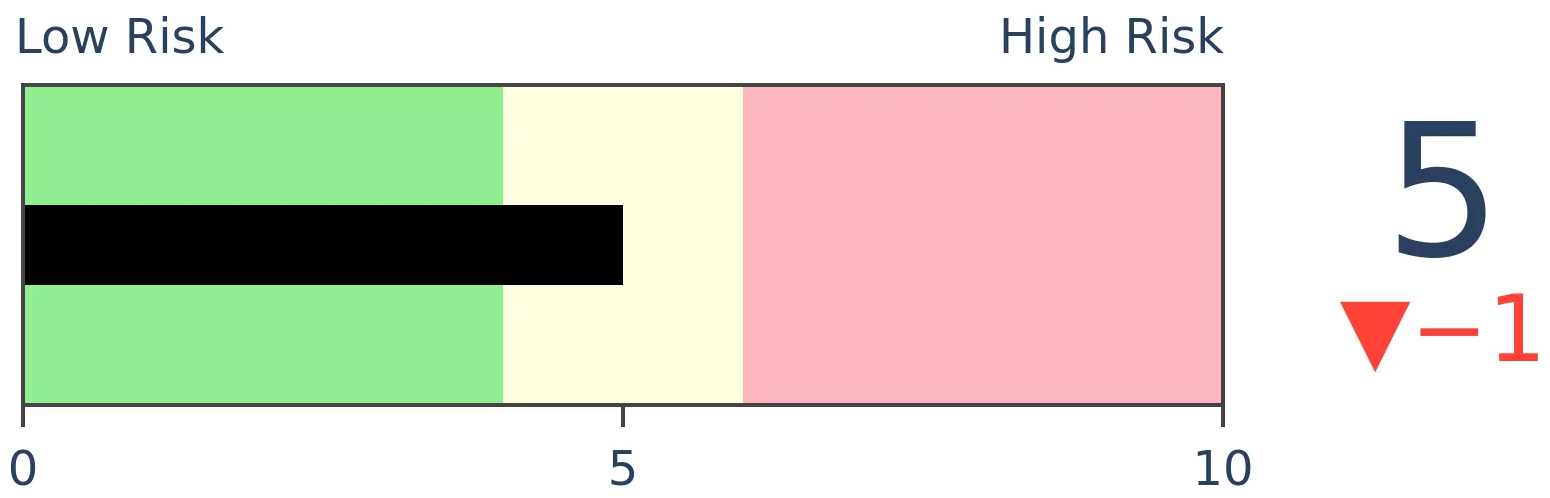
|
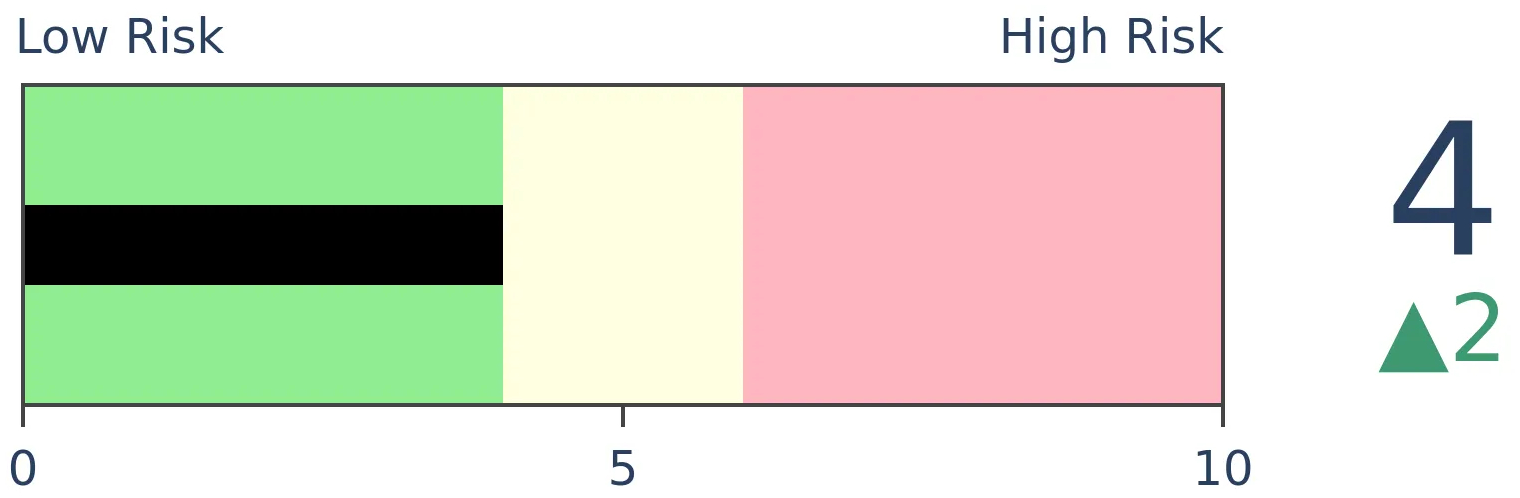
Stocks Medium-Term

|
|
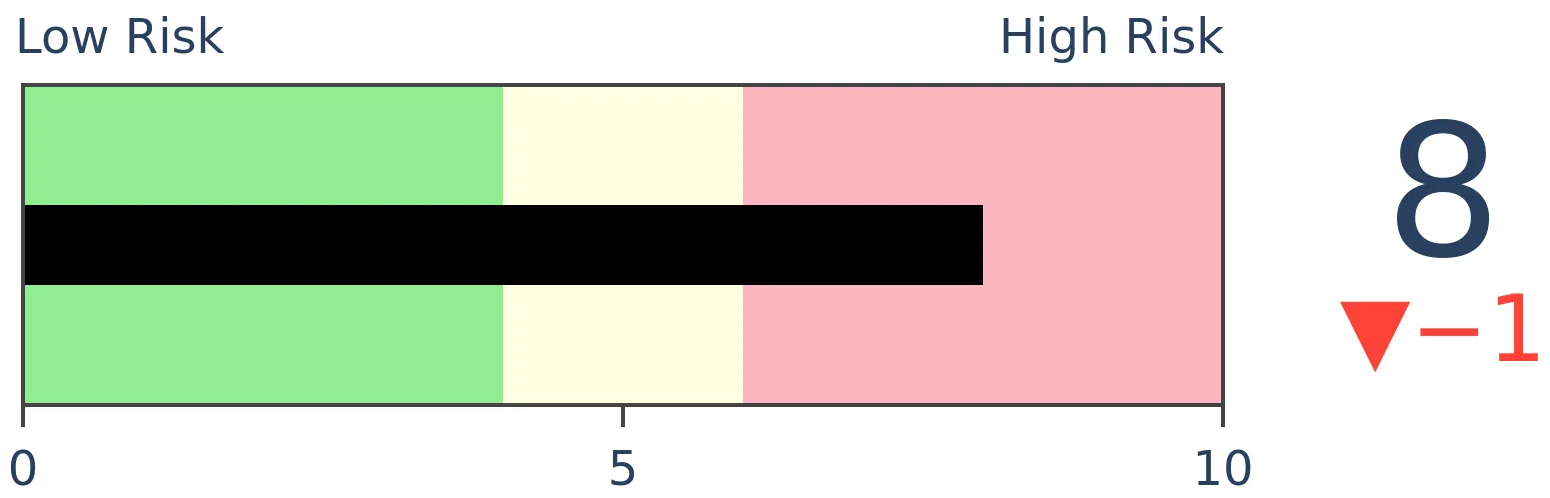
Bonds
|
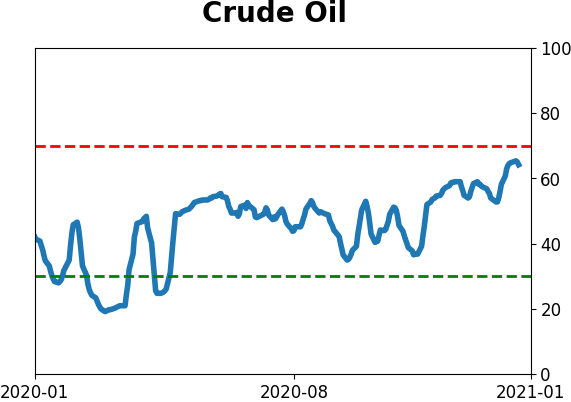
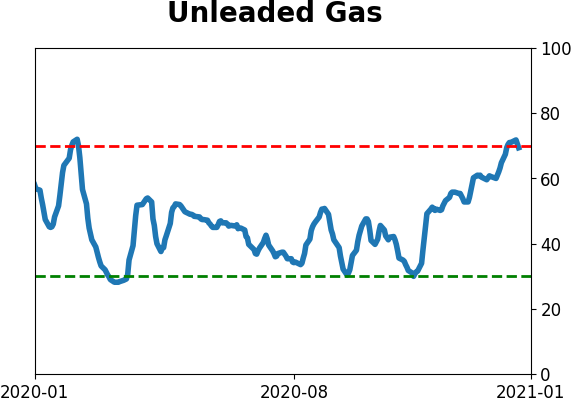
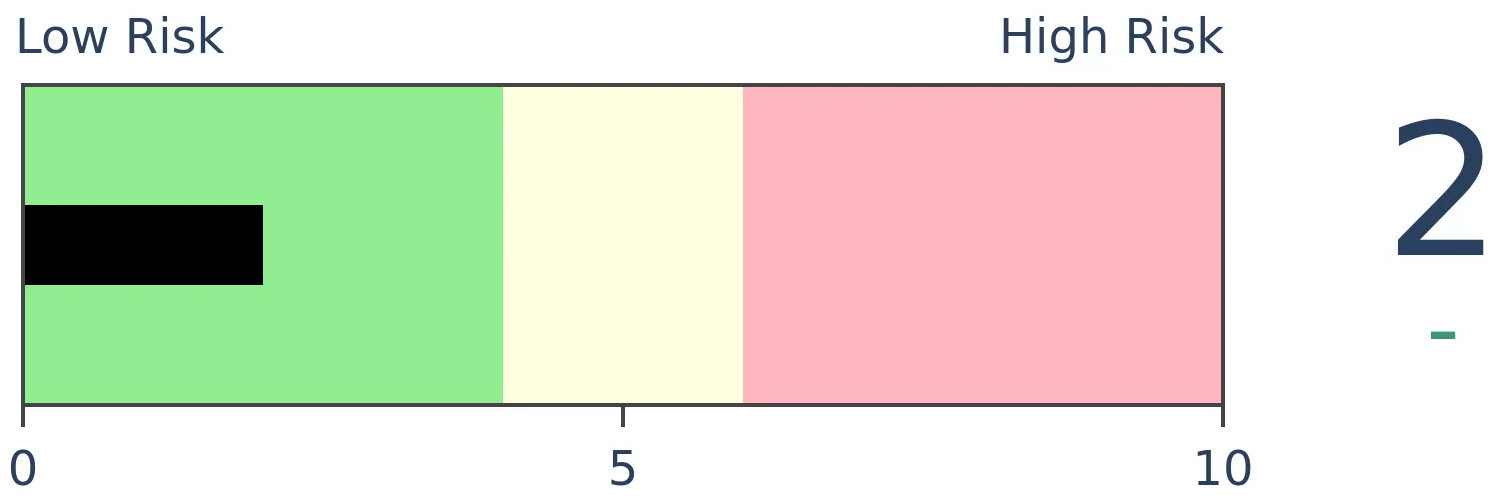
Crude Oil
|
|
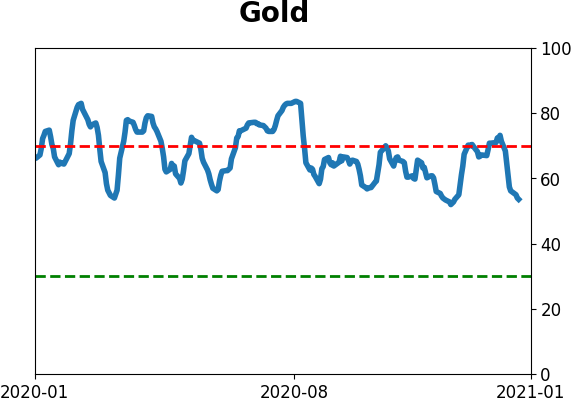
Gold
|
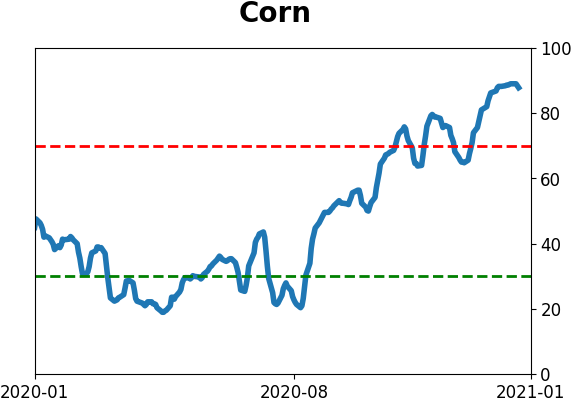
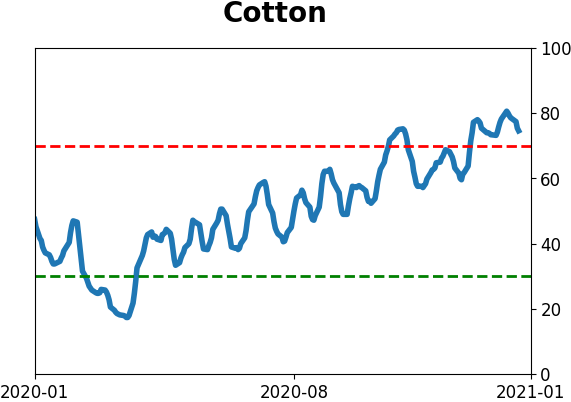
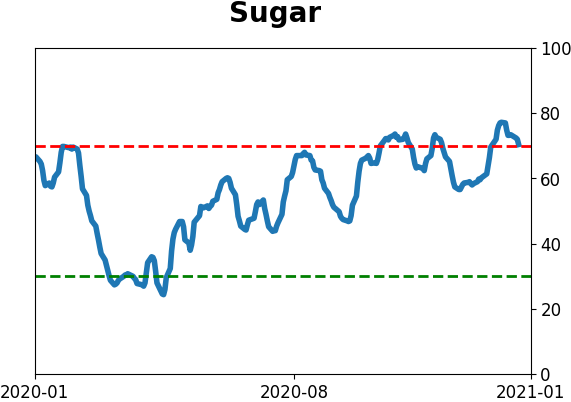
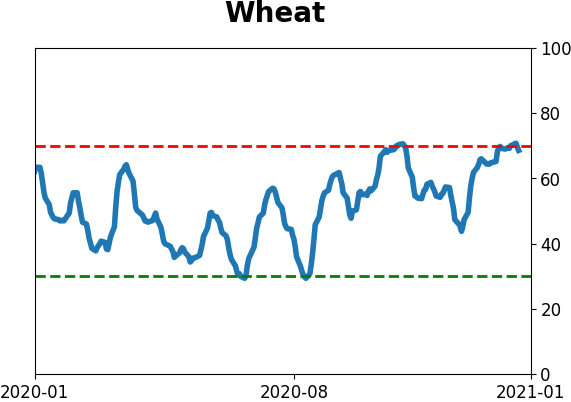
Agriculture
|
|
Research
BOTTOM LINE
More signs of speculative activity in stocks. Overall breadth figures have shown a continued long-term recovery, which bodes well longer-term, but in recent days there have been more oddities triggering.
FORECAST / TIMEFRAME
None
|
The goal of the Weekly Wrap is to summarize our recent research. Some of it includes premium content (underlined links), but we're highlighting the key focus of the research for all. Sometimes there is a lot to digest, with this summary meant to highlight the highest conviction ideas we discussed. Tags will show any related symbols and time frames related to the research.
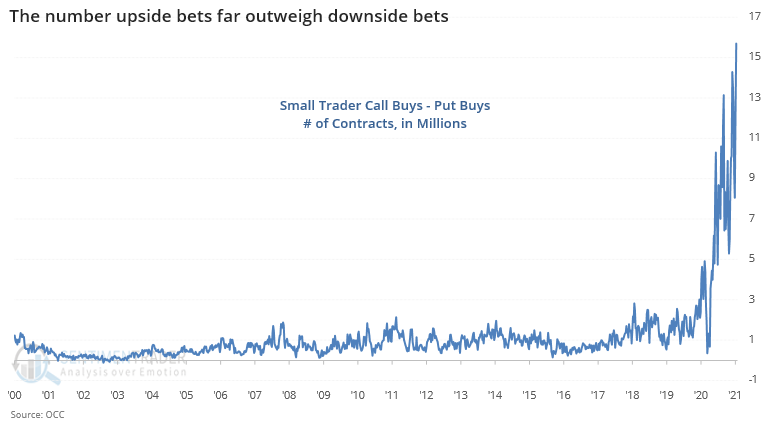
We entered the week once again with a surge in speculative activity. When we look at the raw number of contracts that small traders are buying, it's astounding. Parabolic is the only accurate term, with more than 22 million call options bought last week. Against those call options, they bought to open only 6.5 million puts. So, the net difference is even more extreme.
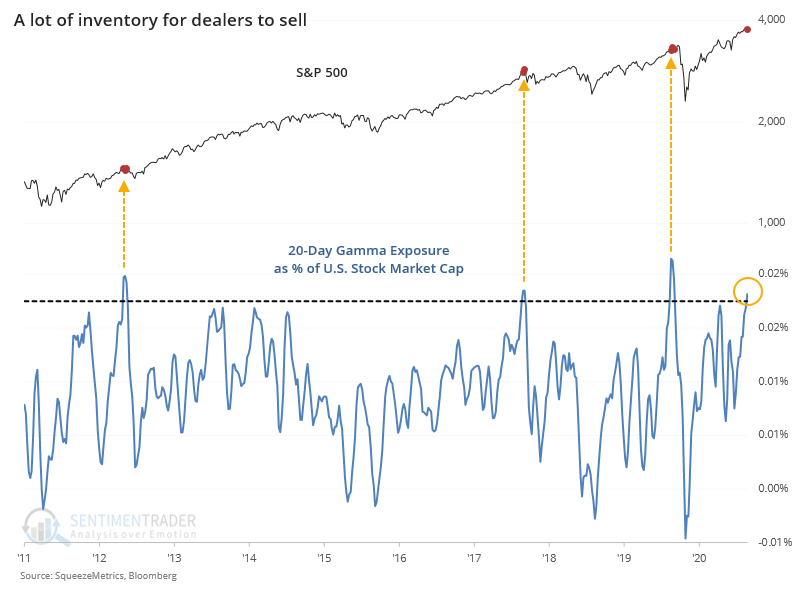
Someone has to take the other side of those call purchases and then hedge their exposure. Over the past 20 days, Gamma Exposure has reached a near-record, on an absolute and relative basis. NOTE: The Gamma Exposure / Market Cap Ratio is now updated daily on the site.
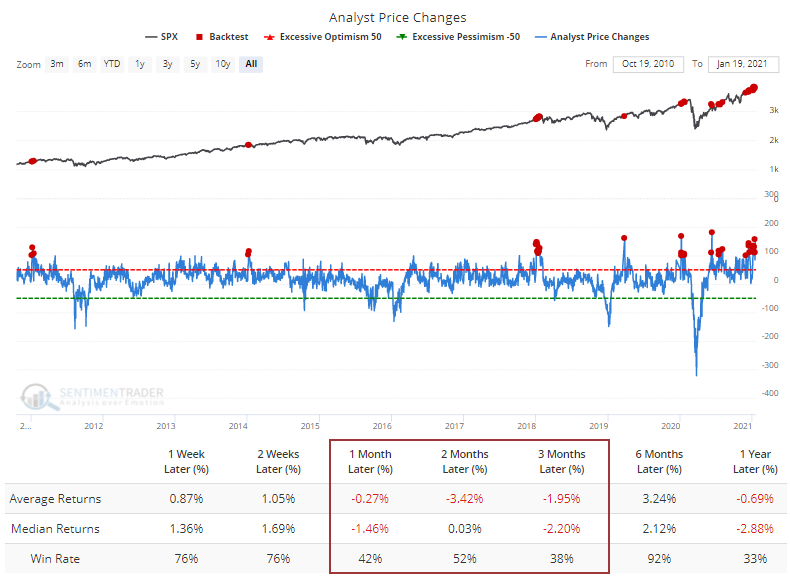
Wall Street analysts have joined the party as U.S. companies begin to report earnings in earnest. They've been busying upgrading price targets, and they've done it on so many stocks that it's registering an extreme. It's been tough for stocks to hold gains when analysts were expecting so much going in.
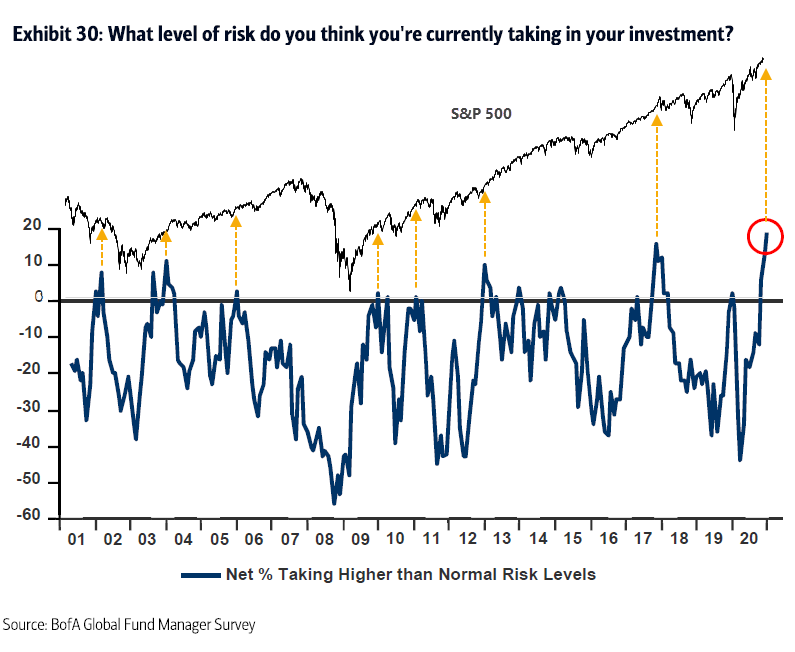
Fund managers in the monthly Bank of America survey, as well, are taking a record amount of risk.
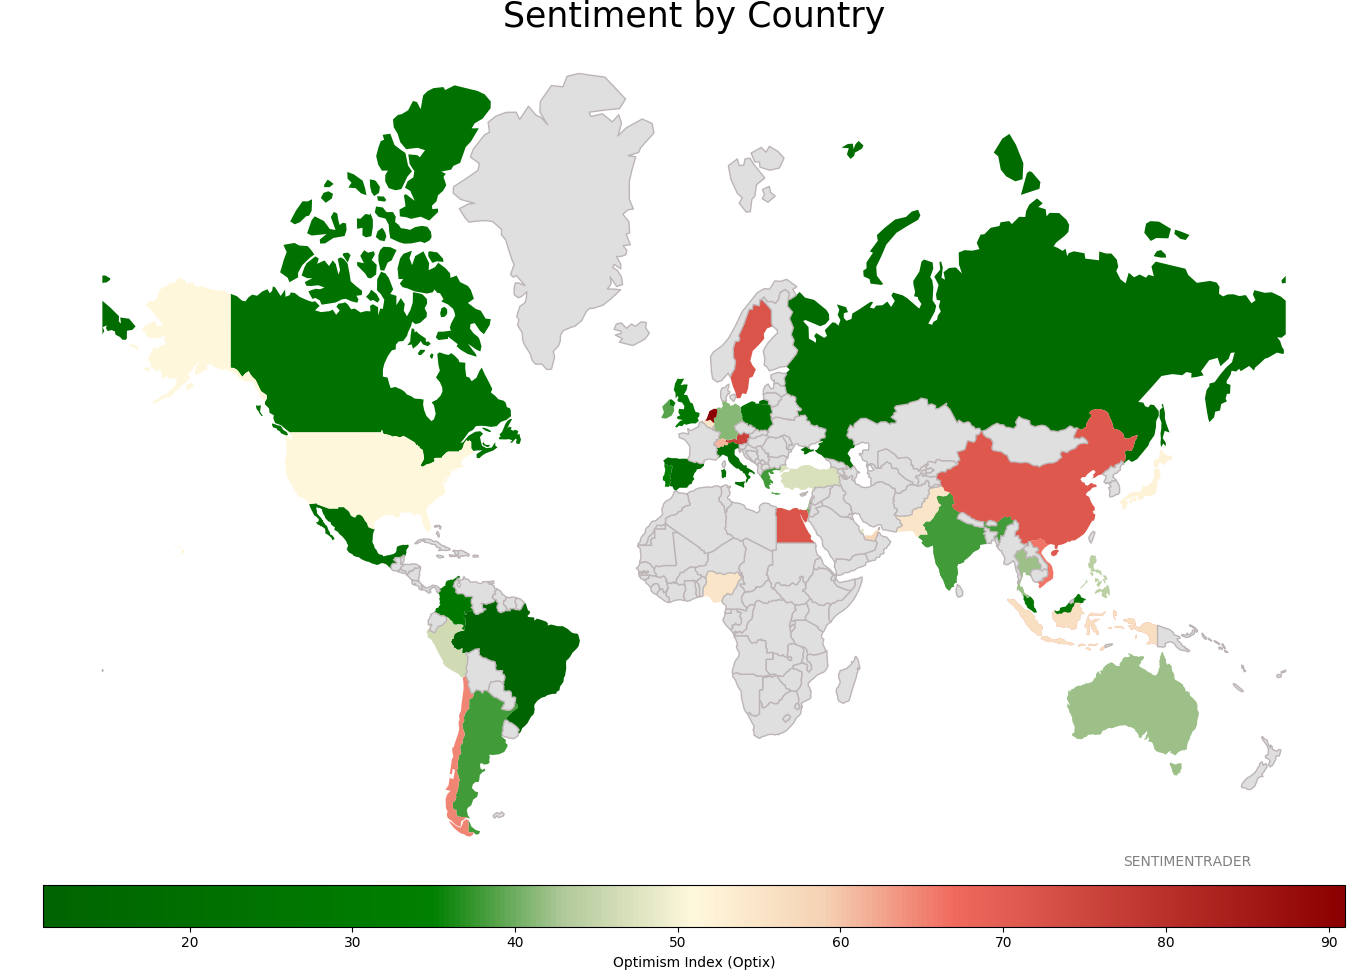
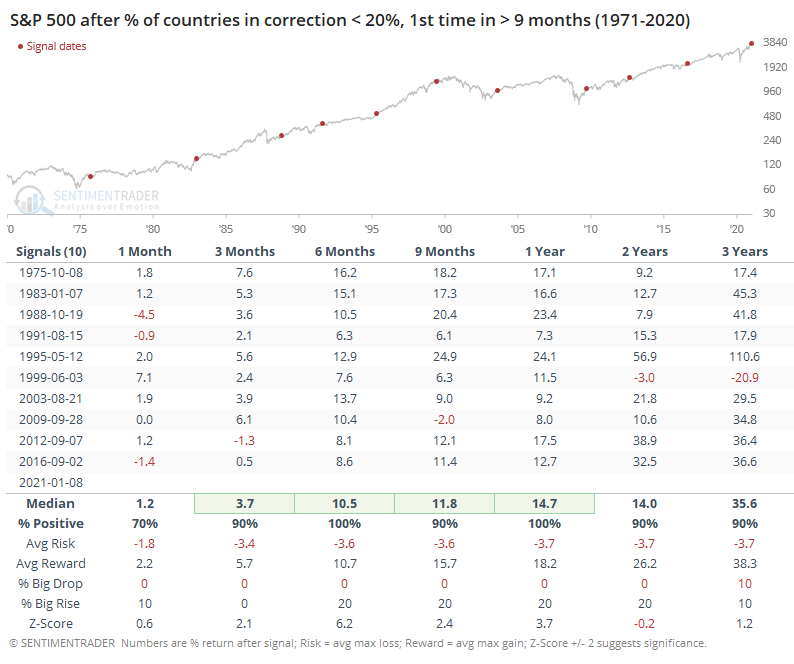
As has been the pattern lately, these extremes in sentiment have triggered as markets display the kinds of participation and momentum normally seen near the beginning of long-term uptrends, not the ends of them. Among the signs of recovery, not just in the U.S. but worldwide, is that for the first time in more than 200 days, fewer than 20% of major world equity indexes are in corrections.
After other streaks ended, it was a good longer-term sign for stocks. It was good for the S&P 500, and even better for small-cap and value stocks.
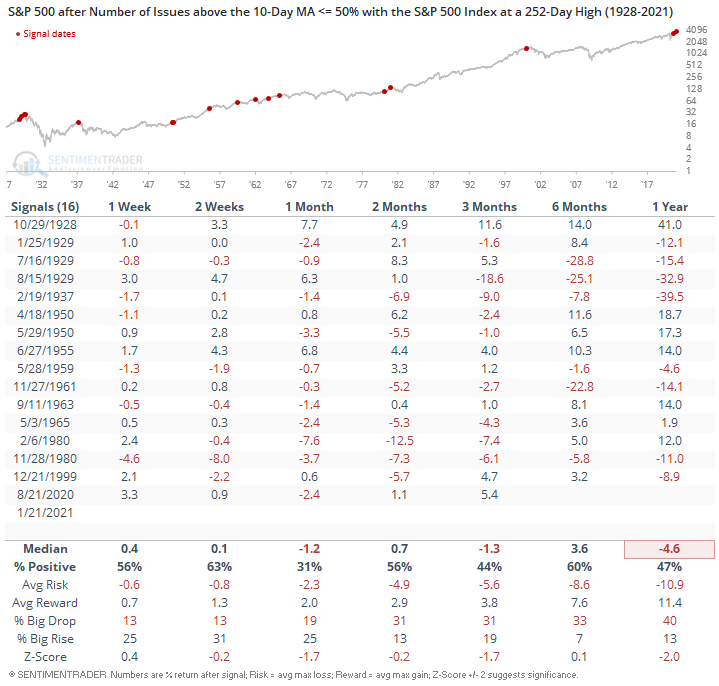
The persistent and broad-based recovery can also be seen in the percentage of securities on the NYSE that have been able to hold above their 200-day averages. Since 1928, this led to consistent gains over the medium-term.
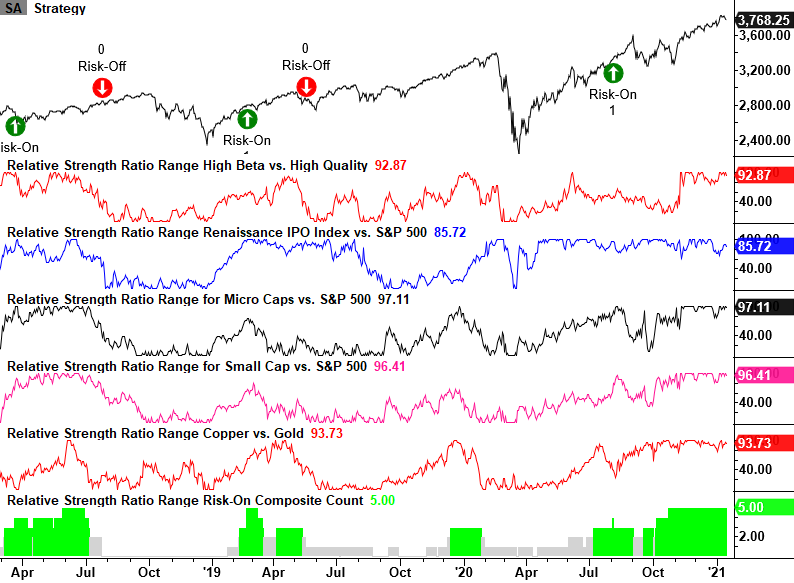
Dean noted that he uses several relative ratio relationships to monitor market participants' risk appetite. When economic conditions are accelerating, capital tends to flow to more risky groups.
He constructs a Risk-On Composite model by measuring the relative ratio range for 5 different ratios. The composite will range from 0 - 5 and issue a buy signal when it crosses a high level. We can see below that it's still in risk-on mode and far from giving a sell signal.
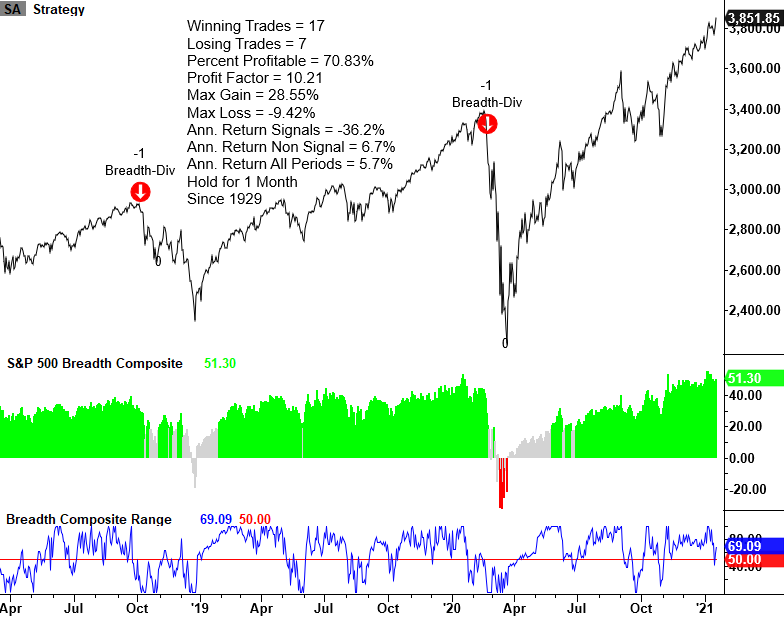
Dean also noted another risk-on or -off methodology to manage portfolio risk. The process seeks to identify a divergence between an index's underlying price and the internal participation amongst members as measured by a breadth composite.
It seeks to identify the 4 conditions that have consistently preceded deteriorating conditions as it did before the last two major corrections. So far, they're not triggering across a number of different indexes and market caps.
NOTE: We're working on integrating these models and signals into our regular updates.
However, we need to watch developments very closely, because just this week, the weakness in small-cap stocks and some bonds has helped to pressure the breadth metrics. We're seeing the very beginning of potential deterioration.
Jay pointed out that certain rivalries in the financial markets sort of take on a life of their own.
Large vs. small is one that a lot of investors pay close attention to. It is sort of the David vs. Goliath of the stock market. In the midst of this never-ending debate, smack dab in the middle lies a potentially significant opportunity that many investors rarely if ever consider – the mid-cap space.
The chart below displays the rolling 5-year return for Mid-caps minus the rolling 5-year return for Large-caps. When the value is positive it means Mid-caps outperformed over the most recent 5 years and vice-versa.
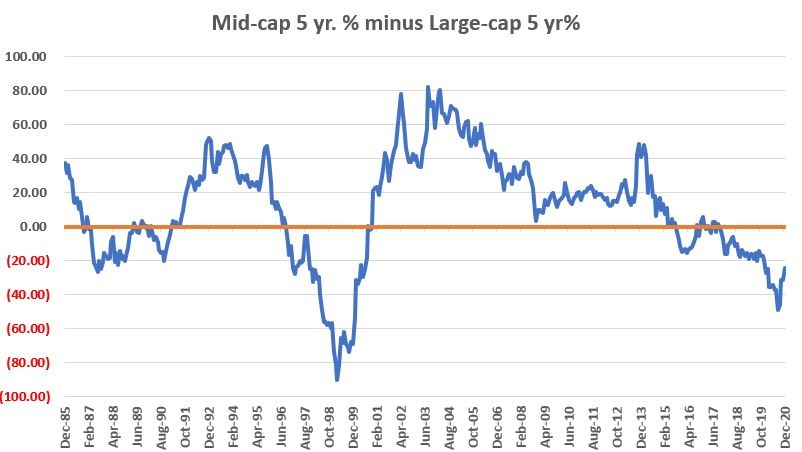
Previous dips into deeply negative territory (i.e., periods where Large-caps significantly outperformed over a 5-year period) were followed by periods of significant outperformance on the part of Mid-caps. The current value is deeply negative but has reversed sharply in recent months. Seasonality and some big losses last spring argue for further outperformance.
| BONDS |
 |
|
|
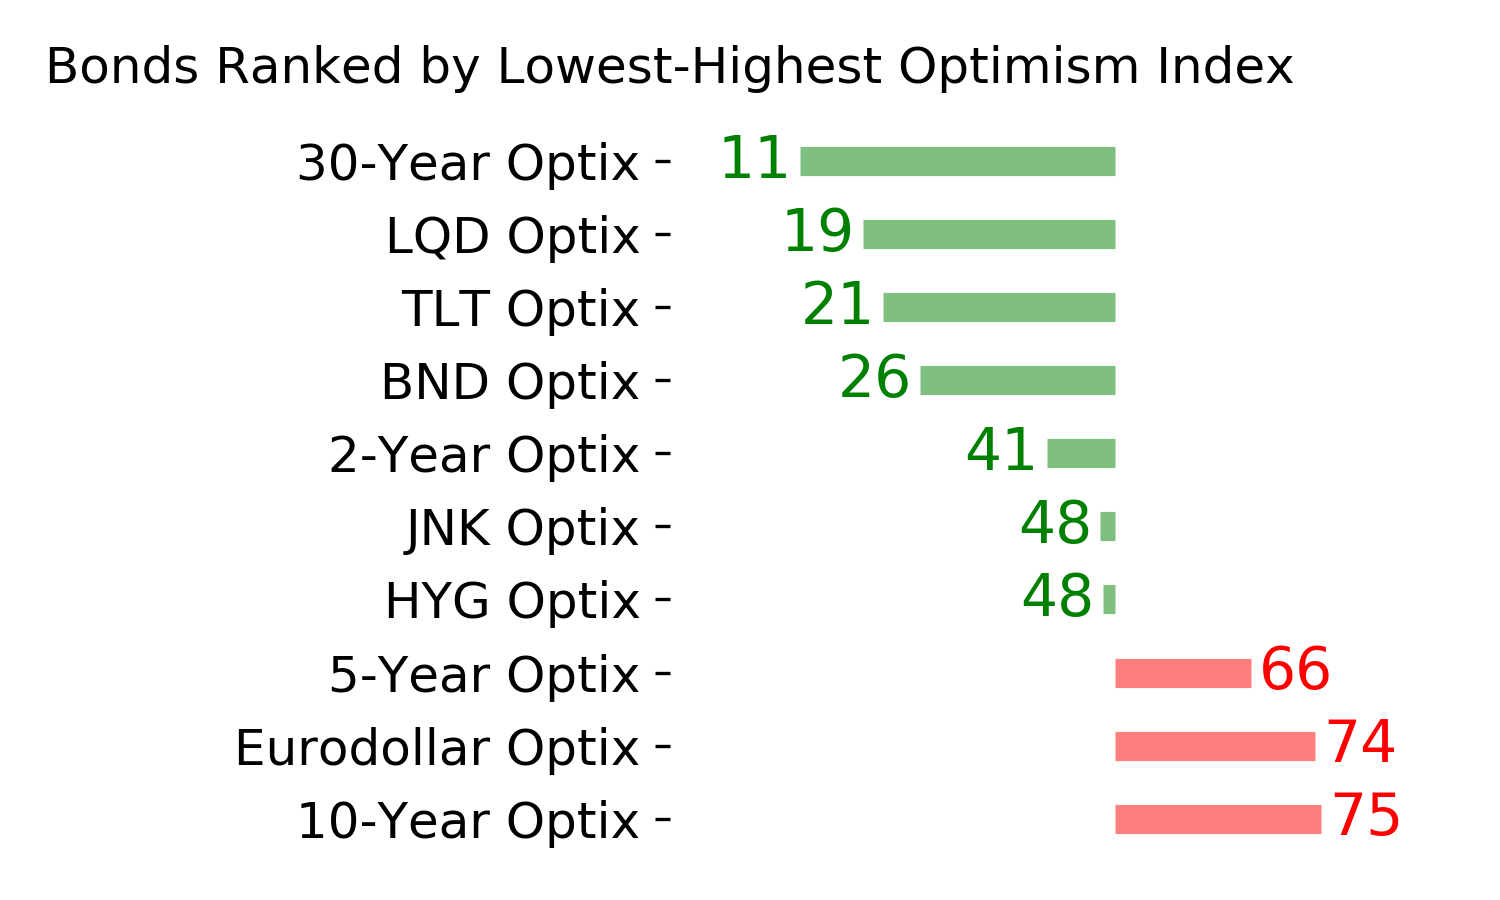
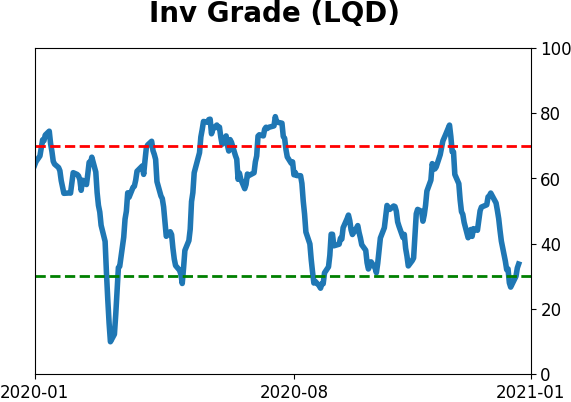
The WSJ pointed out that one of the few markets that has been struggling is investment-grade bonds. That certainly has been the case, as the 10-day average of the percentage of advancing bonds is just now trying to curl up from a very oversold condition.
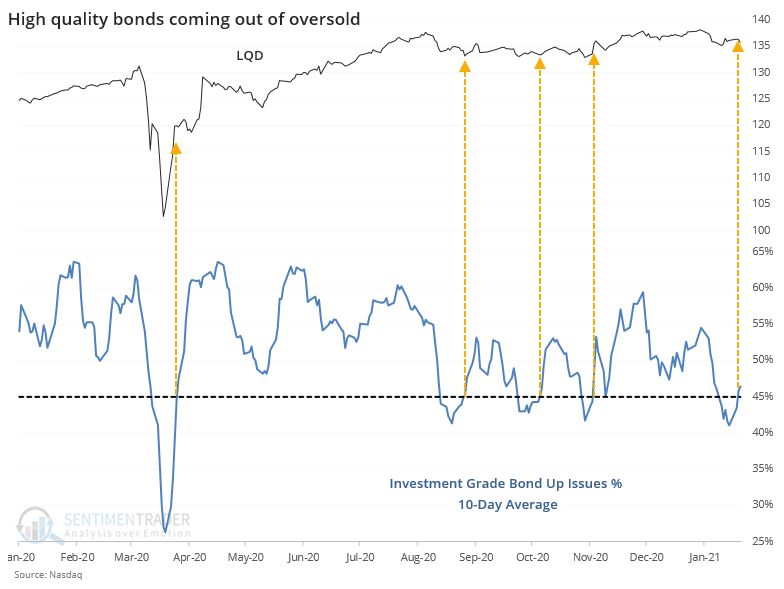
A recent reading near 40% is one of the lower ones in 15 years. The LQD fund did tend to rise going forward but its average return was a bit below average. The biggest positive was that these signals triggered when coming out of oversold conditions, so forward losses tended to be limited.
| COMMODITIES |
 |
|
|
Last week, we saw more potential positives for energy and related stocks. Jay discussed a basic options strategy that can be a good way to capitalize on a directional bet without risking much capital. For those new to the options market, it's an excellent introduction.
The purpose of a stock replacement strategy is captured in the name – instead of buying shares of stock a trader buys a call option. Let's illustrate this with an example. As always, the trade example I am going to use is just that – an example – and NOT a "recommendation."
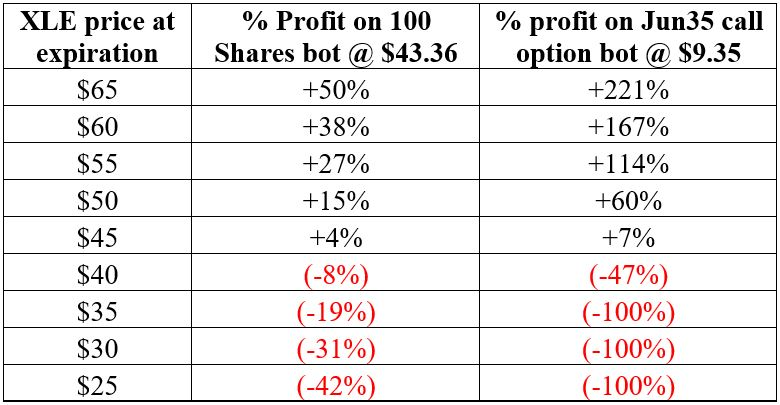
The energy sector has finally started to bounce back from its long downward trend of late. So, let's suppose a trader believes that the energy sector as a whole will advance between now and the end of April. The most straightforward approach would be to buy 100 shares of stock. At the time of publication, XLE (SDPR Energy ETF) was trading at $43.36 a share. So, to buy 100 shares of XLE a trader would put up $4,336. The risk "curve" for this position would be a straight line.
Now let's consider a stock replacement position. The trader expects a move by the end of April. April XLE options expire on April 16, so the next available expiration month is June. For the purposes of this strategy, we want to look for an in-the-money call option with a reasonable bid/ask spread.
Now let's compare P/L possibilities for these two trades.
The primary advantage of the stock replacement strategy is that if done properly it:
- Can allow you to achieve roughly the same dollar return as a stock share position at a fraction of the cost.
- Also allows you to limit your risk in a worst-case scenario.
Among the disadvantages:
- In-the-money options are often thinly traded which can result in large bid/ask spreads.
- When option expiration rolls around you either have to get out or you have to pay another premium to maintain a position.
- You do not receive any dividends holding a call option.
Active Studies
| Time Frame | Bullish | Bearish | | Short-Term | 0 | 0 | | Medium-Term | 2 | 2 | | Long-Term | 15 | 2 |
|
Indicators at Extremes
Portfolio
| Position | Description | Weight % | Added / Reduced | Date | | Stocks | 10.6% VWO, 10.1% XLE, 8.5% RSP, 8.3% PSCE | 37.5 | Added 3% | 2021-01-05 | | Bonds | 10% BND, 10% SCHP, 10% ANGL | 27.8 | Reduced 0.1% | 2020-10-02 | | Commodities | GCC | 2.3 | Reduced 2.1%
| 2020-09-04 | | Precious Metals | GDX | 9.8 | Added 4.8% | 2020-12-01 | | Special Situations | | 0.0 | Reduced 5% | 2020-10-02 | | Cash | | 22.6 | | |
|
Updates (Changes made today are underlined)
There hasn't been much that changed in recent weeks, with sky-high sentiment on many measures receding a bit, but that's not necessarily a good sign, just ask February 2020. We still have the lingering positives from all the breadth thrust last year, as late as October and November. Those have a very good historical record at preceding higher prices over a longer time frame. Of more immediate concern is the explosion in speculation in the most leveraged parts of the market. So far, that hasn't translated to price troubles, though there have been more oddities n the latter half of December than we'd seen since August, like the major indexes rising but on very poor breadth. I continue to avoid tech- and cap-heavy indexes, and don't see that changing any time soon. Energy stocks are doing what they should, and I added a bit more there. I'm not a momentum trader and do not focus on pyramiding positions in this account - it's more about protecting capital - but I like the setup on a long-term time frame. RETURN YTD: 3.7% 2020: 8.1%, 2019: 12.6%, 2018: 0.6%, 2017: 3.8%, 2016: 17.1%, 2015: 9.2%, 2014: 14.5%, 2013: 2.2%, 2012: 10.8%, 2011: 16.5%, 2010: 15.3%, 2009: 23.9%, 2008: 16.2%, 2007: 7.8%
|
|
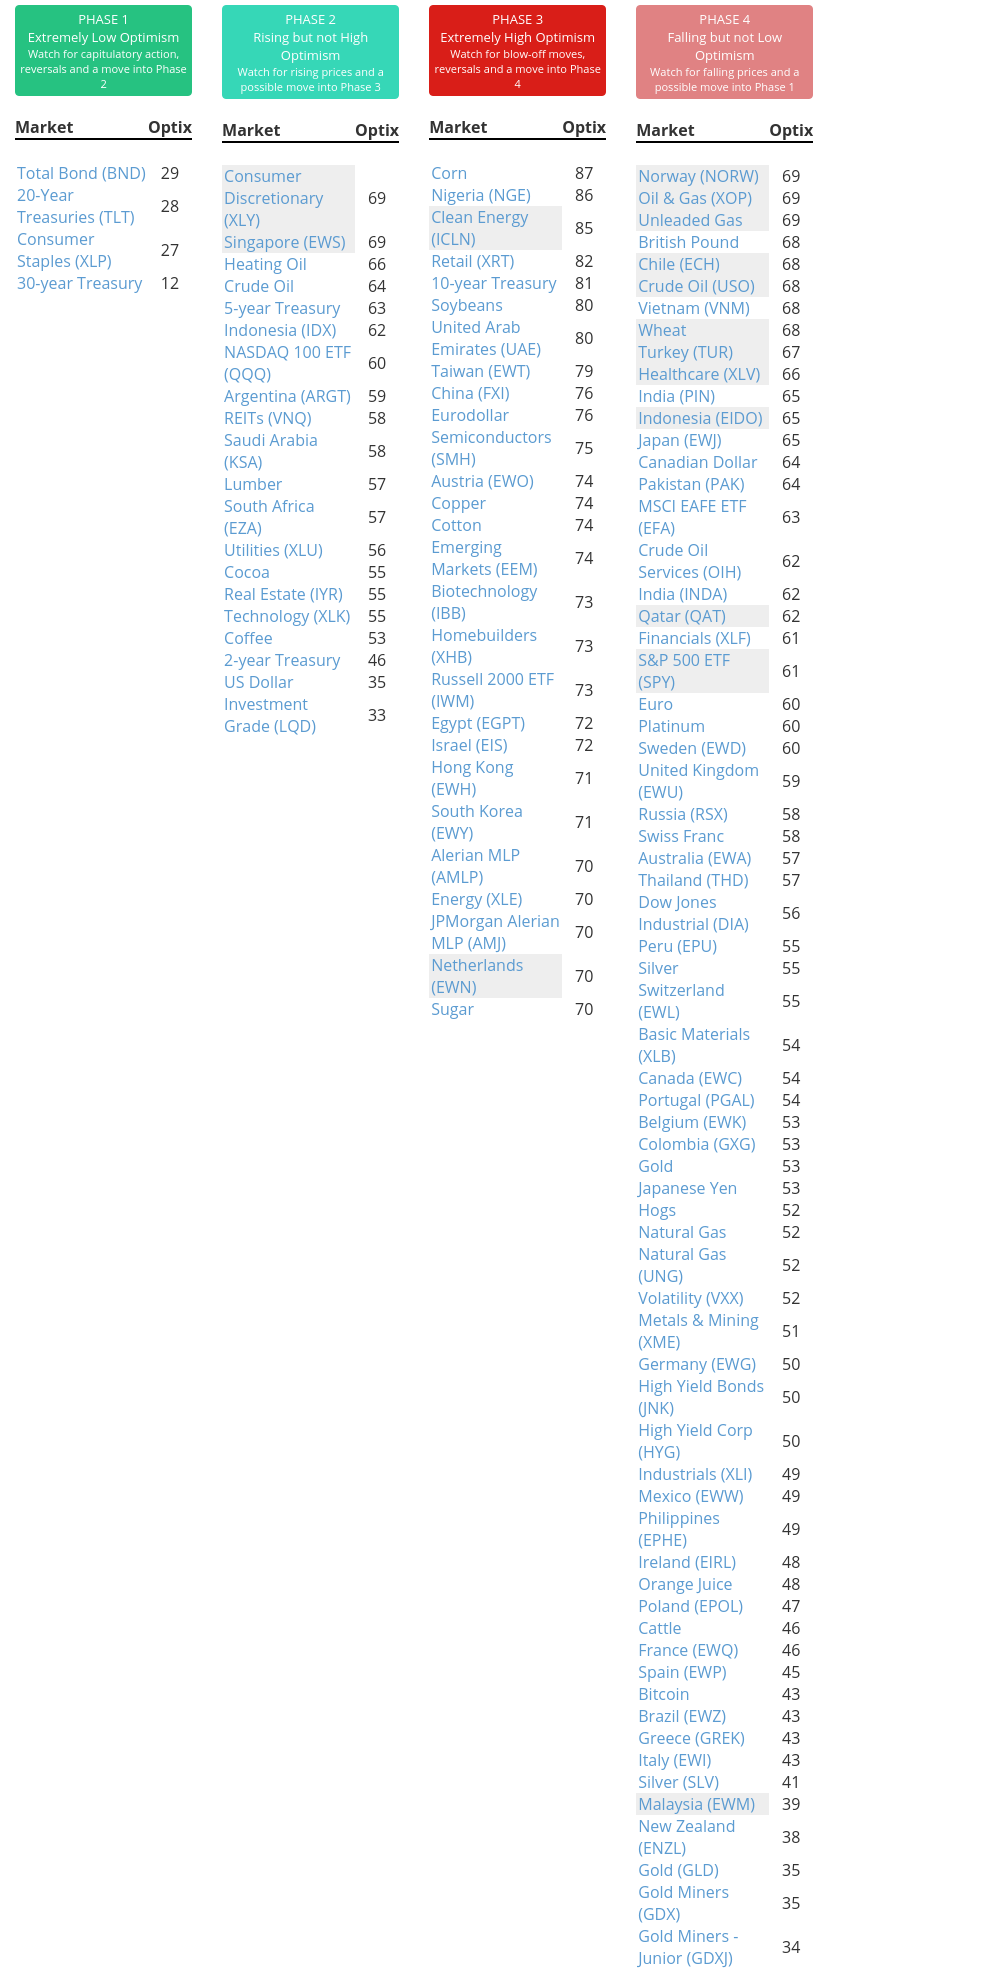
Phase Table
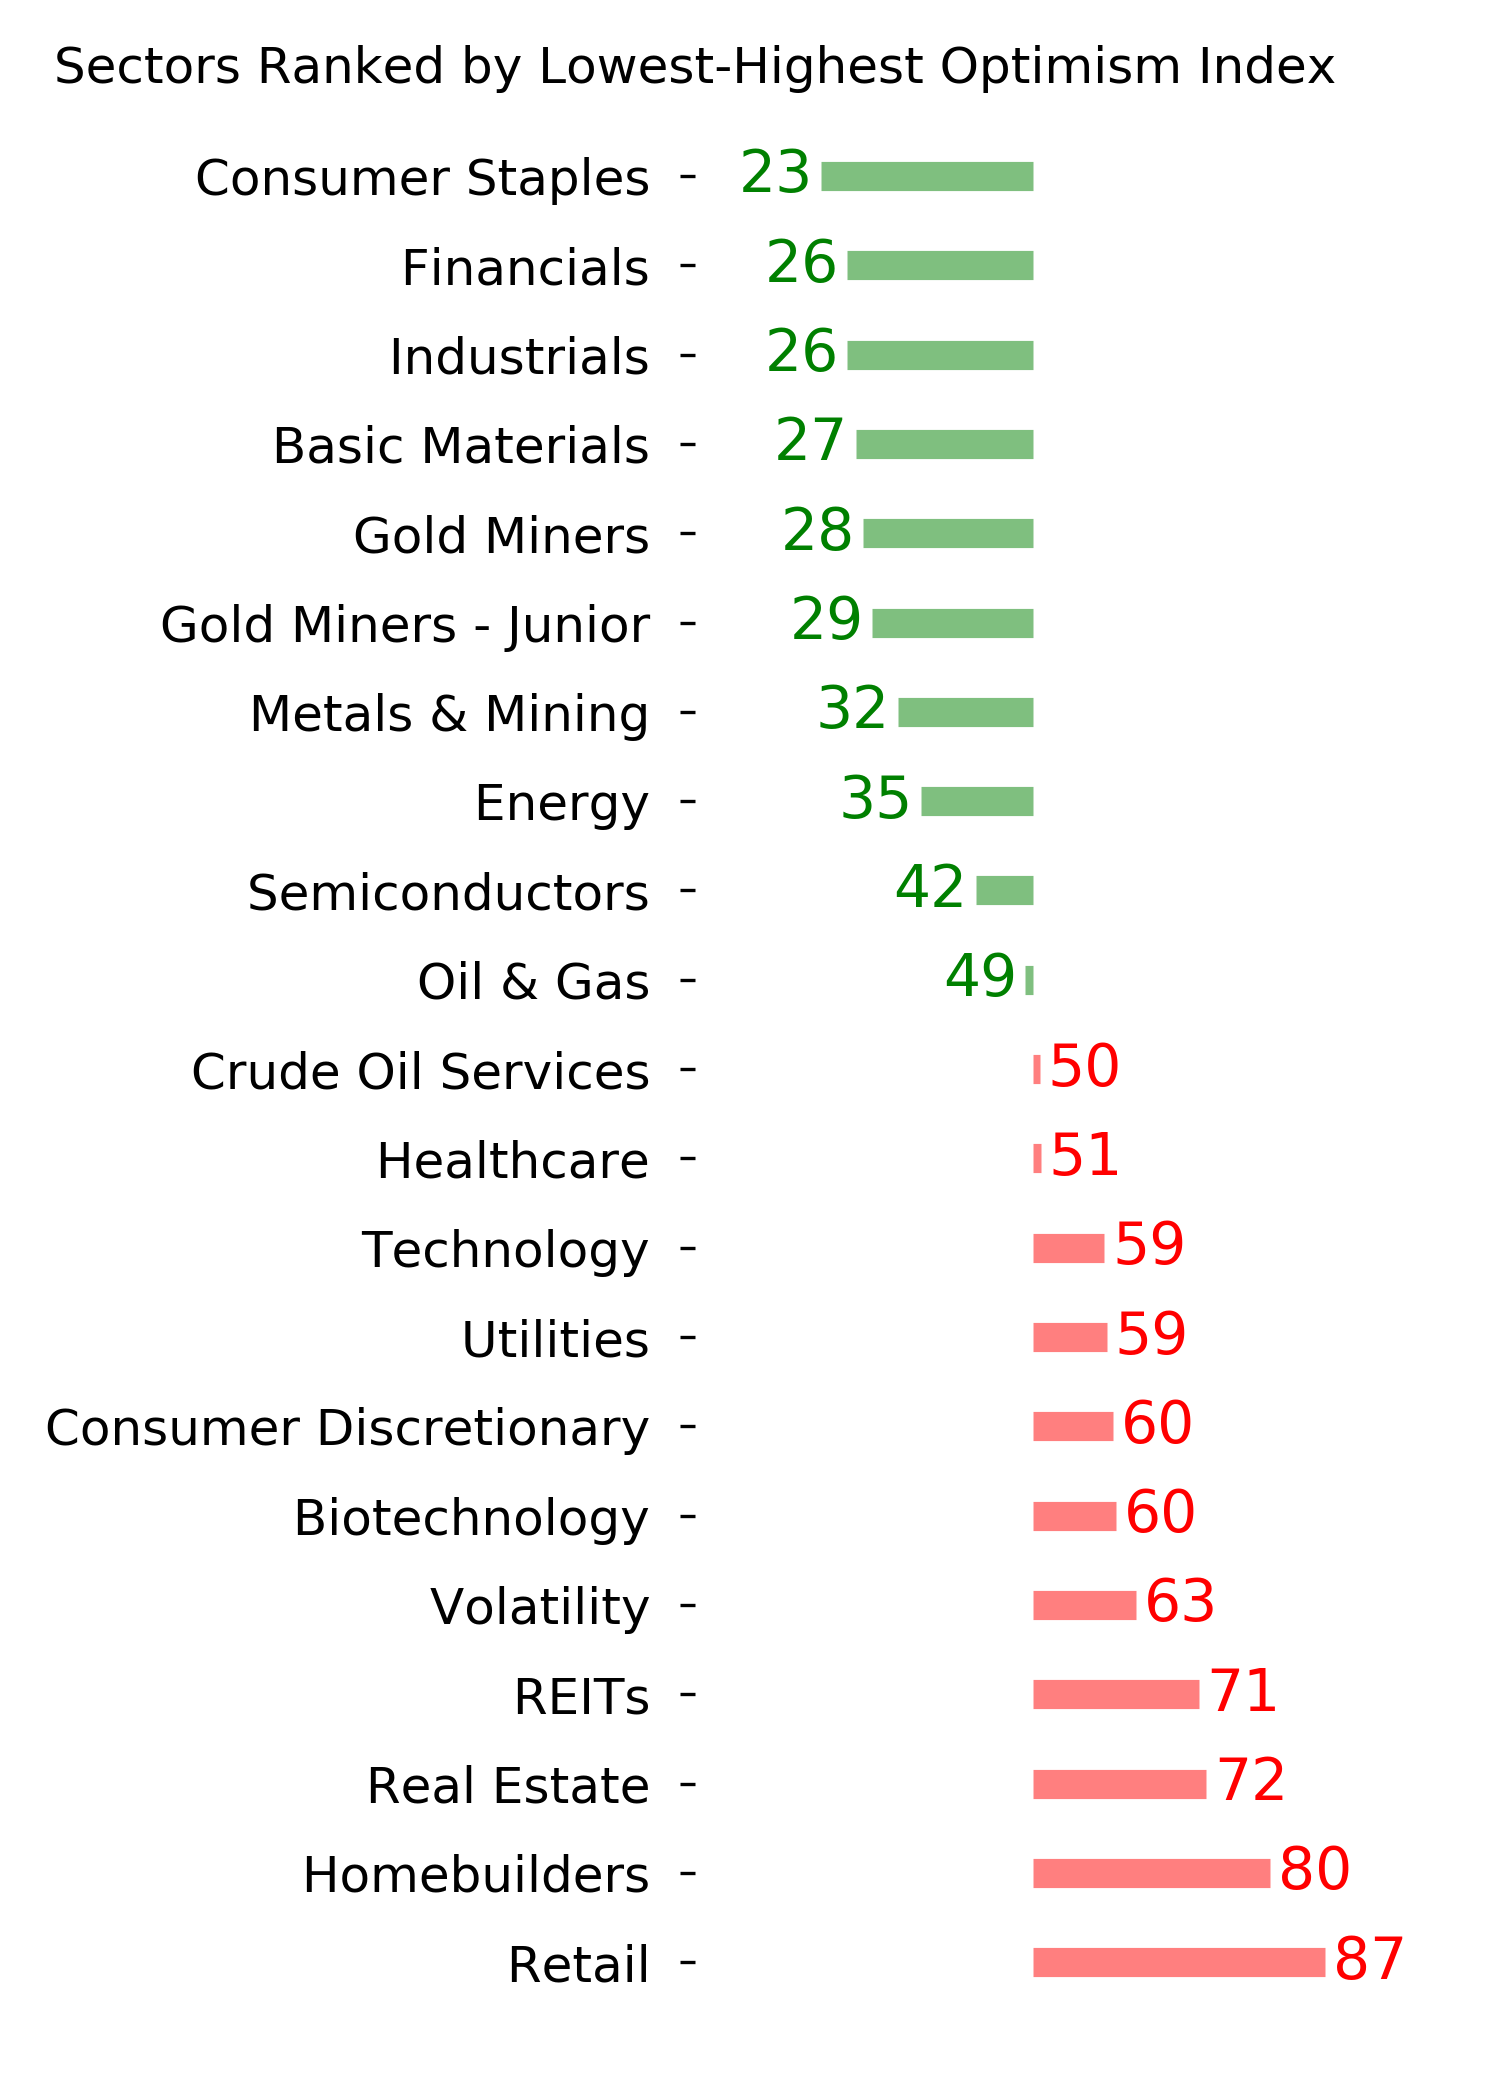
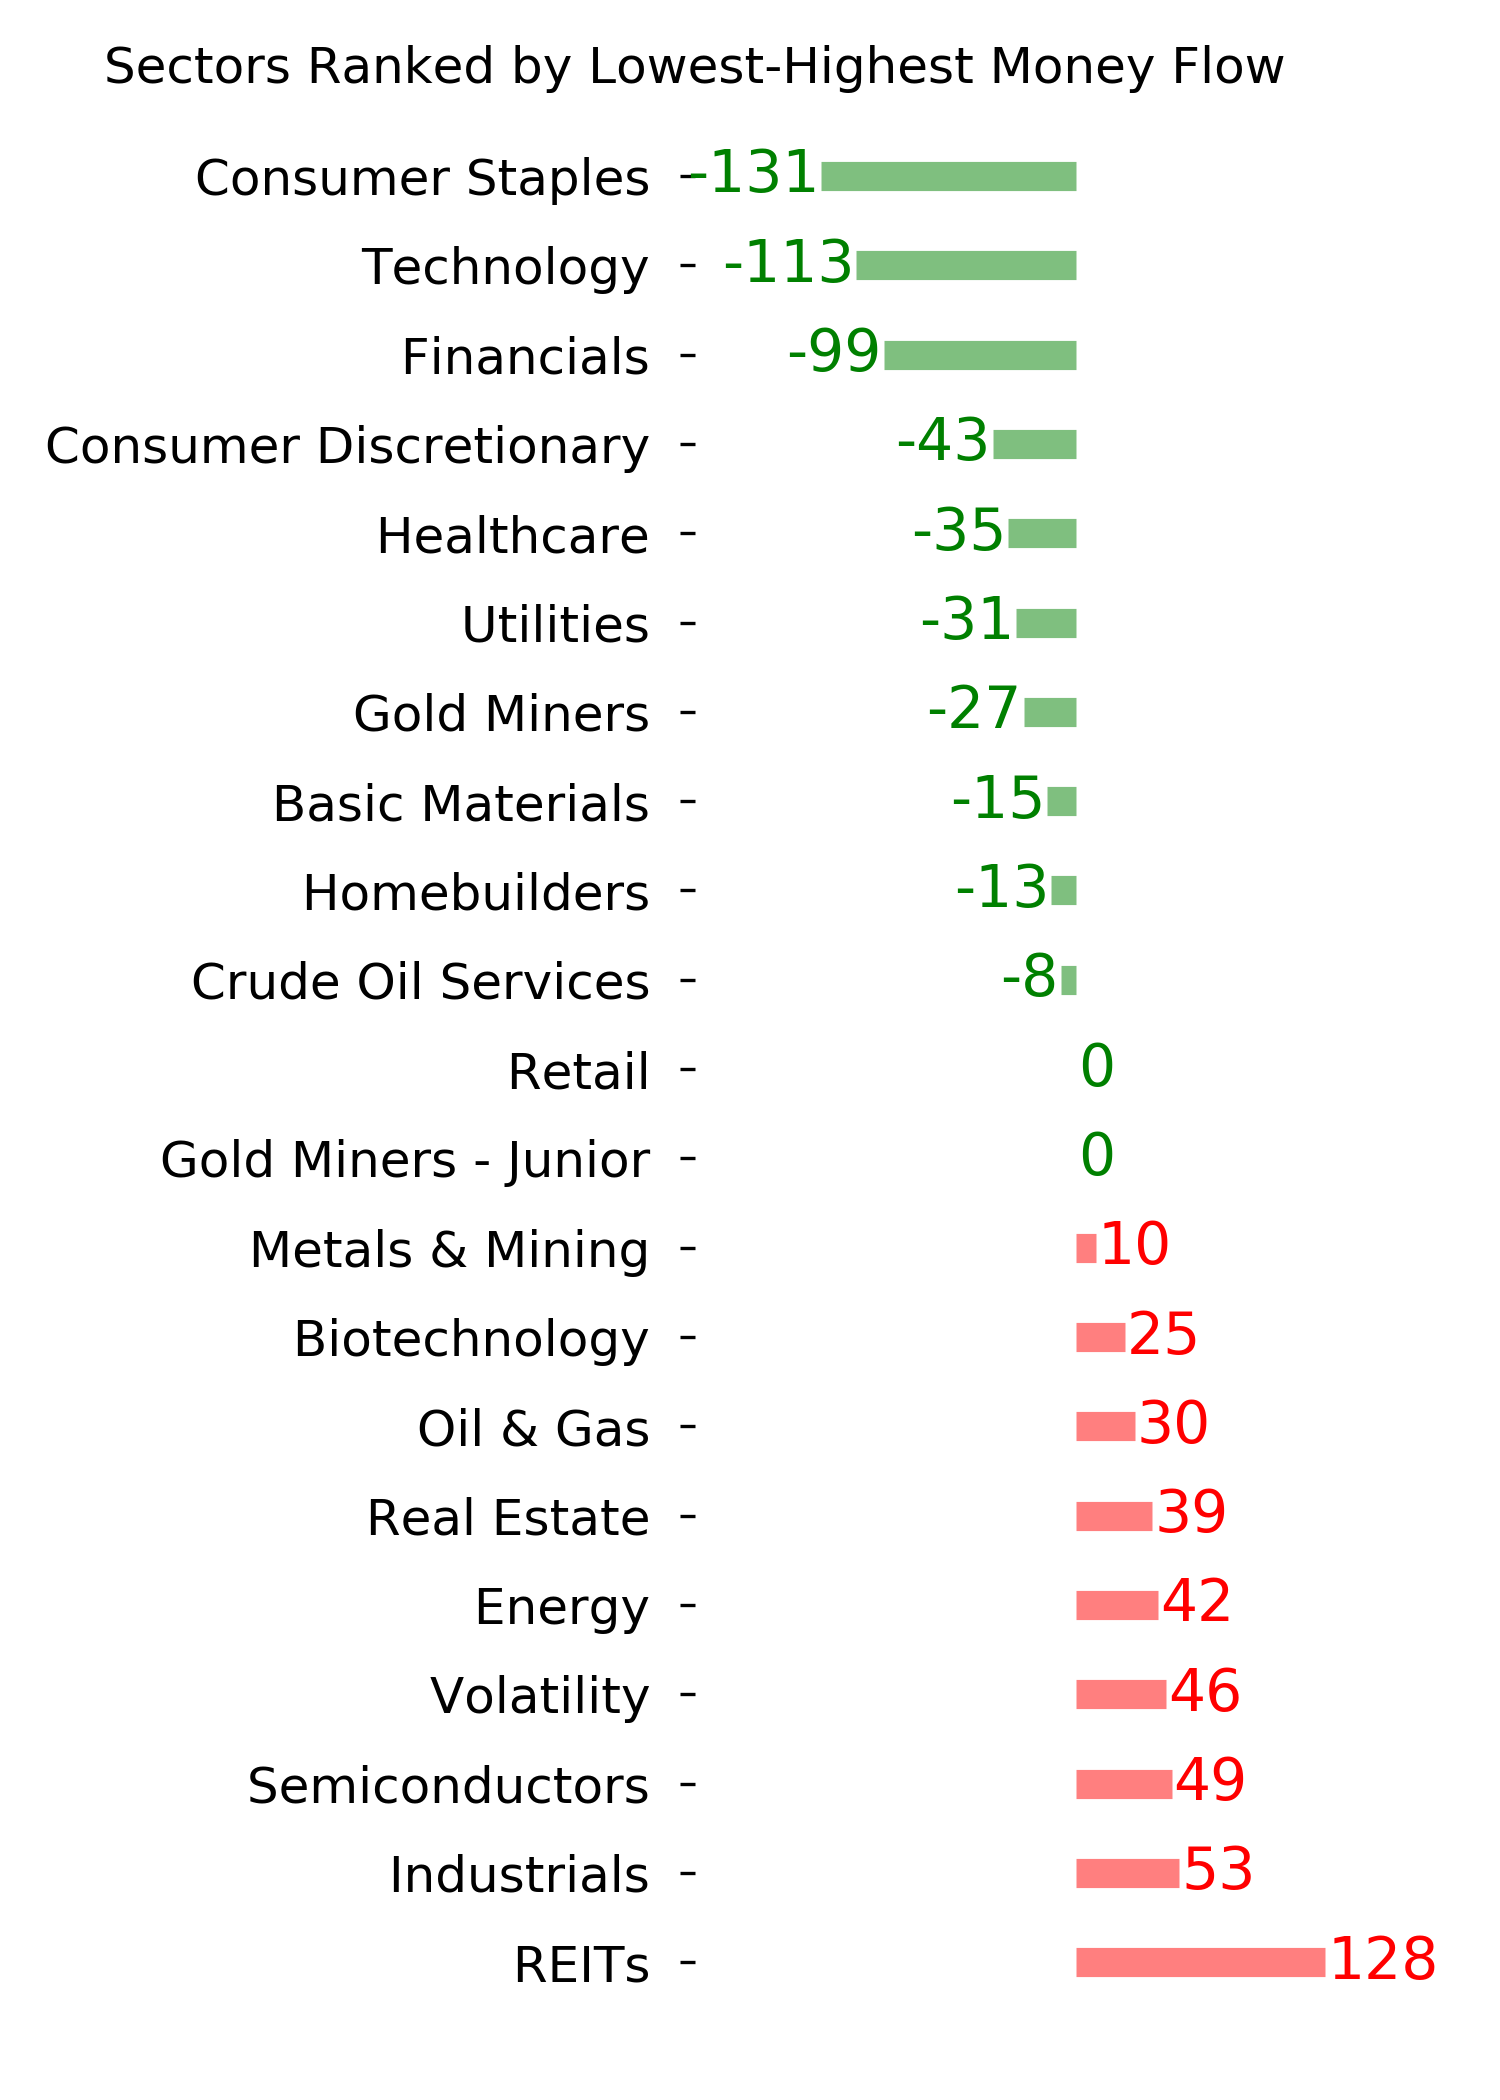
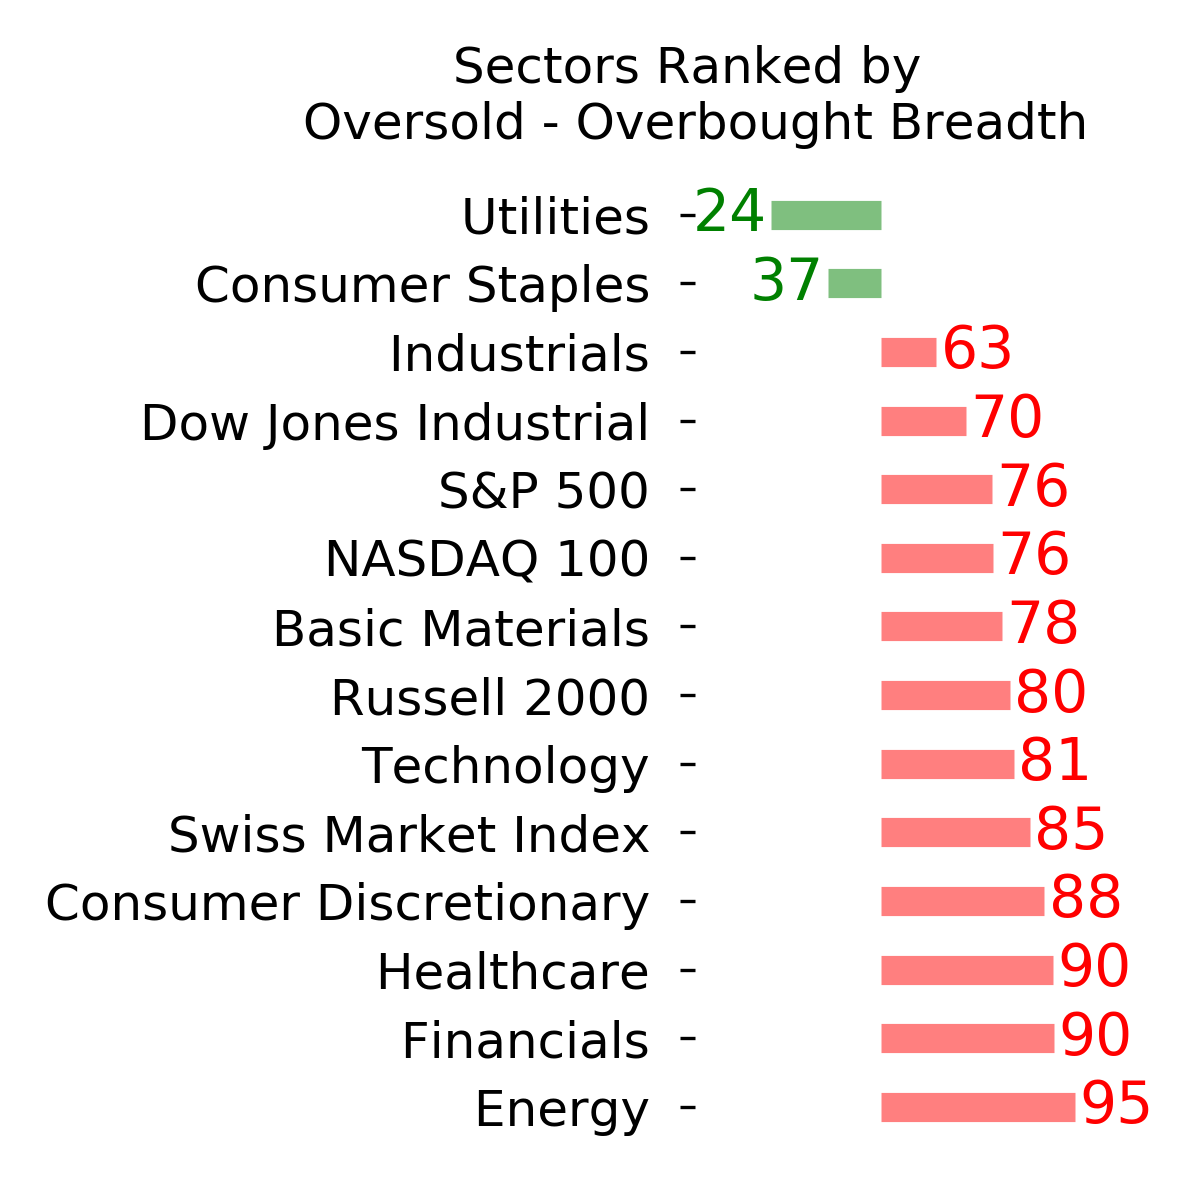
Ranks
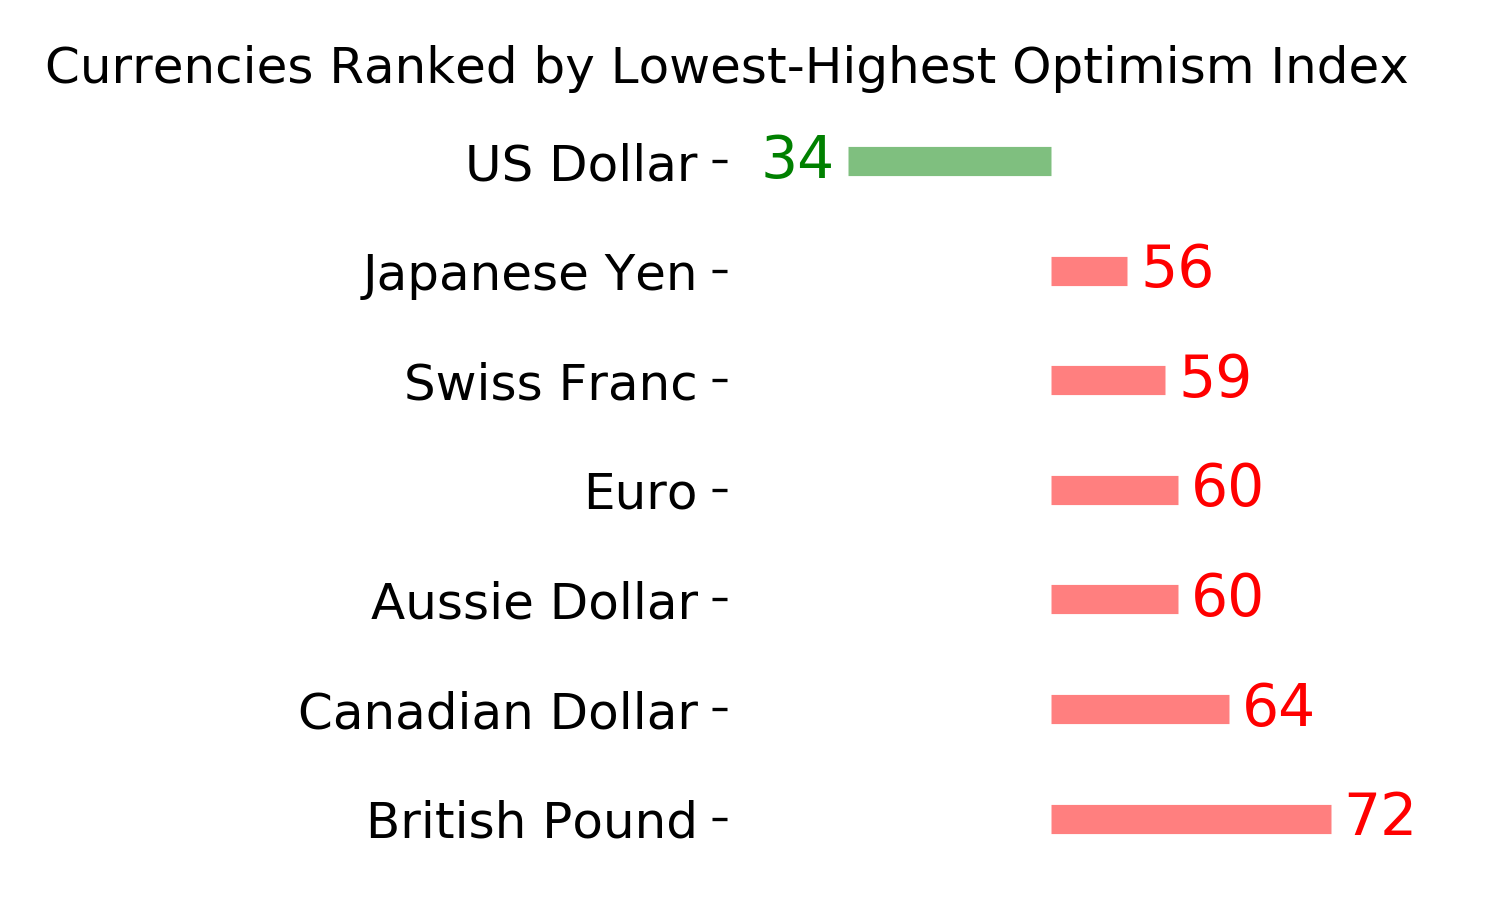
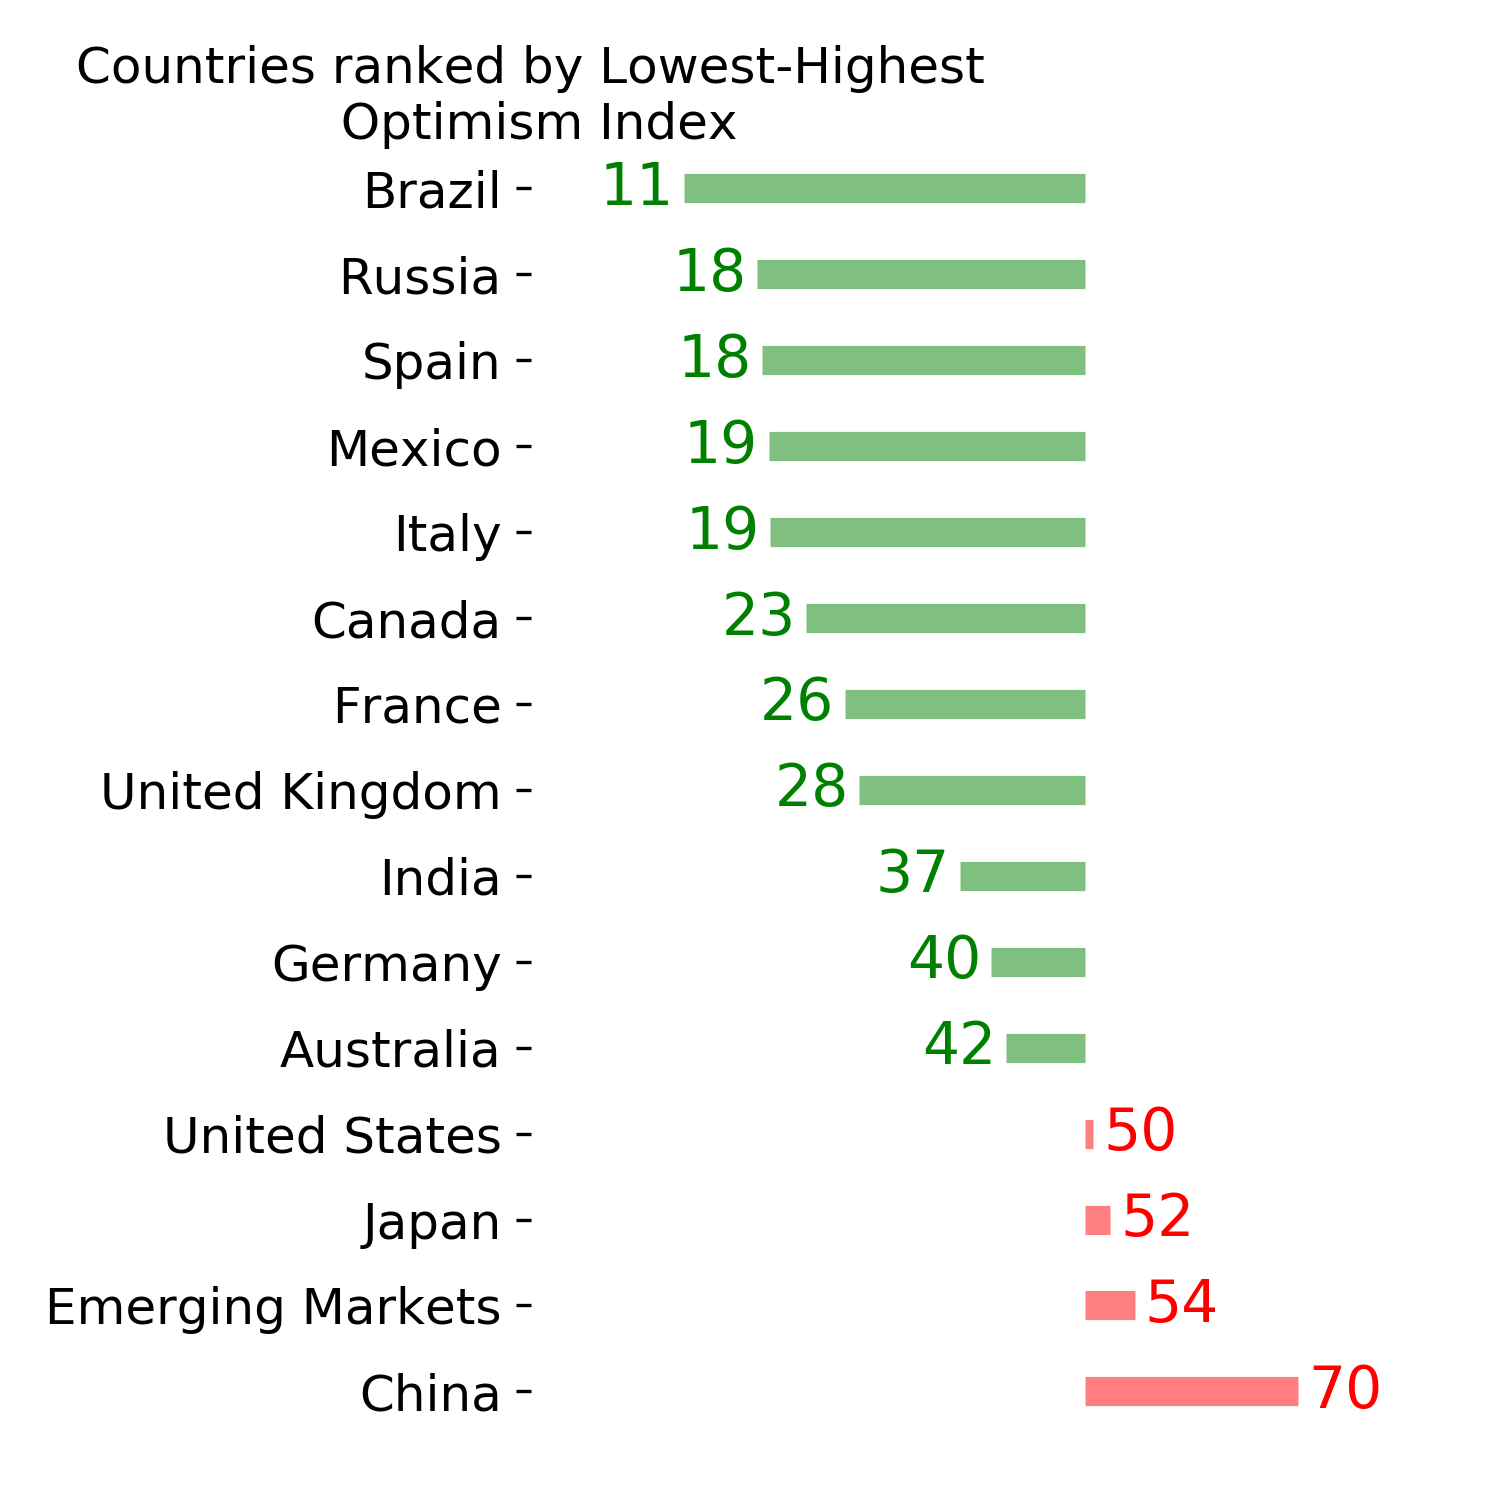
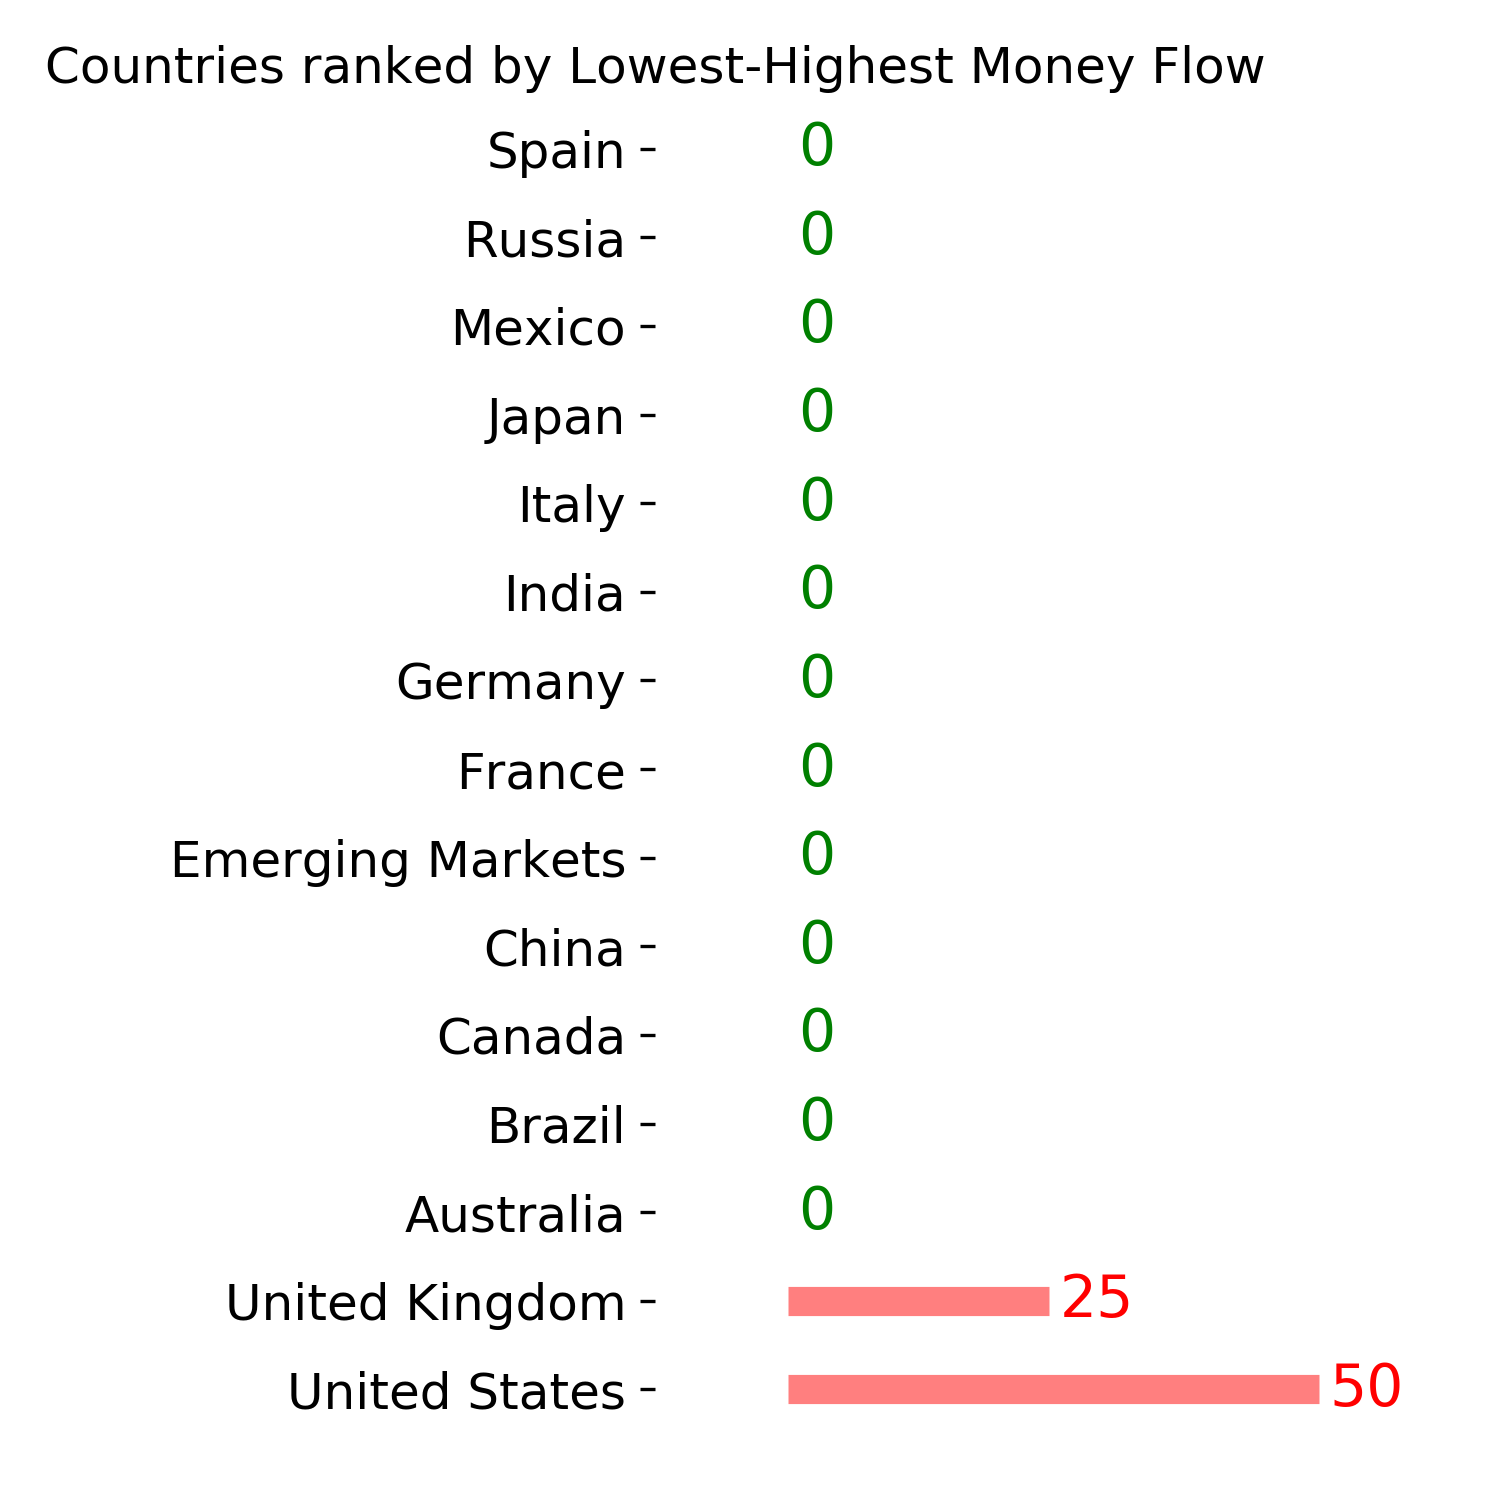
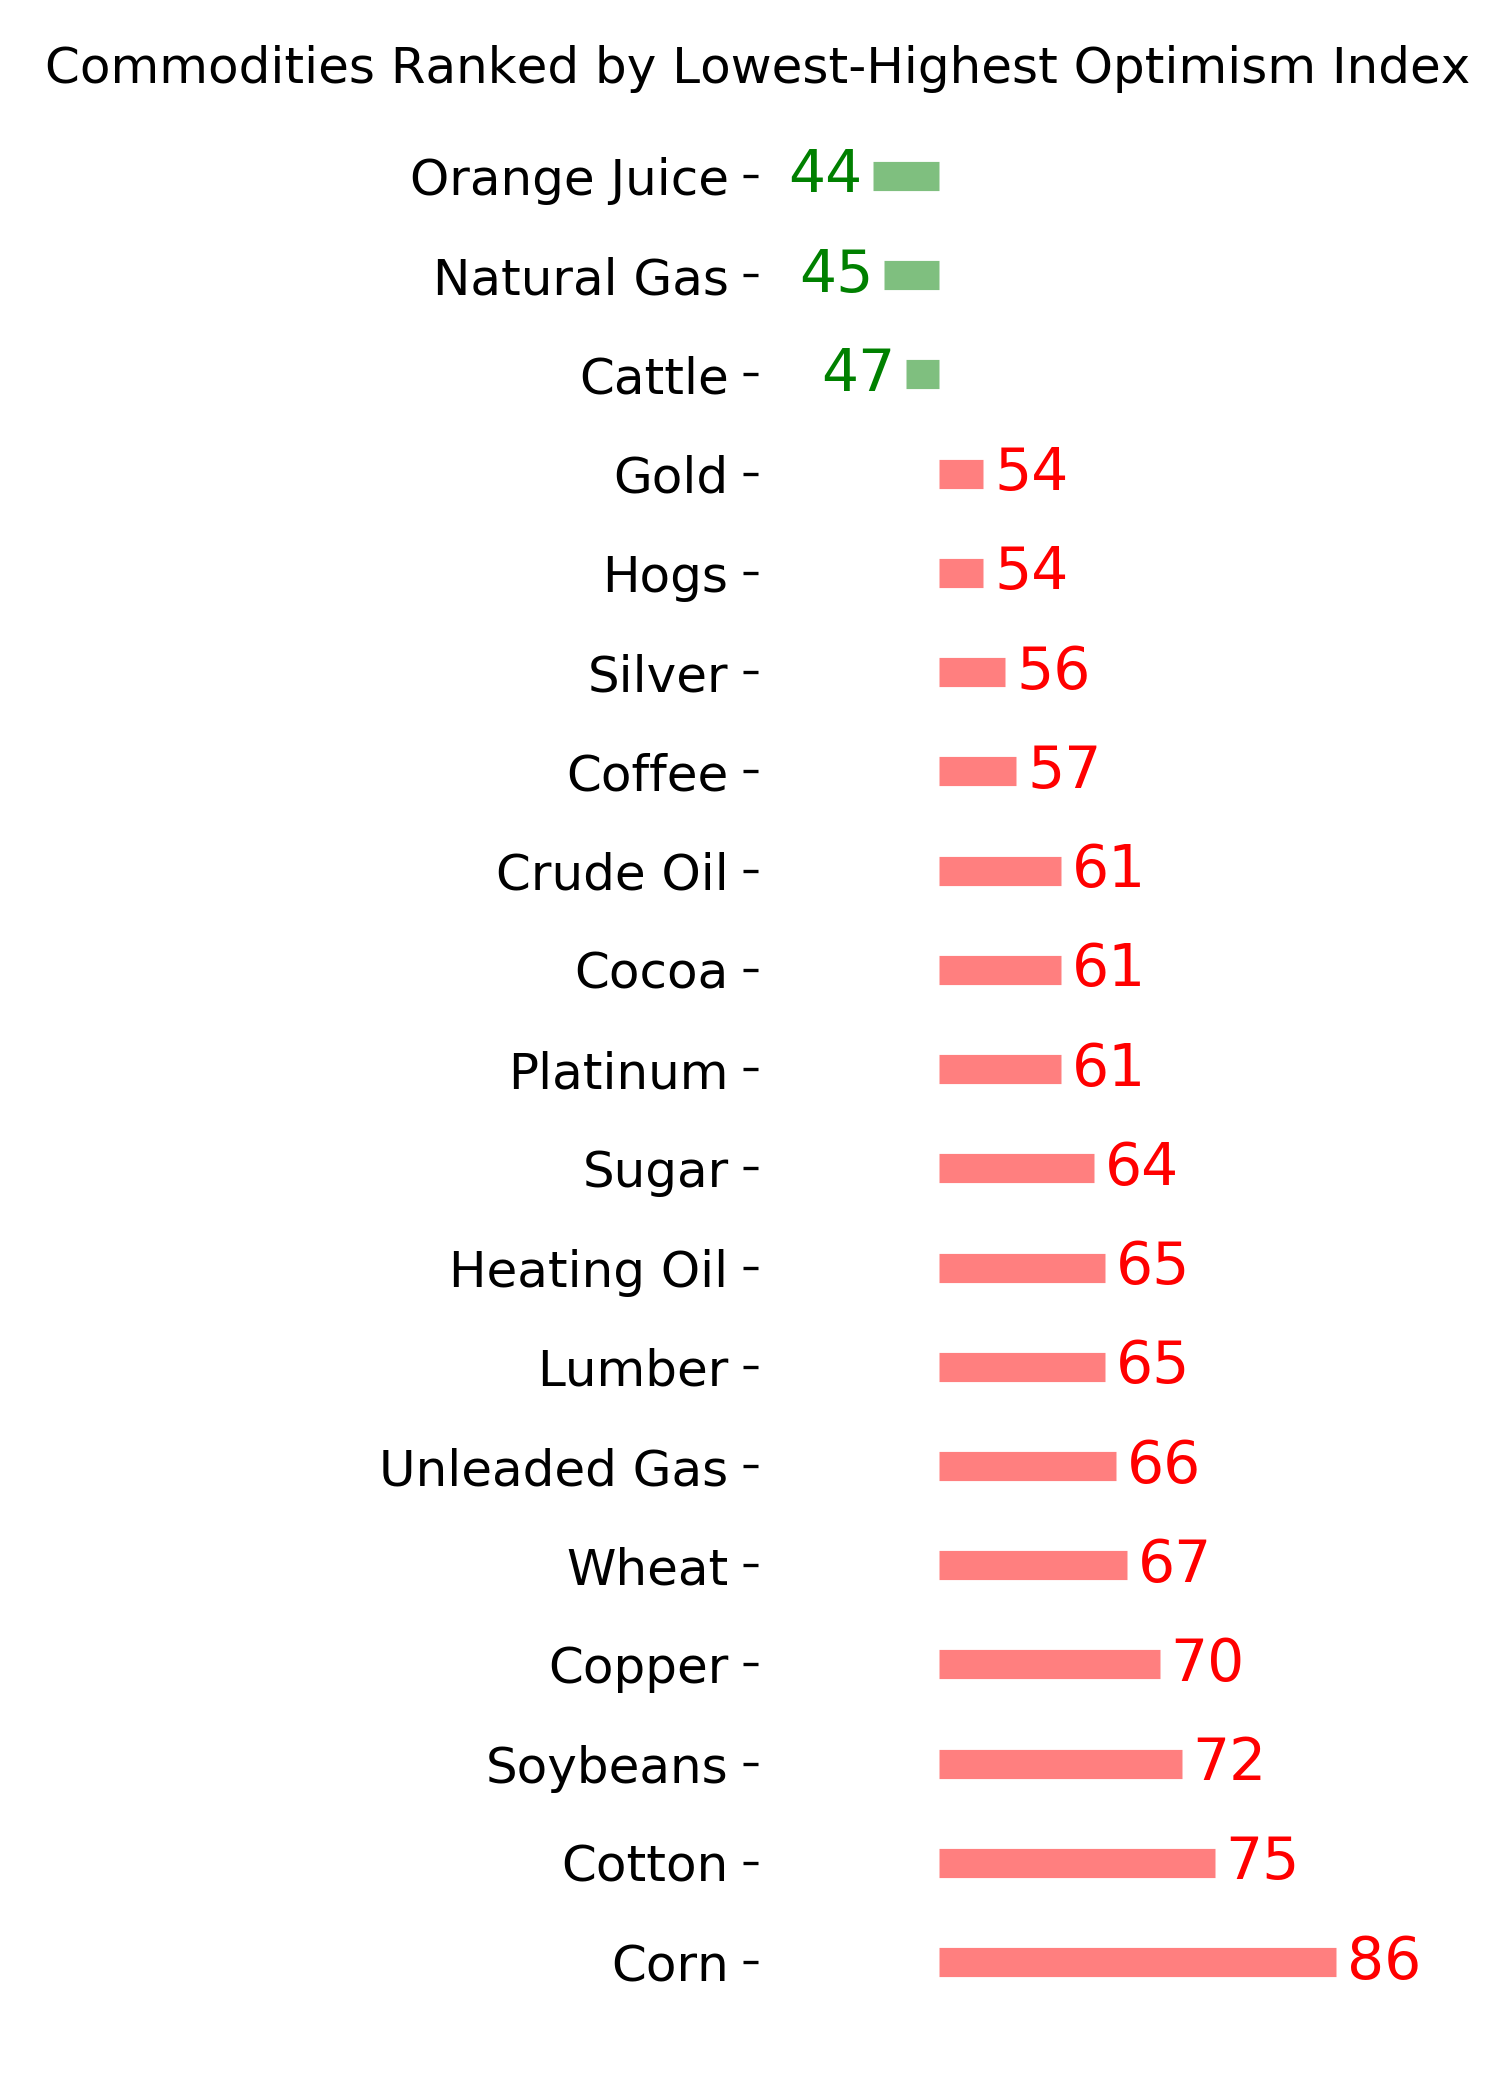
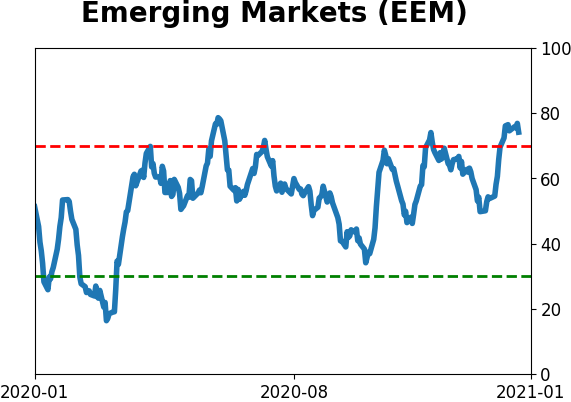
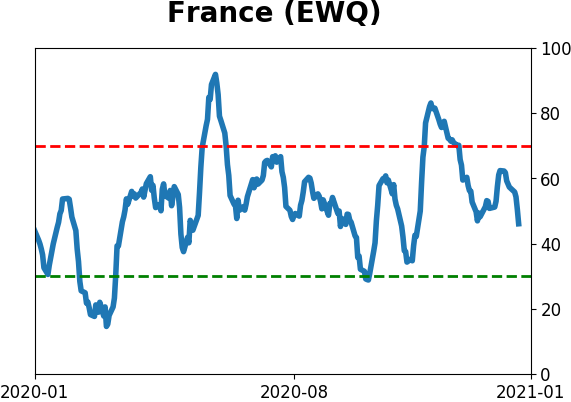
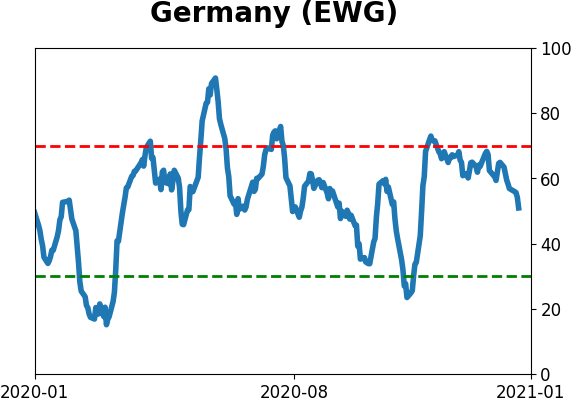
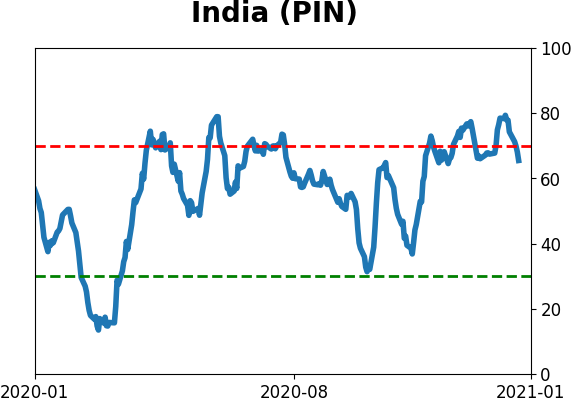
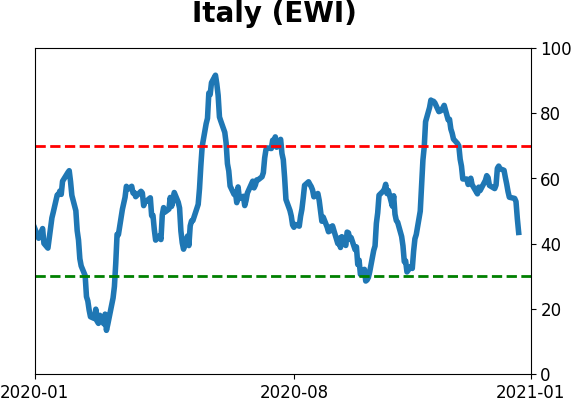
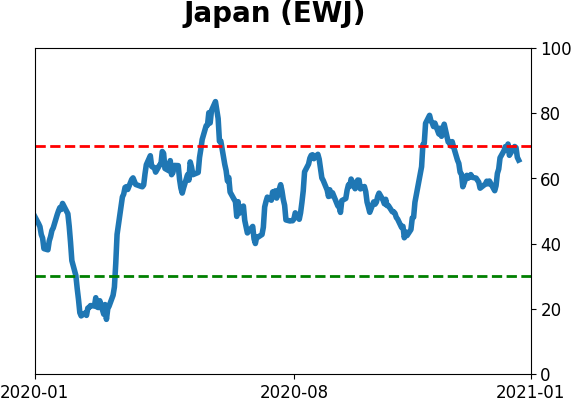
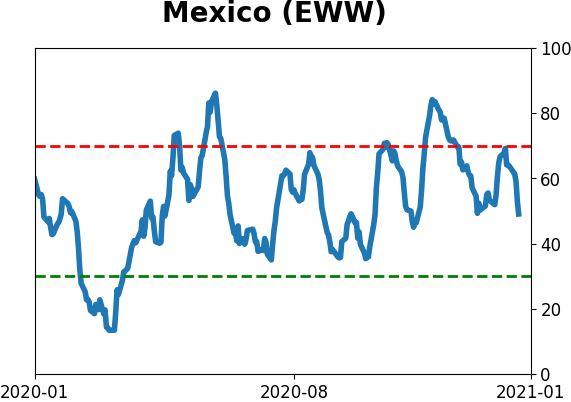
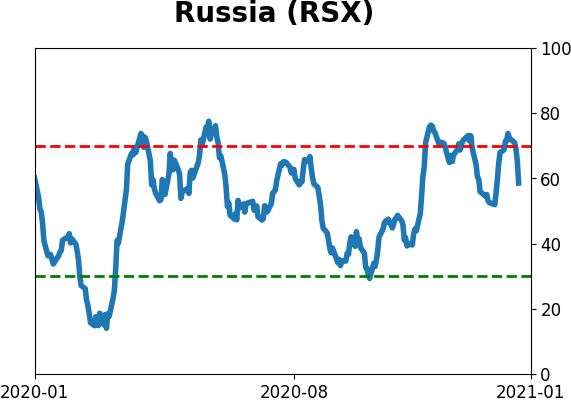
Sentiment Around The World
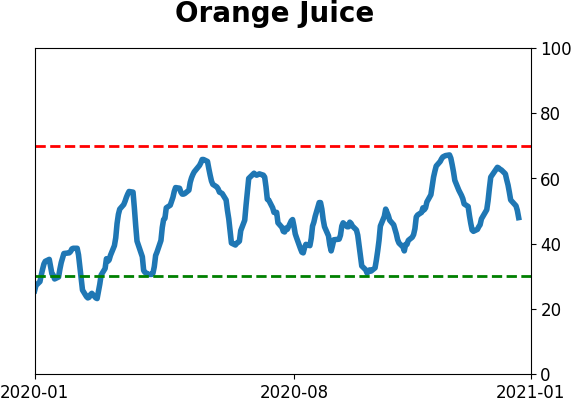
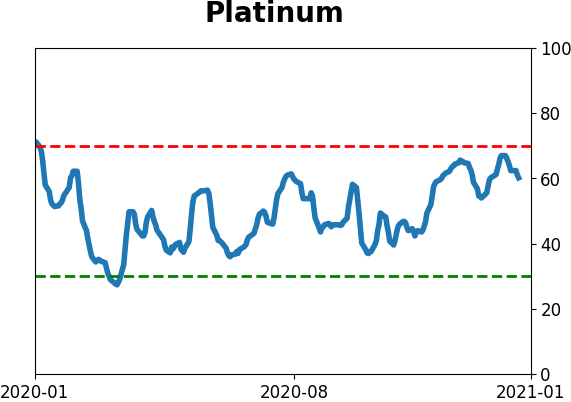
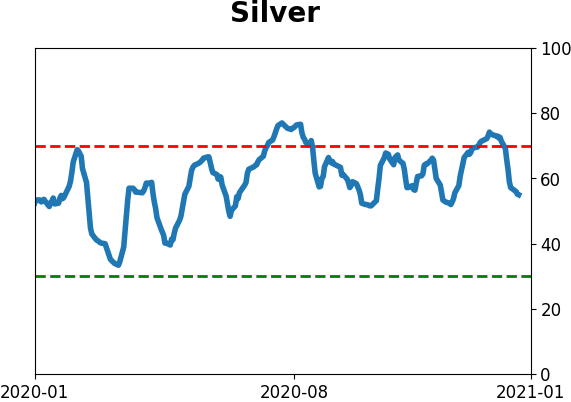
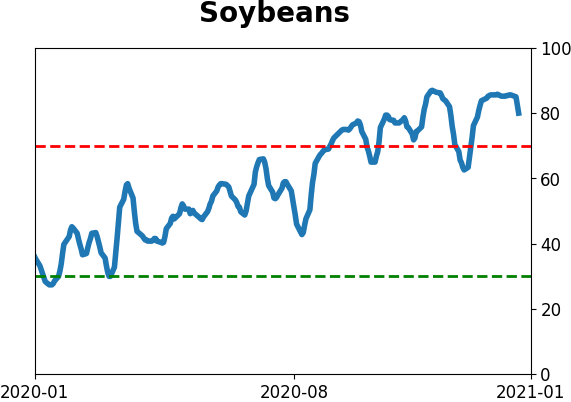
Optimism Index Thumbnails
|
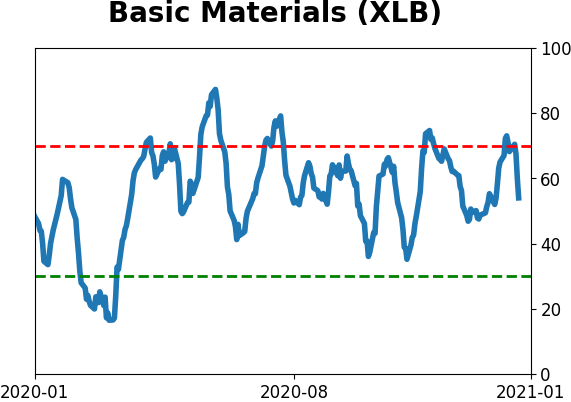
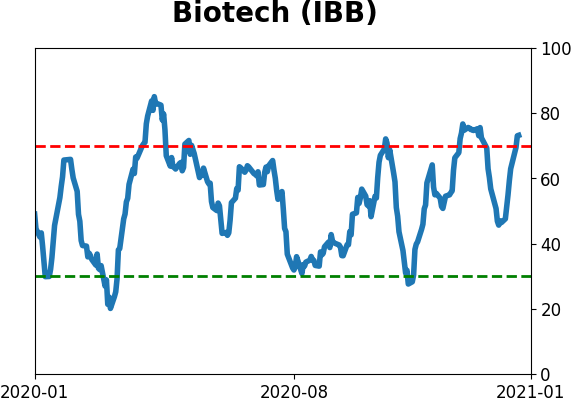
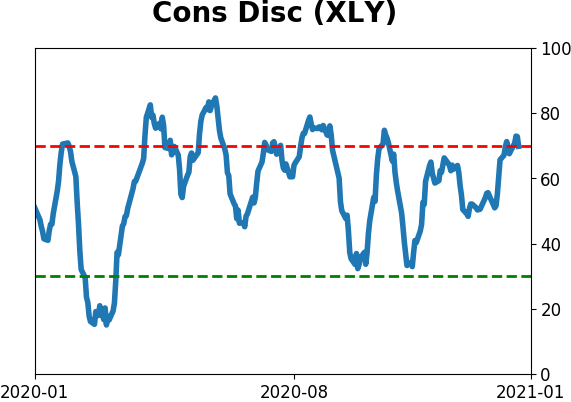
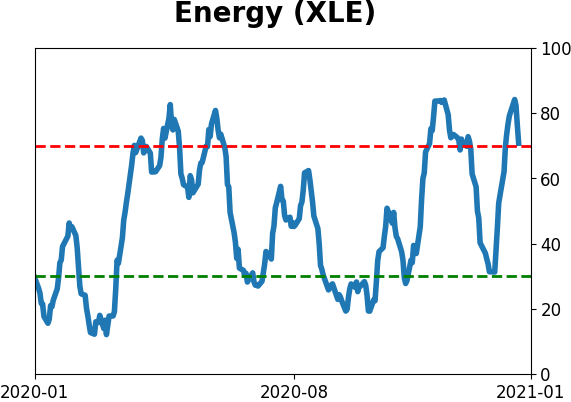
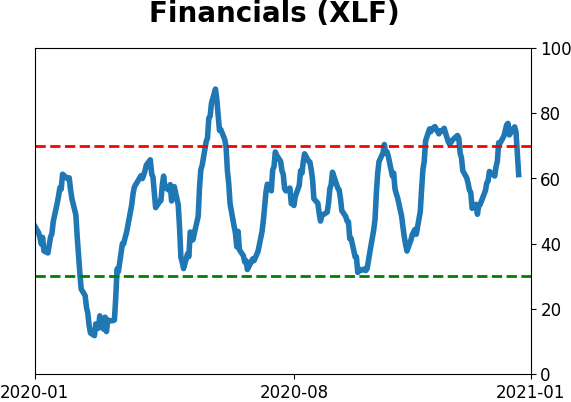
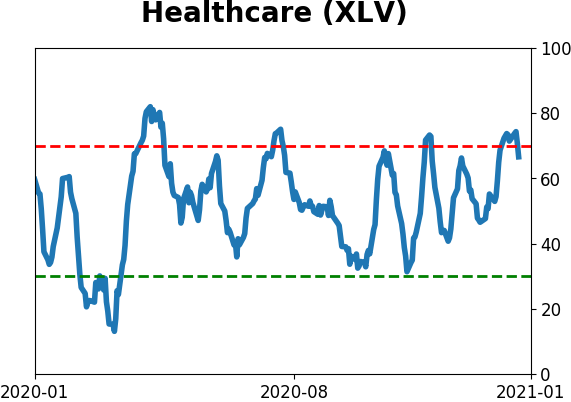
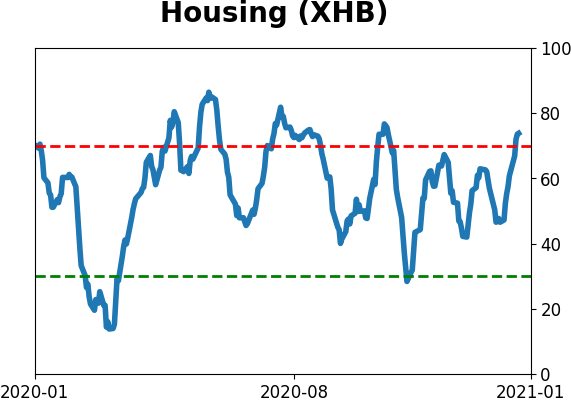
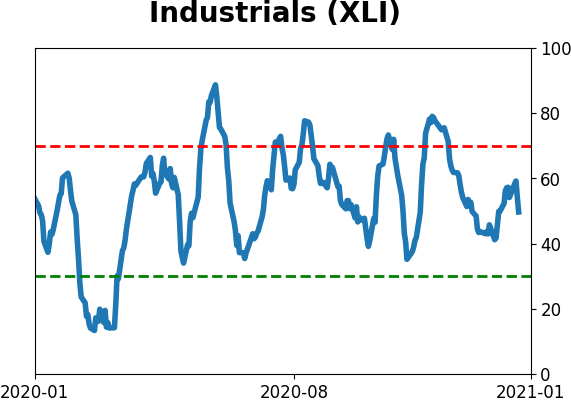
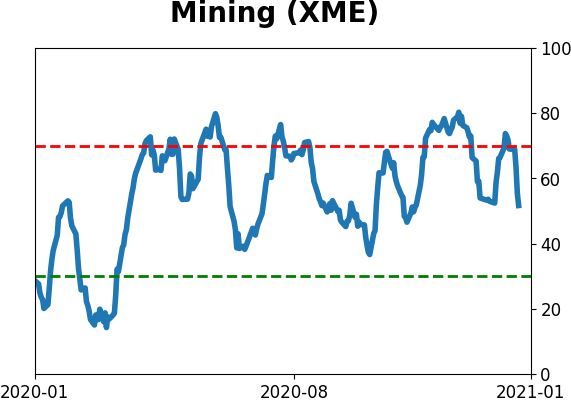
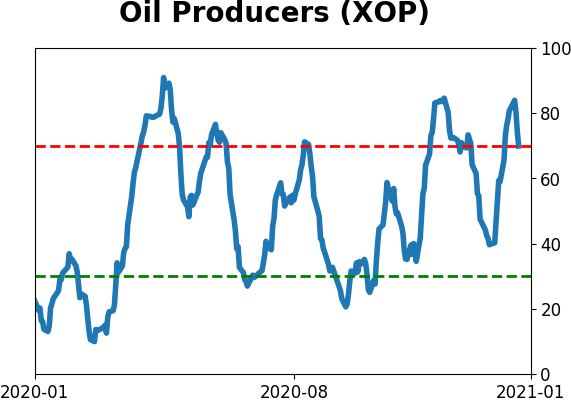
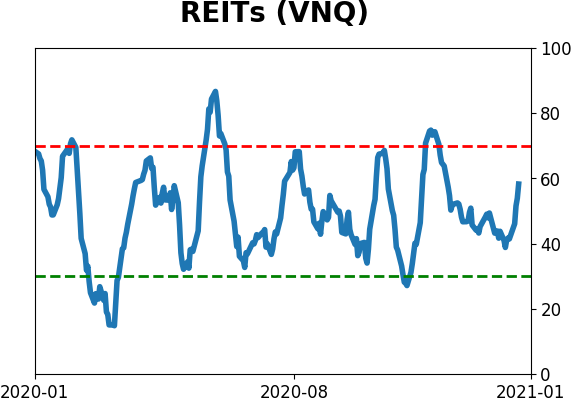
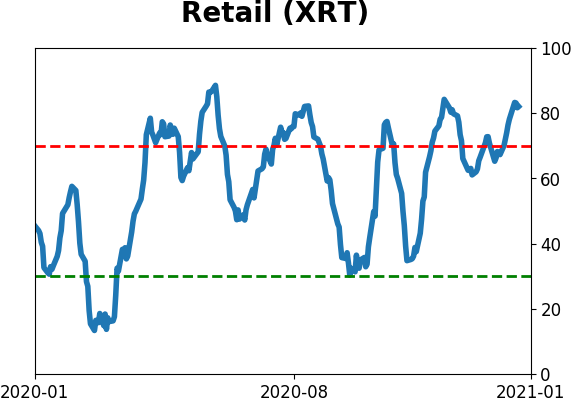
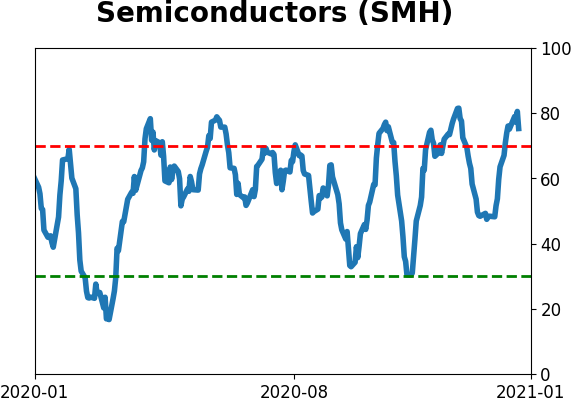
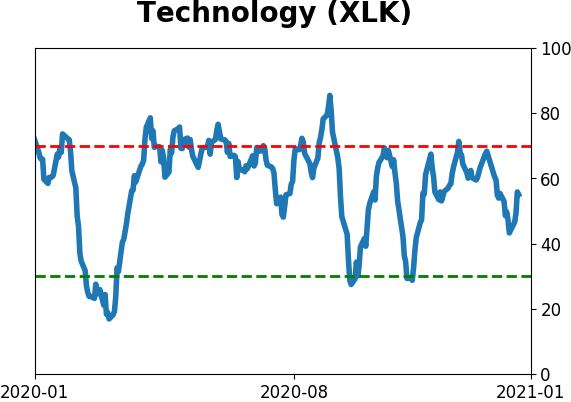
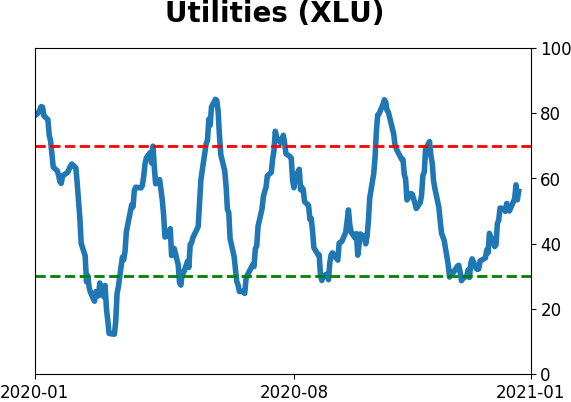
Sector ETF's - 10-Day Moving Average
|
|
|
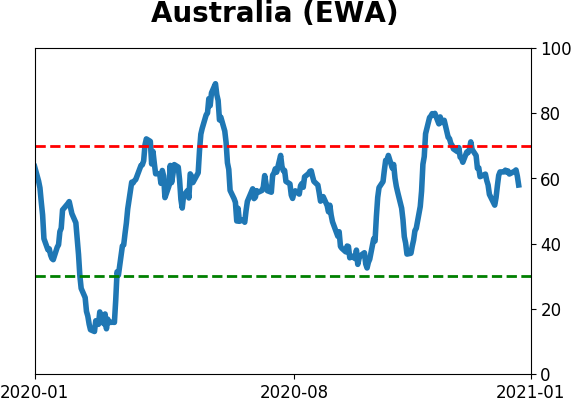
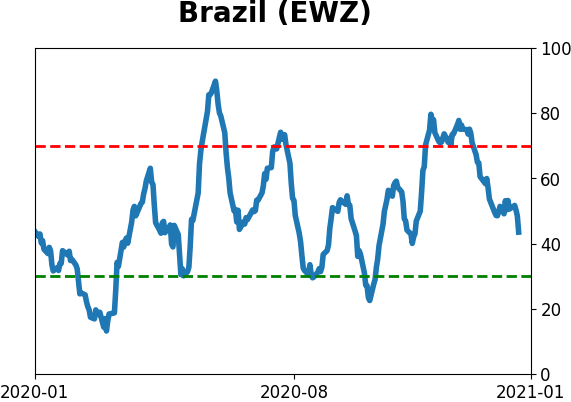
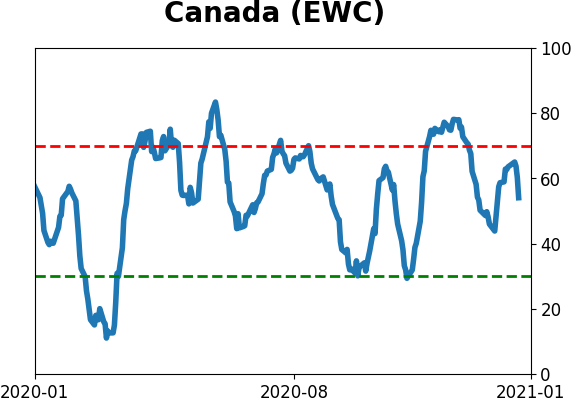
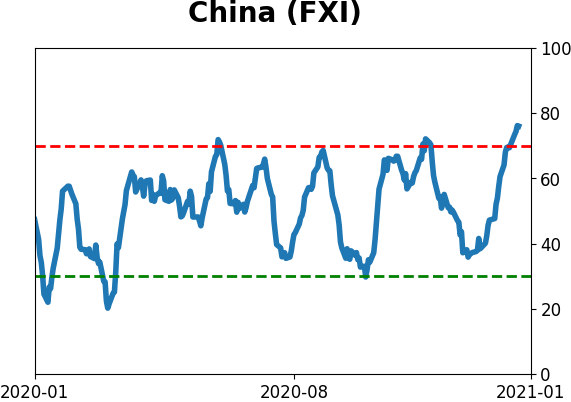
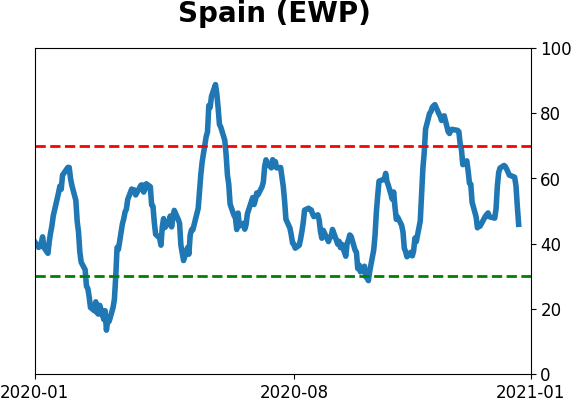
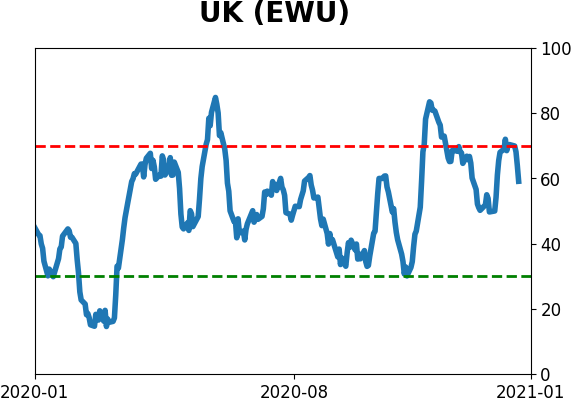
Country ETF's - 10-Day Moving Average
|
|
|
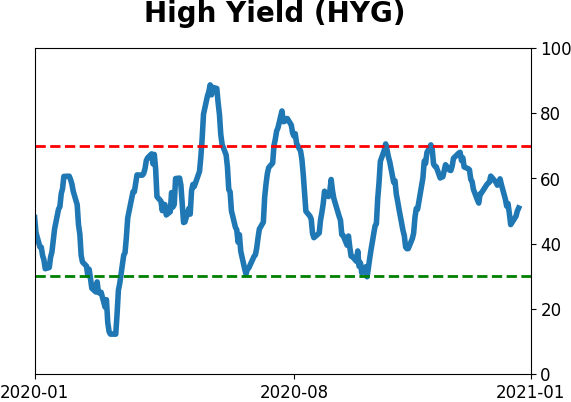
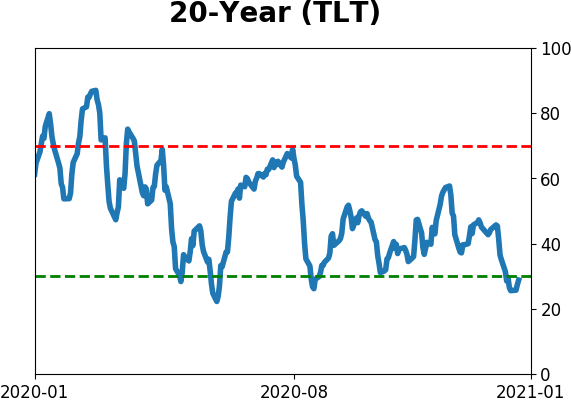
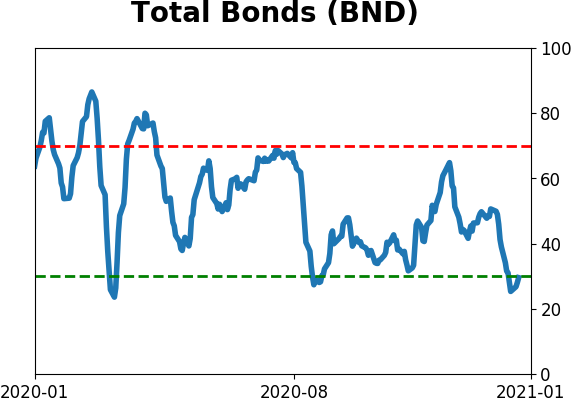
Bond ETF's - 10-Day Moving Average
|
|
|
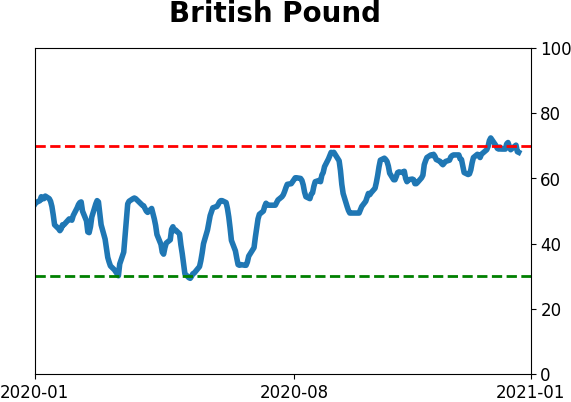
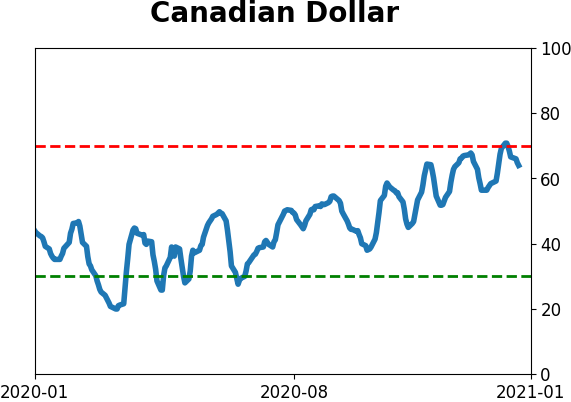
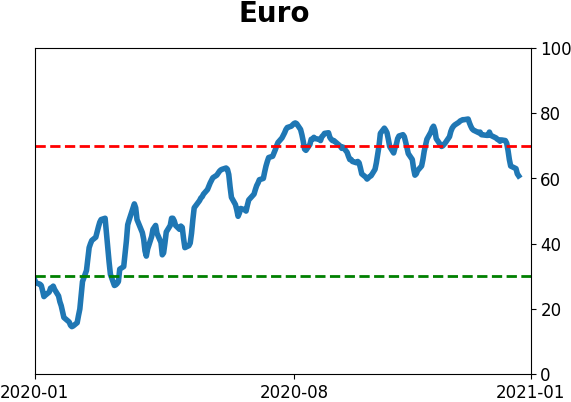
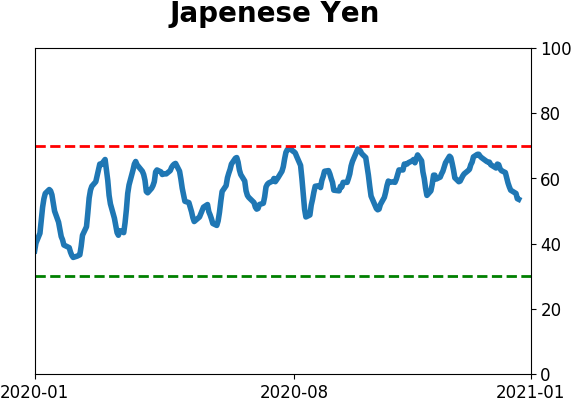
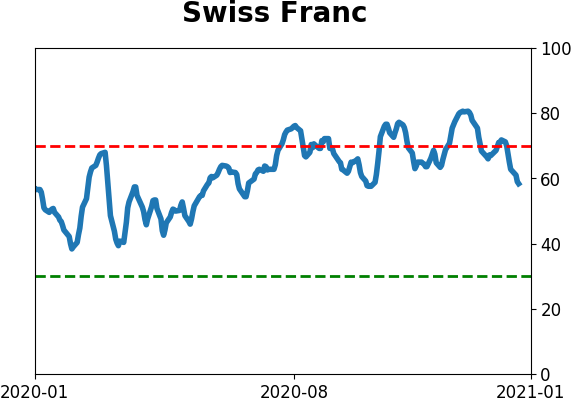
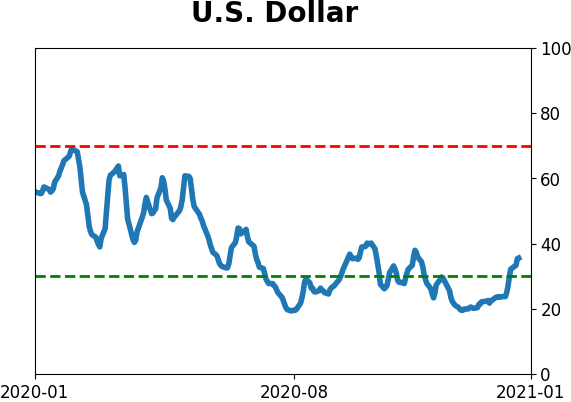
Currency ETF's - 5-Day Moving Average
|
|
|
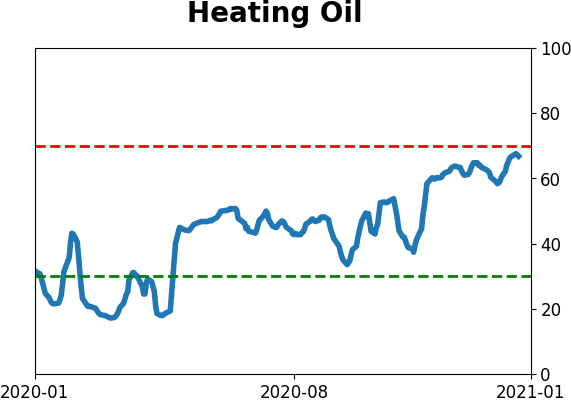
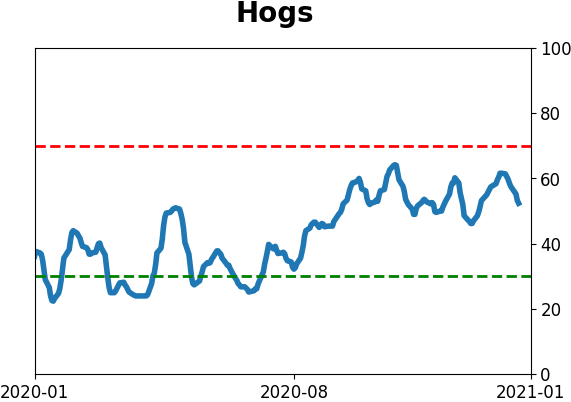
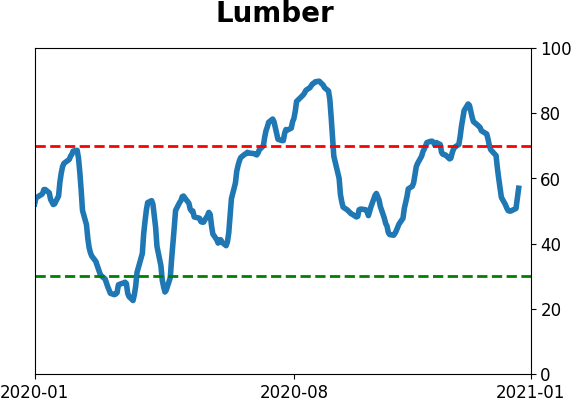
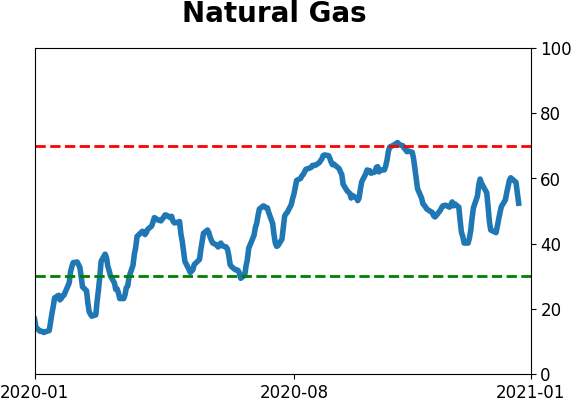
Commodity ETF's - 5-Day Moving Average
|
|