Data &
Technology
Research
Reports
Report Solutions
Reports Library
Actionable
Strategies
Free
Resources
Simple Backtest Calculator
Simple Seasonality Calculator
The Kelly Criterion Calculator
Sentiment Geo Map
Public Research Reports
Free Webinar
Pricing
Company
About
Meet Our Team
In the News
Testimonials
Client Success Stories
Contact
Log inLoginSign up
< BACK TO ALL REPORTS

Sometimes the Middle is Not a Bad Place to Be (Part II)

Jay Kaeppel
2021-01-19
Taking a look at the performance of various cap sizes during particular times of the year.

This is part 2 of a 3-part series, click here for part 1

In Part I, I highlighted the fact that Mid-cap stocks significantly outperformed both Large-cap and Small-cap stocks on a buy-and-hold basis between 1981 and 2020. I also offered a possible theory as to why this happened and why it may continue. In Part II let's take a closer look at when Mid-caps really shine – and when they don't.

Mid-caps, Seasonality and the "Power Zone"

The adage "Sell in May and Go Away" – first popularized by Yale Hirsch, founder of The Stock Trader's Almanac back in the early 1970's – is probably the most well-known seasonal trend in the stock market. For our purposes here we will deem:

  • The months of November through May as the "Power Zone"
  • The months of June through November as the "Dead Zone"

Instead of analyzing the performance of the various size classes (large, mid, small) on a buy-and-hold basis, let's analyze their performance during the Power Zone and Dead Zone separately.

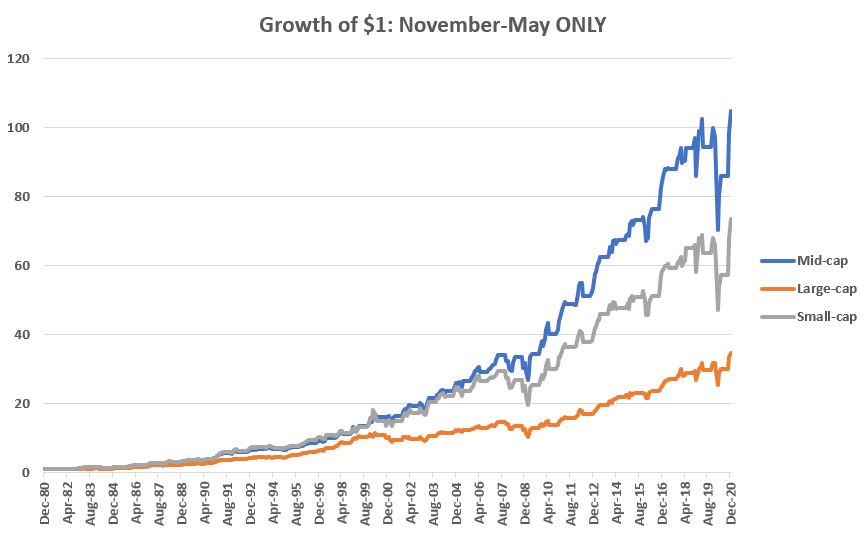
The chart below displays the growth of $1 for each index if held ONLY during the months of November through May every year from January 1st, 1981 through December 31st, 2020.

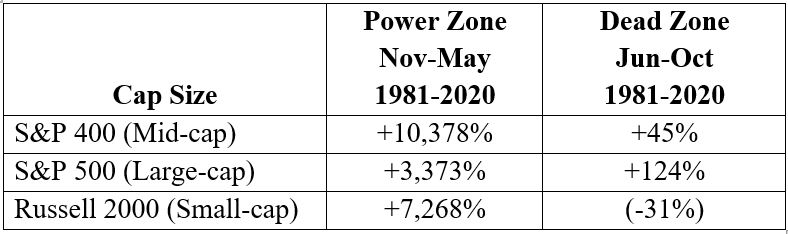
As you can see, Mid-caps significantly outperformed Large-caps and handily outperformed Small-caps during these months. 

Now let's look at the Dead Zone months of June, through October. The chart below displays the growth of $1 for each index if held ONLY during the months of June through October every year from January 1st, 1981 through December 31st, 2020.

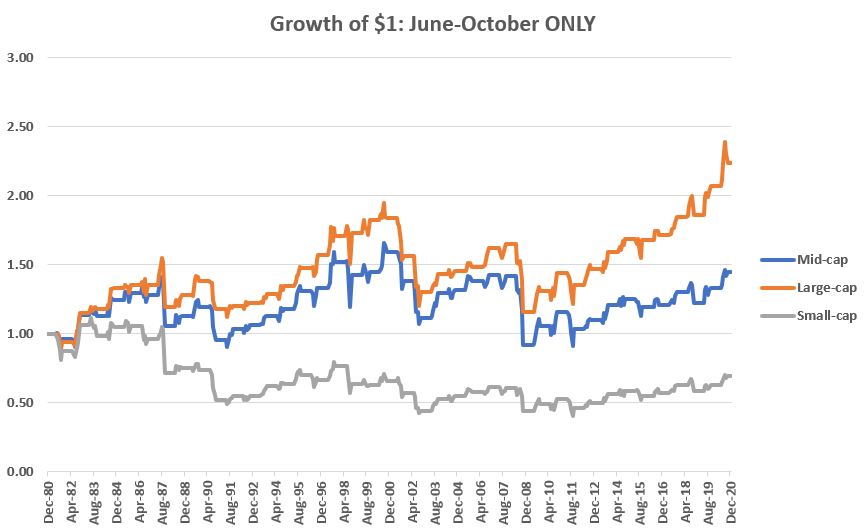
As you can see, Large-caps gained the most during June through October (although it should be noted that 124% in 40 years, including riding some massive declines in 1987, 2000-2002 and 2008 may temper one's enthusiasm) and Small-caps actually lost during these months on the whole.

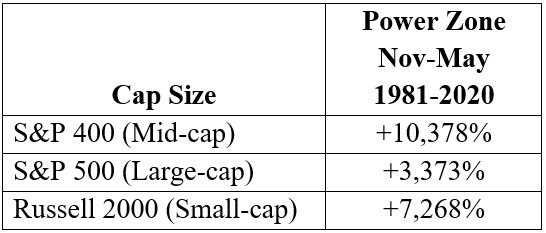
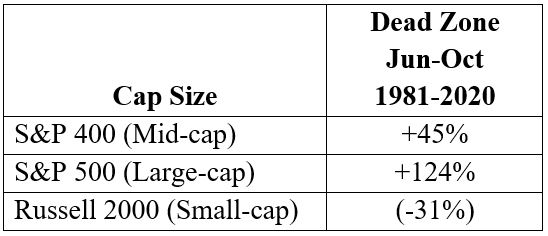
The table below puts all of the relative returns into perspective.

A Thought for Buy-and-Hold Investors

For an investor who wanted to remain fully invested in the stock market with some portion of their capital, it would appear that one rudimentary approach would be to hold:

  • Mid-caps during the Power Zone months of November through May
  • Large-caps during the Dead Zone months of June through October

The chart below displays the growth of $1 invested using the "Switch" strategy – such as it is – above, versus simply buying-and-holding the S&P 500 Index.

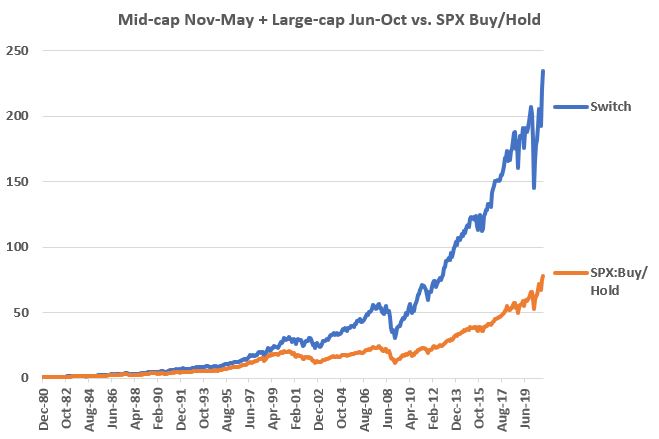
The Switch strategy showed a hypothetical 40-year gain of +23,361% versus +7,677% for simply buying and holding the S&P 500 Index. We are by no means "recommending" this is a standalone strategy. Still, in a hypothetical backtest over the last 40 years this simple method outperformed buying-and-holding the S&P 500 Index by a factor of 3-to-1. 

The key takeaway - Jay's Trading Maxim #65: Sometimes it's not just what you hold, but when you hold it that counts.

Stay tuned for Part III.

Sorry, you don't have access to this report

Upgrade your subscription plan to get access
Go to Dasboard
DATA &
TECHnologies
IndicatorEdge
‍
BackTestEdge
‍
Other Tools
‍
DataEdge API
RESEARCH
reports
Research Solution
‍
Reports Library
‍
actionable
Strategies
Trading Strategies
‍
Smart Stock Scanner
‍
FREE
RESOUrCES
Simple Backtest
Calculator
Simple Seasonality
Calculator
The Kelly Criterion
Calculator
Sentiment Geo Map
‍
Public Research Reports
‍
Free Webinar
COMPANY
‍
About
‍
Meet our Team
‍
In the News
‍
Testimonials
‍
Client Success Stories
Pricing
Bundle pricing
‍
Announcements
‍
FAQ
© 2024 Sundial Capital Research Inc. All rights reserved.
Setsail Marketing
TermsPrivacyAffiliate Program
Risk Disclosure: Futures and forex trading contains substantial risk and is not for every investor. An investor could potentially lose all or more than the initial investment. Risk capital is money that can be lost without jeopardizing ones’ financial security or life style. Only risk capital should be used for trading and only those with sufficient risk capital should consider trading. Past performance is not necessarily indicative of future results.

Hypothetical Performance Disclosure: Hypothetical performance results have many inherent limitations, some of which are described below. No representation is being made that any account will or is likely to achieve profits or losses similar to those shown; in fact, there are frequently sharp differences between hypothetical performance results and the actual results subsequently achieved by any particular trading program. One of the limitations of hypothetical performance results is that they are generally prepared with the benefit of hindsight. In addition, hypothetical trading does not involve financial risk, and no hypothetical trading record can completely account for the impact of financial risk of actual trading. for example, the ability to withstand losses or to adhere to a particular trading program in spite of trading losses are material points which can also adversely affect actual trading results. There are numerous other factors related to the markets in general or to the implementation of any specific trading program which cannot be fully accounted for in the preparation of hypothetical performance results and all which can adversely affect trading results.

Testimonial Disclosure: Testimonials appearing on this website may not be representative of other clients or customers and is not a guarantee of future performance or success.